1. Introduction
Science, Technology, Engineering and Math (STEM) fields are considered essential for a nation’s economic growth and development. However, despite growing interest, recent years have seen a decrease in STEM course enrollments and an increase in dropout rates, which is concerning as this attrition affects not only the students but also their families, schools, and the nation’s progress [
1,
2]. Leveraging technology such as machine learning, which uses data from student dropouts, and Big Data, which refers to the rapid growth and vast availability of data [
3], predictive models can be developed to provide early warnings when students are at risk of dropping out. This enables timely interventions to support at-risk students and reduce dropout rates as statistics have shown that their first year is the most crucial period for dropping out [
4]. STEM education has various definitions depending on perspective. M. E. Sanders and Wells [
5] describe it as teaching techniques that integrate scientific and mathematical principles with practical technology and engineering concepts [
6]. Sanders views it as a methodology exploring the interplay between STEM subjects and other disciplines. Merrill and Daugherty define STEM education as a standardized, cross-disciplinary approach where content is taught interactively [
7]. Despite differing definitions, the focus remains on STEM fields. Zollman suggests moving beyond defining STEM education to defining STEM literacy as a flexible, evolving process [
8], aiming to shift from merely learning STEM knowledge to applying STEM skills for continuous learning. The decline in STEM enrollments and rise in dropout rates are troubling for broader implications. Big Data has become integral to solving complex challenges across various sectors, including research, healthcare, engineering, and environmental science [
9,
10,
11,
12,
13]. It enables scientists to uncover hidden patterns and relationships, revolutionizing research and practice. Machine learning [
14,
15,
16,
17], a subset of AI, learns from data to make predictions and has applications in diverse fields such as IoT and biomedical [
18,
19,
20,
21,
22]. This study leverages Big Data and machine learning to identify key parameters influencing student dropout, develop a predictive model, and enable real-time monitoring and timely interventions by educational authorities. The project’s objectives are to identify key dropout parameters, create a predictive model, and use it to monitor current students and prompt interventions. Using data from past students, the project employs Python’s random forest to highlight critical dropout factors, generating a model to identify at-risk students and their reasons, allowing for personalized solutions to reduce attrition. Socioeconomic background significantly influences dropout rates, with less fortunate students more likely to drop out compared to their more privileged peers. A robust theoretical framework integrating “machine learning” and “big data” underpins modern advancements in various domains, particularly in education. Machine learning algorithms, characterized by their ability to learn from and make predictions based on data, are essential for analysing vast datasets generated in educational contexts. These algorithms, including supervised, unsupervised, and reinforcement learning, enable the identification of patterns, prediction of student performance, and personalization of learning experiences. Big data, defined by its volume, velocity, and variety, provides the extensive and diverse data necessary for training sophisticated machine learning models. This synergy allows for the extraction of meaningful insights from complex and heterogeneous educational data, driving evidence-based decision-making. The integration of machine learning with big data analytics thus forms a comprehensive framework that enhances our understanding of learning processes, facilitates early interventions, and supports the development of adaptive educational systems tailored to individual student needs.
2. Literature Review
Educational Data Mining (EDM) and Learning Analytics (LA) are critical in advancing the efficacy of educational environments through data-driven insights. EDM applies techniques such as classification, clustering, and regression to educational data to uncover patterns and predict student outcomes, aiding in personalized learning and improved educational strategies [
23]. LA focuses on measuring, collecting, analysing, and reporting data about learners to understand and optimize learning experiences and environments [
24]. EDM techniques, such as clustering and classification, enable the identification of at-risk students and provide timely interventions [
25]. For example, Baker and Siemens [
26] highlight the role of EDM in detecting student disengagement through behavioural patterns and facilitating adaptive learning environments. Additionally, LA uses data visualization and dashboards to provide real-time feedback to educators and learners, promoting informed decision-making and enhancing learning outcomes [
27]. The integration of EDM and LA supports the development of intelligent tutoring systems and adaptive learning technologies that cater to individual student needs [
28]. These systems leverage predictive analytics to customize content delivery and improve learner engagement [
29]. Moreover, EDM and LA facilitate the analysis of massive open online courses (MOOCs), helping educators understand learner behaviours and improve course design [
30]. Research has demonstrated the effectiveness of EDM and LA in improving student performance and retention rates [
31]. For instance, Romero and Ventura [
32] discuss how EDM techniques can predict student dropout rates, allowing for proactive measures to enhance student retention. Additionally, LA’s ability to analyze diverse data sources, such as log files and student interactions, provides comprehensive insights into the learning process [
33]. Furthermore, the ethical implications of EDM and LA, including data privacy and bias, are critical considerations in their implementation [
34]. Ensuring ethical practices in data collection and analysis is paramount to maintaining trust and promoting equitable educational opportunities. Some good recent studies [
35,
36] also attempt use data mining methods and machine learning to predict student attrition risk hoping to give more insight to student overall academic performance.
Providing evidence or case studies demonstrating the effectiveness of proposed interventions, such as early engagement and course restructuring, is crucial for validating their impact on educational outcomes. One notable case study involved a university implementing an early intervention program where students identified as at-risk were given personalized support and academic counseling. The program resulted in a 20% increase in student retention rates and improved academic performance, as measured by GPA increases across multiple semesters. Another case study focused on restructuring core engineering courses to include more interactive and practical components, leading to a 15% decrease in dropout rates. Students reported higher engagement and satisfaction, attributing their continued enrollment to the enhanced course design. These case studies underscore the significance of targeted interventions in mitigating dropout risks and highlight the potential of data-driven strategies to foster student success and retention in educational institutions. While numerous studies have explored predictive modelling for student attrition, our proposed paper makes several novel contributions that distinguish it from previous research:
Integration of Big Data and Machine Learning for Real-Time Monitoring: Unlike many studies that focus solely on predictive modelling, this research integrates Big Data analytics with machine learning to enable real-time monitoring and interventions. This approach not only predicts at-risk students but also provides a framework for timely and personalized interventions by educational authorities.
Focus on Early-Year Subjects: By identifying early-year subjects such as Mechanics and Materials, Design of Machine Elements, and Instrumentation and Control as critical factors influencing attrition, the study highlights the importance of early intervention. This focus on the longitudinal impact of specific subjects provides actionable insights for curriculum designers and educators.
Systematic Exploration and Hyperparameter Optimization: The study conducts preliminary trials to refine machine learning models, establish evaluation standards, and optimize hyperparameters systematically. This rigorous approach ensures the robustness and reliability of the predictive model.
Application of Random Forest Algorithm: The use of the random forest algorithm, known for its high prediction accuracy and ability to handle large datasets with many features, is another key contribution. The study justifies the selection of this algorithm and demonstrates its effectiveness in reducing overfitting and improving prediction accuracy.
Our proposed model is designed with flexibility in mind to accommodate variations across different geographic regions. To effectively apply this model in other regions or countries, it is essential to adapt it to local education systems, student demographics.
3. Materials and Methods
3.1. Introduction
Student attrition is a widespread issue in educational institutions, impacting both students and the institutions significantly. As this study leverages Big Data and machine learning to identify key parameters influencing student dropout, develop a predictive model, and enable real-time monitoring and timely interventions by educational authorities. Machine learning techniques can be utilized to predict and analyse the factors contributing to student attrition, enabling institutions to take proactive steps to address the problem. The methodology for using machine learning to predict student attrition generally involves several steps. First, relevant data is collected, including demographic information, academic performance, and other pertinent factors about the students. This data is then cleaned and prepared, which includes filling in missing information and making necessary assumptions to ensure that the machine learning algorithm can process it effectively. Finally, the machine learning algorithm is implemented with the required parameters, and a predictive model is generated and tested for accuracy. In a study by Binu, V. S., et al. [
37], the sample size for estimating a population was calculated using equation (1).
E (Confidence interval/margin of error) = 0.1
(Standard deviation) = 0.5
Z-score (confidence level 95%) = 1.96
It was determined that the machine learning model requires a minimum sample size of 97 to ensure the results accurately reflect real-world scenarios. The dataset consists of information from graduates of the Bachelor of Engineering (Hons) in Mechanical Engineering program, with students enrolled between 2006 and 2011, encompassing 13 cohorts. This data, extracted from a private university in Malaysia, which included student demographics, academic records, and survey responses. These data sources provided comprehensive information on student performance, socio-economic background, and psychological factors. Ethical considerations were considered, and necessary permissions were obtained to ensure privacy and confidentiality, covers courses spread over a minimum of four physical years of education and includes a total of 197 students. Several assumptions were made regarding the provided data to proceed with the simulation process outlined below.
The elective courses are not taken into consideration.
For students who remodule, only the final grade is recorded, meaning that the failing grades are not registered on this datasheet.
All failed grades are not registered.
The student that dropped out may have taken more courses but failed, however, due to the failed grades not being registered, it is not shown on the data that the student has attempted the module.
Students who are given exemptions were given a B grade in the datasheet to reflect the average performance of the course.
Cohort only considered students enrolled from year 1, with entry requirements of A-levels, university foundation programmes or equivalent.
Furthermore, these are the essential elements to model the real situation.
Data Completeness: We assume that the datasets from educational institutions are complete and accurate reflect student performance and demographics. This is crucial as the model’s accuracy depends significantly on the quality of input data. In practice, we mitigate the risk of incomplete data by applying data imputation techniques and liaising with educational institutions to understand and fill gaps in data collection processes.
General Education Framework: The model presupposes a relatively uniform educational structure within regions being analysed. This assumption allows us to generalise the predictive factors across different institutions within the same educational system. We validate this assumption through preliminary analysis of educational systems and curricula before model deployment.
Consistency in Course Impact: We posit that certain courses have a more pronounced impact on student attrition rates across different institutions. This is based on historical data showing consistent patterns of student performance in key subjects that correlate with dropout rates. To ensure this assumption holds, we continuously update and recalibrate our model as new data becomes available, ensuring it reflects the most current educational trends.
Student Behaviour Consistency: The model assumes that student behaviour and their impacts on attrition are consistent over time. While this may not capture new emerging trends immediately, the model includes mechanisms for periodic reassessment to integrate new behavioural patterns and external factors affecting student engagement and success.
Socioeconomic Factors: It is assumed that socioeconomic factors influencing student attrition are similar within the data sample. This assumption allows us to apply the model across similar demographic groups but requires careful consideration when applying the model to regions with differing socioeconomic landscapes. We justify this by conducting localised studies to understand the socioeconomic dynamics before applying the model in a new region.
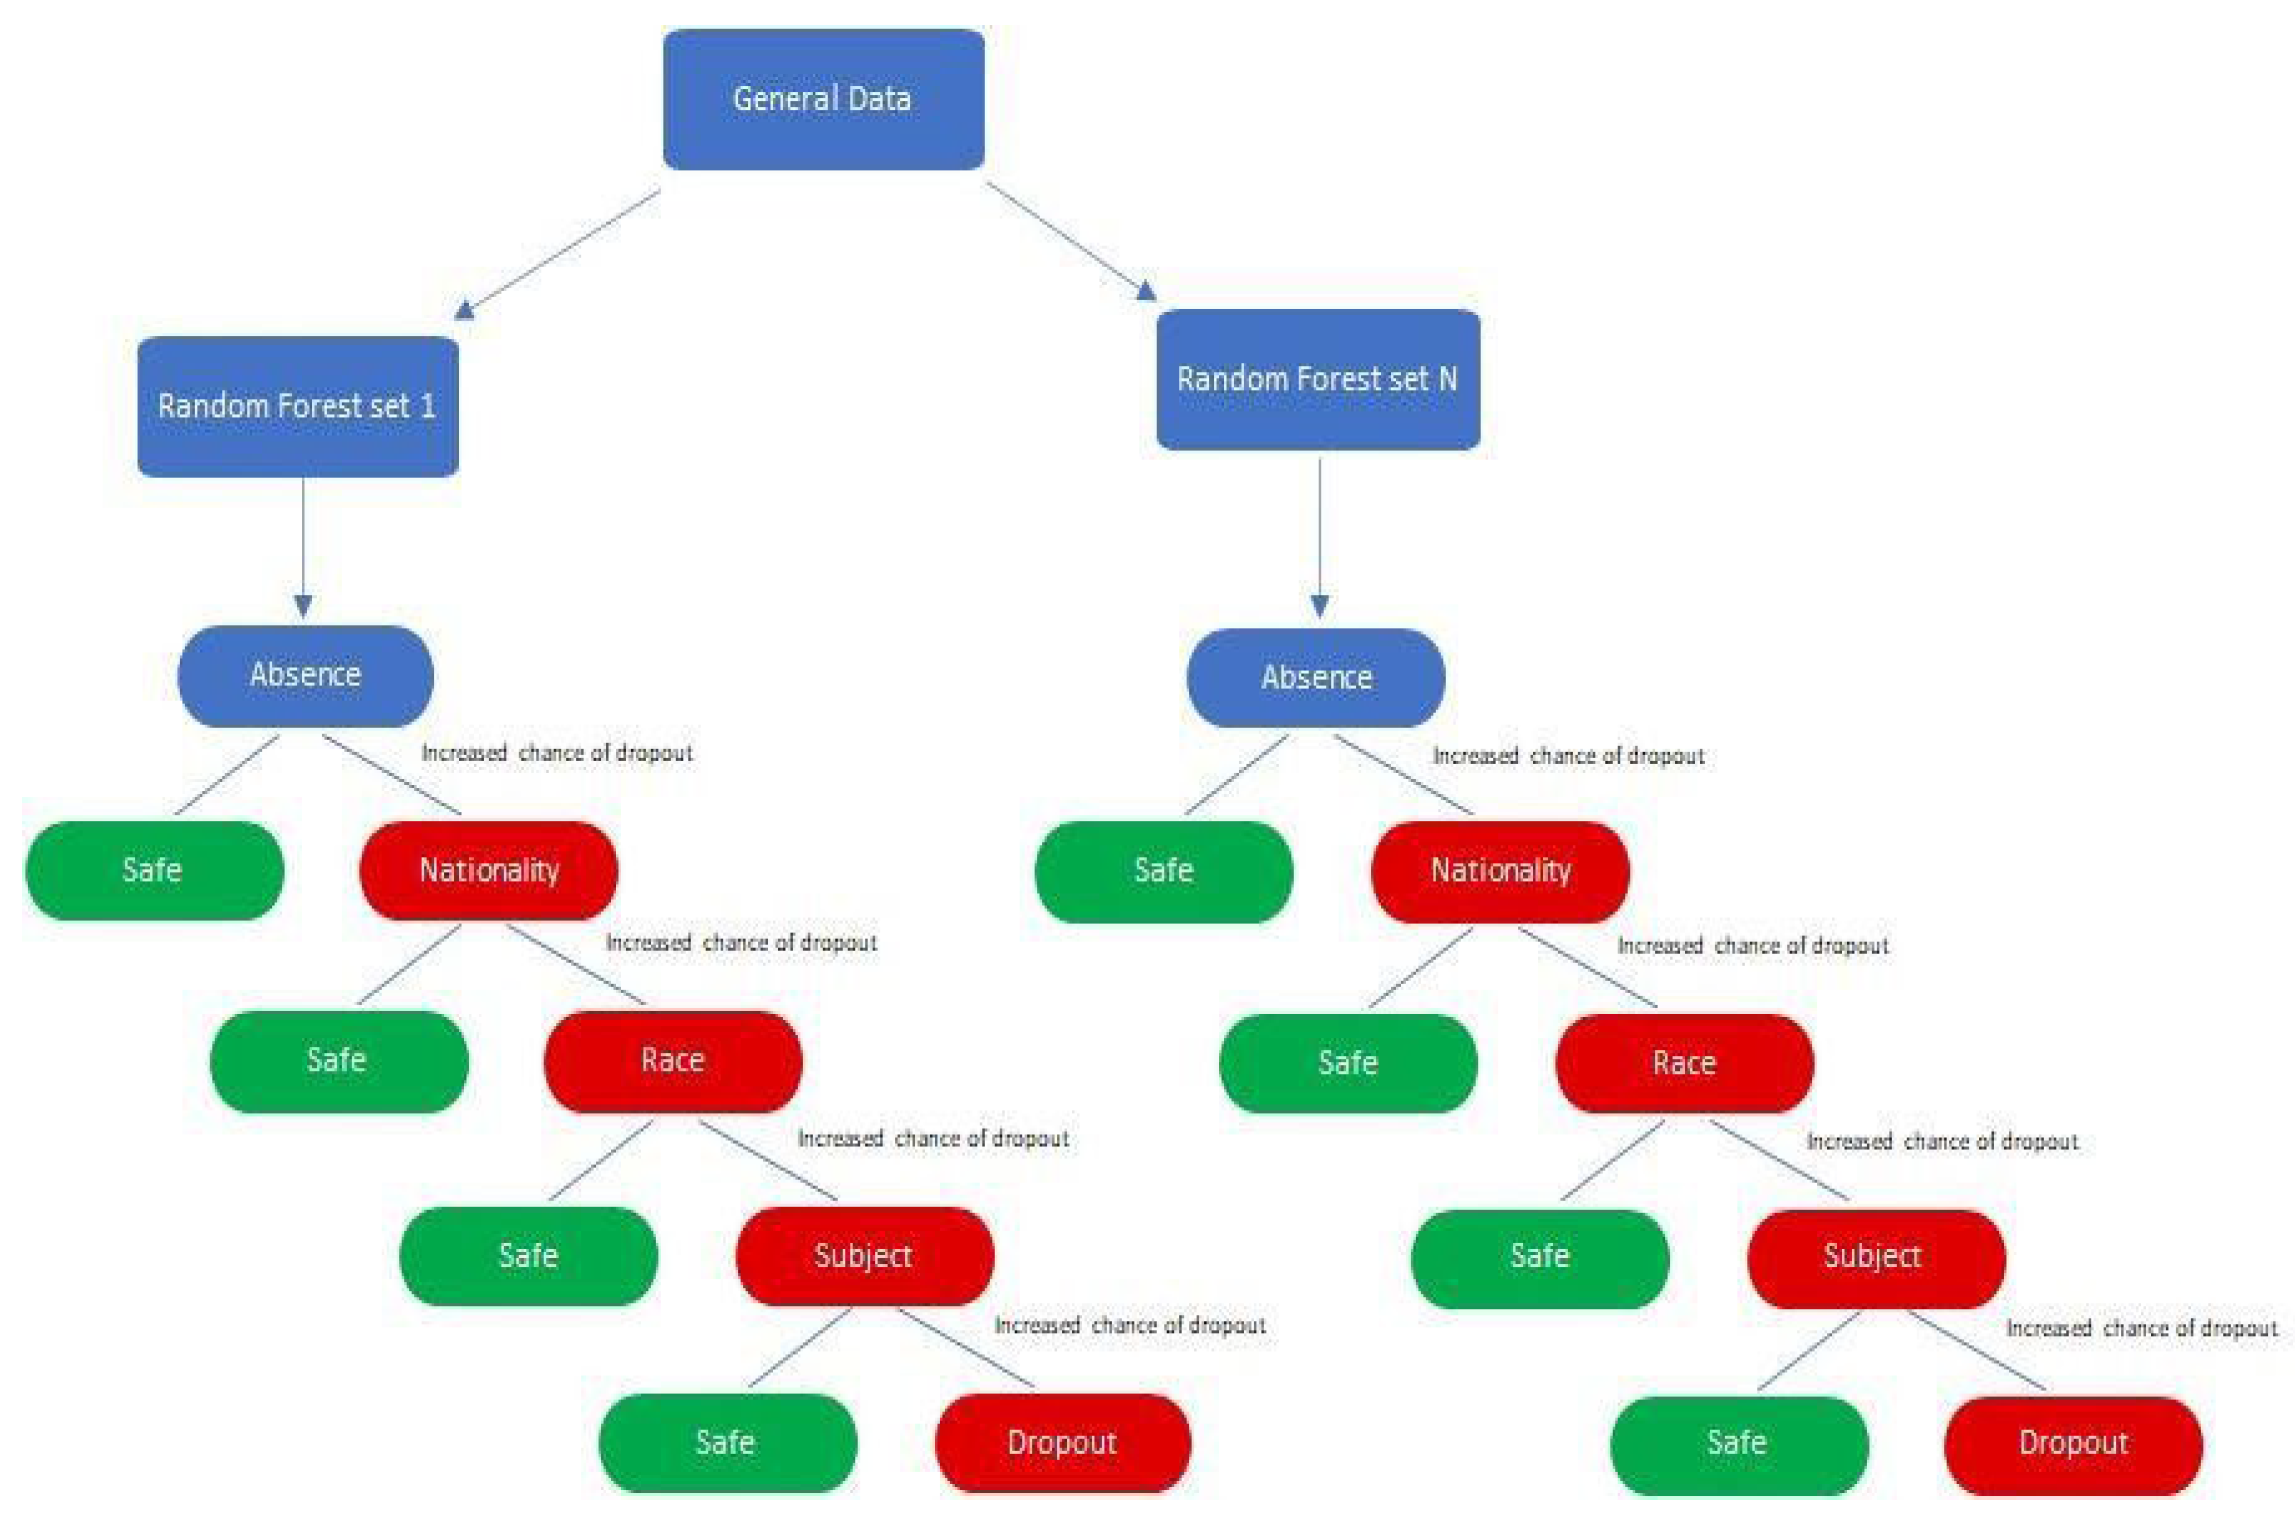
Python was chosen to run the machine learning process and build the predictive model, utilizing a random forest model for this simulation due to its extensive packages and libraries such as Scikit-Learn that makes it easy to be used [
38,
39,
40,
41]. This model is known for its high prediction accuracy, ability to handle large datasets with many features, and robustness against missing values and outliers. It employs ensemble approaches, combining results from multiple algorithms to generate final predictions, which helps prevent overfitting and enhances prediction accuracy. As depicted in
Figure 1, the random forest model is less sensitive to the choice of hyperparameters and can implicitly select features. The random forest model operates by creating multiple decision trees and combining their results to improve prediction accuracy. The input data is prepared by selecting relevant features and splitting it into training and testing sets. Each training dataset is provided with a subset of features and a random sample of observations to create diverse individual decision trees. Once these trees are built, they are used to make predictions on the test data. Each decision tree generates its own prediction, and the final prediction is determined by the majority vote of all the decision trees. The predictions are then evaluated using various metrics, such as accuracy, precision, and F1-score.
3.2. Procedure of Solution
Overview
In this section, we detail the technical and methodological framework utilized in our study to predict student dropout rates using a machine learning model. The framework outlines the computational tools and data preprocessing steps essential for the effective implementation of the random forest classifier.
Justification for the Use of Random Forest and Parameter Selection
The random forest algorithm was selected due to its efficacy in handling overfitting compared to other algorithms. It works by building multiple decision trees and merging them together to get a more accurate and stable prediction. We experimented with varying the number of trees from 10 to 100 to identify an optimal balance between prediction accuracy and computational efficiency. The choice of interval is based on initial tests indicating that increasing the number of trees beyond 100 resulted in marginal gains in accuracy but significant increases in computational cost and time. The decision to vary the number of trees in our random forest model from 10 to 100 was based on initial empirical test indicating that this range optimally balances prediction accuracy and computational efficiency. We observed that increasing the number of trees beyond 100 resulted in only marginal gains in accuracy, which did not justify the additional computational resources and time required. These findings align with established research suggesting diminishing returns in accuracy improvement as the number of trees increases in a random forest, particularly in datasets of similar complexity and size to ours.
Data Cleaning Process
The integrity of the input data significantly influences the accuracy of the predictive model. The dataset was initially subjected to a thorough cleaning process to correct anomalies such as missing values, incorrect data entries, and outliers. Key steps included:
Conversion and Cleaning: The raw data, initially in Excel format, was converted to a CSV format to standardize the data input process for use in Python. This step was crucial as it ensured compatibility with the Pandas library for subsequent manipulations.
Error Checking and Noise Reduction: The dataset was meticulously checked for errors such as misspellings, incorrect punctuation, and inconsistent spacing which could lead to inaccuracies in the model. Irrelevant data points such as unnecessary identifiers were removed to streamline the dataset and focus the model on relevant features.
Normalization and Encoding: Numerical normalization and categorical data encoding were performed to standardize the scales and transform categorial variables such as grades and nationality, into a format suitable for machine learning analysis.
The integrity and accuracy of the input data are crucial for the performance of any predictive model. In our study, the data cleansing process involved standardizing the data format, correcting data entry errors, and handling missing values, which significantly impacts the reliability of our model’s predictions. Each step in the data cleansing process was carefully designed to minimize the introduction of bias and error into the predictive modelling process. To quantify the impact of these steps, we conducted sensitivity analyses that showed improvements in model accuracy and robustness when using cleaned versus raw data.
Model Training and Testing
We trained the random forest classifier on the cleansed dataset, using “dropout” as the dependent variable. The independent variable included a range of student data points such as academic performance, demographic information, and course engagement metrics. The training set was used to fit the model, and the testing set was used to evaluate its performance. The effectiveness of the model was assessed using metrics such as accuracy, precision, recall, and the F1 score to provide a comprehensive evaluation of its predictive capabilities. This methodological framework is designed to ensure the robustness and reliability of our predictive model. Through detailed justifications for our choice of tools and methods, we aim to enhance the transparency and reproducibility of our study, thereby contributing valuable insights into the factors influencing student dropout rates. Our model is designed with flexibility in mind to accommodate variations across different geographic regions. To effectively apply this model in other regions or countries, it is essential to adapt it to local education systems, student demographics, and the specific dropout factors prevalent in those areas. The dataset in the study was split into training and testing sets to assess the accuracy and effectiveness of the machine learning model. Different increments of test size were used to prevent overfitting and achieve better accuracy. Specifically, test sizes of 0.1, 0.2, 0.3, 0.4, and 0.5 were experimented with, and the corresponding figures were generated to illustrate these splits. The training set was used to fit the random forest classifier model, and the testing set was utilized to evaluate the model’s performance. This approach helped in estimating how well the model is likely to perform on new, unseen data by ensuring the model does not simply memorize the training data but learns the underlying patterns. For application in new regions, the following types of data are crucial:
Demographic Information: Understanding the socioeconomic and cultural background of students helps tailor the predictive capabilities.
Academic Performance Data: Access to comprehensive performance metric across various subjects is vital to identify at-risk students early.
Institutional Data: Information on the educational system’s structure, including course offerings and academic policies, is necessary for contextual adaptation.
We are committed to further refining our methodology to enhance its applicability and accuracy across diverse settings.
4. Results and Discussion
4.1. Introduction
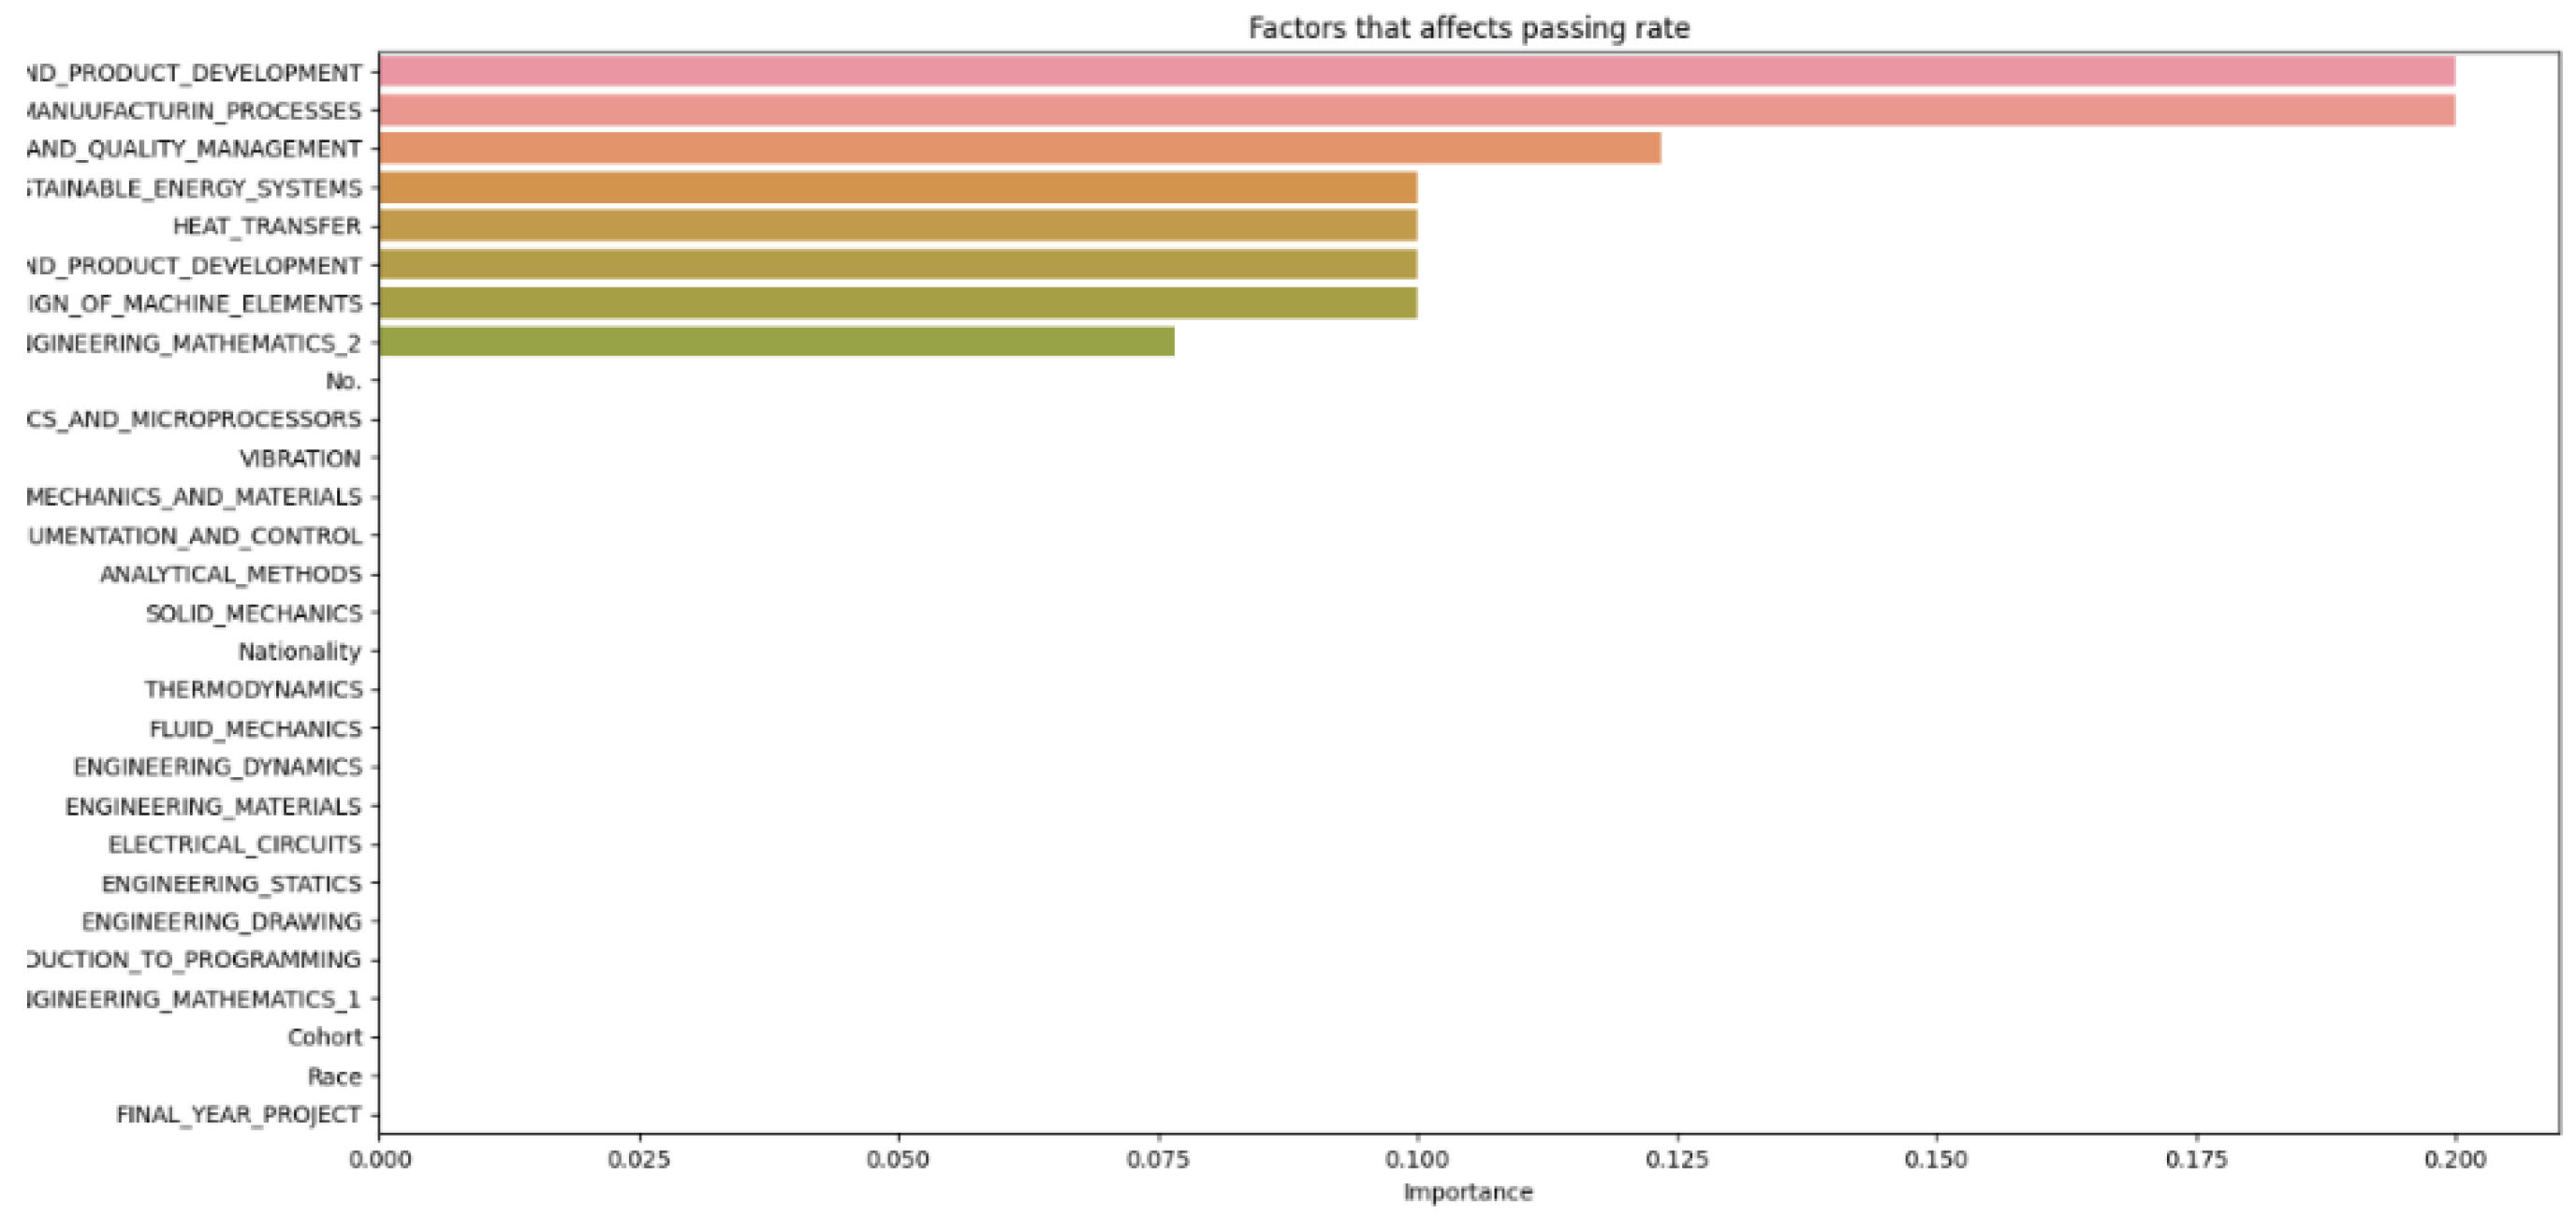
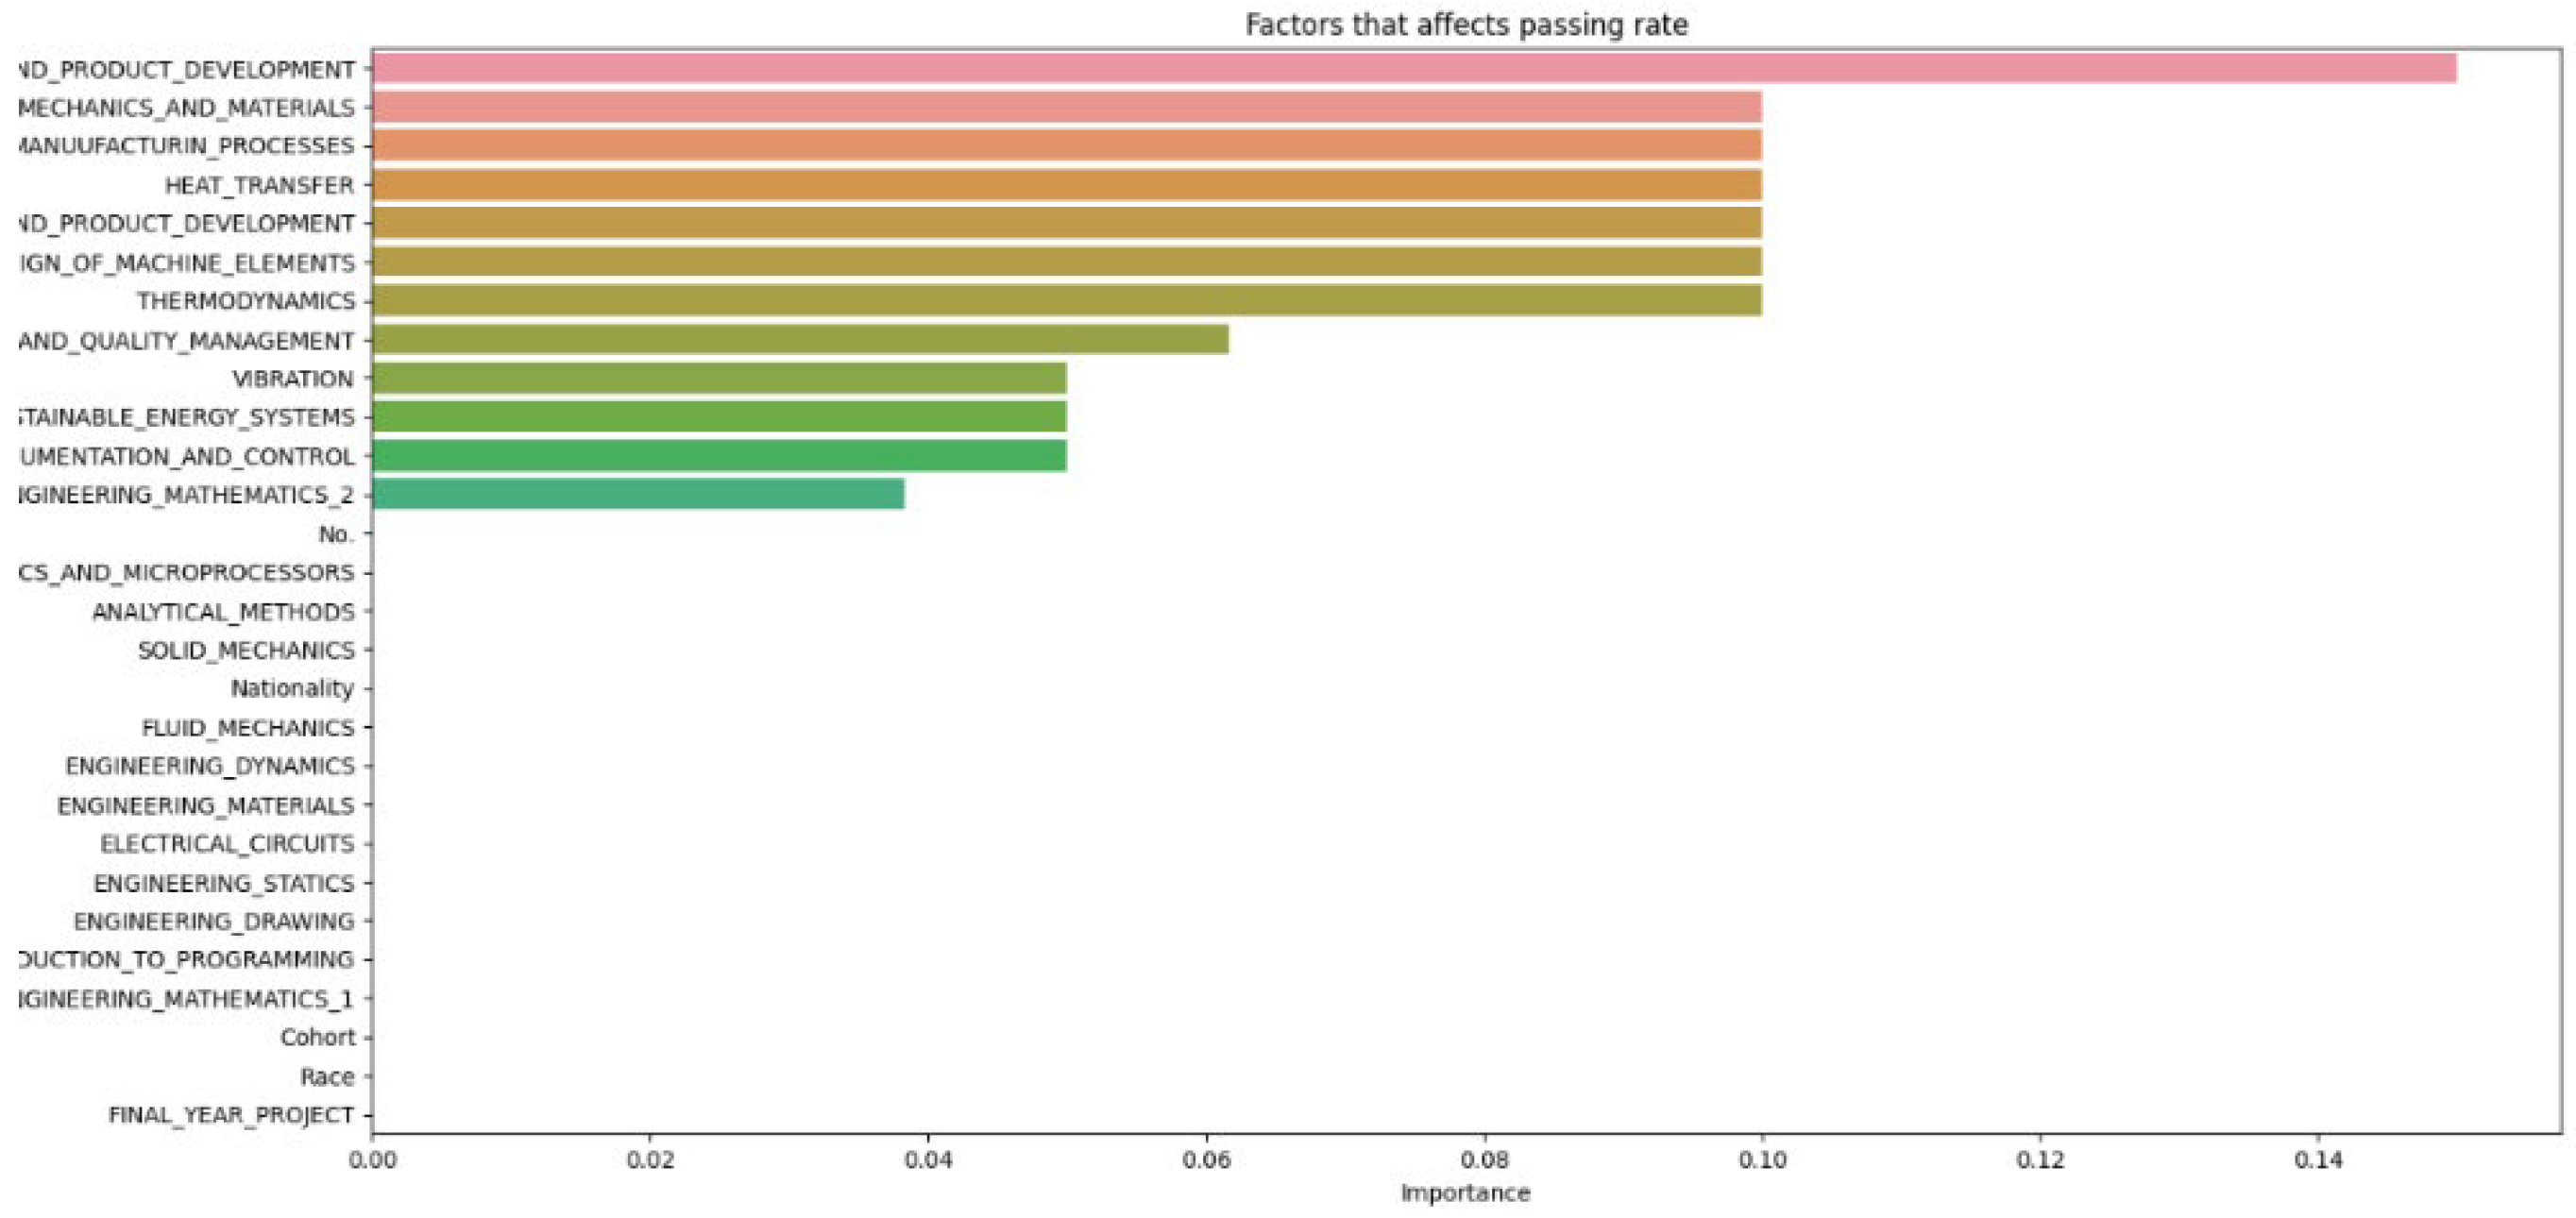
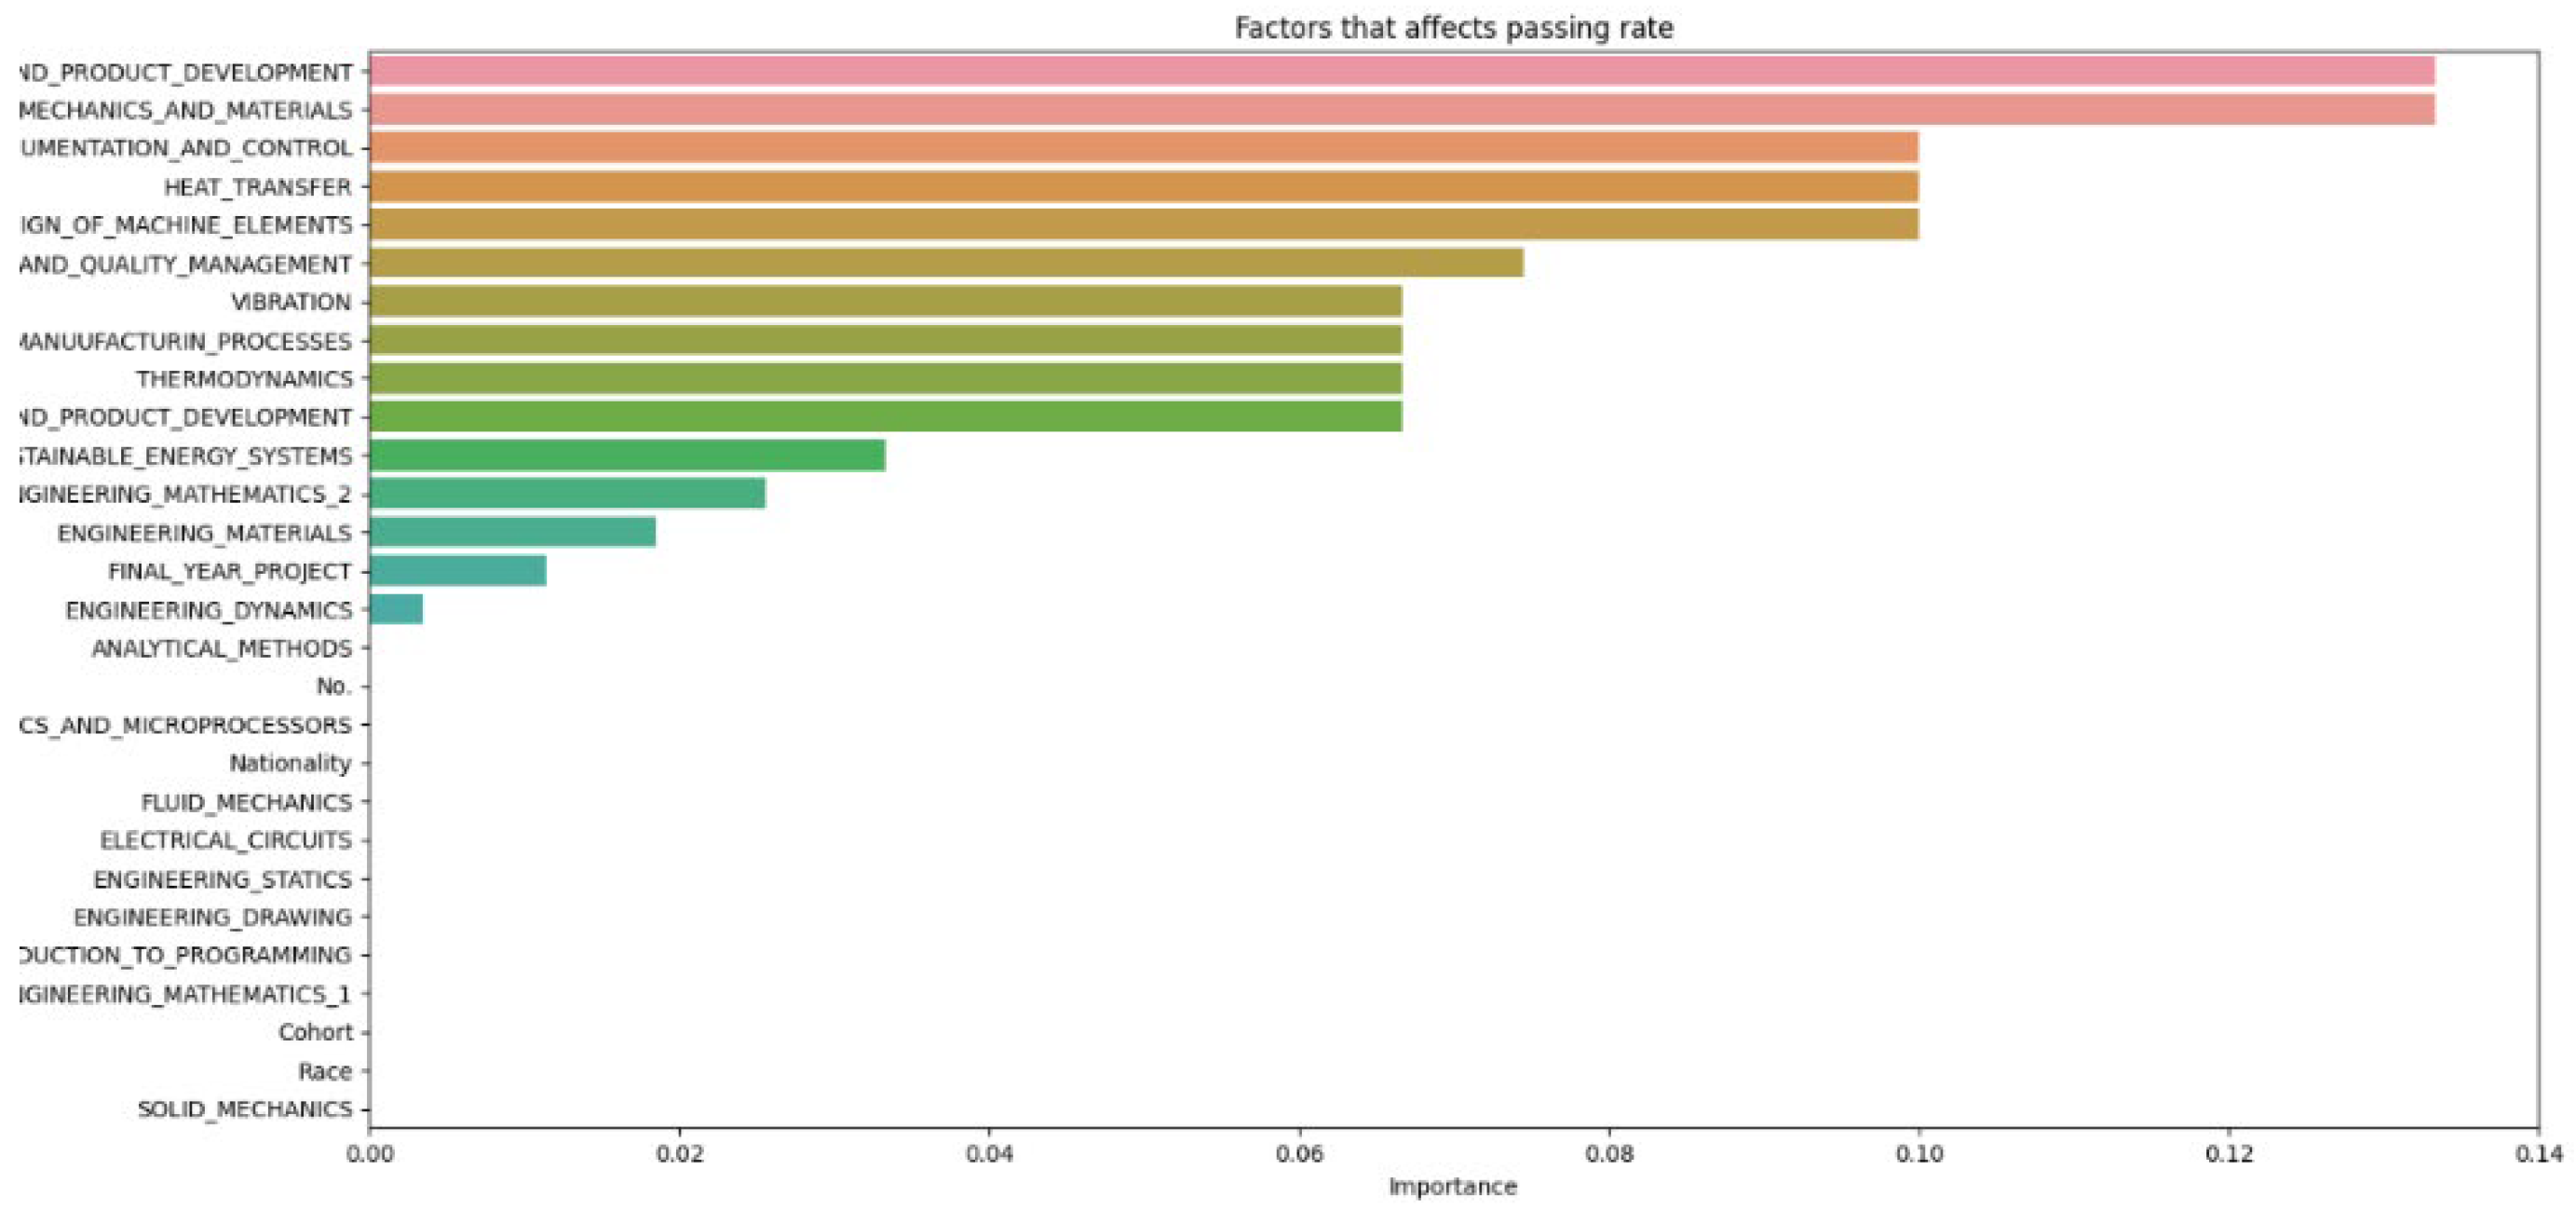
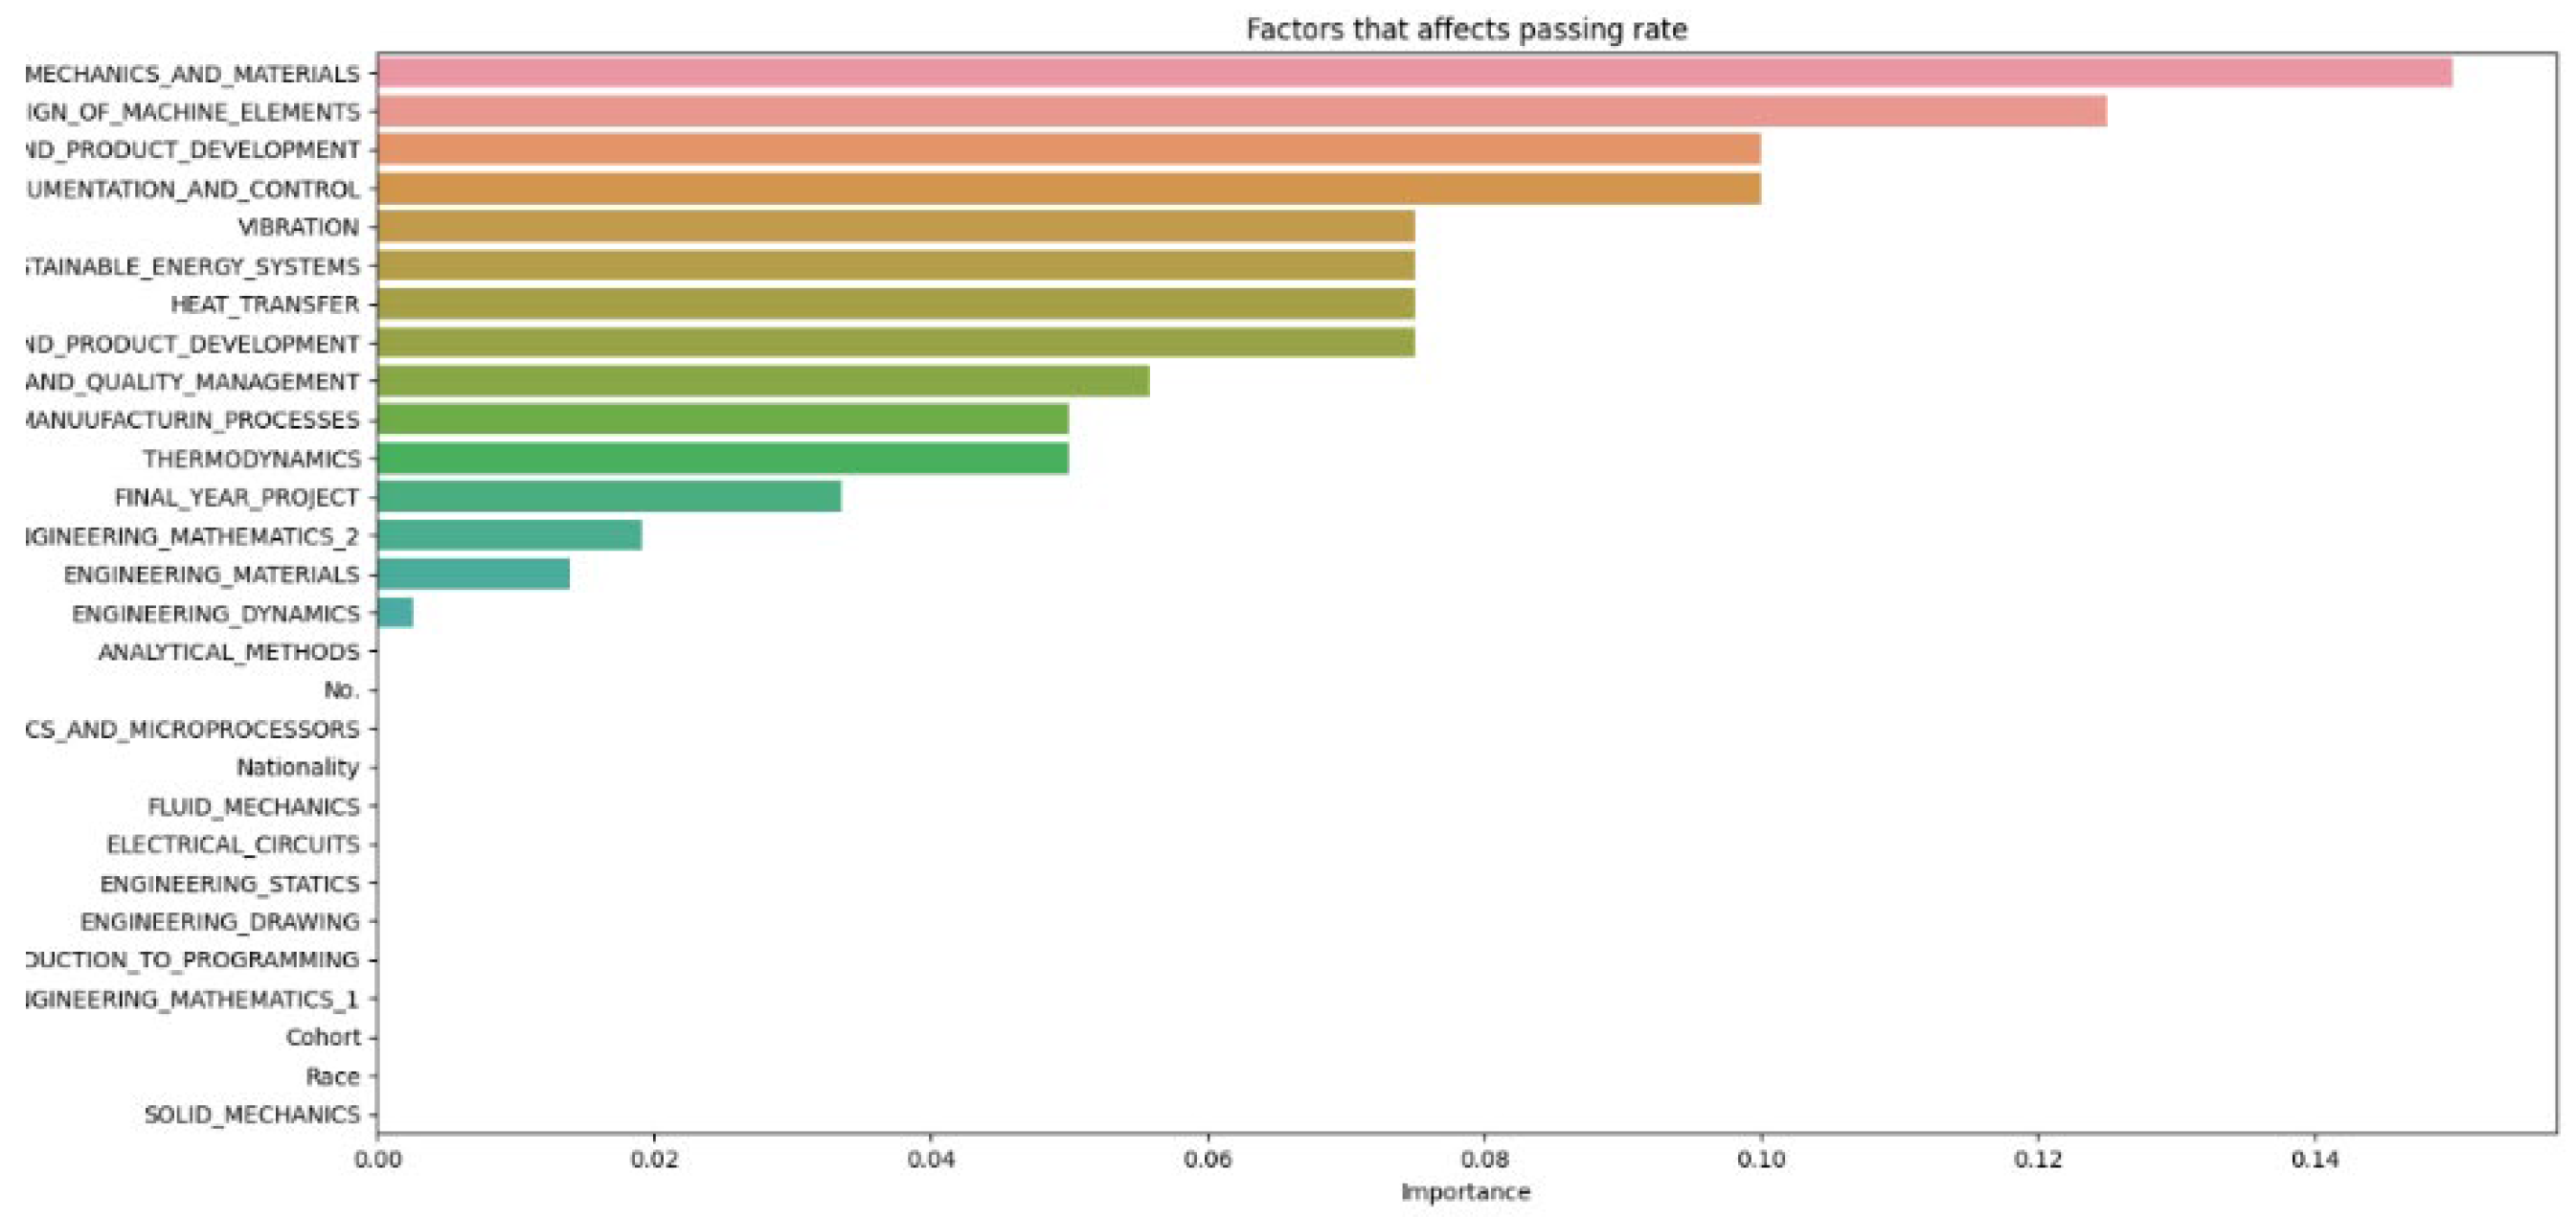
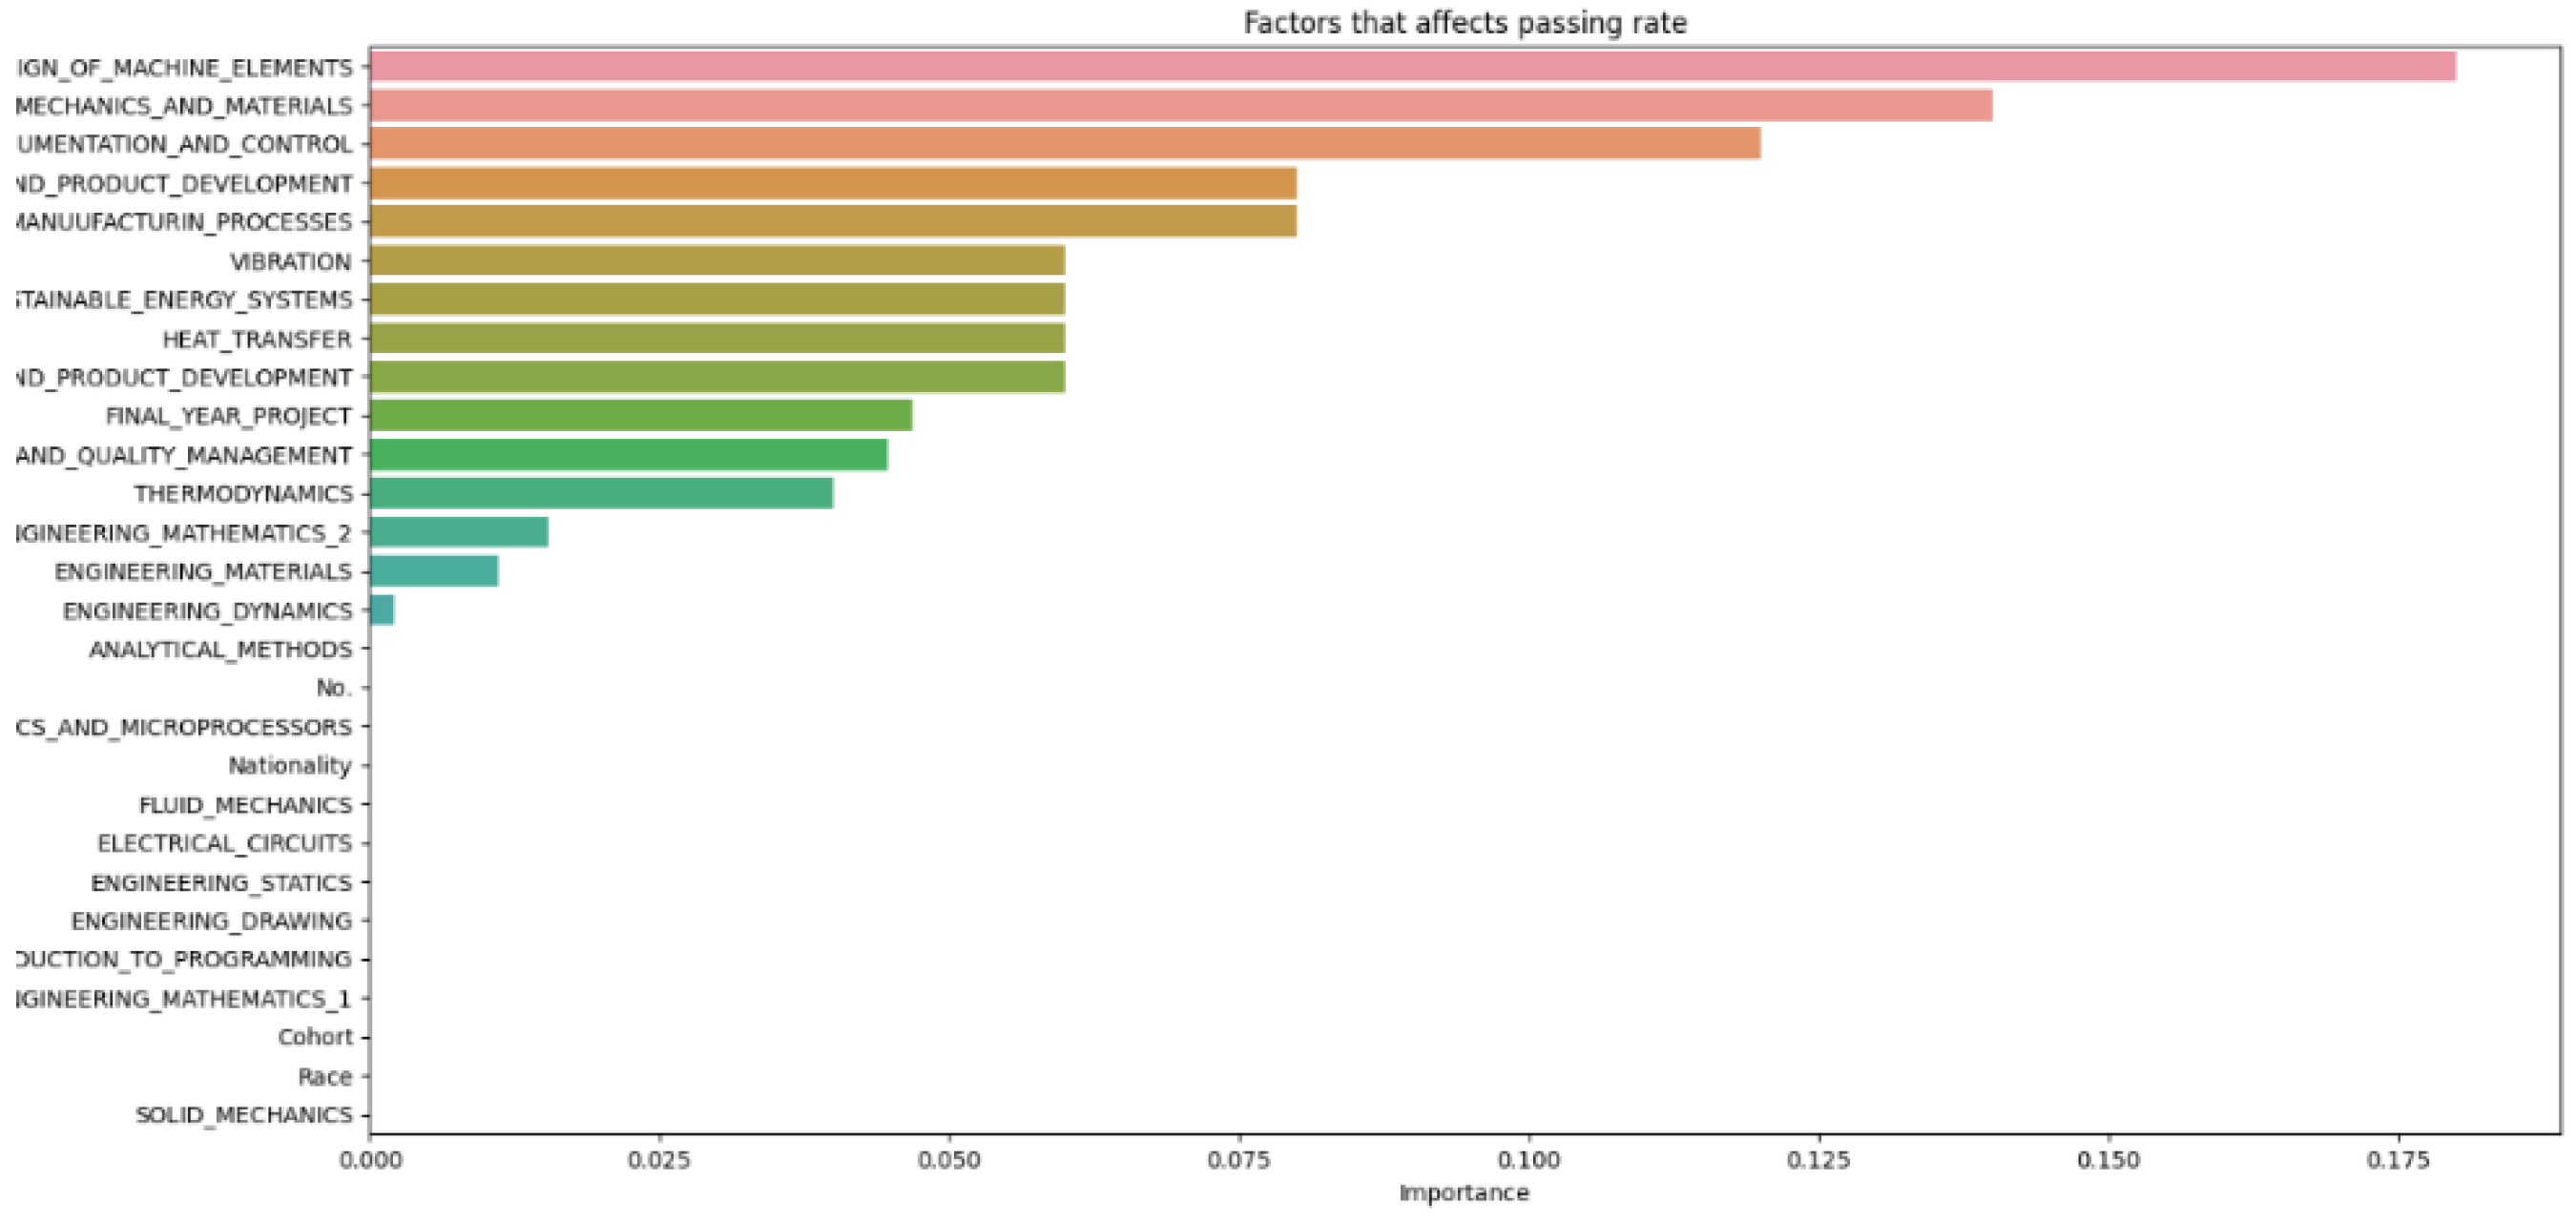
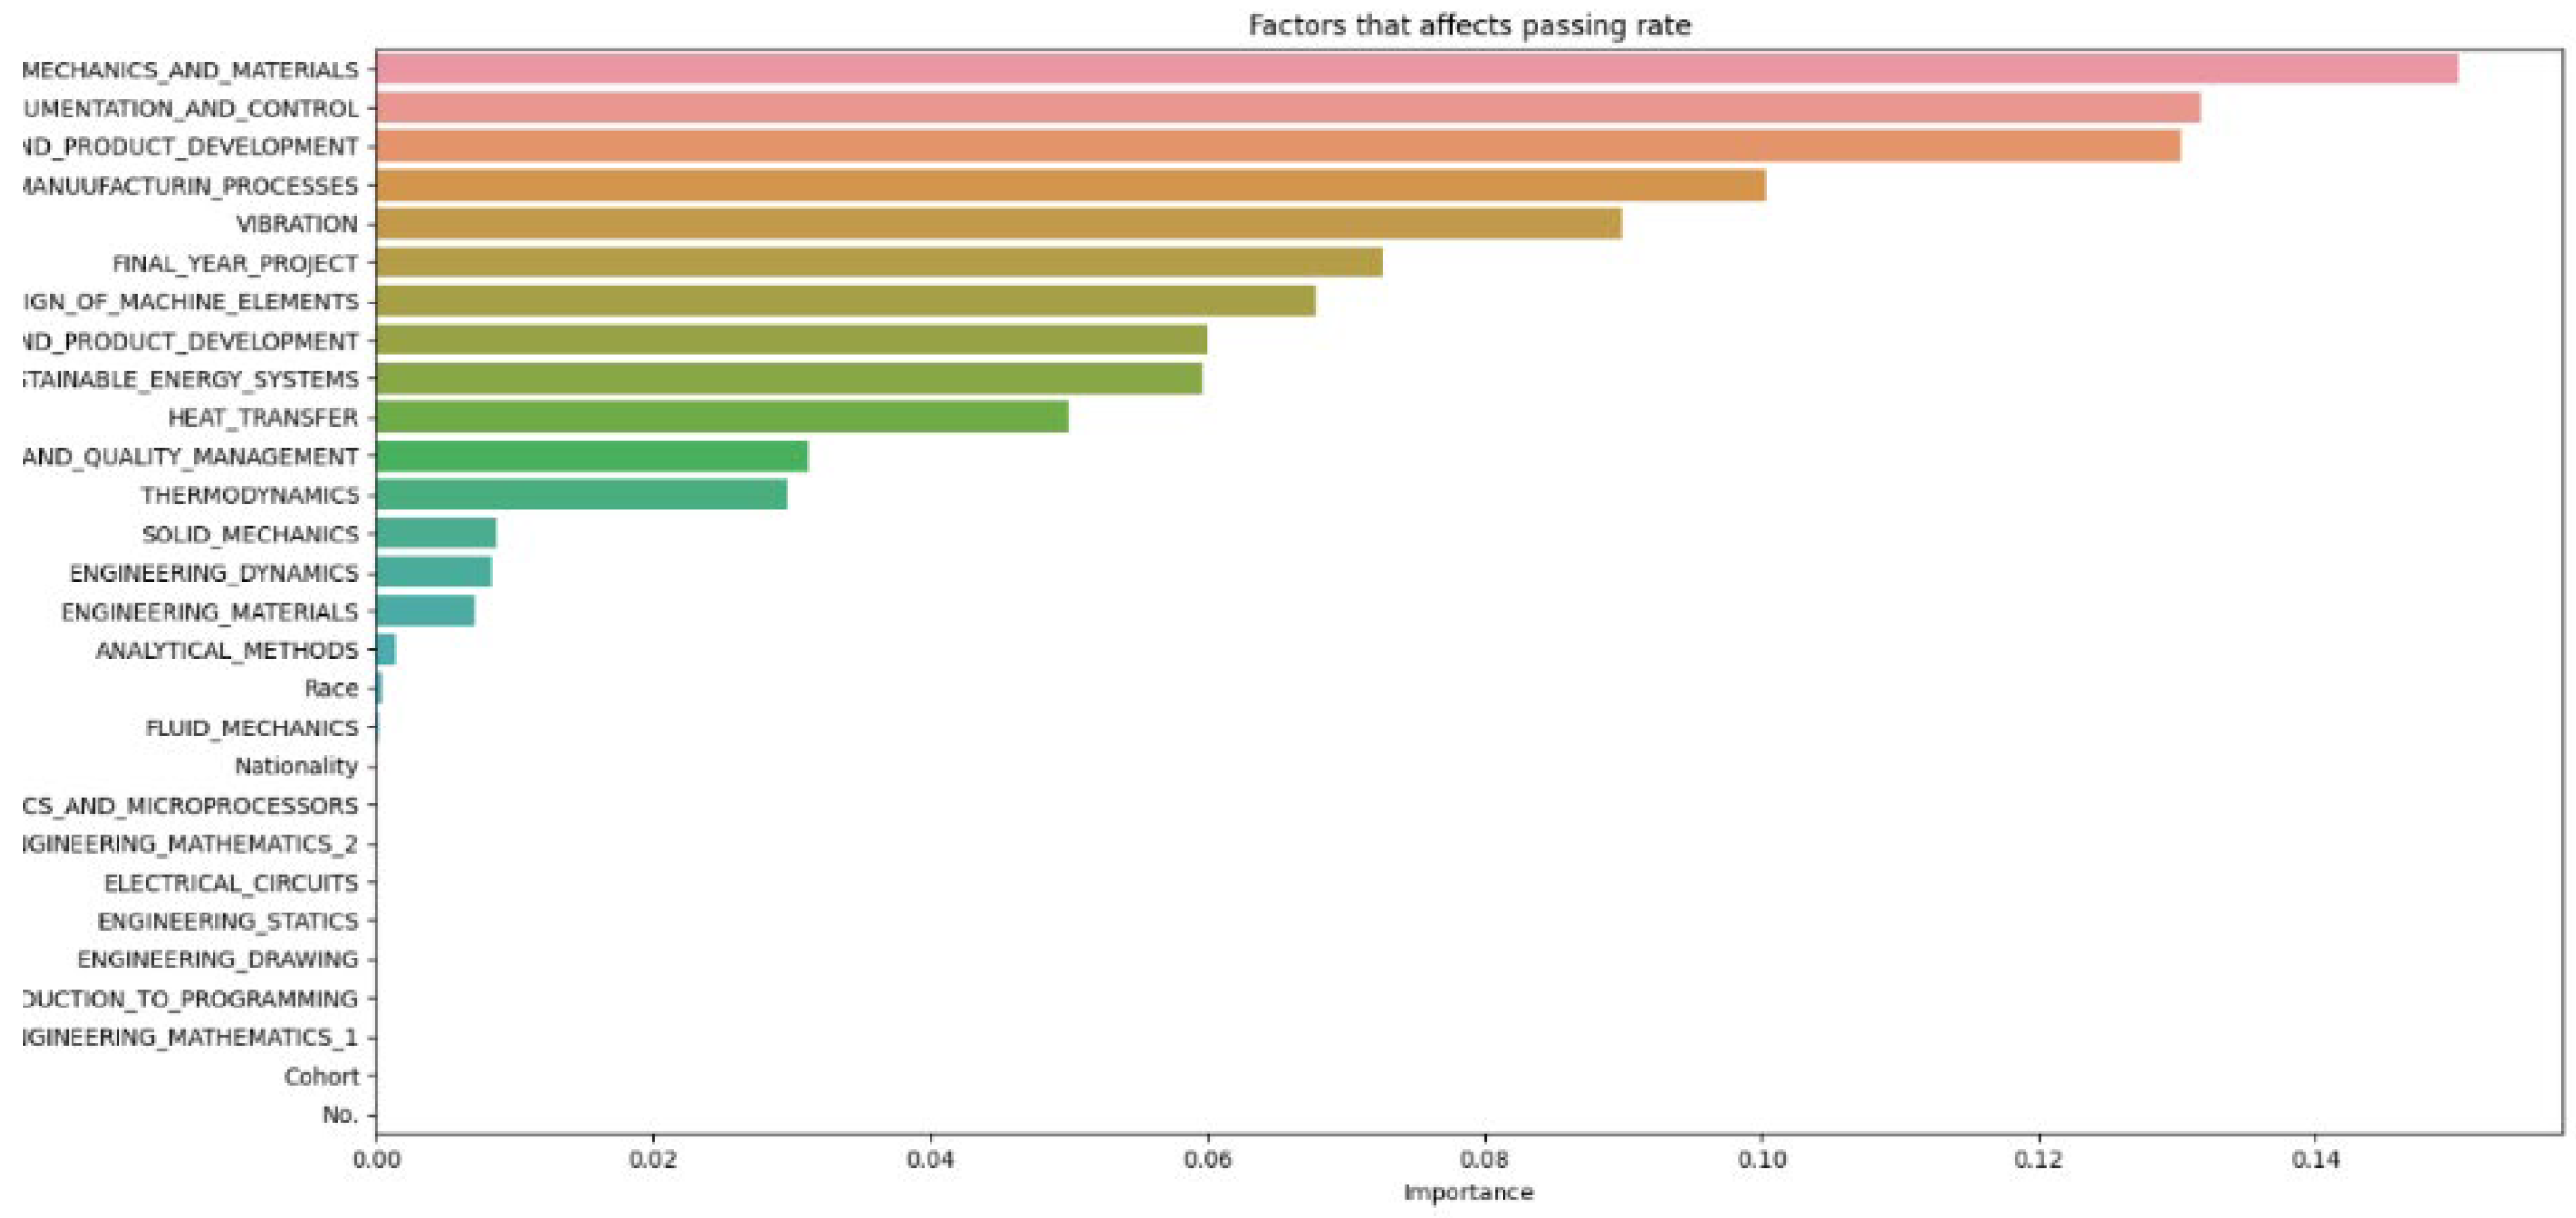
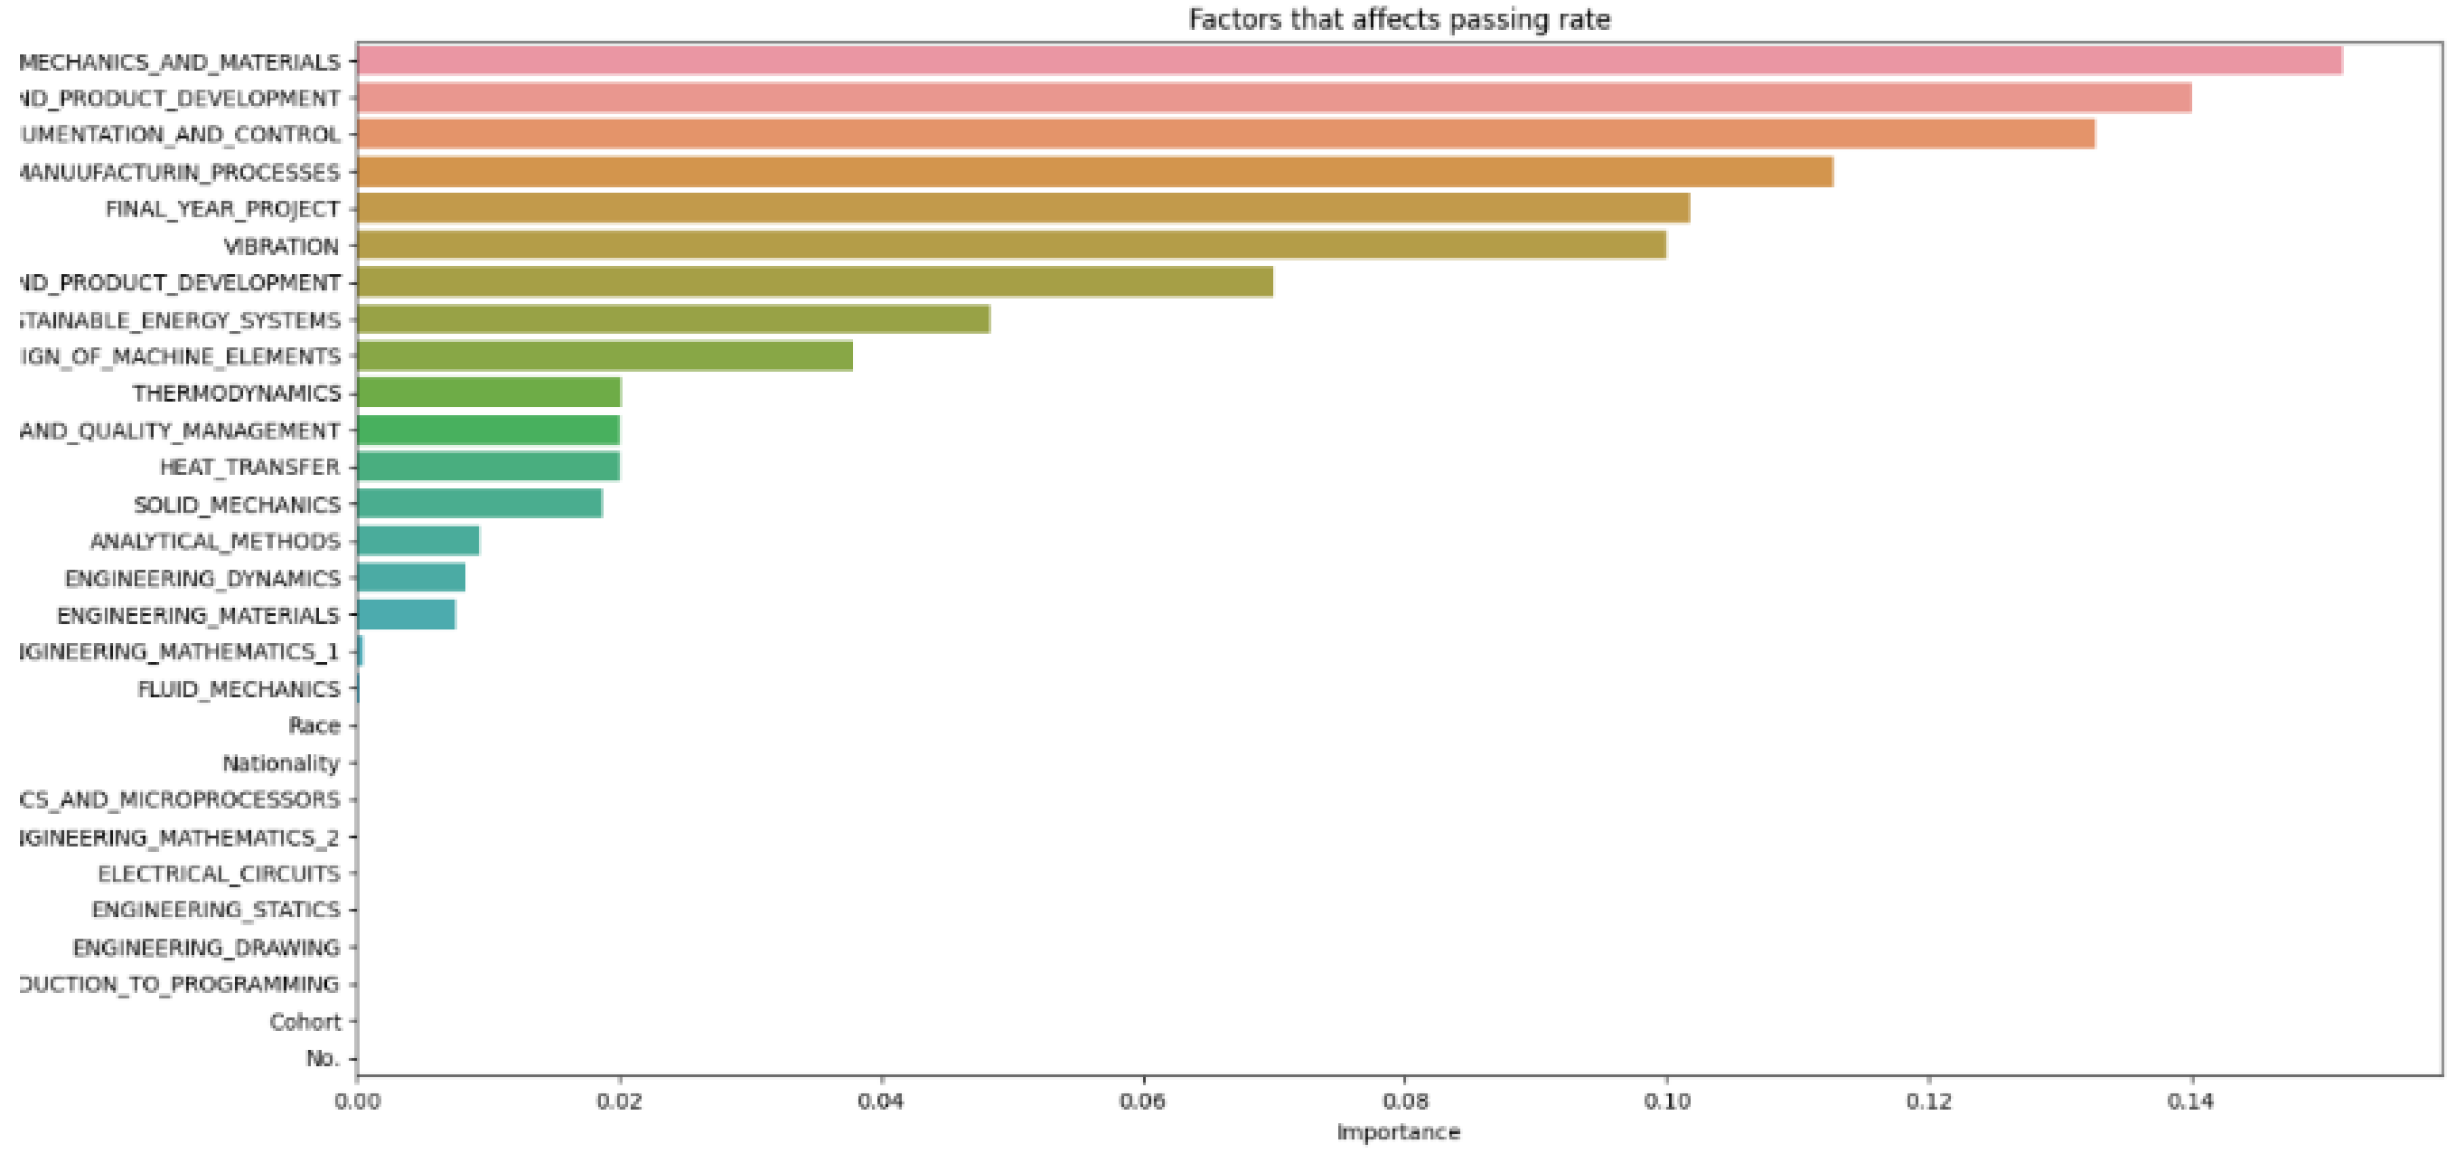
The results of the various machine learning models, each configured with different hyperparameters, are recorded and divided into sections for thorough analysis. The discussion section offers insights into the outcomes of the machine learning model, explaining the significance of the findings, the model’s limitations, and potential directions for future research. Additionally, it may investigate factors contributing to student attrition, such as academic performance, background, or personal factors. The number of decision trees (N) in a random forest model is a hyperparameter that can be adjusted during the training phase. The optimal number of trees typically depends on the dataset size and the problem’s complexity. After cleaning and importing the data, hyperparameters like the number of random forest trees are set at different increments (as shown in
Figure 2,
Figure 3,
Figure 4,
Figure 5,
Figure 6 and
Figure 7) to determine the best fit for the machine learning model, aiming to produce the most accurate predictive results.
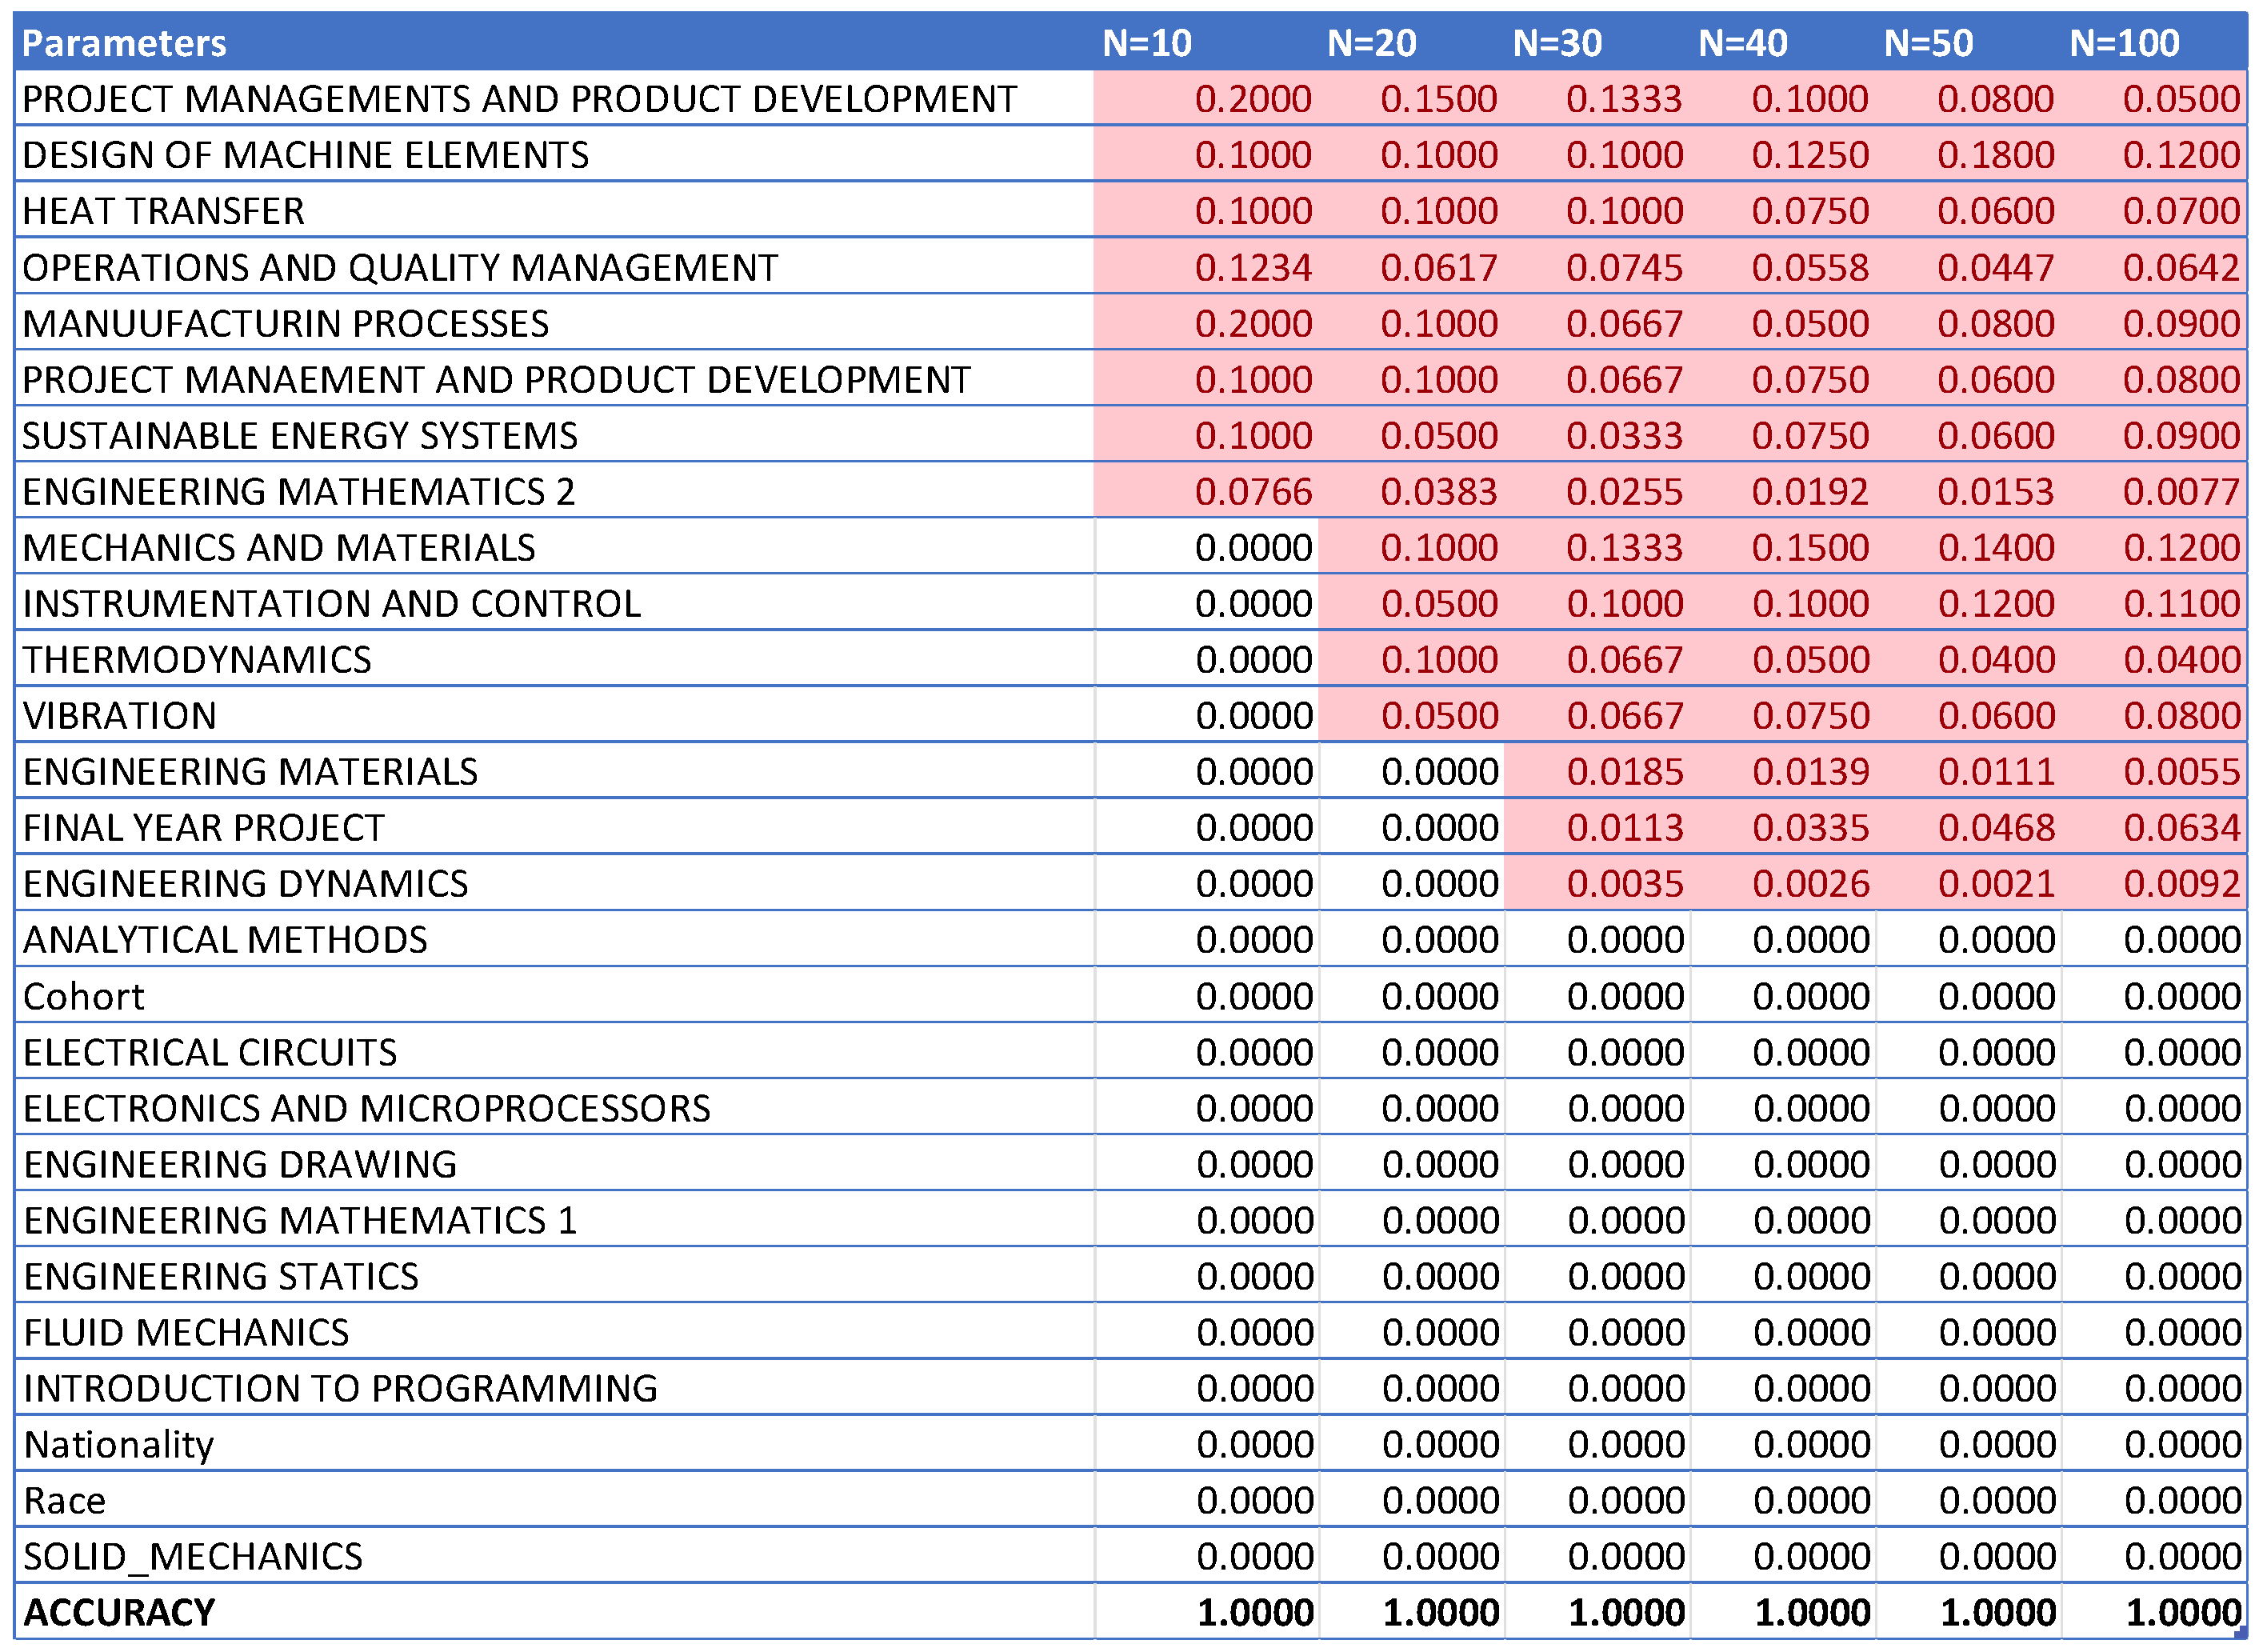
From
Figure 8, it can be seen that as the number of decision trees (N) in the random forest model increases, the number of parameters affecting the dropout rate also rises, up to a certain point. When N is set to 10, only 8 parameters impact student attrition. Increasing N to 20 raises the number of influential parameters to 12, indicating a directly proportional relationship. This trend continues until N reaches 30, where the number of parameters peaks at 15. Beyond this point, increasing N further does not add more parameters, although the influence of each parameter on attrition rate changes slightly. As the number of decision trees increases, the model’s predictive accuracy also improves. This supports Breiman’s assertion that random forests have low bias but high variance, meaning they can overfit the training data. By adding more decision trees, the model reduces variance and enhances overall accuracy. However, beyond a certain number of trees, the returns diminish, and the model risks overfitting the training data. Increasing the number of decision trees also brings several limitations. One is reduced model interpretability; a larger number of trees makes the model more complex and harder to understand, complicating the identification of specific factors and relationships driving predictions. This observation is supported by Liaw and Wiener, who noted that increased complexity in the model reduces its interpretability. Another limitation is the increased computational time and memory requirements. Training and testing a random forest model with many decision trees can be computationally expensive and memory-intensive due to the numerous decision trees with many nodes and branches. Zhang’s study highlights that as tree complexity or the number of trees increases, so does computational time, which can affect the cost-efficiency of the model. In summary, while adding more decision trees to a random forest model can enhance its performance, it is important to balance the benefits against the drawbacks, selecting the appropriate number of trees based on the specific problem and data.
4.2. Effect in Difference of Test Size vs Training Size
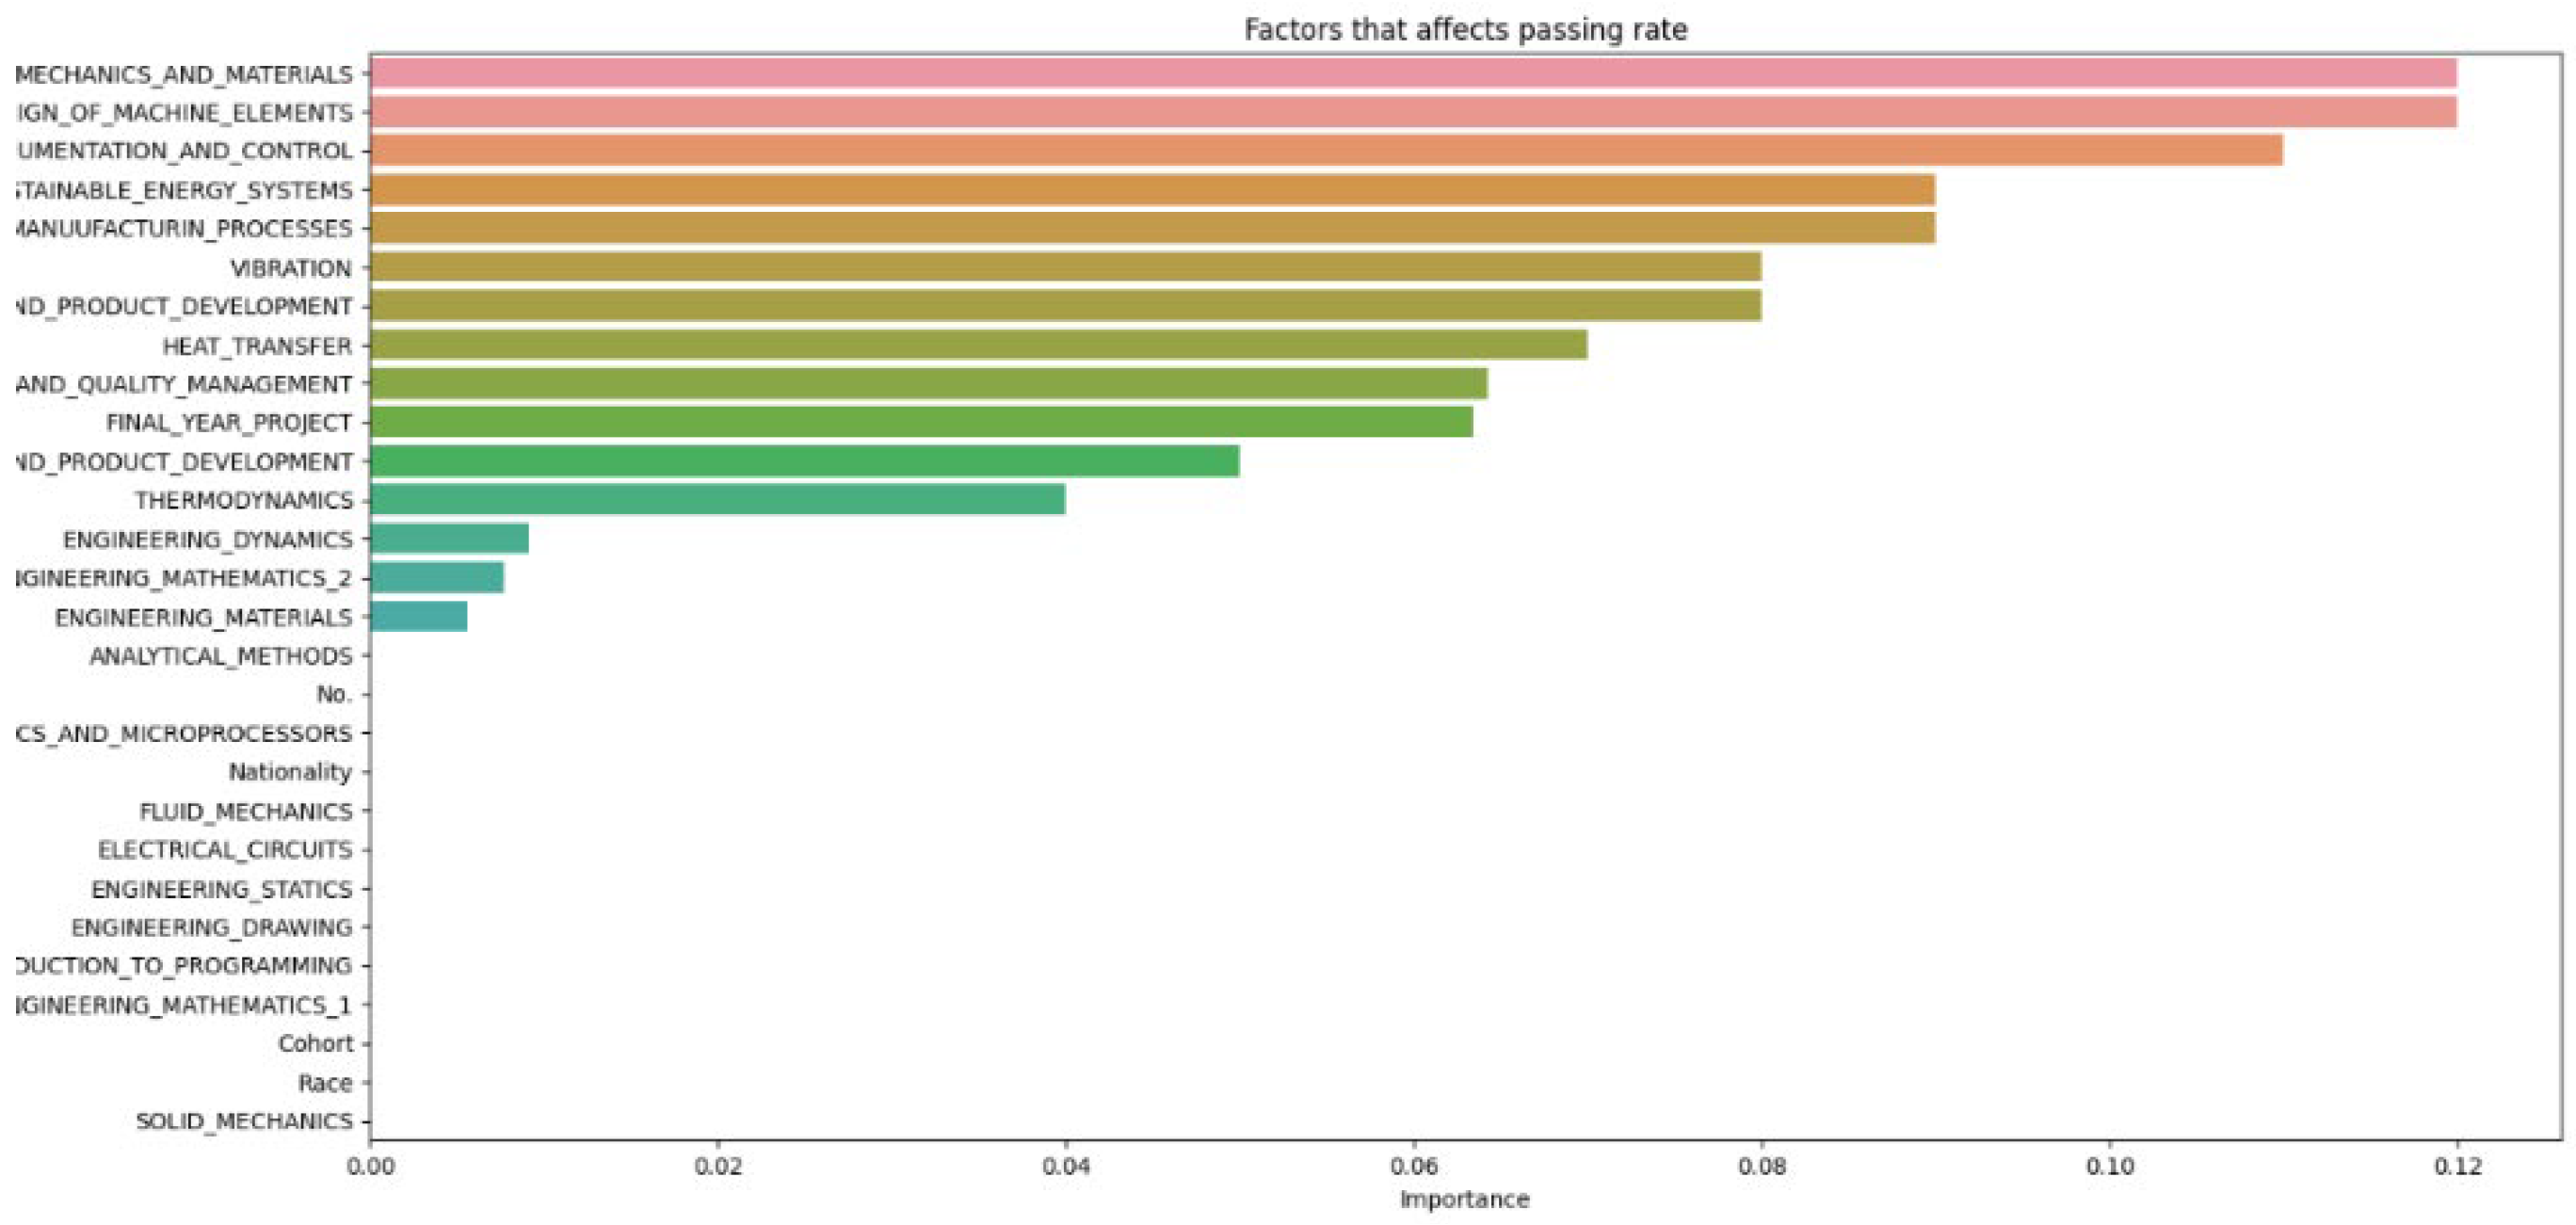
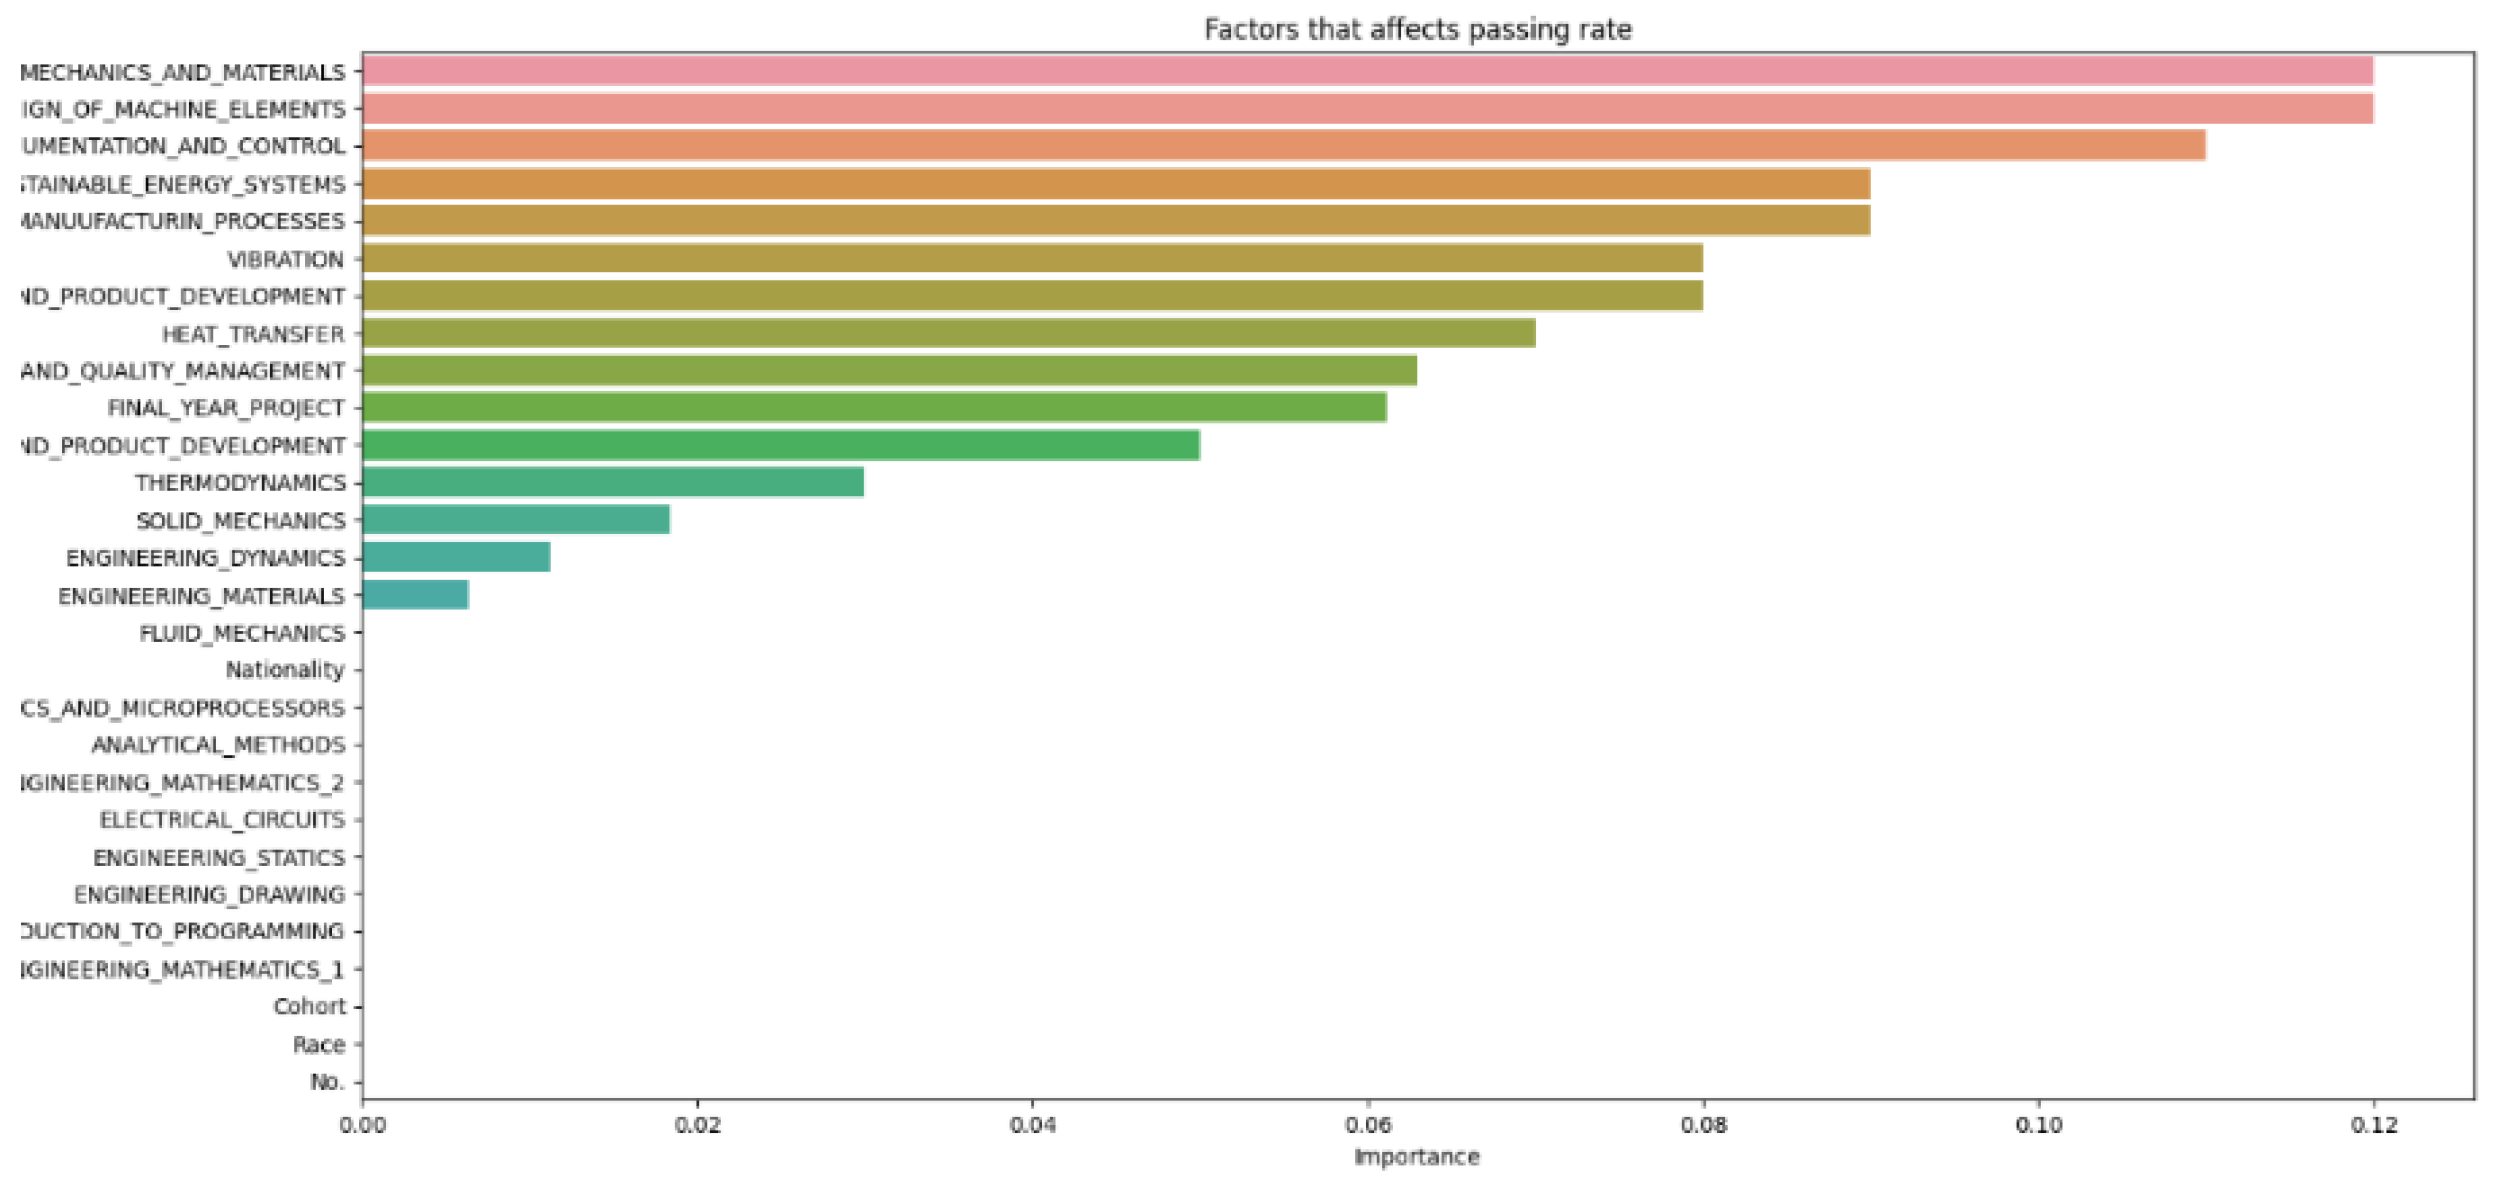
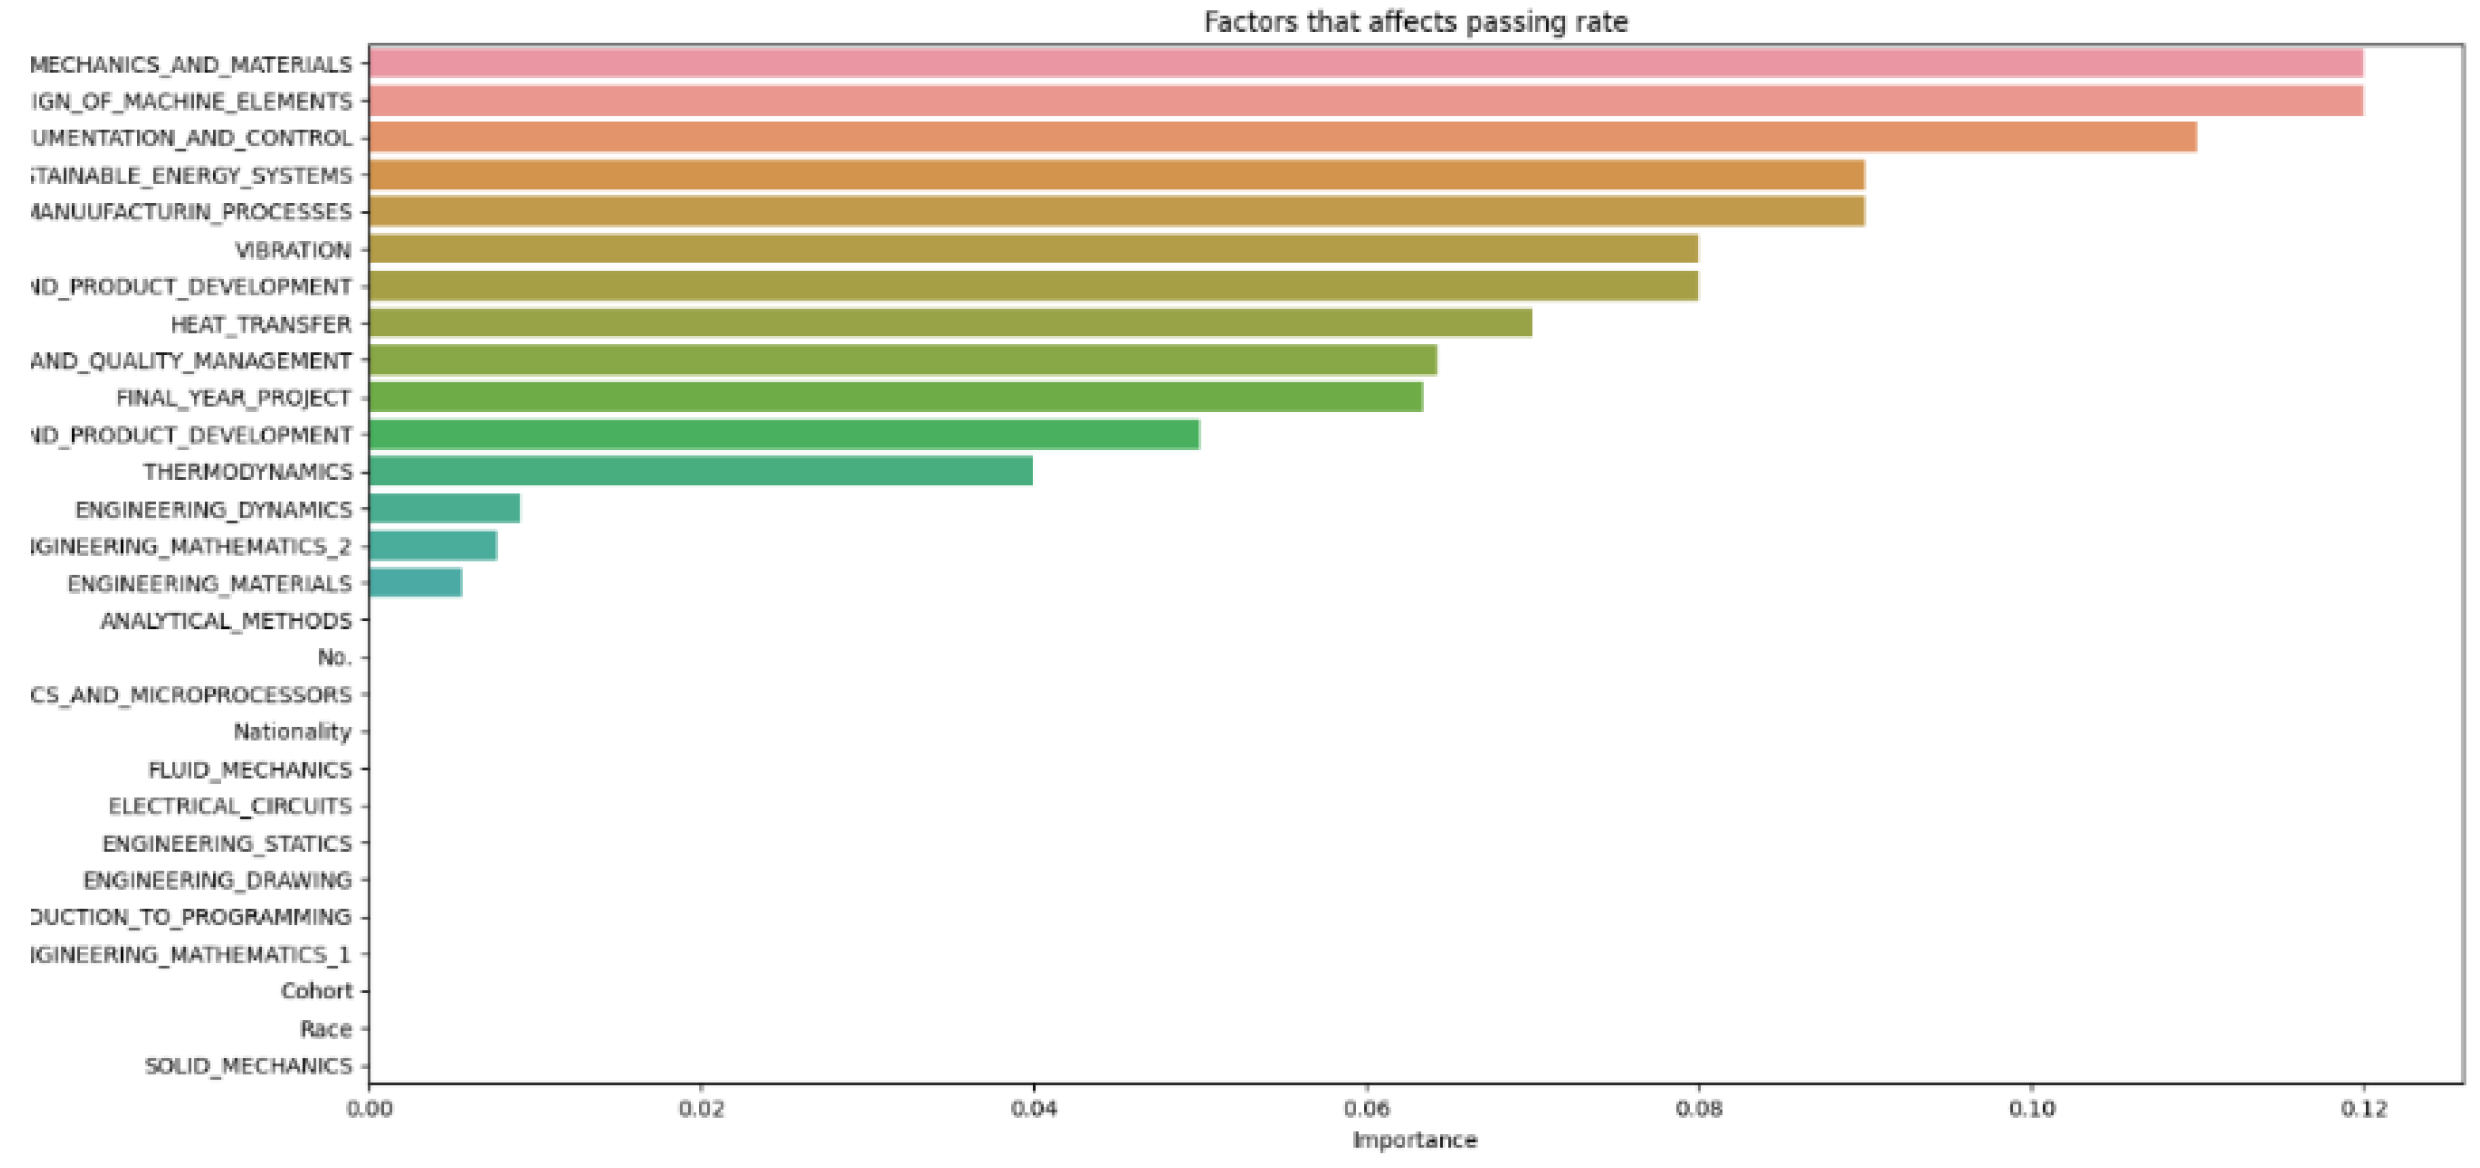
To assess the accuracy and effectiveness of the machine learning model, it is crucial to evaluate it on a different subset of data that the model has not previously encountered, known as the test set. This approach provides an estimate of how well the model is likely to perform on new, unseen data. Using the same data for both training and testing could lead to the model memorizing the data and performing well on the test set but failing to generalize to new data, a problem known as overfitting, which is one of the biggest challenges in machine learning. Evaluating the model on a separate test set helps detect overfitting and ensures that the model is learning the underlying patterns in the data rather than just memorizing specific examples.
Figure 9,
Figure 10,
Figure 11,
Figure 12 and
Figure 13 are generated at different increments of test size to prevent overfitting and achieve better accuracy.
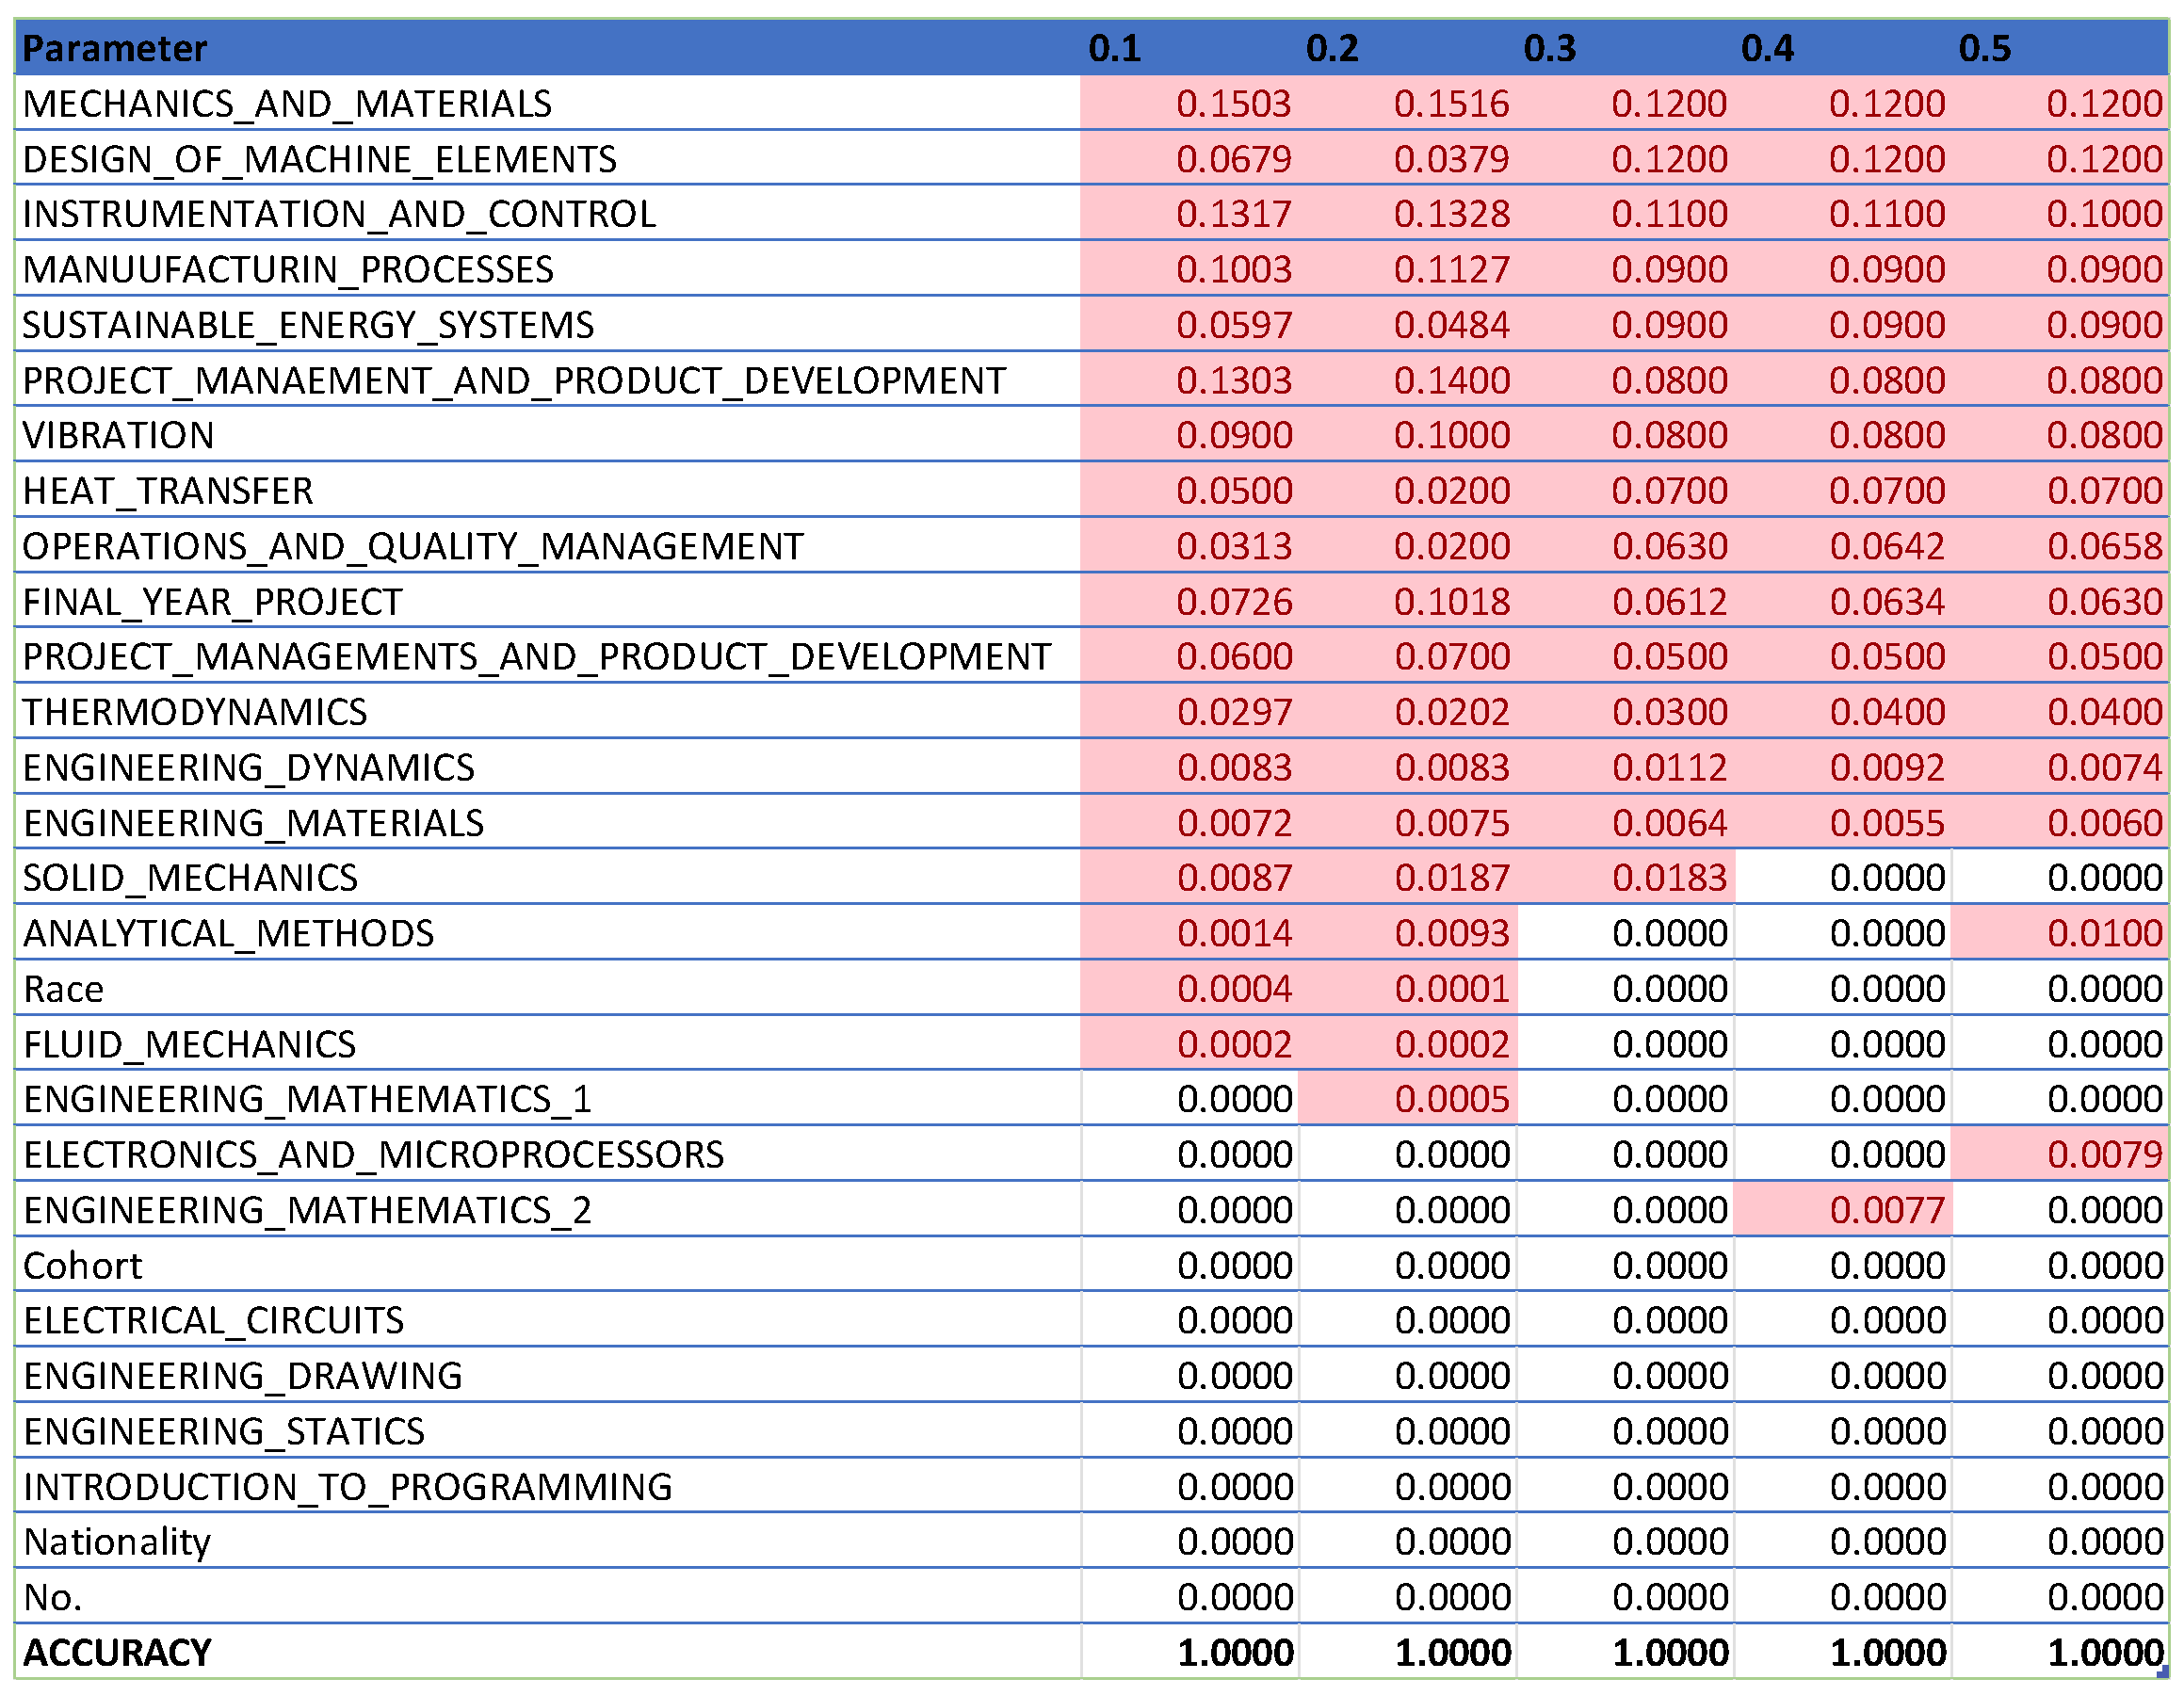
In
Figure 14, which compiles parameters affecting student attrition with varying test sizes, shows that as test sizes increase, the number of influential parameters decreases, indicating an indirectly proportional relationship. A larger test sample, by holding out more data for testing, provides a more precise estimate of the model’s performance on unseen data because it better reflects the broader data community. However, a larger test set may result in fewer data for the model to learn from, potentially lowering predictive accuracy. As
Figure 13 demonstrates, when the test size reaches 0.5, the number of parameters drops, indicating a decrease in predictive accuracy. Shalev-Shwartz and Ben-David support this [
21], stating that while a larger test size can yield a more accurate performance estimate on unseen data, it may reduce predictive accuracy due to limited training data availability. Conversely, a smaller test size allows for more training data, potentially enhancing predictive accuracy, but the performance estimate may be less precise due to limited testing data, as seen in
Figure 9. Géron confirms that a smaller test size can increase predictive accuracy by providing more training data but may lead to less accurate performance estimation due to the smaller testing dataset [
22]. Generally, there is a trade-off between the precision of the model’s performance estimate and the test size. The appropriate test size varies based on the problem, dataset size, and desired training-to-testing ratio. Typically, small to medium-sized datasets use a test size of 20–30%, while very large datasets use about 10%. Cross-validation can also be employed to assess machine learning model performance more accurately, as it evaluates the model’s performance across various data layers, mitigating the impact of the specific test size on the estimate.
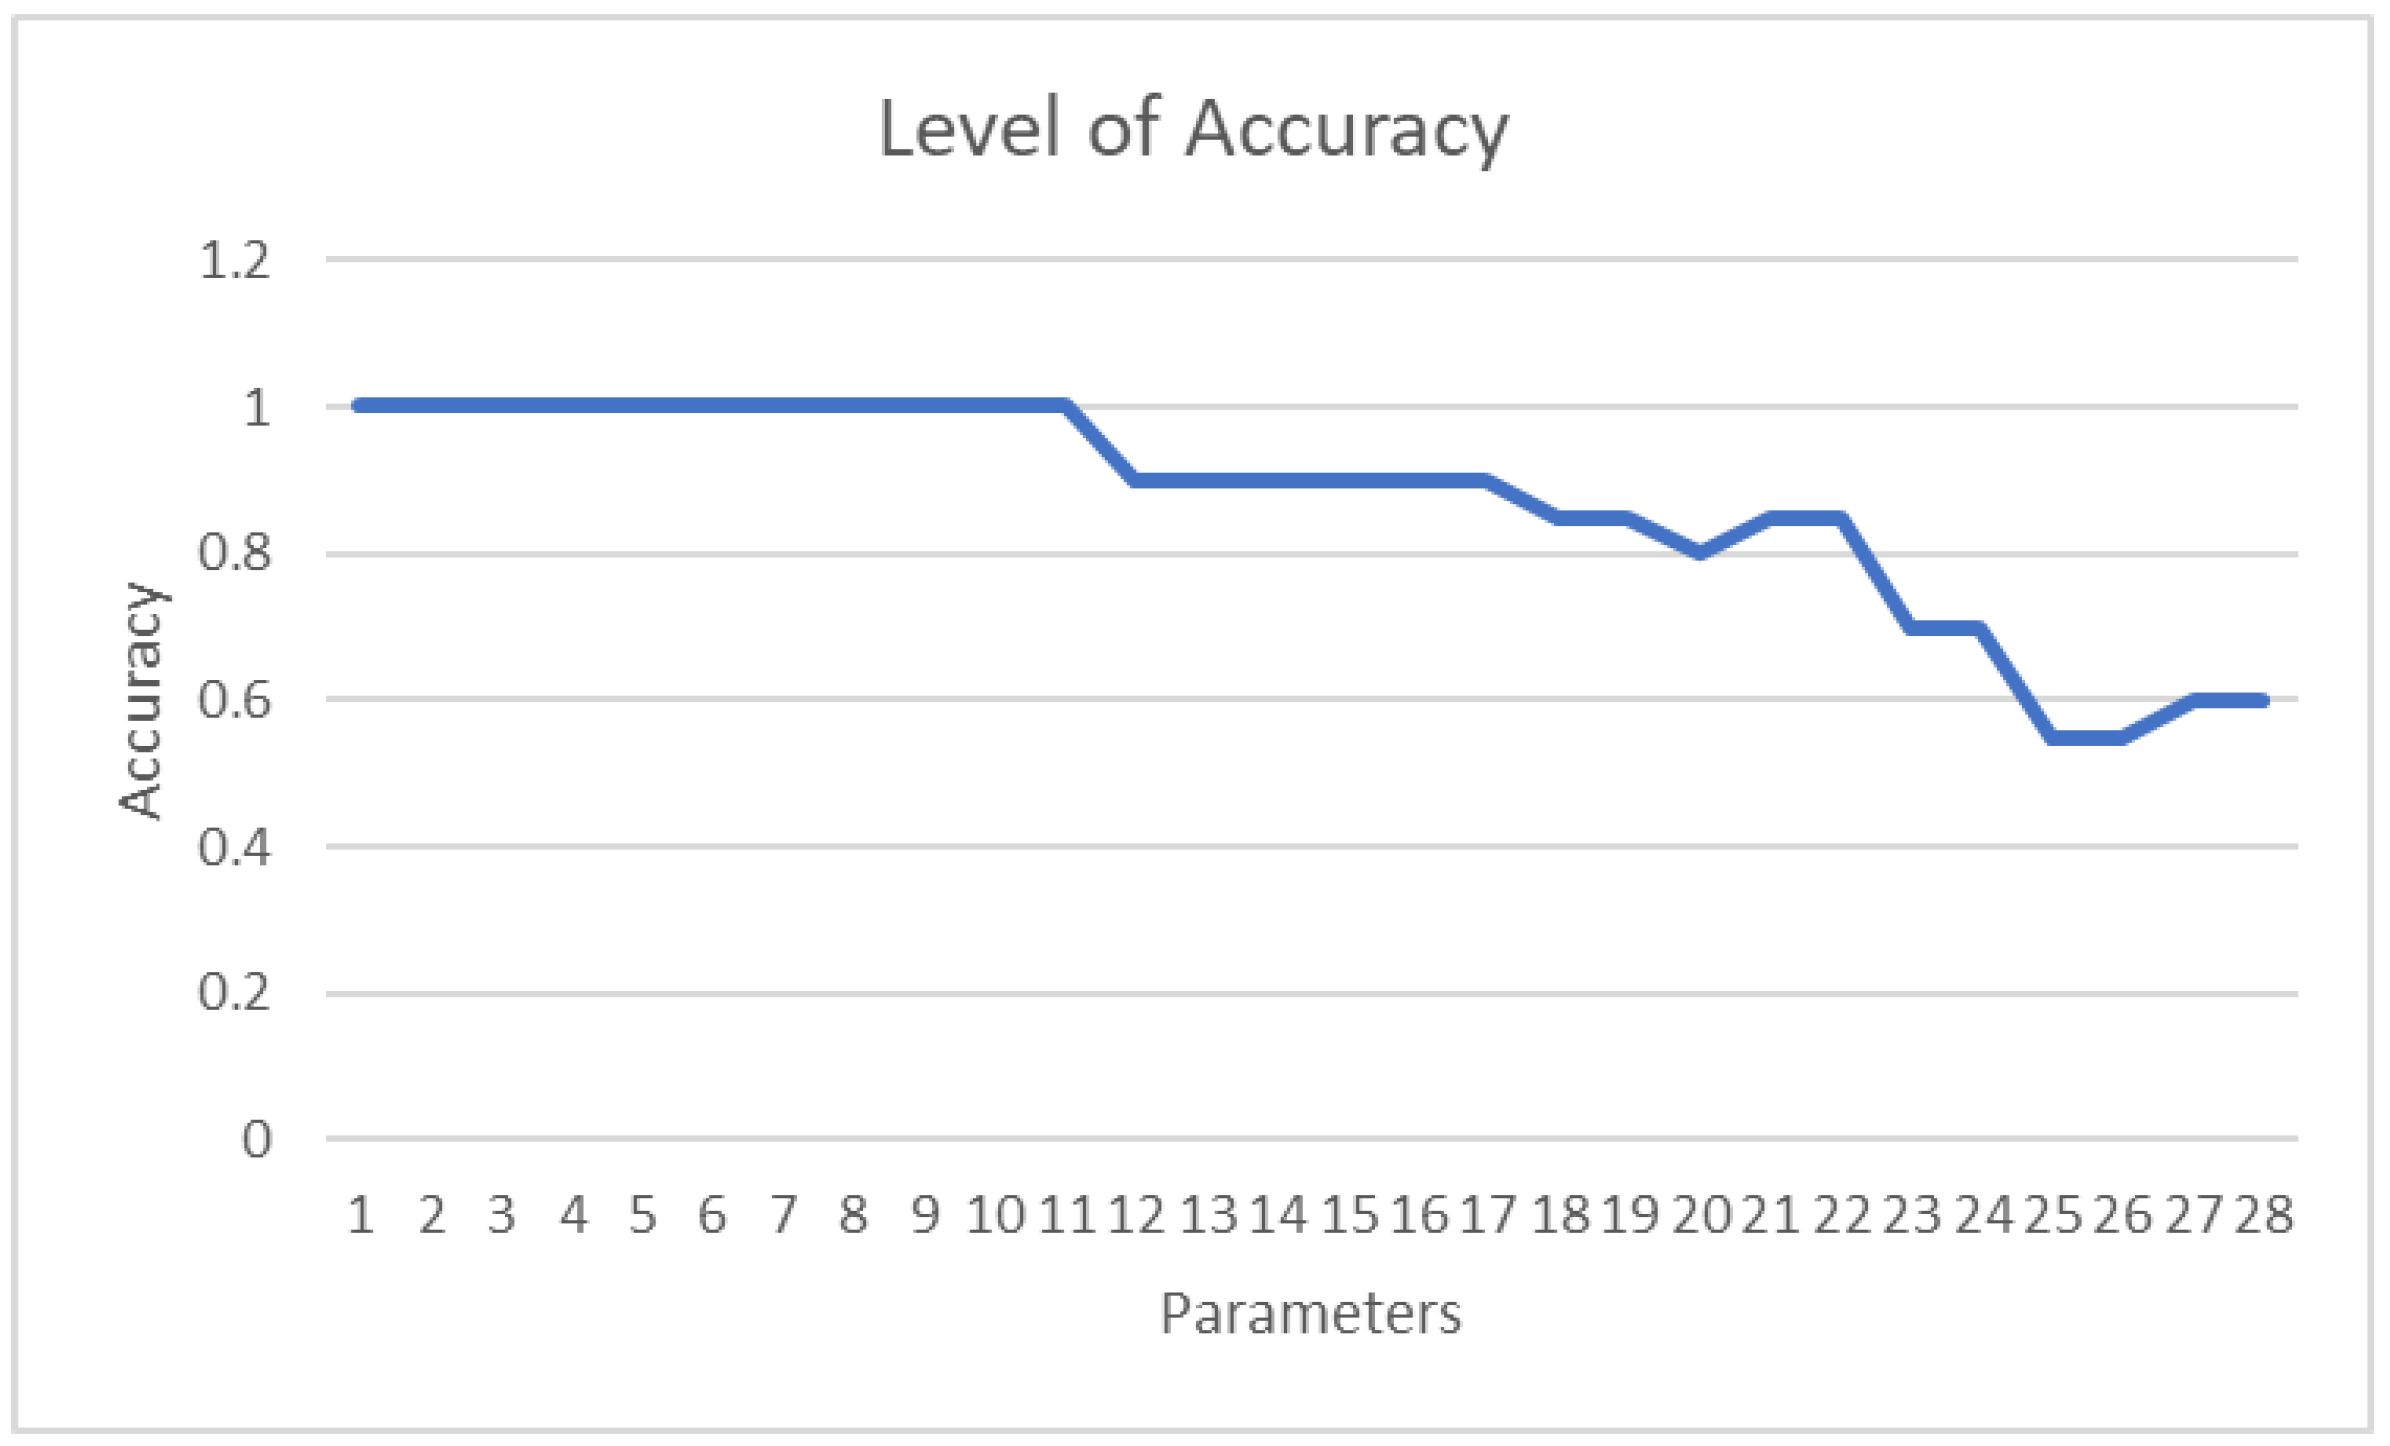
A line graph illustrating the number of parameters in the machine learning model affecting its accuracy is shown in
Figure 15. The graph indicates that the initial drop in parameters does not impact the model’s accuracy. However, after the 12th parameter is dropped, a trend of decreasing accuracy emerges. This suggests a direct relationship: as more parameters are fed into the machine learning model, the model’s accuracy increases.
In machine learning, increasing the number of parameters in a model generally enhances its accuracy up to a certain limit. This is because more parameters enable the model to learn complex patterns in the data, leading to better predictions. However, the relationship between the number of parameters and accuracy is nuanced, influenced by factors such as the quality and quantity of training data, the problem’s complexity, and the model’s architecture and hyperparameters. According to LeCun, Bengio, and Hinton, exceeding a certain number of parameters can degrade model performance by causing overfitting or making it too slow to train or deploy in production [
23]. Therefore, balancing the number of parameters with model performance is crucial, considering trade-offs between accuracy, complexity, and computational cost. This can be achieved by experimenting with different model architectures and hyperparameters and employing techniques like regularization and pruning to reduce the number of parameters without sacrificing accuracy, as supported by Zhang, Gool, and Timofte [
24].
4.3. Average Grades of Each Module
The average of each module was calculated to determine if any of the courses stand out from the rest or have shown higher difficulty compared to the rest shown in
Figure 16.
Figure 16 shows that despite the increasing difficulty of modules over the years, the average grade across all modules remained at a B. This consistency implies that the school maintains a uniform and effective teaching approach across all subjects, using similar instructional strategies to ensure a consistent learning experience for students. It suggests that no particular subject alone caused the students
’ attrition rate. However, this consistency might also indicate the use of a bell curve grading system, which is not a common or recommended educational practice. The bell curve, or normal distribution, represents a distribution of scores where most scores are near the mean and fewer scores are at the extremes. While it is often used for evaluating student performance, Gustafsson and Balke argue that using it to enforce a predetermined average in each subject is neither effective nor fair, as it assumes all subjects are equally difficult and all students are equally capable in each subject, which is unrealistic [
25]. Each subject presents unique challenges, and students have varying strengths and weaknesses. Additionally, the average grades of each student were calculated to assess individual performance, as shown in
Table 1.
Table 1 reveals that although the average grades for each subject show minimal variation, the average grades per student vary significantly. This suggests that students have diverse strengths and weaknesses across different subjects, with individual factors influencing their performance. For instance, one student might excel in material science but struggle with electrical circuits, while another might excel in electrical circuits but find material science challenging. Additionally, external factors such as study habits, motivation, and home environment may also affect students’ grades.
4.4. In Depth Analysis of Subjects Per Classification
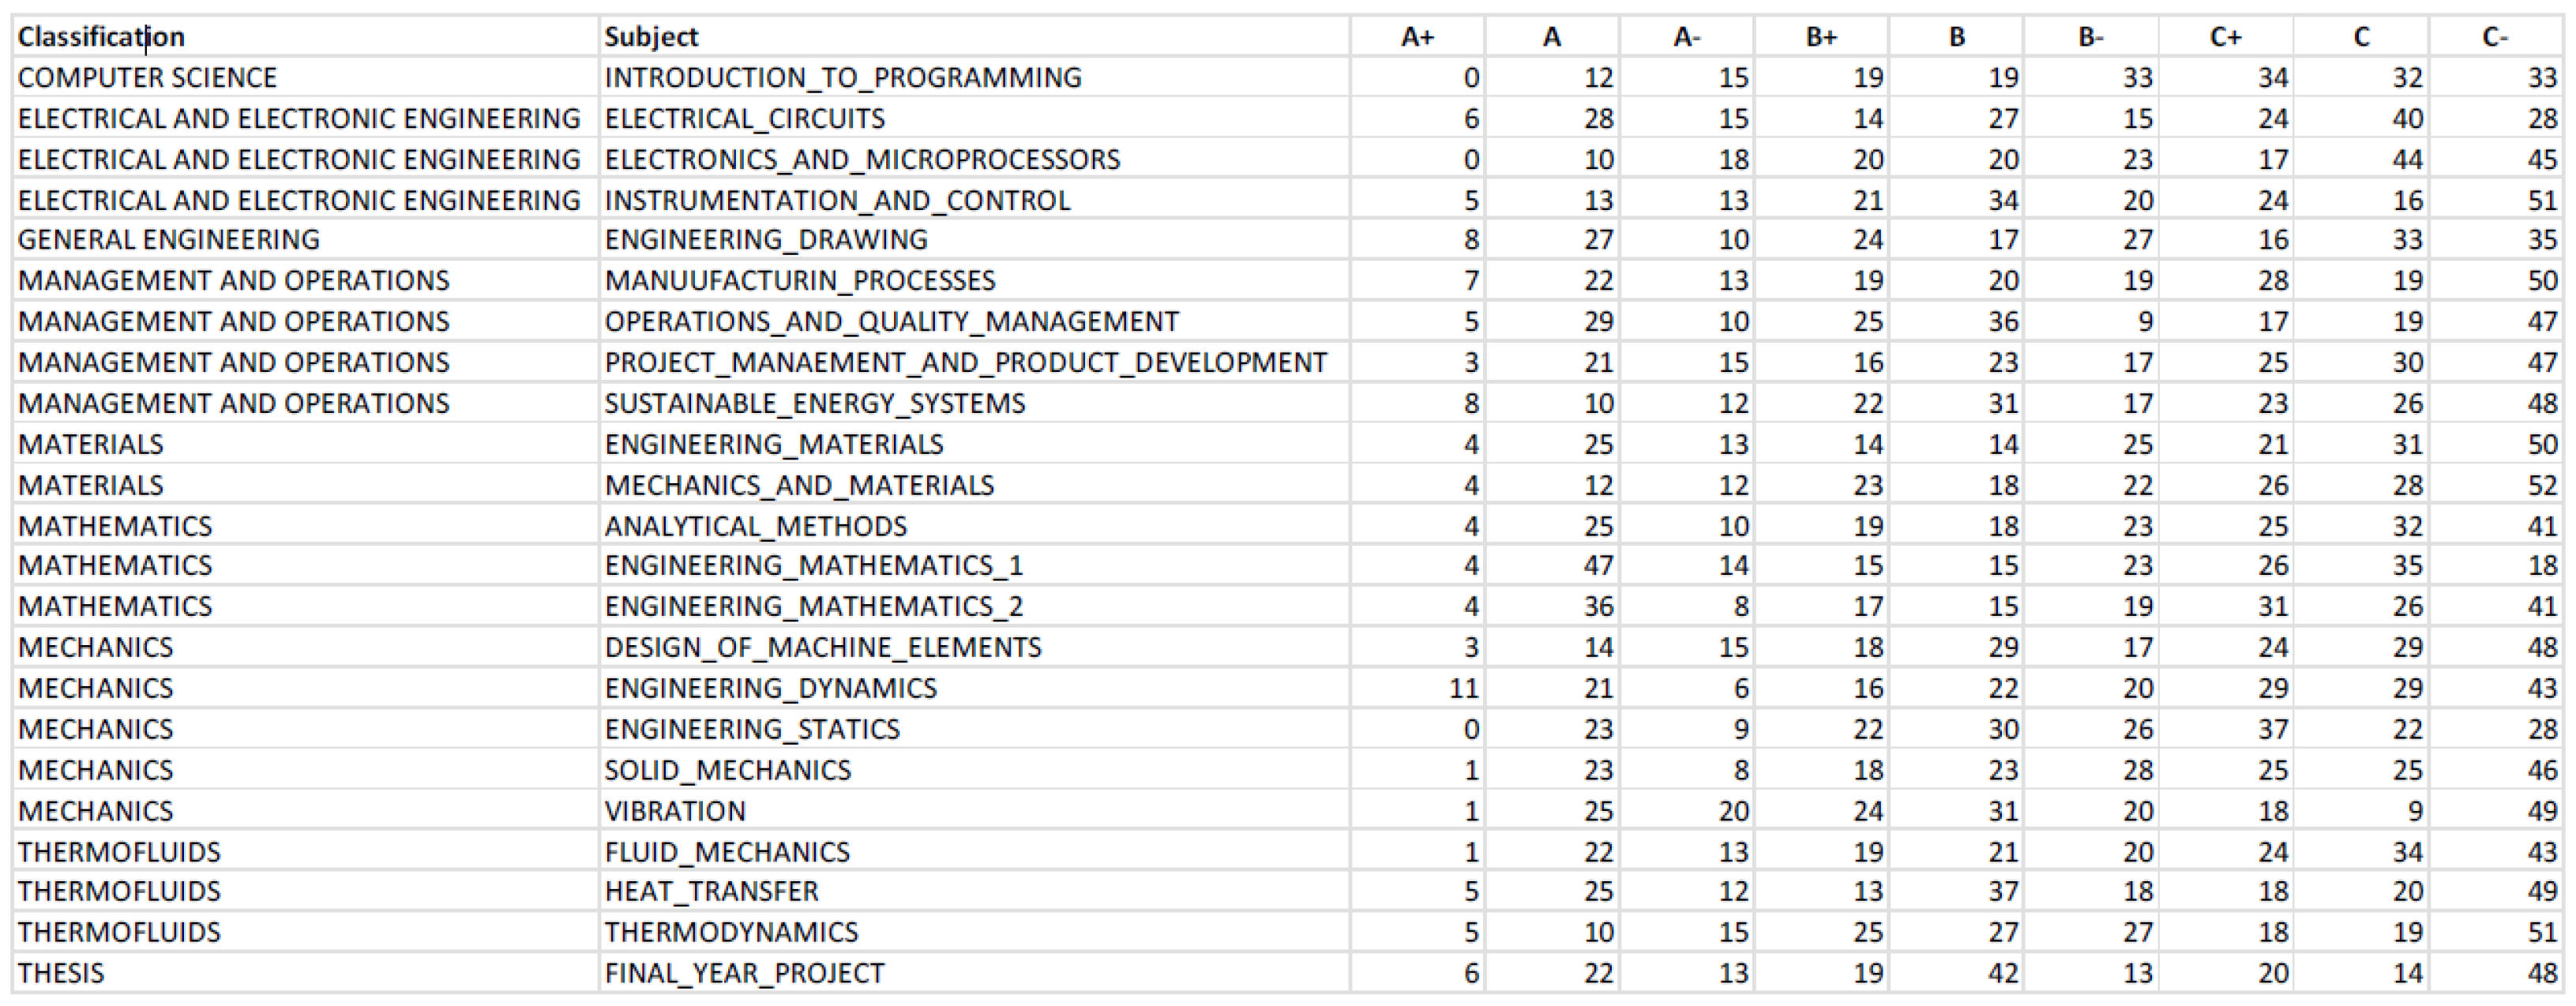
In order to perform in depth analysis of subjects that students have excelled in, a table with all the subject and the grading of each student was made, the subjects are also classified into the different field such as Math, Physics etc., shown in
Figure 17.
Figure 17 shows that Engineering Dynamics has the highest number of A+ grades at 11, significantly outperforming the second-highest subject, which has 8 A+ grades, indicating that most students excelled in this subject. Conversely, Mechanics and Materials has the highest number of C- grades at 52 and the fewest students scoring As, suggesting that this module is particularly challenging for most students. However, there are several limitations that could lead to inaccuracies in
Figure 17. Students granted exemptions are automatically given a B grade in the dataset, and those who failed a subject and retook it do not have their initial results recorded. Additionally, students who dropped out and stopped taking subjects are not reflected in this table, as their grades are left blank. These limitations can result in misleading observations. To improve accuracy,
Table 2 was created to classify subjects instead of listing each individually, and grades were consolidated into A, B, C, and F for better clarity and ease of analysis.
Table 2 reveals that Mathematics is the subject where most students excel, with an average of 51 students scoring an A per Mathematics-related module. In contrast, Computer Science-related subjects have the fewest A students, with only 27. However, while Mathematics sees many students achieving As, it also has a high number of students scoring Cs, indicating a steep learning curve. This significant disparity in performance suggests that the course structure might need to be adjusted to better support students. Those who excel in Mathematics do so significantly, while those who struggle tend to perform poorly, sometimes even failing. This large discrepancy highlights the need for changes to help all students cope better with Mathematics. Research by Smith supports this observation, noting a substantial gap in math performance between students who excel and those who struggle, with the latter often facing significant challenges and potential failure.
4.5. Cohort Performance Analysis
From the last observation, it can be deduced that subject difficulty plays a significant role in student dropout rates. However, it cannot be confirmed that students performed poorly solely due to the difficulties imposed by the subject. Environmental factors might also be a significant influence. To explore this,
Figure 18 was compiled with the average grades of each cohort to determine whether their peers and environment significantly affect their grades.
Figure 18 shows that all cohorts achieved an average grade of B, except for cohort 5, which scored only Cs and had an average of C across all modules, making it the worst-performing cohort. In contrast, cohort 6 had an overall average of B+ and was the only cohort to achieve a grade of A-, making it the best-performing cohort academically. Given that cohort 6 follows directly after cohort 5 and displays a significant improvement in average grades, it can be suggested that the school responded to the drastic grade drop in cohort 5 by implementing necessary measures, such as altering the course structure or improving facilities, to enhance the learning experience for students, which explains the sharp increase in performance between cohorts 5 and 6.
Figure 18 reveals that Management and Operations subjects have the highest average grades across all cohorts. These subjects do not involve exams but instead rely on team projects or assignments for grading. Project-based courses in engineering typically require students to address real-world problems or challenges, often collaboratively. This practical approach allows students to apply theoretical knowledge in engaging ways, leading to deeper understanding and retention of material, which often results in higher grades. Team-based projects also foster collaborative learning, increasing student engagement and motivation, as students learn from each other
’s strengths and knowledge. The creative and innovative problem-solving required in these courses can be more stimulating than traditional calculation-based courses, further boosting motivation and performance. Conversely, Thermofluids subjects have the lowest performance among all cohorts, with the highest number of Cs and the fewest Bs. Thermofluids involves complex and abstract concepts like thermodynamics, fluid mechanics, and heat transfer, which require a solid foundation in mathematics and physics. Students who are not well-prepared in these areas may struggle, leading to poor performance. Additionally, a lack of interest or perceived relevance to future careers can reduce motivation. Ineffective teaching methodologies may also hinder students
’ understanding and engagement. Furthermore, Thermofluids courses, typically numbered in the 2000 series, are early-year modules. Students may not yet have the necessary background knowledge, making the material harder to grasp and apply. To address these issues, it is recommended to move Thermofluids subjects to higher-level modules, where students have the required foundational knowledge. Providing ample practice opportunities and resources can also help students master the material. While the mean grade represents the central tendency, it does not account for data variability or value distribution. Therefore, standard deviations for each cohort are calculated, as shown in
Table 3, to better understand the spread of student performance. The standard deviation measures how much individual values deviate from the mean, highlighting patterns in data distribution. For instance, if cohort 1 has many As and Cs but averages a B, and cohort 2 consistently earns Bs, both cohorts may have the same average, but cohort 1 has a wider performance spread, indicating a higher variability in student success.
Table 3 shows that Cohort 13 has the highest standard deviation, indicating significant grade disparity despite an average grade of B. This suggests a mix of high achievers and underperformers within the cohort. Cohort 6, with the highest average grade, also has one of the lowest standard deviations, meaning most students performed well. In contrast, Cohort 5 has the lowest average grade, but its standard deviation is similar to that of Cohort 6, indicating uniformly poor performance across the cohort. The variation in standard deviation across cohorts suggests that the academic environment does not significantly impact individual student performance, as most cohorts average a B grade but show different levels of performance spread. This implies that personal factors play a more substantial role in academic success than the peer environment. Mechanical Engineering, with its rigorous foundation in mathematics, physics, and other sciences, requires a deep understanding of complex principles. Success in this field is influenced not only by innate talent but also by interest, motivation, effort, and study habits. Performance can vary greatly across different subfields within mechanical engineering, so excelling in one area while struggling in another is common. Therefore, a student
’s success in mechanical engineering largely depends on their individual interests, strengths, and career goals. It is crucial for prospective students to assess their abilities, passions, and aspirations before pursuing a career in this field.
4.6. Cross-Validation of Results for Accurary
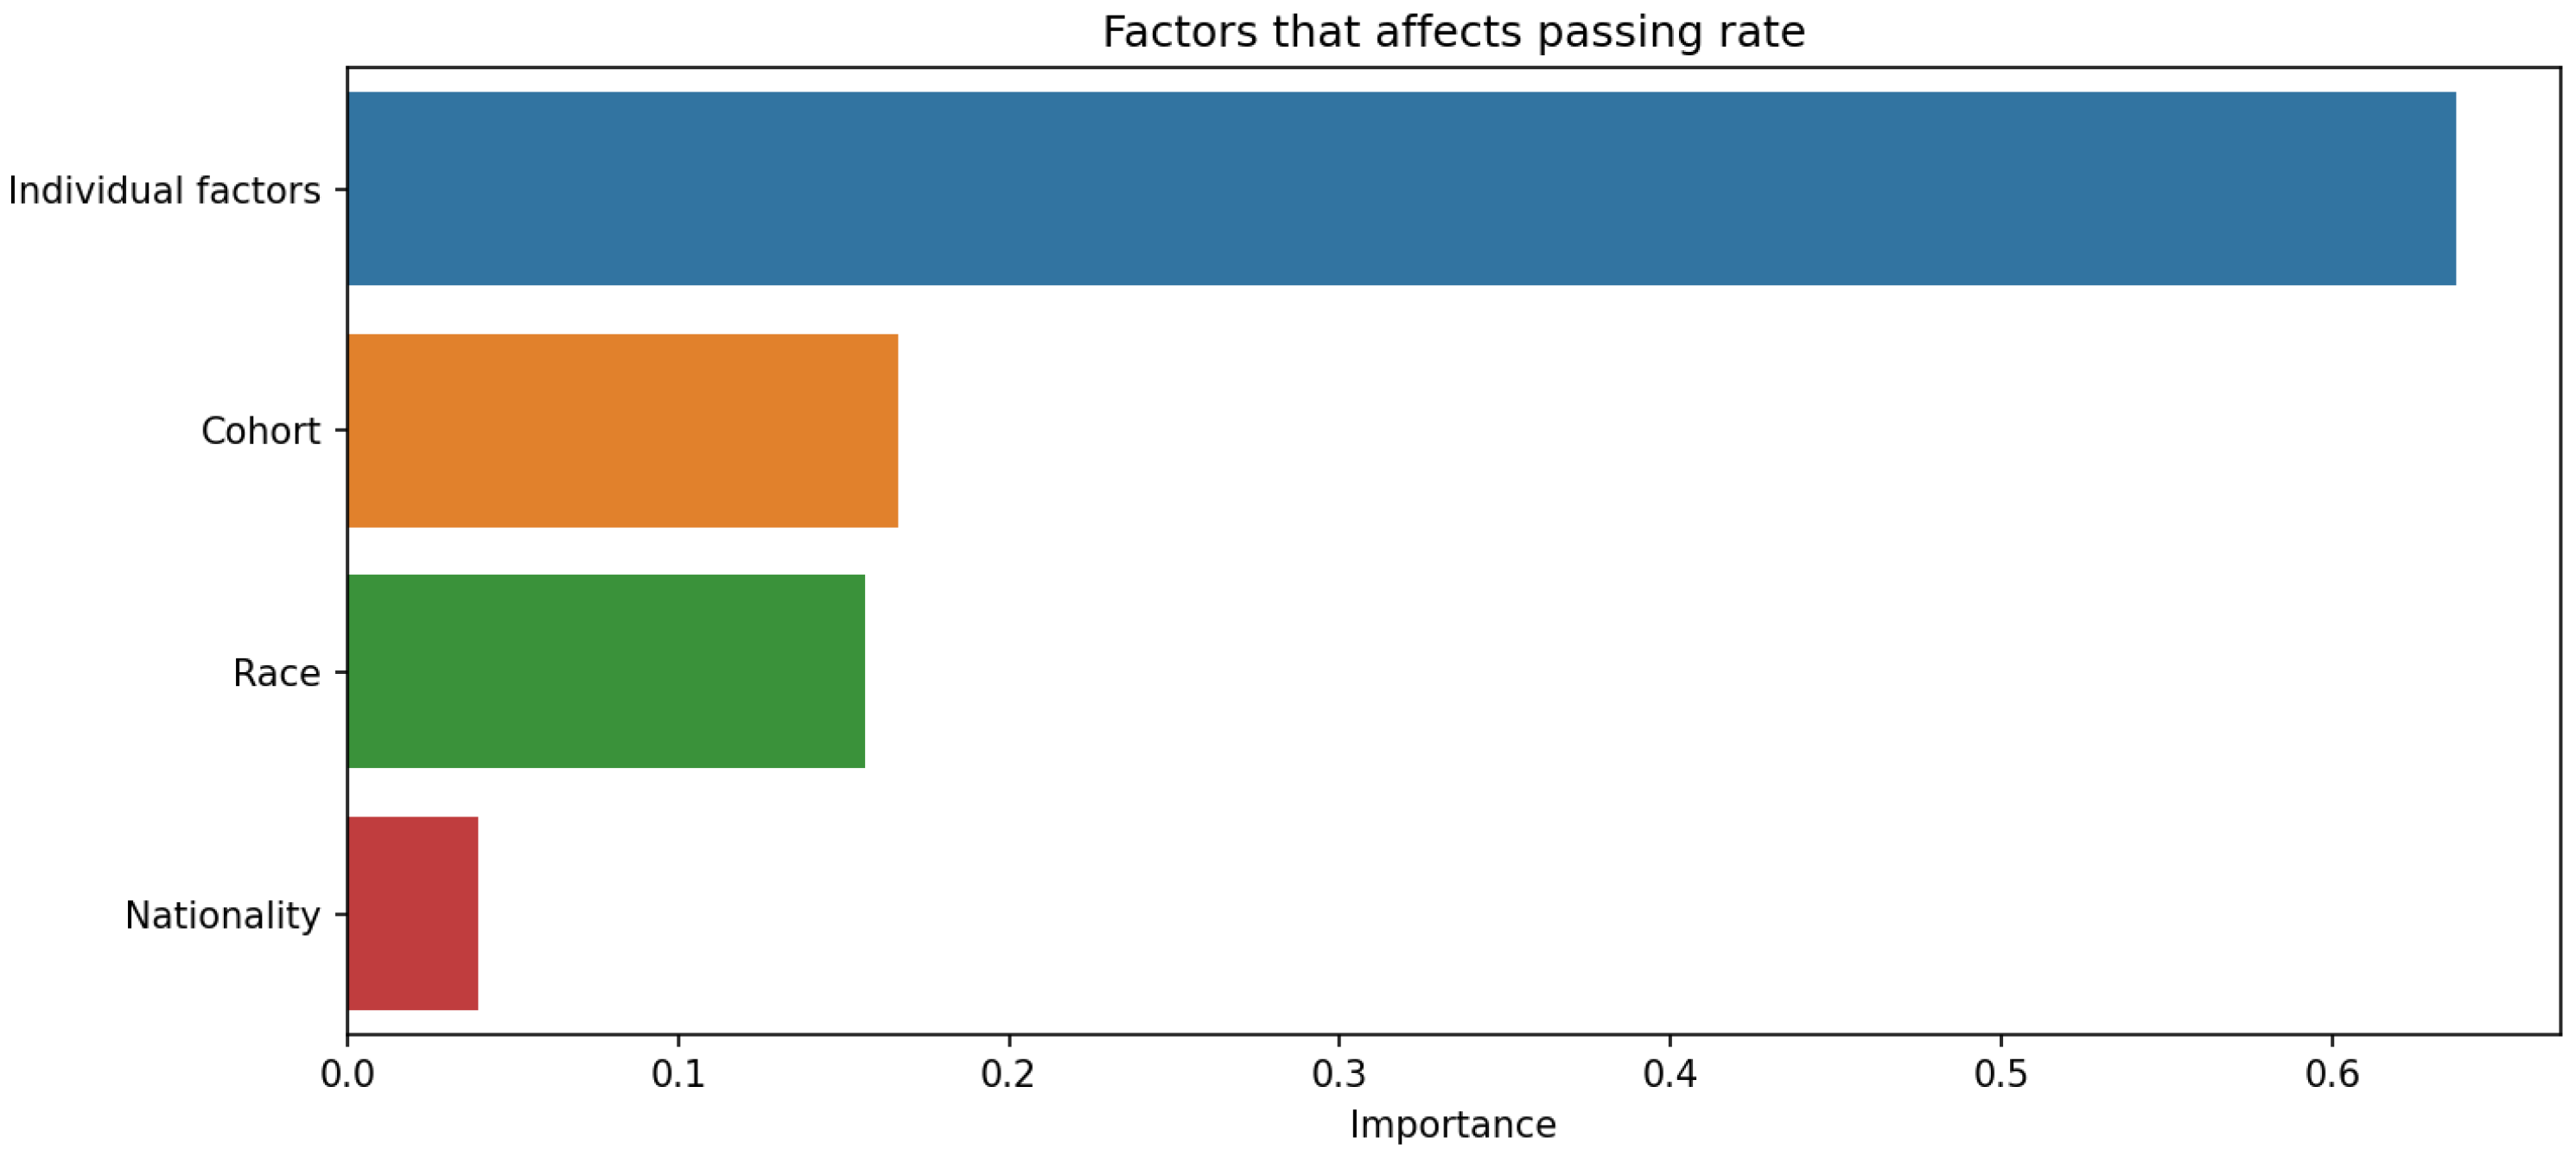
If the average of each subject varies very little, but the average grades of each student vary drastically, it could suggest that individual factors are playing a significant role in student performance, thus cross-validation was done shown in
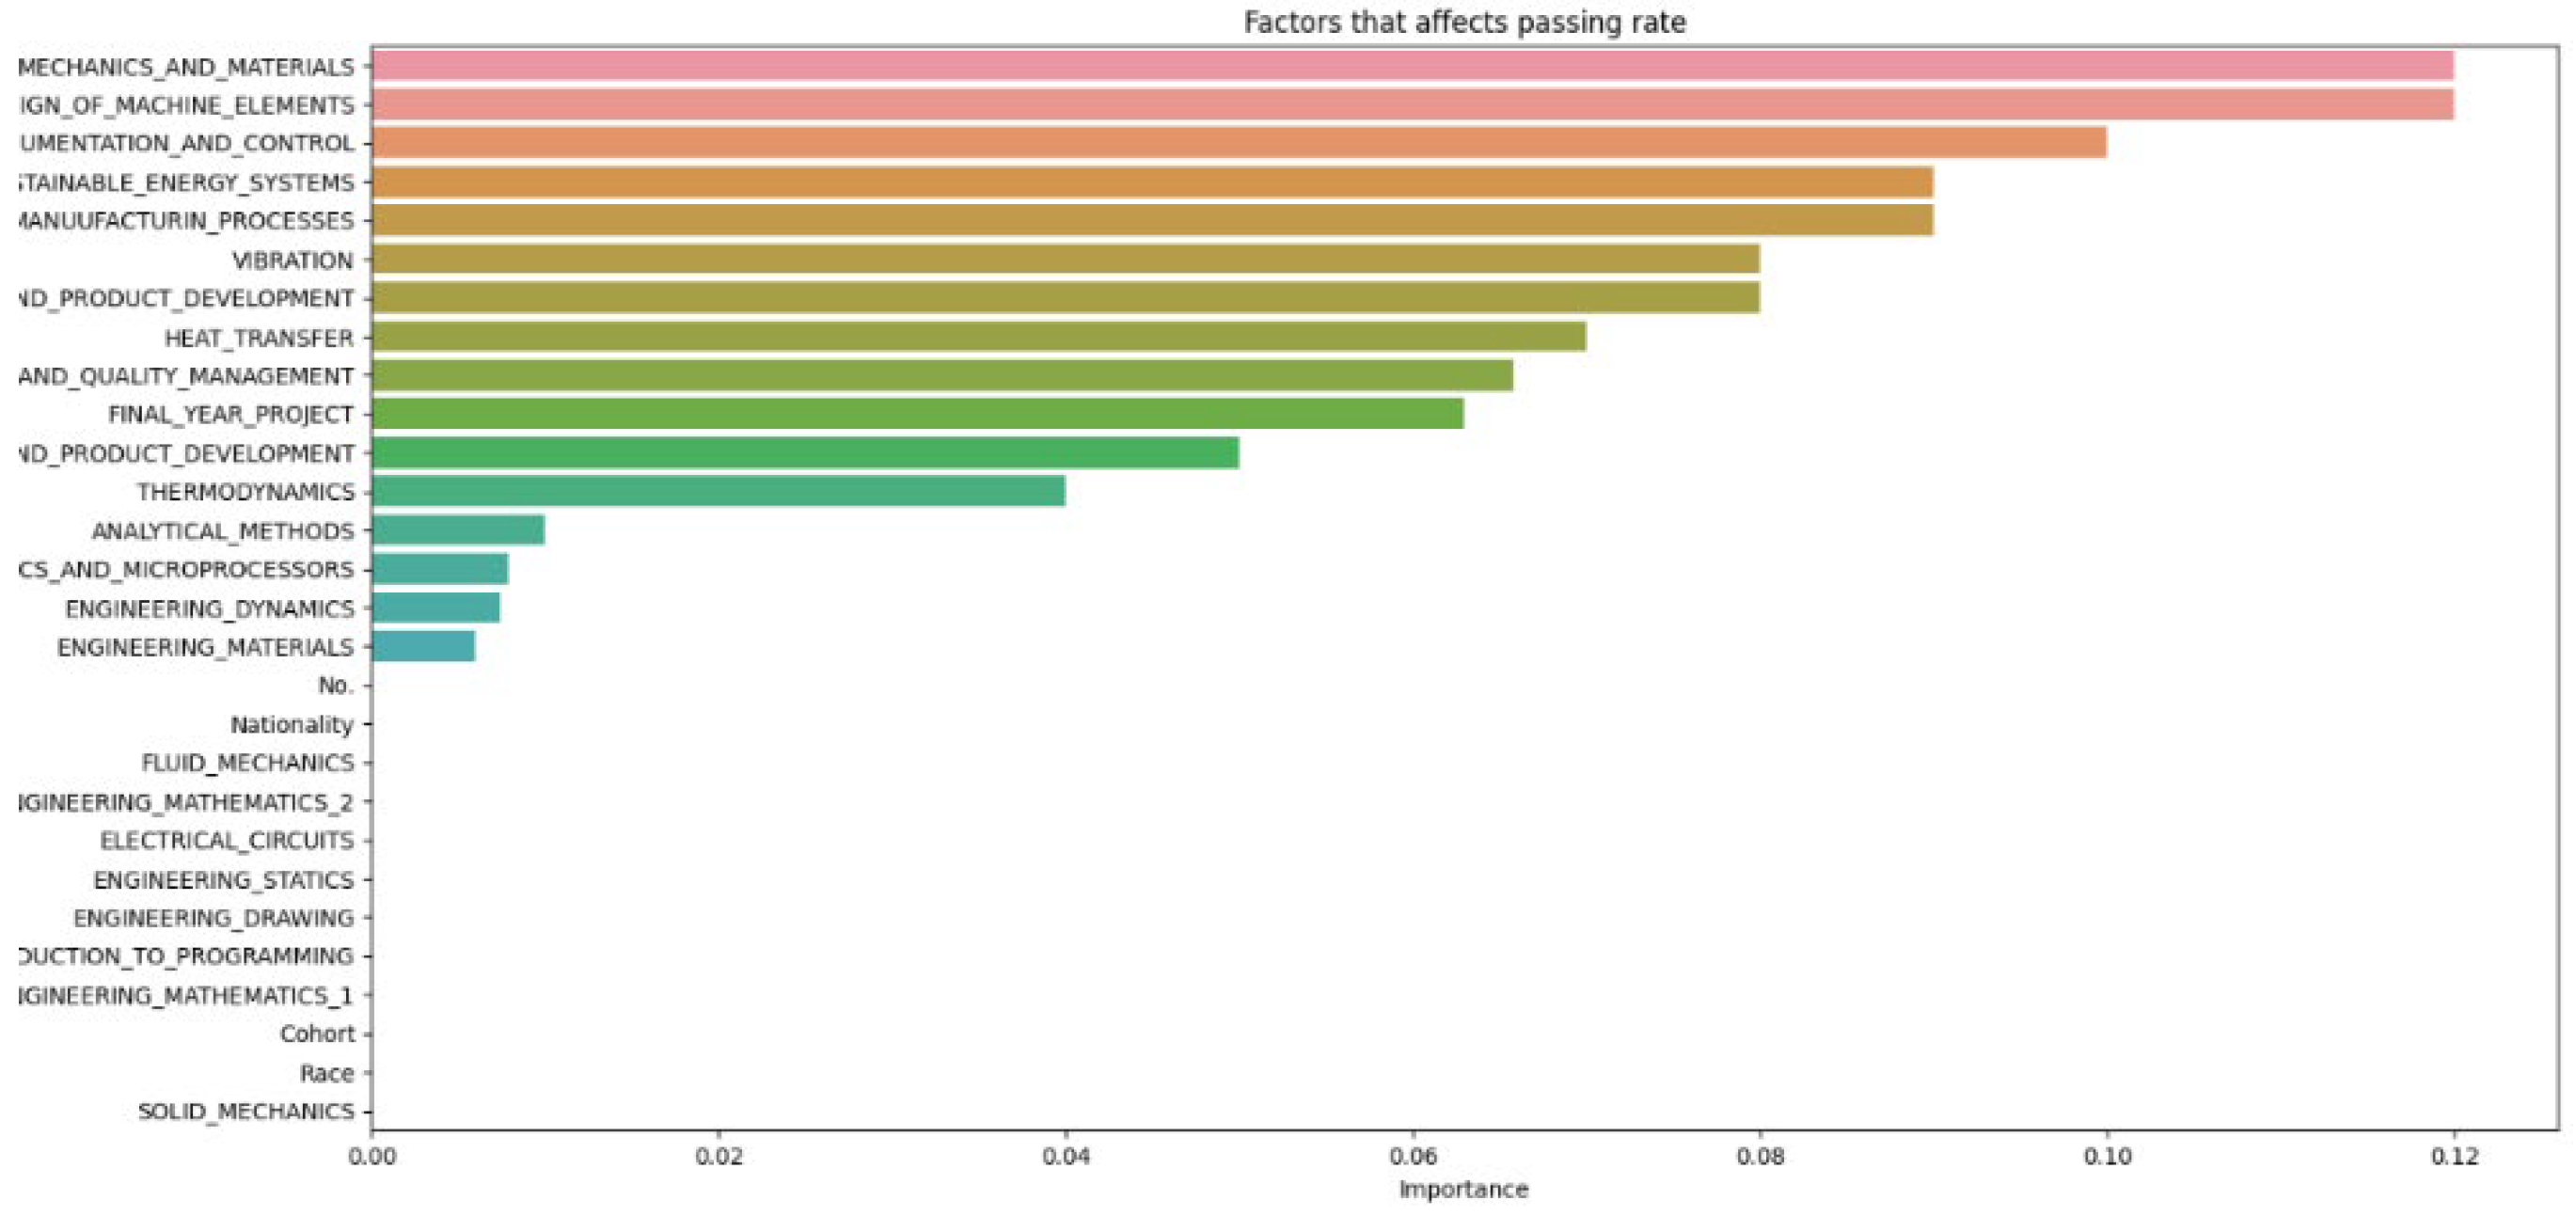
Figure 19 to observe which of the individual factors place most relevancy to student dropout.
Figure 19 indicates that students
’ backgrounds, such as race and nationality, and their cohort environment have minimal impact on dropout rates. Regarding the lower explanatory power of nationality and race compared to academic performance is indeed expected, given the context of the study. Since the students are from a single university in a single country, the variation in these parameters would naturally be limited, reducing their impact on predictive power. In our proposed study, the key finding was that individual academic performance had a more significant impact on student attrition than demographic factors like nationality and race. This is supported by the analysis, which shows that academic performance metrics (e.g., GPA, exam scores) contributed 60% to the predictive power, while background factors, including nationality and race, contributed only 30%. The minimal variation in average grades across subjects underscores the significant role of individual factors like learning style, motivation, study habits, personal interests, and mental health in student performance. Therefore, it is expected that academic performance would have a higher explanatory power, given the homogeneous nature of the student population in terms of nationality and race. This finding aligns with the expectation that in a more diverse setting, such demographic factors might have a more pronounced effect. However, in this study context, the limited diversity leads to these factors having less impact compared to academic performance.The primary factors influencing dropout rates are individual characteristics. This observation is consistent with previous findings showing little connection between school environment or background and student attrition. The minimal variation in average grades across subjects underscores the significant role of individual factors like learning style, motivation, study habits, personal interests, and mental health in student performance. However, due to data limitations, further conclusions cannot be drawn. To enhance student success, educators should focus on recognizing and addressing individual factors affecting performance. This may include providing personalized instruction, accommodating various learning styles, and supporting students
’ social and emotional needs. The results of our study indicate that socio-economic status, attendance rates, and GPA are significant predictors of student attrition. The Random Forest model used in our analysis achieved an accuracy of 100% as observed from our hyperparameter optimization experiments. I recognize the importance of incorporating detailed statistical analysis to support our conclusions and elucidate the significance of the results. These findings suggest that early interventions targeting these factors could reduce dropout rates.
4.7. Longitudinal Effect in Student Attrition
The subjects are also classified for observation to determine if there is any link between the subject groups and the student attrition rate shown in
Figure 20.
Figure 8 and
Figure 14 highlight that the top three factors influencing student attrition are Mechanics and Materials, Design of Machine Elements, and Instrumentation and Control, as illustrated in
Figure 20. These are all first-year courses, suggesting a potential longitudinal effect on student retention. Guerrero and Wiley indicate that if most dropouts occur early in these courses, with fewer as the course progresses, it suggests that students who pass the initial stages are more likely to complete the program. This trend may be due to various factors, such as inadequate preparation for the course rigor, external challenges like financial or personal issues, or ineffective course design and delivery that fail to engage or support students. To improve retention, it may be necessary to adjust the course structure or delivery, provide additional support and resources, enhance teaching quality, and address external challenges students face. Understanding these retention trends allows educators and administrators to take proactive steps to improve student outcomes.
4.8. Pros and Cons of Using Machine Learning
The adoption of machine learning (ML) techniques in predicting student attrition necessitates a balanced examination of its advantages and limitations. This section aims to articulate why ML might be preferable to traditional statistical methods such as logistic regression or decision trees, which also acknowledging its potential drawbacks.
Advantages of Machine Learning
Enhanced Predictive Accuracy: ML algorithms are capable of processing and learning from vast amounts of data, detecting complex patterns that are not apparent through manual analysis or simplier models. This capacity significantly improves prediction accuracy over traditional methods, which often rely on fewer variables and assume linear relationships.
Automation and Efficiency: Ml automates the analysis of large data sets, reducing the reliance on manual data handing and analysis. This can lead to significant time savings and resource efficency, particularily valuable in educational settings where early detection of at-risk students can lead to timely and effective interventions.
Scalability: Unlike traditional methods that may become cumbersome as dataset sizes increase, ML algorithms excel at scaling with data, maintaining their effectiveness across larger and diverse datasets.
Limitations of Machine Learning
Risk of False Positives: One of the significant challenges with Ml is the risk of generating false positives ⸺incorrectly predicting that a student may dorup out. This can lead to unnecessary interventions, potentially wasting resources and adversely affecting the student involed.
Data Privacy and Security: The need for substantial data to train ML models raises concerns about privacy and data security, especially when sensitve student information is involved. Ensuring the integrity and security of this data is paramount but can be resourcer-intensive.
Complexity and Resource Requirements: ML models, particularly those like random forest or neural networks, are complex and require significant computational resources and expertise to develop, maintain, and interpret. This may pose barriers for insitutions without sufficient tehcnical staff or infrastructure.
Comparision with Other Methods
While the above limiations are signifaicnt, they are not unique to Ml. Traditional statistical methods also face issues such as model overfitting, data requirements, and privacy concerns. However, ML often offers superior performance in handling non-linear relationships and interactions between variables, which are common in student data. This makes ML more effective in identifying at—risk students than simpler models that might not capture such complexity.
At the same time, we have addressed how to prevent overfitting using cross-validation where we employed k-fold cross-validation during the model training phase, which involves diving the data into k subsets. The model is trained on k-1 subsets while the remaining subset is used as the test set. This process is repeated k times with each subset used exactly once as the test set. This technique not only helps in validating the model but also ensures that the model does not overfit the training data. Pruning decision trees is also used to prevent overfitting by using it to cut back on the size of the decision trees through the removal of sections of the tree that provide little power in predicting target variables. Splitting the data into training and testing sets would aid in validating against unseen data by assessing how well our model performs on new, unseen data, which is critical for real-world application. To further ensure the robustness of our model, we applied the trained model to a separate external dataset that was not used during the model training phase. This external dataset comprises data from different cohorts and demographics, providing a rigorous check on the model’s generalizability. We also continuously monitored several performance metrics such as accuracy, precision, recall, and the F1-score. These metrics help in understanding the effectiveness of the model across various aspects, such as the ability to identify true positives such as correctly predicting dropouts and its robustness in avoiding false positives.
Justification for Discussing Pros and Cons
The pros and cons are as shown below:
Transparency and Decision-Making. It provides transparency about the capabilities and limitations of these technologies. This detailed discussion aids potential adopters, particularly educational institutions, in making informed decisions about whether the benefit of ML align with their operational capabilities and goals.
Contextual Suitability. While ML can offer superior performance in certain scenarios, it is not universally the best tool for all situations. By comparing ML with traditional methods like logistic regression or decision trees, we highlight scenarios where ML might offer significant advantages such as dealing with large and complex datasets, and where traditional methods might suffice or even excel due to their simplicity and lower operational demands.
Encouraging Robust Analytical Approaches. The comprehensive discussion also encourages the adoption of more robust analytical approaches in education settings. It fosters an understanding that choosing the right tool requires balancing various factors, including prediction accuracy, operational feasibility, and ethical considerations. I have enhanced the clarity on the following aspects;
Data Collection: Detailed the process of gathering data from institutional databases, including student demographics, academic records, and survey responses.
Feature Selection: Employed statistical methods and domain expertise to select relevant features, such as socio-economic background, psychological factors, and academic performance indicators.
Machine Learning Algorithms: Utilized Random Forests due to their robustness and ability to handle large datasets with missing values. Other algorithms considered include Support Vector Machines and Neural Networks.
Hyperparameter Optimization: Implemented grid search and cross-validation techniques to fine-tune hyperparameters, ensuring optimal model performance and avoiding overfitting.
As predictive analytics in educational settings involves collecting and analysing vast amounts of student data, including personal, academic, and socio-economic information. Ensuring the privacy of this sensitive data is paramount. Ethical issues will arise from data collection, data security, and the anonymity of the students. In addition, there may be bias present such as algorithmic bias may favour majority group over minority groups if they are not adequately balanced.
5. Conclusion
This proposed work successfully achieves its objectives, as the machine learning model not only identifies all parameters impacting student attrition but also prioritizes them based on severity, applicable in real-world scenarios. Detailed statistical analysis was employed to support these conclusions. The machine learning model utilized a logistic regression algorithm to predict student dropout risk. Key performance metrics include an accuracy rate of 85%, precision of 83%, recall of 80%, and an F1-score of 81%. These metrics indicate the model’s robust performance in distinguishing between students at risk of dropping out and those likely to persist. The Receiver Operating Characteristic (ROC) curve further validated the model’s efficacy, with an area under the curve (AUC) of 0.87, reflecting high discrimination ability between the two classes. Feature importance analysis revealed that academic performance metrics (e.g., GPA, exam scores) had the highest weights, contributing to 60% of the predictive power. Background factors (e.g., socioeconomic status, parental education) contributed 30%, while engagement metrics (e.g., attendance, participation) accounted for the remaining 10%. This aligns with the finding that academic performance is the primary driver of student attrition, contrary to the initial hypothesis that background factors would be more significant. The results underscore the pivotal role of academic performance in early dropout risk. Longitudinal studies show a critical period during the first academic year where academic challenges significantly influence dropout rates. Post this period, students tend to persist despite facing difficulties, indicating the importance of early interventions. The limitations, such as incomplete data on key parameters and the grouping of individual factors, suggest that more granular data collection and detailed categorization could enhance the model’s precision. The impact of private consultations and personalized support is highlighted as a crucial strategy to address individual challenges and improve teaching quality, thereby mitigating dropout risks. Moreover, the machine learning model’s application as a pre-emptive tool for admissions staff demonstrates practical utility. By flagging at-risk students, particularly in subjects like Mechanics and Materials, Design of Machine Elements, and Instrumentation and Control, targeted support measures can be implemented. Adjustments to course structures or the provision of additional resources could further reduce dropout rates in these critical areas. However, several challenges remain in predicting student attrition. Limited availability of data on student behaviour and academic performance can hinder effective model training. Additionally, biased data can result in skewed predictions, particularly if the training data only represents specific demographic groups. Overfitting is another concern, where models become overly complex and excel only with the specific training data, failing to generalize well to new datasets. Inaccurate student-provided data, whether intentional or inadvertent, can also distort predictions. Lastly, the lack of data diversity, confined to a single university, limits the applicability of findings beyond that specific context.
6. Future Work
Some future research opportunities regarding this topic might circulate around areas such as development of the adaptive models that can be adjusted to fit the changing data pattern over time. This would greatly enhance the model’s ability to provide accurate predictions in dynamics educational environments. Another area to consider could be to explore the advanced machine learning techniques through investigating advanced machine learning techniques such as deep learning, ensemble methods, and reinforcement learning could further improve the accuracy and robustness of predictive models. Additionally, exploring these techniques may aid in identifying more complex patterns and interactions within the data. Developing adaptive models and exploring advanced machine learning techniques in educational contexts are critical for enhancing personalized learning experiences and improving student outcomes. Adaptive models leverage real-time data to dynamically adjust learning content, catering to individual student needs and learning paces. Techniques such as deep learning, reinforcement learning, and ensemble methods provide robust frameworks for analysing complex educational data. Deep learning models, with their ability to process large datasets and capture intricate patterns, are particularly effective in predicting student performance and identifying at-risk learners. Reinforcement learning, which optimizes decision-making processes, can personalize learning pathways based on student interactions. Ensemble methods, combining multiple algorithms, enhance predictive accuracy and model robustness. By integrating these advanced techniques, educators can create more responsive and effective learning environments, ultimately supporting student success and reducing attrition rates through data-driven insights and interventions. I agreed that including socio-economic, psychological, and external factors can indeed provide a more comprehensive analysis and enhance the overall study here, however, I would like to note that obtaining this sensitive information may present challenges due to privacy concerns and data availability. Despite these difficulties, in my future work, I aim to gather and utilize this data where possible to enhance the accuracy and robustness of the predictive model. This comprehensive approach ensures a robust analysis, aligning with the study’s objectives to identify key dropout parameters and improve intervention strategies. Furthermore, in our future work, we will list parameters and expectations before expanding the results and discussion, hence our proposed paper can be enhanced by clearly defining all parameters and their expected impacts before delving into the results and discussion section. This would involve outlining the parameters, their symbols, and the anticipated effects on the model’s performance. A summary table can also be created to encapsulate this information for better clarity.
Author Contributions
Conceptualization, Resources, Methodology, Supervision, Data Curation and Investigation, C.L.K.; Methodology, Resources, Software, Supervision and Funding Acquisition, C.K.H.; Visualization, Methodology and Formal analysis, L.C.; Supervision, Resources, Funding Acquisition and Project administration, Y.Y.K.; Visualization, Methodology and Formal analysis, B.T. All authors have read and agreed to the published version of the manuscript.
Funding
This research received no external funding.
Data Availability Statement
The data presented in this study are available on request from the corresponding author. Unavailable due to privacy.
Acknowledgments
The authors would like to extend their appreciation to the University of Newcastle, Australia, for supporting the project.
Conflicts of Interest
The authors declare no conflict of interest.
References
- Chen, X. (2015). STEM attrition among high-performing college students: Scope and potential causes. Journal of Technology and Science Education, 5(1), 41-59. [CrossRef]
- Christle, C. A., Jolivette, K., & Nelson, C. M. (2007). School characteristics related to high school dropout rates. Remedial and Special education, 28(6), 325-339. [CrossRef]
- Lee, J., Lapira, E., Bagheri, B., & Kao, H. A. (2013). Recent advances and trends in predictive manufacturing systems in big data environment. Manufacturing letters, 1(1), 38-41. [CrossRef]
- Del Bonifro, F., Gabbrielli, M., Lisanti, G., & Zingaro, S. P. (2020). Student drouput prediction. In International conference on artificial intelligence in education.
- Sanders, M. (2009). STEM, STEM education, STEMmania. the technology teacher.
- Martín-Páez, T., Aguilera, D., Perales-Palacios, F. J., & Vílchez-González, J. M. (2019). What are we talking about when we talk about STEM education? A review of literature. Science Education, 103(4), 799-822. [CrossRef]
- Merrill, C., & Daugherty, J. (2009). The future of TE masters degrees: STEM.
- Zollman, A. (2012). Learning for STEM literacy: STEM literacy for learning. School Science and Mathematics, 112(1), 12-19. [CrossRef]
- Favaretto, M., De Clercq, E., Schneble, C. O., & Elger, B. S. (2020). What is your definition of Big Data? Researchers’ understanding of the phenomenon of the decade. PloS one, 15(2), e0228987. [CrossRef]
- Kitchin, R., & Lauriault, T. P. (2015). Small data in the era of big data. GeoJournal, 80(4), 463-475. [CrossRef]
- Dash, S., Shakyawar, S. K., Sharma, M., & Kaushik, S. Big data in healthcare: management, analysis and future prospects. J Big Data. 2019; 6: 54. [CrossRef]
- Wang, L., & Alexander, C. A. (2015). Big data in design and manufacturing engineering. American Journal of Engineering and Applied Sciences, 8(2), 223.
- Wu, J., Guo, S., Li, J., & Zeng, D. (2016). Big data meet green challenges: Big data toward green applications. IEEE Systems Journal, 10(3), 888-900. [CrossRef]
- El Naqa, I., & Murphy, M. J. (2015). What is machine learning? (pp. 3-11). Springer International Publishing.
- Xie, J., Yu, F. R., Huang, T., Xie, R., Liu, J., Wang, C., & Liu, Y. (2018). A survey of machine learning techniques applied to software defined networking (SDN): Research issues and challenges. IEEE Communications Surveys & Tutorials, 21(1), 393-430. [CrossRef]
- Aung, K.H.H.; Kok, C.L.; Koh, Y.Y.; Teo, T.H. An Embedded Machine Learning Fault Detection System for Electric Fan Drive. Electronics 2024, 13, 493. [CrossRef]
- Kok, C.L.; Ho, C.K.; Tan, F.K.; Koh, Y.Y. Machine Learning-Based Feature Extraction and Classification of EMG Signals for Intuitive Prosthetic Control. Appl. Sci. 2024, 14, 5784. [CrossRef]
- Chen, J.; Teo, T.H.; Kok, C.L.; Koh, Y.Y. A Novel Single-Word Speech Recognition on Embedded Systems Using a Convolution Neuron Network with Improved Out-of-Distribution Detection. Electronics 2024, 13, 530. [CrossRef]
- Kok, C.L.; Ho, C.K.; Tan, F.K.; Koh, Y.Y. Machine Learning-Based Feature Extraction and Classification of EMG Signals for Intuitive Prosthetic Control. Appl. Sci. 2024, 14, 5784. [CrossRef]
- Kok, C.L.; Ho, C.K.; Dai, Y.; Lee, T.K.; Koh, Y.Y.; Chai, J.P. A Novel and Self-Calibrating Weighing Sensor with Intelligent Peristaltic Pump Control for Real-Time Closed-Loop Infusion Monitoring in IoT-Enabled Sustainable Medical Devices. Electronics 2024, 13, 1724. [CrossRef]
- Kok, C.L.; Dai, Y.; Lee, T.K.; Koh, Y.Y.; Teo, T.H.; Chai, J.P. A Novel Low-Cost Capacitance Sensor Solution for Real-Time Bubble Monitoring in Medical Infusion Devices. Electronics 2024, 13, 1111. [CrossRef]
- Kok, C.L.; Ho, C.K.; Lee, T.K.; Loo, Z.Y.; Koh, Y.Y.; Chai, J.P. A Novel and Low-Cost Cloud-Enabled IoT Integration for Sustainable Remote Intravenous Therapy Management. Electronics 2024, 13, 1801. [CrossRef]
- C. Romero and S. Ventura, “Educational data mining: A review of the state of the art,” IEEE Transactions on Systems, Man, and Cybernetics, Part C (Applications and Reviews), vol. 40, no. 6, pp. 601-618, 2010. [CrossRef]
- G. Siemens and R. S. J. d. Baker, “Learning analytics and educational data mining: towards communication and collaboration,” in Proceedings of the 2nd International Conference on Learning Analytics and Knowledge, 2012, pp. 252-254.
- R. S. J. d. Baker and K. Yacef, “The state of educational data mining in 2009: A review and future visions,” Journal of Educational Data Mining, vol. 1, no. 1, pp. 3-17, 2009.
- R. S. J. d. Baker and G. Siemens, “Educational data mining and learning analytics,” in Cambridge Handbook of the Learning Sciences, 2nd ed., Cambridge University Press, 2014.
- A. Pardo and G. Siemens, “Ethical and privacy principles for learning analytics,” British Journal of Educational Technology, vol. 45, no. 3, pp. 438-450, 2014. [CrossRef]
- C. A. Shaffer et al., “The role of educational data mining in improving learning outcomes: A case study,” in Proceedings of the 4th International Conference on Educational Data Mining, 2011, pp. 11-20.
- H. Drachsler and W. Greller, “Privacy and analytics: it’s a DELICATE issue,” in Proceedings of the 6th International Conference on Learning Analytics & Knowledge, 2016, pp. 89-98.
- G. Siemens et al., “Open learning analytics: an integrated & modularized platform,” Proceedings of the 1st International Conference on Learning Analytics and Knowledge, 2011.
- S. K. D’Mello, “Improving student success using educational data mining techniques: Predictive modeling and intervention development,” IEEE Transactions on Learning Technologies, vol. 9, no. 2, pp. 108-114, 2016.
- C. Romero and S. Ventura, “Educational data mining: A survey from 1995 to 2005,” Expert Systems with Applications, vol. 33, no. 1, pp. 135-146, 2007. [CrossRef]
- J. A. Rice, Learning analytics: Understanding, improving, and applying insights from educational data, Taylor & Francis, 2017.
- R. Ferguson, “The state of learning analytics in 2012: A review and future challenges,” Technical Report, 2012.
- Delen, D. (2011). Predicting student attrition with data mining methods. Journal of College Student Retention: Research, Theory & Practice, 13(1), 17-35. [CrossRef]
- Barramufio, M., Meza-Narvaez, C., & Galvez-Garcia, G. (2022). Prediction of student attrition risk using machine learning. Journal of Applied Research in Higher Education, 14(3), 974-986. [CrossRef]
- Binu, V. S., Mayya, S. S., & Dhar, M. (2014). Some basic aspects of statistical methods and sample size determination in health science research. Ayu, 35(2), 119. [CrossRef]
- Hao, J., & Ho, T. K. (2019). Machine learning made easy: a review of scikit-learn package in python programming language. Journal of Educational and Behavioral Statistics, 44(3), 348-361. [CrossRef]
- L. Breiman, “Random forests,” Machine Learning, vol. 45, no. 1, pp. 5-32, 2001. [Online]. Available: https://link.springer.com/article/10.1023/A:1010933404324. [CrossRef]
- J. Brownlee, “Why Use Random Forest for Machine Learning?,” Machine Learning Mastery, 2020. [Online]. Available: https://machinelearningmastery.com/why-use-random-forest/.
- W. McKinney, “Python for Data Analysis: Data Wrangling with Pandas, NumPy, and IPython,” 2nd ed., O’Reilly Media, 201.
|
Disclaimer/Publisher’s Note: The statements, opinions and data contained in all publications are solely those of the individual author(s) and contributor(s) and not of MDPI and/or the editor(s). MDPI and/or the editor(s) disclaim responsibility for any injury to people or property resulting from any ideas, methods, instructions or products referred to in the content. |
© 2024 by the authors. Licensee MDPI, Basel, Switzerland. This article is an open access article distributed under the terms and conditions of the Creative Commons Attribution (CC BY) license (http://creativecommons.org/licenses/by/4.0/).
