Submitted:
18 August 2024
Posted:
19 August 2024
You are already at the latest version
Abstract
Keywords:
1. Introduction
2. Materials and Methods
2.1. Bacterial Strains and Growth Conditions
2.2. Cell Culture
2.3. Intracellular Infection Model
2.4. RNA Extraction and cDNA Library Construction
2.5. RNA- Seq Data Analysis
2.6. Reads Alignment and Differential Expression Analysis of RNA-Seq
2.7. Analysis of the Alternative Splicing Prediction
2.8. Prediction of Target Gene of lncRNA
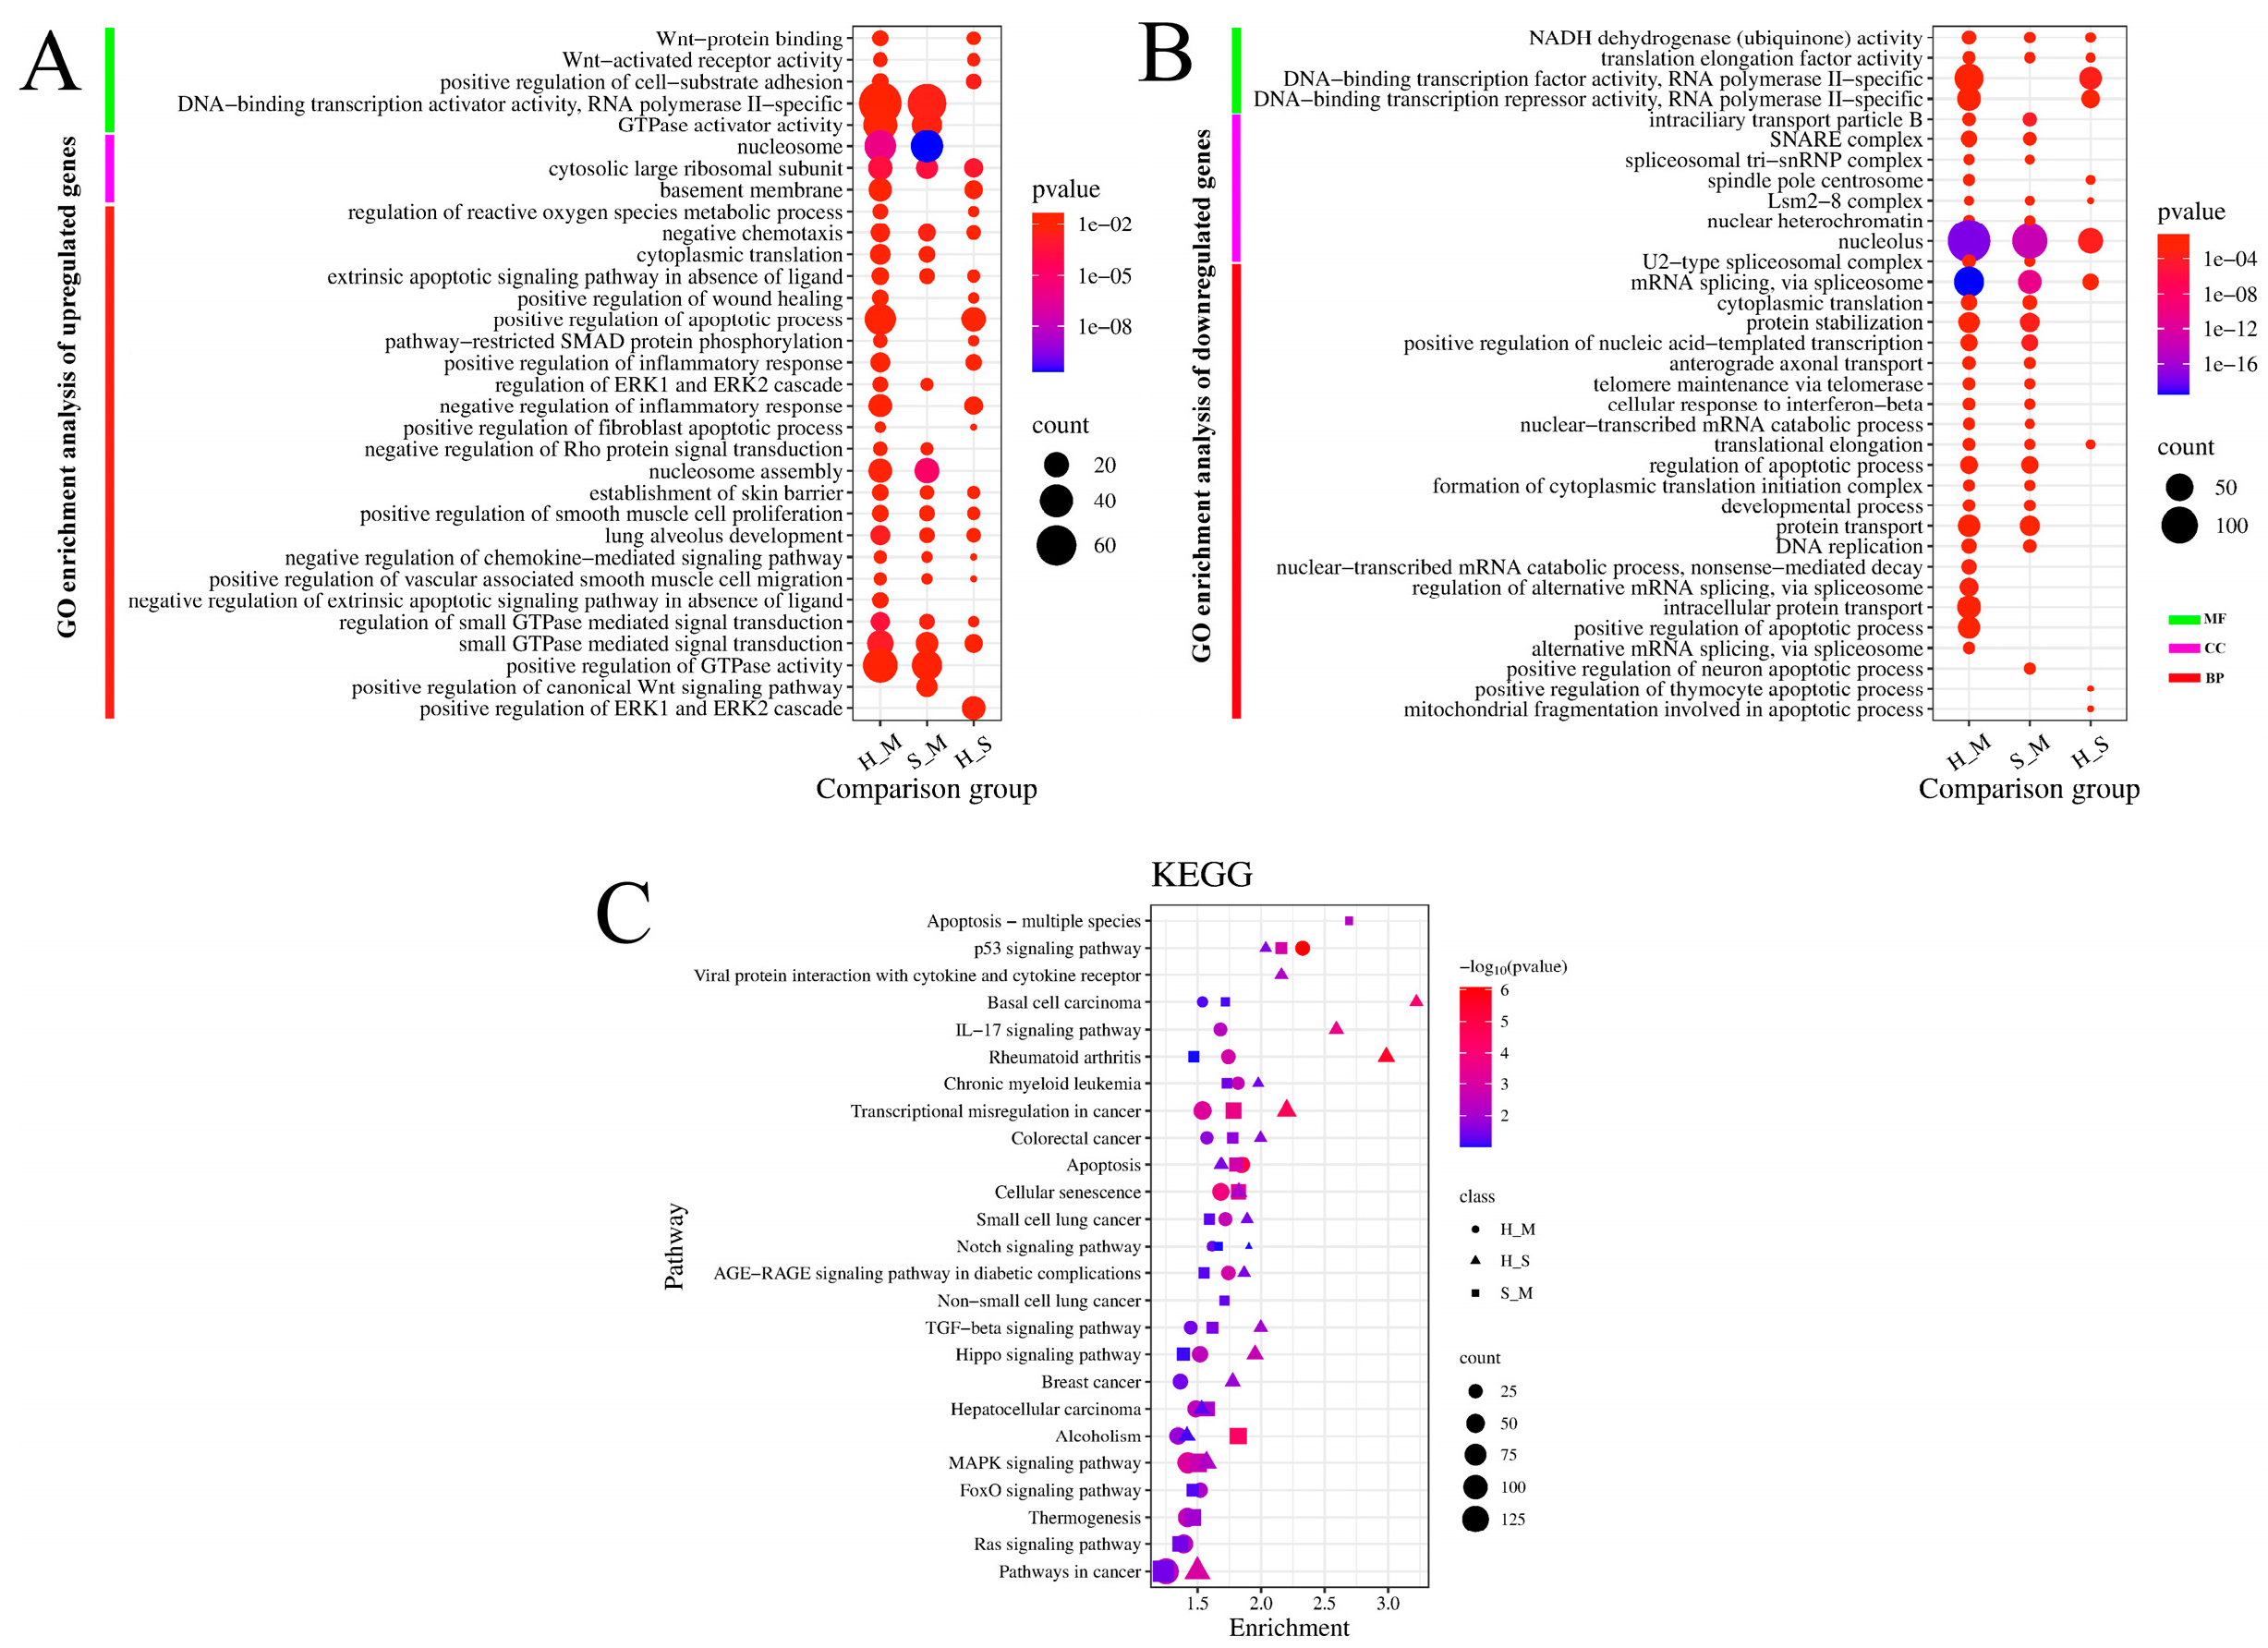
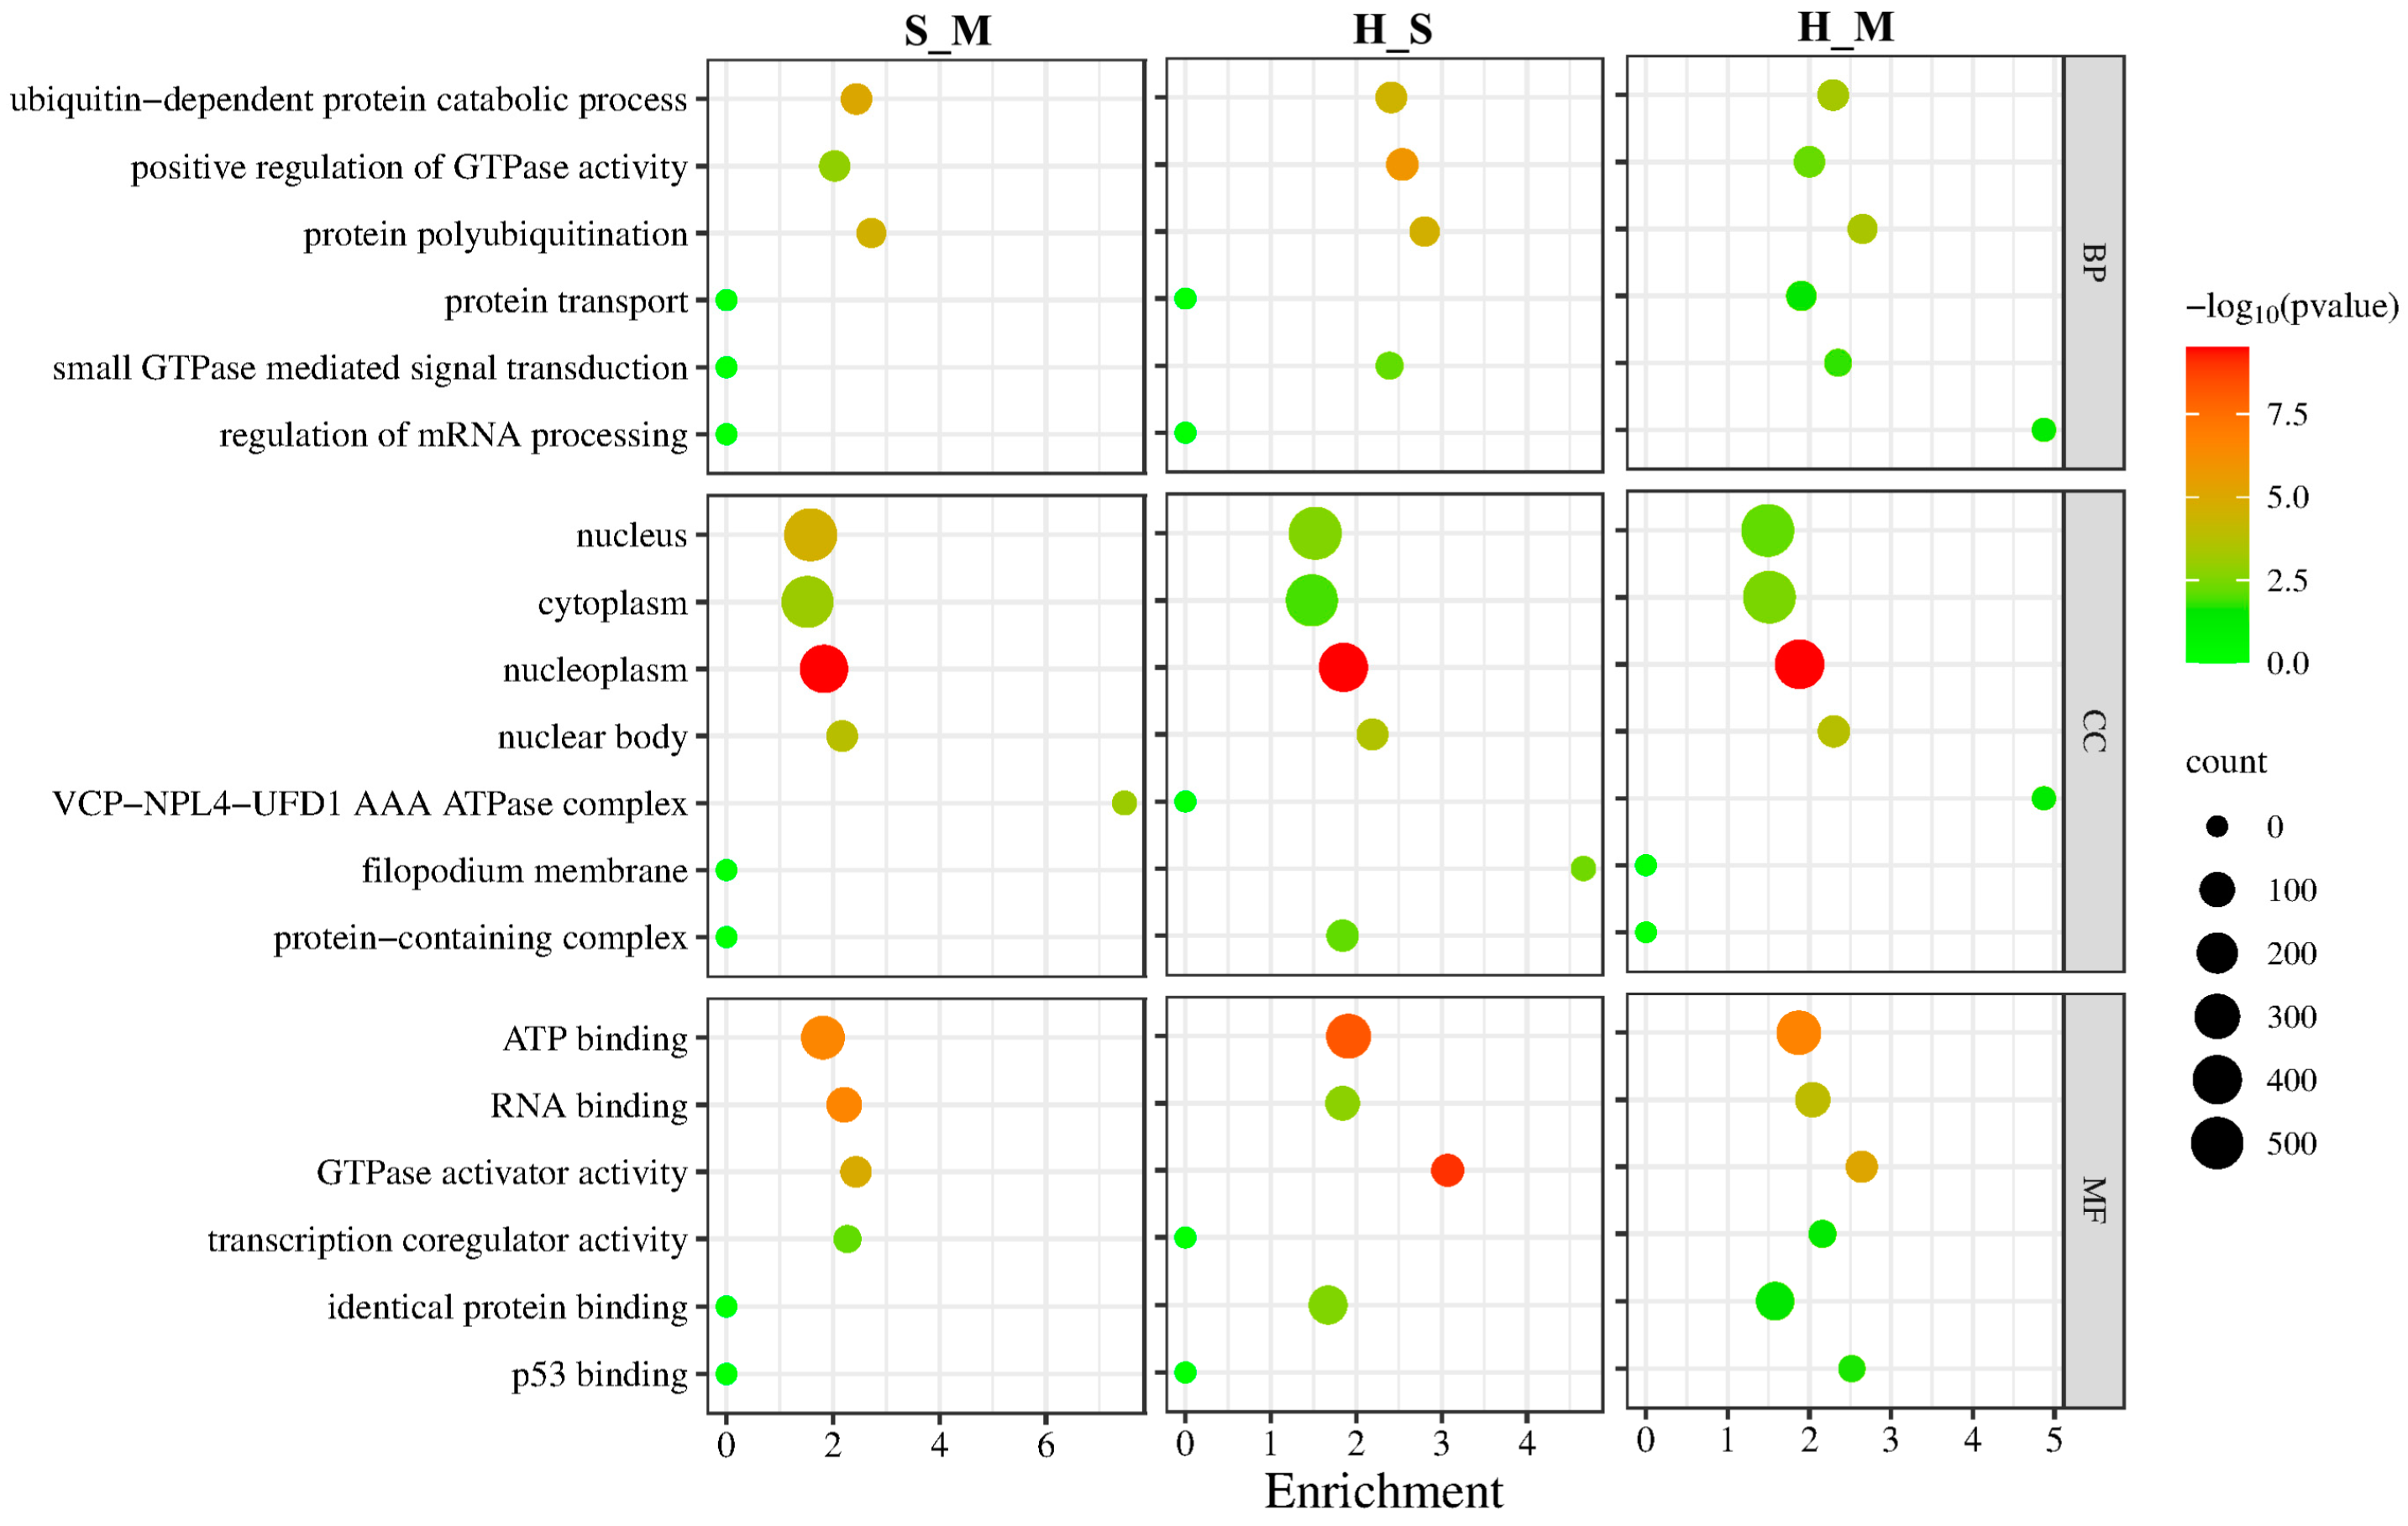
2.9. GO and KEGG Pathway Analysis of DEmRNAs and Target Genes of DElncRNAs
2.10. Differential Gene Co-Expression Analysis
3. Results
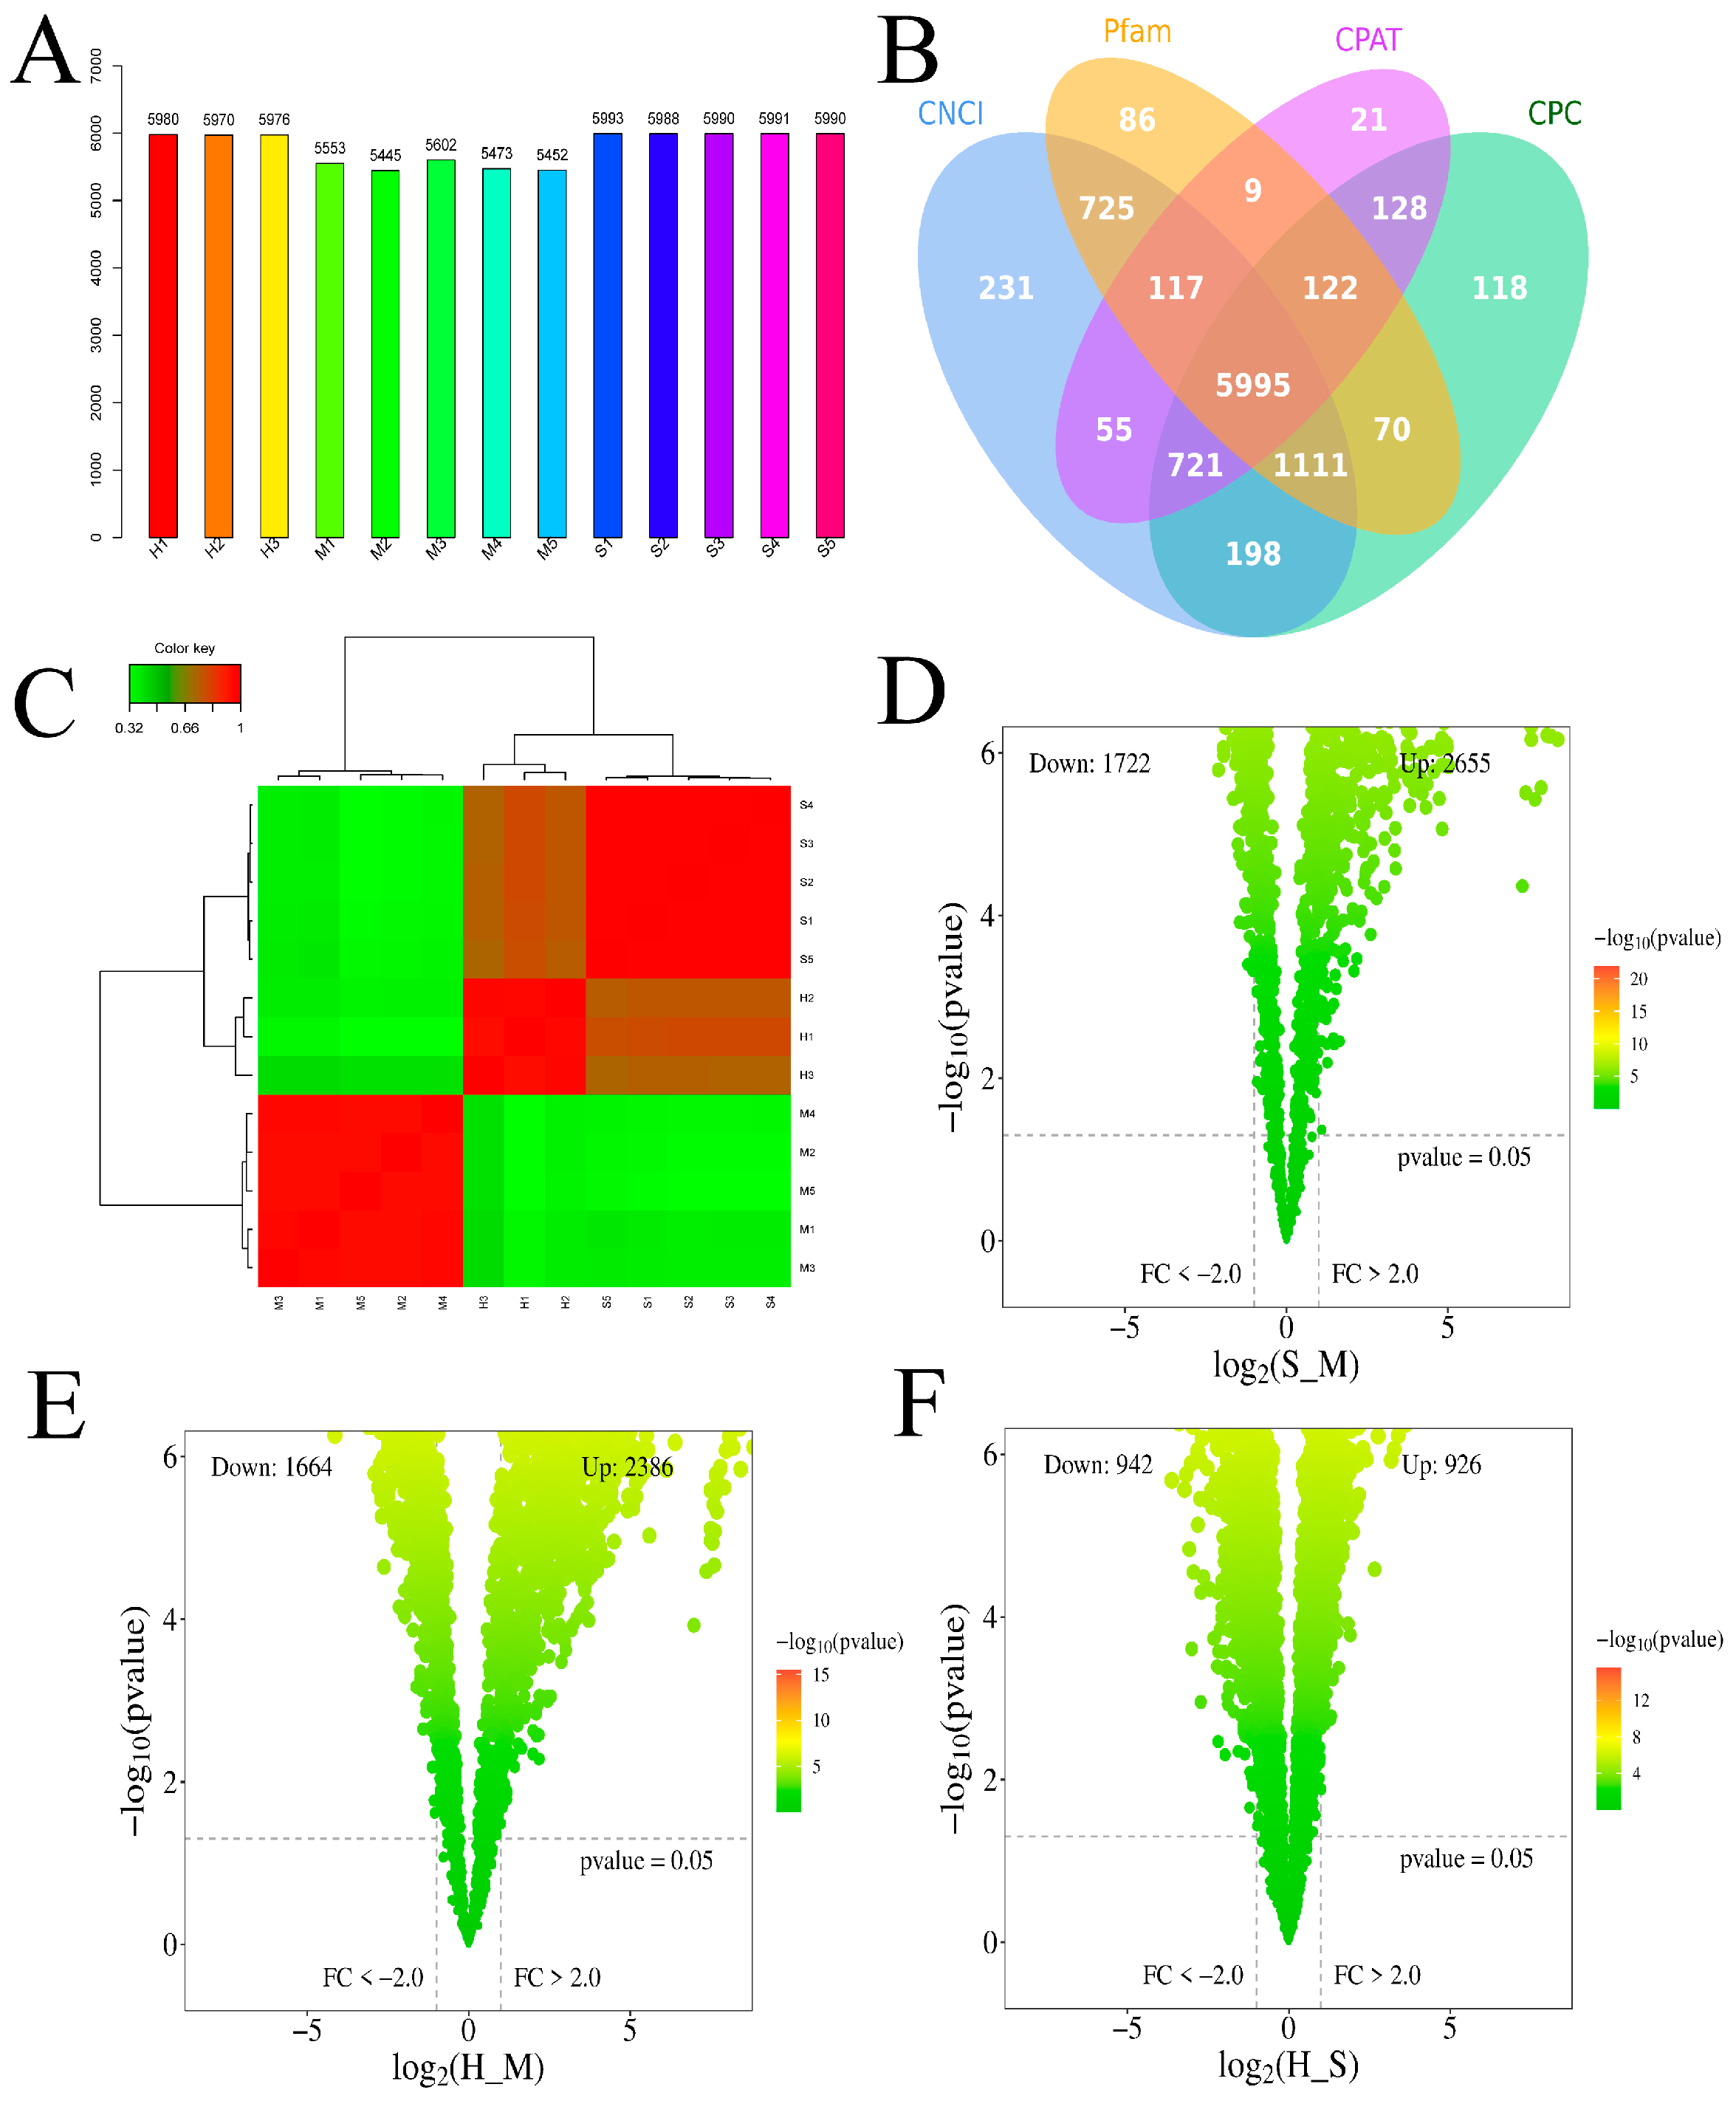
3.1. Transcriptome Assembly Profiles Evaluation
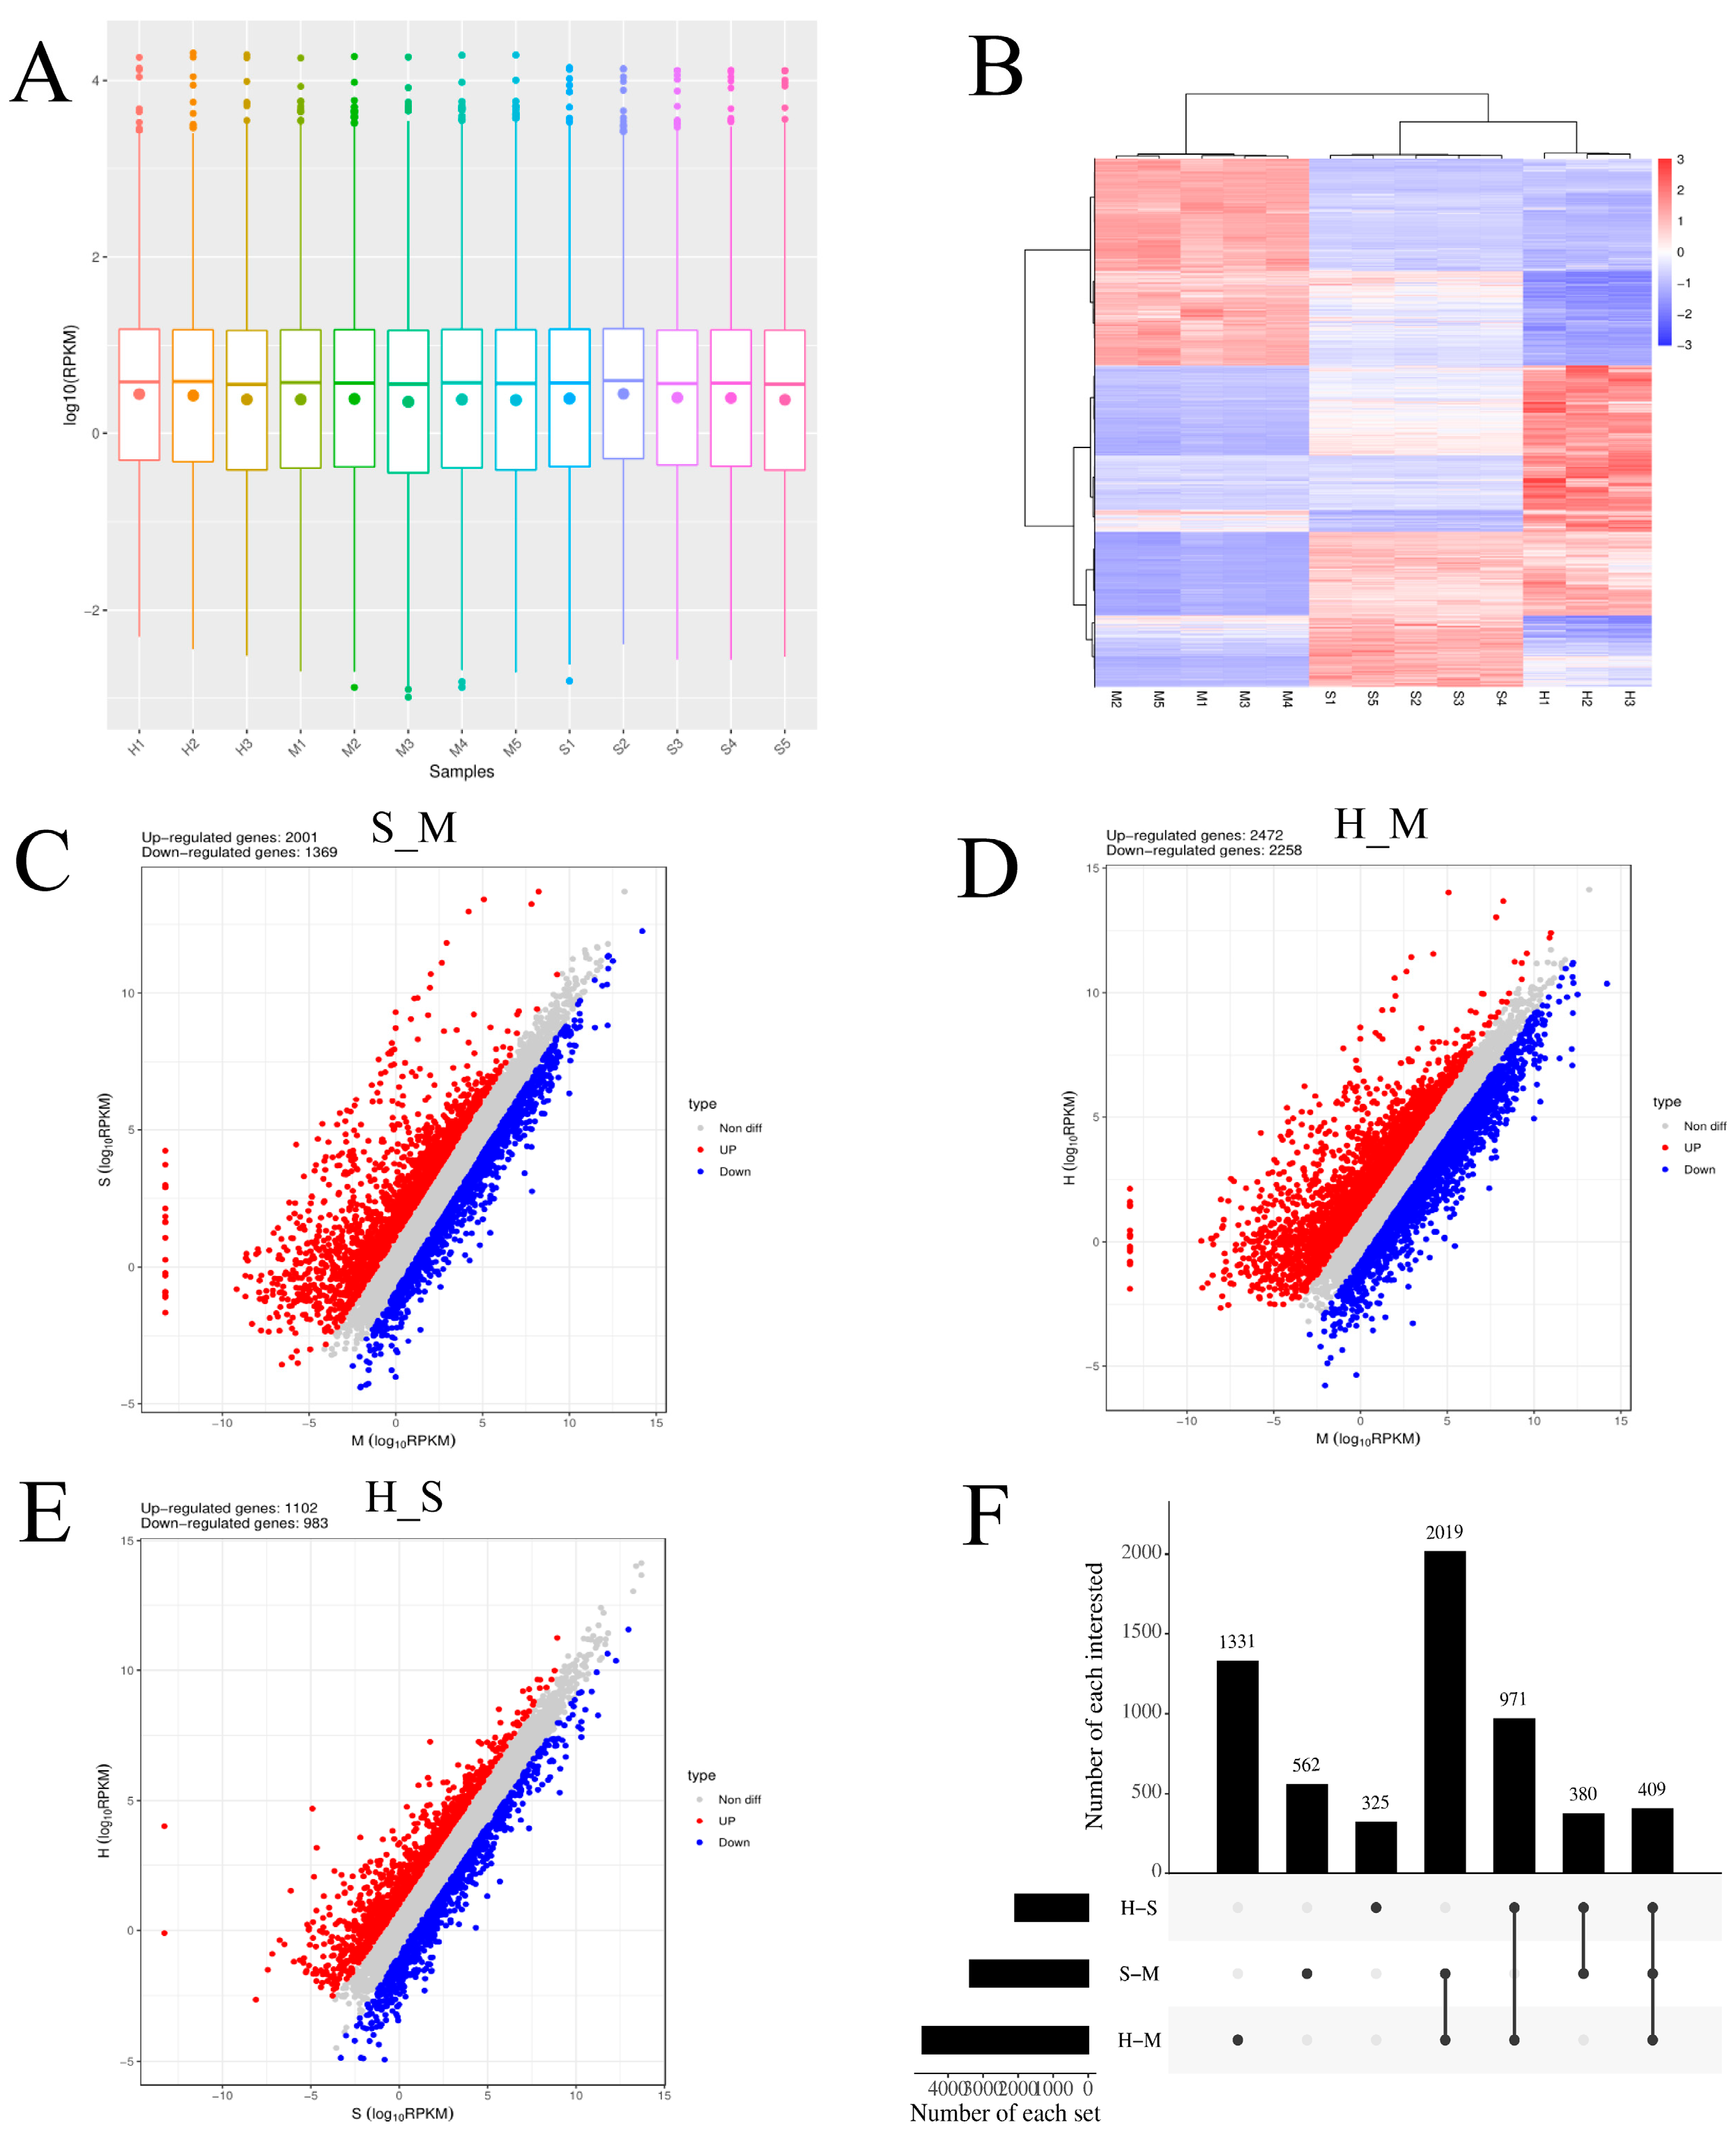
3.2. Analysis of Differentially Expressed mRNAs
3.3. Analysis of Host mRNA Alternative Splicing
3.4. Analysis of Differentially Expressed lncRNA
3.5. Analysis of pDEmRNAs of Pathogens
3.6. Gene Co-Expression Analysis Interaction Network
3.7. The Expression Level of Candidate Genes
4. Discussion
5. Conclusions
Supplementary Materials
Author Contributions
Funding
Institutional Review Board Statement
Informed Consent Statement
Data Availability Statement
Acknowledgments
Conflicts of Interest
References
- Ouamba, A.J.K.; Gagnon, M.; LaPointe, G.; Chouinard, P.Y.; Roy, D. Graduate Student Literature Review: Farm management practices: Potential microbial sources that determine the microbiota of raw bovine milk. Journal of dairy science 2022, 105, 7276–7287. [Google Scholar] [CrossRef] [PubMed]
- Kurban, D.; Roy, J.P.; Kabera, F.; Fréchette, A.; Um, M.M.; Albaaj, A.; Rowe, S.; Godden, S.; Adkins, P.R.F.; Middleton, J.R.; et al. Diagnosing Intramammary Infection: Meta-Analysis and Mapping Review on Frequency and Udder Health Relevance of Microorganism Species Isolated from Bovine Milk Samples. Animals : an open access journal from MDPI 2022, 12, 3288. [Google Scholar] [CrossRef]
- Wang, Y.; Nan, X.; Zhao, Y.; Jiang, L.; Wang, H.; Zhang, F.; Hua, D.; Liu, J.; Yao, J.; Yang, L.; et al. Dietary Supplementation of Inulin Ameliorates Subclinical Mastitis via Regulation of Rumen Microbial Community and Metabolites in Dairy Cows. Microbiology spectrum 2021, 9, e0010521. [Google Scholar] [CrossRef]
- Hoekstra, J.; Zomer, A.L.; Rutten, V.; Benedictus, L.; Stegeman, A.; Spaninks, M.P.; Bennedsgaard, T.W.; Biggs, A.; De Vliegher, S.; Mateo, D.H.; et al. Genomic analysis of European bovine Staphylococcus aureus from clinical versus subclinical mastitis. Scientific reports 2020, 10, 18172. [Google Scholar] [CrossRef]
- Khan, M.Z.; Wang, J.; Ma, Y.; Chen, T.; Ma, M.; Ullah, Q.; Khan, I.M.; Khan, A.; Cao, Z.; Liu, S. Genetic polymorphisms in immune- and inflammation-associated genes and their association with bovine mastitis resistance/susceptibility. Frontiers in immunology 2023, 14, 1082144. [Google Scholar] [CrossRef] [PubMed]
- Kan, X.; Hu, G.; Liu, Y.; Xu, P.; Huang, Y.; Cai, X.; Guo, W.; Fu, S.; Liu, J. Mammary Fibrosis Tendency and Mitochondrial Adaptability in Dairy Cows with Mastitis. Metabolites 2022, 12, 1035. [Google Scholar] [CrossRef] [PubMed]
- Li, N.; Richoux, R.; Boutinaud, M.; Martin, P.; Gagnaire, V. Role of somatic cells on dairy processes and products: a review. Dairy science & technology 2014, 94, 517–538. [Google Scholar] [CrossRef]
- Krishnamoorthy, P.; Suresh, K.P.; Jayamma, K.S.; Shome, B.R.; Patil, S.S.; Amachawadi, R.G. An Understanding of the Global Status of Major Bacterial Pathogens of Milk Concerning Bovine Mastitis: A Systematic Review and Meta-Analysis (Scientometrics). Pathogens (Basel, Switzerland) 2021, 10, 545. [Google Scholar] [CrossRef]
- Abd El-Razik, K.A.E.; Arafa, A.A.; Fouad, E.A.; Younes, A.M.; Almuzaini, A.M.; Abdou, A.M. Isolation, identification and virulence determinants of Streptococcus agalactiae from bovine subclinical mastitis in Egypt. Journal of infection in developing countries 2021, 15, 1133–1138. [Google Scholar] [CrossRef]
- Lakew, B.T.; Fayera, T.; Ali, Y.M. Risk factors for bovine mastitis with the isolation and identification of Streptococcus agalactiae from farms in and around Haramaya district, eastern Ethiopia. Tropical animal health and production 2019, 51, 1507–1513. [Google Scholar] [CrossRef]
- Lin, L.; Huang, X.; Yang, H.; He, Y.; He, X.; Huang, J.; Li, S.; Wang, X.; Tang, S.; Liu, G.; et al. Molecular epidemiology, antimicrobial activity, and virulence gene clustering of Streptococcus agalactiae isolated from dairy cattle with mastitis in China. J Dairy Sci 2021, 104, 4893–4903. [Google Scholar] [CrossRef] [PubMed]
- Kabelitz, T.; Aubry, E.; van Vorst, K.; Amon, T.; Fulde, M. The Role of Streptococcus spp. in Bovine Mastitis. Microorganisms 2021, 9, 1497. [Google Scholar] [CrossRef]
- Yang, F.; Yuan, L.; Xiang, M.; Jiang, Q.; Zhang, M.; Chen, F.; Tong, J.; Huang, J.; Cai, Y. A Novel TLR4-SYK Interaction Axis Plays an Essential Role in the Innate Immunity Response in Bovine Mammary Epithelial Cells. Biomedicines 2022, 11, 97. [Google Scholar] [CrossRef] [PubMed]
- Zhang, H.; Jiang, H.; Fan, Y.; Chen, Z.; Li, M.; Mao, Y.; Karrow, N.A.; Loor, J.J.; Moore, S.; Yang, Z. Transcriptomics and iTRAQ-Proteomics Analyses of Bovine Mammary Tissue with Streptococcus agalactiae-Induced Mastitis. Journal of agricultural and food chemistry 2018, 66, 11188–11196. [Google Scholar] [CrossRef] [PubMed]
- Tong, J.; Sun, M.; Zhang, H.; Yang, D.; Zhang, Y.; Xiong, B.; Jiang, L. Proteomic analysis of bovine mammary epithelial cells after in vitro incubation with S. agalactiae: potential biomarkers. Veterinary research 2020, 51, 98. [Google Scholar] [CrossRef]
- Tong, J.; Ji, X.; Zhang, H.; Xiong, B.; Cui, D.; Jiang, L. The Analysis of the Ubiquitylomic Responses to Streptococcus agalactiae Infection in Bovine Mammary Gland Epithelial Cells. Journal of inflammation research 2022, 15, 4331–4343. [Google Scholar] [CrossRef]
- Sbardella, A.P.; Weller, M.; Fonseca, I.; Stafuzza, N.B.; Bernardes, P.A.; FF, E.S.; da Silva, M.; Martins, M.F.; Munari, D.P. RNA sequencing differential gene expression analysis of isolated perfused bovine udders experimentally inoculated with Streptococcus agalactiae. Journal of dairy science 2019, 102, 1761–1767. [Google Scholar] [CrossRef]
- Weller, M.; Fonseca, I.; Sbardella, A.P.; Pinto, I.S.B.; Viccini, L.F.; Brandão, H.M.; Gern, J.C.; Carvalho, W.A.; Guimarães, A.S.; Brito, M.; et al. Isolated perfused udder model for transcriptome analysis in response to Streptococcus agalactiae. The Journal of dairy research 2019, 86, 307–314. [Google Scholar] [CrossRef]
- Richards, V.P.; Choi, S.C.; Pavinski Bitar, P.D.; Gurjar, A.A.; Stanhope, M.J. Transcriptomic and genomic evidence for Streptococcus agalactiae adaptation to the bovine environment. BMC genomics 2013, 14, 920. [Google Scholar] [CrossRef]
- Pu, J.; Li, R.; Zhang, C.; Chen, D.; Liao, X.; Zhu, Y.; Geng, X.; Ji, D.; Mao, Y.; Gong, Y.; et al. Expression profiles of miRNAs from bovine mammary glands in response to Streptococcus agalactiae-induced mastitis. The Journal of dairy research 2017, 84, 300–308. [Google Scholar] [CrossRef] [PubMed]
- Westermann, A.J.; Barquist, L.; Vogel, J. Resolving host-pathogen interactions by dual RNA-seq. PLoS pathogens 2017, 13, e1006033. [Google Scholar] [CrossRef]
- Park, J.W.; Tokheim, C.; Shen, S.; Xing, Y. Identifying differential alternative splicing events from RNA sequencing data using RNASeq-MATS. Methods in molecular biology (Clifton, N.J.) 2013, 1038, 171–179. [Google Scholar] [CrossRef] [PubMed]
- Kang, Y.J.; Yang, D.C.; Kong, L.; Hou, M.; Meng, Y.Q.; Wei, L.; Gao, G. CPC2: a fast and accurate coding potential calculator based on sequence intrinsic features. Nucleic acids research 2017, 45, W12–w16. [Google Scholar] [CrossRef] [PubMed]
- Wang, L.; Park, H.J.; Dasari, S.; Wang, S.; Kocher, J.P.; Li, W. CPAT: Coding-Potential Assessment Tool using an alignment-free logistic regression model. Nucleic acids research 2013, 41, e74. [Google Scholar] [CrossRef] [PubMed]
- Sun, L.; Luo, H.; Bu, D.; Zhao, G.; Yu, K.; Zhang, C.; Liu, Y.; Chen, R.; Zhao, Y. Utilizing sequence intrinsic composition to classify protein-coding and long non-coding transcripts. Nucleic acids research 2013, 41, e166. [Google Scholar] [CrossRef] [PubMed]
- Mistry, J.; Chuguransky, S.; Williams, L.; Qureshi, M.; Salazar, G.A.; Sonnhammer, E.L.L.; Tosatto, S.C.E.; Paladin, L.; Raj, S.; Richardson, L.J.; et al. Pfam: The protein families database in 2021. Nucleic acids research 2021, 49, D412–d419. [Google Scholar] [CrossRef] [PubMed]
- Tang, D.; Chen, M.; Huang, X.; Zhang, G.; Zeng, L.; Zhang, G.; Wu, S.; Wang, Y. SRplot: A free online platform for data visualization and graphing. PloS one 2023, 18, e0294236. [Google Scholar] [CrossRef]
- Kabelitz, T.; Aubry, E.; van Vorst, K.; Amon, T.; Fulde, M. The Role of Streptococcus spp. in Bovine Mastitis. Microorganisms 2021, 9. [Google Scholar] [CrossRef]
- Dipankar, P.; Kumar, P.; Dash, S.P.; Sarangi, P.P. Functional and Therapeutic Relevance of Rho GTPases in Innate Immune Cell Migration and Function during Inflammation: An In Silico Perspective. Mediators of inflammation 2021, 2021, 6655412. [Google Scholar] [CrossRef]
- Pan, J.S.; Hong, M.Z.; Ren, J.L. Reactive oxygen species: a double-edged sword in oncogenesis. World journal of gastroenterology 2009, 15, 1702–1707. [Google Scholar] [CrossRef]
- Hirata, Y. [Reactive Oxygen Species (ROS) Signaling: Regulatory Mechanisms and Pathophysiological Roles]. Yakugaku zasshi : Journal of the Pharmaceutical Society of Japan 2019, 139, 1235–1241. [Google Scholar] [CrossRef] [PubMed]
- Oliveira, J.S.S.; Santos, G.D.S.; Moraes, J.A.; Saliba, A.M.; Barja-Fidalgo, T.C.; Mattos-Guaraldi, A.L.; Nagao, P.E. Reactive oxygen species generation mediated by NADPH oxidase and PI3K/Akt pathways contribute to invasion of Streptococcus agalactiae in human endothelial cells. Memorias do Instituto Oswaldo Cruz 2018, 113, e140421. [Google Scholar] [CrossRef]
- Hussen, J. Bacterial species-specific modulatory effects on phenotype and function of camel blood leukocytes. BMC veterinary research 2021, 17, 241. [Google Scholar] [CrossRef]
- Ma, F.; Yang, S.; Zhou, M.; Lu, Y.; Deng, B.; Zhang, J.; Fan, H.; Wang, G. NADPH oxidase-derived reactive oxygen species production activates the ERK1/2 pathway in neutrophil extracellular traps formation by Streptococcus agalactiae isolated from clinical mastitis bovine. Veterinary microbiology 2022, 268, 109427. [Google Scholar] [CrossRef]
- Wei, C.D.; Li, Y.; Zheng, H.Y.; Tong, Y.Q.; Dai, W. Palmitate induces H9c2 cell apoptosis by increasing reactive oxygen species generation and activation of the ERK1/2 signaling pathway. Molecular medicine reports 2013, 7, 855–861. [Google Scholar] [CrossRef]
- Geng, N.; Liu, K.; Lu, J.; Xu, Y.; Wang, X.; Wang, R.; Liu, J.; Liu, Y.; Han, B. Autophagy of bovine mammary epithelial cell induced by intracellular Staphylococcus aureus. Journal of microbiology (Seoul, Korea) 2020, 58, 320–329. [Google Scholar] [CrossRef] [PubMed]
- Wang, D.; Liu, L.; Augustino, S.M.A.; Duan, T.; Hall, T.J.; MacHugh, D.E.; Dou, J.; Zhang, Y.; Wang, Y.; Yu, Y. Identification of novel molecular markers of mastitis caused by Staphylococcus aureus using gene expression profiling in two consecutive generations of Chinese Holstein dairy cattle. Journal of animal science and biotechnology 2020, 11, 98. [Google Scholar] [CrossRef]
- Liu, J.; Gao, Y.; Zhang, X.; Hao, Z.; Zhang, H.; Gui, R.; Liu, F.; Tong, C.; Wang, X. Transcriptome sequencing analysis of bovine mammary epithelial cells induced by lipopolysaccharide. Animal biotechnology 2024, 35, 2290527. [Google Scholar] [CrossRef]
- Chen, Y.; Jing, H.; Chen, M.; Liang, W.; Yang, J.; Deng, G.; Guo, M. Transcriptional Profiling of Exosomes Derived from Staphylococcus aureus-Infected Bovine Mammary Epithelial Cell Line MAC-T by RNA-Seq Analysis. Oxidative medicine and cellular longevity 2021, 2021, 8460355. [Google Scholar] [CrossRef]
- Hernández Borrero, L.J.; El-Deiry, W.S. Tumor suppressor p53: Biology, signaling pathways, and therapeutic targeting. Biochimica et biophysica acta. Reviews on cancer 2021, 1876, 188556. [Google Scholar] [CrossRef]
- Asl, E.R.; Amini, M.; Najafi, S.; Mansoori, B.; Mokhtarzadeh, A.; Mohammadi, A.; Lotfinejad, P.; Bagheri, M.; Shirjang, S.; Lotfi, Z.; et al. Interplay between MAPK/ERK signaling pathway and MicroRNAs: A crucial mechanism regulating cancer cell metabolism and tumor progression. Life sciences 2021, 278, 119499. [Google Scholar] [CrossRef]
- Ząbek, T.; Semik-Gurgul, E.; Ropka-Molik, K.; Szmatoła, T.; Kawecka-Grochocka, E.; Zalewska, M.; Kościuczuk, E.; Wnuk, M.; Bagnicka, E. Short communication: Locus-specific interrelations between gene expression and DNA methylation patterns in bovine mammary gland infected by coagulase-positive and coagulase-negative staphylococci. Journal of dairy science 2020, 103, 10689–10695. [Google Scholar] [CrossRef]
- Di, H.S.; Wang, L.G.; Wang, G.L.; Zhou, L.; Yang, Y.Y. The Signaling Mechanism of TGF-β1 Induced Bovine Mammary Epithelial Cell Apoptosis. Asian-Australasian journal of animal sciences 2012, 25, 304–310. [Google Scholar] [CrossRef] [PubMed]
- Zhao, S.; Gao, Y.; Xia, X.; Che, Y.; Wang, Y.; Liu, H.; Sun, Y.; Ren, W.; Han, W.; Yang, J.; et al. TGF-β1 promotes Staphylococcus aureus adhesion to and invasion into bovine mammary fibroblasts via the ERK pathway. Microbial pathogenesis 2017, 106, 25–29. [Google Scholar] [CrossRef]
- Clements, R.T.; Minnear, F.L.; Singer, H.A.; Keller, R.S.; Vincent, P.A. RhoA and Rho-kinase dependent and independent signals mediate TGF-beta-induced pulmonary endothelial cytoskeletal reorganization and permeability. American journal of physiology. Lung cellular and molecular physiology 2005, 288, L294–306. [Google Scholar] [CrossRef] [PubMed]
- Park, J.E.; Ryoo, G.; Lee, W. Alternative Splicing: Expanding Diversity in Major ABC and SLC Drug Transporters. The AAPS journal 2017, 19, 1643–1655. [Google Scholar] [CrossRef] [PubMed]
- Dockterman, J.; Coers, J. How did we get here? Insights into mechanisms of immunity-related GTPase targeting to intracellular pathogens. Current opinion in microbiology 2022, 69, 102189. [Google Scholar] [CrossRef]
- Haldar, A.K.; Piro, A.S.; Finethy, R.; Espenschied, S.T.; Brown, H.E.; Giebel, A.M.; Frickel, E.M.; Nelson, D.E.; Coers, J. Chlamydia trachomatis Is Resistant to Inclusion Ubiquitination and Associated Host Defense in Gamma Interferon-Primed Human Epithelial Cells. mBio 2016, 7. [Google Scholar] [CrossRef]
- Rose, J.T.; Moskovitz, E.; Boyd, J.R.; Gordon, J.A.; Bouffard, N.A.; Fritz, A.J.; Illendula, A.; Bushweller, J.H.; Lian, J.B.; Stein, J.L.; et al. Inhibition of the RUNX1-CBFβ transcription factor complex compromises mammary epithelial cell identity: a phenotype potentially stabilized by mitotic gene bookmarking. Oncotarget 2020, 11, 2512–2530. [Google Scholar] [CrossRef] [PubMed]
- Ariffin, N.S. RUNX1 as a Novel Molecular Target for Breast Cancer. Clinical breast cancer 2022, 22, 499–506. [Google Scholar] [CrossRef] [PubMed]
- Sionov, R.V.; Vlahopoulos, S.A.; Granot, Z. Regulation of Bim in Health and Disease. Oncotarget 2015, 6, 23058–23134. [Google Scholar] [CrossRef]
- Luo, S.; Rubinsztein, D.C. BCL2L11/BIM: a novel molecular link between autophagy and apoptosis. Autophagy 2013, 9, 104–105. [Google Scholar] [CrossRef] [PubMed]
- Lam, S.D.; Babu, M.M.; Lees, J.; Orengo, C.A. Biological impact of mutually exclusive exon switching. PLoS computational biology 2021, 17, e1008708. [Google Scholar] [CrossRef]
- Qiu, Y.; Chan, S.T.; Lin, L.; Shek, T.L.; Tsang, T.F.; Zhang, Y.; Ip, M.; Chan, P.K.; Blanchard, N.; Hanquet, G.; et al. Nusbiarylins, a new class of antimicrobial agents: Rational design of bacterial transcription inhibitors targeting the interaction between the NusB and NusE proteins. Bioorganic chemistry 2019, 92, 103203. [Google Scholar] [CrossRef]
- Sherman, M.W.; Sandeep, S.; Contreras, L.M. The Tryptophan-Induced tnaC Ribosome Stalling Sequence Exposes High Amino Acid Cross-Talk That Can Be Mitigated by Removal of NusB for Higher Orthogonality. ACS synthetic biology 2021, 10, 1024–1038. [Google Scholar] [CrossRef] [PubMed]
- Teplova, M.; Tereshko, V.; Sanishvili, R.; Joachimiak, A.; Bushueva, T.; Anderson, W.F.; Egli, M. The structure of the yrdC gene product from Escherichia coli reveals a new fold and suggests a role in RNA binding. Protein science : a publication of the Protein Society 2000, 9, 2557–2566. [Google Scholar] [CrossRef] [PubMed]
- Fu, T.M.; Liu, X.; Li, L.; Su, X.D. The structure of the hypothetical protein smu.1377c from Streptococcus mutans suggests a role in tRNA modification. Acta crystallographica. Section F, Structural biology and crystallization communications 2010, 66, 771–775. [Google Scholar] [CrossRef]
- Barkan, A.; Klipcan, L.; Ostersetzer, O.; Kawamura, T.; Asakura, Y.; Watkins, K.P. The CRM domain: an RNA binding module derived from an ancient ribosome-associated protein. RNA (New York, N.Y.) 2007, 13, 55–64. [Google Scholar] [CrossRef]
- Pediconi, D.; Spurio, R.; LaTeana, A.; Jemiolo, D.; Gualerzi, C.O.; Pon, C.L. Translational regulation of infC operon in Bacillus stearothermophilus. Biochemistry and cell biology = Biochimie et biologie cellulaire 1995, 73, 1071–1078. [Google Scholar] [CrossRef]
- Xiao, Y.; Wu, L.; He, L.; Tang, Y.; Guo, S.; Zhai, S. Transcriptomic analysis using dual RNA sequencing revealed a Pathogen-Host interaction after Edwardsiella anguillarum infection in European eel (Anguilla anguilla). Fish & shellfish immunology 2022, 120, 745–757. [Google Scholar] [CrossRef]
- Kurita, D.; Abo, T.; Himeno, H. Molecular determinants of release factor 2 for ArfA-mediated ribosome rescue. The Journal of biological chemistry 2020, 295, 13326–13337. [Google Scholar] [CrossRef] [PubMed]
- Han, K.Y.; Song, J.A.; Ahn, K.Y.; Park, J.S.; Seo, H.S.; Lee, J. Enhanced solubility of heterologous proteins by fusion expression using stress-induced Escherichia coli protein, Tsf. FEMS microbiology letters 2007, 274, 132–138. [Google Scholar] [CrossRef] [PubMed]
- Che, R.X.; Xing, X.X.; Liu, X.; Qu, Q.W.; Chen, M.; Yu, F.; Ma, J.X.; Chen, X.R.; Zhou, Y.H.; God'Spower, B.O.; et al. Analysis of multidrug resistance in Streptococcus suis ATCC 700794 under tylosin stress. Virulence 2019, 10, 58–67. [Google Scholar] [CrossRef]
- Kasthuri, T.; Barath, S.; Nandhakumar, M.; Karutha Pandian, S. Proteomic profiling spotlights the molecular targets and the impact of the natural antivirulent umbelliferone on stress response, virulence factors, and the quorum sensing network of Pseudomonas aeruginosa. Frontiers in cellular and infection microbiology 2022, 12, 998540. [Google Scholar] [CrossRef]
- Wen, Y.; Chen, H.; Luo, F.; Zhou, H.; Li, Z. Roles of long noncoding RNAs in bacterial infection. Life sciences 2020, 263, 118579. [Google Scholar] [CrossRef] [PubMed]
- Romero-Barrios, N.; Legascue, M.F.; Benhamed, M.; Ariel, F.; Crespi, M. Splicing regulation by long noncoding RNAs. Nucleic acids research 2018, 46, 2169–2184. [Google Scholar] [CrossRef] [PubMed]
- Schmerer, N.; Schulte, L.N. Long noncoding RNAs in bacterial infection. Wiley interdisciplinary reviews. RNA 2021, 12, e1664. [Google Scholar] [CrossRef] [PubMed]


| Sample | Group | Total raw reads | Total clean reads | Total clean base (G) | Effective Rate (%) | Reads with UIDs | Dedup Reads |
|---|---|---|---|---|---|---|---|
| M1 | Control (M Group) |
81298832 | 70041960 | 10.38 | 86.15 | 64794252(92.51%) | 61112168(87.25%) |
| M2 | 80917920 | 70388474 | 10.46 | 86.99 | 65098992(92.49%) | 60322418(85.70%) | |
| M3 | 92091998 | 79660982 | 11.81 | 86.5 | 73798986(92.64%) | 69202752(86.87%) | |
| M4 | 82288064 | 70524828 | 10.46 | 85.7 | 65226928(92.49%) | 61014132(86.51%) | |
| M5 | 91369374 | 79413762 | 11.81 | 86.92 | 73703106(92.81%) | 67255788(84.69%) | |
| S1 | Treat1 (S Group) |
102946650 | 92613194 | 13.63 | 89.96 | 86948336(93.88%) | 79863190(86.23%) |
| S2 | 71198348 | 63027196 | 9.25 | 88.52 | 59120464(93.80%) | 56144004(89.08%) | |
| S3 | 86815548 | 76934788 | 11.25 | 88.62 | 72256950(93.92%) | 68365948(88.86%) | |
| S4 | 92741594 | 82904518 | 12.12 | 89.39 | 77832968(93.88%) | 73052626(88.12%) | |
| S5 | 104732530 | 93522804 | 13.67 | 89.3 | 87853102(93.94%) | 82741910(88.47%) | |
| H1 | Treat2 (H Group) |
60552640 | 43447378 | 6.3 | 72.94 | 41488876(95.49%) | 40567390(93.37%) |
| H2 | 72552826 | 51713480 | 7.61 | 71.28 | 49400638(95.53%) | 46882558(90.66%) | |
| H3 | 83335490 | 62442120 | 9.2 | 74.93 | 59544572(95.36%) | 55991706(89.67%) |
| EventType. | NumEvents. JC. only |
SigEvents. JC. only (up: down) | NumEvents. JC+ Reads On Target | SigEvents. JC+ reads On Target (up: down) | ||||||||
|---|---|---|---|---|---|---|---|---|---|---|---|---|
| S_ M | H_ M | H_ S | S_ M | H_M | H_ S | S_ M | H_ M | H_ S | S_ M | H_ M | H_ S | |
| SE | 36032 | 33110 | 35535 | 428:497 | 557:1034 | 434:818 | 36038 | 33113 | 35536 | 450:533 | 593:1091 | 462:851 |
| MXE | 7816 | 6661 | 7424 | 993:1090 | 1398:1132 | 1159:794 | 7816 | 6661 | 7424 | 982:1083 | 1375:1130 | 1144:787 |
| A5SS | 348 | 324 | 309 | 17:16 | 19:21 | 9:12 | 349 | 324 | 309 | 17:15 | 21:23 | 13:13 |
| A3SS | 418 | 405 | 393 | 12:12 | 18:13 | 12:10 | 418 | 405 | 393 | 12:13 | 19:13 | 12:09 |
| RI | 494 | 455 | 426 | 7:21 | 13:37 | 8:17 | 503 | 457 | 432 | 6:18 | 13:32 | 7:13 |
Disclaimer/Publisher’s Note: The statements, opinions and data contained in all publications are solely those of the individual author(s) and contributor(s) and not of MDPI and/or the editor(s). MDPI and/or the editor(s) disclaim responsibility for any injury to people or property resulting from any ideas, methods, instructions or products referred to in the content. |
© 2024 by the authors. Licensee MDPI, Basel, Switzerland. This article is an open access article distributed under the terms and conditions of the Creative Commons Attribution (CC BY) license (http://creativecommons.org/licenses/by/4.0/).


