Submitted:
18 August 2024
Posted:
19 August 2024
You are already at the latest version
Abstract
Keywords:
I. Introduction
II. Literature Review
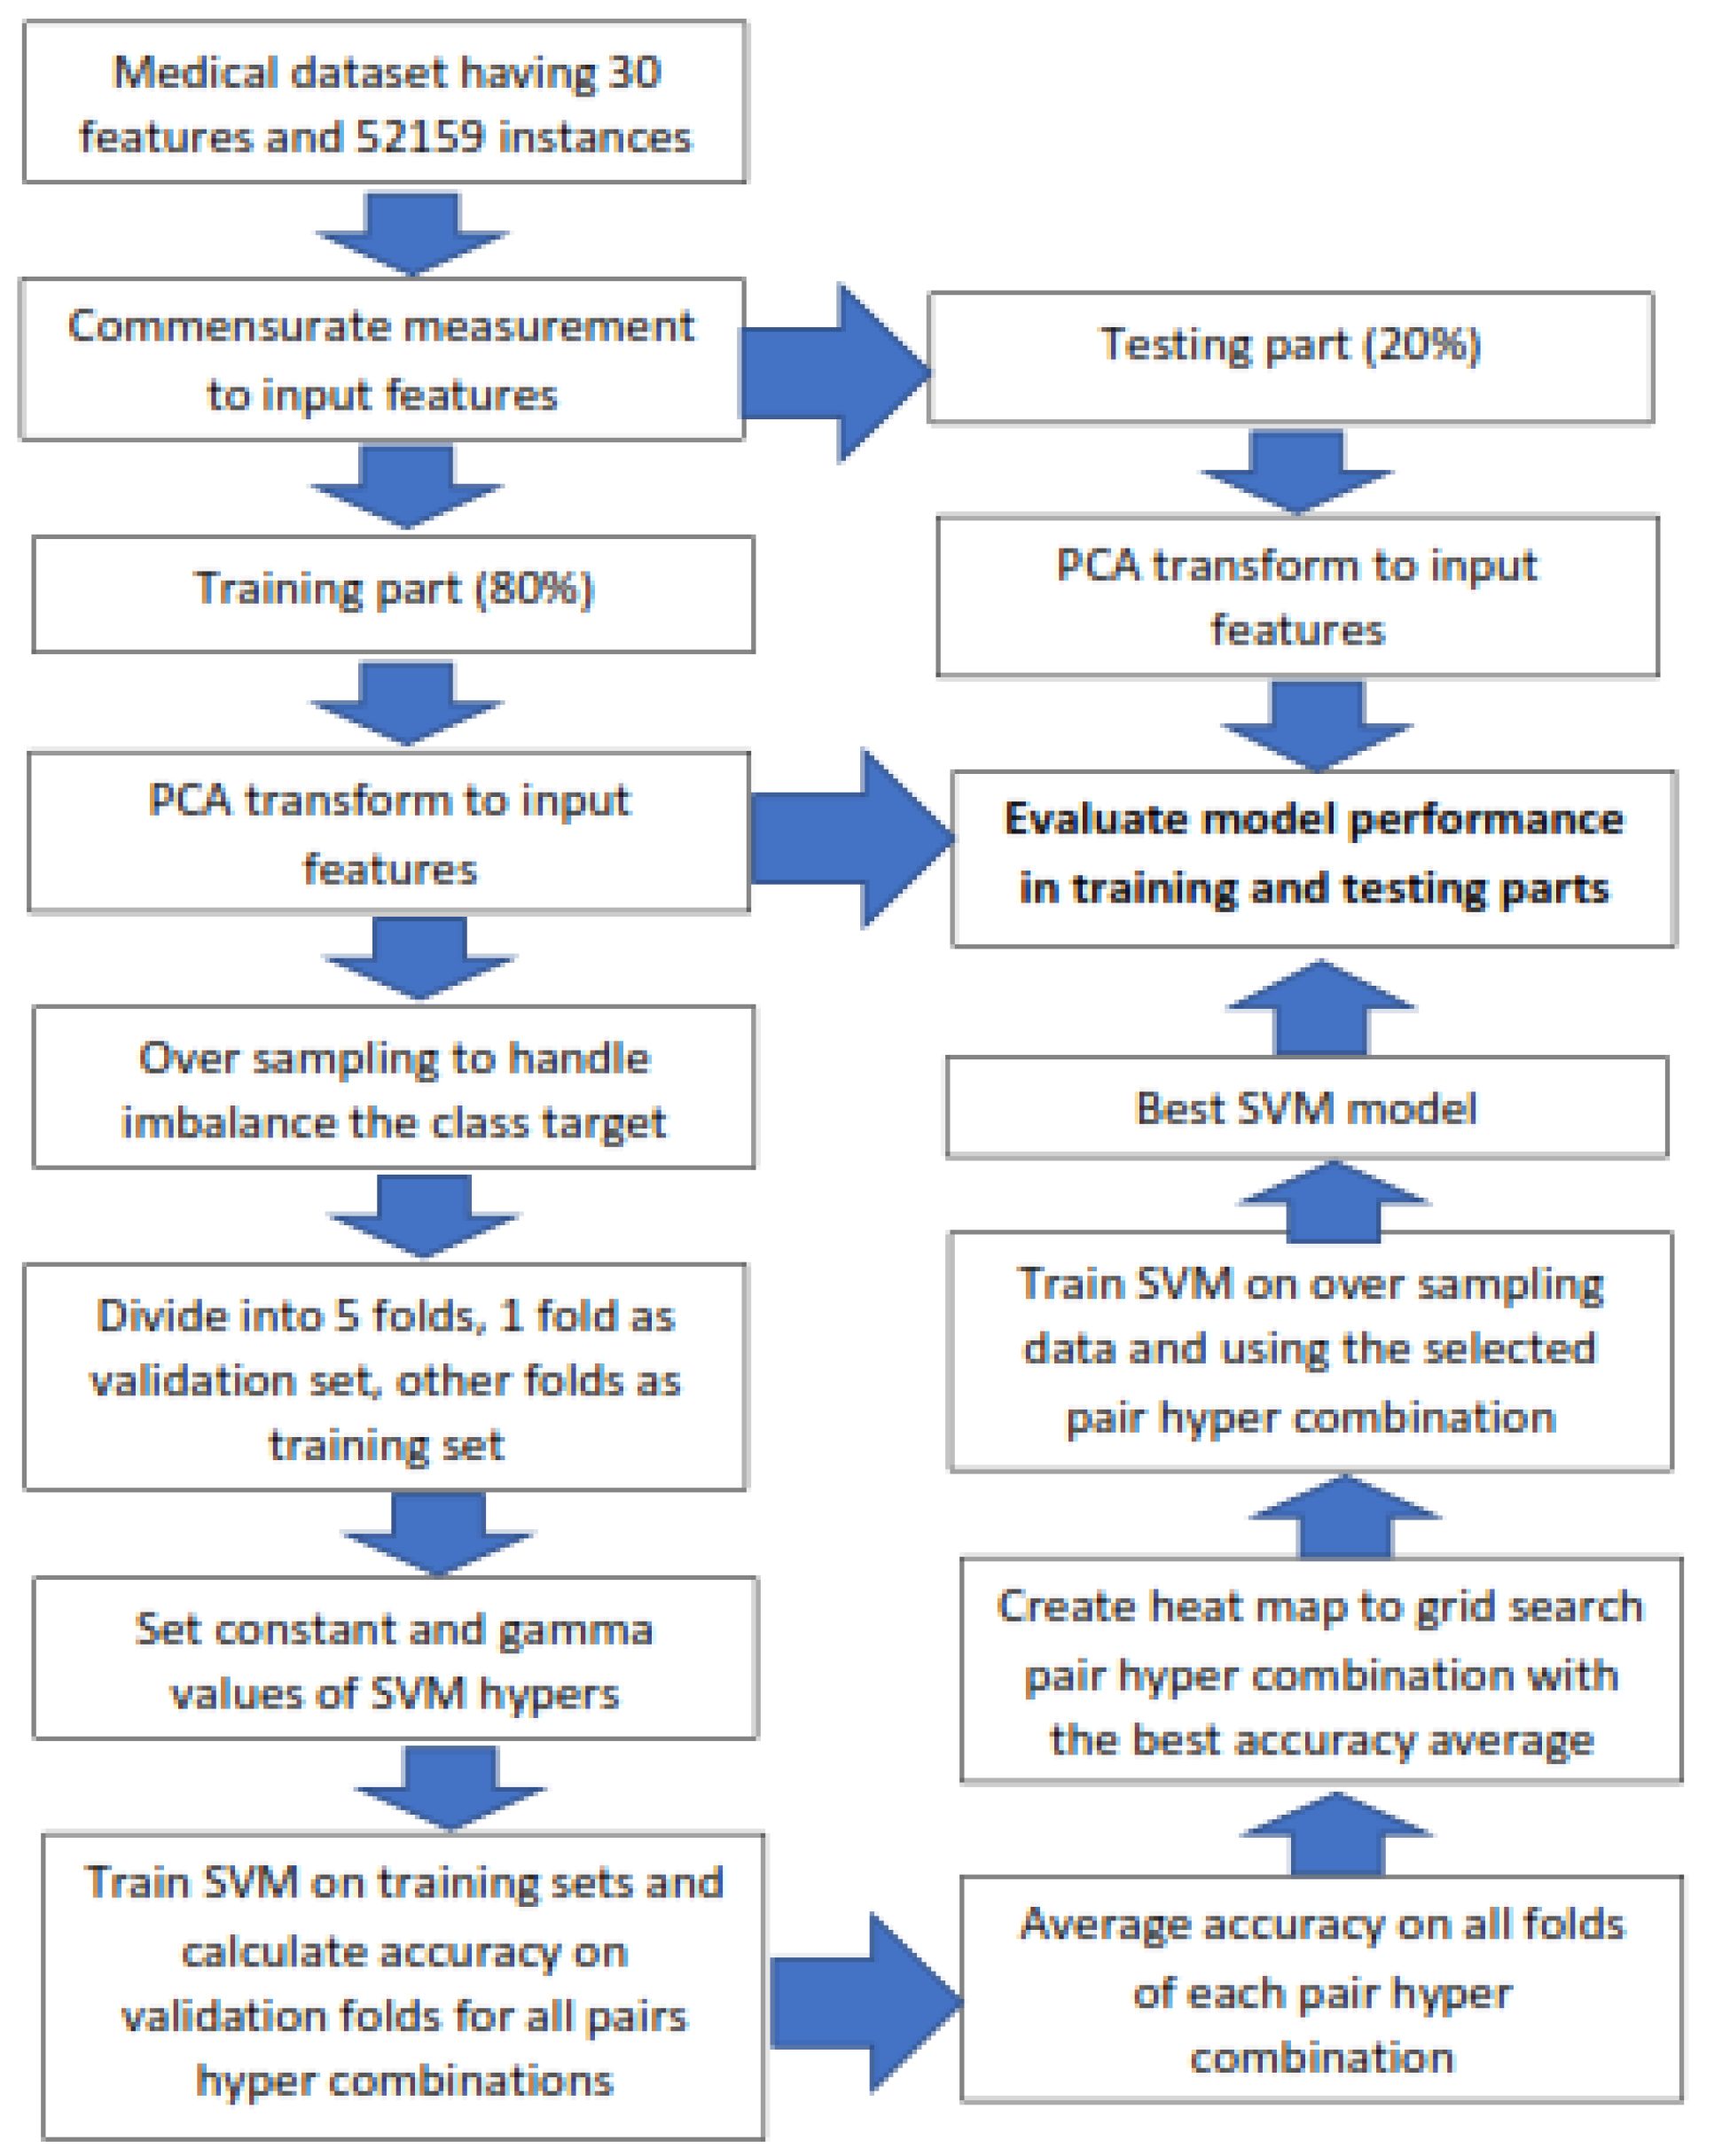
III. Materials and Methods
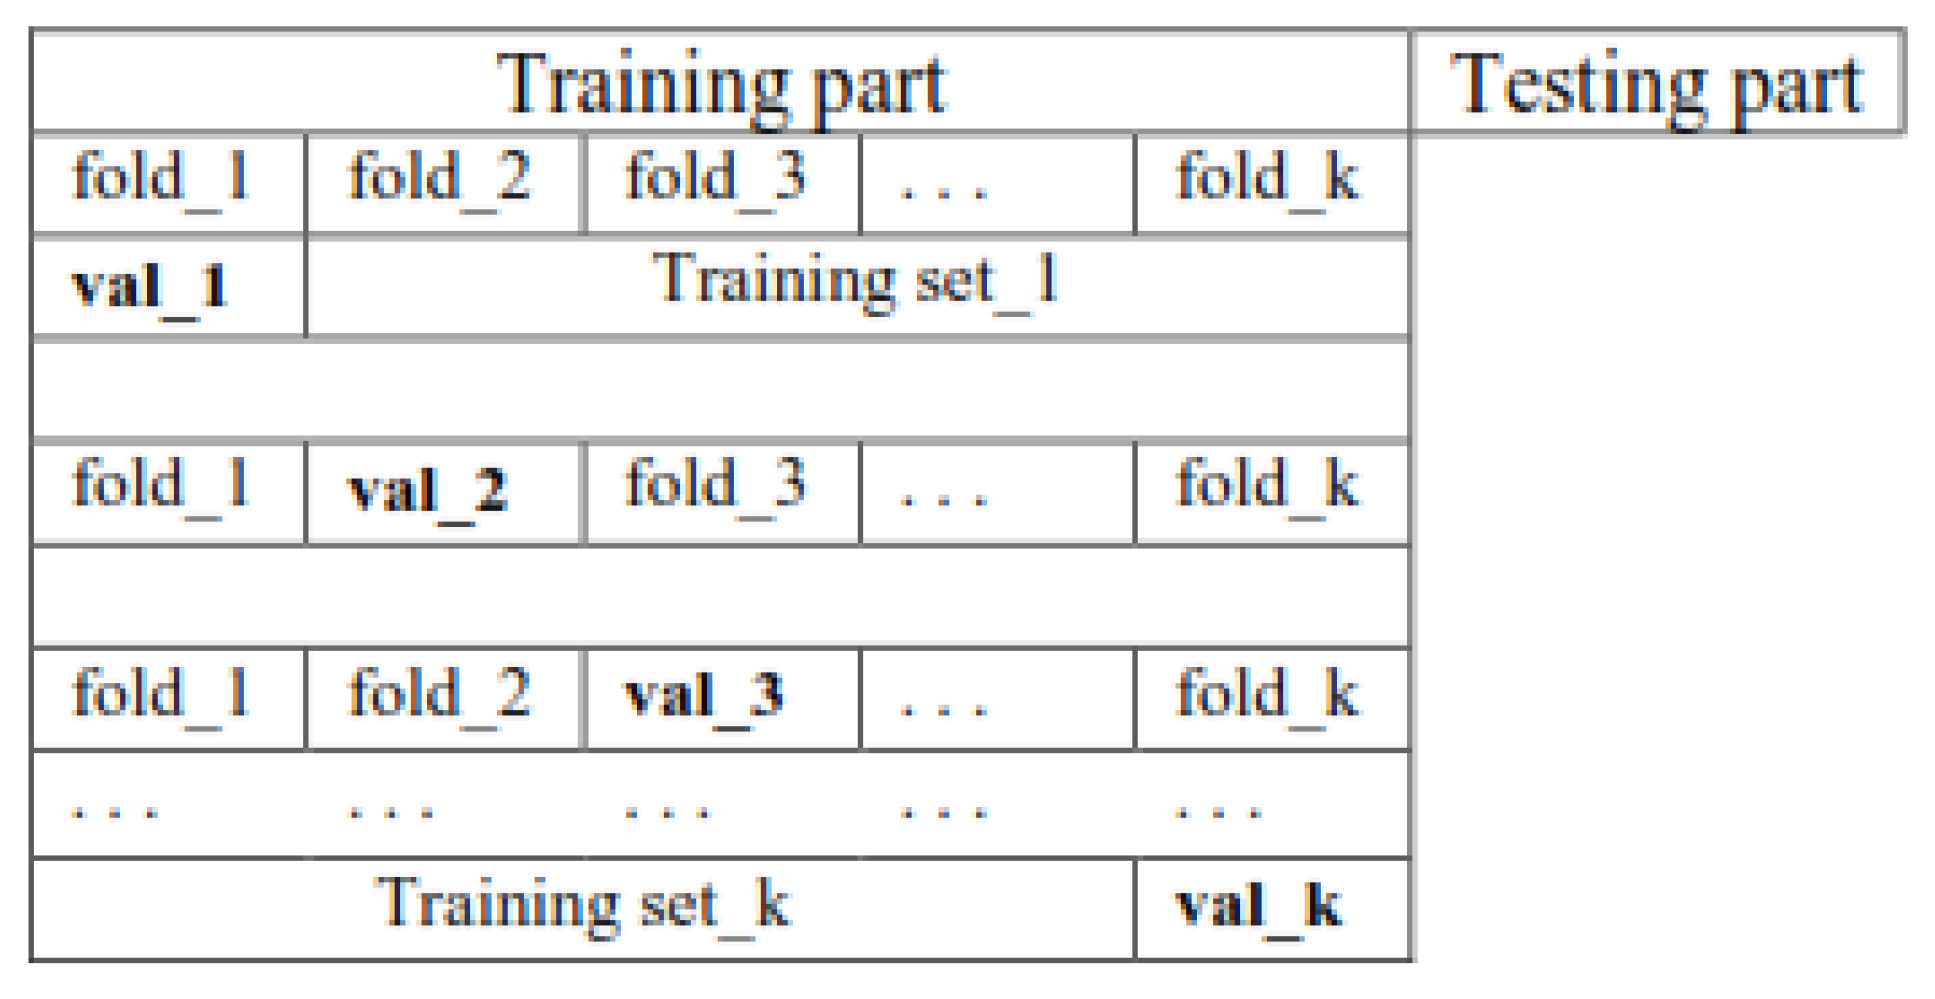
A. Create Pairs of Training And Validation Subsets through K Folds Cross-validation
- The first fold was selected as the validation set, and the other folds as the training set.
- The second fold was selected as the validation set, and the other folds as the training set.
- Pick the third fold as the validation set and other folds as the training set,
- Finally, the kth fold is selected as the validation set, and the other folds as the training set.
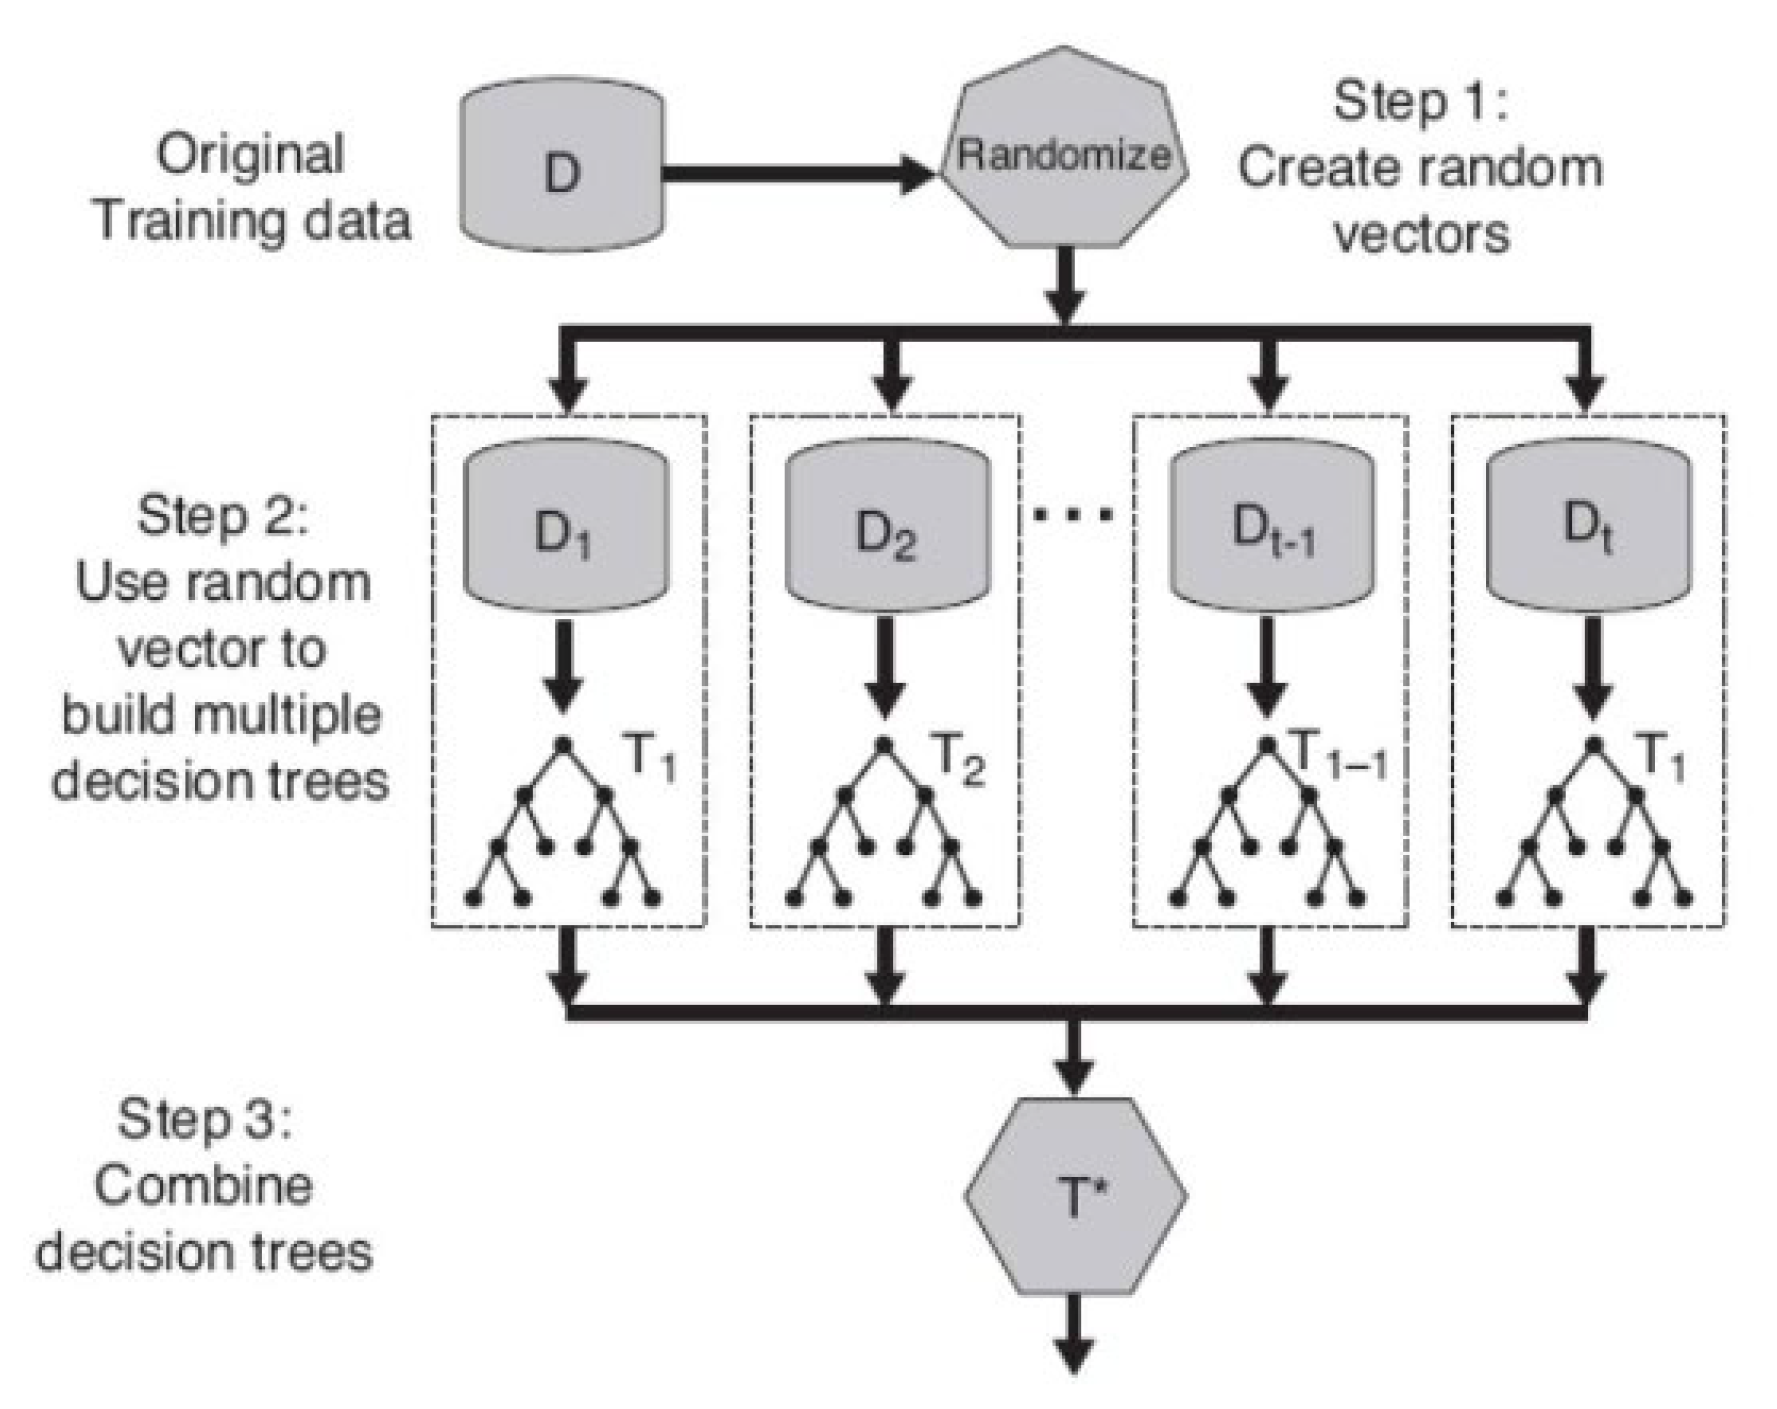
B.Random Forest Classification Model
- i.
- Pick up a bootstrapped data called Db with size N from the dataset D.
- ii.
-
Grow a decision tree called Tb based on Db by recursively repeating the following steps for each decision node until reaching a leaf node.
- -
- Randomly select m features from the M features with (m < M)
- -
- Calculate the information gains (IG) of all m features
- -
- Pick up the best feature and its IG as the splitting feature
- -
- Split the node into two child nodes
- iii.
- The output of the ensemble of trees (RF) was obtained using the majority vote of all tree outputs.
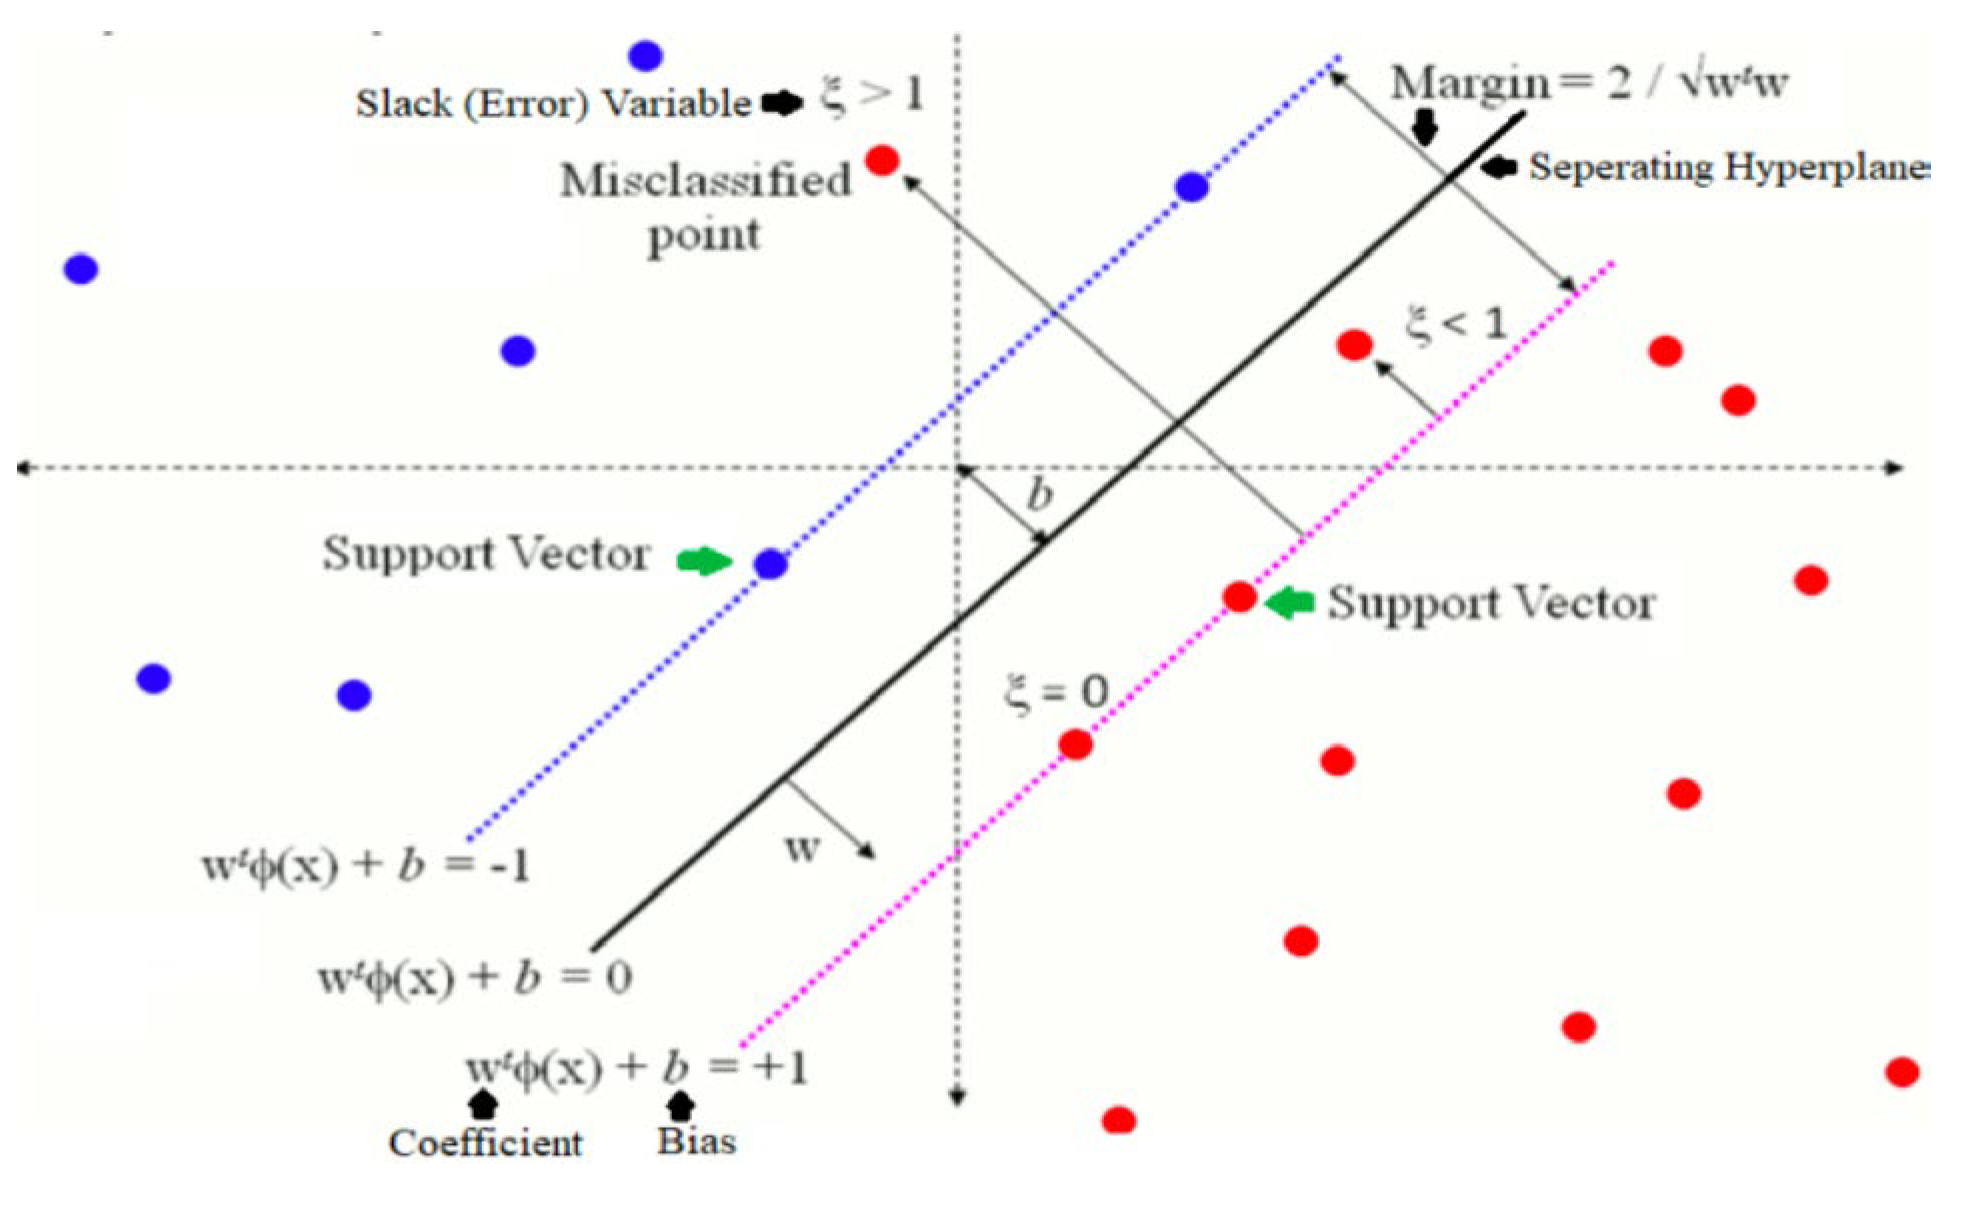
C. Support Vector Classification Model
D. Performance Metrics of Classification Model
IV. Result and Discussion
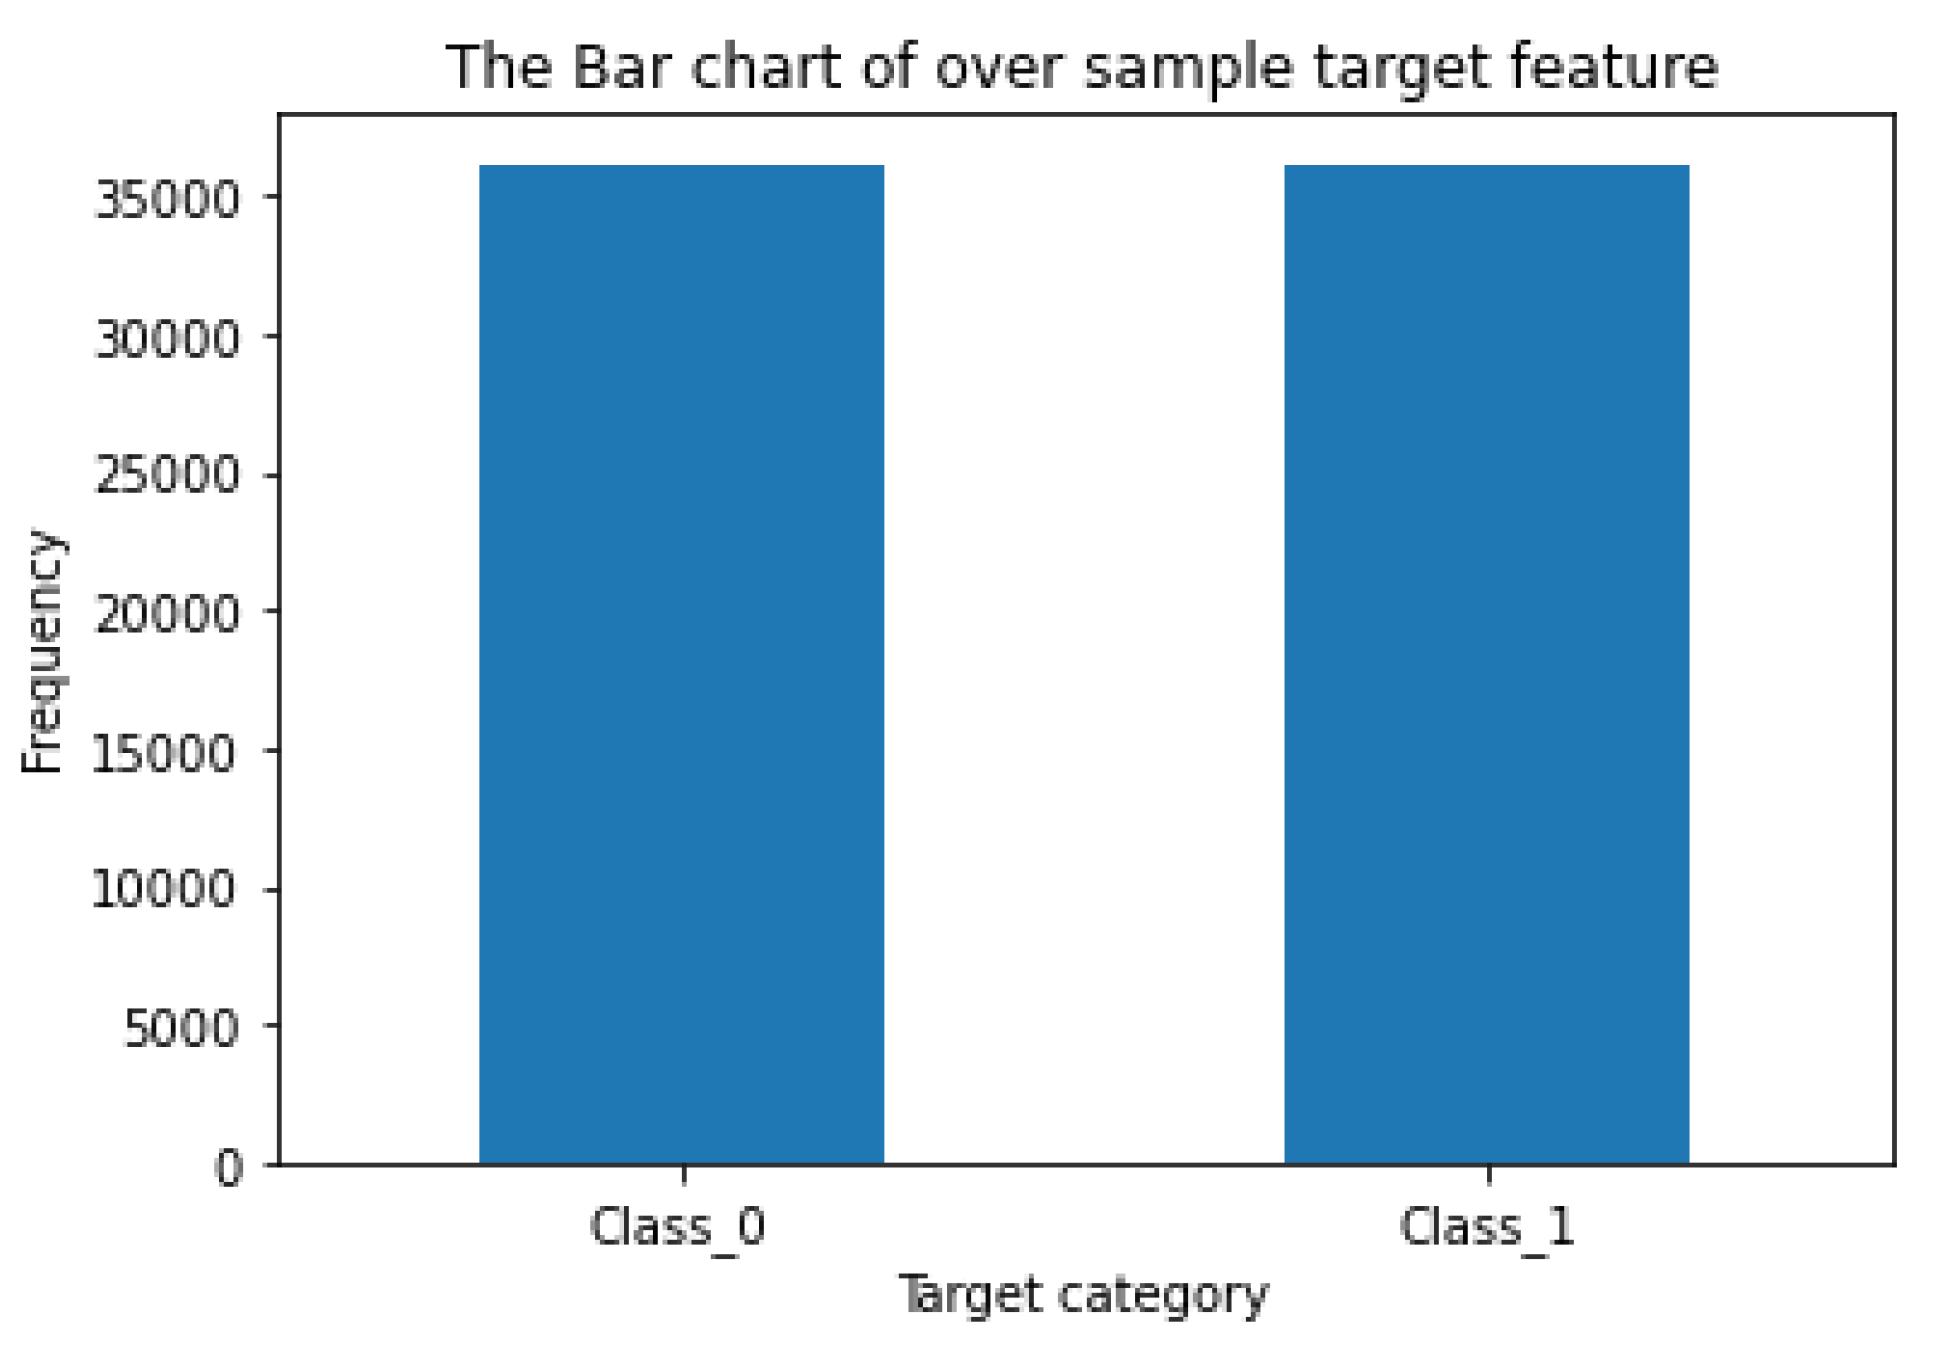
A. Do Oversampling and Format 5 Pairs of the Training and Validation Subsets
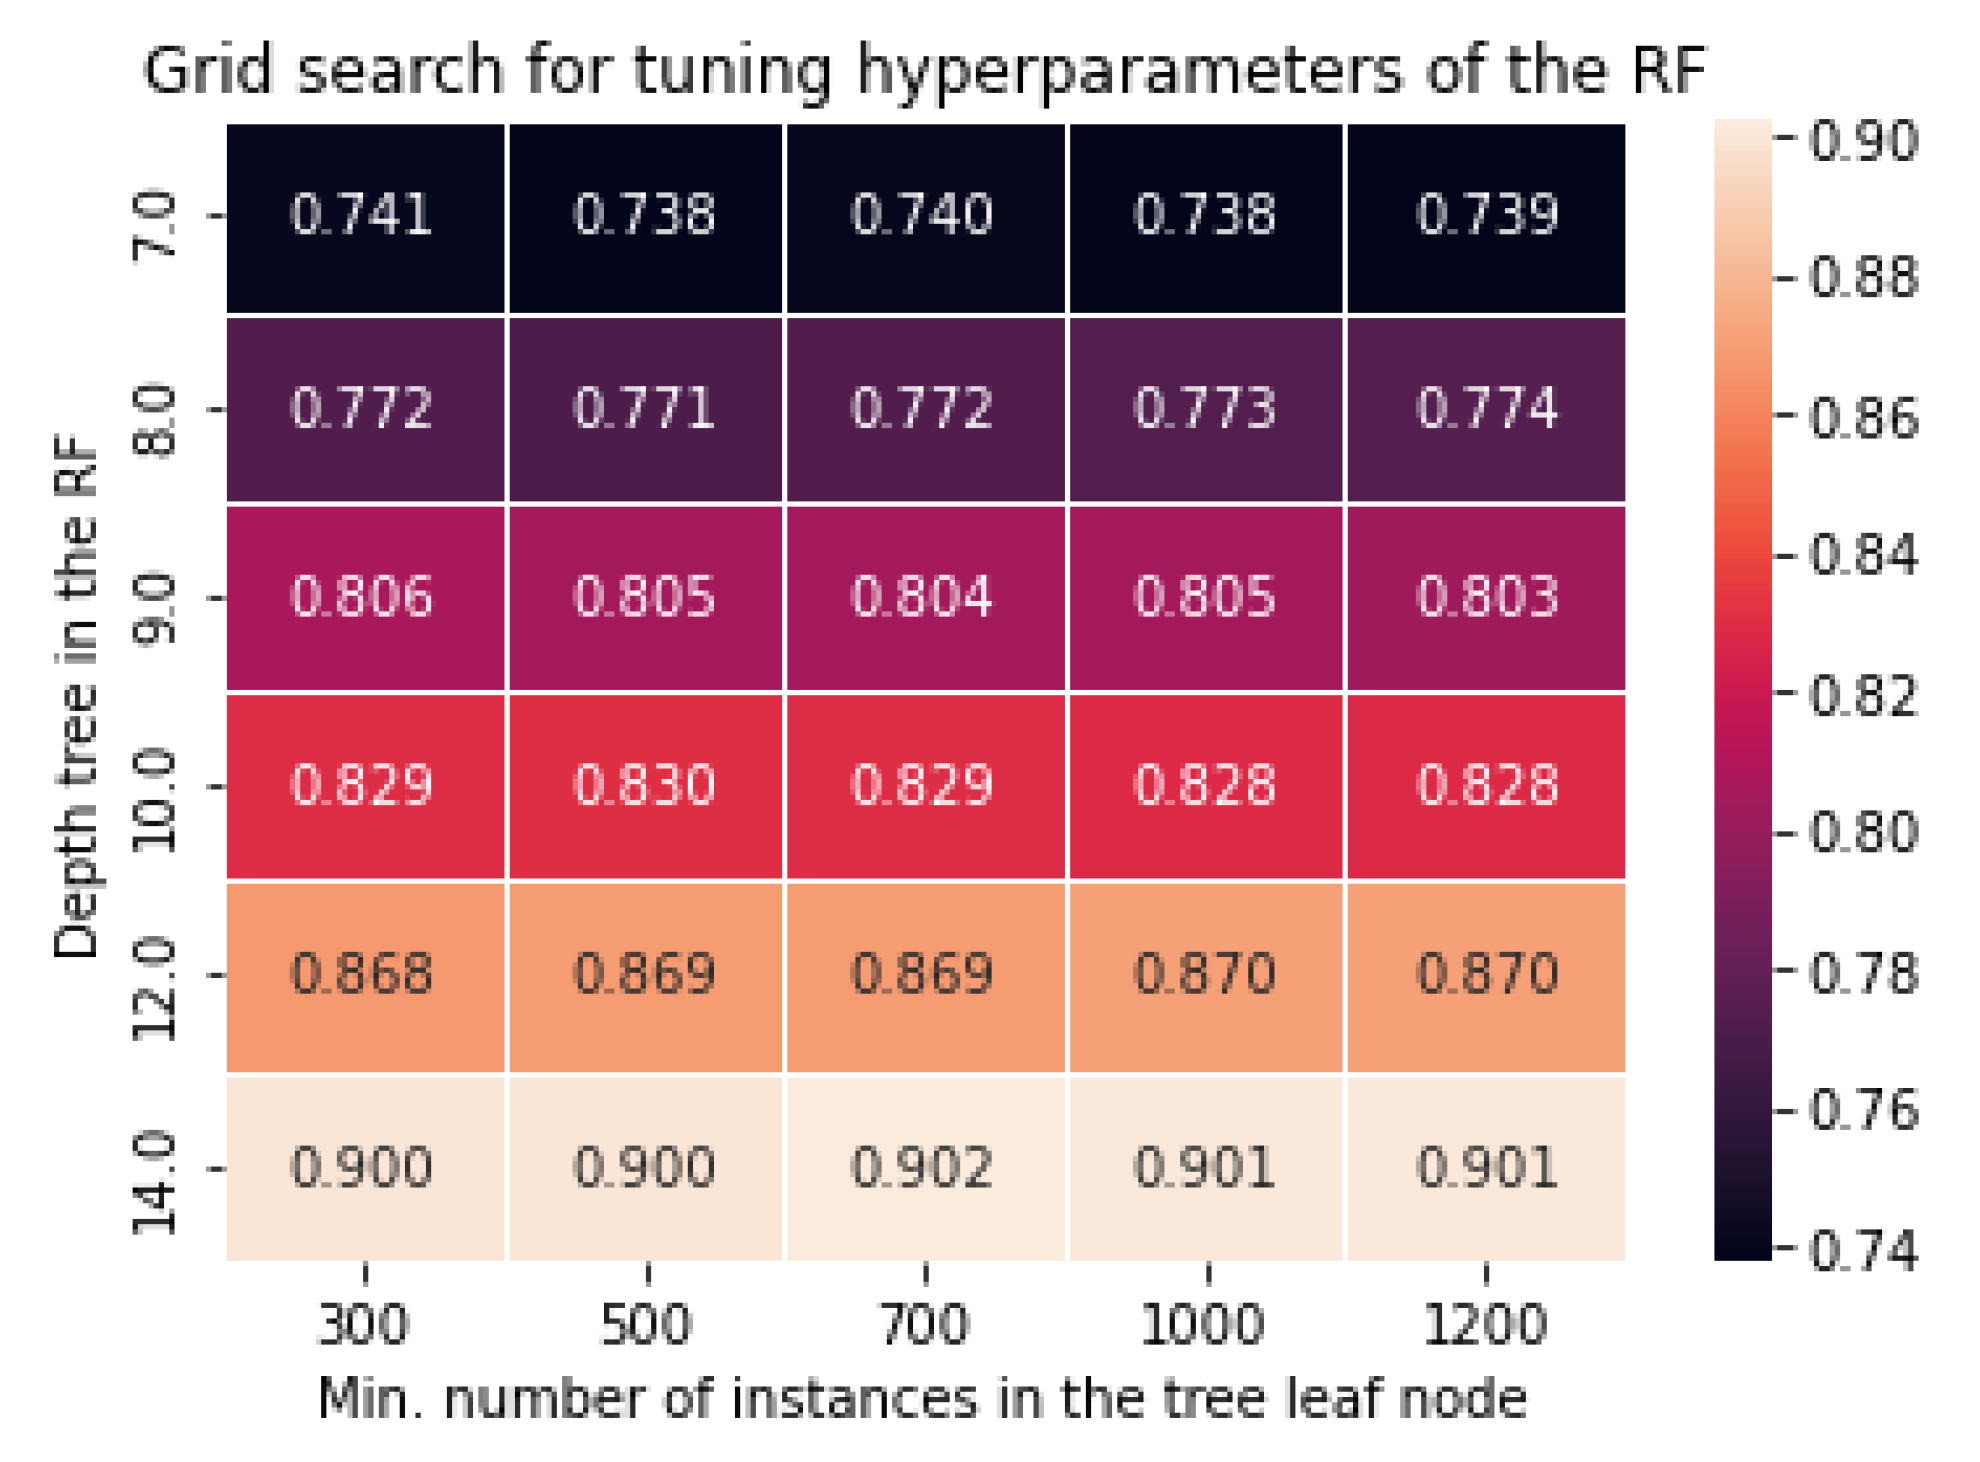
B. Tunining Hyperparameters of Random Forest Classification
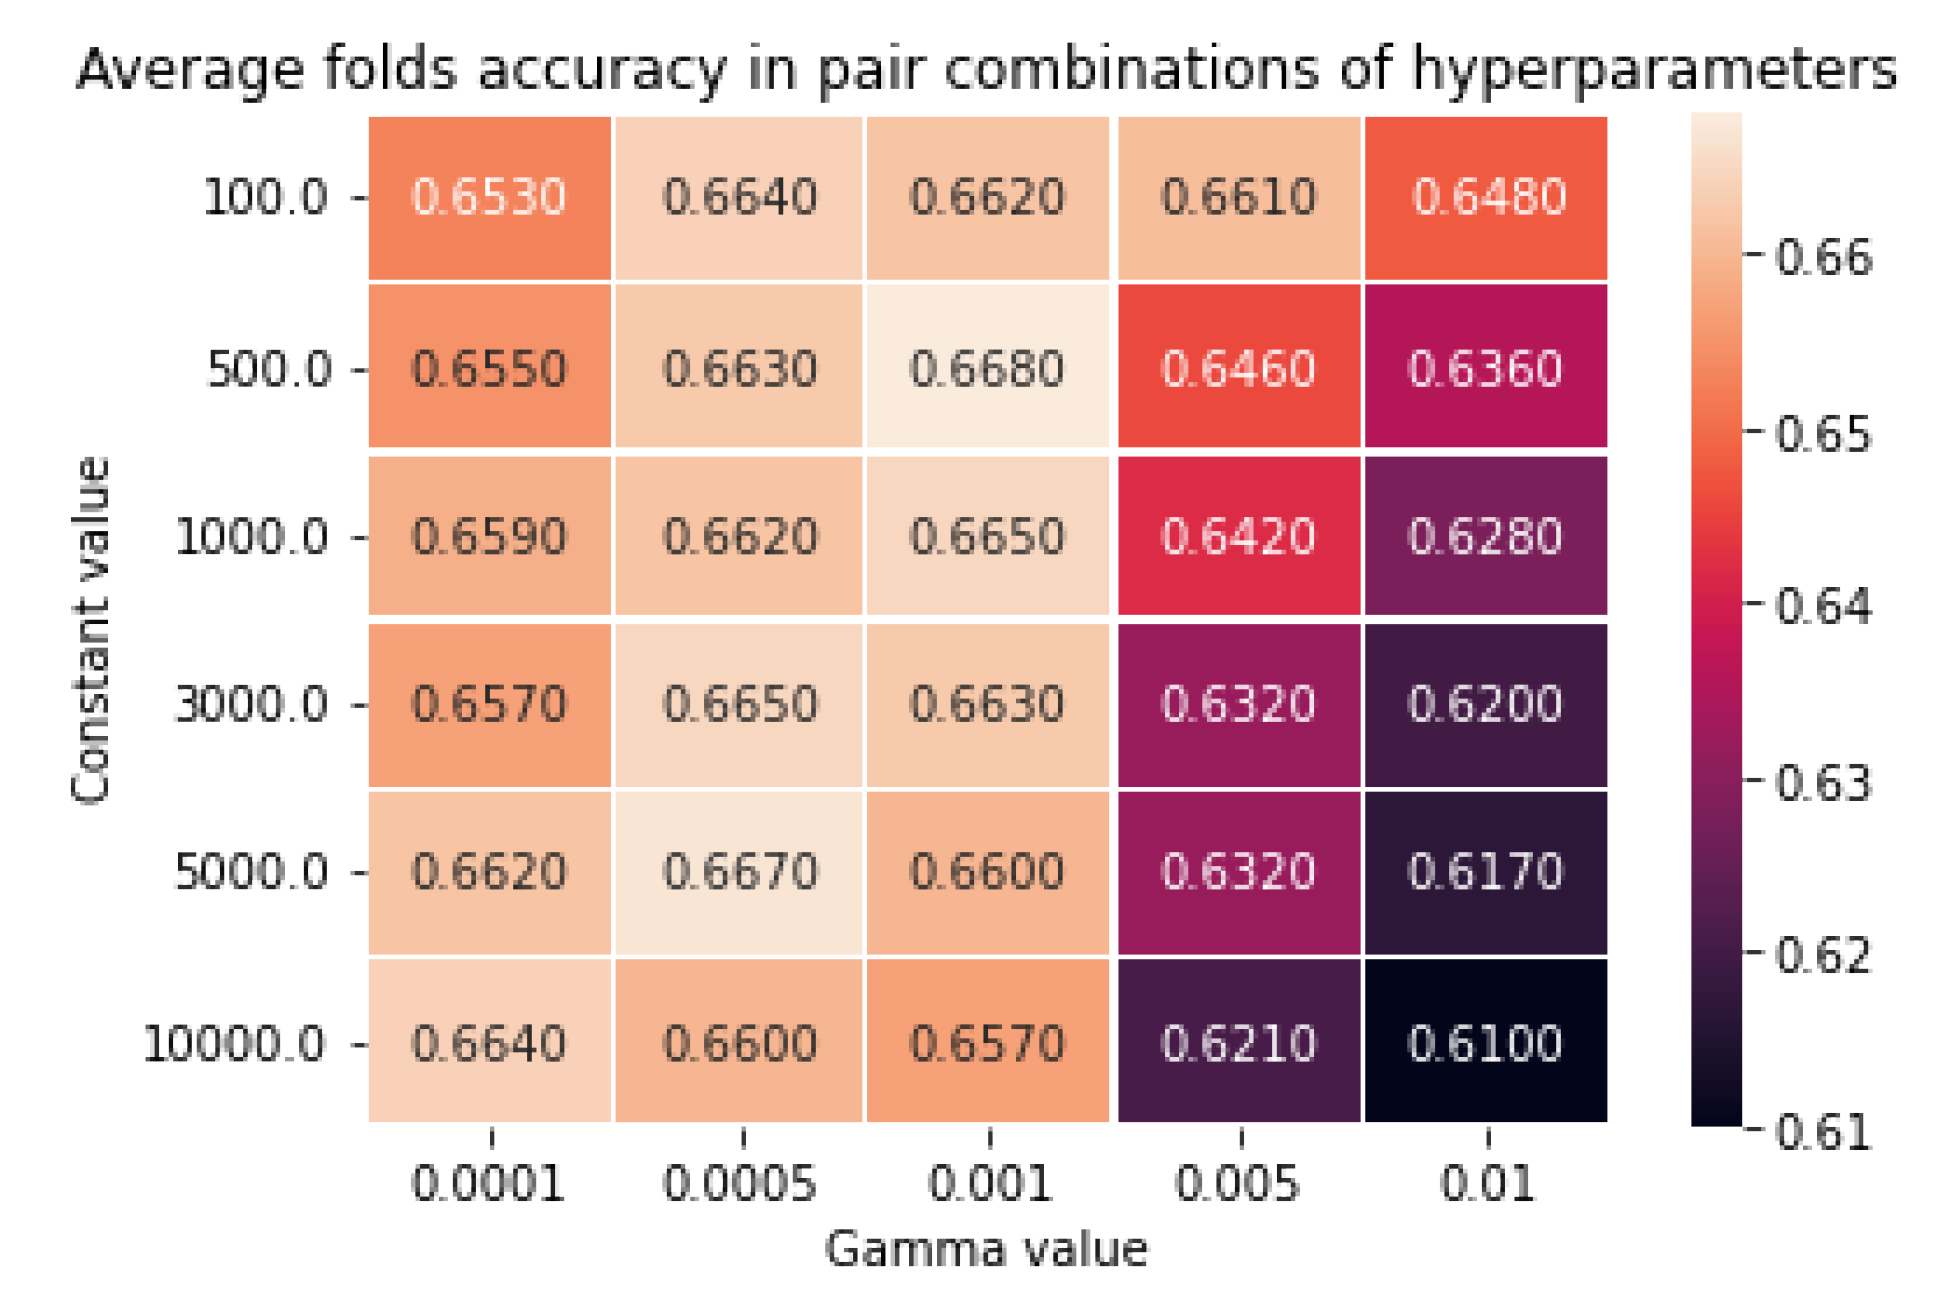
C. Tuning Hyperparameter of the Support Vector Classification Model
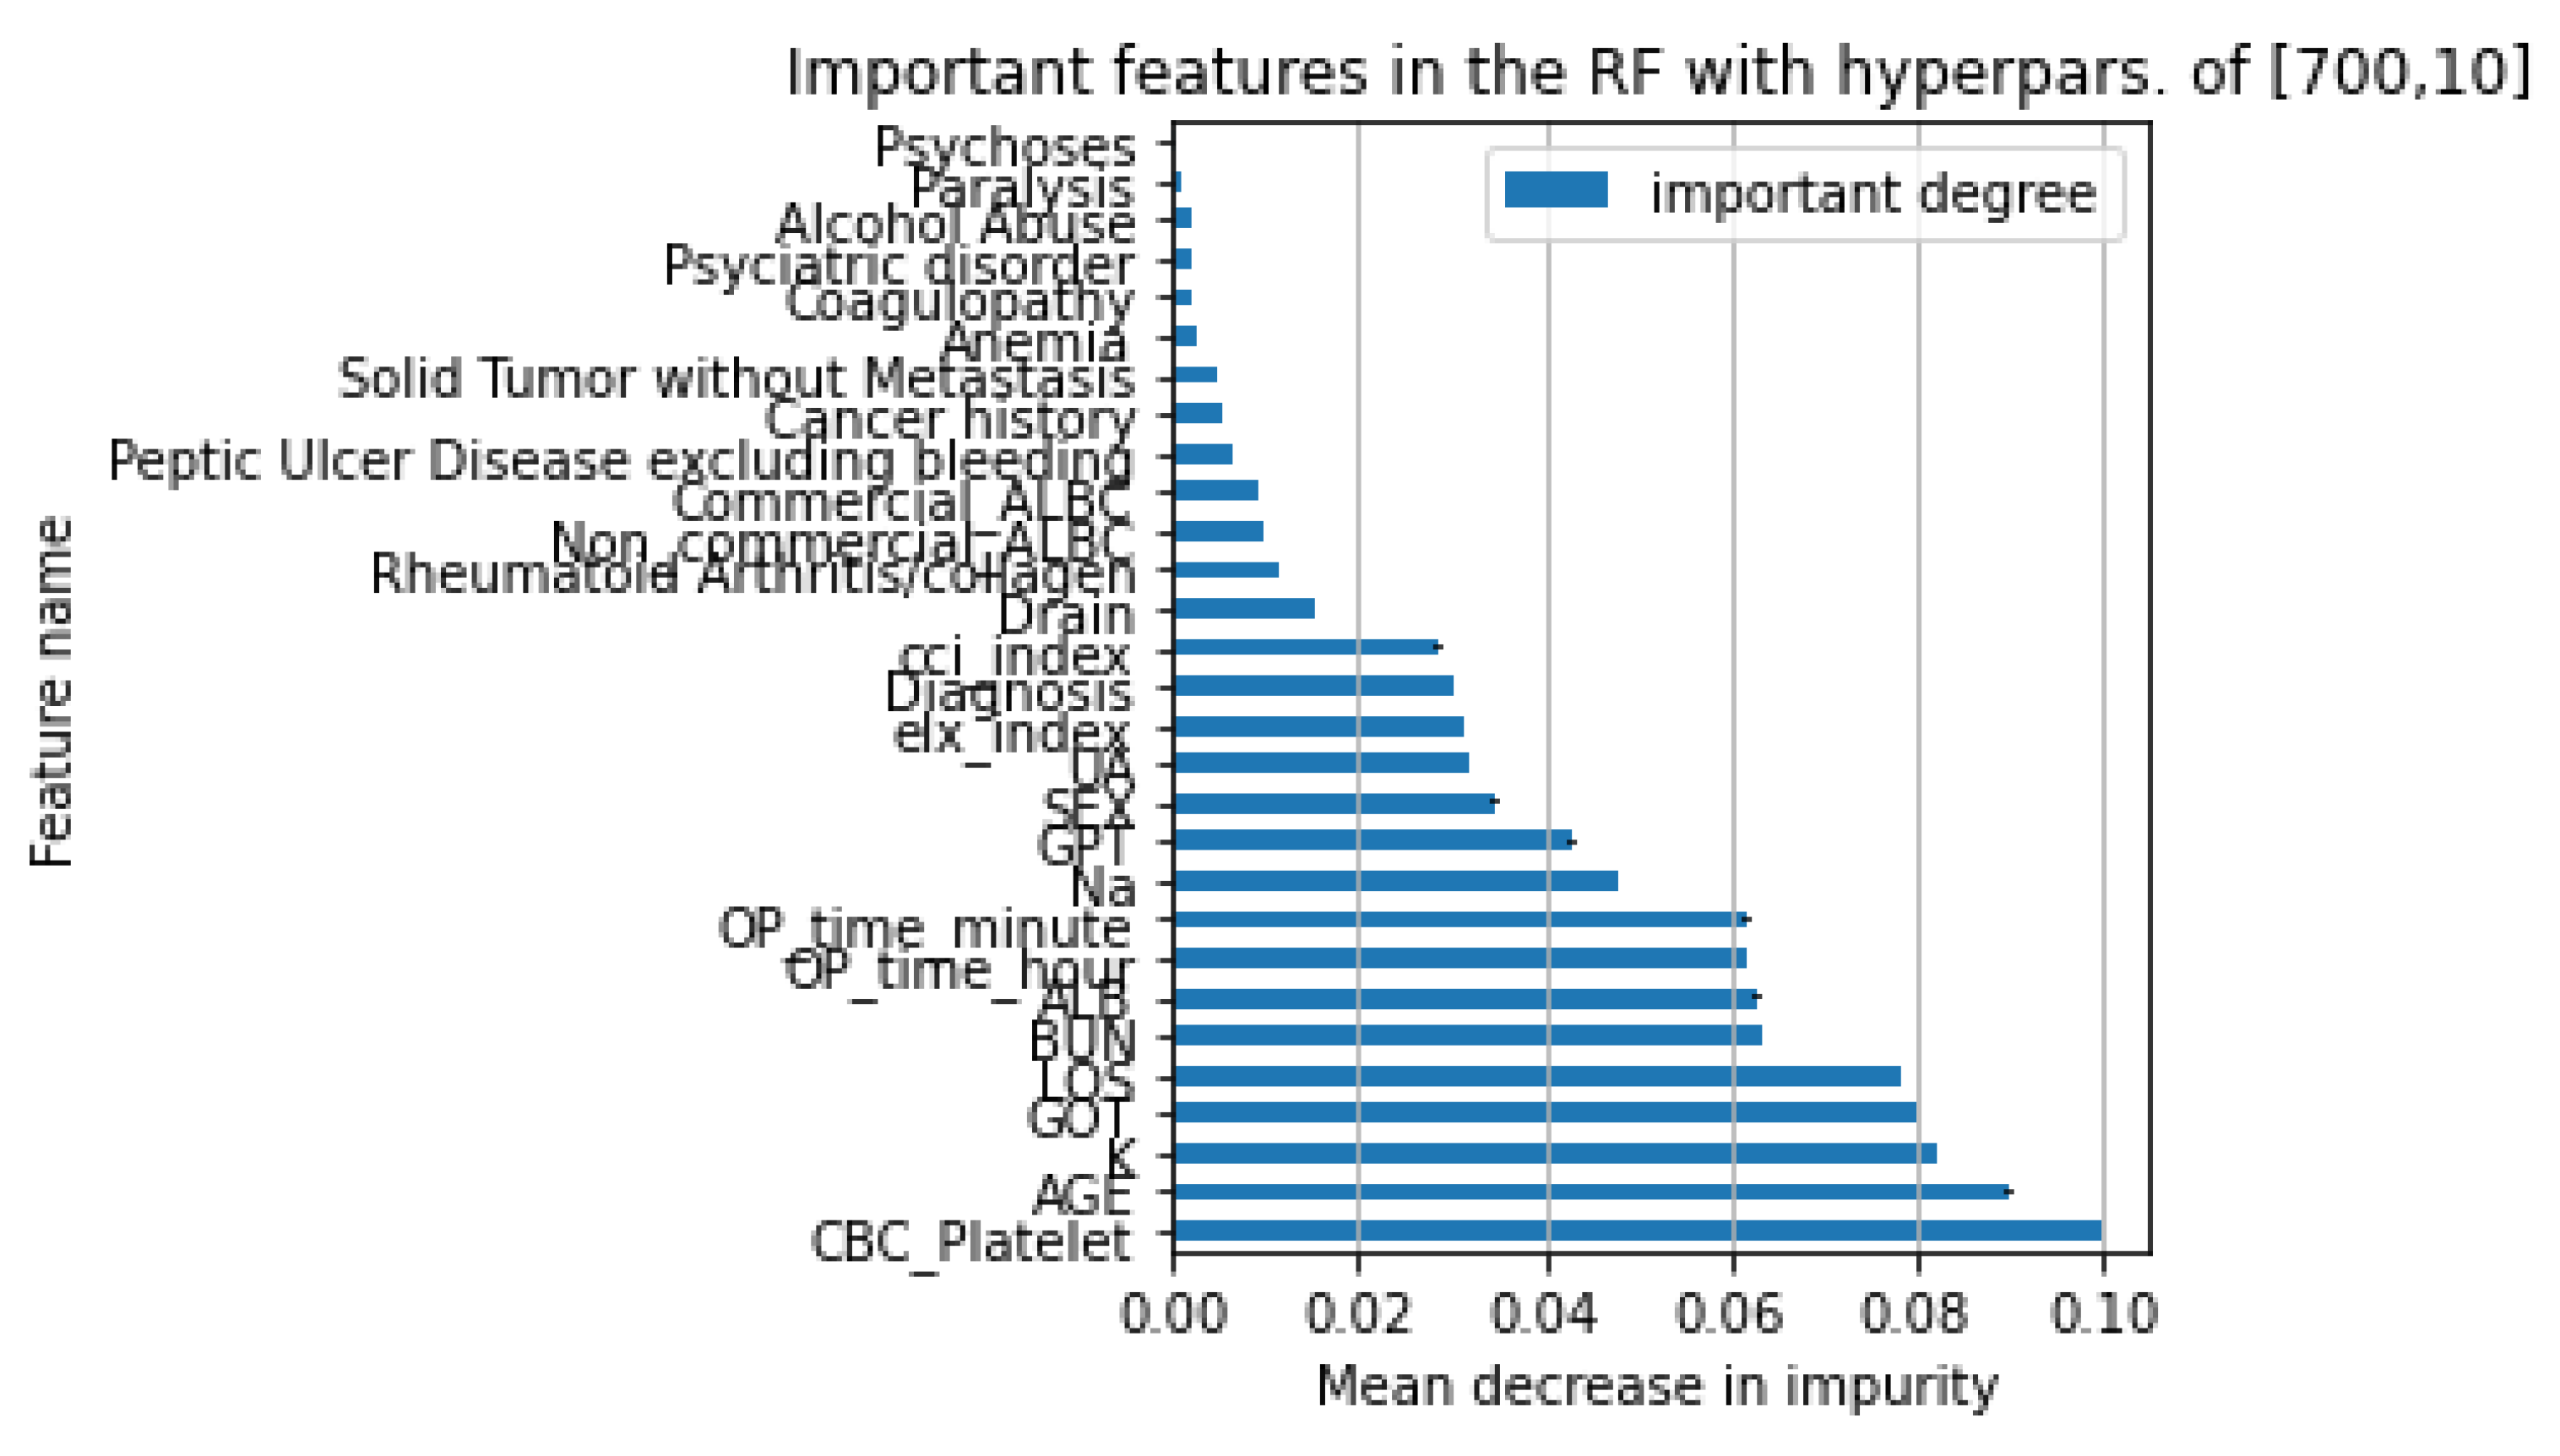
D. The Comparison of Models Performance and the Important Features
V. Conclusion
Author Contributions
Conflicts of Interest
References
- A. W. Widodo, S. Handoyo, G. Irianto, N. W. Hidajati, D. S. Susanti, and I. N. Purwanto, “Finding the Best Performance of Bayesian and Naïve Bayes Models in Fraudulent Firms Classification through Varying Threshold,” International Journal of Emerging Technology and Advanced Engineering, vol. 12, no. 12, pp. 94–106, Dec. 2022. [CrossRef]
- S. Syahrial, R. Ilham, Z. F. Asikin, and St. S. I. Nurdin, “Stunting Classification in Children’s Measurement Data Using Machine Learning Models,” Journal La Multiapp, vol. 3, no. 2, 2022. [CrossRef]
- W. Cnota et al., “The Killer Placenta” — a threat to the lives of young women giving Birth by cesarean section,” Ginekol Pol, vol. 93, no. 4, 2022. [CrossRef]
- T. Liu, W. Fan, and C. Wu, “A hybrid machine learning approach to cerebral stroke prediction based on the imbalanced medical dataset,” Artif Intell Med, vol. 101, 2019. [CrossRef]
- I. D. Mienye and Y. Sun, “Performance analysis of cost-sensitive learning methods with application to imbalanced medical data,” Inform Med Unlocked, vol. 25, 2021. [CrossRef]
- A. V. Barmak, Y. V. Krak, E. A. Manziuk, and V. S. Kasianiuk, “Information technologyof separating hyperplanes synthesisfor linear classifiers,” Journal of Automation and Information Sciences, vol. 51, no. 5, 2019. [CrossRef]
- Priyanka and D. Kumar, “Decision tree classifier: A detailed survey,” International Journal of Information and Decision Sciences, vol. 12, no. 3, 2020. [CrossRef]
- T. Lan, H. Hu, C. Jiang, G. Yang, and Z. Zhao, “A comparative study of decision tree, random forest, and convolutional neural network for spread-F identification,” Advances in Space Research, vol. 65, no. 8, 2020. [CrossRef]
- J. L. Speiser, M. E. Miller, J. Tooze, and E. Ip, “A comparison of random forest variable selection methods for classification prediction modeling,” Expert Systems with Applications, vol. 134. 2019. [CrossRef]
- M. Z. Alam, M. S. Rahman, and M. S. Rahman, “A Random Forest based predictor for medical data classification using feature ranking,” Inform Med Unlocked, vol. 15, 2019. [CrossRef]
- S. El-Sappagh, F. Ali, T. Abuhmed, J. Singh, and J. M. Alonso, “Automatic detection of Alzheimer’s disease progression: An efficient information fusion approach with heterogeneous ensemble classifiers,” Neurocomputing, vol. 512, 2022. [CrossRef]
- J. Cervantes, F. Garcia-Lamont, L. Rodríguez-Mazahua, and A. Lopez, “A comprehensive survey on support vector machine classification: Applications, challenges and trends,” Neurocomputing, vol. 408, 2020. [CrossRef]
- W. Pannakkong, K. Thiwa-Anont, K. Singthong, P. Parthanadee, and J. Buddhakulsomsiri, “Hyperparameter Tuning of Machine Learning Algorithms Using Response Surface Methodology: A Case Study of ANN, SVM, and DBN,” Math Probl Eng, vol. 2022, 2022. [CrossRef]
- X. Ding, J. Liu, F. Yang, and J. Cao, “Random radial basis function kernel-based support vector machine,” J Franklin Inst, vol. 358, no. 18, 2021. [CrossRef]
- A. Kumar, N. Sinha, and A. Bhardwaj, “A novel fitness function in genetic programming for medical data classification,” J Biomed Inform, vol. 112, 2020. [CrossRef]
- J. Bektaş, “EKSL: An effective novel dynamic ensemble model for unbalanced datasets based on LR and SVM hyperplane-distances,” Inf Sci (N Y), vol. 597, 2022. [CrossRef]
- M. A. Ganaie and M. Tanveer, “KNN weighted reduced universum twin SVM for class imbalance learning,” Knowl Based Syst, vol. 245, 2022. [CrossRef]
- D. Chicco and G. Jurman, “The advantages of the Matthews correlation coefficient (MCC) over F1 score and accuracy in binary classification evaluation,” BMC Genomics, vol. 21, no. 1, 2020. [CrossRef]
- G. Canbek, T. Taskaya Temizel, and S. Sagiroglu, “BenchMetrics: a systematic benchmarking method for binary classification performance metrics,” Neural Comput Appl, vol. 33, no. 21, 2021. [CrossRef]
- G. Kovács, “An empirical comparison and evaluation of minority oversampling techniques on a large number of imbalanced datasets,” Applied Soft Computing Journal, vol. 83, 2019. [CrossRef]
- Z. Xu, D. Shen, T. Nie, Y. Kou, N. Yin, and X. Han, “A cluster-based oversampling algorithm combining SMOTE and k-means for imbalanced medical data,” Inf Sci (N Y), vol. 572, 2021. [CrossRef]
- D. Passos and P. Mishra, “A tutorial on automatic hyperparameter tuning of deep spectral modelling for regression and classification tasks,” Chemometrics and Intelligent Laboratory Systems, vol. 223. 2022. [CrossRef]
- S. Nematzadeh, F. Kiani, M. Torkamanian-Afshar, and N. Aydin, “Tuning hyperparameters of machine learning algorithms and deep neural networks using metaheuristics: A bioinformatics study on biomedical and biological cases,” Comput Biol Chem, vol. 97, 2022. [CrossRef]
- R. Yacouby and D. Axman, “Probabilistic Extension of Precision, Recall, and F1 Score for More Thorough Evaluation of Classification Models,” 2020. [CrossRef]
- D. Chicco and G. Jurman, “The Matthews correlation coefficient (MCC) should replace the ROC AUC as the standard metric for assessing binary classification,” BioData Min, vol. 16, no. 1, 2023. [CrossRef]
- S. Handoyo, Y. P. Chen, G. Irianto, and A. Widodo, “The varying threshold values of logistic regression and linear discriminant for classifying fraudulent firm,” Mathematics and Statistics, vol. 9, no. 2, 2021. [CrossRef]
- H. Zhou, K. M. Yu, Y. C. Chen, and H. P. Hsu, “A Hybrid Feature Selection Method RFSTL for Manufacturing Quality Prediction Based on a High Dimensional Imbalanced Dataset,” IEEE Access, vol. 9, 2021. [CrossRef]
- A. S. Sumant and D. V. Patil, “Parallel Ensemble Feature Subset Selection based Deep Learning Approach for Imbalanced High Dimensional Cancer Datasets,” Indian Journal of Computer Science and Engineering, vol. 13, no. 6, 2022. [CrossRef]
- T. Wongvorachan, S. He, and O. Bulut, “A Comparison of Undersampling, Oversampling, and SMOTE Methods for Dealing with Imbalanced Classification in Educational Data Mining,” Information (Switzerland), vol. 14, no. 1, 2023. [CrossRef]
- A. S. Desuky and S. Hussain, “An Improved Hybrid Approach for Handling Class Imbalance Problem,” Arab J Sci Eng, vol. 46, no. 4, 2021. [CrossRef]
- W. Lu, Z. Li, and J. Chu, “Adaptive Ensemble Undersampling-Boost: A novel learning framework for imbalanced data,” Journal of Systems and Software, vol. 132, 2017. [CrossRef]
- P. Roy and C. Chowdhury, “A Survey of Machine Learning Techniques for Indoor Localization and Navigation Systems,” Journal of Intelligent and Robotic Systems: Theory and Applications, vol. 101, no. 3, 2021. [CrossRef]
- Marji, S. Handoyo, I. N. Purwanto, and M. Y. Anizar, “The effect of attribute diversity in the covariance matrix on the magnitude of the radius parameter in fuzzy subtractive clustering,” J Theor Appl Inf Technol, vol. 96, no. 12, 2018.
- I. N. Purwanto, A. Widodo, and S. Handoyo, “System for selection starting lineup of a football players by using analytical hierarchy process (AHP),” J Theor Appl Inf Technol, vol. 96, no. 1, 2018.
- S. Handoyo, Marji, I. N. Purwanto, and F. Jie, “The fuzzy inference system with rule bases generated by using the fuzzy C-means to predict regional minimum wage in Indonesia,” International Journal of Operations and Quantitative Management, vol. 24, no. 4, 2018.
- L. Liu, N. Jia, L. Lin, and Z. He, “A Cohesion-Based Heuristic Feature Selection for Short-Term Traffic Forecasting,” IEEE Access, vol. 7, 2019. [CrossRef]
- W. H. Nugroho, S. Handoyo, and Y. J. Akri, “An influence of measurement scale of predictor variable on logistic regression modeling and learning vector quntization modeling for object classification,” International Journal of Electrical and Computer Engineering, vol. 8, no. 1, 2018. [CrossRef]
- Marji and S. Handoyo, “PERFORMANCE OF RIDGE LOGISTIC REGRESSION AND DECISION TREE IN THE BINARY CLASSIFICATION,” J Theor Appl Inf Technol, vol. 100, no. 15, 2022.
- M. Koklu and I. A. Ozkan, “Multiclass classification of dry beans using computer vision and machine learning techniques,” Comput Electron Agric, vol. 174, 2020. [CrossRef]
- S. Handoyo, N. Pradianti, W. H. Nugroho, and Y. J. Akri, “A Heuristic Feature Selection in Logistic Regression Modeling with Newton Raphson and Gradient Descent Algorithm,” International Journal of Advanced Computer Science and Applications, vol. 13, no. 3, 2022. [CrossRef]
- N. Han et al., “Transferable Linear Discriminant Analysis,” IEEE Trans Neural Netw Learn Syst, vol. 31, no. 12, 2020. [CrossRef]
- Y. T. Mursityo, I. Rupiwardani, W. H. N. Putra, D. S. Susanti, T. Handayani, and S. Handoyo, “Relevant Features Independence of Heuristic Selection and Important Features of Decision Tree in the Medical Data Classification,” Journal of Advances in Information Technology, vol. 15, no. 5, pp. 591–601, 2024. [CrossRef]
- P. H. Huynh and V. H. Nguyen, “A Novel Ensemble of Support Vector Machines for Improving Medical Data Classification,” Engineering Innovations, vol. 4, 2023. [CrossRef]
- M. M. Chen and M. C. Chen, “Modeling road accident severity with comparisons of logistic regression, decision tree, and random forest,” Information (Switzerland), vol. 11, no. 5, 2020. [CrossRef]
- A. Subudhi, M. Dash, and S. Sabut, “Automated segmentation and classification of brain stroke using expectation-maximization and random forest classifier,” Biocybern Biomed Eng, vol. 40, no. 1, 2020. [CrossRef]
- A. Al-Hashedi et al., “Ensemble Classifiers for Arabic Sentiment Analysis of Social Network (Twitter Data) towards COVID-19-Related Conspiracy Theories,” Applied Computational Intelligence and Soft Computing, vol. 2022, 2022. [CrossRef]
- M. Aslani and S. Seipel, “Efficient and decision boundary aware instance selection for support vector machines,” Inf Sci (N Y), vol. 577, 2021. [CrossRef]
- A. Widodo and S. Handoyo, “The classification performance using logistic regression and support vector machine (SVM),” J Theor Appl Inf Technol, vol. 95, no. 19, 2017.
- T. Y. Wen and S. A. Mohd Aris, “Hybrid Approach of EEG Stress Level Classification Using K-Means Clustering and Support Vector Machine,” IEEE Access, vol. 10, 2022. [CrossRef]
- G. Bologna and Y. Hayashi, “A Comparison Study on Rule Extraction from Neural Network Ensembles, Boosted Shallow Trees, and SVMs,” Applied Computational Intelligence and Soft Computing, vol. 2018, 2018. [CrossRef]
- S. K. Saddam Hussain, E. Sai Charan Reddy, K. Gangadhar Akshay, and T. Akanksha, “Fraud Detection in Credit Card Transactions Using SVM and Random Forest Algorithms,” in Proceedings of the 5th International Conference on I-SMAC (IoT in Social, Mobile, Analytics and Cloud), I-SMAC 2021, 2021. [CrossRef]
- A. Sabat-Tomala, E. Raczko, and B. Zagajewski, “Comparison of support vector machine and random forest algorithms for invasive and expansive species classification using airborne hyperspectral data,” Remote Sens (Basel), vol. 12, no. 3, 2020. [CrossRef]
- M. Hesami and A. M. P. Jones, “Modeling and optimizing callus growth and development in Cannabis sativa using random forest and support vector machine in combination with a genetic algorithm,” Appl Microbiol Biotechnol, vol. 105, no. 12, 2021. [CrossRef]
- C. G. Siji George and B. Sumathi, “Grid search tuning of hyperparameters in random forest classifier for customer feedback sentiment prediction,” International Journal of Advanced Computer Science and Applications, vol. 11, no. 9, 2020. [CrossRef]
- D. Sun, J. Xu, H. Wen, and D. Wang, “Assessment of landslide susceptibility mapping based on Bayesian hyperparameter optimization: A comparison between logistic regression and random forest,” Eng Geol, vol. 281, 2021. [CrossRef]
- M. Daviran, A. Maghsoudi, R. Ghezelbash, and B. Pradhan, “A new strategy for spatial predictive mapping of mineral prospectivity: Automated hyperparameter tuning of random forest approach,” Comput Geosci, vol. 148, 2021. [CrossRef]
- I. S. Al-Mejibli, J. K. Alwan, and D. H. Abd, “The effect of gamma value on support vector machine performance with different kernels,” International Journal of Electrical and Computer Engineering, vol. 10, no. 5, 2020. [CrossRef]
- J. Wainer and P. Fonseca, “How to tune the RBF SVM hyperparameters? An empirical evaluation of 18 search algorithms,” Artif Intell Rev, vol. 54, no. 6, 2021. [CrossRef]
- W. H. Nugroho, S. Handoyo, H. C. Hsieh, Y. J. Akri, Zuraidah, and D. DwinitaAdelia, “Modeling Multioutput Response Uses Ridge Regression and MLP Neural Network with Tuning Hyperparameter through Cross Validation,” International Journal of Advanced Computer Science and Applications, vol. 13, no. 9, 2022. [CrossRef]
- T. Yan, S. L. Shen, A. Zhou, and X. Chen, “Prediction of geological characteristics from shield operational parameters by integrating grid search and K-fold cross validation into stacking classification algorithm,” Journal of Rock Mechanics and Geotechnical Engineering, vol. 14, no. 4, 2022. [CrossRef]
- G. N. Ahmad, H. Fatima, Shafiullah, A. Salah Saidi, and Imdadullah, “Efficient Medical Diagnosis of Human Heart Diseases Using Machine Learning Techniques with and Without GridSearchCV,” IEEE Access, vol. 10, 2022. [CrossRef]
- Z. Chai and C. Zhao, “Enhanced random forest with concurrent analysis of static and dynamic nodes for industrial fault classification,” IEEE Trans Industr Inform, vol. 16, no. 1, 2020. [CrossRef]
- L. Gigović, H. R. Pourghasemi, S. Drobnjak, and S. Bai, “Testing a new ensemble model based on SVM and random forest in forest fire susceptibility assessment and its mapping in Serbia’s Tara National Park,” Forests, vol. 10, no. 5, 2019. [CrossRef]
- A. Murugan, S. A. H. Nair, and K. P. S. Kumar, “Detection of Skin Cancer Using SVM, Random Forest and kNN Classifiers,” J Med Syst, vol. 43, no. 8, 2019. [CrossRef]
- Y. Zhang, D. Xiao, and Y. Liu, “Automatic Identification Algorithm of the Rice Tiller Period Based on PCA and SVM,” IEEE Access, vol. 9, 2021. [CrossRef]
- D. D. Shankar and A. S. Azhakath, “Minor blind feature based Steganalysis for calibrated JPEG images with cross validation and classification using SVM and SVM-PSO,” Multimed Tools Appl, 2020. [CrossRef]
- A. W. Widodo, S. Handoyo, I. Rupiwardani, Y. T. Mursityo, I. N. Purwanto, and H. Kusdarwati, “The Performance Comparison between C4.5 Tree and One-Dimensional Convolutional Neural Networks (CNN1D) with Tuning Hyperparameters for the Classification of Imbalanced Medical Data,” International Journal of Intelligent Engineering and Systems, vol. 16, no. 5, pp. 748–759, 2023. [CrossRef]
- D. Chicco and G. Jurman, “A statistical comparison between Matthews correlation coefficient (MCC), prevalence threshold, and Fowlkes–Mallows index,” J Biomed Inform, vol. 144, 2023. [CrossRef]
- S. Boughorbel, F. Jarray, and M. El-Anbari, “Optimal classifier for imbalanced data using Matthews Correlation Coefficient metric,” PLoS One, vol. 12, no. 6, 2017. [CrossRef]
| Feature Name | Distribution Label | Labels number | Feature Name | Distribution Label | Labels number |
|---|---|---|---|---|---|
| Outcome | [51280, 879] | 2 | Commercial_ALBC | [47355, 4804] | 2 |
| Psychoses | [51999, 160] | 2 | Drain | [38550, 13609] | 2 |
| Alcohol Abuse | [51541, 618] | 2 | Paralysis | [52025, 134] | 2 |
| Coagulopathy | [51802, 357] | 2 | SEX | [34786, 17279] | 2 |
| Solid Tumor without Metastasis | [50089, 2070] | 2 | Non_commercial_ALBC | [30418, 21741] | 2 |
| Peptic Ulcer Disease, excluding bleeding | [49244, 2915] | 2 | Anemia | [51510, 629, 20] | 3 |
| Rheumatoid Arthritis/collagen | [49890, 2269] | 2 | Psychiatric disorder | [51114, 986, 59] | 3 |
| Cancer history | [50001, 1964, 193, 1] | 4 | |||
| Diagnosis | [40786, 7023, 2038, 1310, 906, 96] | 6 | |||
| elx_index | [29700, 9366, 6165, 3474, 1768, 898, 464, 188, 74, 32, 18, 9, 2, 1] | 14 | |||
| cci_index | [35002, 8003, 4343, 2301, 1172, 656, 289, 131, 117, 84, 29, 13, 12, 4, 2, 1] | 16 | |||
| Feature name | Min. | Max. | Var. |
|---|---|---|---|
| CBC_Platelet | 16.1 | 992 | 1509.13 |
| AGE | 12 | 99 | 148.93 |
| LOS | 1 | 72 | 8.35 |
| OP_time_minute | 2 | 1539 | 1030.98 |
| OP_time_hour | 0.03 | 25.65 | 0.29 |
| BUN | 1.8 | 140.67 | 25.76 |
| GOT | 4 | 15643 | 4824.68 |
| GPT | 2 | 506 | 171.28 |
| ALB | 2 | 7.01 | 0.17 |
| Na | 22.1 | 169.32 | 3.07 |
| K | 2.3 | 8.13 | 0.17 |
| UA | 1.1 | 18.74 | 0.8 |
| Actual value | Prediction training | Prediction testing | ||
| Class_0 | Class_1 | Class_0 | Class_1 | |
| Class_0 | 26329 | 9826 | 6512 | 2511 |
| Class_1 | 36 | 575 | 84 | 85 |
| Actual value | Prediction training | Prediction testing | ||
| Class_0 | Class_1 | Class_0 | Class_1 | |
| Class_0 | 22813 | 13342 | 5461 | 3562 |
| Class_1 | 192 | 419 | 65 | 104 |
| Performance measures | Random Forest (RF) | Support Vector Machine (SVM) | ||||||
|---|---|---|---|---|---|---|---|---|
| Benchmark | Best model | Benchmark | Best model | |||||
| Training | Testing | Training | Testing | Training | Testing | Training | Testing | |
| Accuracy | 0.984 | 0.982 | 0.732 | 0.718 | 0.983 | 0.982 | 0.632 | 0.605 |
| Precision | 0.980 | 0.960 | 0.980 | 0.970 | 0.970 | 0.970 | 0.970 | 0.980 |
| Recall | 0.980 | 0.980 | 0.730 | 0.720 | 0.980 | 0.980 | 0.630 | 0.610 |
| F1-score | 0.980 | 0.970 | 0.830 | 0.820 | 0.970 | 0.980 | 0.760 | 0.740 |
| MCC | 0.150 | 0.000 | 0.190 | 0.067 | 0.000 | 0.000 | 0.085 | 0.056 |
| AUC | 0.512 | 0.500 | 0.835 | 0.612 | 0.500 | 0.500 | 0.658 | 0.611 |
About the Authors
 |
Samingun Handoyo received a B.Sc. in Statistics and an M.Sc. in Computer Science from Brawijaya University and Gadjah Mada University, Indonesia. He is an Associate Professor in Science Data at Brawijaya University and a PhD candidate in Electrical Engineering and Computer Science -IGP from National Yang-Ming Chiao Tung University, Taiwan. His research interests include Machine Learning, Statistical Learning, Predictive Modeling, Fuzzy Systems, and Time Series forecasting. He has written two textbooks, The Fuzzy System Implementation with R and The Linear Time Series Analysis Application with R. |
 |
Ying-Ping Chen received the B.S. and M.S. degrees in computer science and information engineering from National Taiwan University, Taiwan, in 1995 and 1997, respectively, and the Ph.D. degree in 2004 from the Department of Computer Science, University of Illinois at Urbana-Champaign, Illinois, USA. He is currently a full professor in the Department of Computer Science at National Yang-Ming Chiao Tung University, Taiwan. His research interests include understanding intelligence via computational mechanisms and from computational perspectives, working principles, and dimensional/facet-wise models in genetic and evolutionary computation. |
 |
Ratno Bagus Edy Wibowo received a B.Sc. in Mathematics from Brawijaya University, an M.Sc. from Bandung Institute of Technology (ITB) in Indonesia, and a Ph.D. in Mathematics from Osaka University, Japan. Currently, he serves as the Dean of the Mathematics and Natural Sciences Faculty of Brawijaya University and Head of Analysis and Geometry Sciences at the Indonesian Mathematical Society (IndoMS). His research interests include Mathematical Analysis and its applications, Nonlinear PDEs, and Modeling and Analysis with mathematical approaches. |
 |
Agus Wahyu Widodo received a bachelor's degree in electrical engineering from the Faculty of Engineering, Brawijaya University, and a master's degree in computer science from Gadjah Mada University. He currently serves as the vice dean for general administration, finance, and resources at the computer science faculty at Universitas Brawijaya. He is also active as a researcher in the intelligent computing laboratory at the same faculty: his research concerns optimization, machine learning, and digital image processing. |
Disclaimer/Publisher’s Note: The statements, opinions and data contained in all publications are solely those of the individual author(s) and contributor(s) and not of MDPI and/or the editor(s). MDPI and/or the editor(s) disclaim responsibility for any injury to people or property resulting from any ideas, methods, instructions or products referred to in the content. |
© 2024 by the authors. Licensee MDPI, Basel, Switzerland. This article is an open access article distributed under the terms and conditions of the Creative Commons Attribution (CC BY) license (http://creativecommons.org/licenses/by/4.0/).


