Preprint
Article

Pore Characteristics of Hydrate-Bearing Sediments from Krishna-Godavari Basin, Offshore India

Altmetrics

Downloads

81

Views

24

Comments

0

A peer-reviewed article of this preprint also exists.

This version is not peer-reviewed

Submitted:

19 August 2024

Posted:

20 August 2024

You are already at the latest version

Alerts
Abstract
Interpore hydrates are the main occurrence forms of marine gas hydrates. Pore characteristics are a vital factor affecting the thermodynamic properties of hydrates and their distribution in sediments. Currently, the characterization of the pore system for hydrate-bearing reservoirs are little reported. Therefore this paper focus on the Krishna-Godavari Basin, via varies methods to characterize the hydrate-bearing sediments in the region. The results showed that X-ray Diffraction(XRD) combined with Scanning Electron Microscope (SEM)and Cast Thin Section (CTS) can better characterize the mineral composition in the reservoir, High Pressure Mercury Injection (HPMI) focused on the contribution of pore size to permeability, Constant Rate Mercury Injection(CRMI) had the advantage of distinguishing between pore space and pore throat, and Nuclear Magnetic Resonance Cryoporometry (NMRC) technique can not only obtain the pore size distribution of nanopores with a characterization range greater than Nitrogen Gas Adsorption (N2GA), but also quantitatively describe the trend of fluids in the pore system with temperature. As for pore system, Samples 58 and 68 all developed nanopores, the mineral distribution was relatively scattered, and they were rich in paleontological shells such as foraminifera, among which Sample 68 had more pyrite content, and abundant pyrite framboid was observed, which made the intergranular pore develop and provide more nanopores. Sample 58 has a high concentration of pore and throat, high pore connectivity, low pore curvature, and pores with a diameter of 10μm contributing to the main permeability, with an average pore radius of 2.495μm, whereas Sample 68 has poor pore connectivity, high curvature, and pores with a diameter of 1μm contributing to the main permeability, with an average pore diameter of 60 nm, which explains the obvious difference in permeability between the two samples.
Keywords: 
Subject: Environmental and Earth Sciences  -   Oceanography

1. Introduction

As an important natural gas resource, hydrate-bearing sediment reservoirs have attracted extensive attention in recent years. Due to their unique physical and chemical properties, the microscopic pore structure of hydrate-bearing sediments has a decisive impact on their reserves and exploitation efficiency [1,2,3]. Interpore hydrate is the main storage form of marine gas hydrate, and pore features are important factors affecting the thermodynamic properties of hydrate and its distribution in sediments, and pore diameter, pore size distribution, pore connectivity, and physicochemical properties of pore surface are the key factors determining the formation, decomposition and migration of hydrate [4,5,6,7].
However, the extraction and utilization of gas hydrates faces several technical challenges, one of which is the in-depth understanding and characterization of the microscopic pore structure of the reservoir. In addition, the properties of the reservoir (e.g., permeability, porosity, organic matter content, mineral composition, etc.) also have a significant impact on the formation and distribution of hydrates [8,9]. Limited to characterization methods, the characterization of microscopic pore structure systems of hydrate-bearing sediment reservoirs is rarely reported. Due to the complex pore structure and variable reservoir conditions, how to accurately characterize microscopic pores has always been a research problem in this field. Therefore, this study focuses on the sediment system characterization of the KG Basin in the gas hydrate-bearing region of India.
The Krishna-Godavari (KG) Basin in India is one of the world's largest gas hydrate deposits, with low permeability and high saturation reservoir characteristics, making hydrate extraction and utilization challenging [10,11,12]. The study of the characteristics of the reservoir, especially the study of the microporous structure, not only helps to better understand the storage state of hydrates, but also provides an important theoretical basis for subsequent exploration technology, which is essential for the effective development and utilization of hydrate resources.
Scholars have used HPMI and N2GA methods to characterize the porosity of the KG Basin [13,14]. Daigle et al. used the HPMI method to study the microporous system of hydrate-bearing sediments in the Kumano Basin, offshore Japan, and found that micron-scale pores caused 64% of the observed MHSZ basal uplift through the Gibbs-Thomson effect, showing the extent to which pore size affects MHSZ thickness, indicating the importance of considering lithology and pore structure when assessing stability conditions for methane hydrates in marine sediments. In other study, Daigle et al. performed nitrogen adsorption (N2GA) experiments to determine the PSD of nanoscale pores by BJH model and merge them with HPMI data, the results showed that the micropore content (pore size less than 2 nm) was mainly affected by mineralogy, and the diagenesis process also had a certain influence, and the micropore content was mainly determined by the abundance of detrital clay and the development process of clay as an ash alteration product, and the amorphous silica cement precipitated in areas with abnormally high porosity also had a certain effect.
However, there is no systematic study on the microscopic porosity of hydrate-bearing sediment reservoirs in the KG Basin, and the characterization methods used are too homogeneous, and the applicability of other methods in the characterization of hydrate-bearing reservoirs is not clear. Due to the complexity and particularity of the geological conditions of the hydrate-bearing sediment reservoirs in the KG Basin, there are still many challenges in the in-depth research and effective development and utilization of the reservoirs.
In order to overcome the above shortcomings and better understand the microscopic pore structure of hydrate-bearing sediment reservoirs, this study took the hydrate-bearing reservoirs in the KG Basin as the research object, explored the applicability of various characterization techniques, compared the advantages and limitations of qualitative and quantitative characterization techniques, analyzed the microporous structure and heterogeneity of hydrate-bearing sediment. This study not only helps to deepen the understanding of the micropores of hydrate-bearing reservoirs, but also provides a scientific basis for the characterization of hydrate-bearing reservoirs in other regions, and provides an important reference for parameter setting and the exploration and exploitation of hydrates, which will promote the further development of the research field of hydrate-bearing reservoirs.

2. Geological Background

The Krishna-Godavari Basin is a sedimentary basin in the India subcontinent whose formation is closely related to the collision of the India Plate with the Eurasian Plate and subsequent tectonic activity. Over the course of its geological history, the KG Basin has undergone numerous transgressions and retreats, resulting in a variety of sedimentary facies zones and sedimentary systems. The interior of the basin is mainly composed of Paleozoic and Mesozoic sedimentary strata, which are rich in organic matter, which provides a material basis for oil and gas generation. Changes in sedimentary facies zones and sedimentary systems not only control the formation and aggregation of hydrocarbons, but also affect the development of reservoirs and caprocks. In addition, tectonic activity in the KG Basin has also had a significant impact on the migration and accumulation of hydrocarbons. Tectonic morphologies such as faults and folds in the basin provide channels for hydrocarbon migration and a favorable site for hydrocarbon accumulation [15,16,17,18,19].
Samples for this study were obtained from the KG basin offshore India, which is located on the east coast of India and extends 500 km laterally and more than 200 km from the coast to the deep sea. The basin covers an area of 70,000 km2, mostly alluvium, and 42,000 km2 of offshore, mainly in the Bay of Bengal. India has launched a National Gas Hydrate Project (NGHP) in the KG basin and discovered one of the richest marine gas hydrate aggregates, NGHP-01, with samples from station 01-10D (10X, cc), which is located between 15°-16°N latitude and 81°-82°E longitude [2,10,11,15,20].

3. Samples and Methodology

3.1. Sample Information

The hydrate-bearing sediments in the KG Basin are mainly composed of fine-grained sediments, and the particle size, composition, and distribution characteristics of the sediments are affected by a variety of factors, including tectonic activities within the basin, sedimentary environment, and sea level changes.
Experimental samples were taken from station NGHP01-10-10D, after drilling and coring, the core sediments are preserved in liquid nitrogen tanks, and the sediments were mainly stripped from the Quaternary mudstones, grain size analysis showed that the grain size of the sediments was mainly sandy and silty, the color of the sediment is predominantly black to grayish-black.

3.2. Experiments

The experimental process first formed a preliminary understanding of the physical characteristics of the reservoir by casting thin sections, X-ray diffraction (XRD) and particle size analysis, and obtained the specific data of the minerals in the reservoir, and then carried out field emission scanning electron microscopy (FESEM) an CTS method to obtain the 2D plane and 3D distribution of the pore and pore throat of the sample, to study the microscopic mechanism of the pore. Finally, on this basis, the NMRC method was tried to quantitatively characterize the nanoscale pores combined with N2GA, and the applicability, advantages and limitations of the two methods were compared through experimental data. HPMI and CRMI were used to quantitatively characterize the distribution characteristics of pores and throat.

3.2.1. XRD

Different mineral crystals correspond to different XRD patterns, and the intensity of the characteristic peaks in the spectrum is positively correlated with the mineral content in the sample, and the quantitative analysis is based on the "K-value method" [2,21,22].
The experiments were performed using the Netherlands PANalytical Empyrean Ray Diffractometer and the PIXcel1D-Medipix 3 detector with a scan step of 0.01° and copper K-α radiation. The measured XRD patterns were analyzed using MDI Jade software based on the SY/T 5163-2018 reference standard.

3.2.2. CTS and SEM

Cast Thin Sections were cast using dye resins and then observed using a microscope to determine pore types and pore morphological characteristics at the micrometer scale.
Electron microscope samples are glued to the sample stage using electrostatic glue, gold plated on a fresh plane of the sample using an ion-sputtering instrument, then analyzed using SEM to characterize pore types and morphology at the nanoscale [23,24].

3.2.3. NMRC

The pore size affects the freezing point of the liquid in porous media, which can be quantitatively expressed by the Gibbs-Thomson equation [25,26,27,28,29].
The relationship between the melting point depression temperature ( Δ T m ) and pore diameter (x) is as follows:
Δ T m = T m T m x = 4 σ T m x ρ H
Where x: diameter of the equivalent spherical pore, nm; Δ T m :liquid melting point depression, K; Δ T m : melting point of the bulk material, K; T m x : melting point of a crystal, K; H : bulk enthalpy of fushion, J/g; ρ : density of the solid, g/cm3; σ : solid-liquid surface, N/m.
Generally, the σ , T m , ρ and H can be regarded as constant; therefore, Eq.(1) can be written:
Δ T m = k G T x
Where k G T : Gibbs-Thomson constant, nm·K.
The formula with pore volume is given below:
P x = d v x d x = d v x d T m x × d T m x d x = d v x d T m x × k G T x 2
The log differential PSD is calculated as follows:
d v x d log D = d v x d x × d x d log D = P x · x · ln 10
Where x is the pore diameter, v is the volume of the probe liquid, and T is the temperature.
The NMRC method is to record the phase transition process of hydrogen-containing fluids in porous media with temperature by NMR signals, and the increase in the signal of low-temperature liquids means that the pore volume is accumulated from small to large. In this research, experiments were performed using the NMR MesoMR23-060V-1, choose water as liquid probe with a temperature range of -30°C to 25°C.

3.2.4. HPMI

The experiment was based on the Chinese Oil and Gas Industry Standard (GB/T) 29172-2012 and (GB/T) 29171-2012 using a Micromeritics Auto Pore IV 9505 mercury injection meter with a mercury injection pressure range of 0-200 MPa.
The structural characteristics of the pore and throat were analyzed according to the Washburn equation, and the mercury injection pressure curve was transformed by [30]:
P c = 2 σ cos θ r
Where P c : capillary pressure, MPa; θ: wetting angle, θ = 140◦; σ : surface ten sion, N/m, σ = 0.48 N/m.

3.2.5. CRMI

The experiment used ASPE730 system to monitor mercury injection with the maximum injection pressure of 900 psi and the constant rate of mercury injection velocity of 0.0001 mL/min, the pores and throats identified by pressure fluctuations during mercury injection.

3.2.6. LP-N2GA

The samples were prepared as powders (60-80 mesh), dried to remove residual liquid from the pores, degassed for 12 hours at room temperature. Then using the Mecromeritics ASAP 2460 device, at the temperature of liquid nitrogen, the pressure was increased to achieve the saturated vapor pressure of the liquid nitrogen, and then the pressure was lowered to obtain the nitrogen adsorption-desorption curve.
The analysis of the specific surface area (SSA) and pore size distribution (PSD) is based on Brunnauer-Emmett-Taylor (BET) and Barrett-Joyner-Hallenda (BJH) theories [31,32,33].

4. Results and Discussion

4.1. Mineral Compositions that Make up the Pores
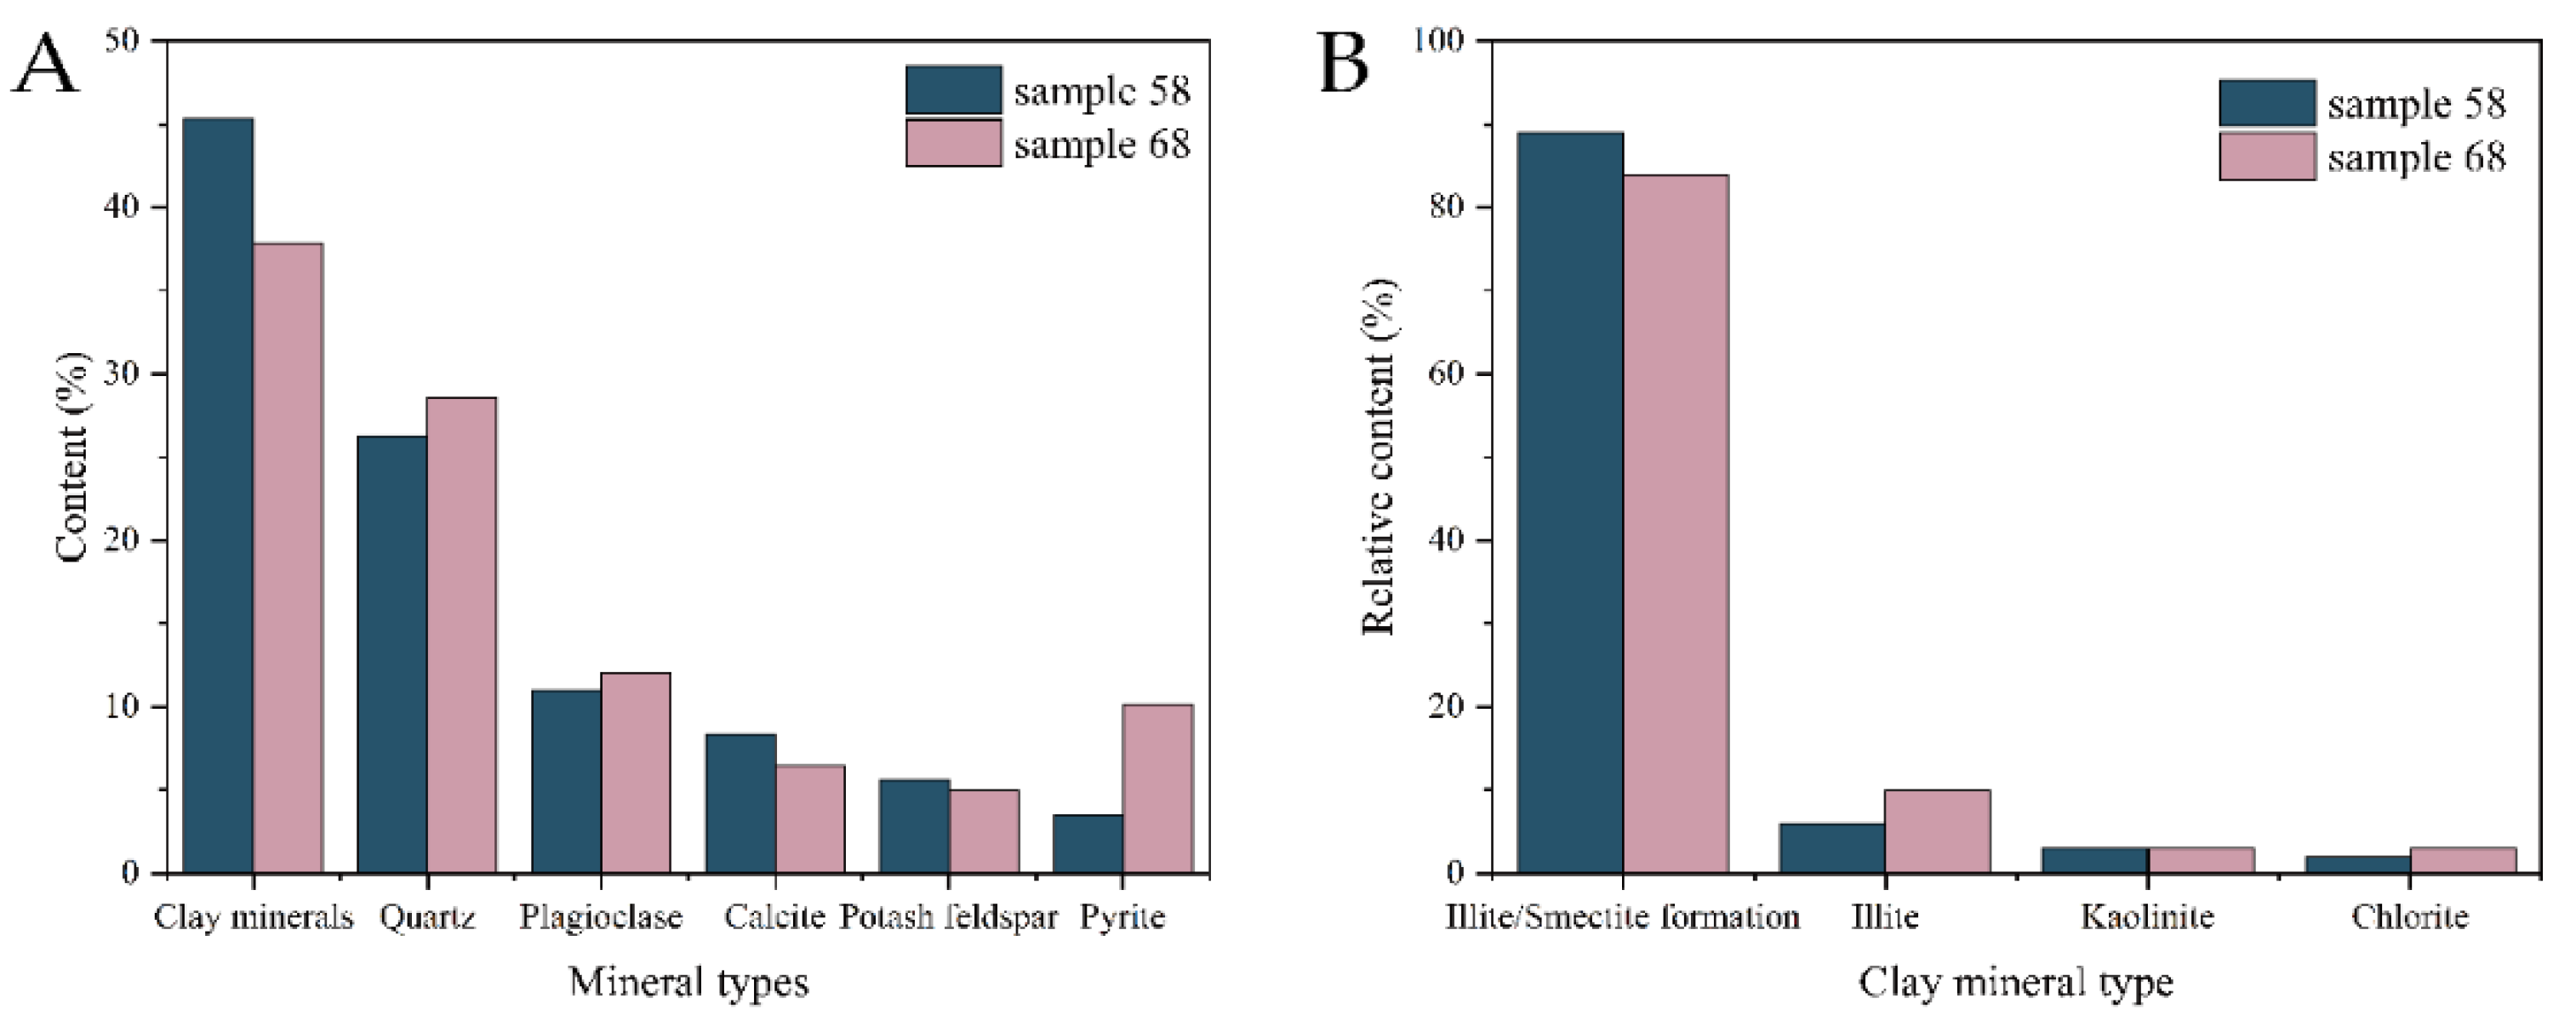
The study shows that the samples from the KG basin mainly contained quartz, feldspar, calcite, pyrite and a large number of clay minerals (Figure 1). The clay minerals content is the highest, with 45.3% and 37.9% in samples 58 and 68, respectively. Clay minerals are widely developed in the illite/smectite mixed layer, with minor amounts of illite, kaolinite, and chlorite. In addition to clay minerals, quartz content was higher, with samples 58 and 68 containing 26.3% and 28.6% respectively. Pyrite was also observed in the samples collected from KG Basin, with Sample 68 having a higher percentage of pyrite at 10.1%, which may account for high magnetic induction intensity observed here.
Figure 1. Comparison of major mineral content in Samples 58 and 68. A: Mineral types; B: Clay mineral types.
Preprints 115611 g001
Figure 2. Pie charts of mineral content in Samples 58 and 68 (a, Sample 58; b, Sample 68). A: Mineral content of Sample 58; B: Mineral content of Sample 68.
Preprints 115611 g002
Figure 3. Pie charts of clay mineral content in Samples 58 and 68 (a, Sample 58; b, Sample 68). A: Clay mineral content of Sample 58; B: Clay mineral content of Sample 68.
Preprints 115611 g003
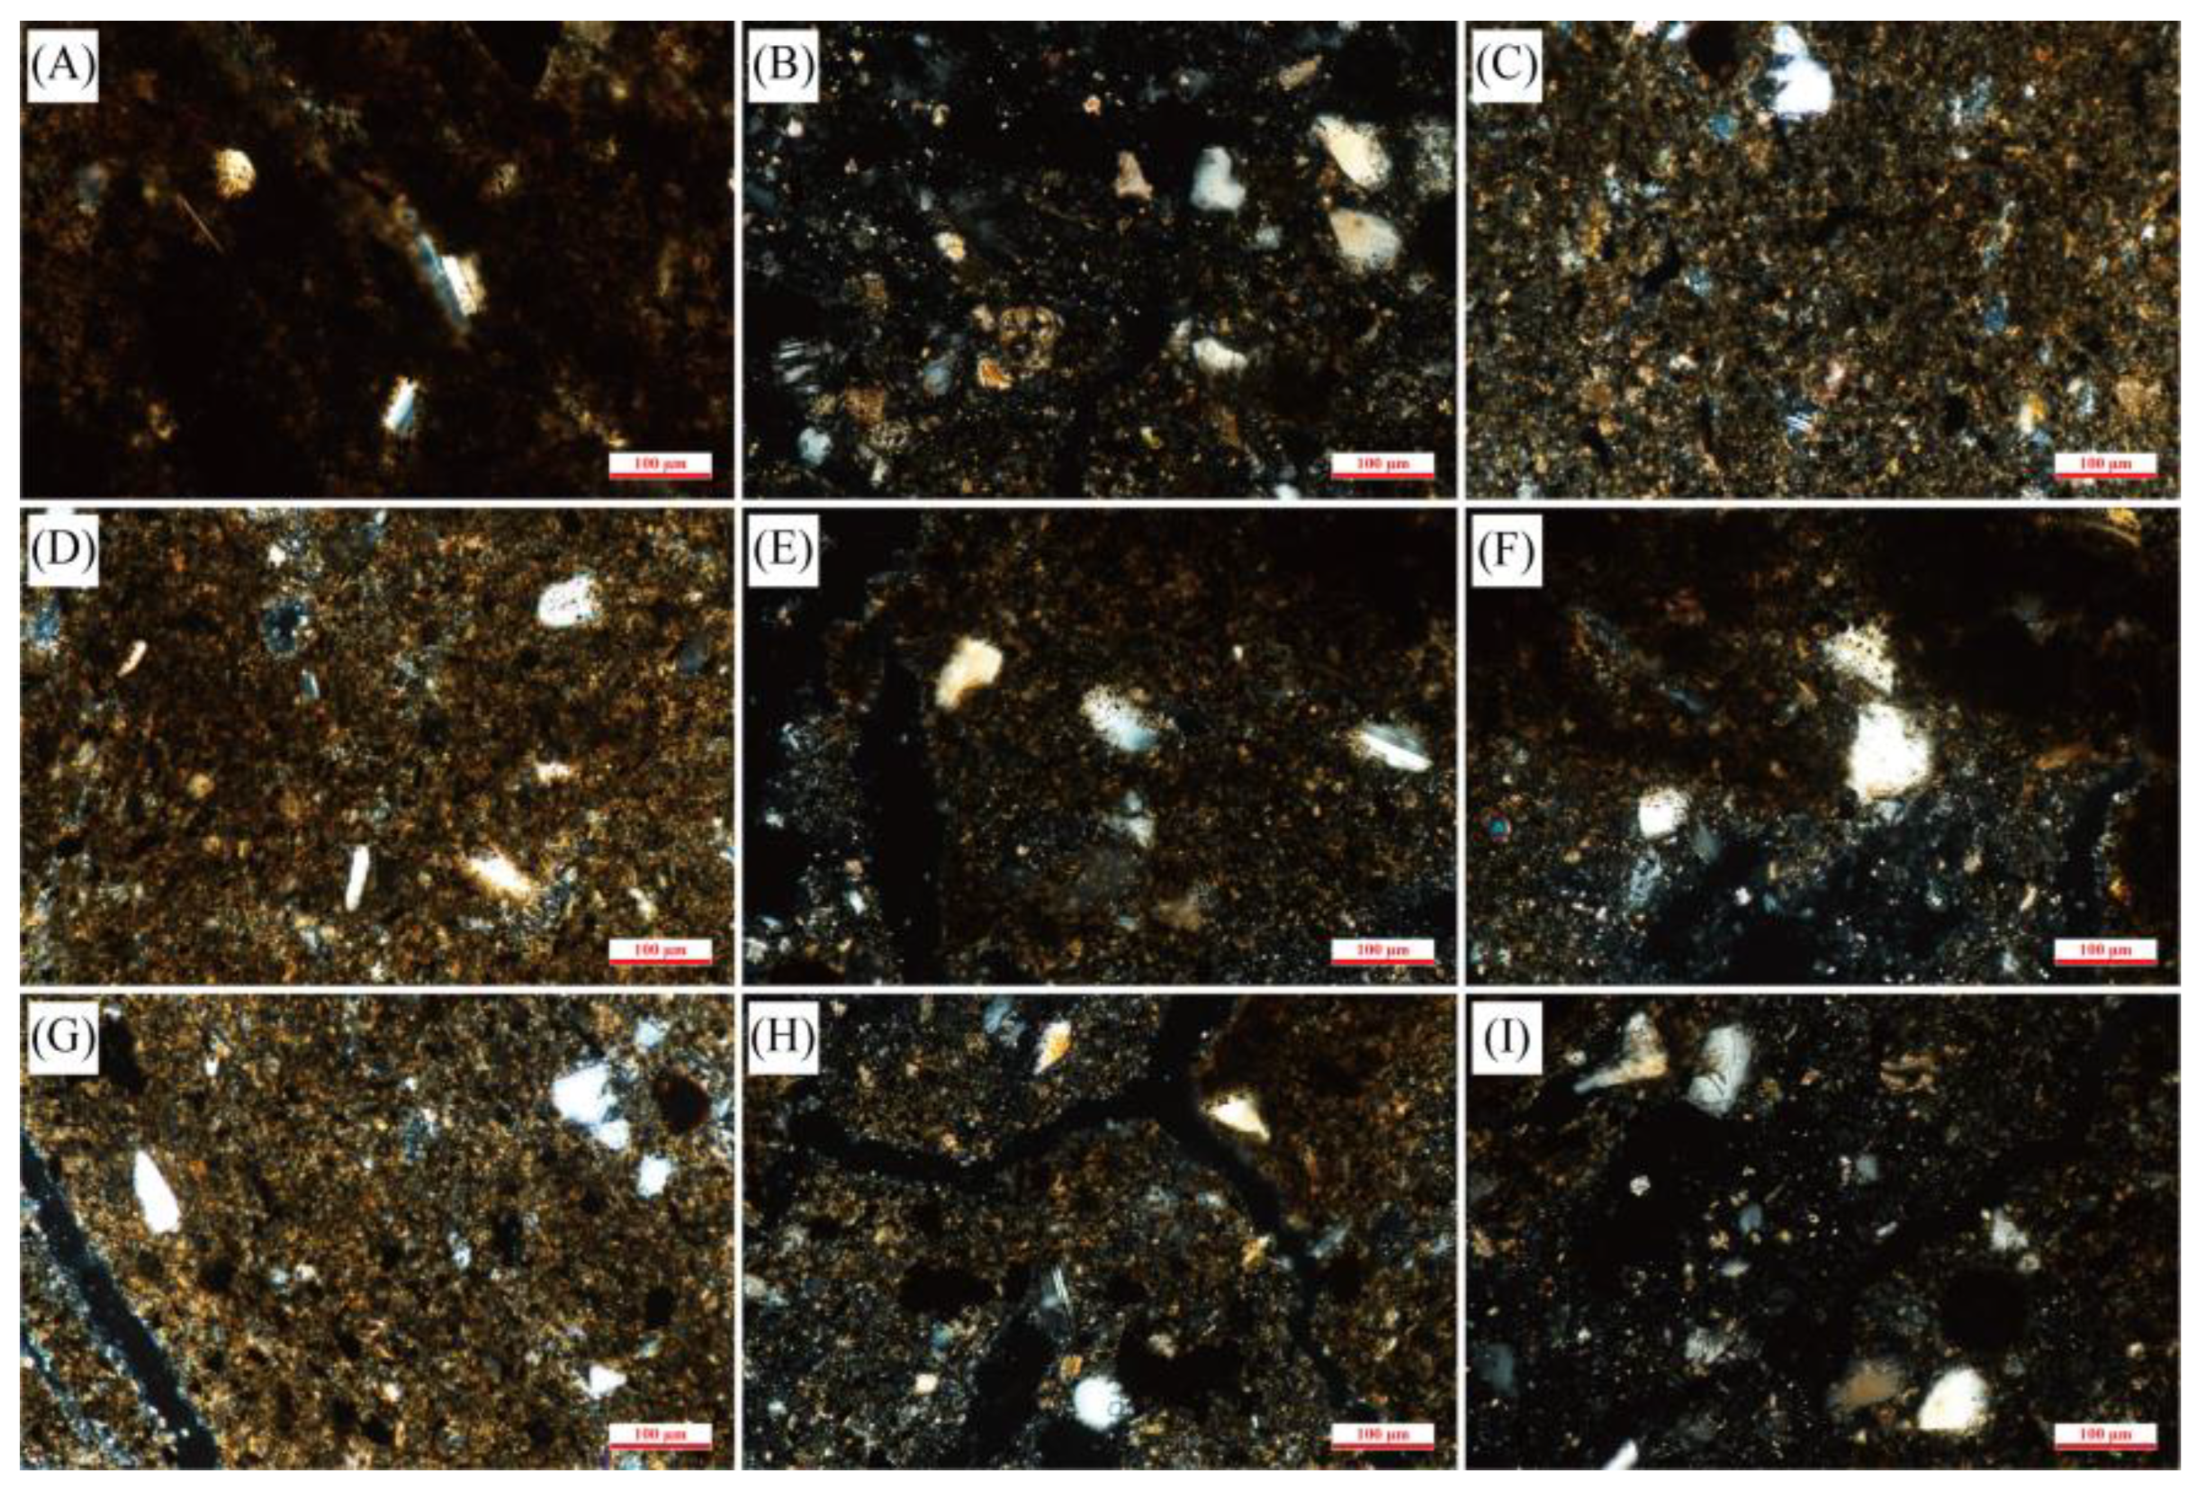
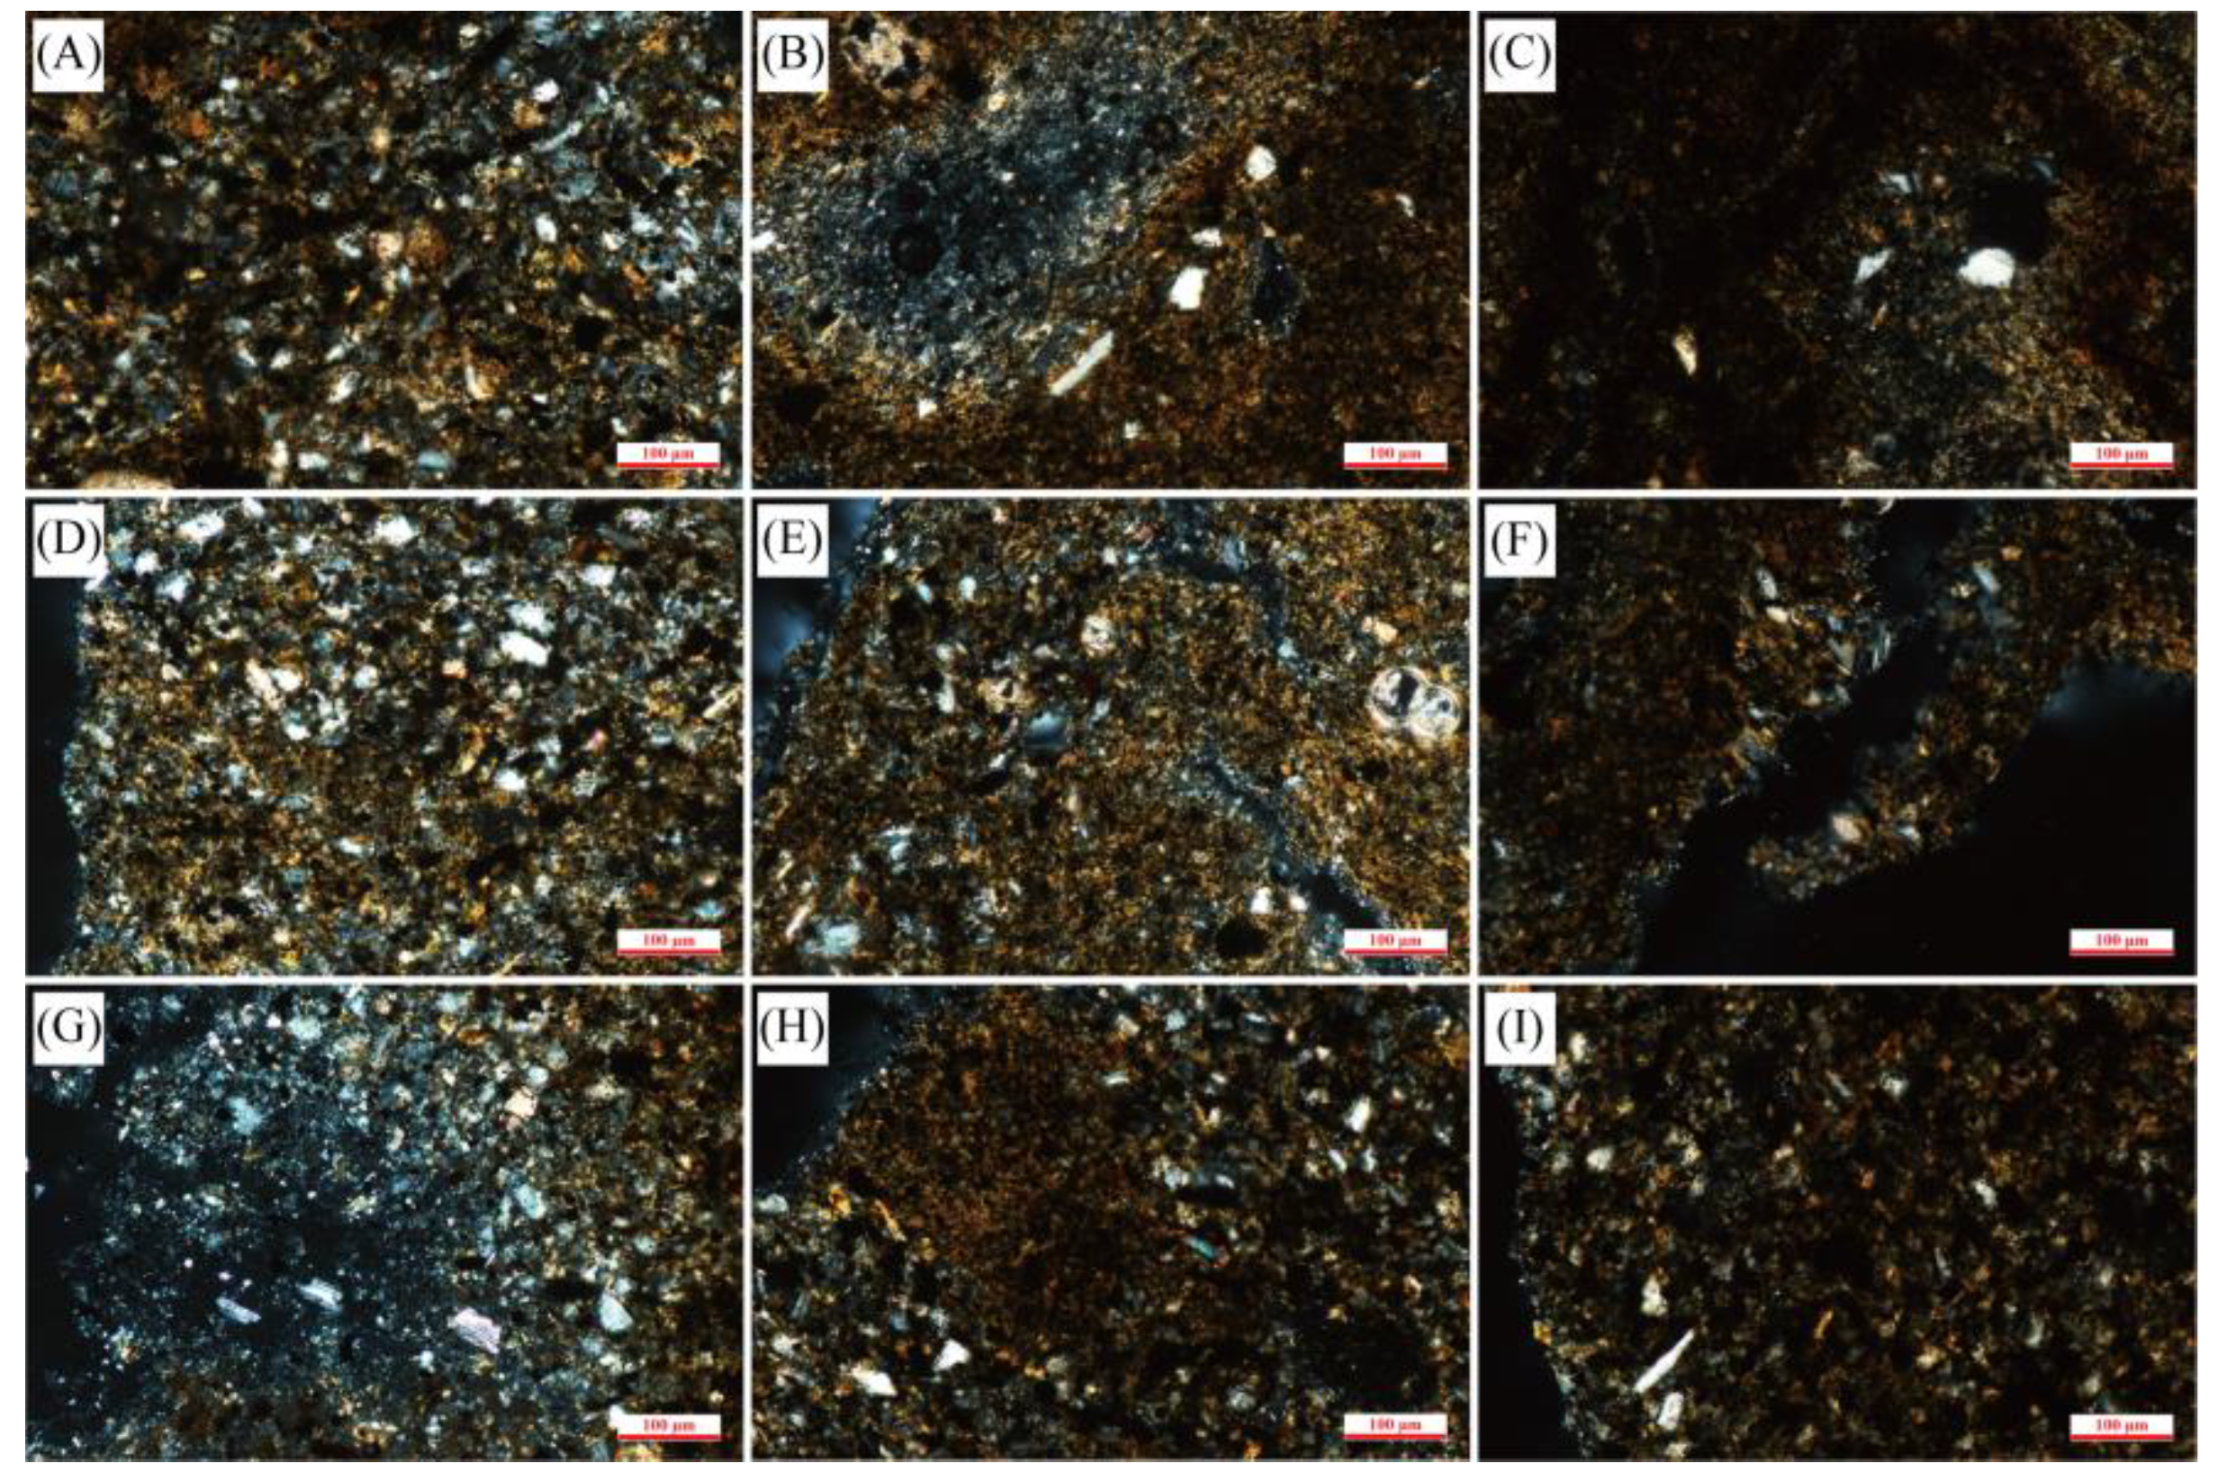
Microscopic images of CTS show that the distribution of detrital minerals in both samples is relatively dispersed, with quartz and feldspar minerals dominant. The particle sizes of the mineral grains are of micrometer scale, with none exceeding 100μm.
Figure 4. Microscopic observation of the mineral distribution in the CTS in Sample 58.
Preprints 115611 g004
Figure 5. Microscopic observation of the mineral distribution in the CTS in Sample 68.
Preprints 115611 g005

4.2. Pore and Throat Types, Geometry

Microscopic observation of the sample revealed the presence of intergranular pores, intragranular pores, and microfractures (MFs). Microfractures consist of intergranular fractures (InterFs) and intragranular fractures (IntraFs).

4.2.1. Intragranular pore

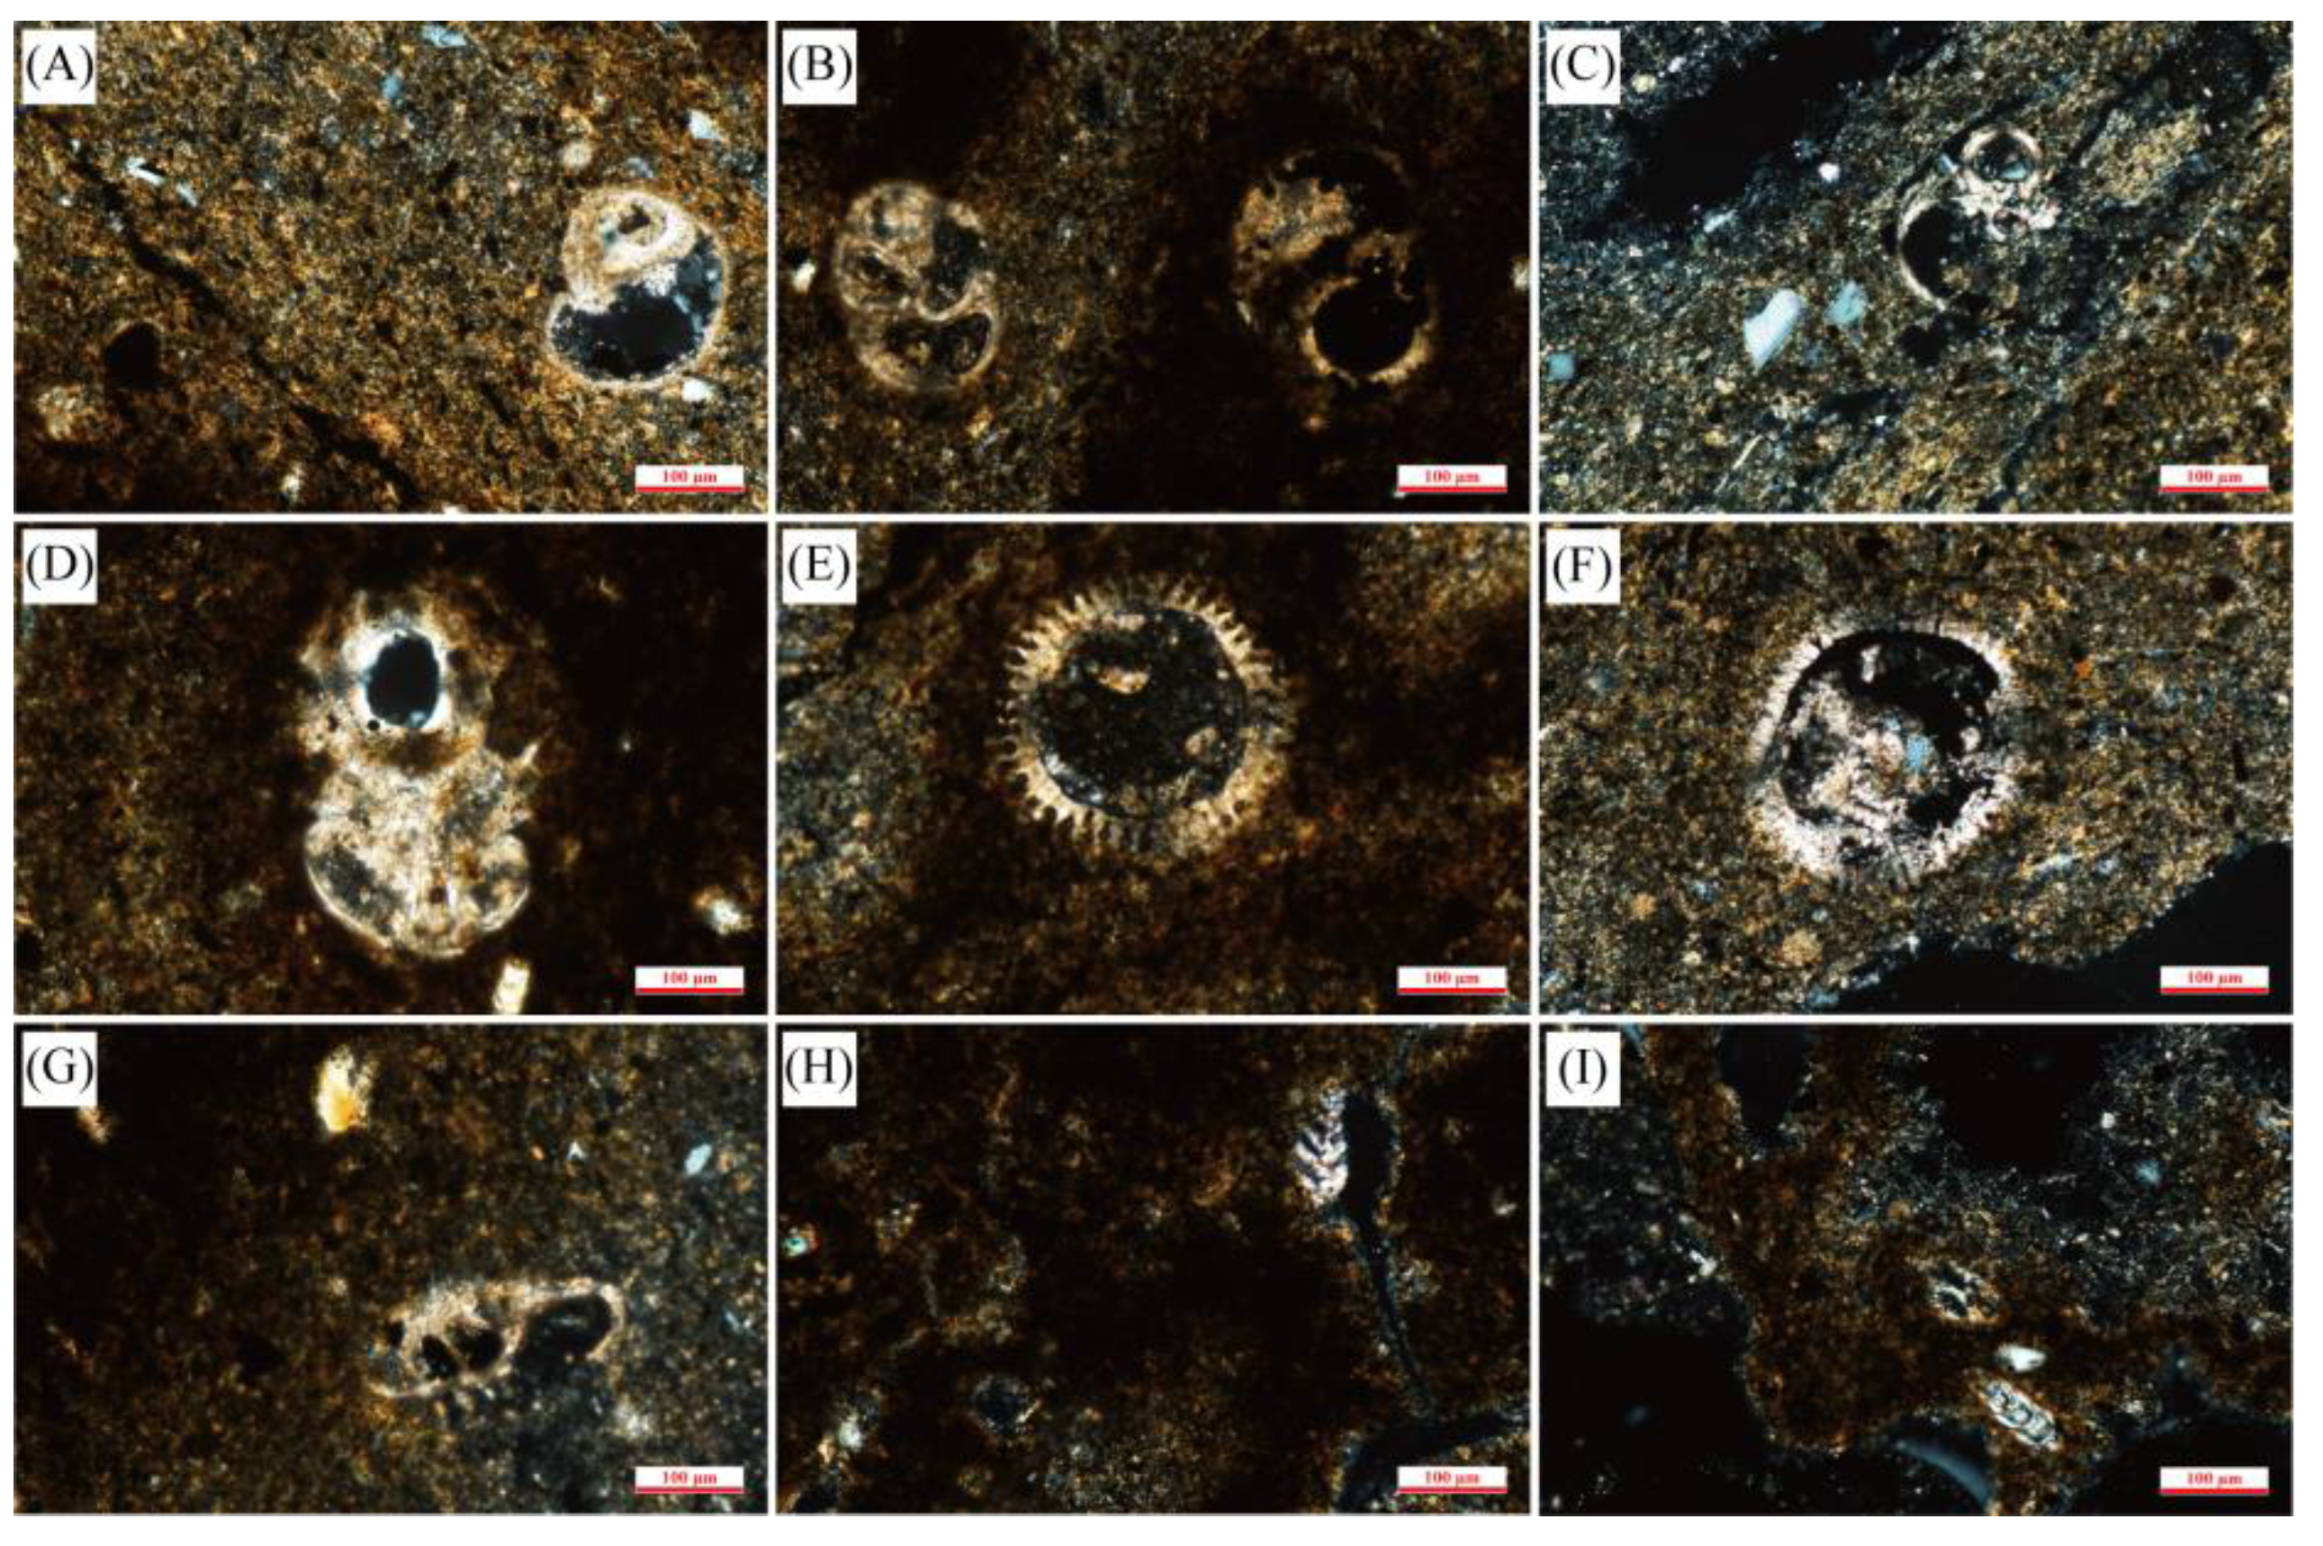
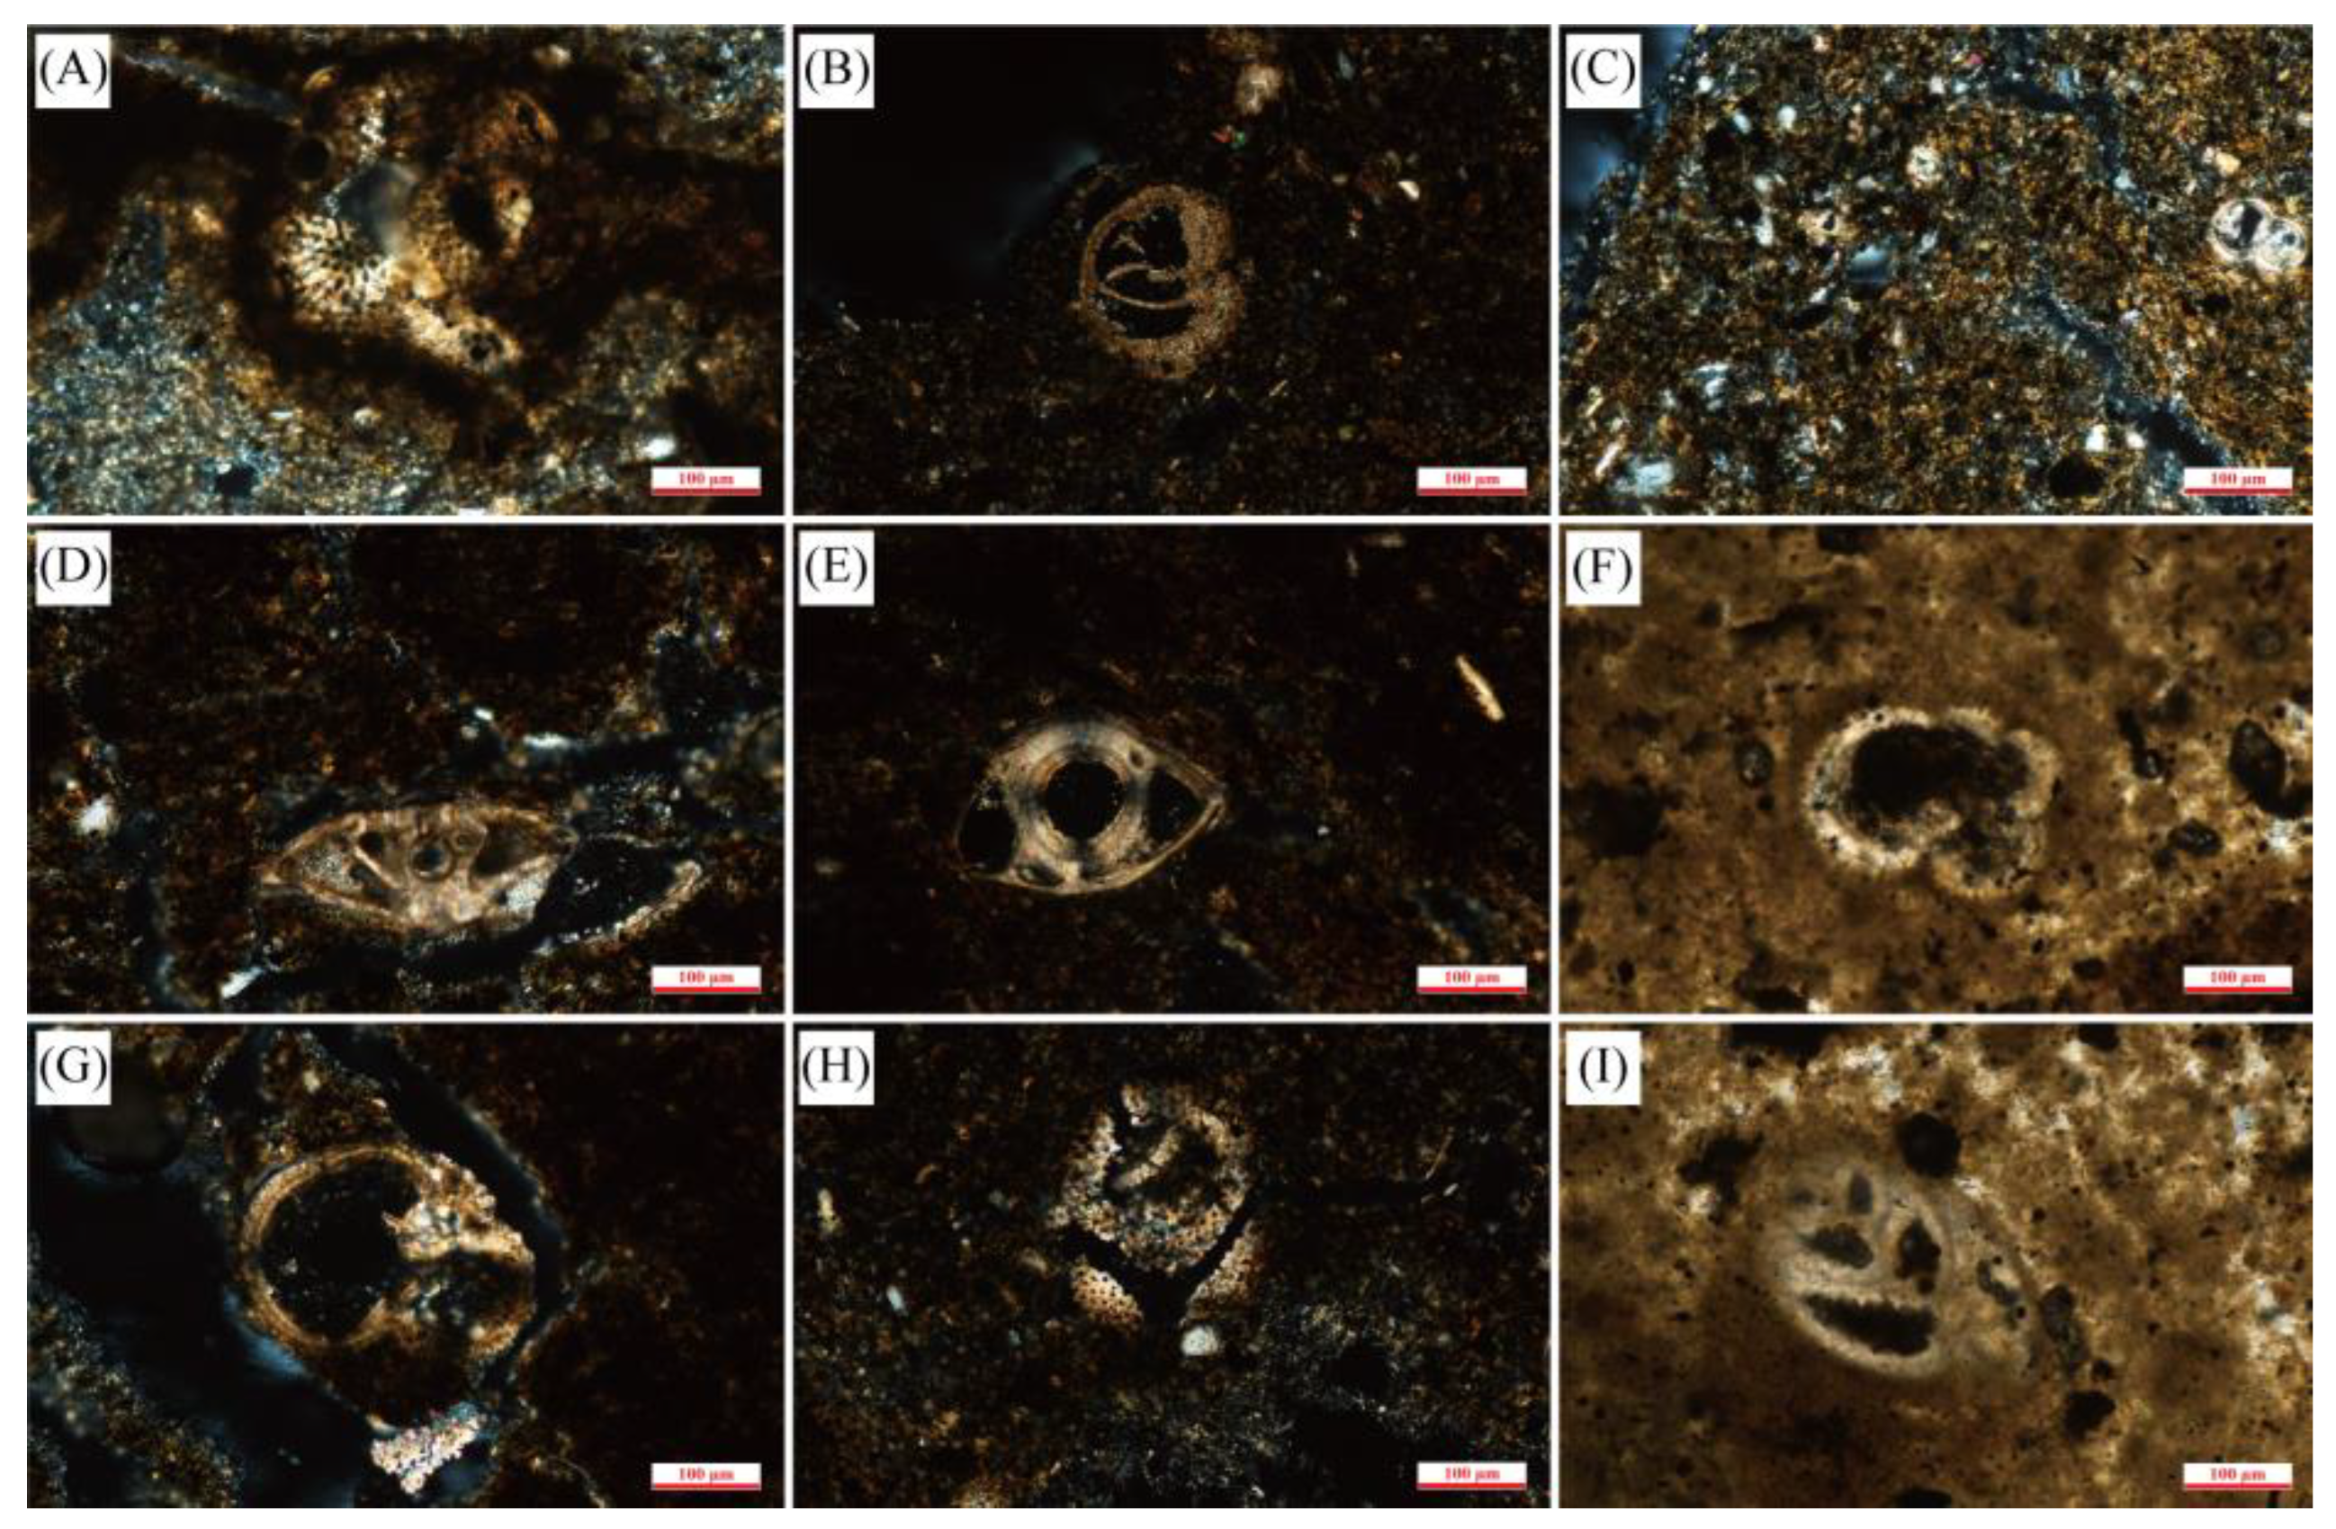
In terms of micropores, the biodetritus such as shells of different species of foraminifera and algae were observed from CTS, with more complete preservation of the contours, and intact chambers could be seen in the foraminifera. The broken foraminifera shells were filled with minerals and organic matter.
Of course, this method has certain limitations. Mechanical polishing of sample pretreatment will cause irregular surface morphology and difficulty distinguishing pseudo-pores from true pores. Moreover, grinding particles can easily enter the actual pore area, resulting in the true pore being buried or obscured.
Figure 6. Microscopic observation of foraminiferal shells and diatom shells in CTS in Sample 58.
Preprints 115611 g006
Figure 7. Microscopic observation of foraminiferal shells and diatom shells in CTS in Sample 68.
Preprints 115611 g007

4.2.2. Intergranular Pore

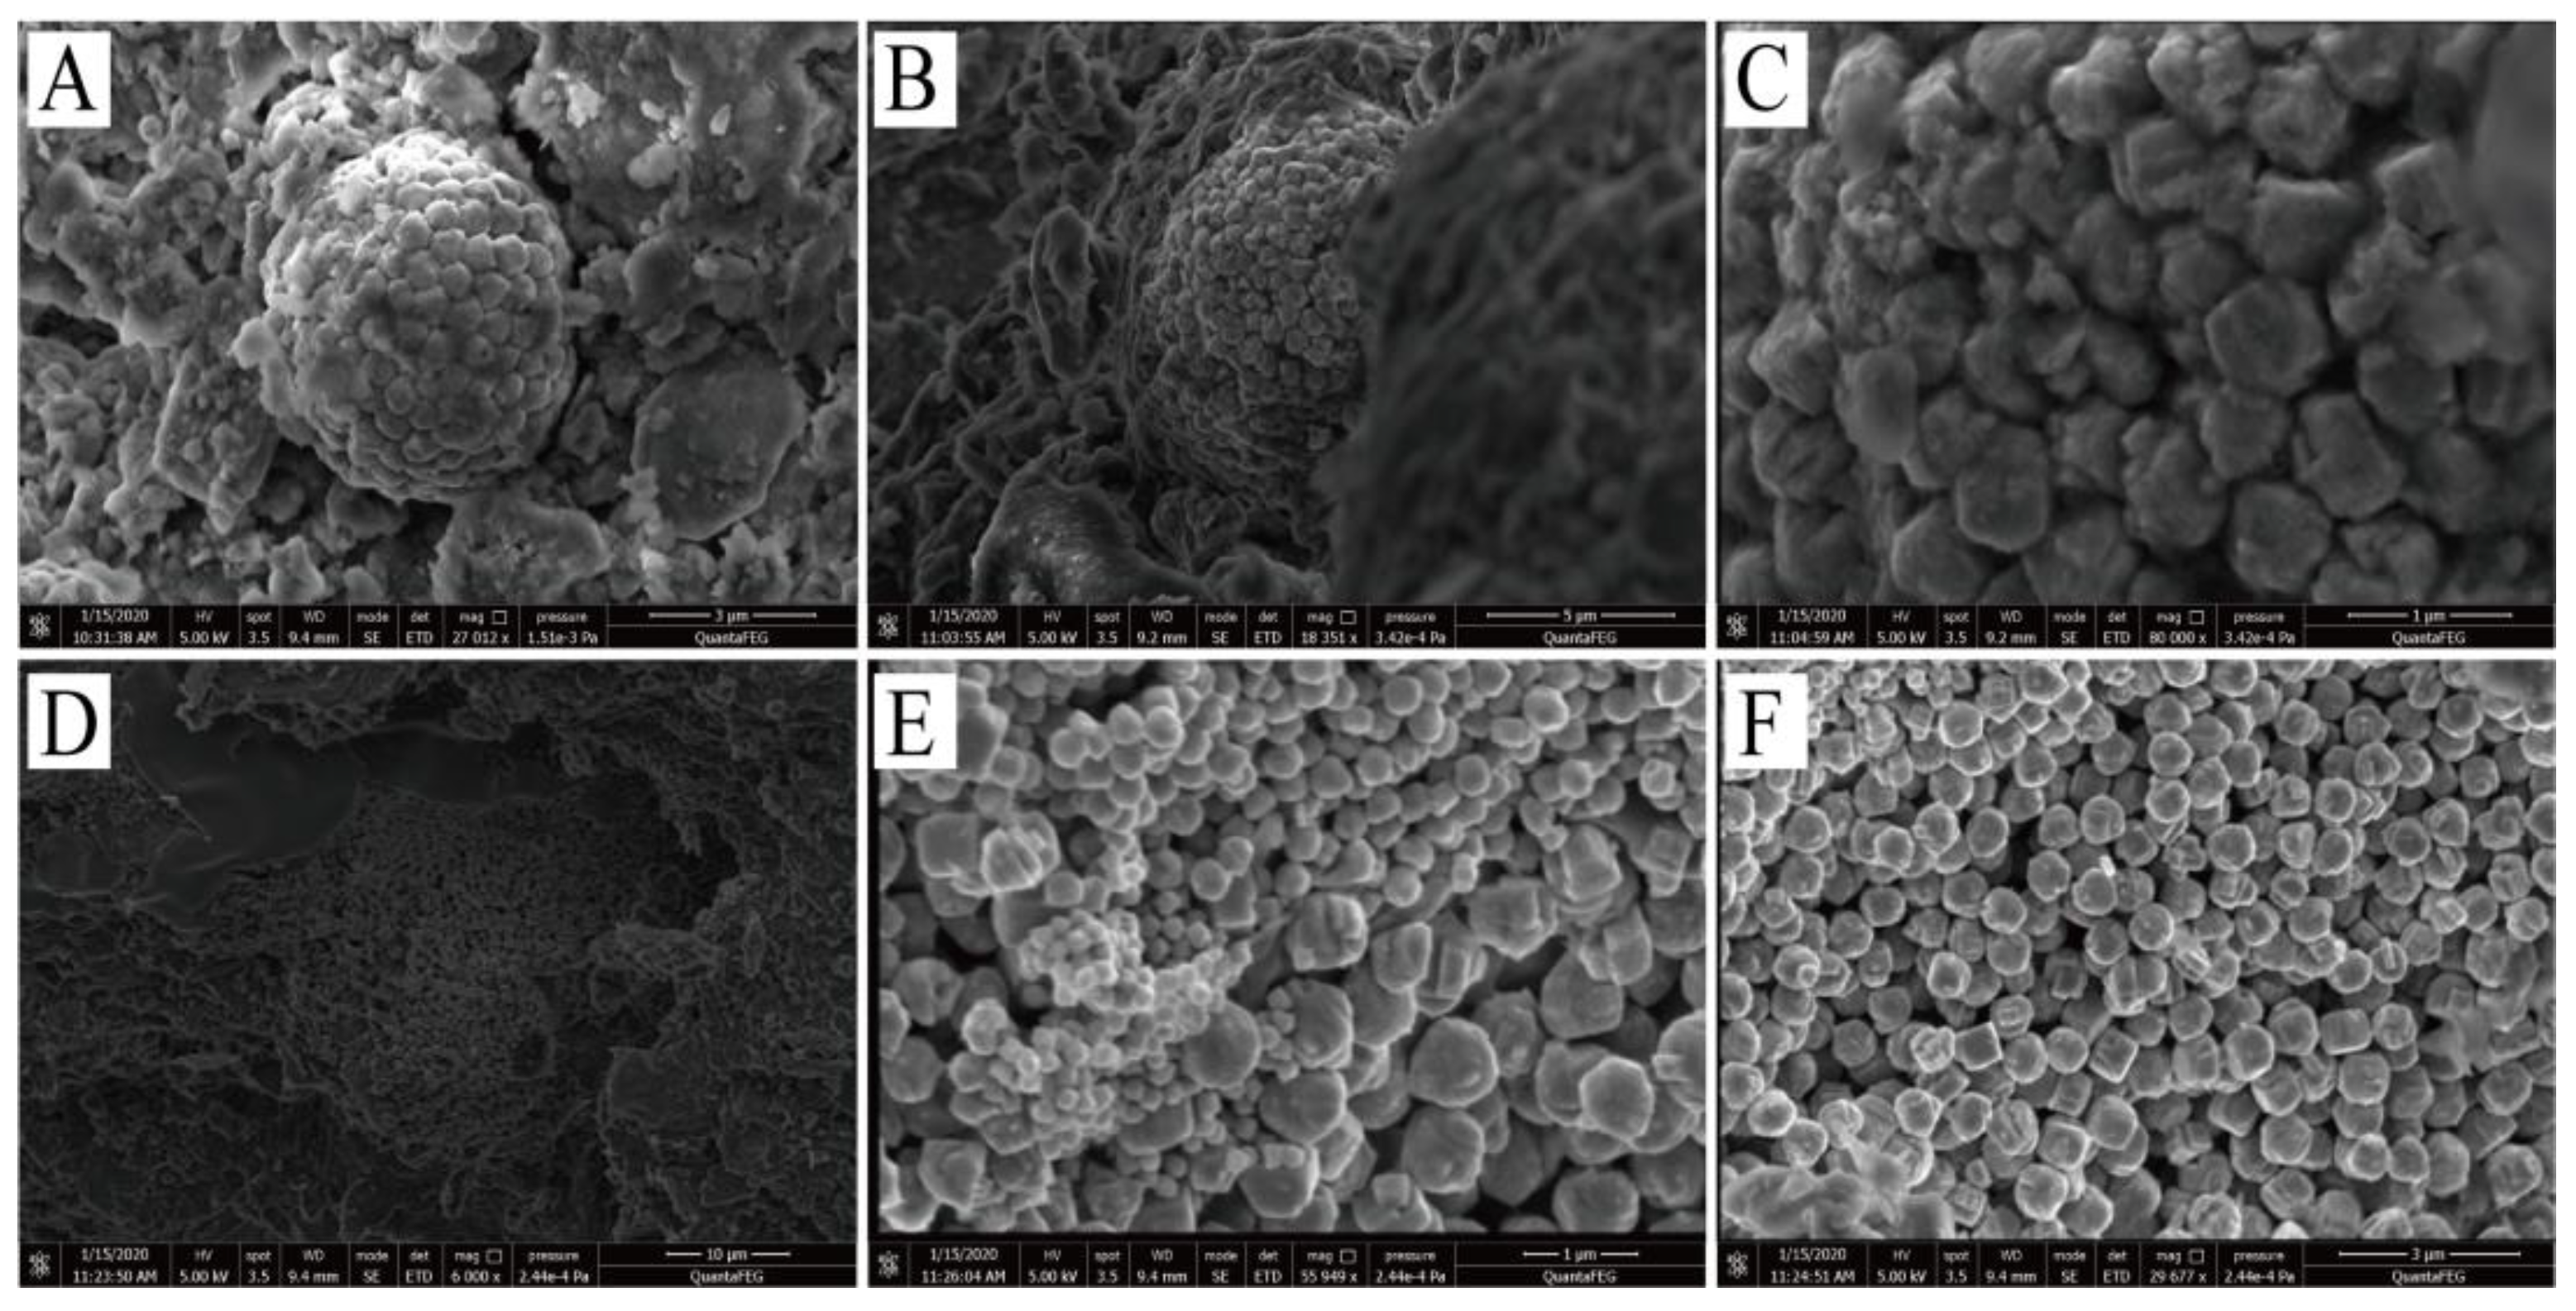
Intergranular pores within the pyrite framboids were observed in SEM experiments on the nanoscale, accumulated particles were about 500 nm in diameter and uniform in size, mostly block hexahedral. Except pyrite framboids, pyrite mineral aggregates and intergranular pores were developed in the samples, which were contiguous and diffuse, and coexisted with clay minerals. The diameter of the pyrite grains in the aggregates varies widely, with most pyrite particles being around 600-800 nm in diameter and smaller pyrite particles of 70-250 nm in diameter stacked together.
As for other minerals, illite is filled around mineral particles such as quartz and feldspar in the form of needles, flakes and networks, the mineral particles and aggregates are stacked with each other to form a large number of micron-sized intergranular pores with complex morphologies. Kaolinite is pseudo-hexagonal plate and worm-like, with a large number of intergranular pores. Rigid and brittle particles such as feldspar and quartz are accompanied by micro-cracks, and the width of the cracks are mostly 1-3μm, surfaces are smooth and cracks are straight, the extension distance is relatively far. Meanwhile, intragranular dissolved pores are observed in calcite.
Figure 8. SEM observation of pyrite framboids in Sample 68.
Preprints 115611 g008

4.2.3. Crack

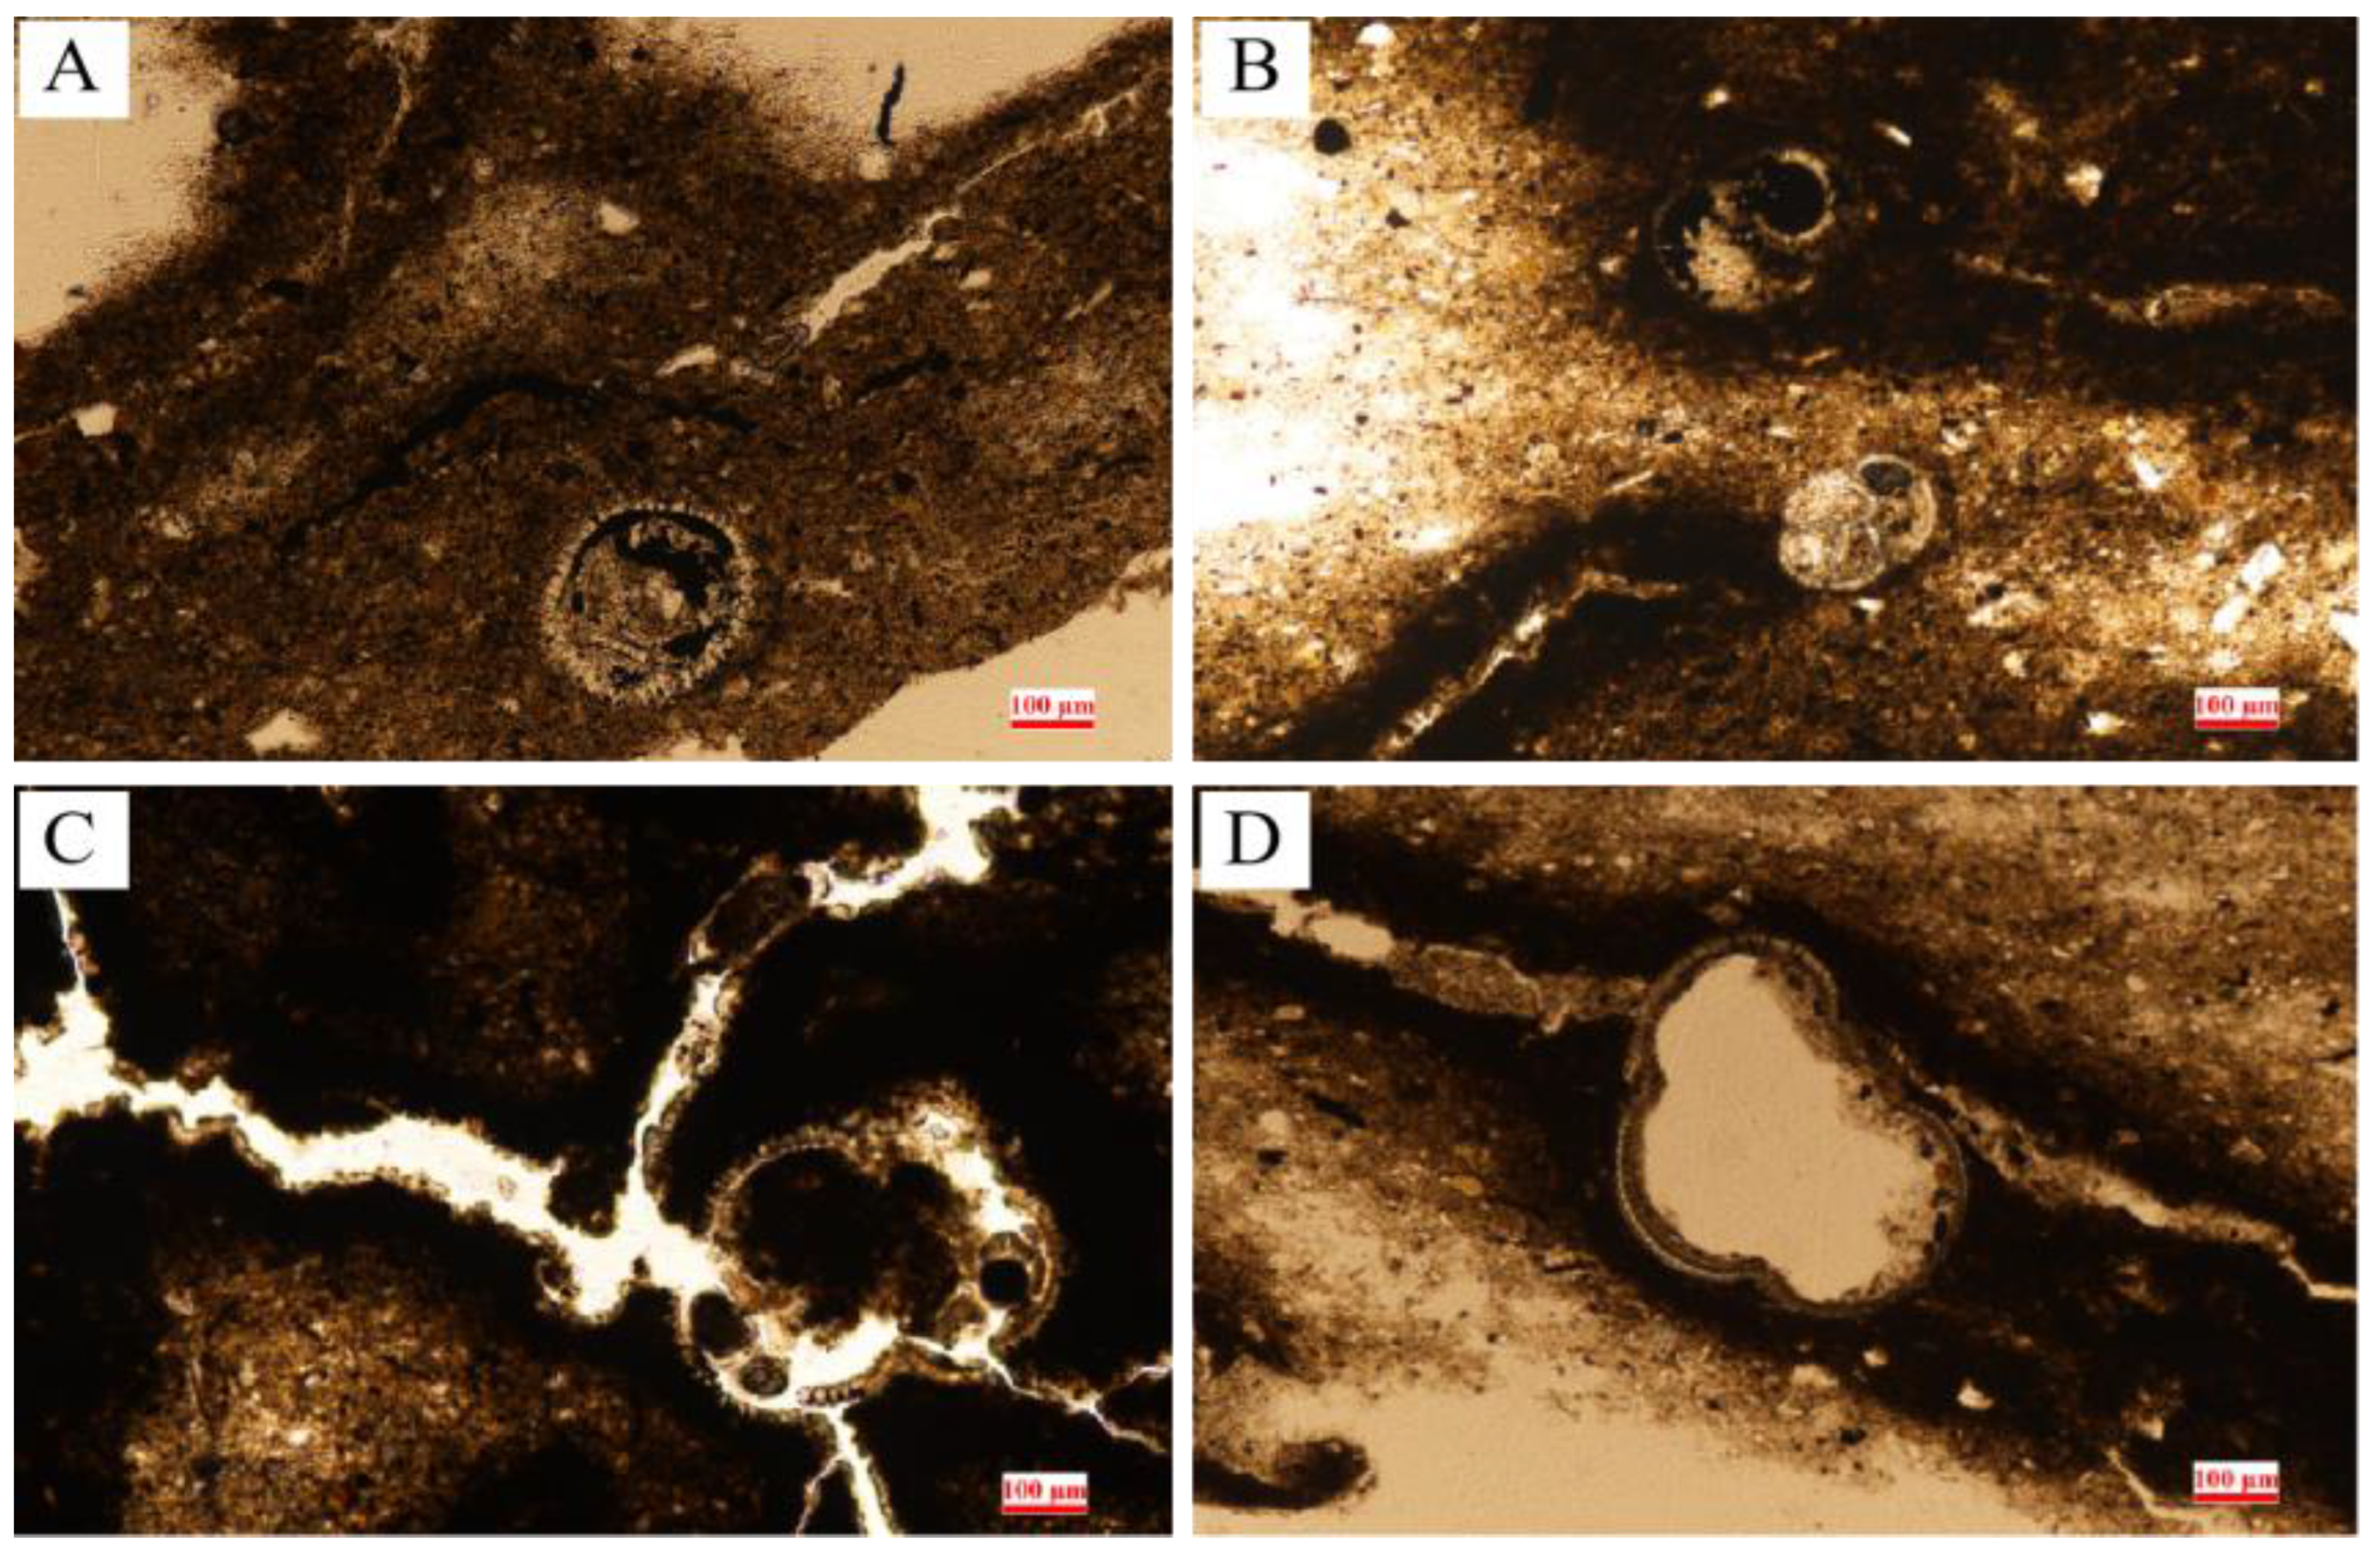
Figure 9. Microscopic observation of cracks in the CTS.
Preprints 115611 g009
The morphology of the bioclasts is preserved intact in the CTS, from which it can be inferred that the microcracks are non-artificial cracks with widths of a few micrometers. The cracks in Figure 11. (A), (B) are single microcracks without branching, and the crack in Figure 11 (C) is connected to the bioclasts with multiple bifurcating microcracks, which increase the pore volume. The cracks in Figure 11 (D) are not connected to the bioclasts, and the bioclast shells provide certain closed pore space.

4.3. Pore Size Distribution (PSD) and Connectivity

4.3.1. Nanometer-Scale Characterization—N2GA
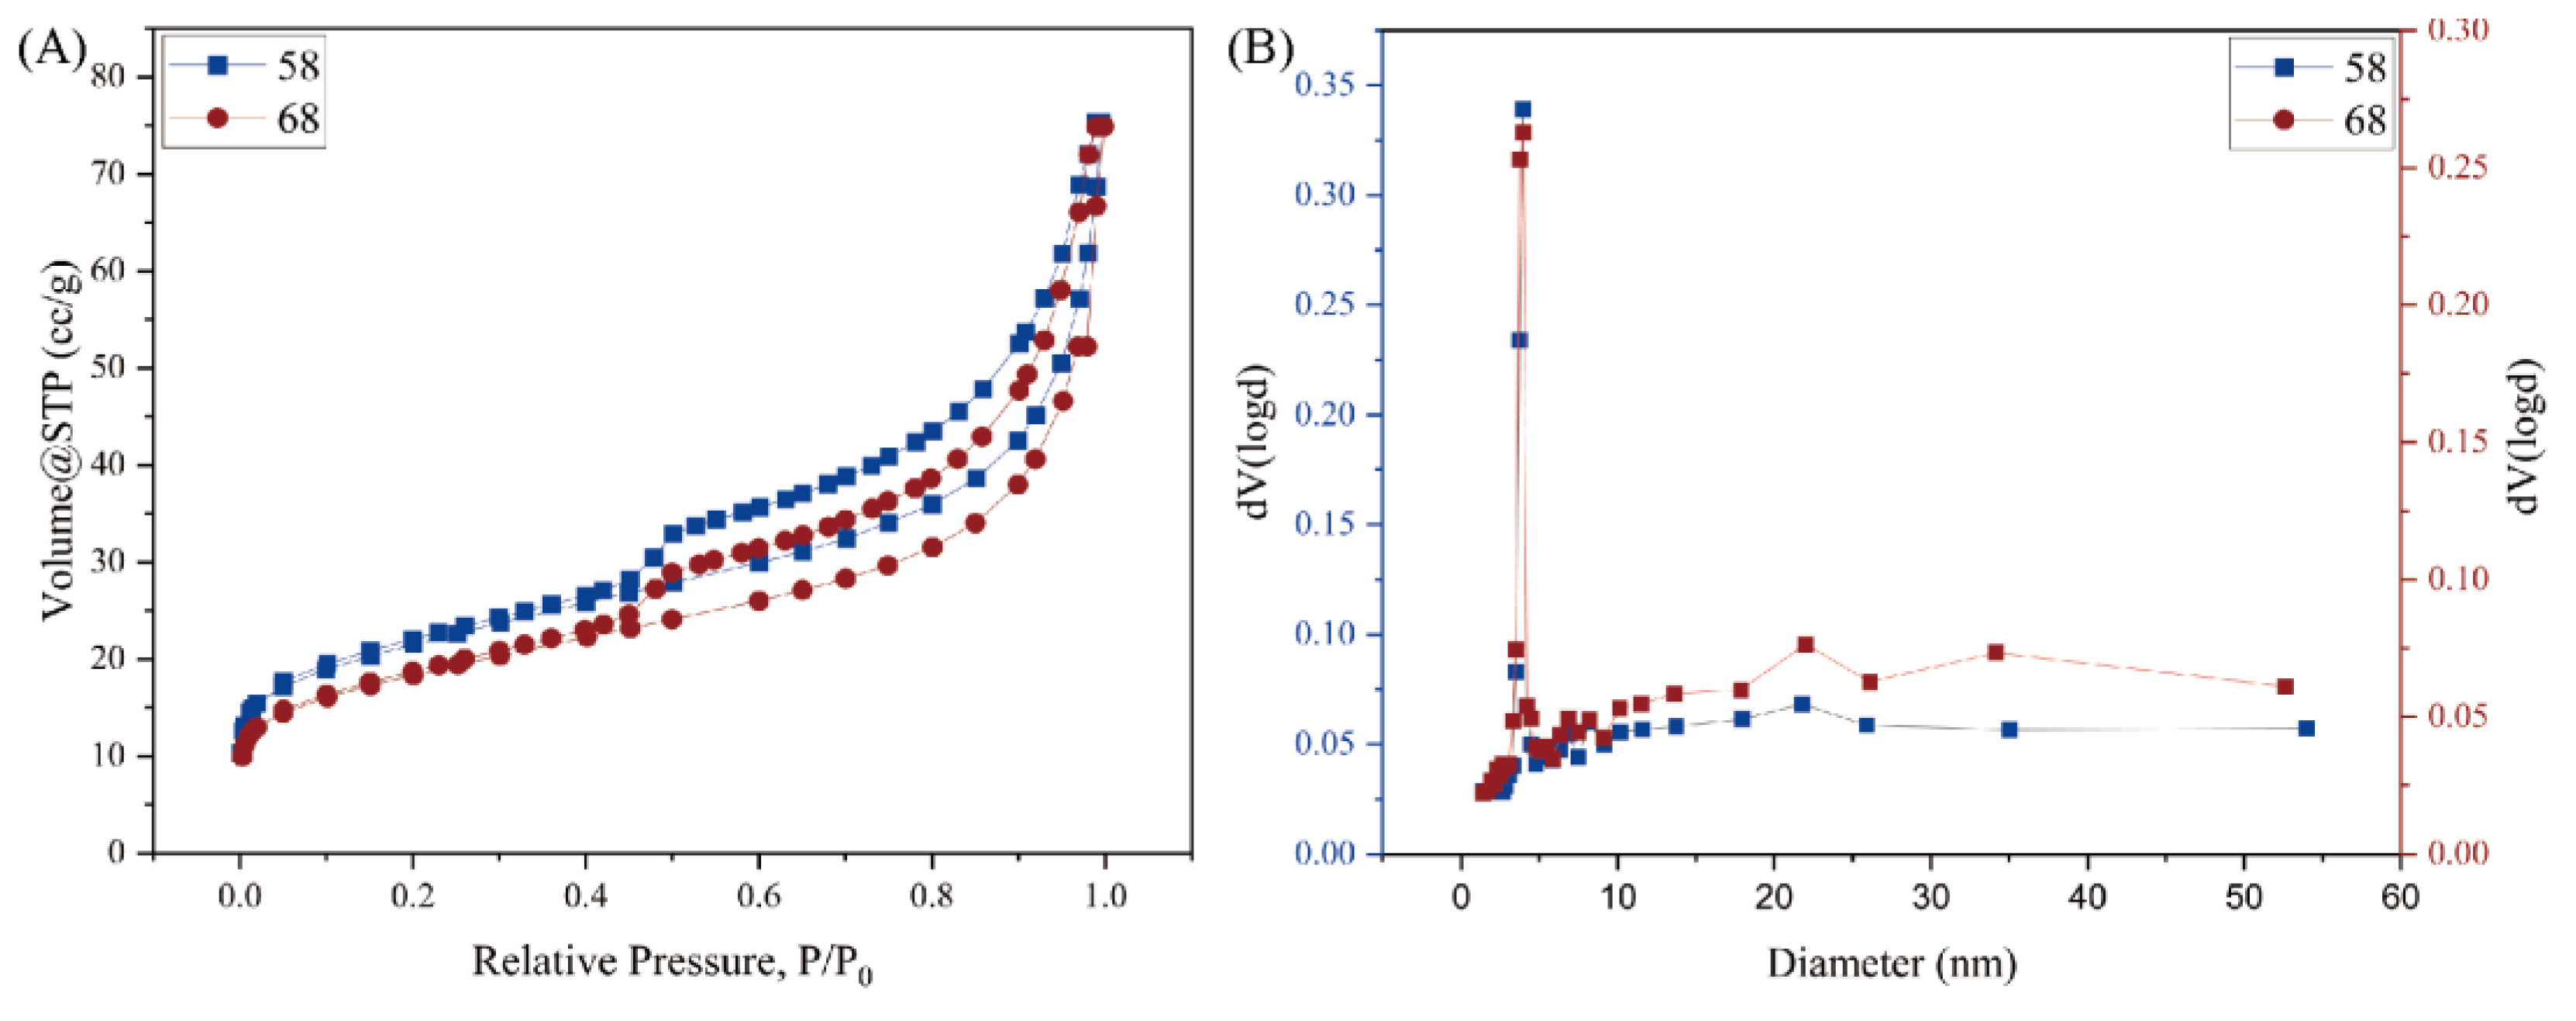
According to the classification of the International Union of Pure and Applied Chemistry (IUPAC), the characteristics of the pore structure can be analyzed by adsorption-desorption curves in the LP-N2GA data. This process is divided into the following three stages:
1. In the part with low relative pressure stage (0<P/P0<0.4), the adsorption capacity increases slowly, and the adsorption isothermal curve showed a slightly upward and convex shape. This stage was the transition process from mono-molecular layer adsorption to multi-molecular layer adsorption, and the inflection point of the isothermal adsorption curve was the critical point of the transition shift.
2. At medium and high relative pressure stage (0.4<P/P0<0.8), the adsorption capacity increases slowly with the increase of pressure, and this stage is the multilayer adsorption process.
3. In the high relative pressure stage (0. 8<P/P0<1), the adsorption isotherm rises sharply, showing a downward concave shape, and the adsorption saturation phenomenon does not occur until it is close to the saturation vapor pressure, which indicated that there existed a certain amount of macropores and mesopores in the sediment, resulting in capillary condensation of nitrogen on the surface of the sediment sample.
Figure 10. N2GA isotherms (A) and pore size distributions (B).
Preprints 115611 g010
According to IUPAC's classification, the adsorption isotherm of the samples are very steep near the saturated vapor pressure, close to the type H3, while having the characteristics of the type H4. These types of hysteresis line indicates that the sediment sampled are predominantly slit-type pores, but also contains some ink-bottle-shaped pores [34,35,36].

4.3.2. Nanometer-scale characterization—NMRC

NMR T2 spectrum
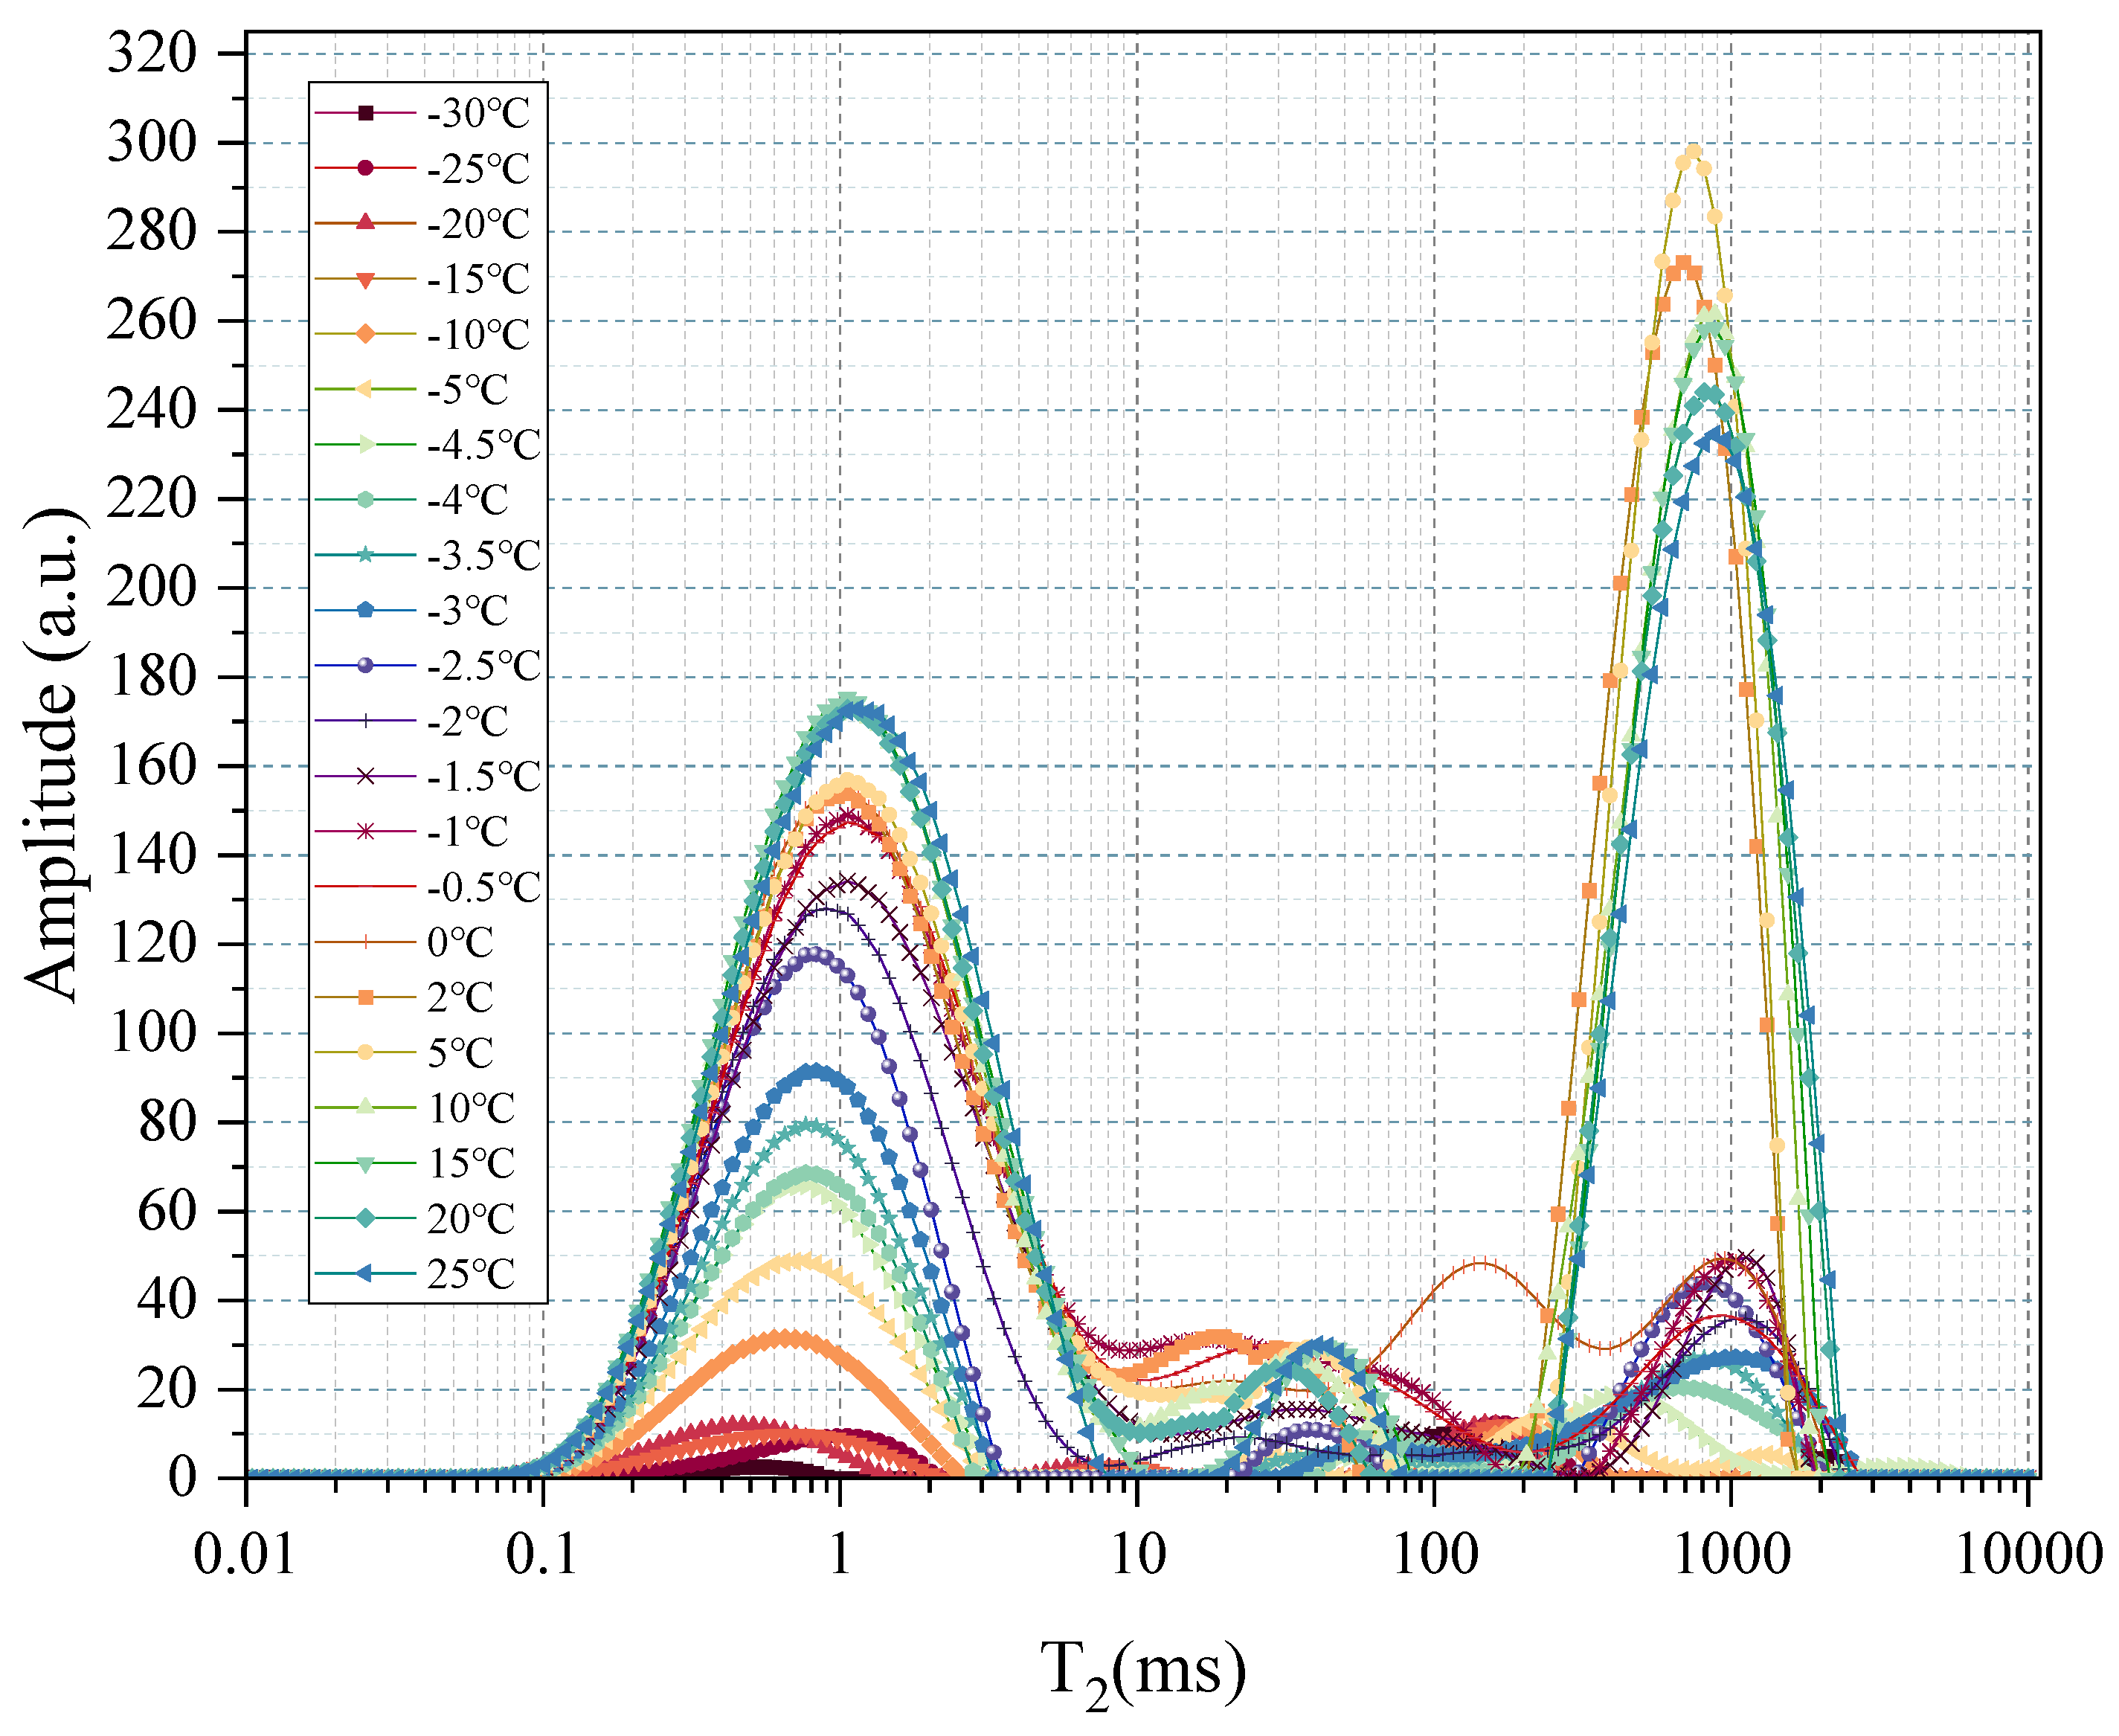
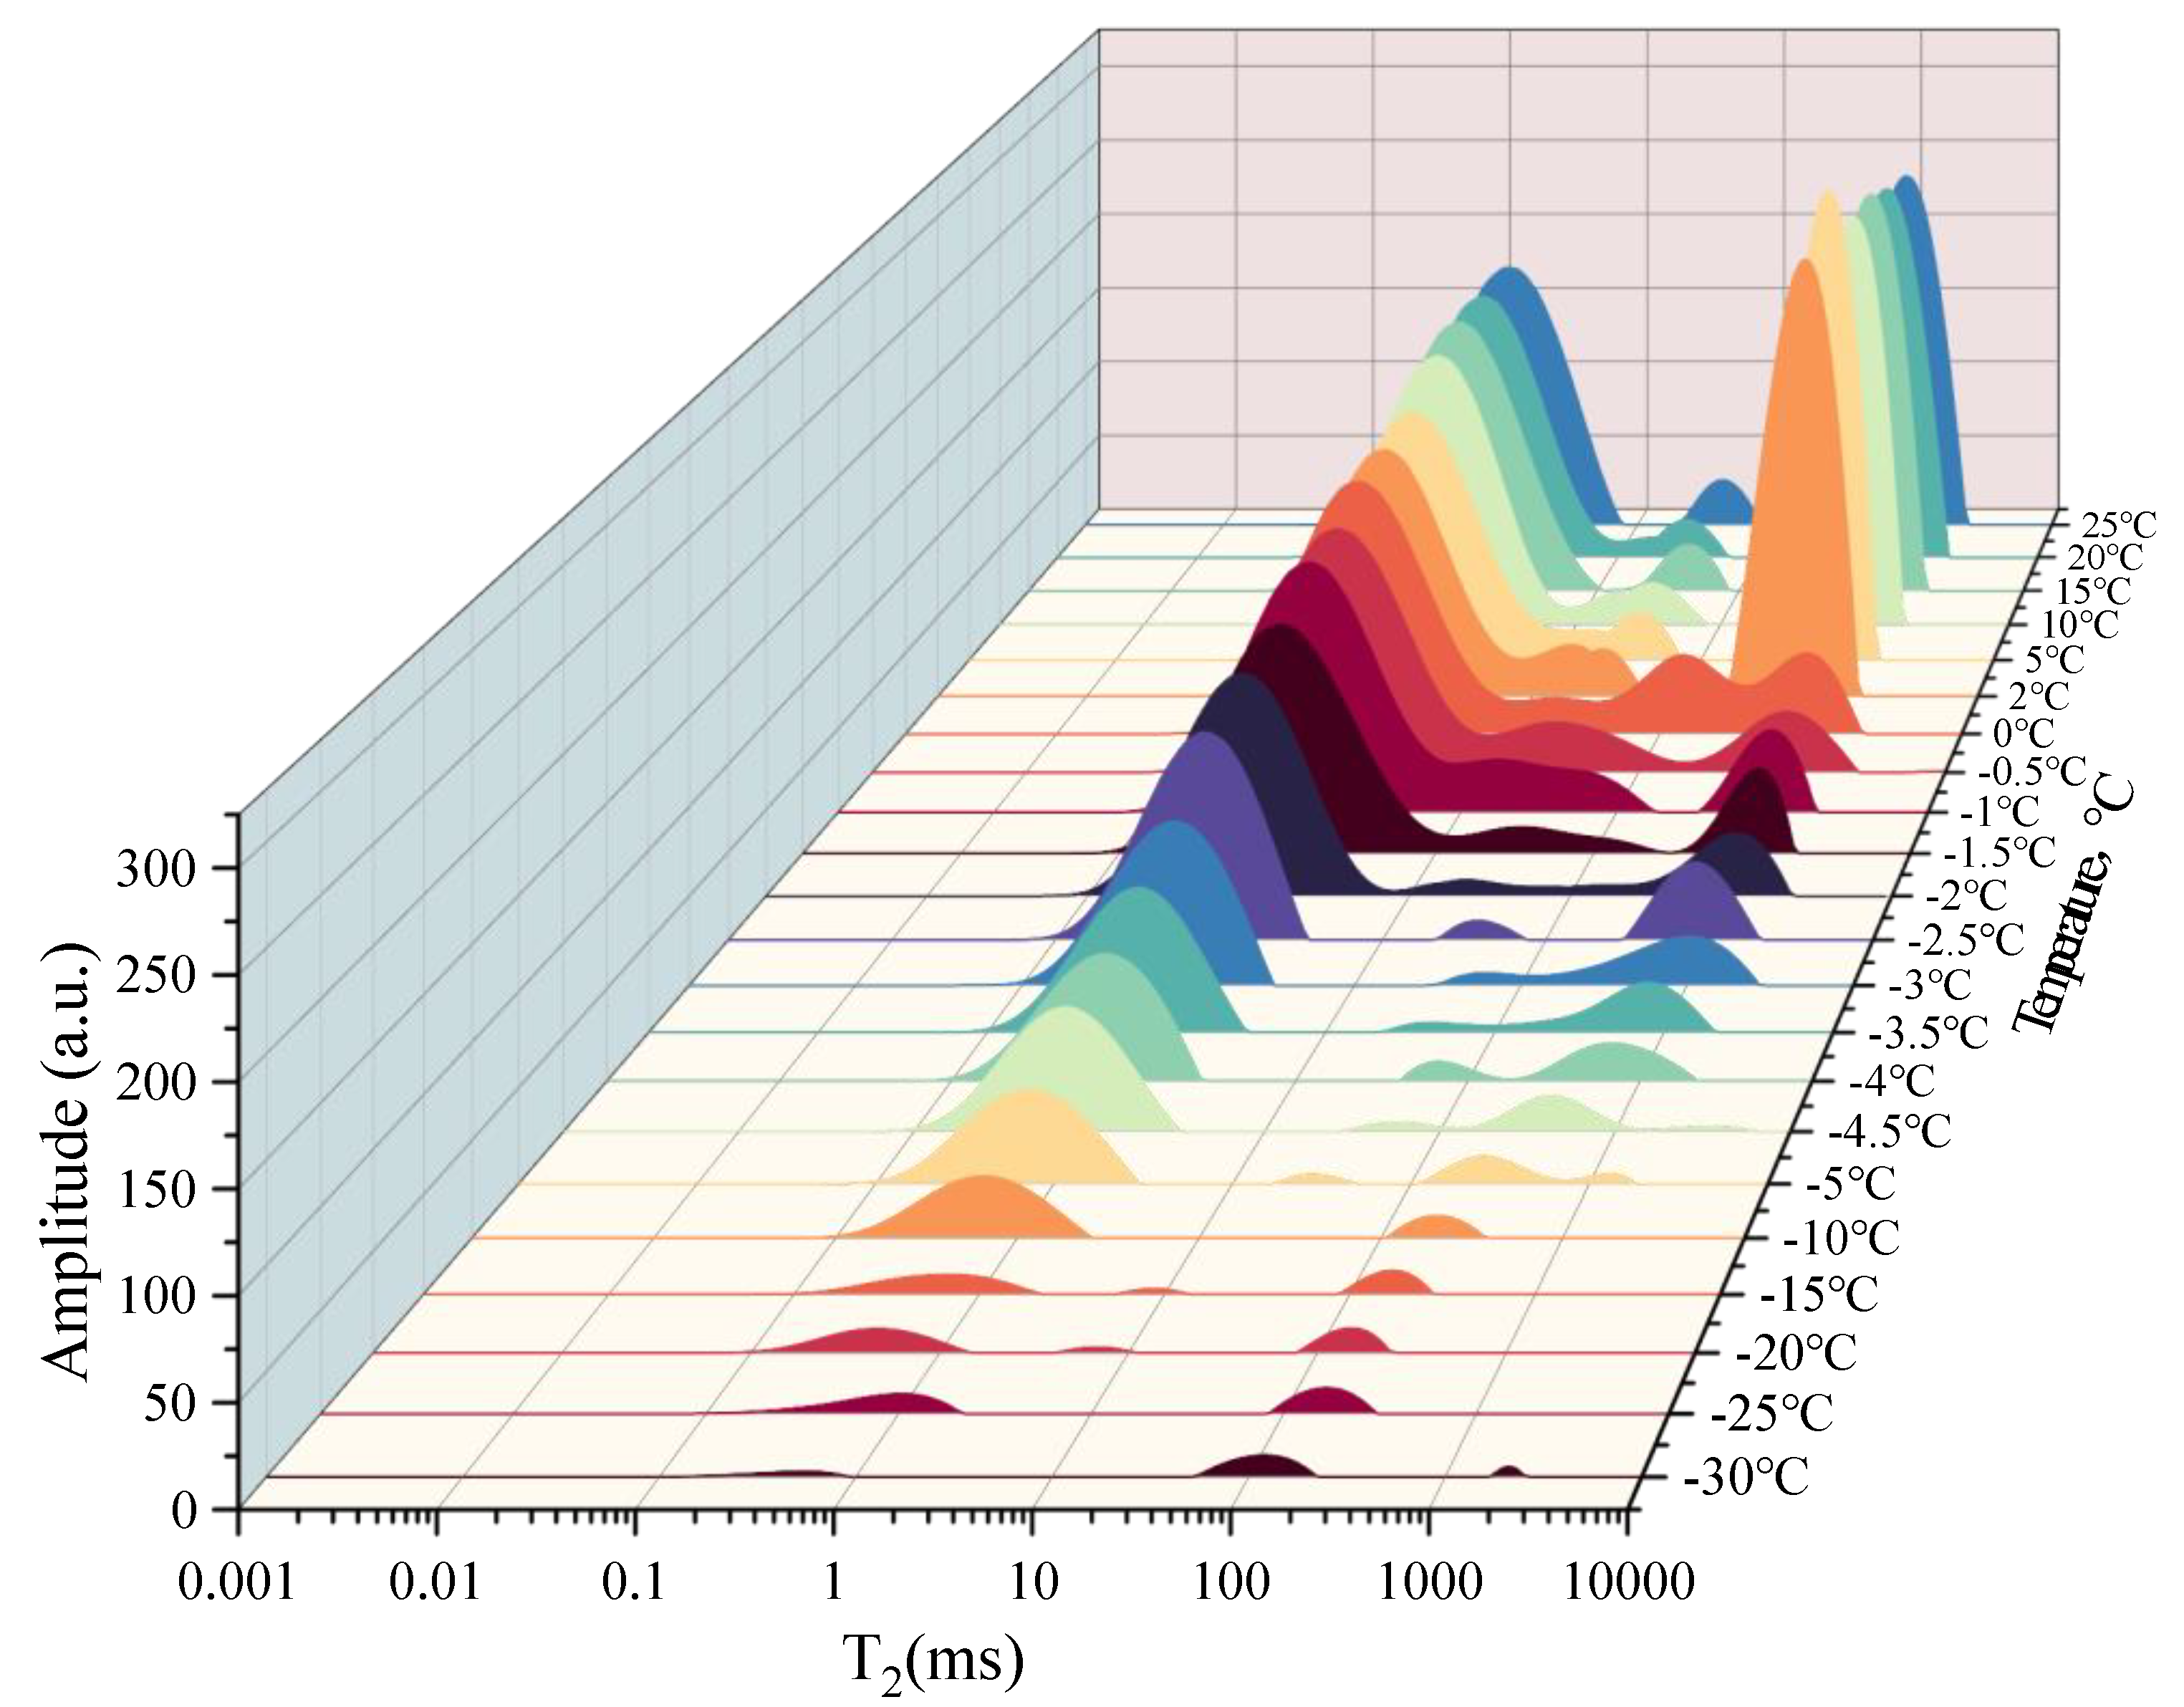
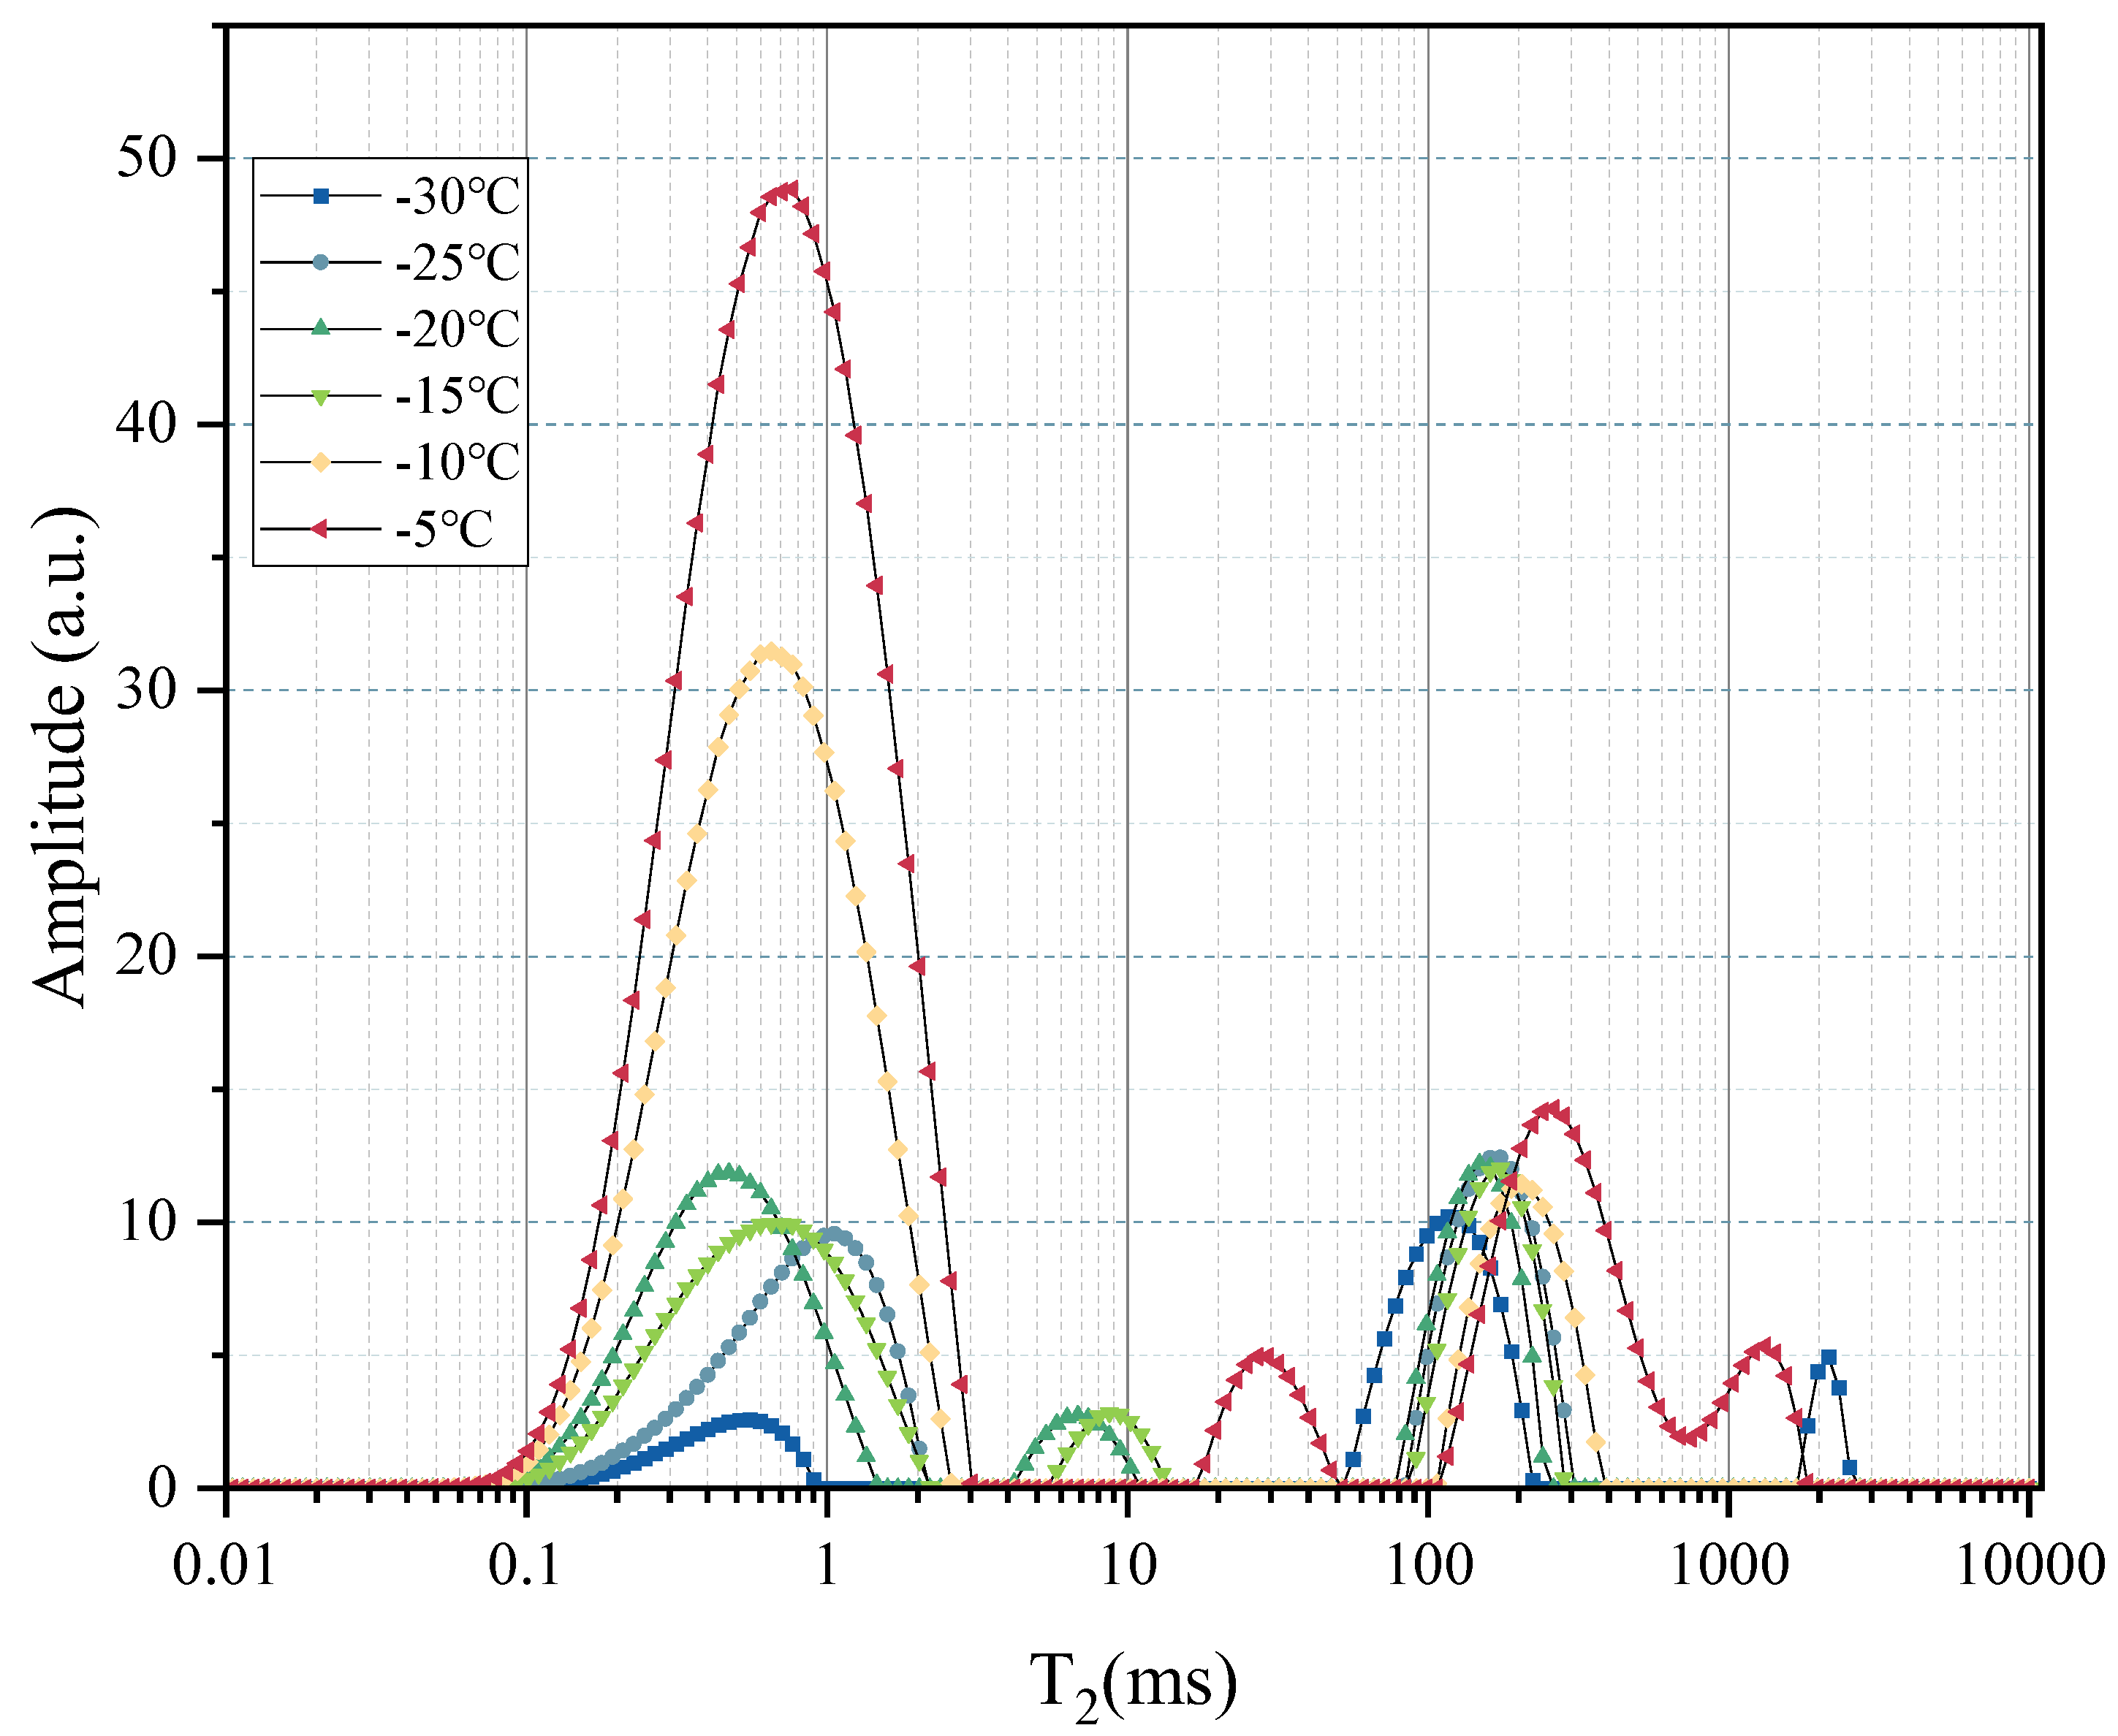
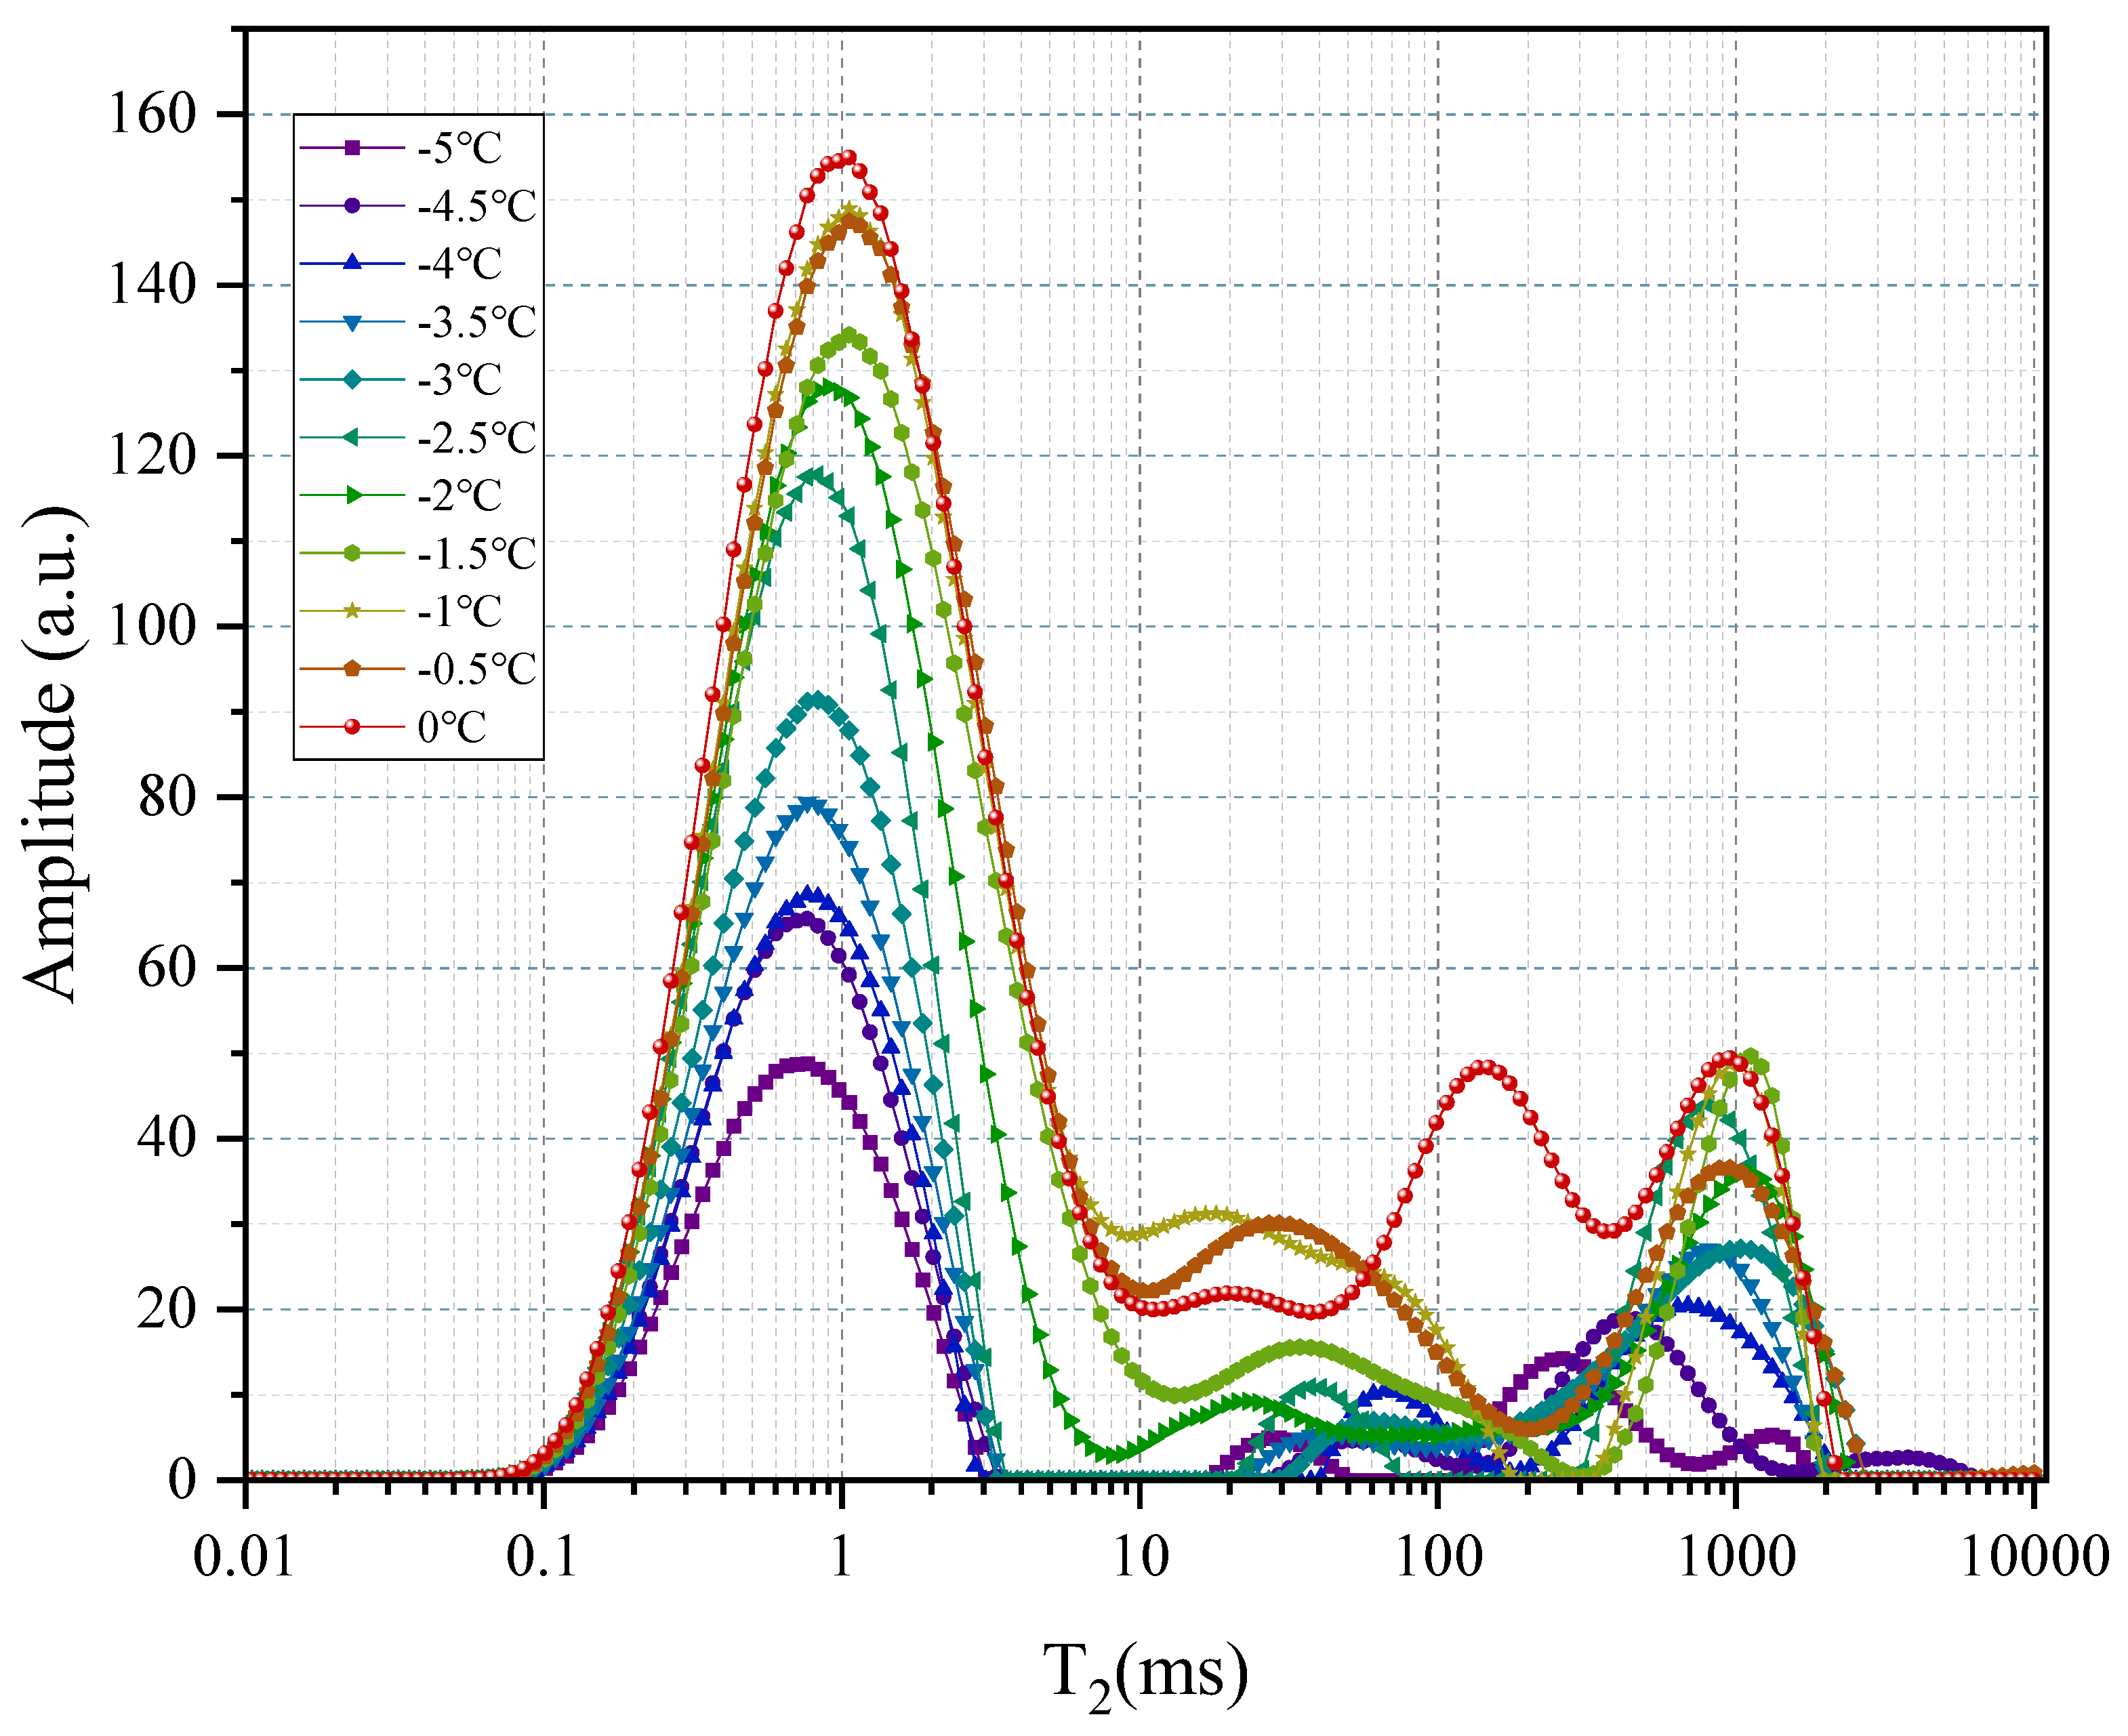
The experimental results show that the melting point of ice in the reservoir micropores is related to the pore size. Figure 13 shows that between -30 °C and -5 °C, the signal of the fluid is quitely weak and the liquid content rises slowly. The bound water is directly bound to the hydrogen bond of the macromolecular group, so the binding force is stronger, the fluidity of the water is weaker, as the attenuation rate is faster. Free water, on the other hand, is not affected by the structure, the fluidity of the water is strong, and the attenuation rate is the slowest [37,38]. Therefore, different states of water can be distinguished based on the magnitude of the relaxation time. These three peaks can represent different water states, such as bound water, perturbed water, and free water, respectively. Thus T2 spectrums are divided into three peaks, from left to right as P1, P2 and P3, where P1 represents bound water, P2 varies in complexity represents perturbed water, and P3 represents free water. The pore size increases with increasing T2 relaxation time.
Figure 11. The T2 relaxation time of NMRC experiment
Preprints 115611 g011
As can be seen from the 3D diagram (Figure 12), the bound water content increases as the temperature increases. The perturbed water starts to increase gradually and continuously at -5°C and migrates through the pores. At 0-2°C, the free water content increases significantly, indicating that the ice has completely melted into water.
Figure 12. Three-dimensional plot of the peak amplitude of the T2 spectrum as a function of temperature.
Preprints 115611 g012
Starting at -5°C, the signal changes significantly and water is transported into larger pores. P3 (Figure 13 and Figure 14) shows two small peaks, indicating that the water in the larger pore size is in a perturbation state. This shows that below -5°C, water exists in the form of bound water (water film).
Figure 13. The T2 spectrum of NMRC with temperature varies from -30 °C to -5°C.
Preprints 115611 g013
Figure 14. The T2 spectrum of NMRC with temperature varies from -30°C to -5°C.
Preprints 115611 g014
Between -5°C and 0°C, the bound water content continued to increase, and the signals of the P2 and P3 peaks were enhanced with the perturbation, and the perturbed water was transported in the pore space, meanwhile there was no significant enhancement of the signal of the P3 peak, suggesting that ice of the smaller pores melted first, and the freezing point decreased due to the influence of pore size, which was caused by the Gibbs-Thomson effect [39,40,41,42].
Figure 15. The T2 spectrum of NMRC with temperature varies from -5°C to 0°C.
Preprints 115611 g015
When the temperature is higher than -5°C, the content and distribution of water in the pores of the sample change significantly. Therefore, -5 °C can be considered to be the freezing point boundary value for adsorbed water and capillary water in the sediment pores, this phenomenon corroborates the view of Razumova et al. and Jaeger et al [43].

Pore Size Distribution

The PSDs of the sample are shown in Figure 16. The pore size distribution of the sample is concentrated between 2-100 nm. The pore size ranges with a large pore volume contribution are 10-50 nm.
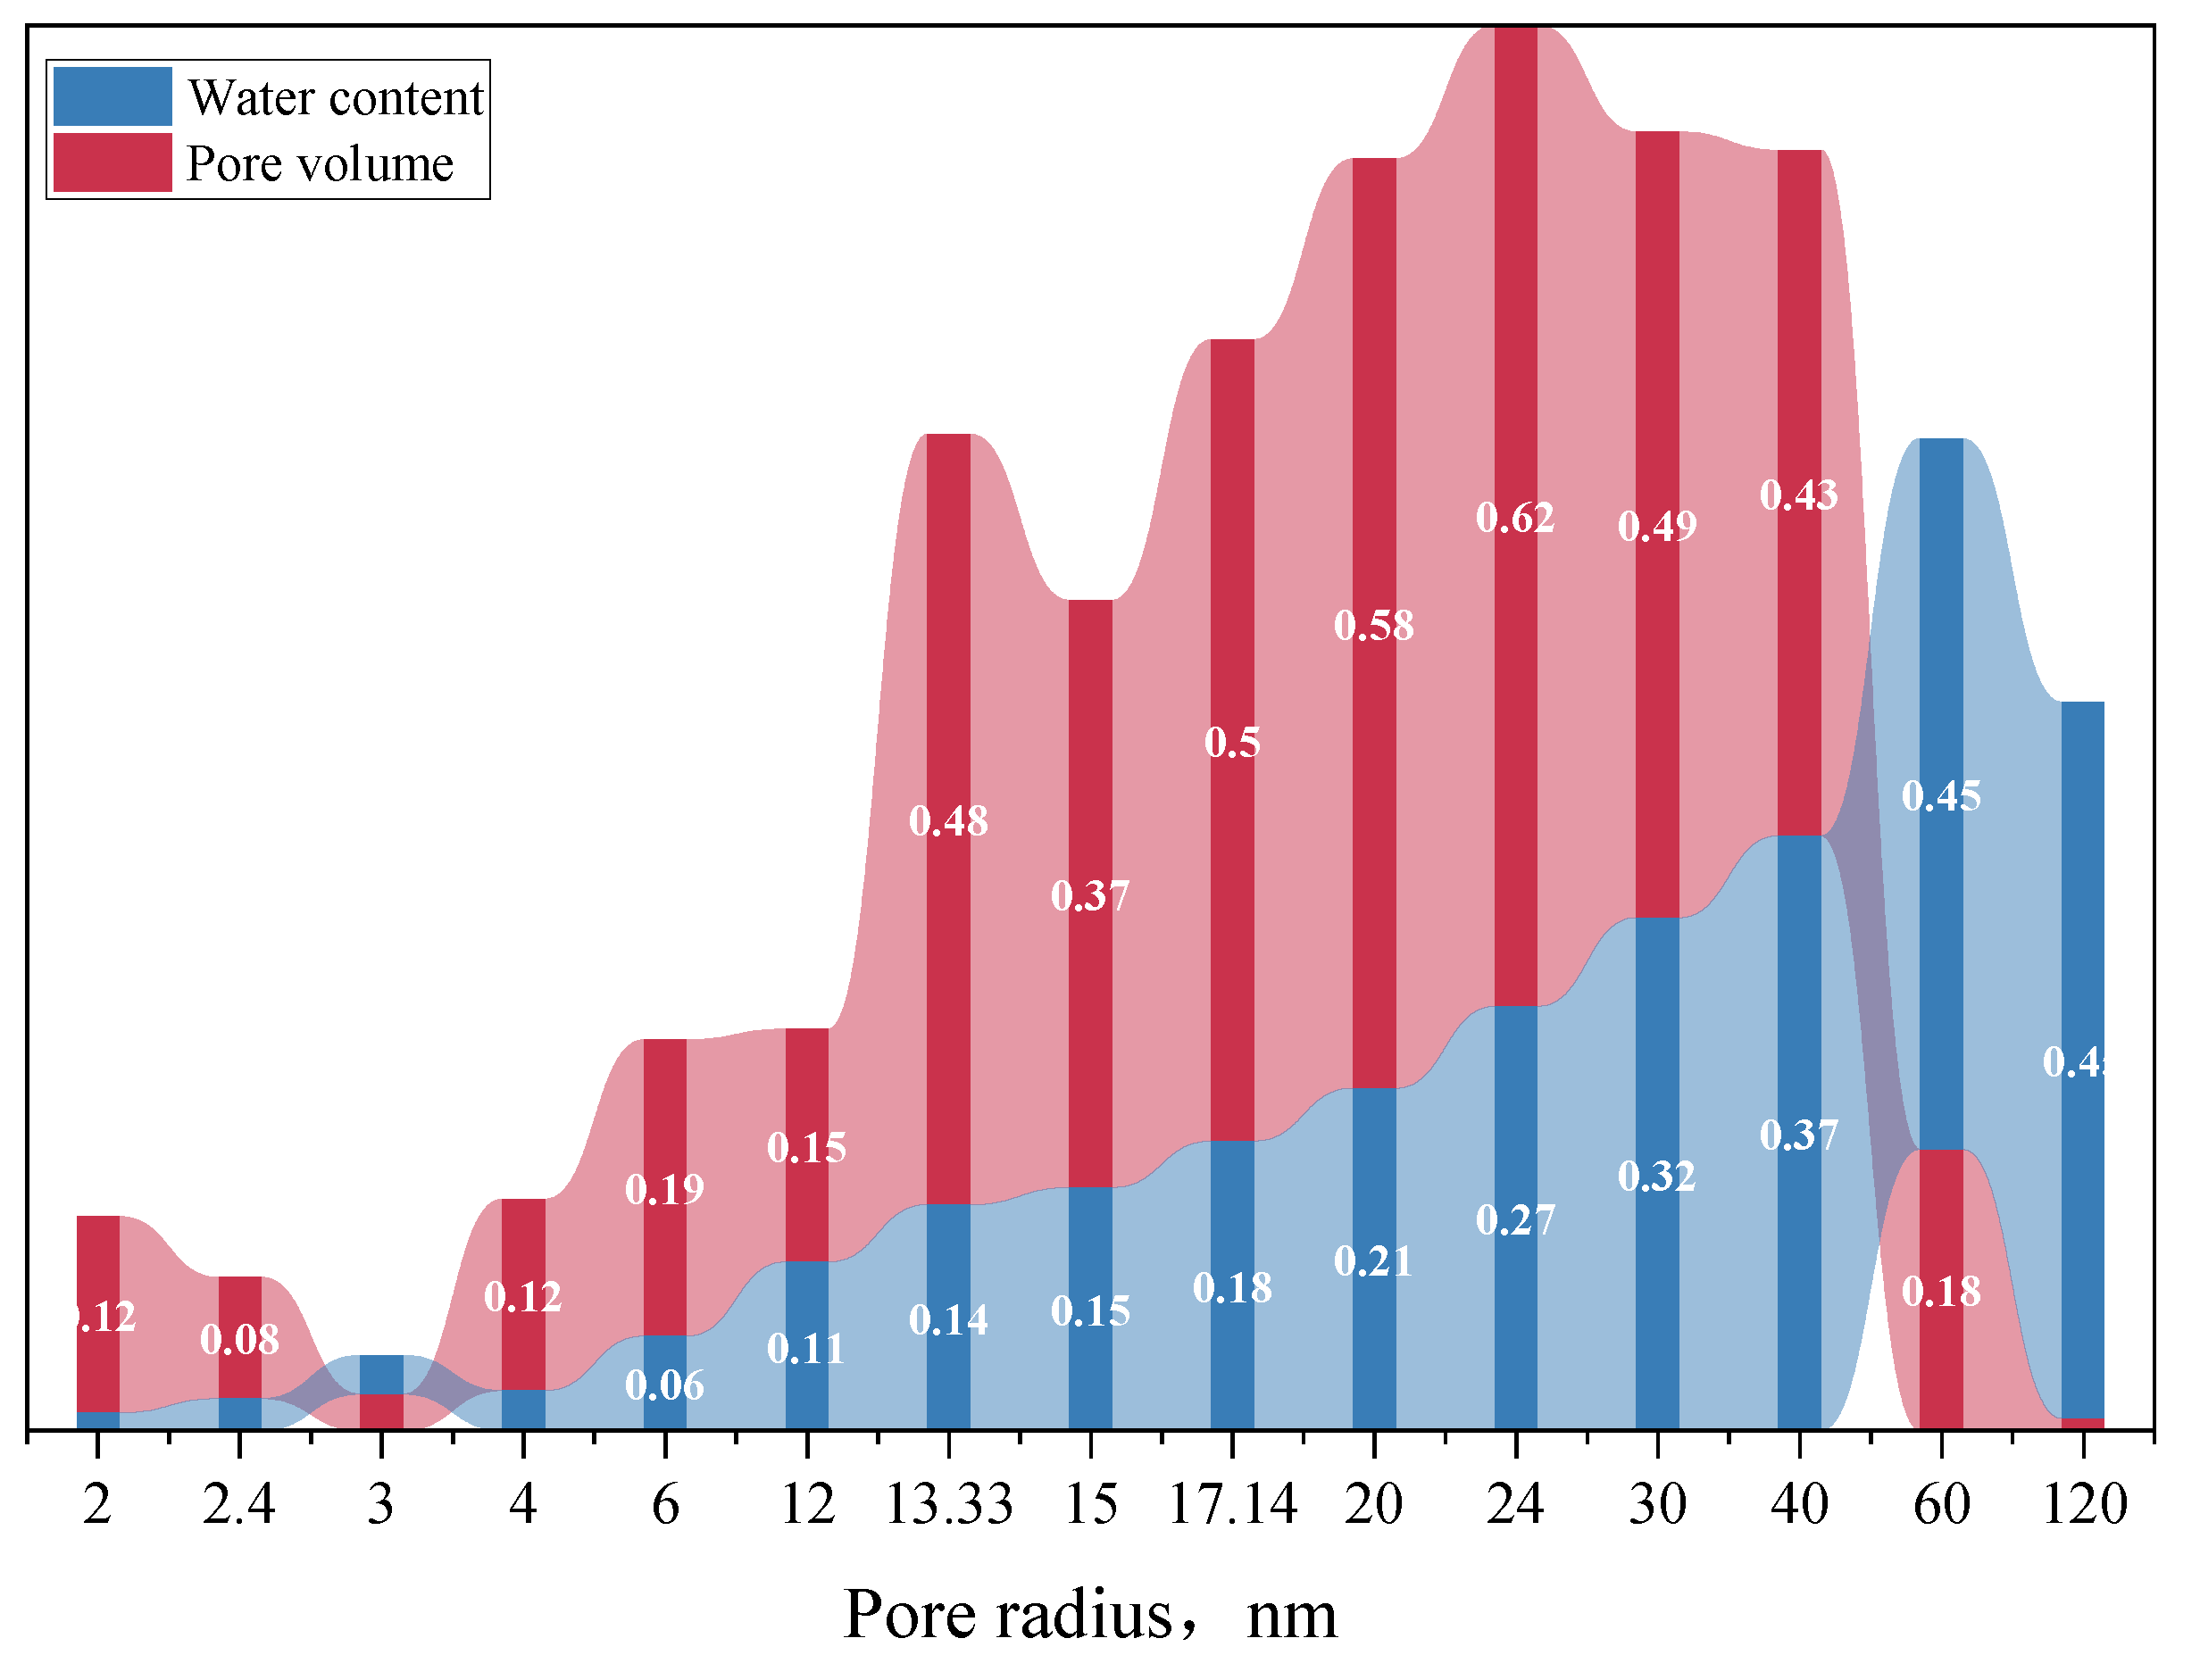
By calibrating with NMRC technology, the trend distribution map of unfrozen water content was obtained (Figure 17). The PSDs of Samples 58 are shown in Figure 15. Among them, pore sizes in the range of 10-100nm account for a relatively larger percent of pore volume. Compared to the N2GA method, NMRC can characterize larger range of pore sizes, detect more closed pores, and calculate water content in the pores (Figure 18).

4.3.3 Pore Volume (PV) and Surface Area (SSA)

PV and SSA can be used to study the storage space of natural gas and are an vital part of reservoir evaluation. In general, pores can be divided into macropores (>50nm), mesoporous (2-50nm) and microporous (<2nm). In this study, SSA can be obtained based on the BET model, PV can be obtained by the BJH model, and pore size distribution can be obtained by BJH or DFT model. Among them, the DFT model can be used to jointly characterize the PSDs of the samples from micropores to partial macropores.
The pore structure parameters are presented in Table 1. The values of the micropore surface area of samples are 76.232 m2/g and 64.751 m2/g respectively. The pore volume of the micropores (pore size 2-50nm) of the samples are 0.108 cc/g and 0.110 cc/g.

4.3.4 Micrometer Scale Characterization—HPMI

The data of HPMI method show that the radius of the pore throat in the KG Basin is concentrated in the nano-scale, with a few micron-scale pore throats. Among them, micro-scale pore throats have more permeability contribution than nano-scale pore throats.
The pore size distributions obtained by HPMI only represent the pore (or throats) that have the permeability contribution, does not reflect all the pore size distribution of the sample, and cannot distinguish between the pore and throat. Therefore, the combination of CRMI and NMRC method was used for further research.
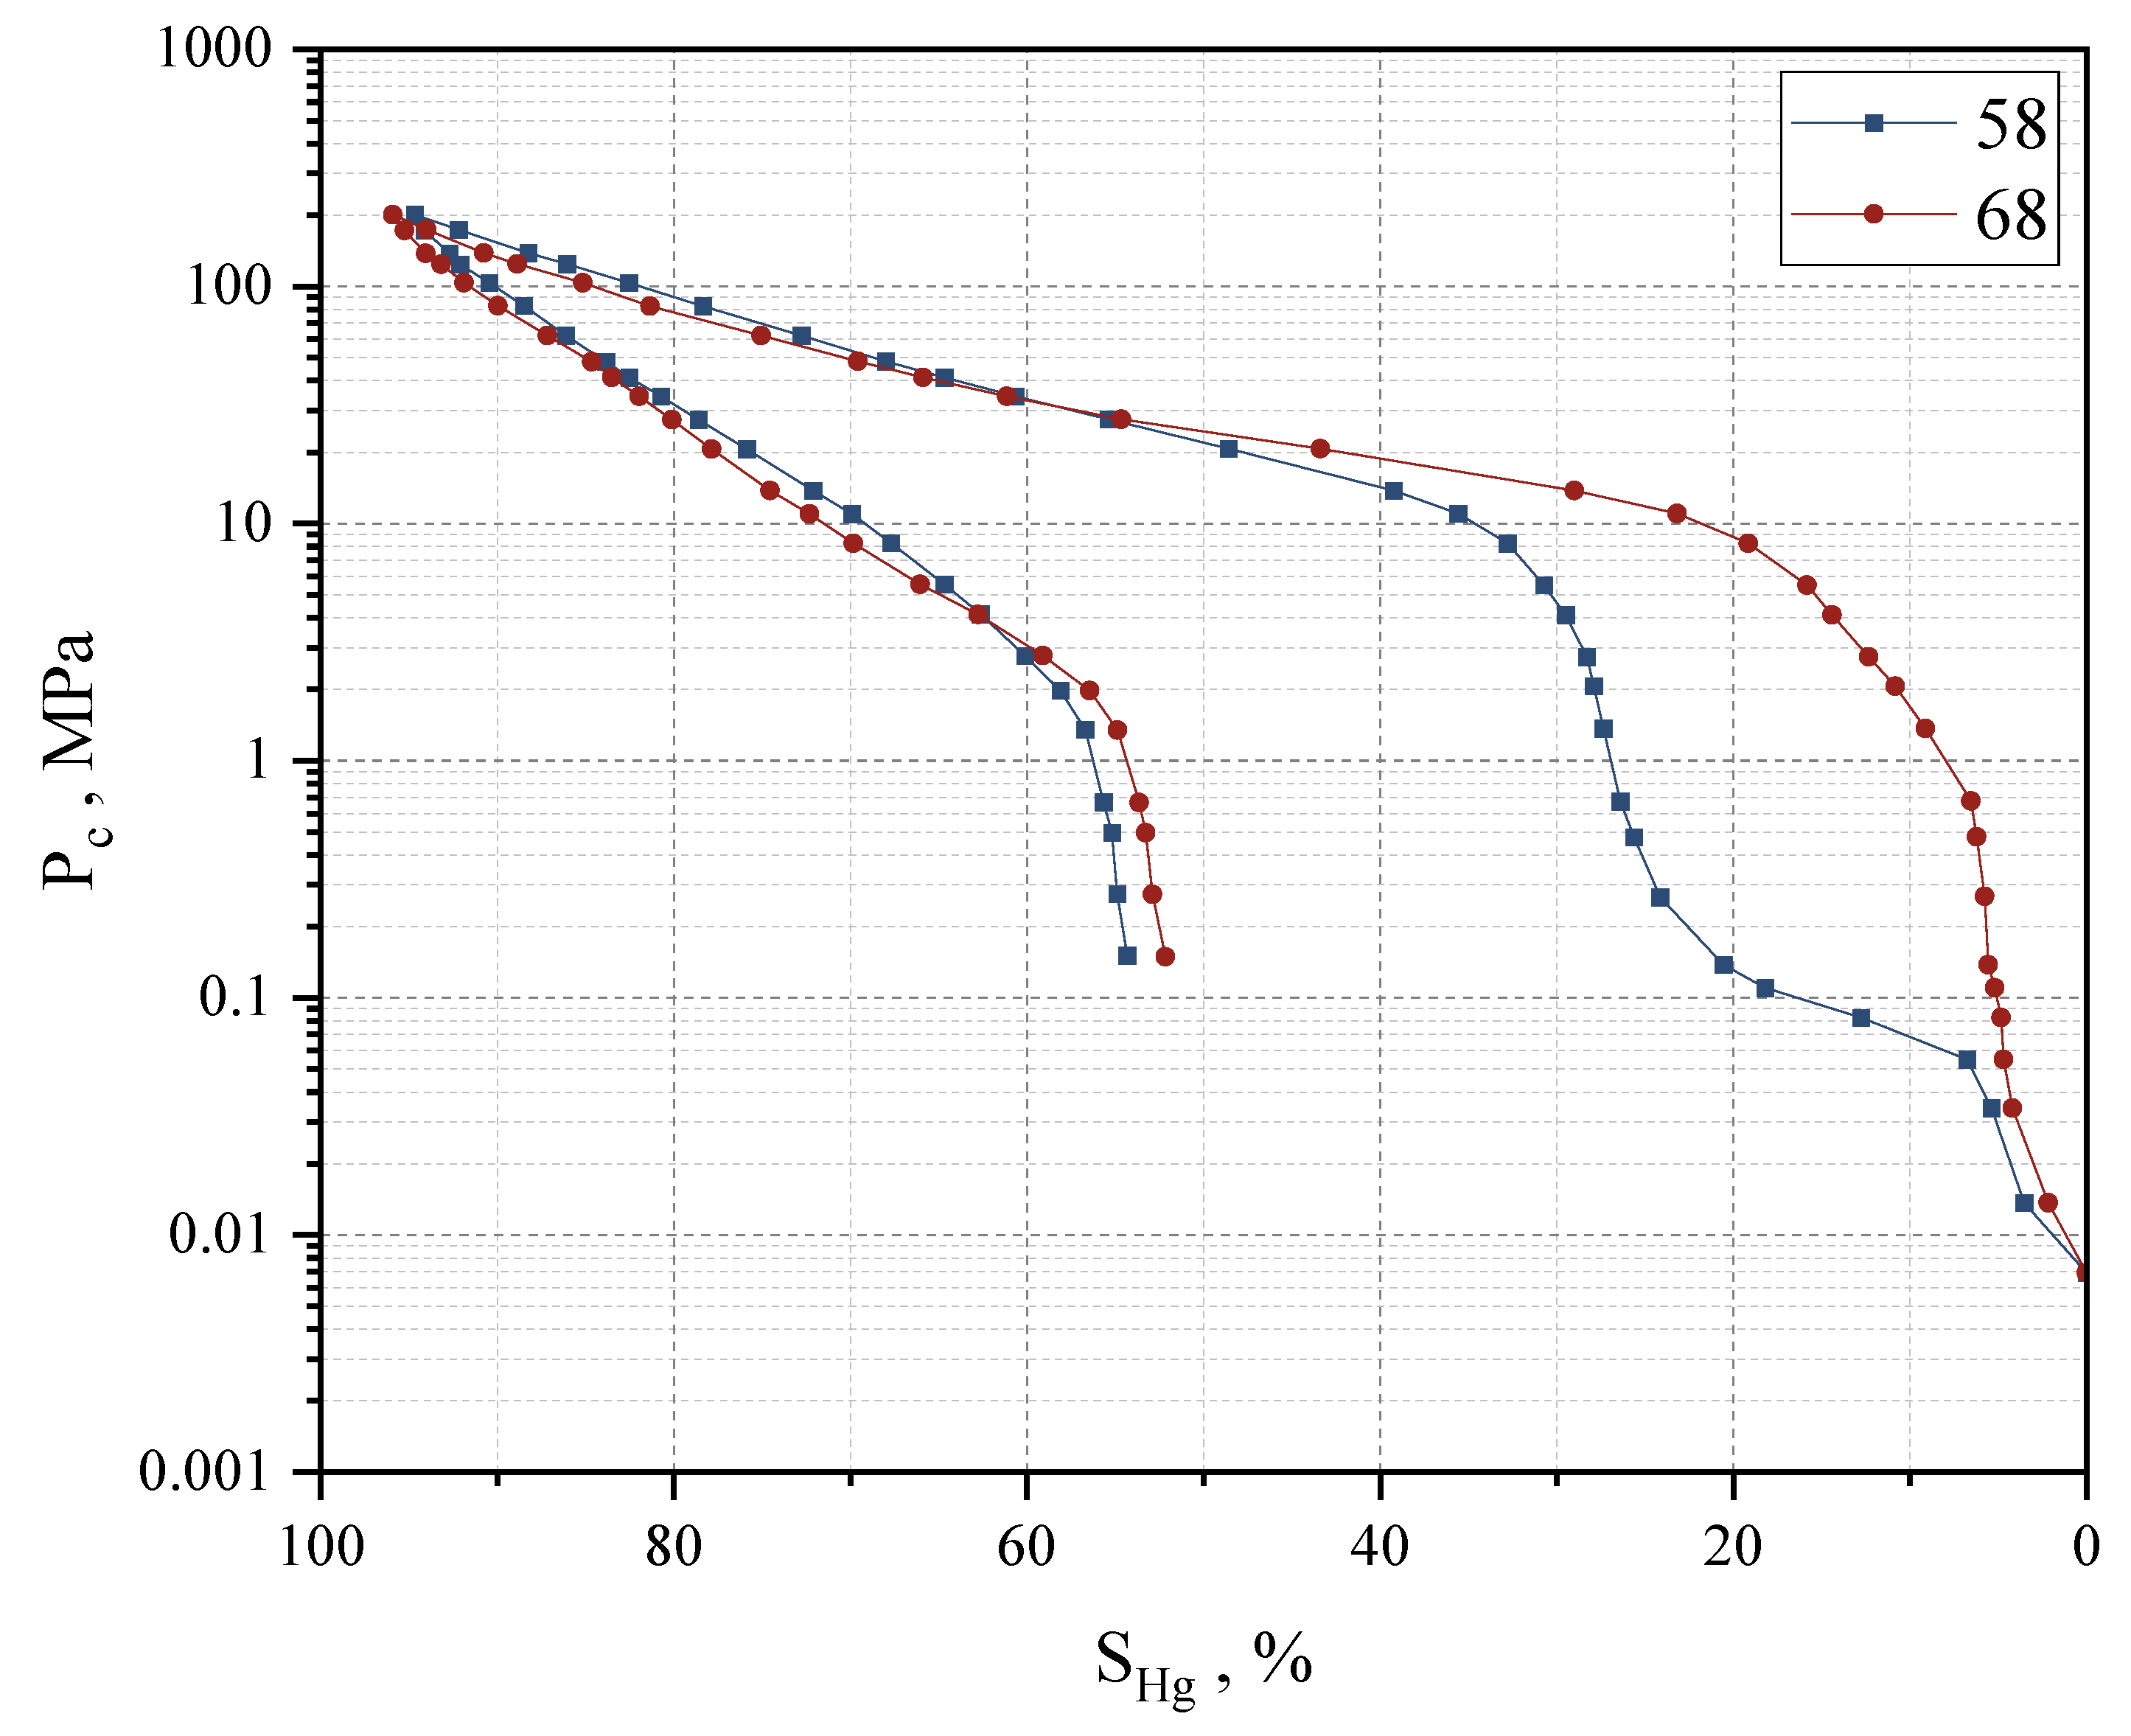
The capillary pressure curves of mercury intrusion and extrusion are depicted in Figure 18, and their key parameters are listed in Table 2.
The parameters indicating that the permeability of Sample 58 and Sample 68 is quite different, with 160.8 10-3μm2 and 0.142 10-3μm2, respectively, but the porosity is similar (Table 2).
The throat radius shows that although the median values of the two sample are the same, the maximum value of the throat was very different, with Sample 58 having a larger average throat radius of 2.937μm, where the maximum throat radius could reach 13.368μm, meanwhile Sample 68 had a nanometer average throat radius of only 0.114μm and the maximum throat radius of 1.088μm.
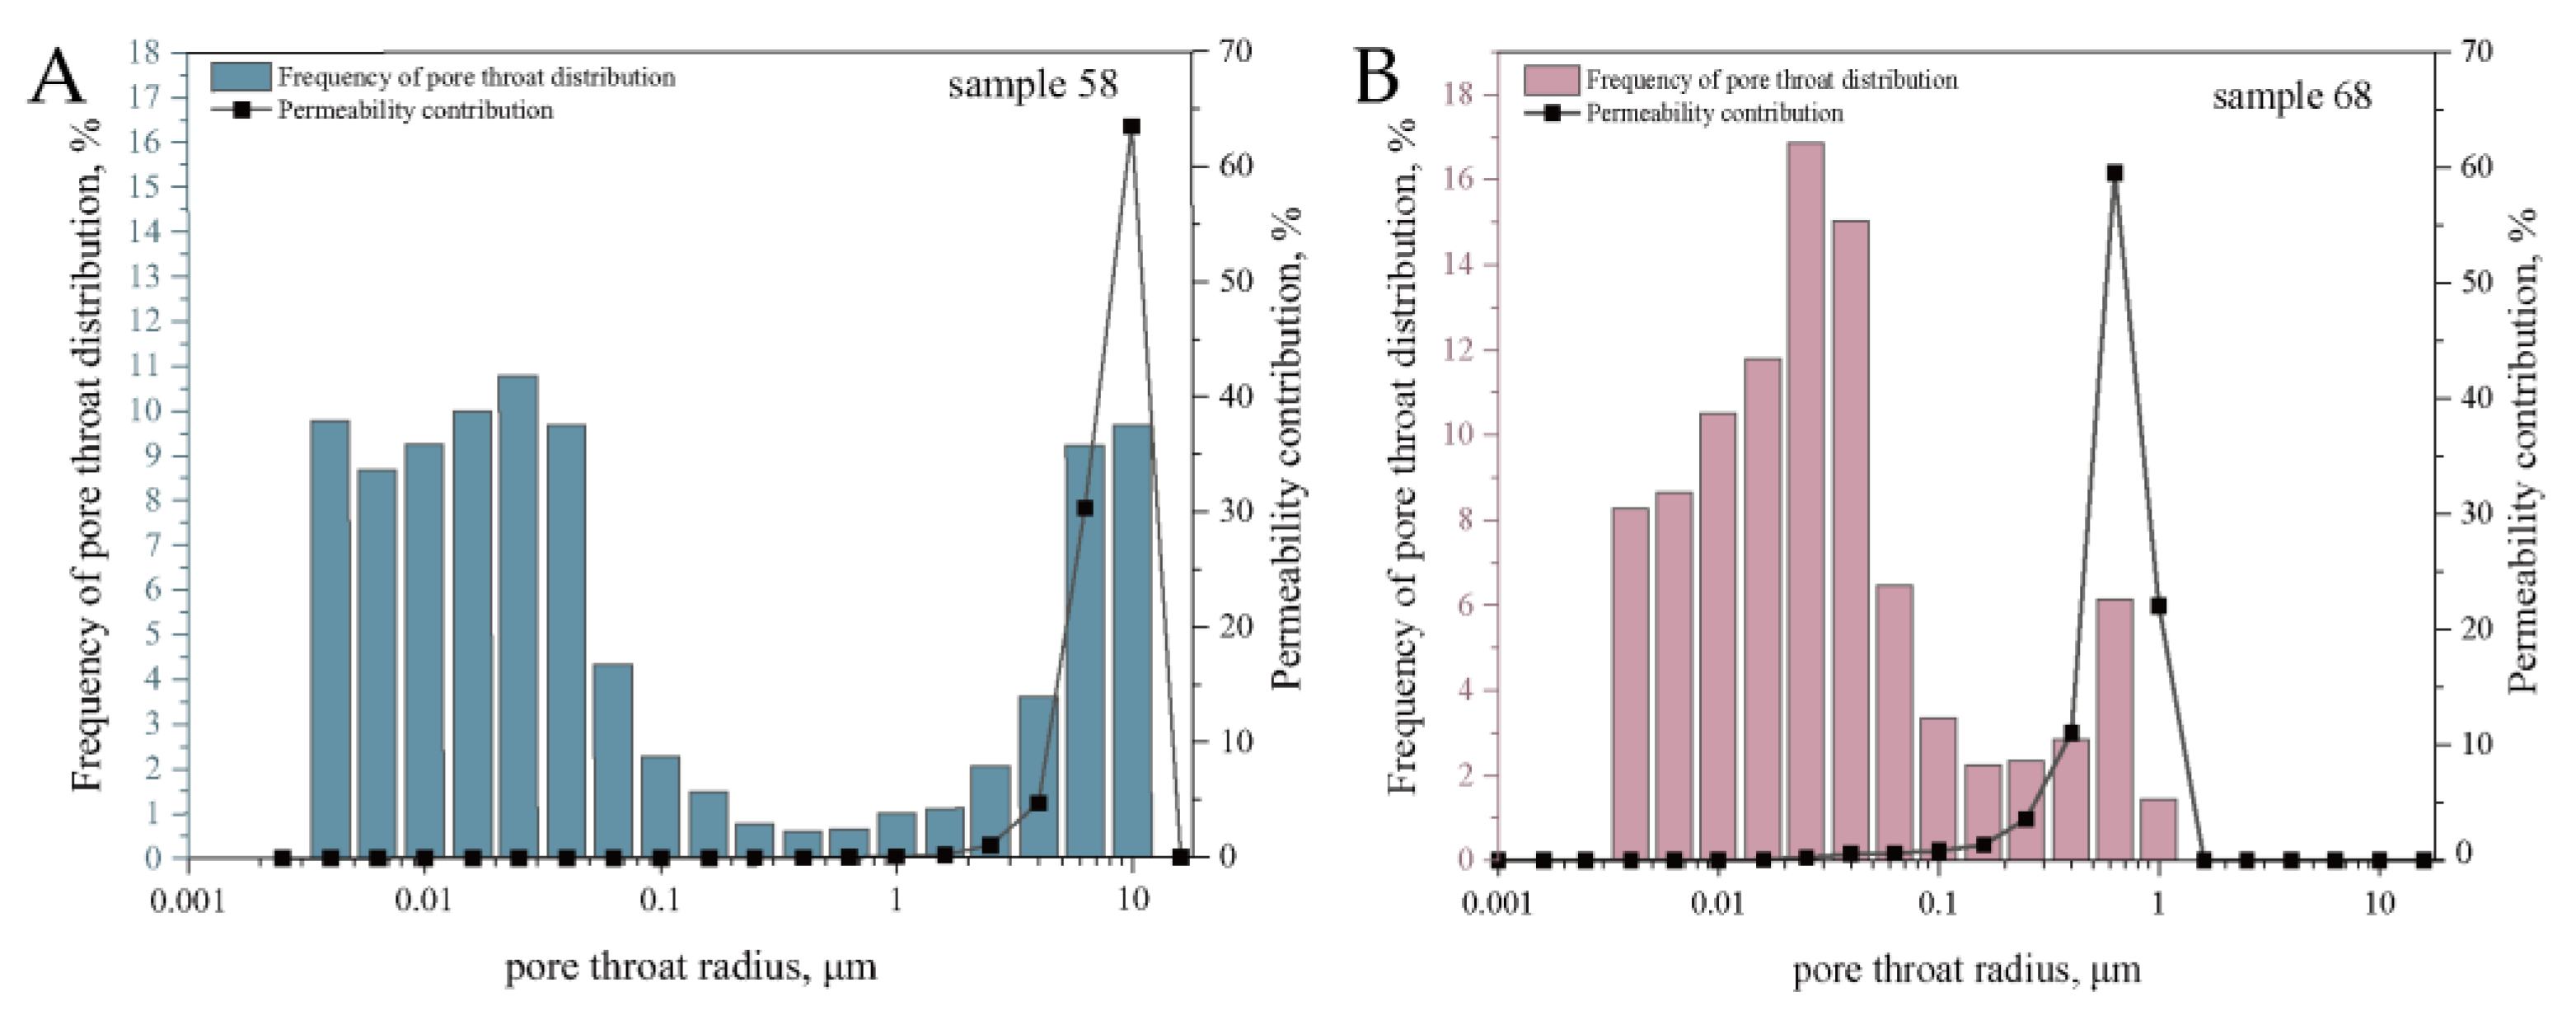
The pore throat is distributed varies a wide range, from nanometer to micrometer, with the larger pore throat providing permeability (Figure 19). The permeability contribution of Sample 58 corresponds to pore size distribution ranging from 2-10μm; so as to the permeability contribution of Sample 68 corresponds to pore size distribution ranging from 0.2-1μm. In samples 58 and 68, the pore sizes with the strongest permeability were 10μm and 0.6 μm, respectively.
Rv and Rm respectively means peak position and peak value of the PSD. The Rv values of the two sample are the same, Sample 68 has the higher value of Rm than Sample 58.
Rf represents the peak position of permeability distribution, while Fm represents the peak value of permeability distribution. In Sample 58, pore throat radius of 10μm contributes the most permeability, while in Sample 68, pore throat radius of 0.63μm contributes the most permeability. This is the reason why the porosity of the two sample is the same, but the permeability is quietly different.
Parameters of pore throat structure from HPMI can be seen in Table 3. Overall sorting coefficients show that the overall pore throat sorting is good for both samples, thus the relative sorting coefficients need to be analyzed. The relative sorting coefficient is used to characterize the uniformity of the pore size, with Sample 58 having a smaller relative sorting coefficient of 1.713, indicating that the pore size of the samples is not uniform, whereas the relative sorting coefficient of Sample 68 is larger at 36.264 indicating that the pore size of the samples is more uniform.
The sorting coefficient is also reflected in the structural characteristic parameters. There is a close relationship between the structural characteristic parameters and the relative permeability, the larger the structural characteristic parameters, the better the relative sorting of the pores. When the difference in pore size is large, the relative sorting is poor, the pore size occupied by the wetting phase and the non-wetting phase is vastly different, the non-wetting phase preferentially occupies the large pore space, which inevitably results in a substantial increase in the relative permeability of the non-wetting phase, then the saturation of the intersection point is shifted to the left.
The structure coefficient φ indicates the degree of seepage and circuitous flow of the fluid in the pores, and the larger the φ value, the stronger the degree of pore bending and meandering. The pore curvature of Sample 68 is greater than that of Sample 58.
Skewness is a measure of the asymmetry of the pore throat size distribution. Skp value varies between±1, i.e. -1≤Skp≤1; Skp = 0, indicating that the pore distribution curve is symmetrical, Skp>0 for coarse skewness, Skp<0 for fine skewness. Samples 58 and 68 are fine skewness, i.e. the pore throat size distribution is biased in favor of fine pore throats.
Kurtosis measures of the steepness of the frequency curve, i.e., the ratio of throat diameters of the two tails (anterior and posterior) of the frequency curve distribution to the center of the curve. Kp=1, the pore distribution curve is normally distributed, Kp>1 is the peak curve, and Kp<1 is a flat or multimodal curve. The kurtosis value of the Sample 58 is smaller than that of the Sample 68.
The homogeneity coefficient α indicates the degree of concentration of the main infiltration pore channels. The homogeneity coefficients are similar for both samples, with Sample 58 having a higher concentration of percolation pore channels.
The homogeneity coefficient α indicates the concentration of the main percolation channels. The homogeneity coefficient was similar for both samples, Sample 58 had higher concentration of percolation pores and channels.

4.3.5 Micrometer Scale Characterization—CRMI

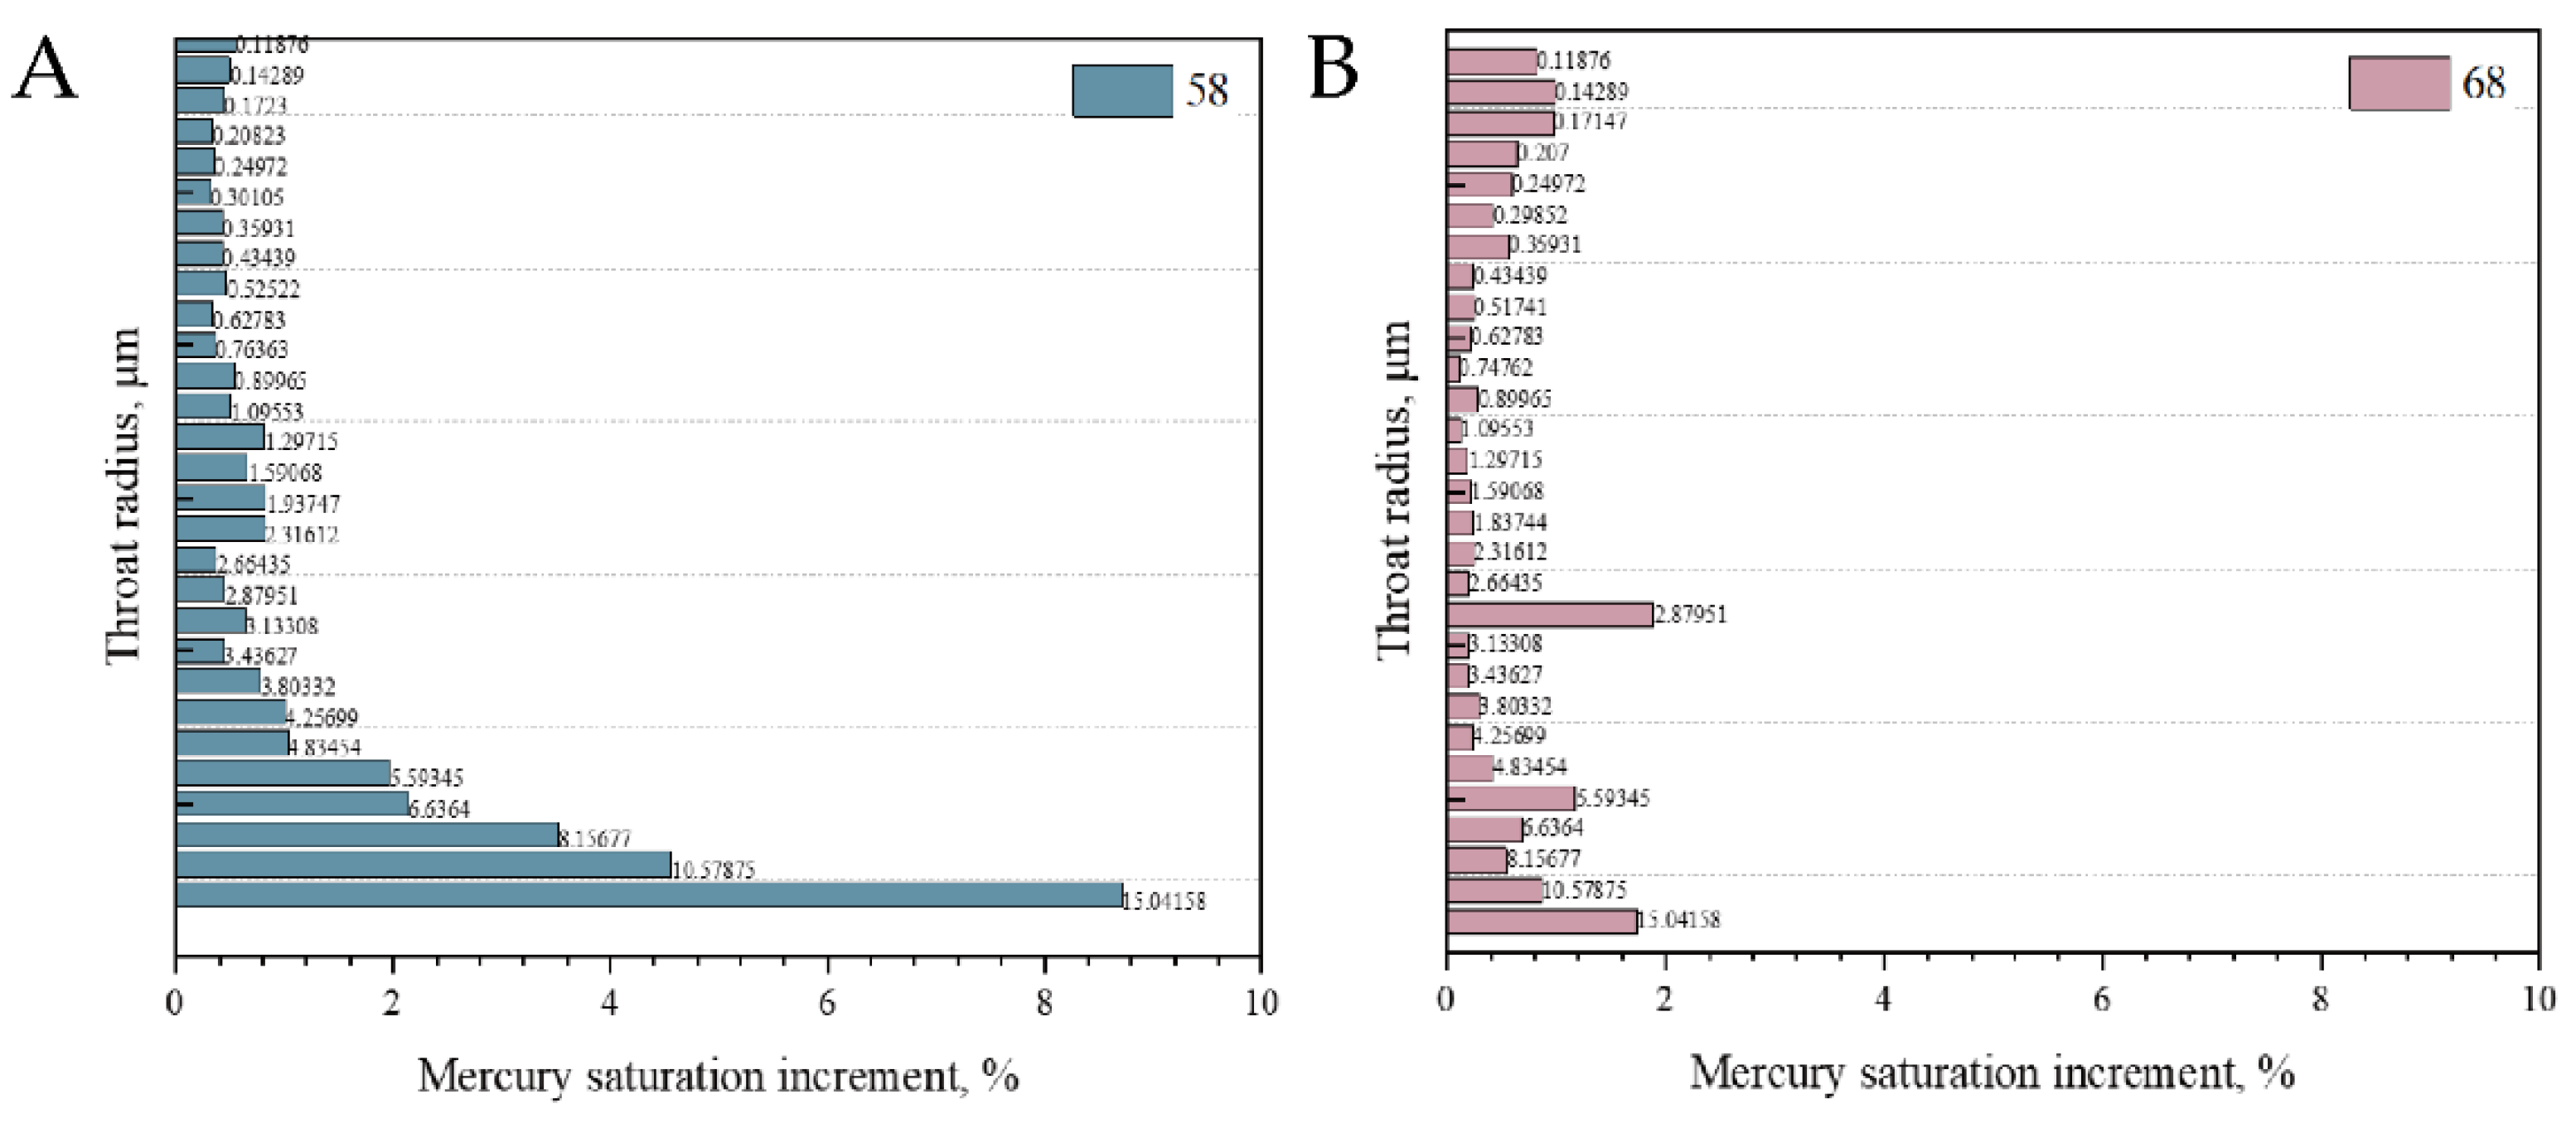
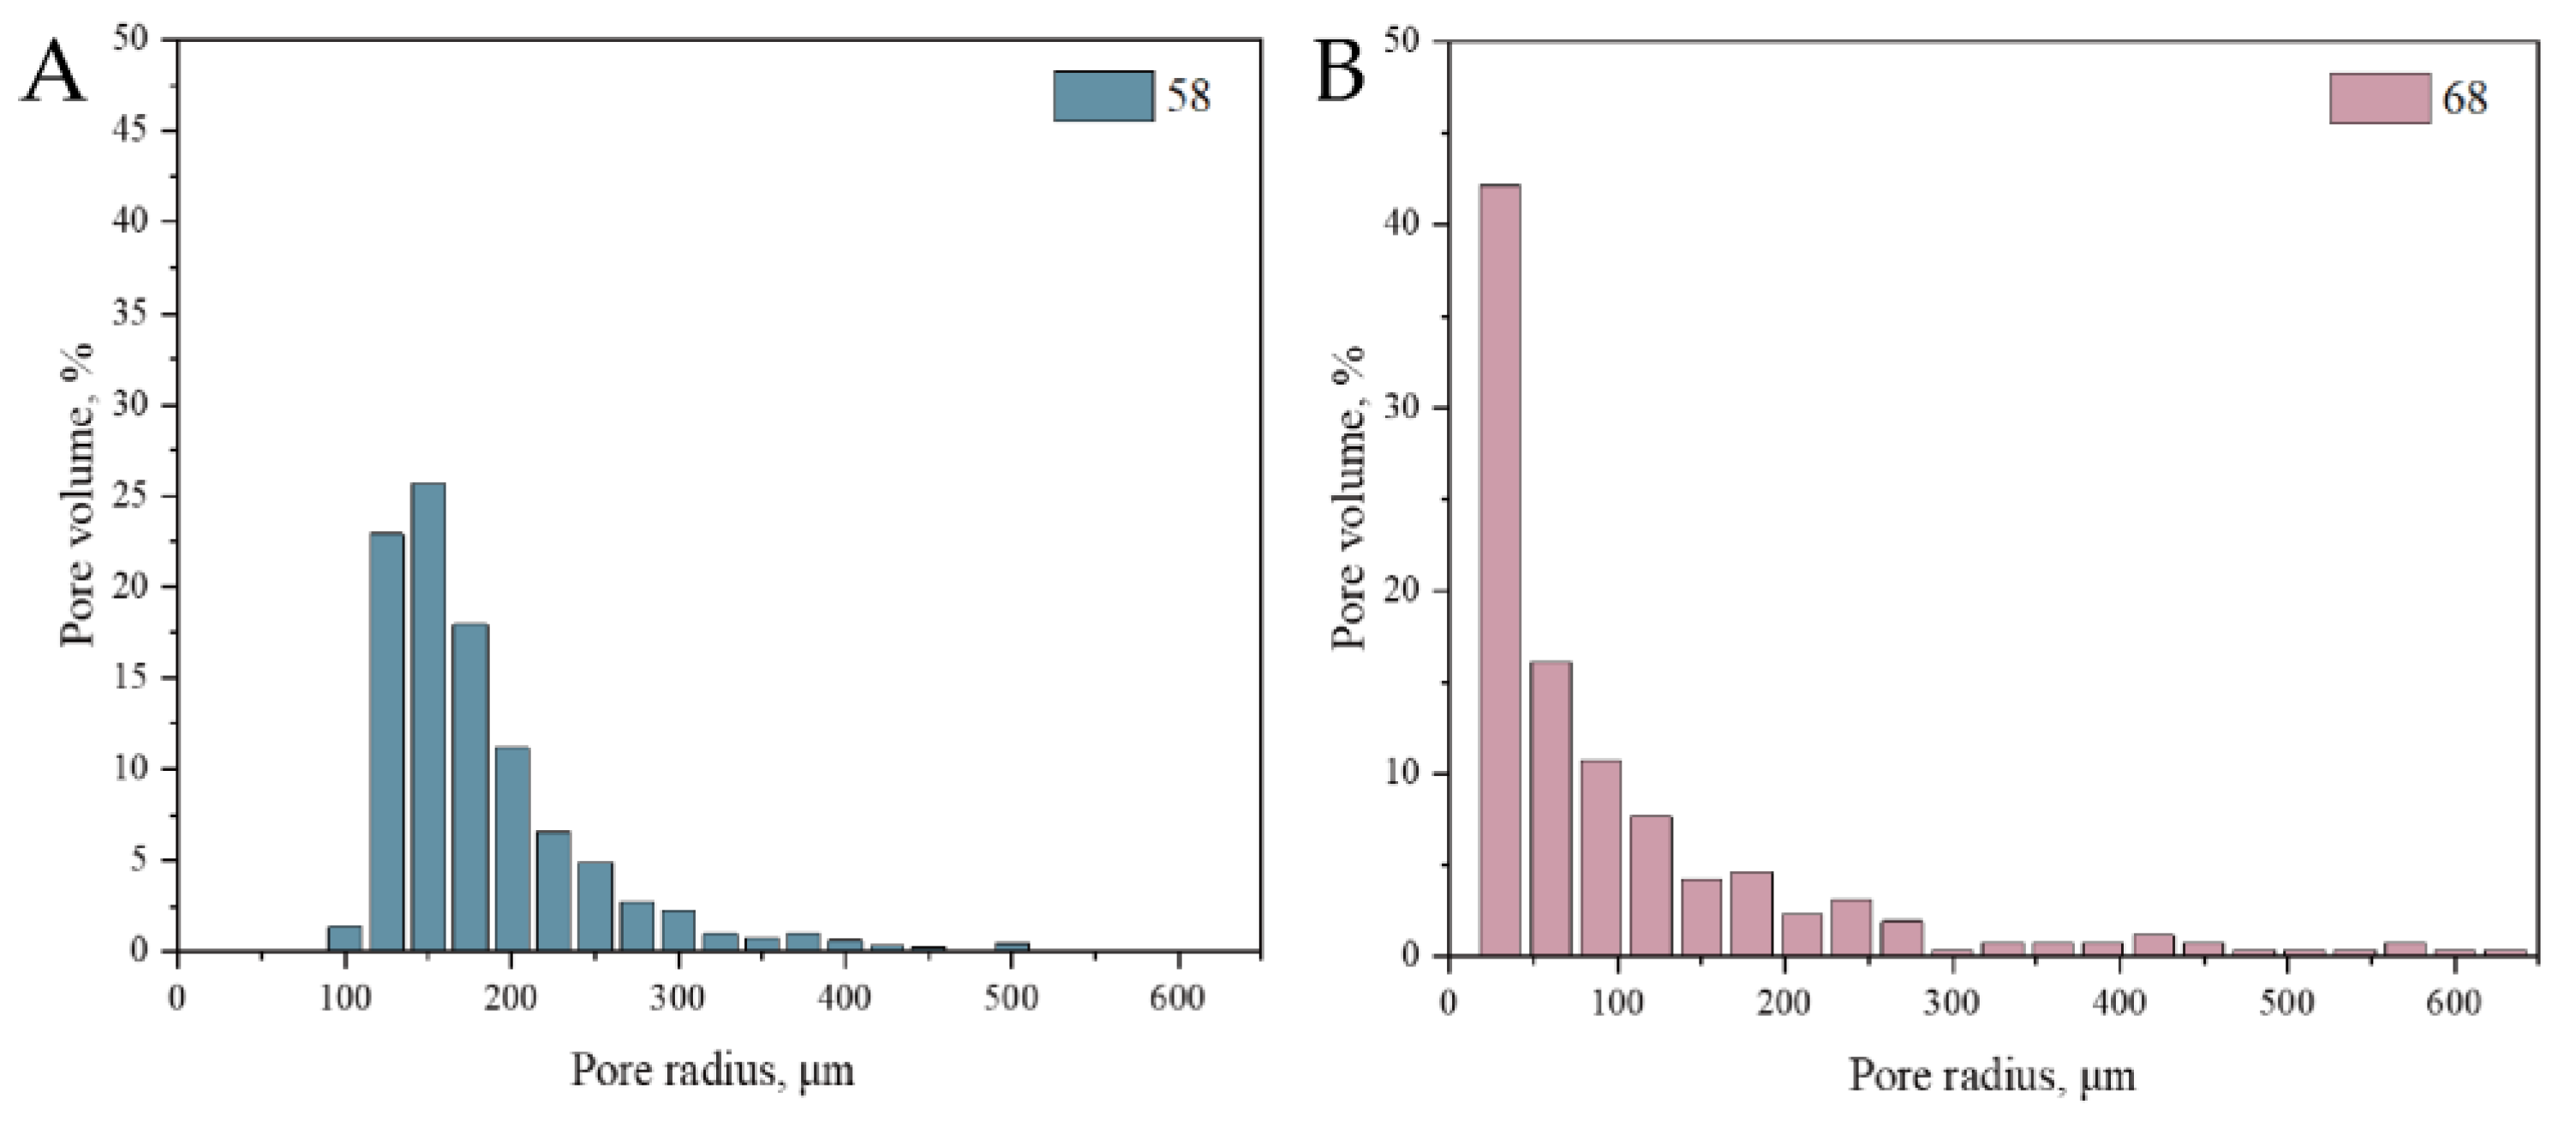
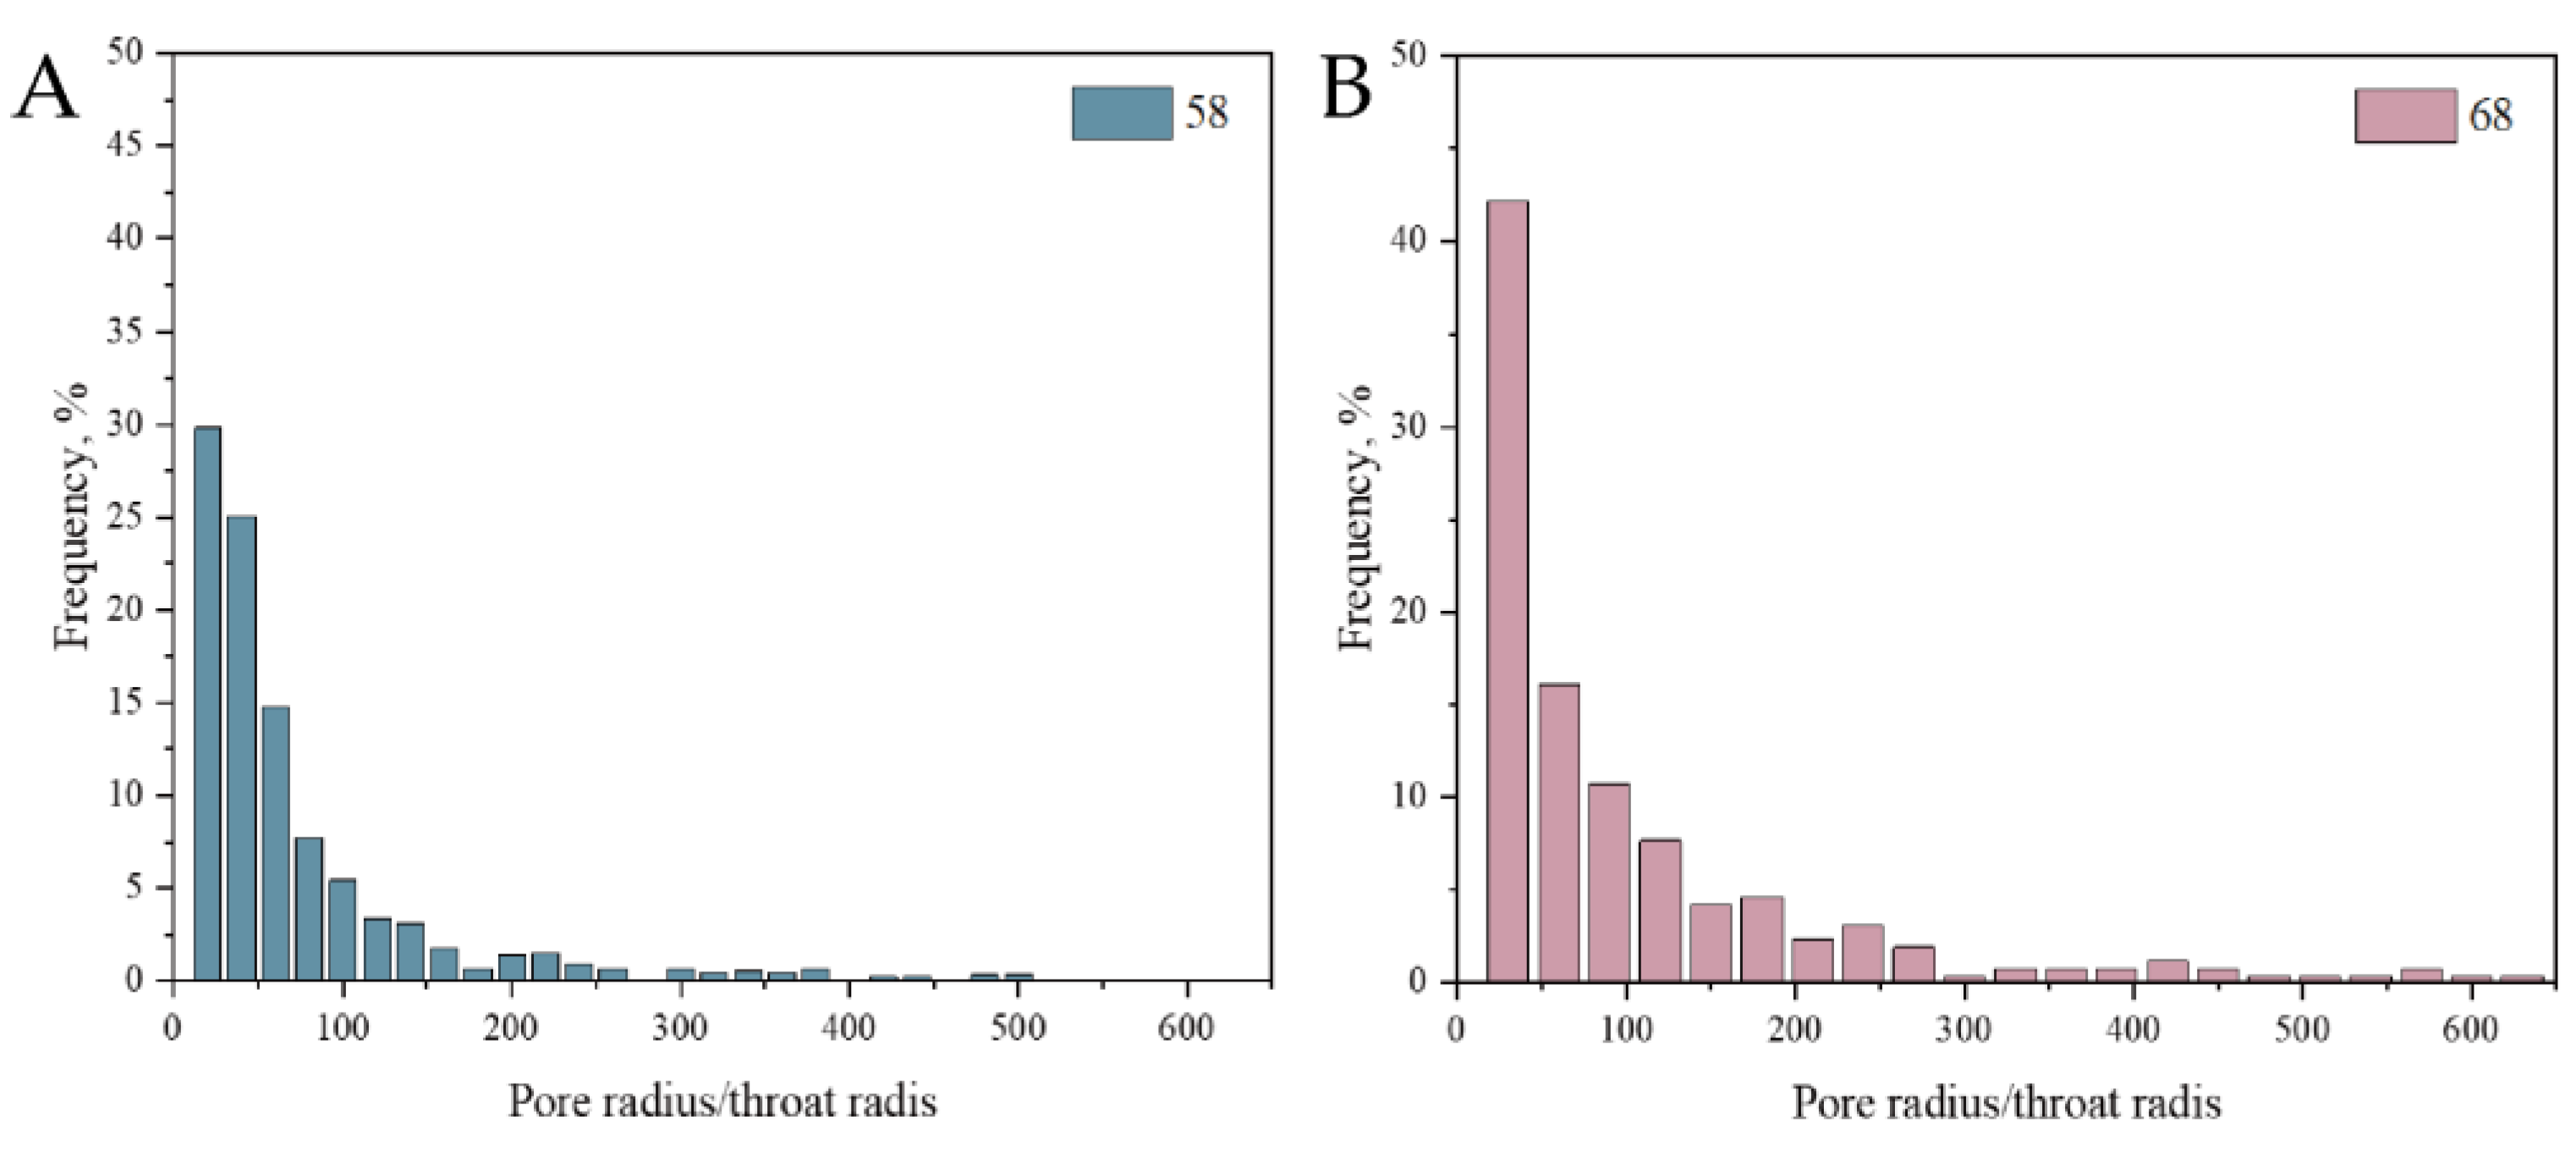
The parameters of CRMI, such as pore/throat radius distribution (Figure 20) and pore/throat radius ratio distribution (Figure 21), can accurately reflect the microstructure characteristics of the sediment.
Sample 58 showed a steady increase in mercury saturation increment Figure 20 (A), while Sample 68 showed an abnormally high value of mercury saturation at 3μm, with high mercury saturation below 1μm and above 5μm in Figure 20 (B),corroborating the findings from the HPMI experiments, Sample 58 has a higher concentration of percolation pores and channels.
The pore radius of Sample 58 is concentrated in the range of 100-300μm, with the peak occurring in the interval around 150μm (Figure 21, A). The pore radius of Sample 68 is mainly concentrated within 100μm, and the pore volume decreases with increasing pore radius, with the peak occurring in the range of 50μm (Figure 21, B).
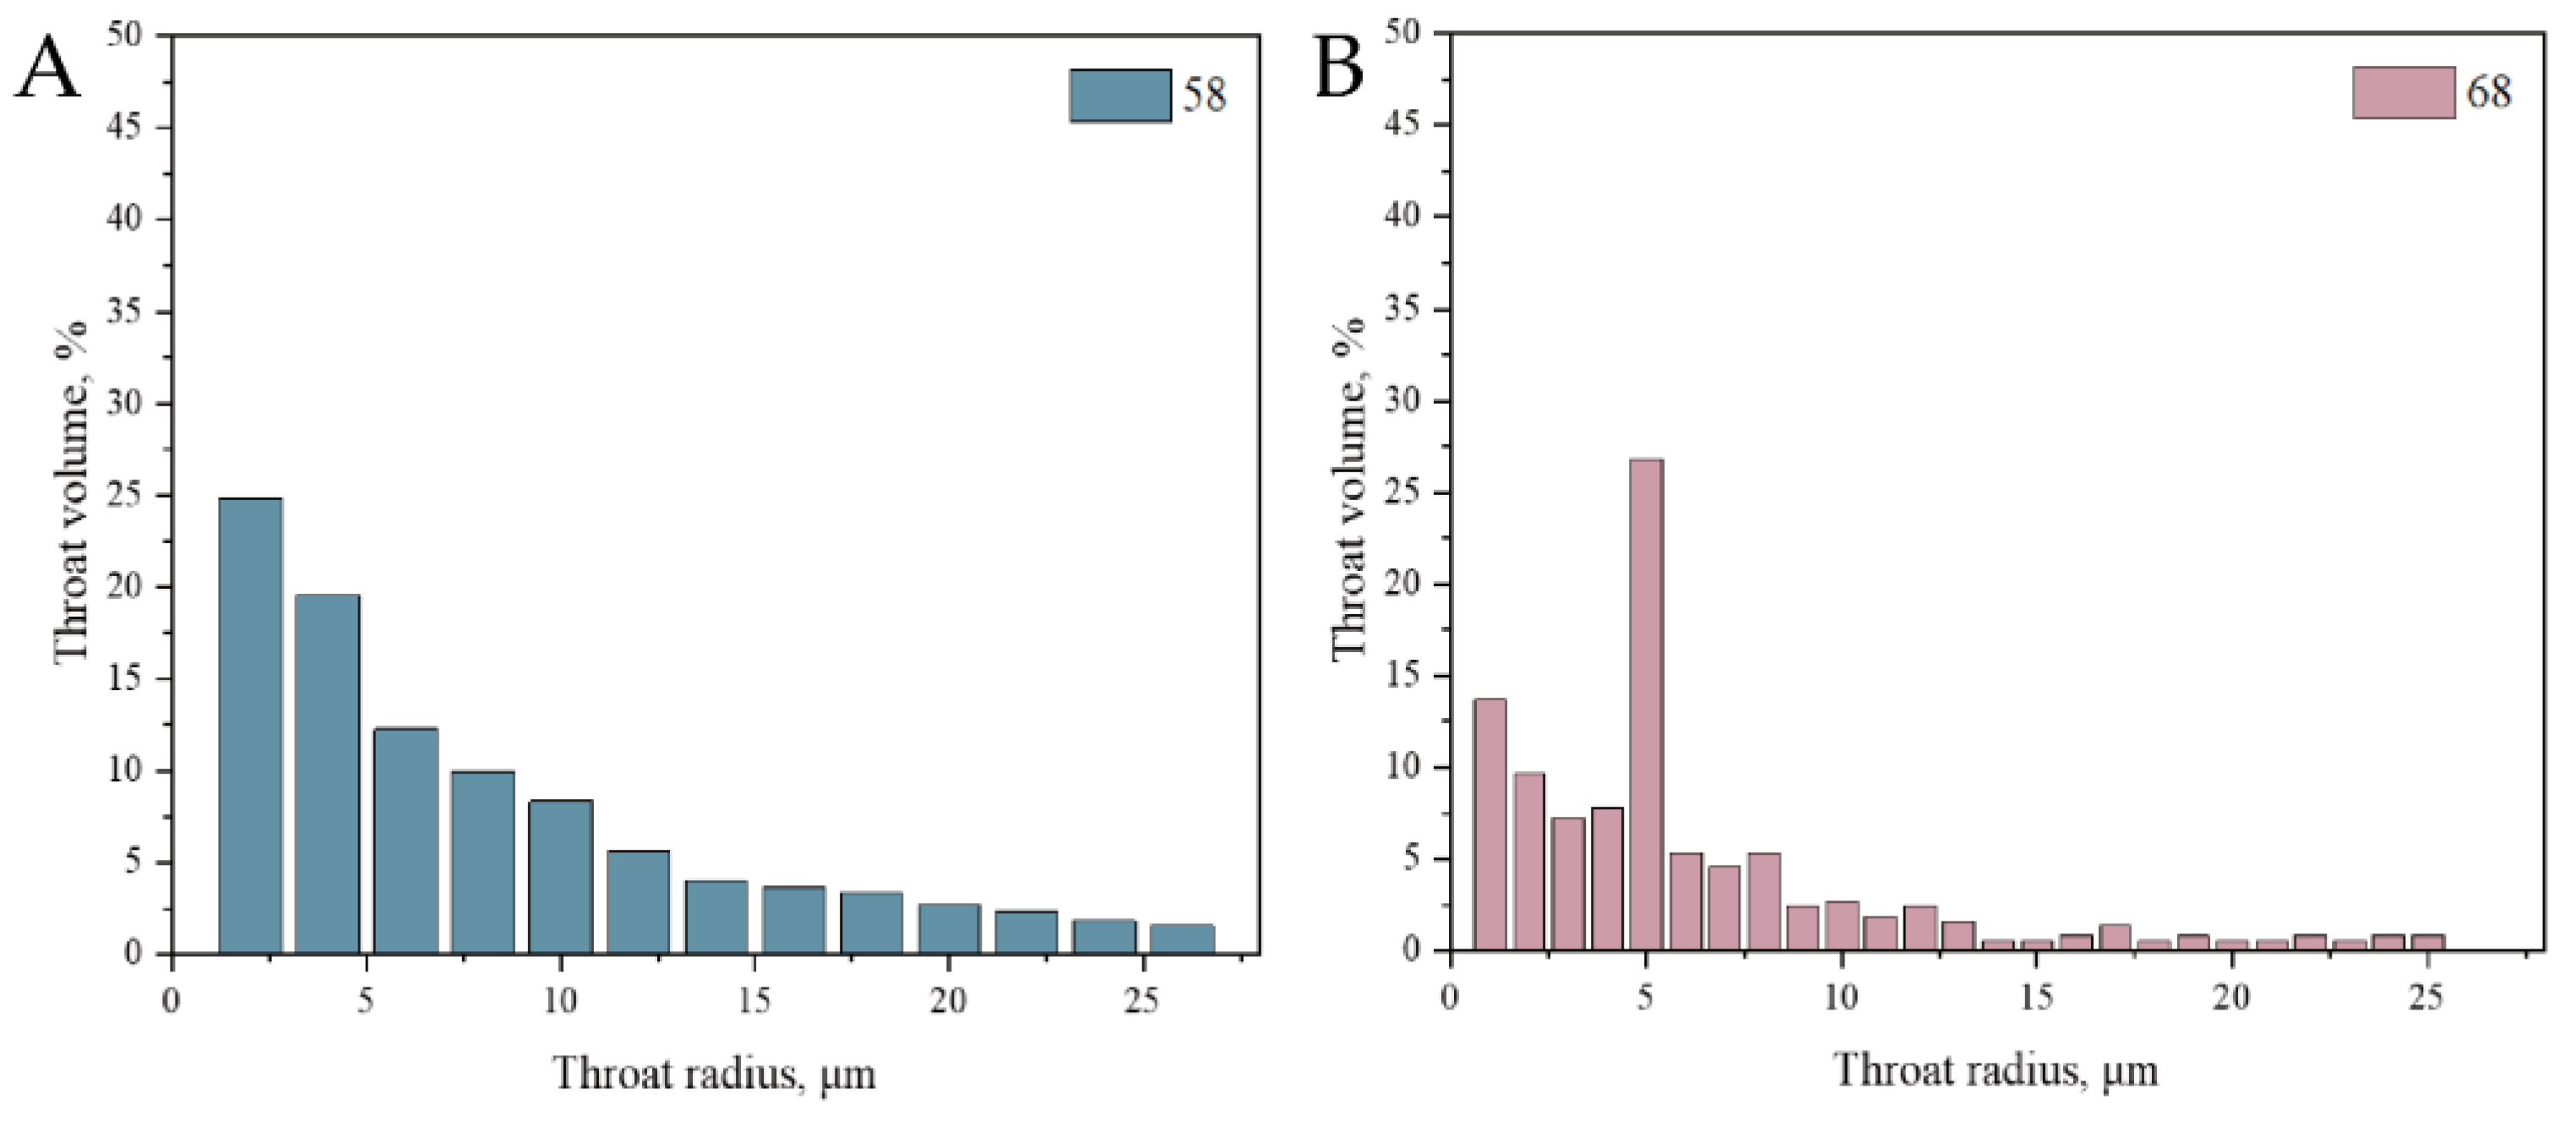
The throat radius of Sample 58 was distributed within 30μm and the pore volume decreased with increasing throat radius (Figure 22, C), and the throat radius of Sample 68 was distributed within 25μm, where the throat with a radius of less than 15μm accounted for the majority of the throat volume, the throat with radius of 5μm contributes to the largest volume of the throat (Figure 22, D).
Figure 23 shows the distribution frequencies of the ratio of pore radius to throat radius, respectively. The peak of the distribution frequency of Sample 68 was greater than that of Sample 58, which was mainly distributed within 200μm and Sample 68 was mainly distributed within 300μm.
Above all, Samples 58 and 68 all developed nanopores, the mineral distribution was relatively scattered, and they were rich in paleontological shells such as foraminifera, among which Sample 68 had more pyrite content, and abundant pyrite framboid was observed, which made the intergranular pore develop and provide more nanopores. Sample 58 has a high concentration of pore and throat, high pore connectivity, low pore curvature, and pores with a diameter of 10μm contributing to the main permeability, with an average pore radius of 2.495μm, whereas Sample 68 has poor pore connectivity, high curvature, and pores with a diameter of 1μm contributing to the main permeability, with an average pore diameter of 60 nm, which explains the obvious difference in permeability between the two samples.

5. Conclusions

This study aims to apply the characterization method of unconventional reservoirs to the sediment pore characterization of hydrate-bearing reservoirs, and integrate methods to obtain various information about pores, such as pore size distribution, porosity, average pore size, pore volume, pore specific surface area and other features, also three-dimensional spatial information of pores.
The results show that the nanoscale characterization methods include N2GA and NMRC. The NMRC method measured much larger total pore volume than the N2GA method, which is presumed to be due to the closed pores, while N2GA did not measure closed pore volume, resulting in large variation in the total pore volume comparison results.
In terms of micron scale characterization, HMPI highlights the permeability contribution of pore throat, while CRMI mainly focuses on the distinction between pore and larynx. The advantage of CTS is to observe the distribution of minerals, and SEM is suitable for studying intergranular pores.
The pore types of hydrate-bearing reservoirs in KG Basin are complex, and the pore morphology is diverse, including closed pores, open pores, ink-bottle pores, etc., and foraminifera shells and diatom shells provide storage space, in addition the connectivity between the pores is poor, 4-20μm pores contribute the most to permeability.

Funding

This study was funded by the DD20230063 and DD20221703 from the China Geological Survey and the Guangdong Major Project of Basic and Applied Basic Research (No.2020B0301030003).

Institutional Review Board Statement

Not applicable.

Informed Consent Statement

Not applicable.

Conflicts of Interest

The authors declare no conflict of interest.

References

  1. Lijith, K.P., R. Srinivasa Rao, and D. Narain Singh, Investigations on the influence of wellbore configuration and permeability anisotropy on the gas production from a turbidite hydrate reservoir of KG Basin. Fuel, 2022. 317. [CrossRef]
  2. Chaturvedi, E., M. Maiti, S. Laik, et al., Mineralogical and structural characterization of the sediments of Krishna Godavari and Mahanadi Basin and their influences on hydrate formation kinetics. Advanced Powder Technology, 2021. 32(4): p. 1247-1263. [CrossRef]
  3. Bhawangirkar, D.R., V.C. Nair, S.K. Prasad, et al., Natural Gas Hydrates in the Krishna-Godavari Basin Sediments under Marine Reservoir Conditions: Thermodynamics and Dissociation Kinetics using Thermal Stimulation. Energy & Fuels, 2021. 35(10): p. 8685-8698. [CrossRef]
  4. Liu, Z., L. Chen, Z. Wang, et al., Hydrate phase equilibria in natural sediments: Inhibition mechanism and NMR-based prediction method. Chemical Engineering Journal, 2023. 452. [CrossRef]
  5. Bian, H., L. Ai, K. Hellgardt, et al., Phase Behaviour of Methane Hydrates in Confined Media. Crystals, 2021. 11(2). [CrossRef]
  6. Zhang, Y., T. Wang, X. Li, et al., Decomposition behaviors of methane hydrate in porous media below the ice melting point by depressurization. Chinese Journal of Chemical Engineering, 2019. 27: p. 2207-2212.
  7. Lee, S. and Y. Seo, Experimental measurement and thermodynamic modeling of the mixed CH4 + C3H8 clathrate hydrate equilibria in silica gel pores: effects of pore size and salinity. Langmuir, 2010. 26(12): p. 9742-8. [CrossRef]
  8. Liu, H., S. Zhan, P. Guo, et al., Understanding the characteristic of methane hydrate equilibrium in materials and its potential application. Chemical Engineering Journal, 2018. 349: p. 775-781. [CrossRef]
  9. Fang, B., T. Lü, W. Li, et al., Microscopic insights into poly- and mono-crystalline methane hydrate dissociation in Na-montmorillonite pores at static and dynamic fluid conditions. Energy, 2024. 288. [CrossRef]
  10. Yoneda, J., M. Oshima, M. Kida, et al., Permeability variation and anisotropy of gas hydrate-bearing pressure-core sediments recovered from the Krishna–Godavari Basin, offshore India. Marine and Petroleum Geology, 2019. 108: p. 524-536. [CrossRef]
  11. Oshima, M., K. Suzuki, J. Yoneda, et al., Lithological properties of natural gas hydrate–bearing sediments in pressure-cores recovered from the Krishna–Godavari Basin. Marine and Petroleum Geology, 2019. 108: p. 439-470. [CrossRef]
  12. Yamamoto, K., Overview and introduction: Pressure core-sampling and analyses in the 2012–2013 MH21 offshore test of gas production from methane hydrates in the eastern Nankai Trough. Marine and Petroleum Geology, 2015. 66: p. 296-309. [CrossRef]
  13. Daigle, H. and A. Johnson, Combining Mercury Intrusion and Nuclear Magnetic Resonance Measurements Using Percolation Theory. Transport in Porous Media, 2015. 111(3): p. 669-679. [CrossRef]
  14. Daigle, H. and B. Dugan, Pore size controls on the base of the methane hydrate stability zone in the Kumano Basin, offshore Japan. Geophysical Research Letters, 2014. 41(22): p. 8021-8028. [CrossRef]
  15. Kocherla, M., D. Ray, M. Satyanarayanan, et al., Trace and rare earth element systematics of cold-seep carbonates from the Krishna-Godavari basin: A comparison between isotopically distinct carbonate deposits. Marine Chemistry, 2024. 259. [CrossRef]
  16. Singh, A. and M. Ojha, Machine learning in the classification of lithology using downhole NMR data of the NGHP-02 expedition in the Krishna-Godavari offshore Basin, India. Marine and Petroleum Geology, 2022. 135. [CrossRef]
  17. Peketi, A., A. Mazumdar, B. Sawant, et al., Biogeochemistry and trophic structure of a cold seep ecosystem, offshore Krishna-Godavari basin (east coast of India). Marine and Petroleum Geology, 2022. 138. [CrossRef]
  18. Nukapothula, S., C. Chen, and A.P. Yunus, Seasonal sediment plumes in the Krishna-Godavari basin using satellite observations. Deep Sea Research Part I: Oceanographic Research Papers, 2022. 188. [CrossRef]
  19. Rehitha, T.V., N.V. Madhu, P.V. Vipindas, et al., Influence of oil and gas exploration activities on the macrobenthic community structure of the Krishna-Godavari basin (Ravva coast), Western Bay of Bengal. Continental Shelf Research, 2021. 224. [CrossRef]
  20. Chatterjee, R., D.K. Singha, M. Ojha, et al., Porosity estimation from pre-stack seismic data in gas-hydrate bearing sediments, Krishna-Godavari basin, India. Journal of Natural Gas Science and Engineering, 2016. 33: p. 562-572. [CrossRef]
  21. Qiao, J., J. Zeng, S. Jiang, et al., Heterogeneity of reservoir quality and gas accumulation in tight sandstone reservoirs revealed by pore structure characterization and physical simulation. Fuel, 2019. 253: p. 1300-1316. [CrossRef]
  22. Mazumdar, A., M. Kocherla, M.A. Carvalho, et al., Geochemical characterization of the Krishna–Godavari and Mahanadi offshore basin (Bay of Bengal) sediments: A comparative study of provenance. Marine and Petroleum Geology, 2015. 60: p. 18-33. [CrossRef]
  23. Xie, S., Q. Cheng, Q. Ling, et al., Fractal and multifractal analysis of carbonate pore-scale digital images of petroleum reservoirs. Marine and Petroleum Geology, 2010. 27(2): p. 476-485. [CrossRef]
  24. Liu, X. and B. Nie, Fractal characteristics of coal samples utilizing image analysis and gas adsorption. Fuel, 2016. 182: p. 314-322. [CrossRef]
  25. Liu, J., C. Zhang, Y. Jiang, et al., Investigation on pore structure characteristics of ultra-tight sandstone reservoirs in the upper Triassic Xujiahe Formation of the northern Sichuan Basin, China. Marine and Petroleum Geology, 2022. 138. [CrossRef]
  26. Qin, Y., S. Yao, H. Xiao, et al., Pore structure and connectivity of tight sandstone reservoirs in petroleum basins: A review and application of new methodologies to the Late Triassic Ordos Basin, China. Marine and Petroleum Geology, 2021. 129. [CrossRef]
  27. Fleury, M., T. Chevalier, R. Jorand, et al., Oil-water pore occupancy in the Vaca Muerta source-rocks by NMR cryoporometry. Microporous and Mesoporous Materials, 2021. 311. [CrossRef]
  28. Zhao, Y., L. Peng, S. Liu, et al., Pore structure characterization of shales using synchrotron SAXS and NMR cryoporometry. Marine and Petroleum Geology, 2019. 102: p. 116-125. [CrossRef]
  29. Yin, T., D. Liu, Y. Cai, et al., Methane adsorption constrained by pore structure in high-rank coals using FESEM, CO2 adsorption, and NMRC techniques. Energy Science & Engineering, 2019. 7(1): p. 255-271. [CrossRef]
  30. Zhou, T., C. Wu, Z. Shi, et al., Multi-Scale Quantitative Characterization of Pore Distribution Networks in Tight Sandstone by integrating FE-SEM, HPMI, and NMR with the Constrained Least Squares Algorithm. Energies, 2019. 12(18). [CrossRef]
  31. Zhang, M. and X. Fu, Characterization of pore structure and its impact on methane adsorption capacity for semi-anthracite in Shizhuangnan Block, Qinshui Basin. Journal of Natural Gas Science and Engineering, 2018. 60: p. 49-62. [CrossRef]
  32. Zhang, H., J. Shen, G. Wang, et al., Experimental study on the effect of high-temperature nitrogen immersion on the nanoscale pore structure of different lithotypes of coal. Energy, 2023. 284. [CrossRef]
  33. Xiong, J., X. Liu, and L. Liang, Experimental study on the pore structure characteristics of the Upper Ordovician Wufeng Formation shale in the southwest portion of the Sichuan Basin, China. Journal of Natural Gas Science and Engineering, 2015. 22: p. 530-539. [CrossRef]
  34. Wang, Z., C. Hao, X. Wang, et al., Effects of micro-mesopore structure characteristics on methane adsorption capacity of medium rank coal. Fuel, 2023. 351. [CrossRef]
  35. Wang, X., M. Wang, J. Li, et al., Thermal maturity: The controlling factor of wettability, pore structure, and oil content in the lacustrine Qingshankou shale, Songliao Basin. Journal of Petroleum Science and Engineering, 2022. 215. [CrossRef]
  36. Wang, X., J. Geng, D. Zhang, et al., Influence of sub-supercritical CO2 on pore structure and fractal characteristics of anthracite: An experimental study. Energy, 2022. 261. [CrossRef]
  37. Yu, S., J. Bo, L. Ming, et al., A review on pore-fractures in tectonically deformed coals. Fuel, 2020. 278. [CrossRef]
  38. Zang, Q., C. Liu, R.S. Awan, et al., Occurrence characteristics of the movable fluid in heterogeneous sandstone reservoir based on fractal analysis of NMR data: A case study of the Chang 7 Member of Ansai Block, Ordos Basin, China. Journal of Petroleum Science and Engineering, 2022. 214. [CrossRef]
  39. Brunelli, D.N. and R.T. Skodje, Kinetics of multicomponent nanosize clusters on solid surfaces. Langmuir, 2003. 19: p. 7130-7140.
  40. Sliwinska-Bartkowiak, M., G. Dudziak, R. Sikorski, et al., Melting/freezing behavior of a fluid confined in porous glasses and MCM-41: Dielectric spectroscopy and molecular simulation. The Journal of Chemical Physics, 2001. 114(2): p. 950-962. [CrossRef]
  41. Sliwinska-Bartkowiak, M. and M. Jazdzewska, Melting behavior of bromobenzene within carbon nanotubes. J. Chem. Eng. Data, 2010. 55: p. 4183–4189.
  42. Coasne, B., J. Czwartos, M. Sliwinska-Bartkowiak, et al., Effect of pressure on the freezing of pure fluids and mixtures confined in nanopores. J. Phys. Chem. B 2009.
  43. Jaeger, F., S. Bowe, H. Van As, et al., Evaluation of 1H NMR relaxometry for the assessment of pore-size distribution in soil samples. European Journal of Soil Science, 2009. 60(6): p. 1052-1064. [CrossRef]
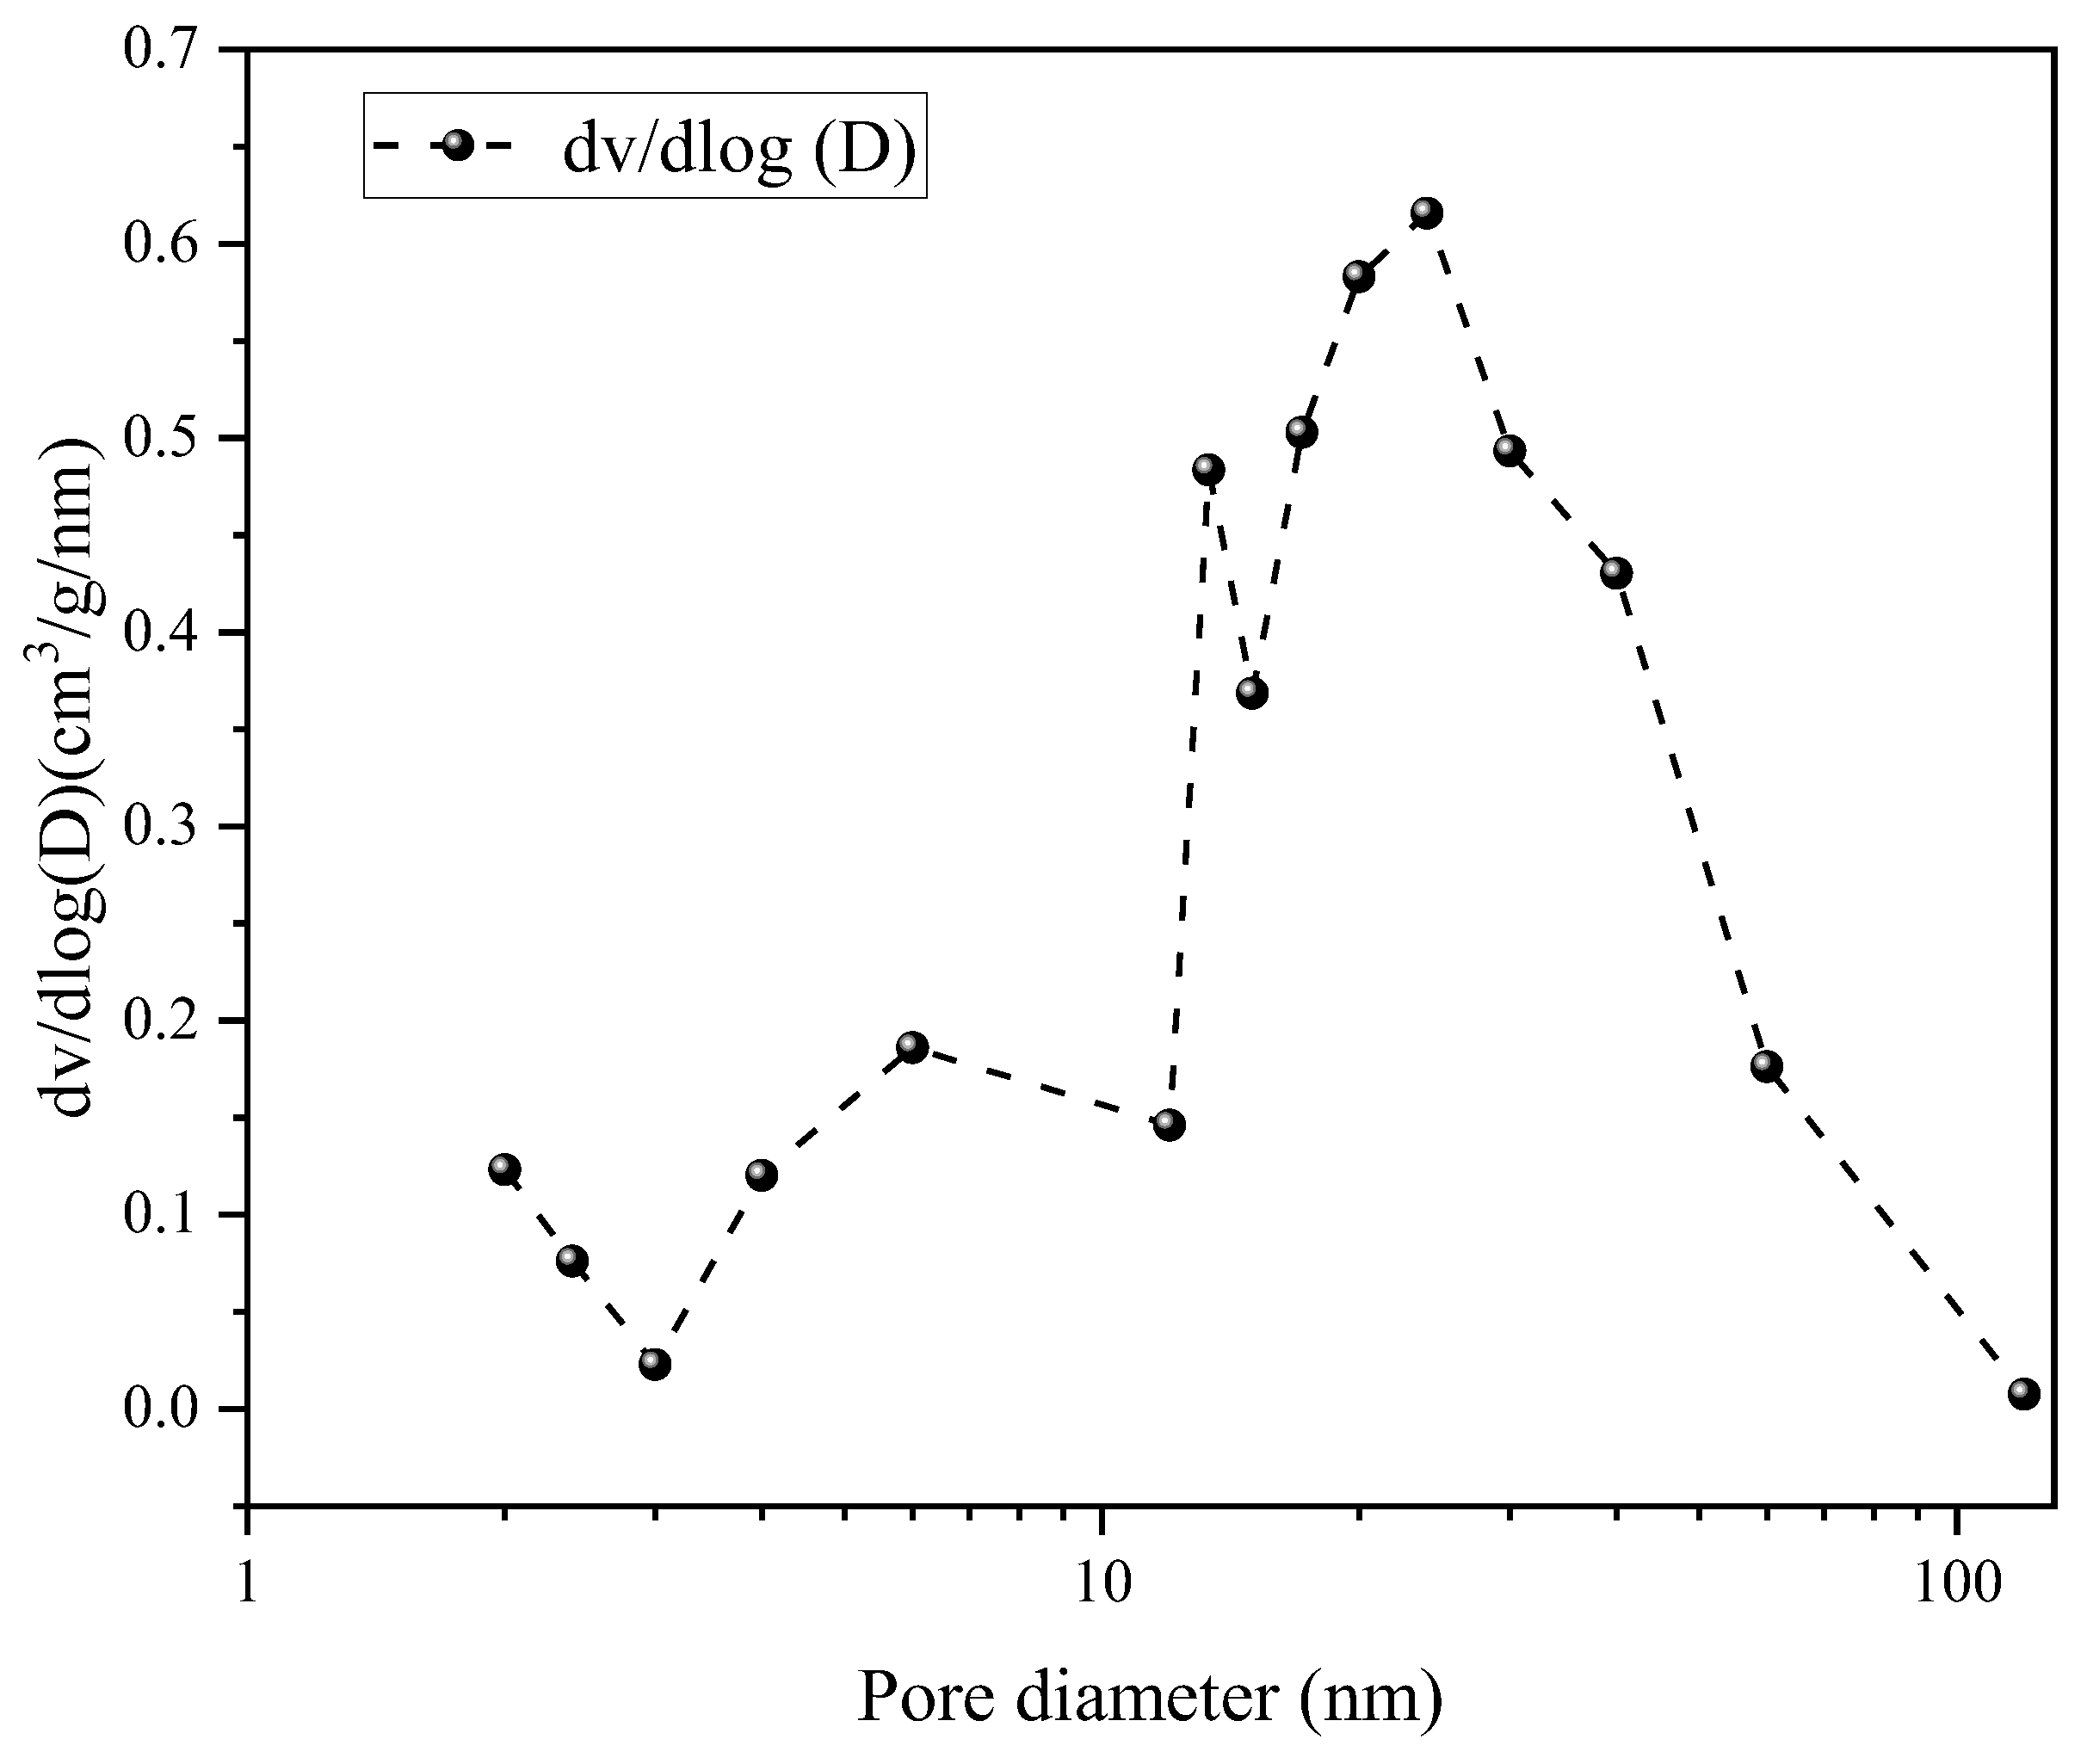
Figure 16. The PSDs of the hydrate-bearing Sample 58.
Preprints 115611 g016
Figure 17. Schematic diagram of pore volume and water content variation with pore size.
Preprints 115611 g017
Figure 18. Capillary pressure curves of mercury intrusion and extrusion obtained by HPMI.
Preprints 115611 g018
Figure 19. The pore throat size distribution and its contribution to the permeability of Sample 68 obtained by HPMI.
Preprints 115611 g019
Figure 20. Schematic of mercury saturation as a function of constant velocity mercury pressing.A, B: Variation of throat radius with incremental mercury saturation for Samples 58 and 68.
Preprints 115611 g020
Figure 21. Schematic diagram of pore and throat radius for CRMI.A, B: Schematic diagram of pore volume variation with pore radius for Samples 58 and 68
Preprints 115611 g021
Figure 22. Schematic diagram of pore and throat radius for CRMI. A, B: Schematic diagram of the variation of throat volume with throat radius for Samples 58 and 68.
Preprints 115611 g022
Figure 23. Schematic diagram of pore and throat radius for CRMI.A, B: Frequency diagrams of the ratio of pore radius to throat radius for Samples 58 and 68
Preprints 115611 g023
Table 1. Pore structure parameters of samples.
Sample BET surface area (m2/g) BJH pore volume (cc/g)
58 76.232 0.108
68 64.751 0.110
Table 2. Parameters of pore throat size in hydrate-bearing reservoir from HPMI.
Permeability Porosity Pore throat radius Pore throat size distribution Permeability distribution
10-3μm2 (%) Maximum Average Median Peak position Peak value Peak position Peak value
(μm) (%) (μm) (%)
K φ Ra Rp R50 Rv Rm Rf Fm
160.8 36.04 13.368 2.937 0.035 0.025 10.769 10.000 63.510
0.142 31.44 1.088 0.114 0.031 0.025 16.868 0.630 59.533
Table 3. Parameters of pore throat structure in hydrate-bearing reservoir from HPMI.
Sorting factor Skewness Kurtosis Mean radius (μm) Structural coefficient Relative sorting coefficient Characteristic structural parameters Homogeneity coefficient
Sp Skp Kp Dm Φ D 1/DΦ α
4.273 -0.494 0.622 2.495 2.417 1.713 0.242 0.220
2.184 -0.146 1.312 0.060 3.622 36.264 0.008 0.105
Disclaimer/Publisher’s Note: The statements, opinions and data contained in all publications are solely those of the individual author(s) and contributor(s) and not of MDPI and/or the editor(s). MDPI and/or the editor(s) disclaim responsibility for any injury to people or property resulting from any ideas, methods, instructions or products referred to in the content.
Copyright: This open access article is published under a Creative Commons CC BY 4.0 license, which permit the free download, distribution, and reuse, provided that the author and preprint are cited in any reuse.
Prerpints.org logo

Preprints.org is a free preprint server supported by MDPI in Basel, Switzerland.

Subscribe

© 2024 MDPI (Basel, Switzerland) unless otherwise stated