1. Introduction
Ocean warming trends associated with climate change and the ongoing loss of sea ice extent, stability and quality are causing rapid and dramatic changes in Arctic marine ecosystems [
1,
2,
3]. One such change is the possibility of an increase in the prevalence of
Alexandrium catenella, which causes HABs. This alga forms resting cysts that remain in the sediment until conditions are favorable for germination and subsequent HABs. Recent studies have revealed massive occurrences of
A. catenella cysts in sediments of the Bering Sea and Chukchi Sea, which are among the largest and densest in the [
4,
5]. There are well-founded concerns that climate change will facilitate the initiation of larger HABs and lead to frequent toxic blooms [
5].
The subject of this study is the microalga
A. catenella (Whedon & Kofoid) Balech, 1985, which belongs to the division
Dinoflagellata. Dinoflagellates of the genus
Alexandrium cause harmful algal blooms (HABs) in coastal waters around the world, damaging marine ecosystems, aquaculture, and human health [
6]. This microalgae can produce potent neurotoxic alkaloids known as saxitoxins (STX) or paralytic shellfish toxins (PST), which can contaminate seafood and cause the human disease known as paralytic shellfish poisoning (PSP) [
7].
A. catenella is interesting because this species causes large-scale toxic blooms in various areas of the world's oceans [
8,
9,
10,
11], and in Russian waters of the Far East, particularly in the Bering Sea, where cases of human poisoning have been reported after eating bivalves contaminated with PST [
12].
The threat posed by toxic microalgae has a profound impact on the economic well-being of countries most dependent on marine fisheries and aquaculture [
13,
14].
A. catenella primarily affects bivalve fisheries, such as those in the Gulf of Maine, USA. In 2005, losses from this microalgae bloom cost the government
$50 million [
15,
16]. To ensure human safety, potentially toxic catch is destroyed. That's why order to reduce economic losses from HAB, it is important to stop fishing in a timely manner, to prevent poisoned objects from getting into the catch. Early detection of increases in toxic microalgae abundance is the important goal for HABs monitoring.
Monitoring the concentration of microalgae in most cases occurs through systematic sampling and study of water samples in laboratory conditions. Obviously, this method of monitoring is routine, requires a high degree of personnel training and has such disadvantages as long analysis time and limited monitoring frequency in time. A promising monitoring method is the use of satellite systems, for example, through MERIS (MEdium Resolution Imaging Spectrometer) [
15,
17] or MODIS (The Moderate Resolution Imaging Spectroradiometer) [
18] sensors. Satellites have a limited frequency of measurements, since not all of them have the appropriate sensors installed, and a satellite can only measure the spectrum of a certain water area a second time after making a full pass through the orbit. Nevertheless, the most important limitation of the satellite method is the fact that harmful blooms of
A. catenella often occur at concentrations of microalgae that do not cause a significant change in the color of the sea surface, and therefore are not sufficient for satellite detection [
15]. Also important is the strong influence of weather on the quality of measurements, for example storm waves or clouds. In addition, satellite methods are not always reliable in determining the species or genera of blooming microalgae, which can be catastrophically important.
We have repeatedly noted the need and possibility to organize automated monitoring of the state of marine areas by an indirect methods, by measuring characteristics associated with the life activity of marine organisms [
19,
20]. One of the promising directions, from our point of view, is the use of parameters of laser-induced fluorescence (LIF) of microalgae and their dependence on temperature [
20,
21]. The ability to measure LIF in real time in situ makes it possible to eliminate the influence of errors during sampling, weather, atmospheric phenomena, etc. on the quality and frequency of measurements. In addition, the ability to repeat measurements at any time intervals potentially makes it possible to monitor the growth of blooms in almost real time and respond to them in a timely manner.
Aim of our study is identifying the characteristic features of the LIF parameters of the microalgae
A. catenella and their changes during enrichment cultivation. The results obtained are expected to be used in the future to develop a technique for fluorescent detection of “blooming” microalgae dominant in specific water areas and to determine the stage of their blooming. To increase the reliability of the results obtained, the culture
Prorocentrum cordatum (Ostenfeld) J. D. Dodge 1976, also blooming, and belonging to a different dinoflagellates, was studied parallel. This microalgae may be a source of venerupine poisoning (VSP) [
22], which occurs after eating shellfish.
2. Materials and Methods
2.1. Cultivation of Microalgae
In this work, we study cultures of microalgae
Alexandrium catenella (MBRU_AL21) and
Prorocentrum cordatum (MBRU_Pr_cor-17) from the collection of the Marine Biobank Center for Collective Use of the National Scientific Center for Marine Biology, Far Eastern Branch of the Russian Academy of Sciences (
https://marbank.dvo.ru).
All studied microalgae cultures were sown in a sterile f/2 nutrient medium. Cultivation was carried out in a “Binder” climate camera at a set temperature of 20°C, illumination by lamp of 3500 lux (Lumilux T5 HO 39 W/830, Osram), photoperiod was set at 12:12 (light/dark). The number of cells during the growth process was taken into account using an EVOS M5000 imaging system from Thermo Fisher Scientific (USA). For measurements over 35 days, each culture was sown in 30 (350 ml) bottles. Culture studies were carried out on days 3, 7, 10, 14, 17, 21, 24, 28, 31, 35. On each of these days, cultures from 3 bottles were studied, which made it possible to perform statistical processing.
2.2. Fluorescence Measurements
The laser-induced fluorescence (LIF) method is based on the excitation of microalgae fluorescence by coherent laser radiation. The excitation wavelength in our measurement system is 445 nm, and the average power at the laser output is 500 mW. The narrow spectrum of exciting radiation allows us to excite only the pigments of interest to us in the photosynthetic apparatus of microalgae. This is important due to the fact that for most microalgae chlorophyll-a is the only fluorescent pigment, and by exciting it, we bypass the chain of transfer of absorbed energy throughout the pigment complex, which makes fluorescence analysis simpler and more convenient. We use the technique of linear heating of samples to critical temperatures and the dependence of the fluorescent characteristics of microalgae on temperature, because fluorescence spectra of microalgae under normal conditions differ slightly. This technique has already was described by us. It show the ability to successfully distinguish microalgae at the genus level [
20,
21], including doing this in an automated mode [
23].
The main idea of our technique is the measurement of fluorescence temperature spectra (FTS), that three-dimensional surfaces formed by fluorescence spectra measured at a constant step with a linear increase in temperature. Our studies use a temperature range from 20 to 80°C, a heating rate of 1°C/min, and the spectra are measured in accordance with the step, that is, every 1°C. Exposure of microalgae to such a temperatures leads to irreversible changes in the cells and their structures, such as the photosynthetic apparatus. Due to the diversity of the internal structure, the destruction of the photosynthetic apparatus occurs in different ways, which is also expressed in the difference in the dynamics of changes in the LIF spectra. The technique for measuring and processing FTS to obtain fluorescent characteristics is described in more detail in [
23]. The result fluorescence temperature spectra, some of which are given in supplementary materials S1-2, 14-15. In this article, we will analyze such important fluorescent parameters obtained from TSF as:
the dependence of the normalized intensity of the fluorescence maximum on temperature, called the normalized fluorescence temperature curve (NFTC);
the dependence of the integrated fluorescence temperature curve (IFTC);
the dependence of the wavelength of the maximum fluorescence, called the wavelength fluorescence temperature curves (WFTCs).
2.3. Cytometry
The growth dynamics of cell cultures were studied by flow cytometry. The analysis was performed on a CytoFLEX flow cytometer (Beckman Coulter, USA), using a blue laser (wavelength 488 nm) for excitation. Data collection and automatic recording were carried out at a constant speed of movement of the cell suspension in the flow cell (50 μl/min), limiting the sample collection time (60 sec). Single cells (singlet) were differentiated from debris and cell aggregates by the ratio of the integral signal of direct light scattering (FSC-A), time of direct light scattering signal and the integral signal of chlorophyll-a fluorescence (PC5.5-A). Cell density was determined as the absolute number of singlet in 1 ml of sample. When taking each sample in the area of singlet, the average value of chlorophyll-a fluorescence intensity (light emission with a wavelength of 690 nm) and the average values of light scattering parameters. The concentration of chlorophyll-a was considered proportional to the fluorescent signal. All measurements were carried out in six replicates.
2.4. Analysis of Pigment Composition
The analysis of the pigment composition was carried out by high-performance liquid chromatography (HPLC) according to standard methods. The pigments were separated on an LC-20A chromatograph. First, pigments of microalgae from 300 ml samples volume were extracted with acetone. Second, the extracts were filtered through a membrane filter with a pore size of 0.45 μm. After sample preparation, a volume of 100 μl of material was introduced into the chromatographic column. While moving along the sorbent in the flow of the mobile phase, the sample components are repeatedly sorbed by the stationary phase and then desorbed again. Due to unequal affinity for the sorbent, different compounds move through the column at different speeds and reach the detector connected to the output of the chromatographic column sequentially at different times. Detection is carried out by recording absorption in the UV region of the spectrum. Pigments from microalgae samples were extracted with acetone. The extracts were filtered through a membrane filter (Microporous film material made from a mixture of cellulose acetates with a pore size of 0.45 µm and a total porosity of 80–85%. Manufacturer: Russia. Disc diameter: 47 mm.) with a pore size of 0.45 μm.
3. Results and Discussion
3.1. LIF parameters of A. catenella
The results of fluorescent studies of the culture of
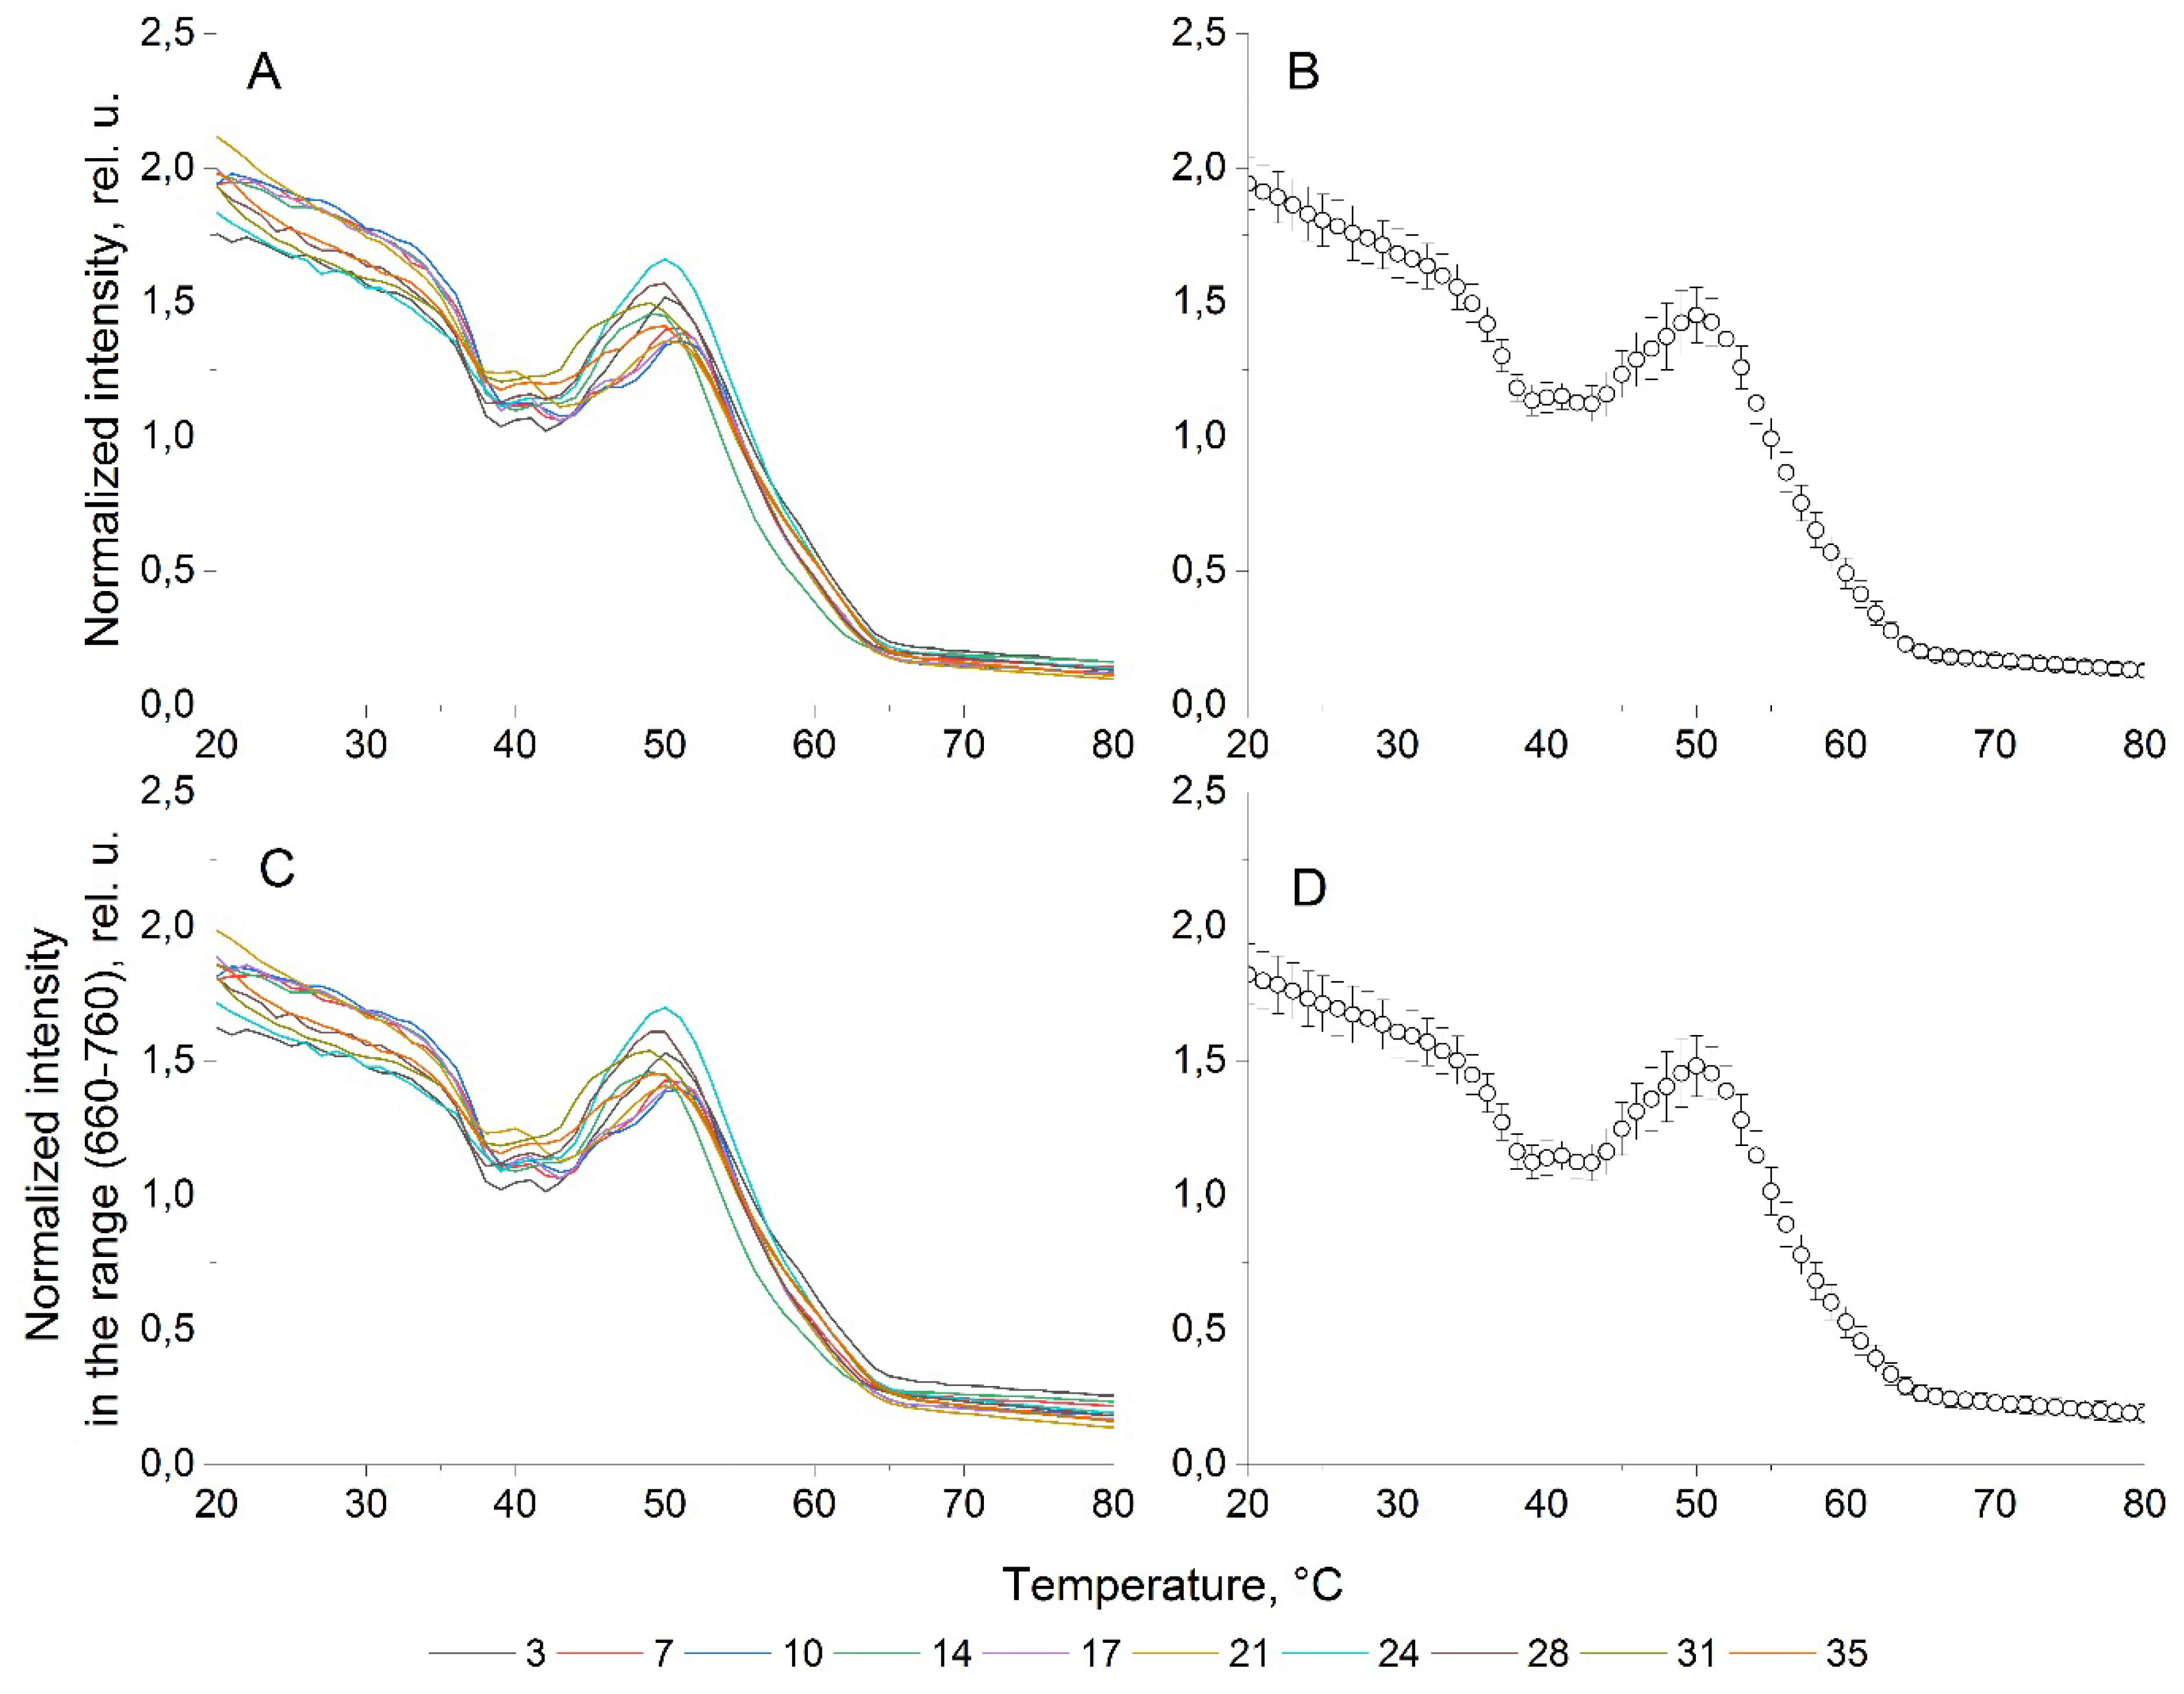
A. catenella in the form of NFTC and IFTC are presented in
Figure 1.
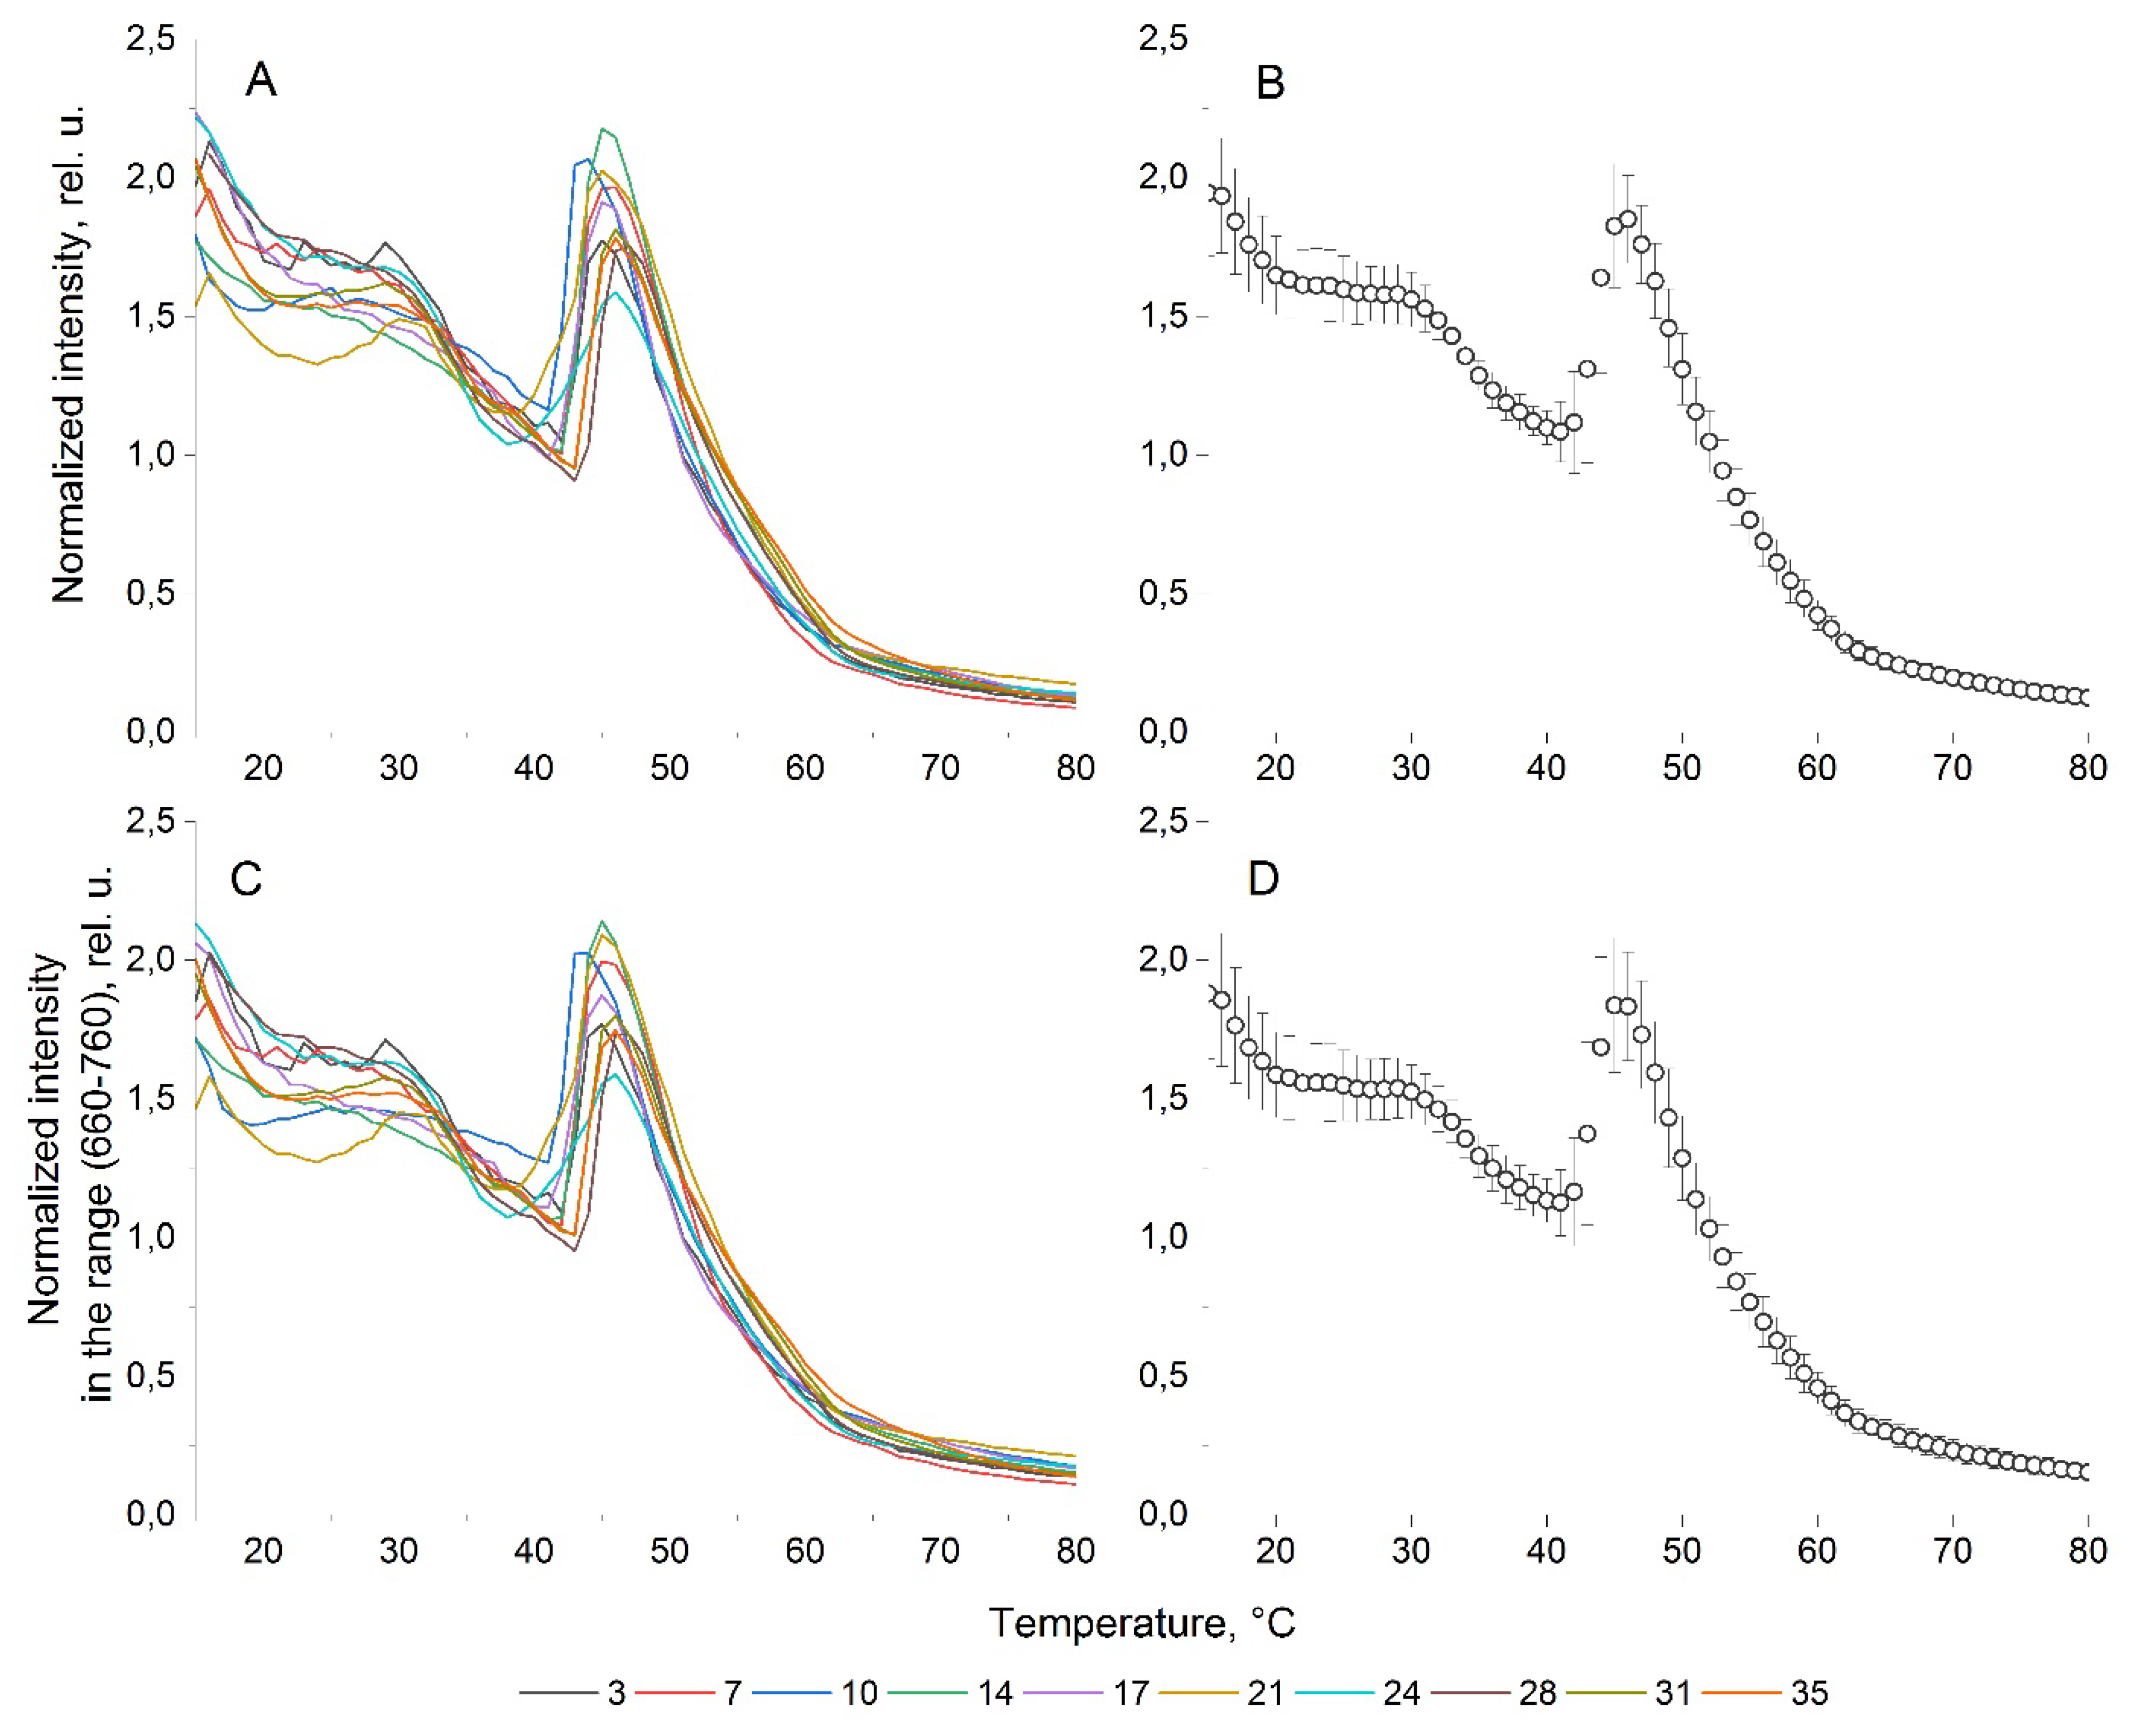
Figure 1a shows the dependence of the intensity of the chlorophyll-a fluorescence peak on temperature, obtained during 35 days of cultivation according to the study flow chat. It can be seen that variations in the shape of the curves are observed during all 35 days of cultivation, but for a living biological objects, these variations can be considered insignificant (
Figure 1b). For confirmation, statistical analysis of fluorescent parameters was performed. The Shapiro-Wilk test carried out in the Origin Lab package showed a normal distribution for these NFTC s and IFTC s over the entire temperature range. In addition, the normality of the distribution is confirmed by the coincidence of the median and arithmetic mean values for these parameters at the corresponding temperatures. For the normal distribution, the coefficient of variation was calculated, which on average has a value of 10% for the entire temperature range, which is a good sign of stability for a living object. In addition, in order to prove that the average NFTC well models the NFTC obtained for each of the 10 stages of the experiment, we calculated the cosine similarity index [
20], obtaining values of (0.99-0.998). The average variance for the entire temperature range reaches 0.07 for
A. catenella.
Figure 1c shows the ITCF of the
A. catenella culture, the shape of the curve during all 35 days of cultivation also does not change significantly (
Figure 1d). Analysis of NFTC and IFTC shows their practical identity.
Figure 1 demonstrates that the
A. catenella culture is characterized by a smooth decrease in fluorescence in the temperature range from 15 to 30°C, which accelerates with further heating. At a temperature of 41°C, a local minimum of fluorescence is observed. After reaching it, the fluorescence intensity begins to increase abruptly, reaching at a temperature of 46°C a local maximum almost equal to the fluorescence intensity of the unheated sample. In the temperature range 46-80°C there is a rapid exponential decrease in fluorescence intensity to a minimum value. Unfortunately, the scope of this publication does not allow us to fully demonstrate the difference between the NFTCs obtained for
A. catenella and the NFTCs obtained for other microalgae. Therefore, we refer to our publications [
20,
21], which present the fluorescent parameters we obtained for representatives of the departments of diatoms, red, green and cryptophytic microalgae. The analysis of papers confirms the uniqueness of NFTC as a feature of microalgae, including for the culture of
A. catenella. This provides a potential opportunity to distinguish the monocultures under study from monocultures from other departments, including the identification of microalgae when monitoring harmful blooms in water areas.
As we have already noted, in addition to the intensity, the fluorescence of microalgae can be characterized by the temperature dependence of another parameter - the wavelength of the fluorescence peak - WFTC. The WFTC parameter in microalgae is determined by the presence of various fluorescent complexes in the photosynthetic apparatus [
24,
25,
26]. According to [
24,
27] these complexes have their own fluorescence spectra with established maxima: 680 nm – LHC2 trimers, 685 nm – RC PS2 complex, which at this wavelength is represented by CP43 and the nucleus PS2 P680, 695 nm – PS2 core antenna, characterized by the pigment-protein complex CP47, 700 nm – LHC2 aggregates, which often appear during cell damage, 720 nm – PS1 core, 735 nm – LHC1-PS1 supercomplex, 760 nm – vibrational sublevels of chlorophyll- A.
Temperature changes in microalgae cells affect such components differently, which leads to a redistribution of their concentration. It affects the wavelength of maximum intensity of the resulting spectrum and is reflected in the dynamics of WFTC.
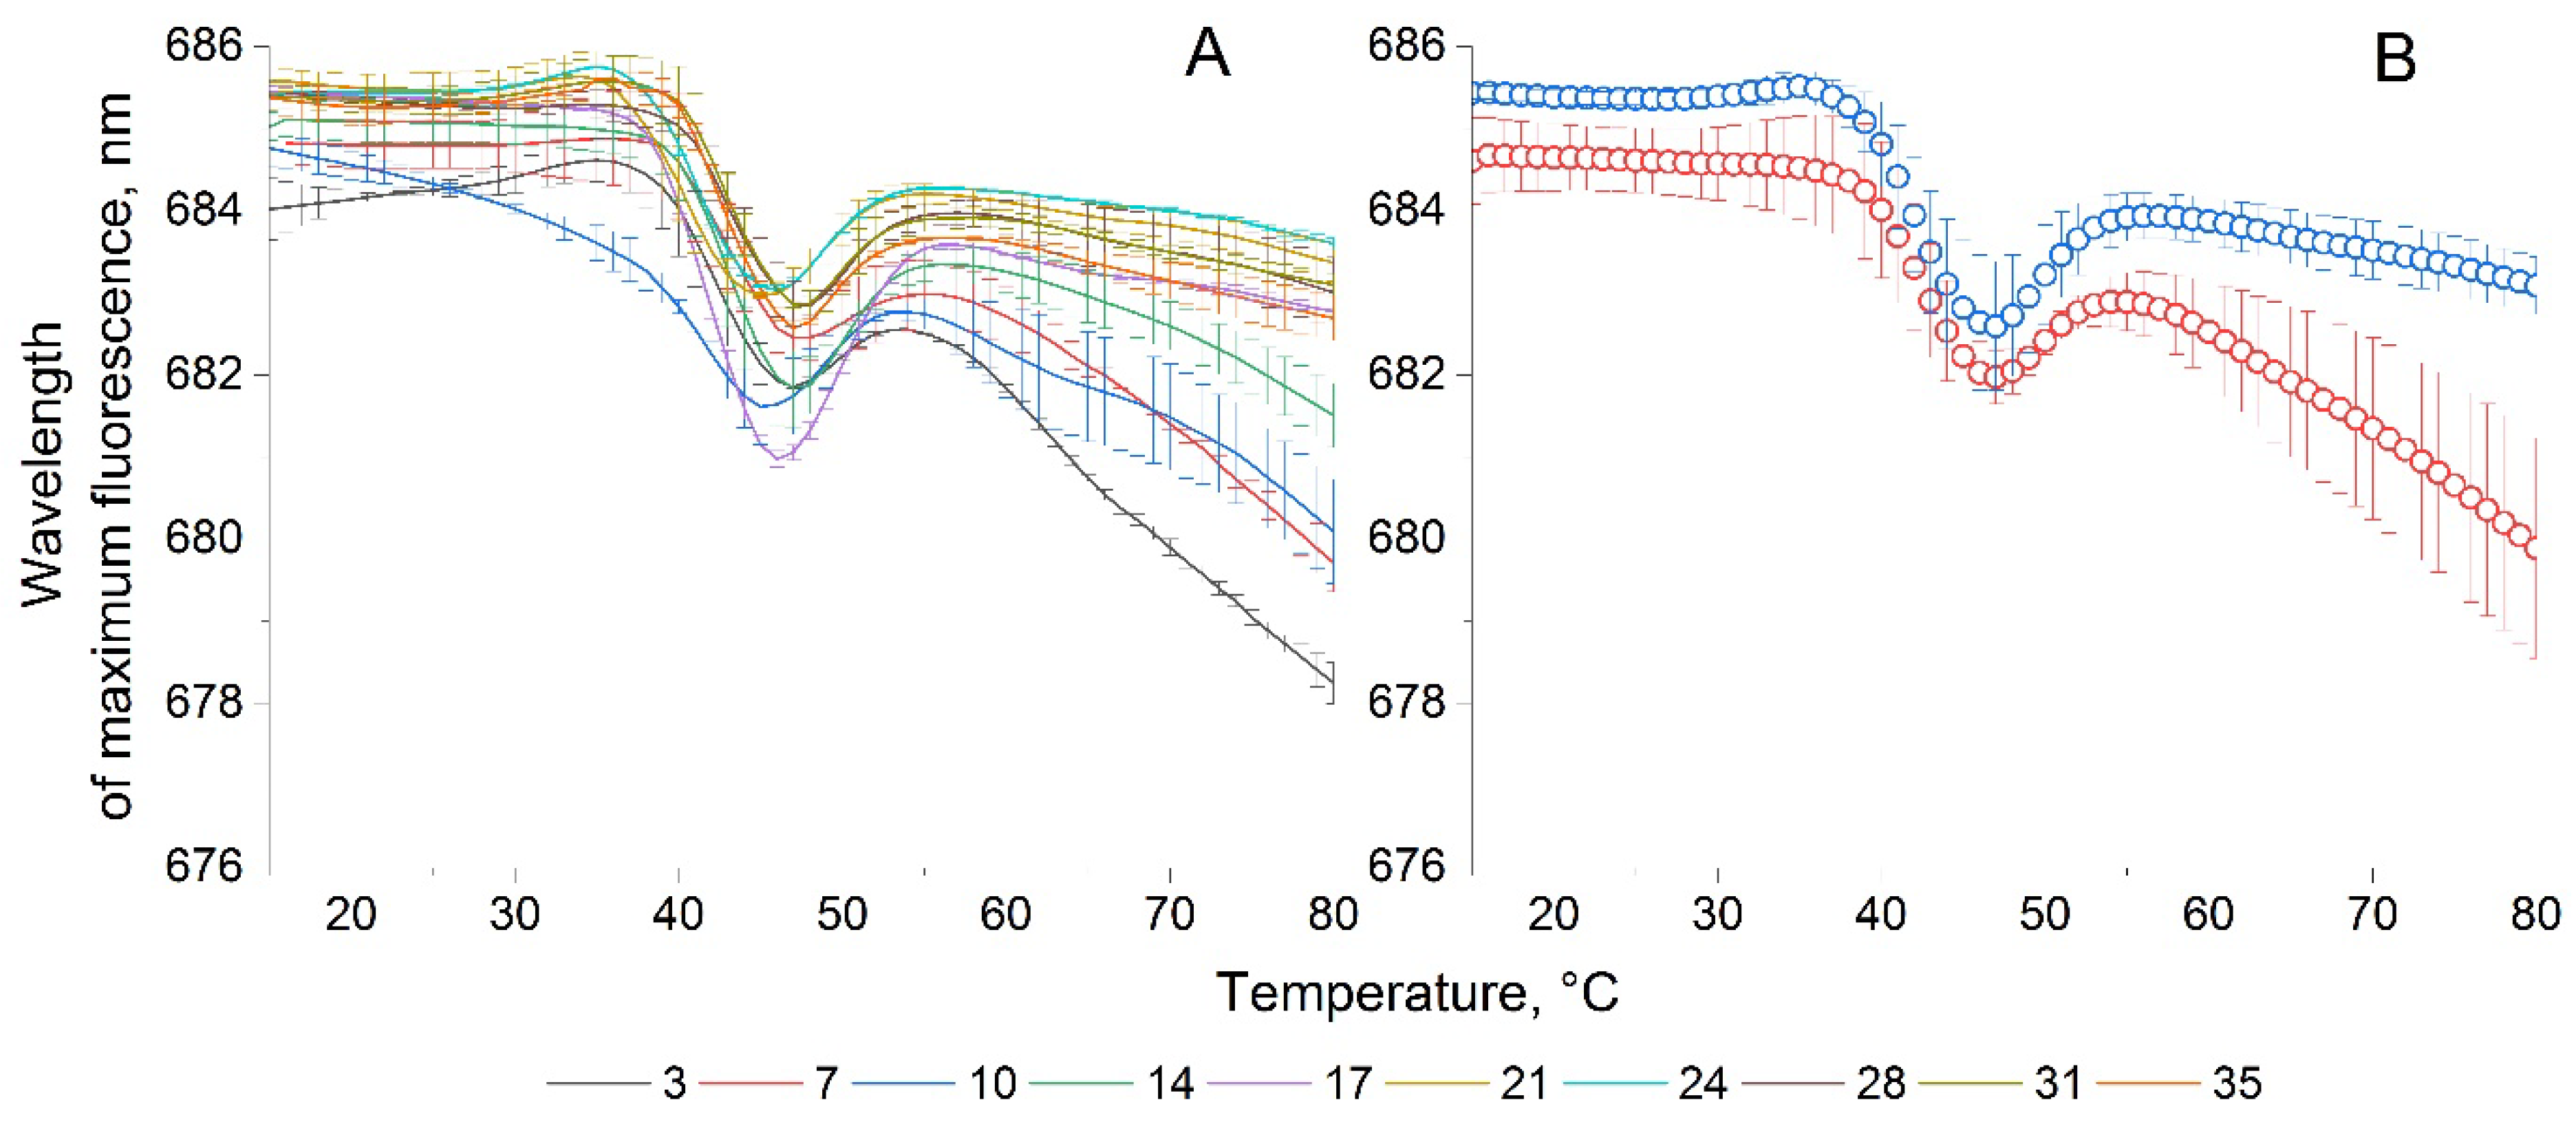
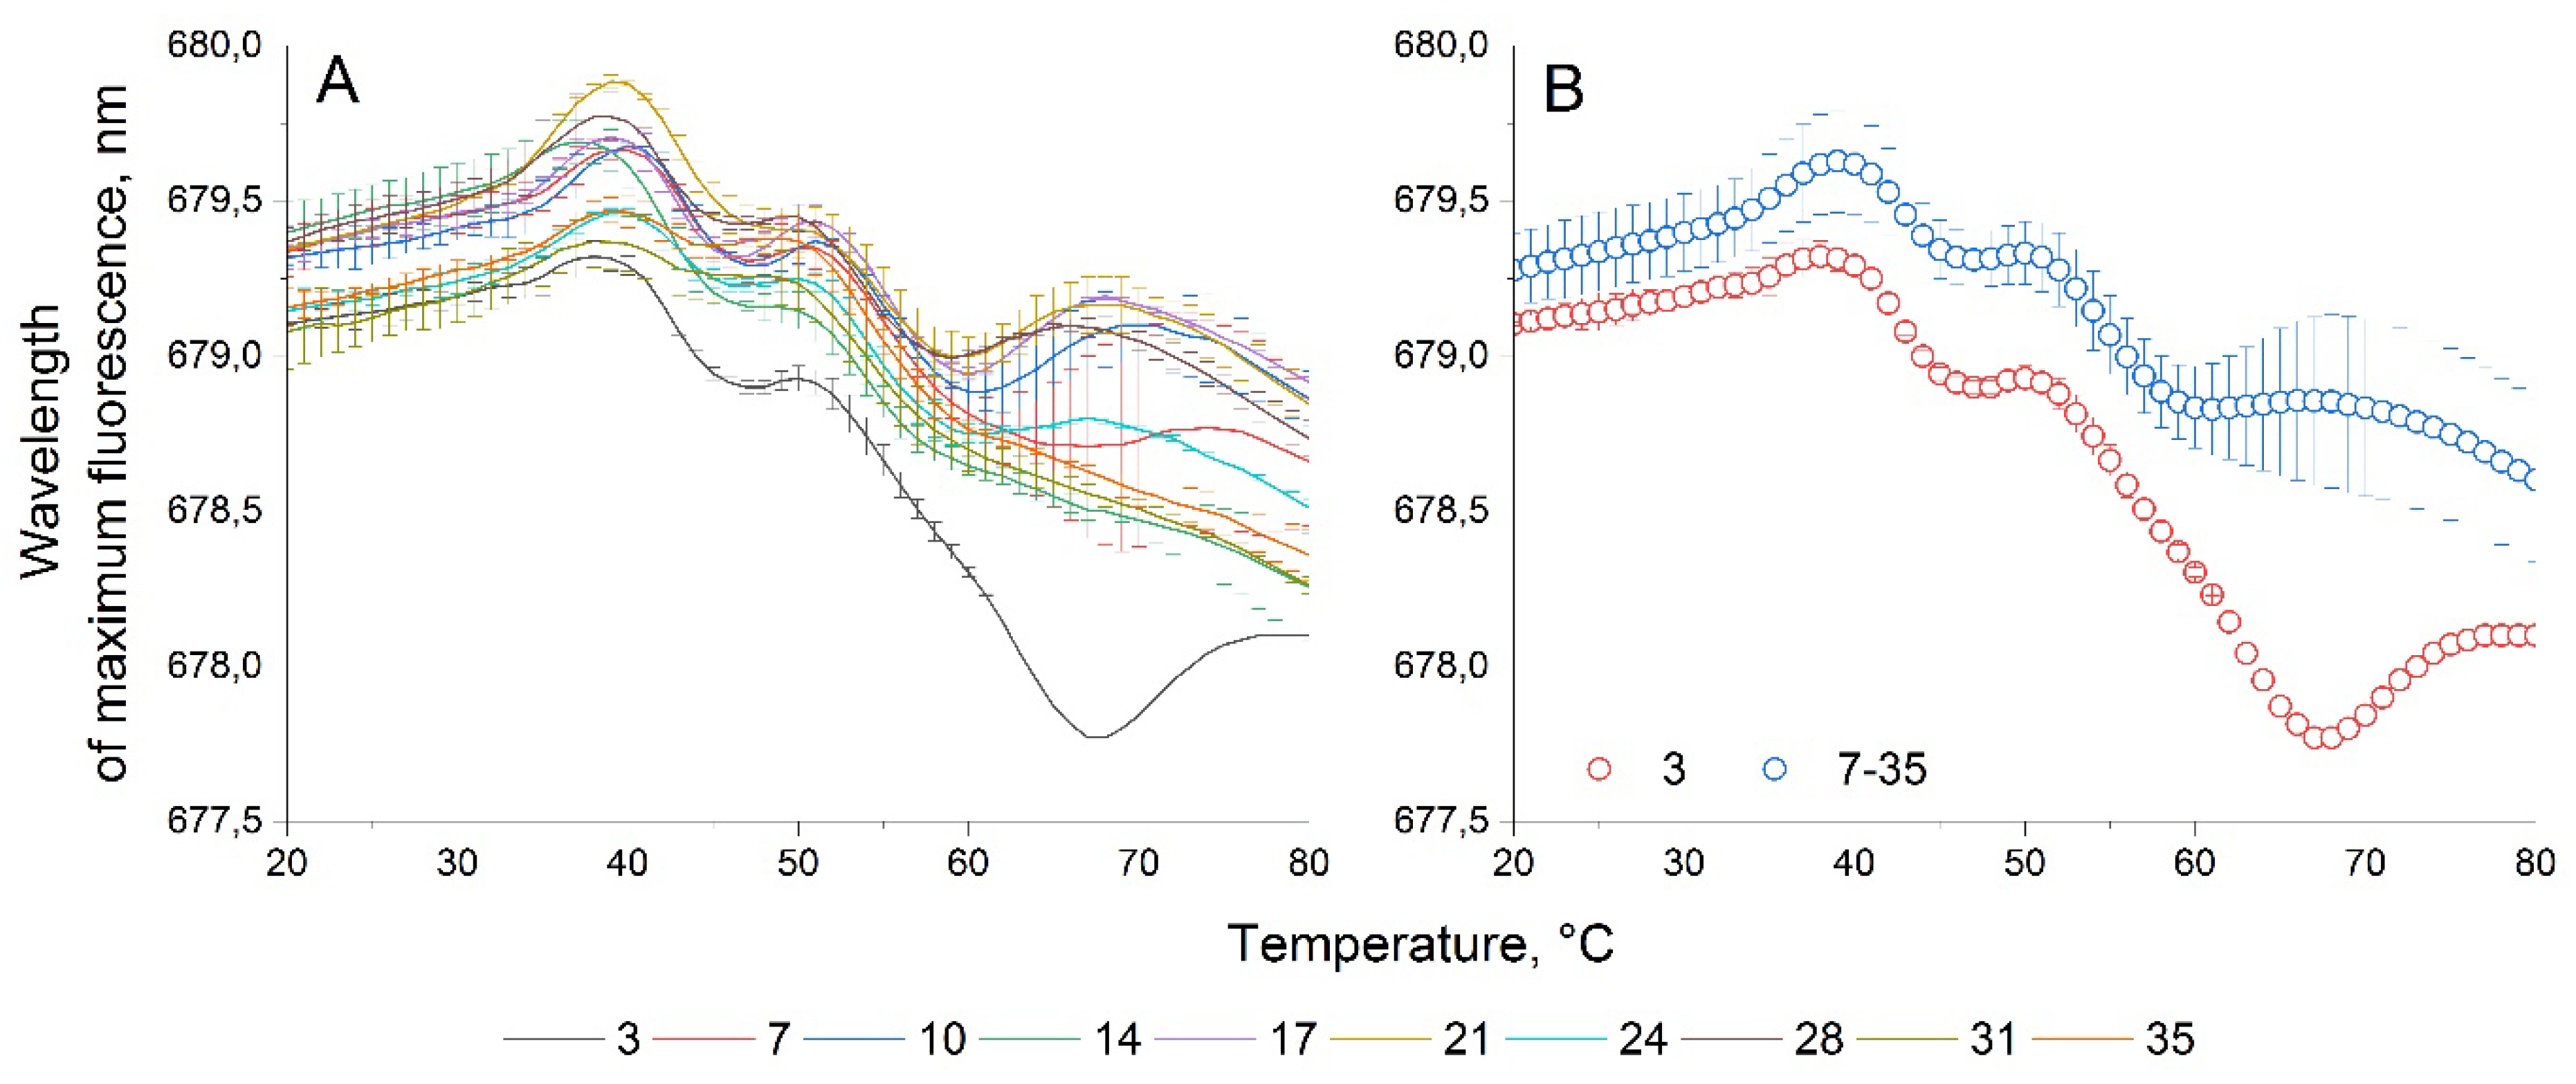
Figure 2 shows the dependence of the wavelength of the chlorophyll-a fluorescence peak of the
A. catenella culture on temperature, obtained during 35 days of cultivation according to the study flow chat.
As can be seen from
Figure 2, the WFTC of microalgae
A. catenella can be divided into two groups: characteristic for 3-14 days of cultivation and characteristic for 17-35 days of cultivation. The differences observed for these groups are more pronounced at high temperatures (>55°C). It can be seen that the culture at all stages of cultivation is characterized by a relative constancy of the wavelength in the temperature range up to 35-36°C. It can be assumed that in this temperature range
A. catenella does not experience strong structural changes or destruction in the cells. In the works [
28,
29], the authors note that this microalgae belongs to eurythermal organisms, that is, organisms that can tolerate temperature changes well. It is obvious that with a further increase in temperature, processes of protein denaturation begin. This process is accompanied by a change in wavelength, first decreasing in the range (36-46°C), then increasing in the range (46-55°C).
As is known, the fluorescence wavelength of complex complexes depends on their structure and the number of chemical bonds between chlorophyll and the substances surrounding it. The formation of new bonds leads to the emergence of new ways of energy dissipation, which in turn is expressed as an increase in the LIF wavelength of chlorophyll-a. In turn, the destruction of bonds and the release of chlorophyll-a leads to a decrease in wavelength due to a decrease in energy losses, which is what we observe in WFTC at a temperature of 45°C. A further increase in wavelength with increasing temperature may be due to the formation of aggregates from released chlorophyll in the aquatic environment [
30,
31]. For the two groups we mentioned, the change in fluorescence at (36-46°С) occurs in the same way, with the only difference being that the wavelength of the maximum fluorescence differs by one nm, which cannot be considered a significant difference without more detailed studies. With a further increase in temperature at (55-80°С), a decrease in the fluorescence wavelength is observed for microalgae in the first two weeks of cultivation, while for microalgae at subsequent stages there is no such decrease. This difference suggests a change in the spectral composition of fluorescent components that form the overall fluorescence spectrum of chlorophyll-a for microalgae at different stages of cultivation. Moreover, the absence of significant differences in WFTC at all stages of cultivation suggests that changes can only be observed in the spectral composition of the components, that is, in their proportional concentration, but not in the components themselves.
We can assume that nutrient deficiency, which is observed as a result of long-term cultivation in a closed volume and an increase in cell concentration during culture growth, leads to a change in the structure of photosynthetic complexes [
32], which is reflected in an increase in the wavelength of WFTC.
3.2. Cytometry of A. catenella
To substantiate the assumptions made as a result of studying the LIF spectra of microalgae, the results of cytometric studies and studies of pigment composition were used, which were also carried out during 35 days of cultivation of the microalgae A. catenella. All measured parameters of microalgae cells are given in normalized form. Normalization was carried out relative to the first day of measurement to reflect the dynamics of changes in culture.
The microalgae
A. catenella has large cells with relatively high fluorescence intensity. The data from cytometric studies are presented in full in supplementary materials.
Figure S3-12 displays scatterplots for samples examined sequentially according to the experimental plan. In
Figures S3-12a, cell sizes are analyzed, where (FSC-H) correlates with cell thickness and (FSC-width) with cell length [
33]. In
Figures S3-12b, the relationship between cell area (FSC-A) and its fluorescence was analyzed.
Several clouds with high density can be identified in the diagrams. The first, large cloud is characterized by low particle sizes and fluorescence intensity, while high ones characterize the second, small cloud.
A. catenella cells are characterized by intense fluorescence, which corresponds to the upper right cloud in the scatter plots. To determine the number of cells, it is necessary to perform gating of the cytometric data. It was carried out according to the fluorescence intensity value (I>2.5×10
6 counts). The data before and after gating are shown in
Figure S13. We calculate the cell concentration on the corresponding day, using this gate. For each experimental day, the concentration was determined from three samples, each of which was measured on a cytometer in triplicate.
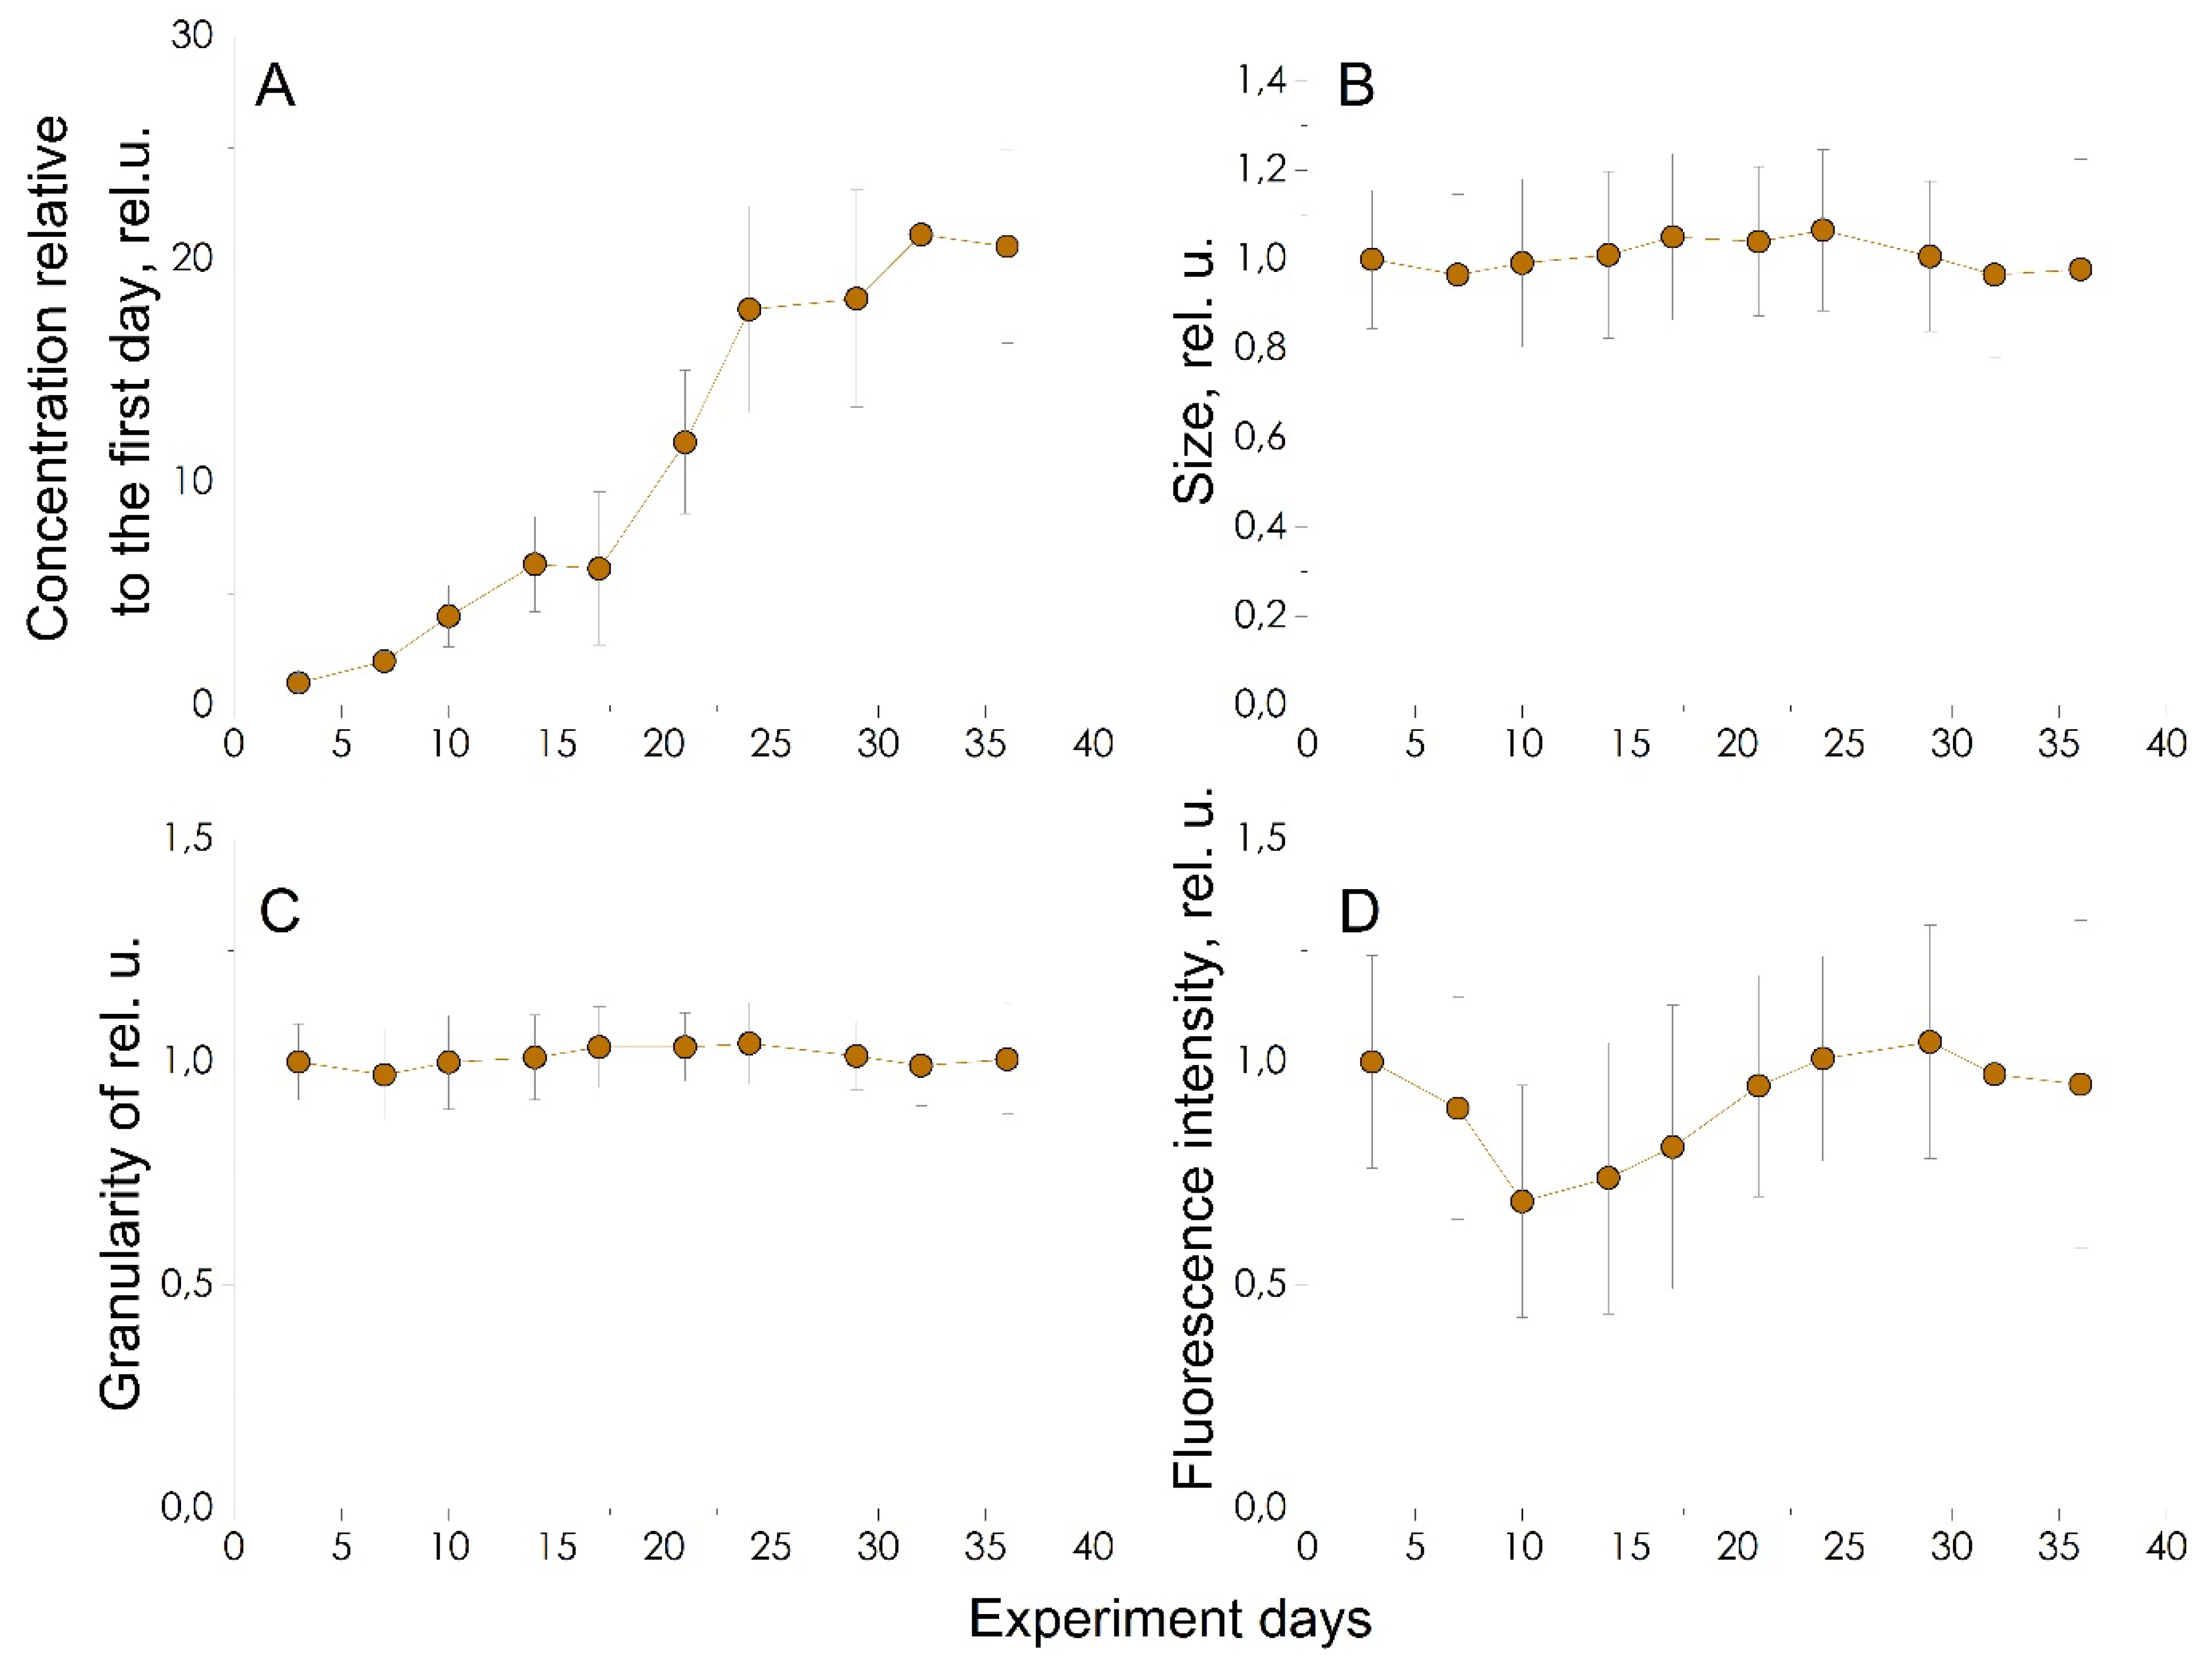
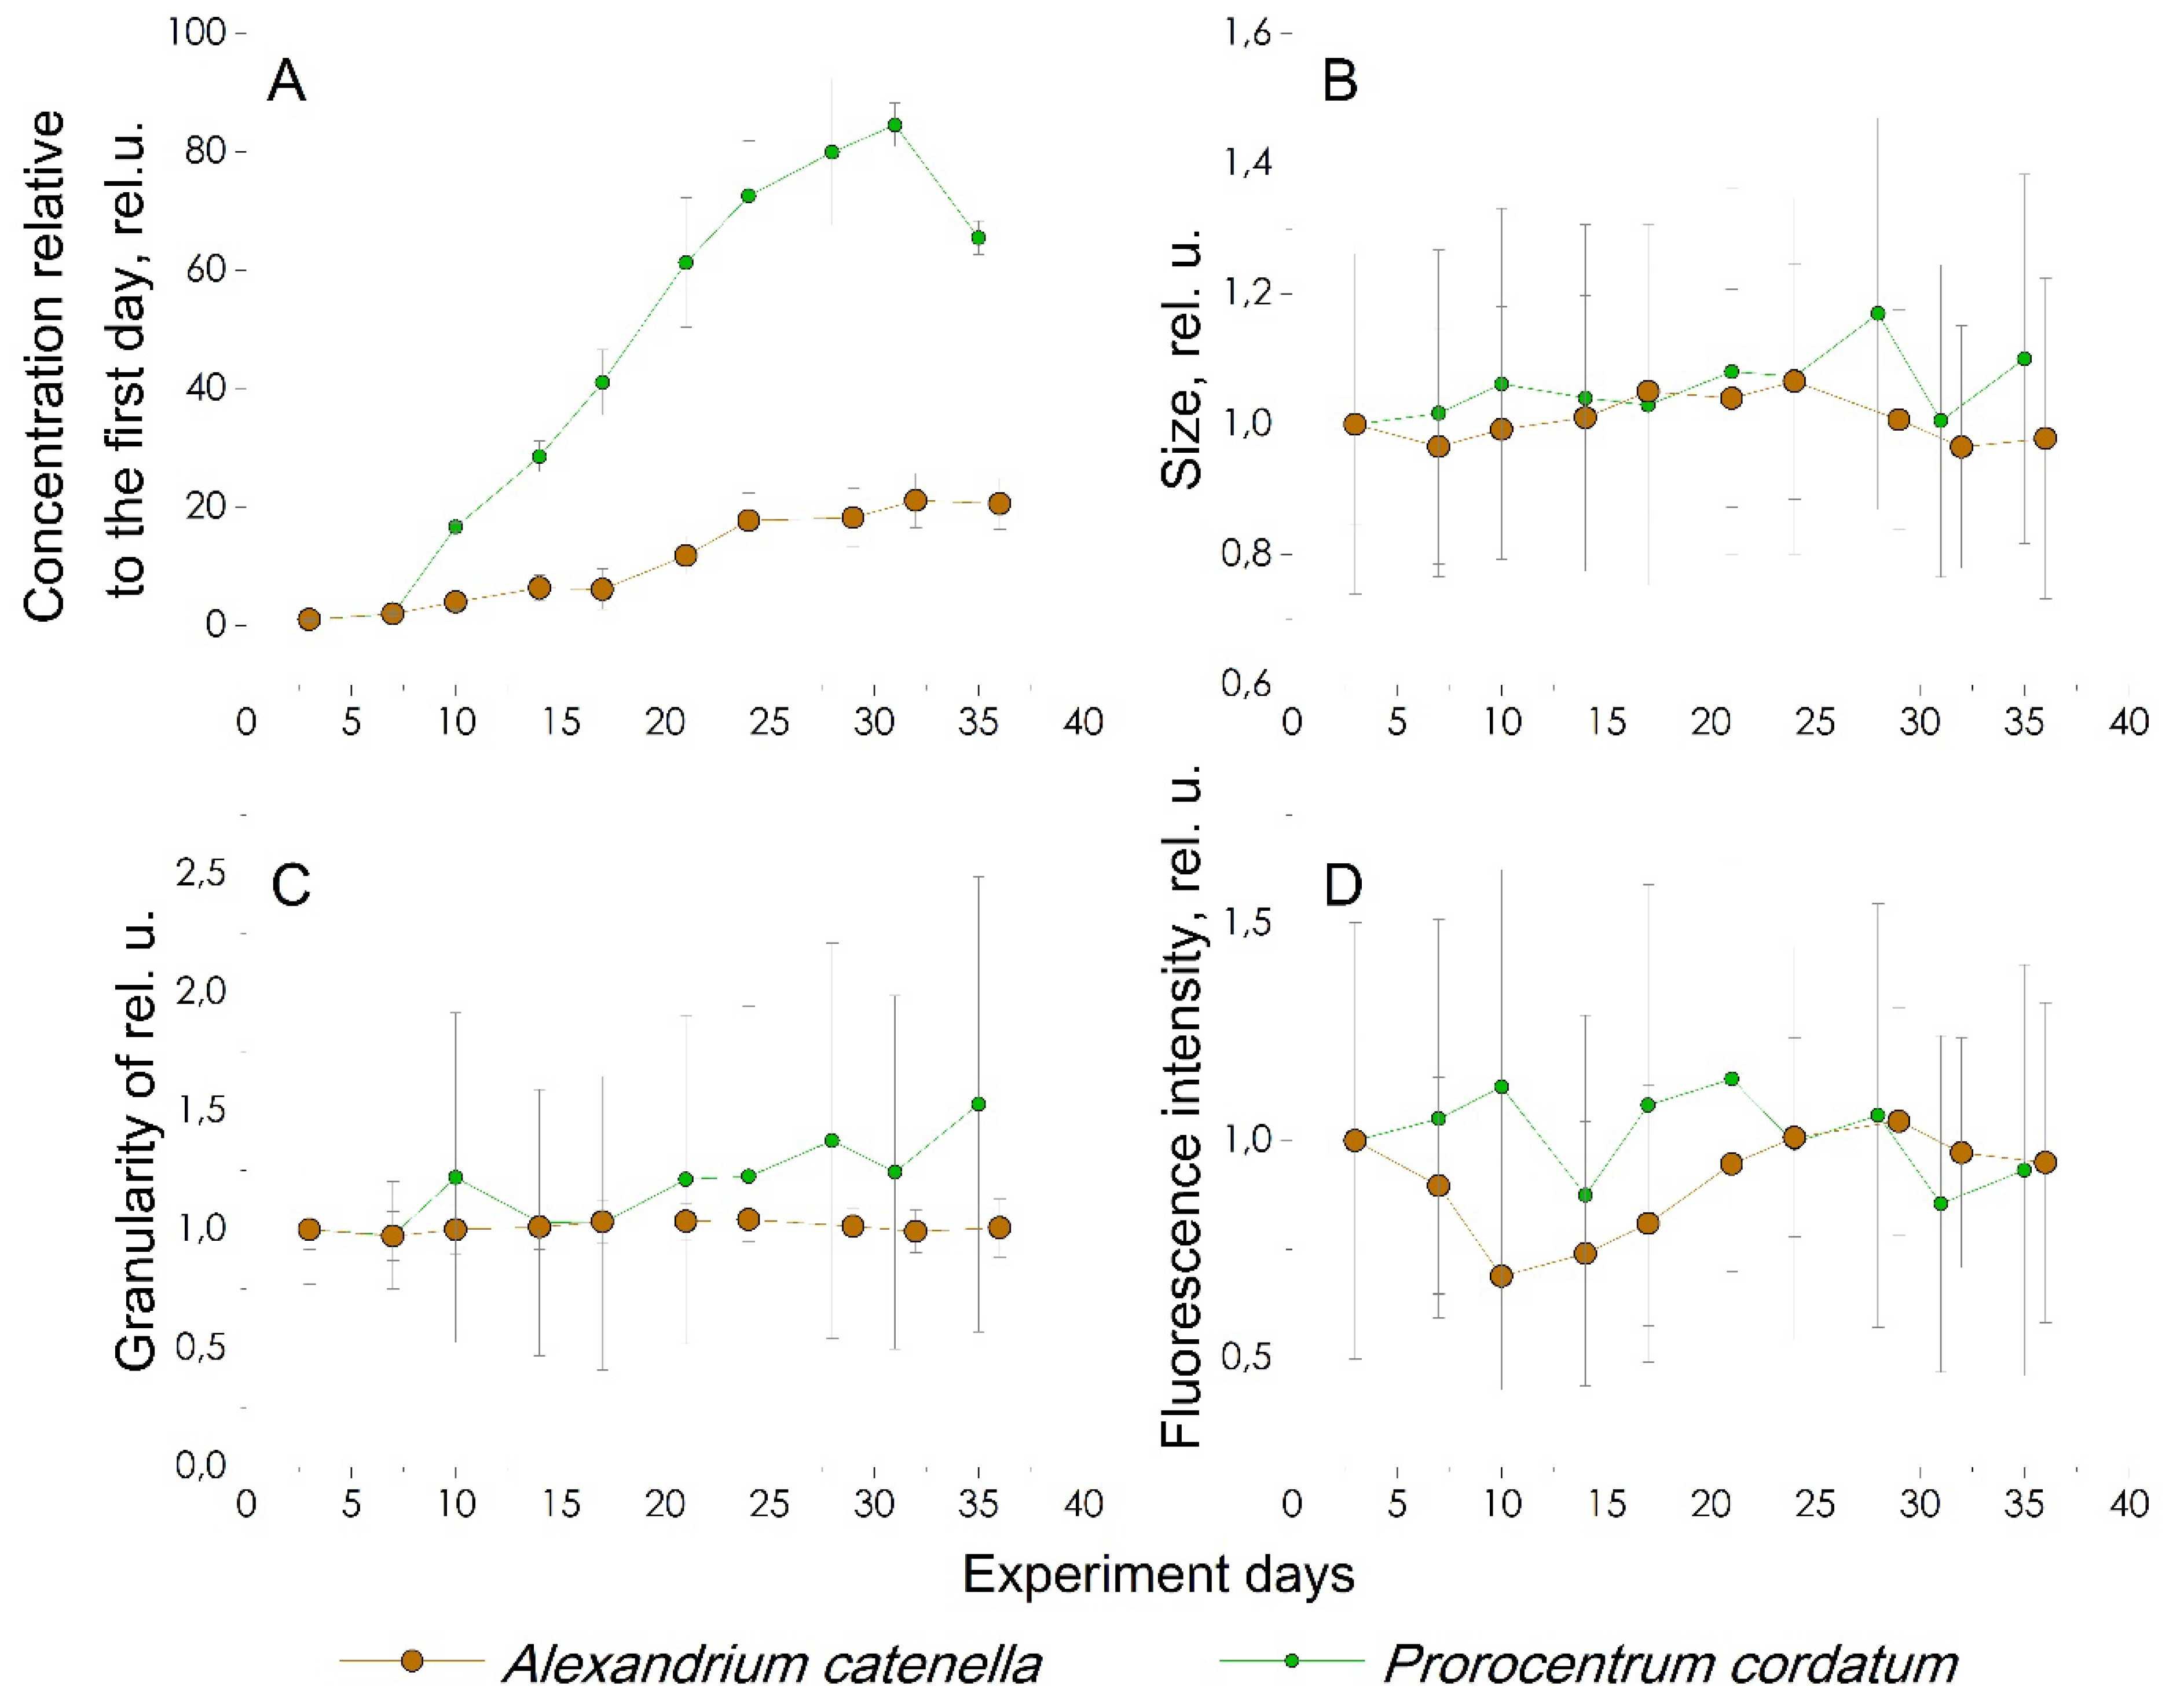
Figure 3a shows the calculated mean concentration and standard deviation for
A. catenella cells for each day of the experiment. It is clearly seen that the change in concentration occurs unevenly. In the first days of the experiment, the growth rate is insignificant, then the concentration begins to increase exponentially, and on the 30th day, the growth rate decreases. The number of cells in an
A. catenella culture increases 20 times over 35 days.
Since during the experiment we observe the growth of a culture, the characteristics of the growing culture itself are also of interest. As can be seen from the
Figure 3 for a growing culture, there are no significant changes in cell size (
Figure 3b) and their granularity (
Figure 3c) throughout the experiment. As for the fluorescence of the culture (
Figure 3d), in the first 10 days there is a monotonous decrease in the average fluorescence intensity. Starting from day 14, there is a monotonous increase in fluorescence intensity to the level of the first day of the experiment (on day 30).
3.3. Studies of the Pigment Composition of A. catenella
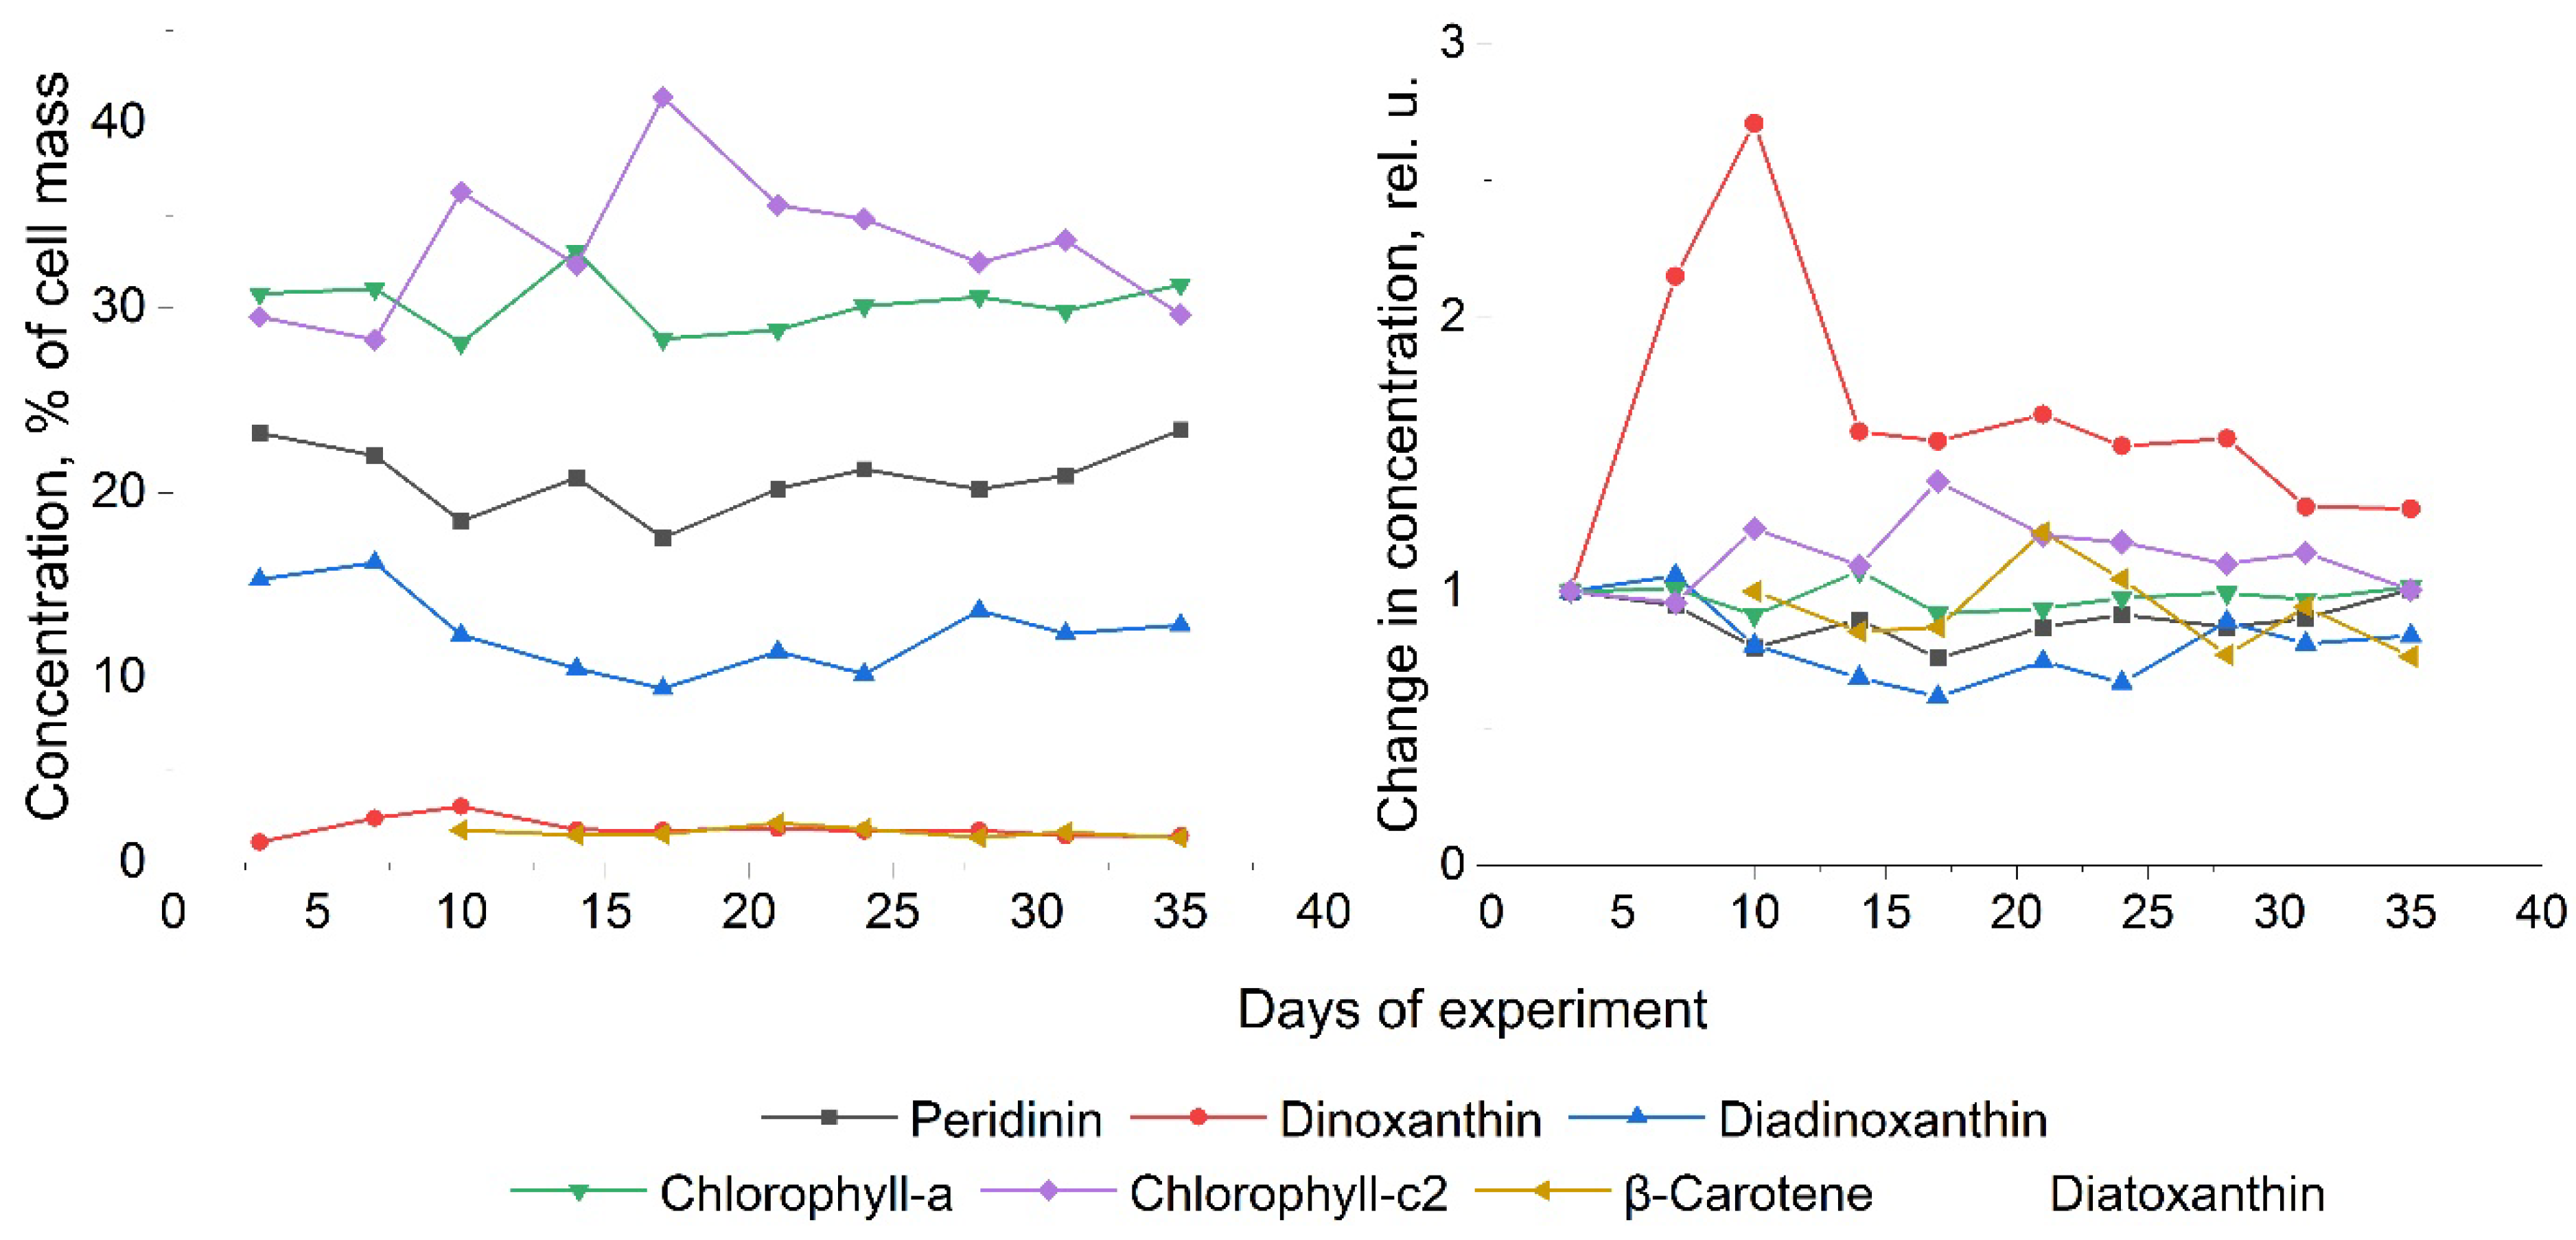
The results of the study of the pigment composition of the
A. catenella culture are presented in
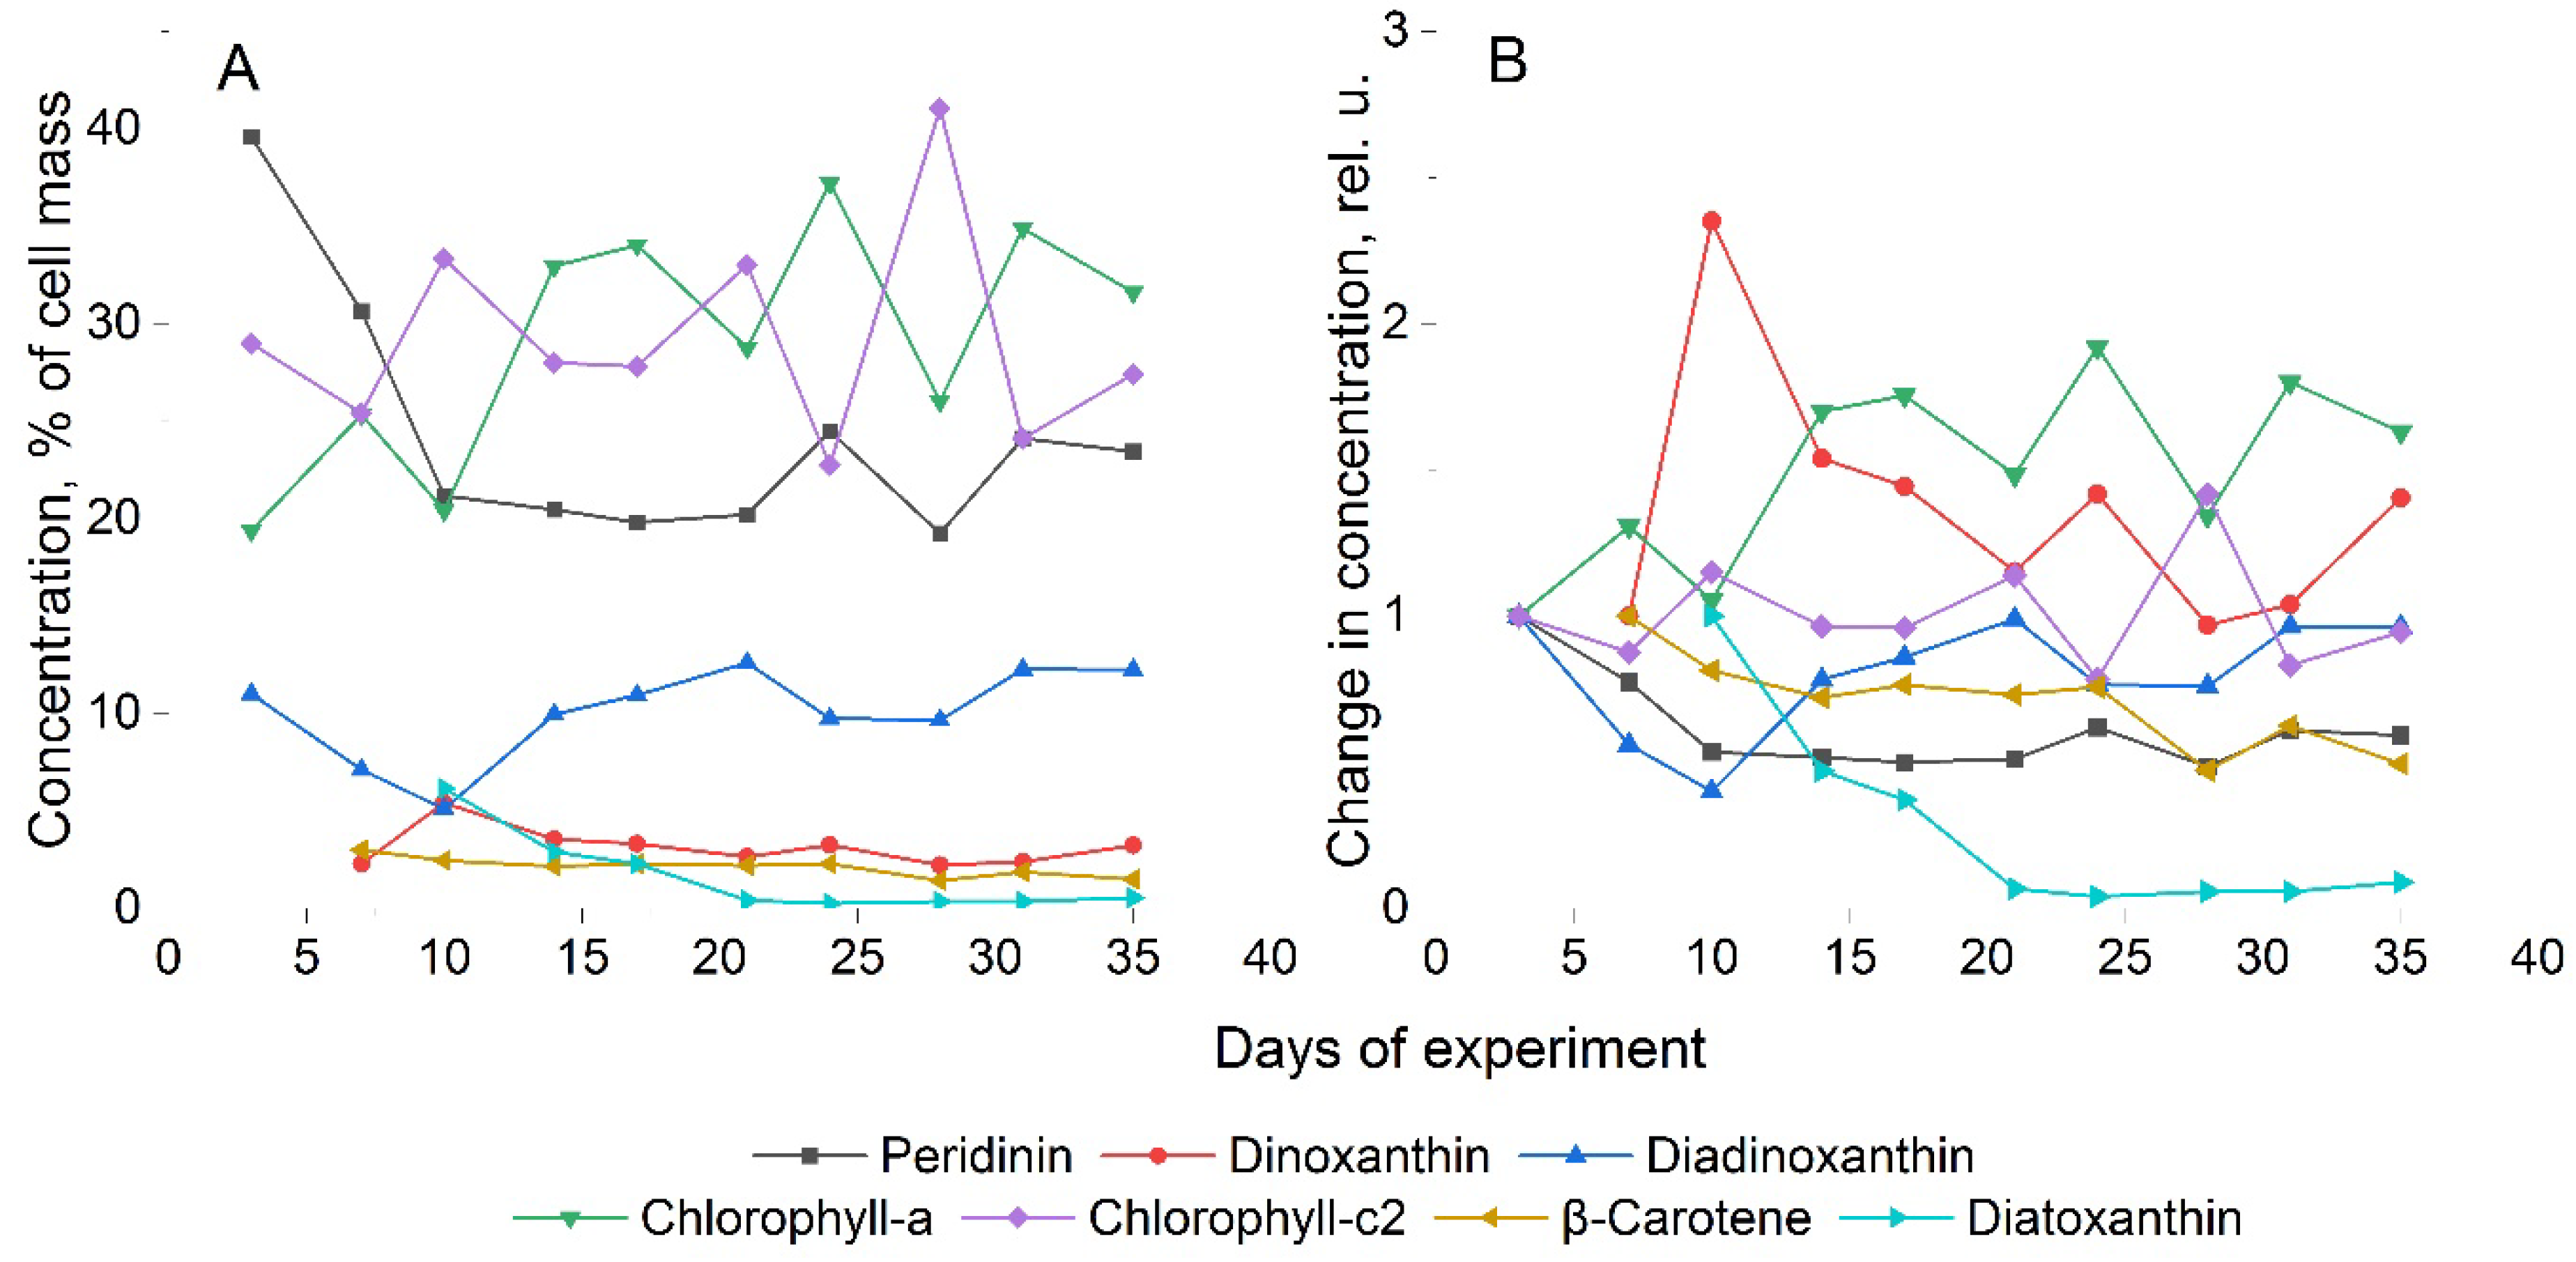
Figure 4. As can be seen, the main pigments are peridinin, chlorophyll-a and chlorophyll-c2, together accounting for almost 90% of the total mass of detected pigments. It is known that peridinin is a characteristic pigment for dinoflagellates and, together with chlorophyll, is part of the light-harvesting pigment-protein complexes of these microalgae. Approximately 10% of the total mass of pigments is diadinoxanthin. Diatoxanthin, dinoxanthin and β-carotene were detected in trace amounts.
According to the data shown in
Figure 4a, the total concentration of chlorophylls in cells remains relatively constant throughout the cultivation time, while the concentrations of chlorophyll-a and chlorophyll-c2 change in a reciprocal manner. That is, an increase in chlorophyll-a leads to a simultaneous decrease in chlorophyll-c2 and vice versa. From this, we can conclude that chlorophyll-c2 is an auxiliary and complementary pigment, which nevertheless plays an important role in the life of these microalgae. Analysis of the dynamics of pigment concentration shows a slight increase in chlorophyll-a for
A. catenella cells (
Figure 4b) towards the end of the experiment. On the contrary, peridinin decreases its concentration during cultivation. In addition, an increase in the concentration of dinoxanthin can be noted: by the end of the first week of cultivation, a significant increase (more than 2 times) with a subsequent decrease in concentration to a level approximately 1.2 times higher than the concentration on the first day of cultivation. All other pigments either did not change their concentration throughout the experiment or decreased it slightly.
Analyzing the results, it can be assumed that the observed increase in chlorophyll-a concentration in
A. catenella simultaneously with decrease in peridinin concentration, may be associated with changes in the photosynthetic apparatus and its components. These processes should be reflected in the fluorescence signal, which was observed both in the fluorescence intensity variance (
Figure 3d) and in the form of WFTC (
Figure 2b). The HPLC results for
A. catenella demonstrate decrease of peridinin and constant of chlorophyll-a concentrations, during the first 10 days, and increase of chlorophyll-a and constancy of peridinin concentration in the rest (
Figure 6,
Figure 4). This allows us to conclude that the fluorescence intensity measurement by cytometer was determined by summarized concentration of peridinin and chlorophyll-a, which are main photosynthetic pigments of dinoflagellates.
To increase the reliability of the research results and reliability of conclusions about the A. catenella features, the P. cordatum microalgae, as well as the dinoflagellate were studied in parallel. The choice of this microalga was due to its presence, like A. catenella, in the Sea of Japan, as well as the tendency of P. cordatum to periodically bloom in Peter the Great Bay. We make comparative analysis of the results obtained for both microalgae.
3.4. Comparison of LIF Parameters
The results of fluorescent studies of the
P. cordatum culture in the form of NFTC and IFTC, obtained during 35 days, are presented in (
Figure 5). We may observe that properties of the curves resulting for
P. cordatum are similar to the
A. сatenella: the practical identity of NFTC and IFTC (
Figure 5b-d) and insignificant variation in the shape of NFTC and IFTC during all 35 days of cultivation (
Figure 5b).
The Shapiro-Wilk test also showed a normal distribution of NFTC and IFTC for
P. cordatum, with agreement between the median and arithmetic mean values for these parameters, at the corresponding temperatures. It is clearly seen that the averaged NFTC well simulate the NFTC obtained for each of the 10 stages of the experiment. The calculating the cosine similarity index [
20] gives a value of (0.996-0.999). The average dispersion for the entire temperature range reaches 0.066, and the coefficient of variation is 0.09.
The constancy of NFTC and IFTC during enrichment cultivation for the microalgae A. catenella and P. cordatum and, as we have already noted, their difference from other microalgae suggests the possibility of using them as the parameters for their identification.
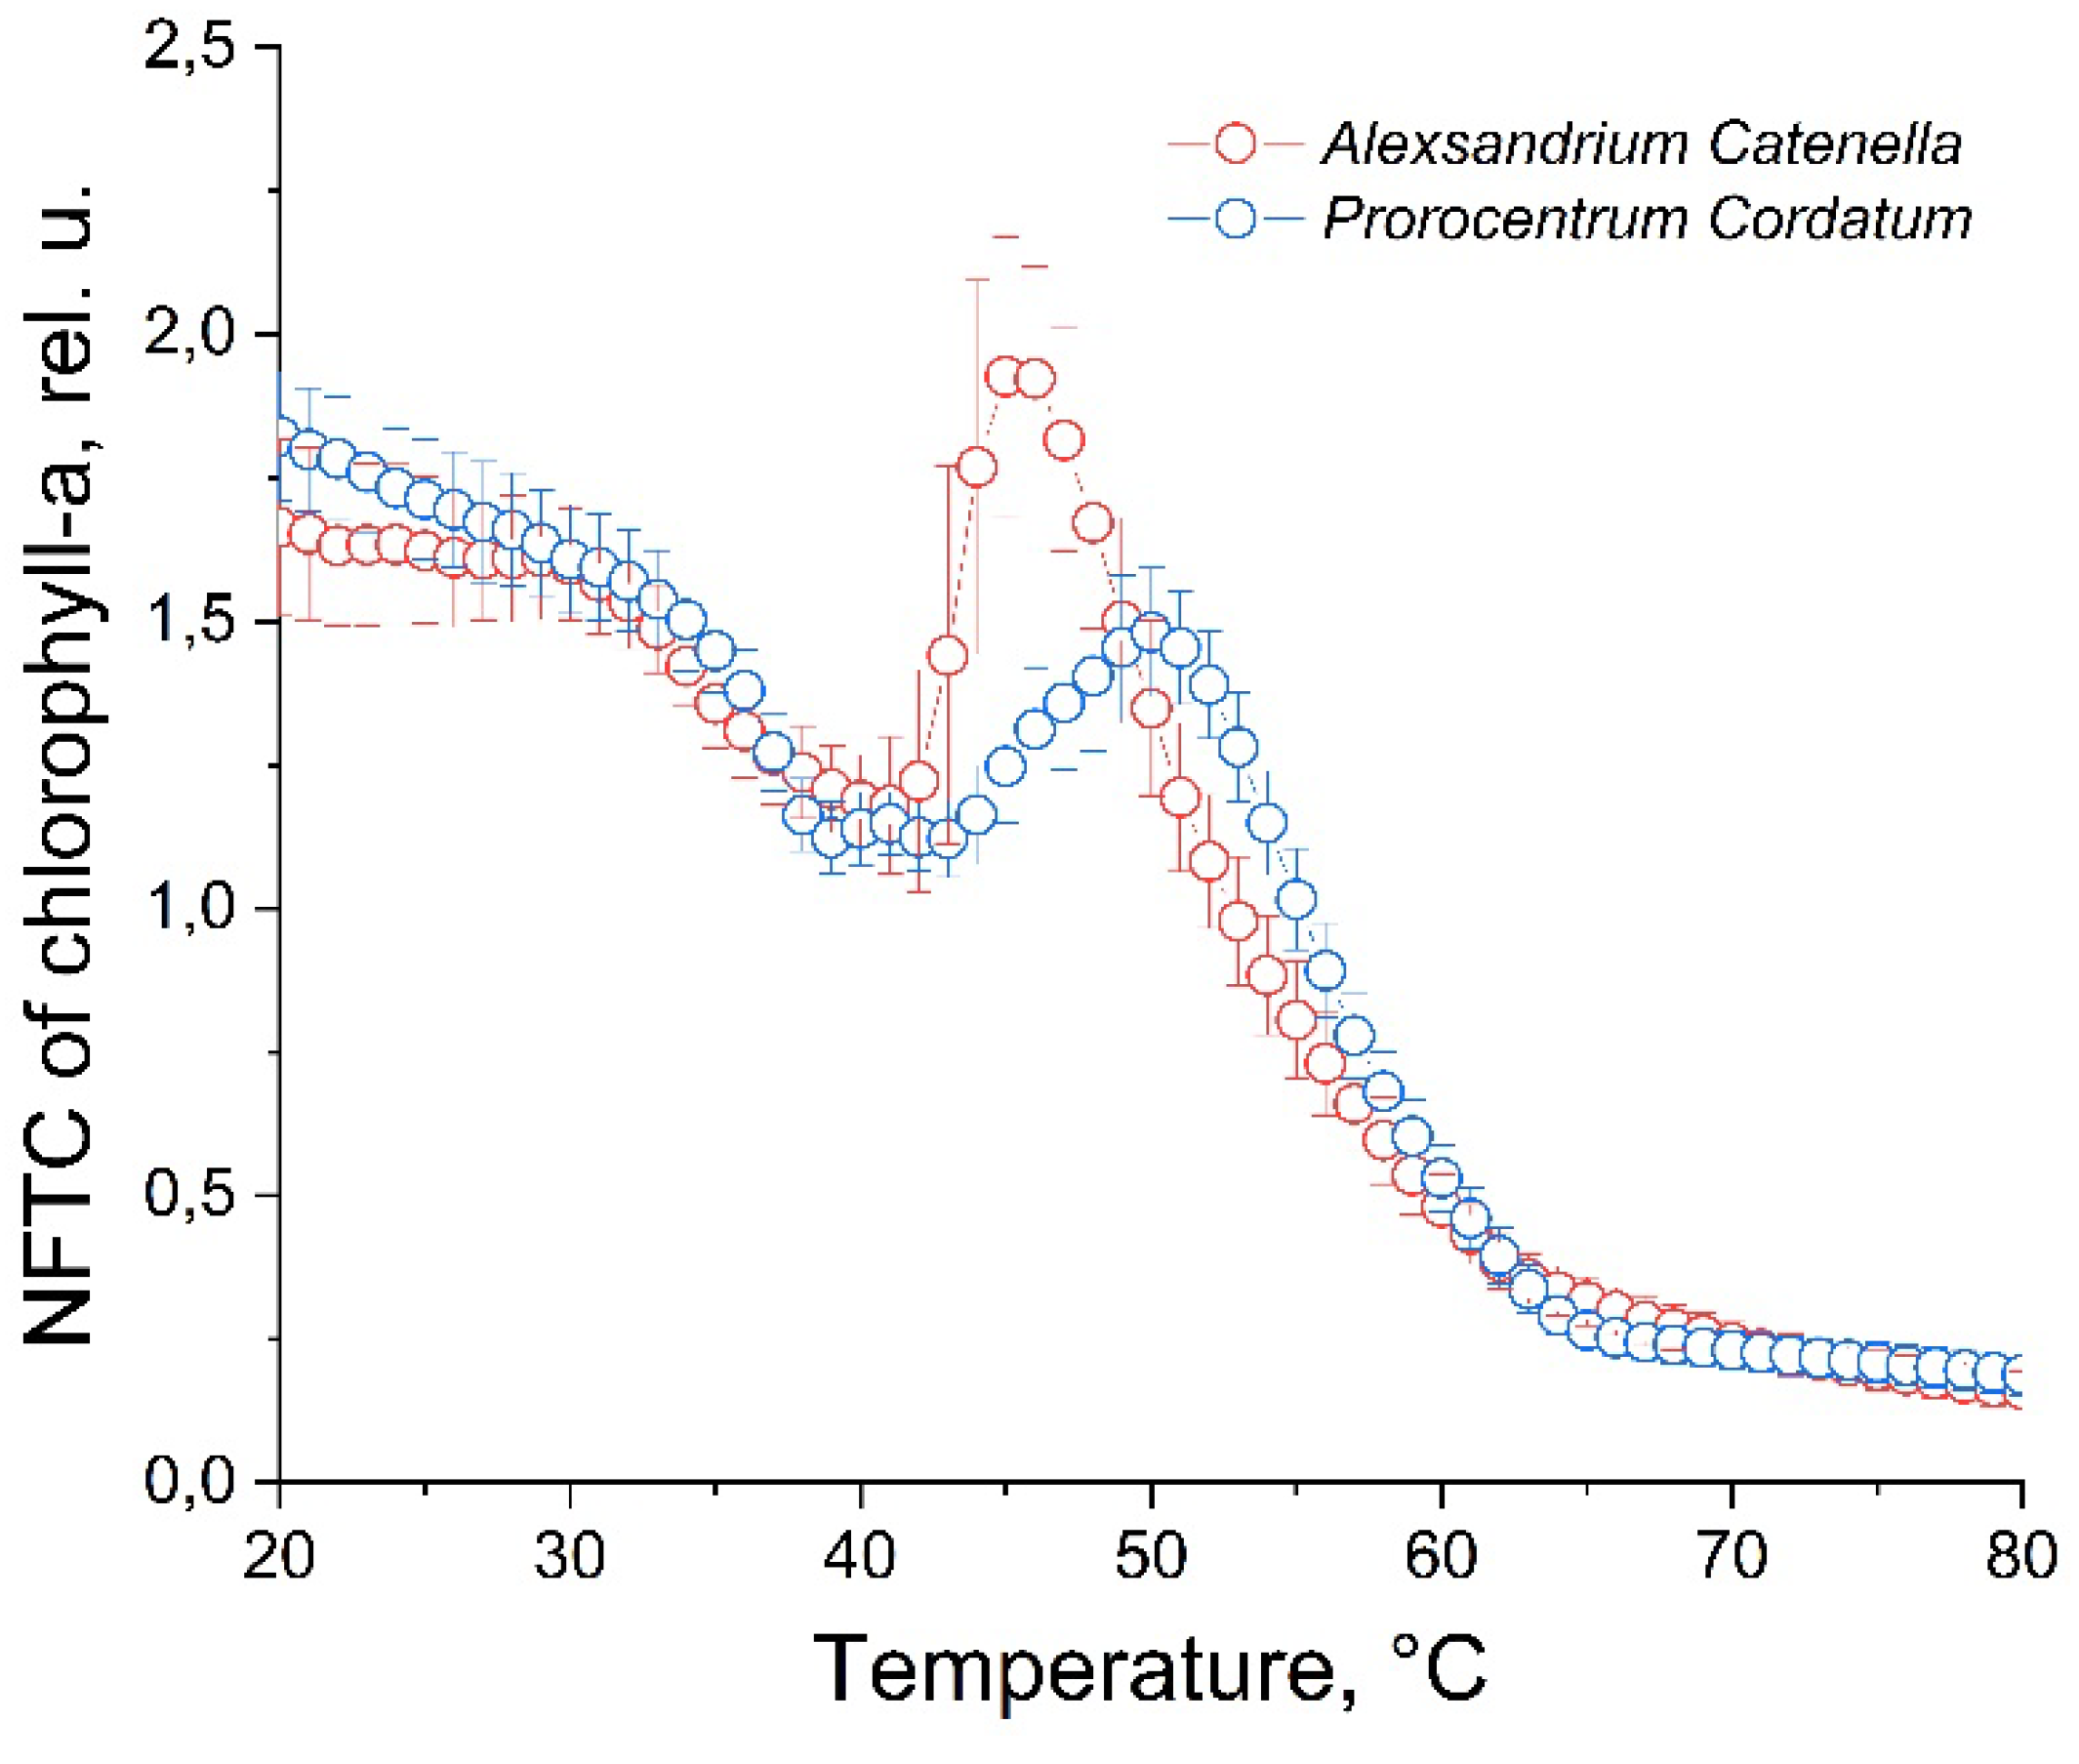
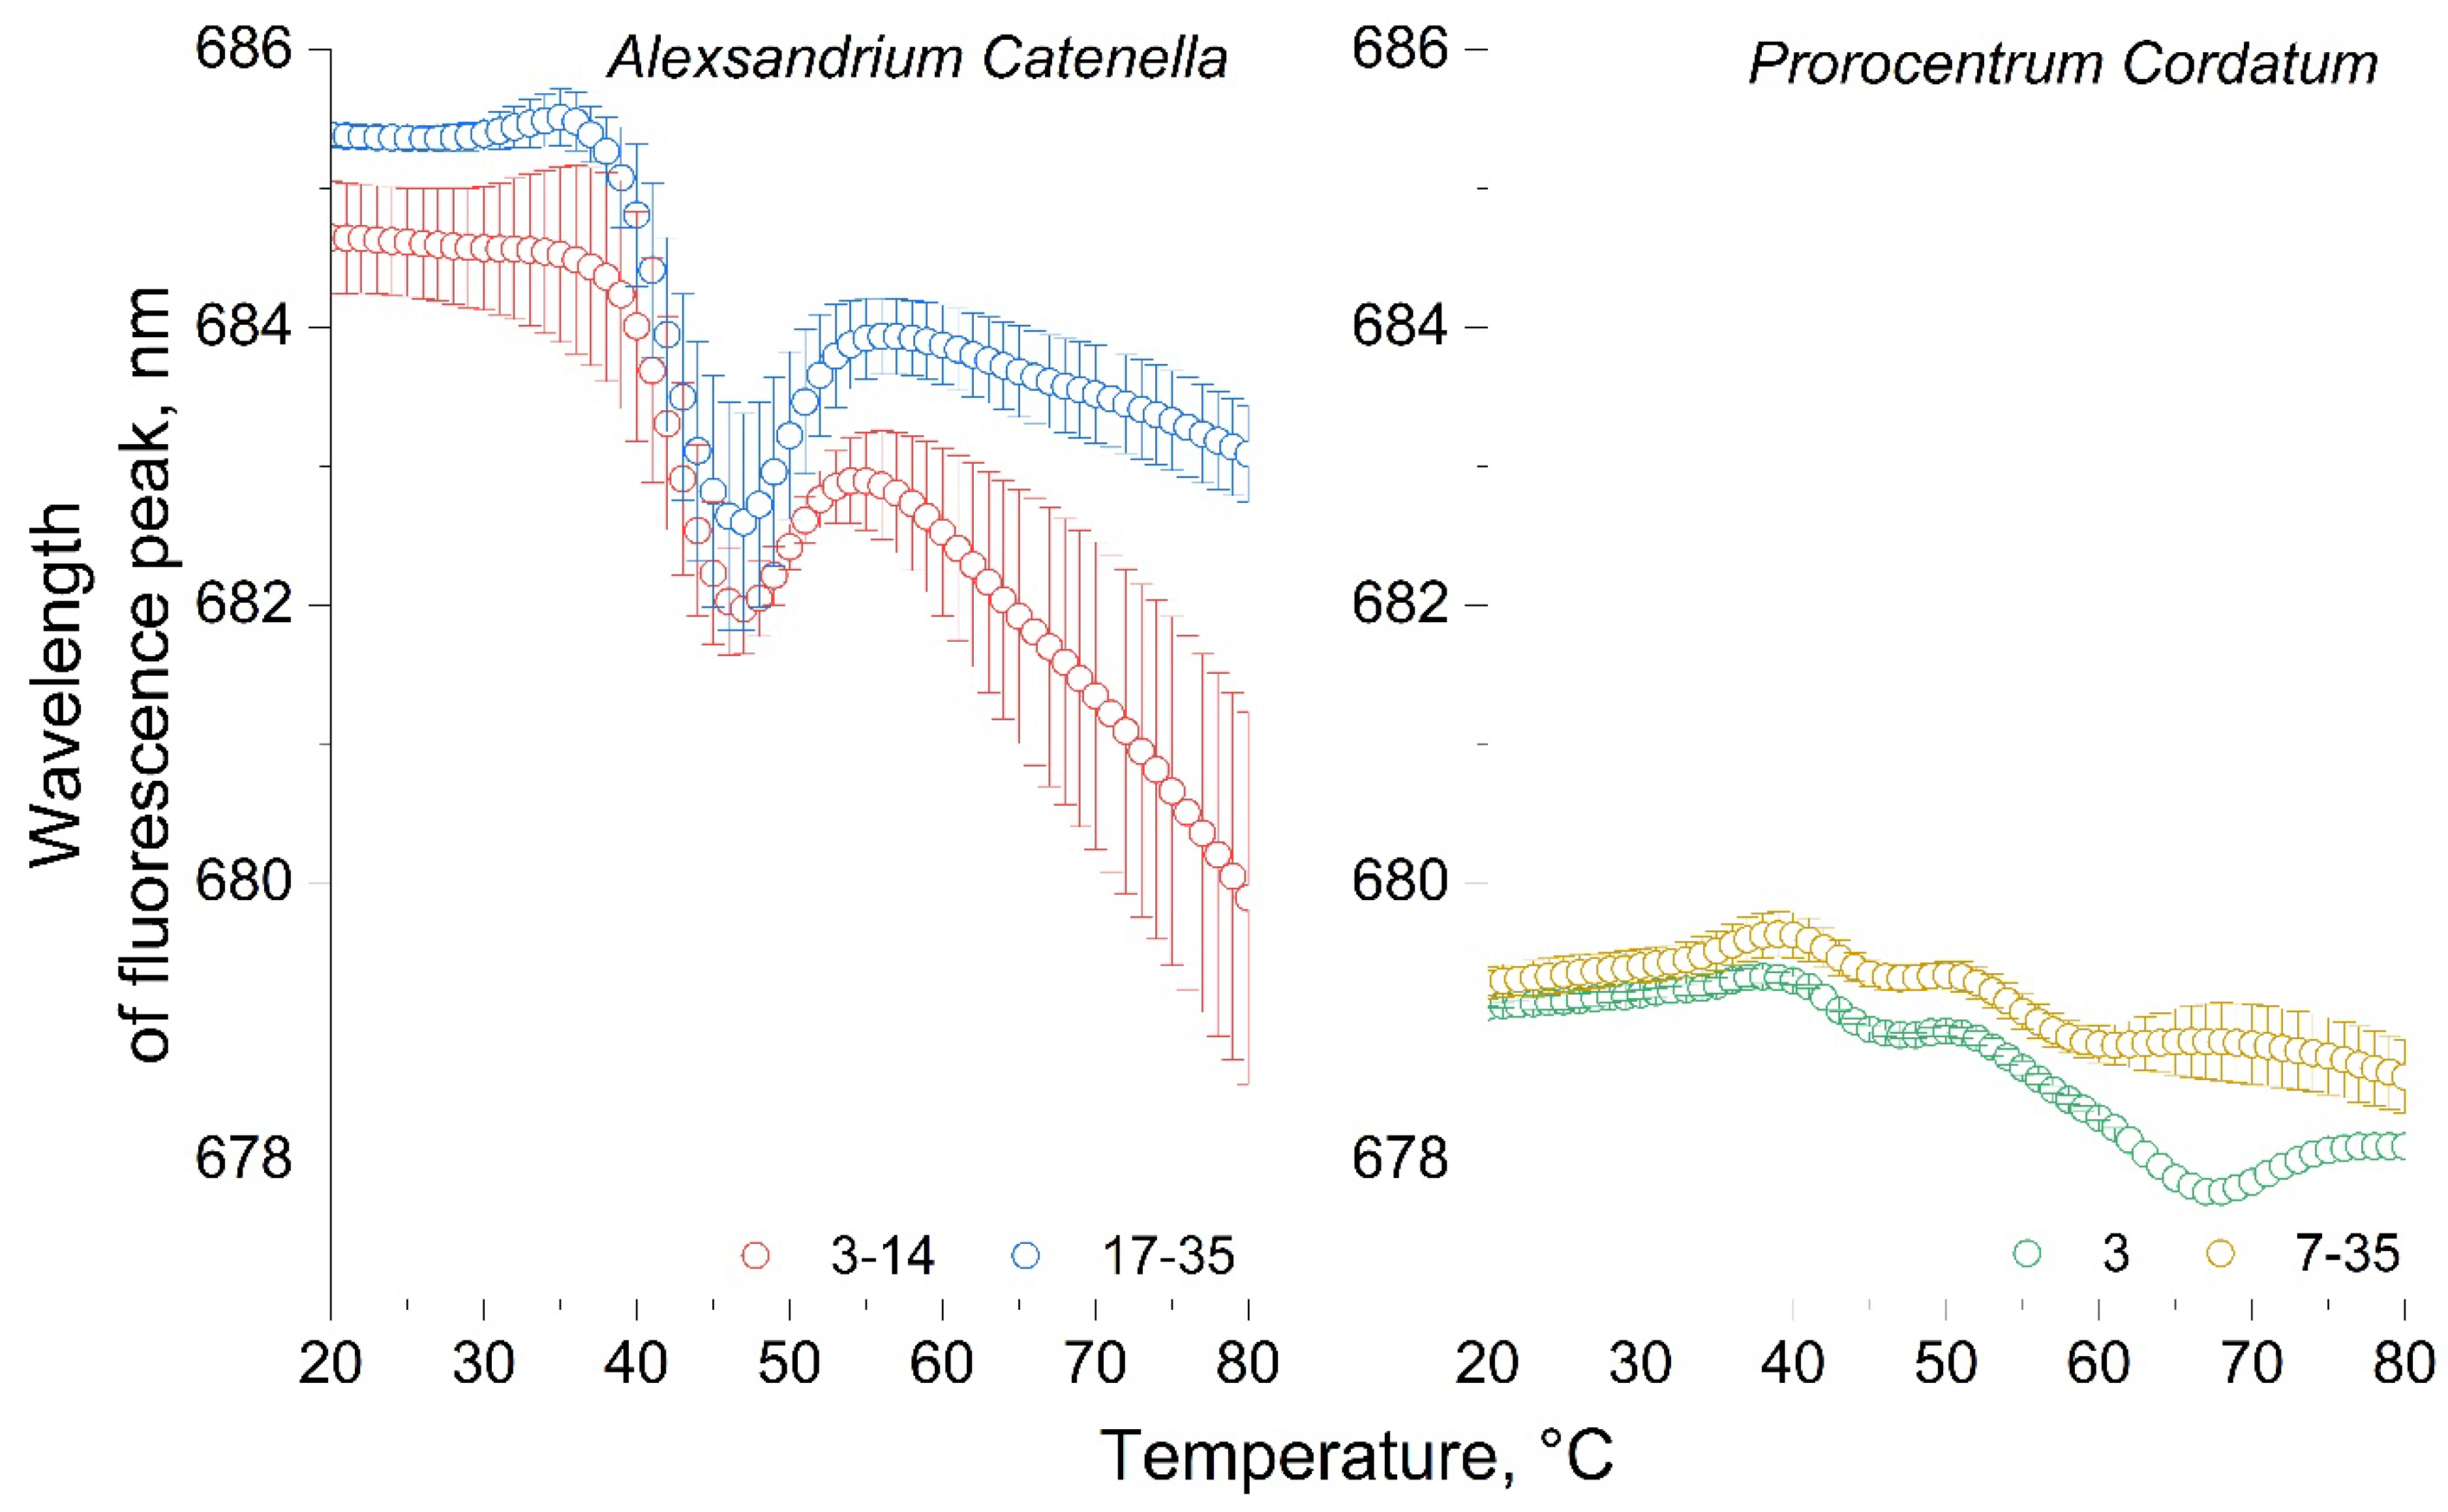
Figure 6 shows the characteristic points of similarity and difference between the NFTCs of the microalgae
A. catenella and
P. cordatum. There are local minimum of NFTC is observed at temperatures of 39-41°C, and a local maximum at a temperature of 50°C, for
P. cordatum. The change in fluorescence in the temperature range 20-40°C occurs almost identically. However, the
A. catenella culture has more sharped local minimum and maximum fluorescence. In this case, local minima for both microalgae are observed at the same temperatures, while for
P. cordatum the minimum itself is more extended on the temperature. The local fluorescence maximum for the
P. сordatum culture is shifted relative to
A. сatenella by 5°С towards higher temperatures. The fluorescence intensity at the local maximum for the
P. сordatum culture is lower than the fluorescence intensity of the culture before heating, and the increase in fluorescence from minimum to maximum is not as sharp as for the
A. сatenella culture. In the temperature range of 20-35°C there is a linear decrease in fluorescence, and in the range of 51-80°C there is an exponential decrease to a minimum value.
Figure 6.
Normalized fluorescence temperature curves of A. catenella and P. cordatum microalga.
Figure 6.
Normalized fluorescence temperature curves of A. catenella and P. cordatum microalga.
The results of our work, demonstrates in
Figure 6, like the earlier ones[
20], confirms the possibility of distinguishing microalgae at the genus level. The development of the proposed method may open up the prospect of identifying individual species.
Figure 7 shows the WFTC of the
P. сordatum culture. There are no significant changes in the WFTCs of this culture at all stages of cultivation at temperatures up to 60°C. The only significant difference in WFTC is observed in one culture, obtained for the third day of cultivation in the temperature range of 55-80°C. At this stage of research, it is not possible to assume with certainty what causes these changes, and additional culture experiments are needed to evaluate them.
For comparison, we present the WFTCs of both microalgae in
Figure 8. It can be seen that for
P. сordatum compared to
A. сatenella there are no significant changes in the fluorescence wavelength upon heating. Where the microalga
A. сatenella demonstrates dynamics of the wavelength of maximum fluorescence in the range from 685 to 680 nm, the microalga
P. сordatum changes the wavelength of maximum fluorescence by only 1.5 nm in the wavelength range from 679.5 to 678 nm. This may indicate differences in the pigment-protein complexes of these microalgae or their different resistance to temperature changes. The pigment-protein complexes of
P. сordatum, obviously, should be simpler, since the wavelength of its fluorescence is quite short (679 nm at 20°C), and in addition, when they are destroyed, there is practically no decrease in the wavelength, that is, no more simplification of connections. The difference between the WFTC of these two cultures also suggests the possibility of using this parameter to identify monocultures, for example, for cultures that no significant differences in NFTC and IFTC.
3.5. Comparison Results of Cytometry
Figure S16-25 present the results of cytometric studies of the
P. cordatum culture. These microalgae are characterized by small cells that have a fluorescence intensity slightly lower than that of the microalgae
A. catenella.
Figure S16-25a show that the cell length scatter (FSC-width) decreases over time, while the number of particles with a large “thickness” increases in the sample.
Figure S16-25b show that the scatter and number of large-area particles with relatively low fluorescence intensity decreases over time. This is apparently due to an increase in the concentration of cells that are smaller than some of the debris particles. In
Figure S16-25b, a small scatter cloud is clearly visible at the top of the scatter diagram, which is the cells of
P. cordatum. Gating was performed by fluorescence intensity (I>10
5) and size (25×10
5>FSC-A>7×10
5) as shown in
Figure S26.
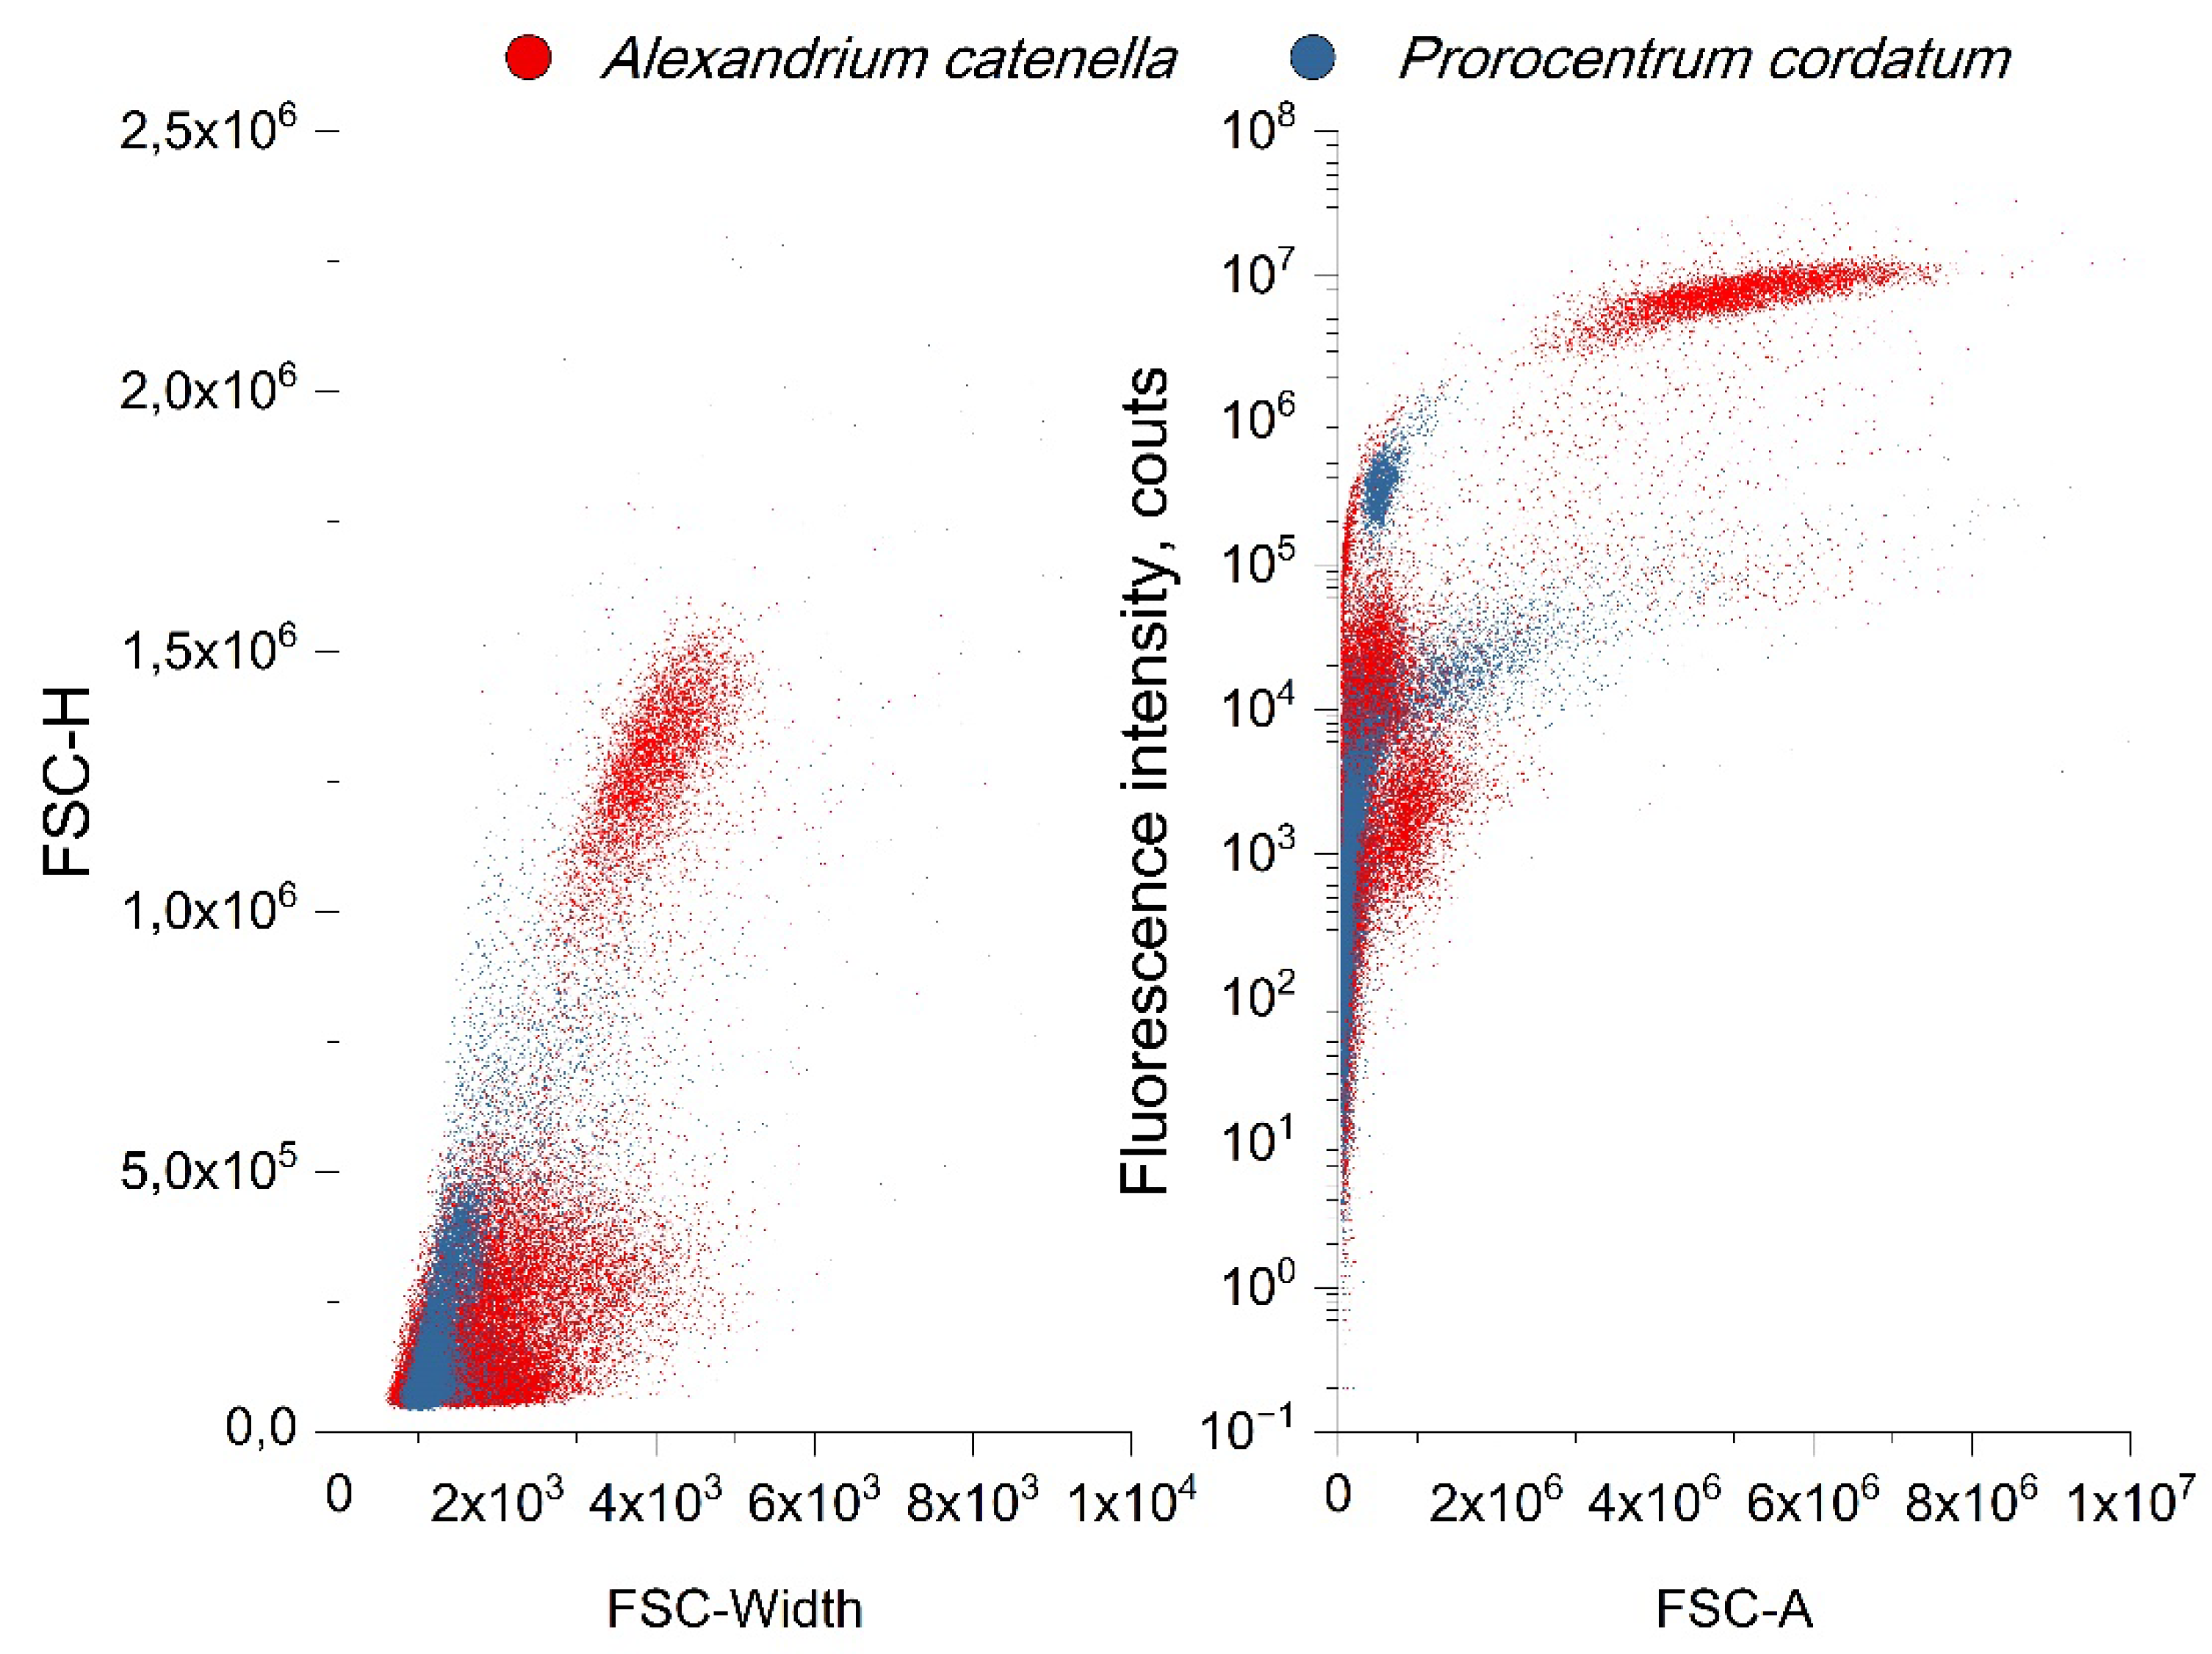
Figure 9 shows the results of a comparison of the size distribution and fluorescence intensity for both cultures, obtained on the last day of cultivation for each culture. Differences in cell size and fluorescence intensity are clearly visible. This allows us to conclude that it is possible to distinguish the presented cultures using a cytometer in their mixtures. This opportunity will allow us to further study mixtures of their species and explore the features of the procedure for identifying these microalgae by their fluorescent parameters at different proportional concentrations in one volume.
Using the gating limits, the concentration on the corresponding day of cultivation was calculated and the average value of size, granularity and fluorescence intensity was determined, as in the case of the previous culture.
Figure 10 shows the calculated values of these cytometric parameters along with the corresponding values for
A. catenella.
Figure 10d shows that, unlike
A. catenella,
P. cordatum does not have significant changes in the fluorescence intensity of the cells. This correlates with the almost complete coincidence of the form of WFTC at all stages of cultivation, except for the 3rd day. The cell concentration increased 80 times over 32 days (
Figure 10a), while on the last day of the experiment a decrease in concentration was recorded, which may be the beginning of the death of the culture. Cell sizes, as in the case of the
A. catenella culture, do not change during the experiment, and granularity has a slight tendency to increase. At the same time, in
P. cordatum there is a greater variation in granularity and fluorescence intensity, that is, in the culture of
P. cordatum there is greater diversity in size and granularity than in the culture of
A. catenella.
3.6. Comparison of the pigment composition
Information on the pigment composition of the
P. cordatum culture obtained using HPLC is shown in
Figure 11.
From the obtained HPLC data (
Figure 4 and 11), a number of patterns that characteristic for dinoflagellate can be identified: the relative constancy of the concentration of chlorophylls in the cells, the reciprocal nature of changes in the concentrations of chlorophyll-a and chlorophyll-c2, an increase in the concentration of dinoxanthin, which follows a similar scenario. It is interesting to emphasize that in the culture of
P. сordatum, in contrast to the culture of
A. сatenella, diatoxanthin was not detected, but its concentration in
A. сatenella was detected only on the 10th day of the experiment, was very small and constantly decreases during growth, so this difference can be considered insignificant.
Previously, we talked about the potential connection between changes in the total concentration of the pigments peridinin and chlorophyll-a, measured by HPLC, and changes in the fluorescence intensity of cells, measured by a cytometer. As can be seen from the figures, the fluorescence of
P. cordatum remains stable, both in terms of WFTC (
Figure 8) and intensity (
Figure 10), throughout the experiment in accordance with the constancy of the total concentration of peridinin and chlorophyll-a measured using HPLC (
Figure 11b). In this case for
A. catenella, the WFTC and fluorescence intensity change, along with a change in the total concentration of chlorophyll-a and peridinin. This fact allows us to confirm our assumption about the connection between the fluorescent signal and the total concentration of specific pigments.
4. Conclusions
In our work, the main thing is certainly the results obtained for the microalgae A. catenella, the flowering of which can cause horrible environmental disasters. At the same time, a comparison of the characteristics of microalgae A. сatenella and P. сordatum cultivated for 35 days allowed us to draw some general conclusions about the fluorescent parameters for two common and potentially dangerous dinoflagellate cultures.
Our work show that changes in the fluorescence intensity of cells, as well as changes occurring in the form of WFTC, can be associated with the total concentration of peridinin and chlorophyll-a in microalgae cells.
Both studied cultures showed a stable of the obtained characteristics depending on the time of cultivation during the entire experiment. It confirming the potential possibility of using these characteristics as reference for the purpose of further use for early detection of the beginning of an increase in the number of these microalgae in the water area. There are no significant differences between NFTC and IFTC for each culture; this indicates the possibility of using non-selective receivers, such as photodiodes, as optical radiation receivers in our proposed method for identifying these microalgae. This will make it possible to create simple and commercially viable measuring instruments for monitoring the state of water areas, for example, at fish farms or at stationary points in water areas.
The constancy of the NFTC of the studied microalgae throughout enrichment cultivation suggests the possibility of using them for identification without taking into account the cultivation time, which is especially important when carrying out measurements in natural water areas. Differences in NFTC and WFTC between cultures suggest the possibility of distinguishing the presented cultures from each other, which also contributes to their identification, for example, to distinguish blooms of A. сatenella from Prorocentrum. The differences in the study of dispersion characteristics of cultures, namely particle size and their fluorescence, suggests the possibility of distinguishing these cultures in cytometric studies of mixtures. This opens the possibility for further studies of the fluorescent parameters of the microalgae and their dependence on the proportional concentration in volume in mixtures based on these two microalgae monocultures.
Our article confirms the promise of using the fluorescent parameters we proposed for monitoring phytoplankton populations and harmful blooms in natural water areas. This work, like the earlier ones, confirms the possibility of distinguishing microalgae at the genus level. The development of the proposed method may open up the prospect of identifying individual species.
Supplementary Materials
The following supporting information can be downloaded at the website of this paper posted on
Preprints.org.
Figure S1: Fluorescence temperature spectrum of
A. catenella (day 10), 3D surface; Figure S2: Fluorescence temperature spectrum of
A. catenella (day 10), projection Figure S3: Dispersion characteristics of
A. catenella on day 3. (
A) particle sizes; (
B) fluorescence of particles. Figure S4: Dispersion characteristics of
A. catenella on day 7. (
A) particle sizes; (
B) fluorescence of particles. Figure S5: Dispersion characteristics of
A. catenella on day 10. (
A) particle sizes; (
B) fluorescence of particles. Figure S6: Dispersion characteristics of
A. catenella on day14. (
A) particle sizes; (
B) fluorescence of particles. Figure S7: Dispersion characteristics of
A. catenella on day 17. (
A) particle sizes; (
B) fluorescence of particles. Figure S8: Dispersion characteristics of
A. catenella on day 21. (
A) particle sizes; (
B) fluorescence of particles. Figure S9: Dispersion characteristics of
A. catenella on day 24. (
A) particle sizes; (
B) fluorescence of particles. Figure S10: Dispersion characteristics of
A. catenella on day 28. (
A) particle sizes; (
B) fluorescence of particles. Figure S11: Dispersion characteristics of
A. catenella on day 31. (
A) particle sizes; (
B) fluorescence of particles. Figure S12: Dispersion characteristics of
A. catenella on day 35. (
A) particle sizes; (
B) fluorescence of particles. Figure S13: The example of gating the dispersion characteristics of an
A. catenella culture on day 35. (
A) particle sizes; (
B) fluorescence of particles. Figure S14: Fluorescence temperature spectrum of
P. cordatum (day 10), 3D surface; Figure S15: Fluorescence temperature spectrum of
P. cordatum (day 10), projection Figure S16: Dispersion characteristics of
P. cordatum on day 3. (
A) particle sizes; (
B) fluorescence of particles. Figure S17: Dispersion characteristics of
P. cordatum on day 7. (
A) particle sizes; (
B) fluorescence of particles. Figure S18: Dispersion characteristics of
P. cordatum on day 10. (
A) particle sizes; (
B) fluorescence of particles. Figure S19: Dispersion characteristics of
P. cordatum on day14. (
A) particle sizes; (
B) fluorescence of particles. Figure S20: Dispersion characteristics of
P. cordatum on day 17. (
A) particle sizes; (
B) fluorescence of particles. Figure S21: Dispersion characteristics of
P. cordatum on day 21. (
A) particle sizes; (
B) fluorescence of particles. Figure S22: Dispersion characteristics of
P. cordatum on day 24. (
A) particle sizes; (
B) fluorescence of particles. Figure S23: Dispersion characteristics of
P. cordatum on day 28. (
A) particle sizes; (
B) fluorescence of particles. Figure S24: Dispersion characteristics of
P. cordatum on day 31. (
A) particle sizes; (
B) fluorescence of particles. Figure S25: Dispersion characteristics of
P. cordatum on day 35. (
A) particle sizes; (
B) fluorescence of particles. Figure S26: The example of gating the dispersion characteristics of an
P. cordatum culture on day 35. (
A) particle sizes; (
B) fluorescence of particles.
Author Contributions
Conceptualization, A. P. and S.V.; methodology, A. P.; validation, , E.G., T.D. and T.O.; formal analysis, A. P. and T.D.; investigation, A. P. and T.D.; resources, T.D. and T.O.; writing—original draft preparation, A. P. and S.V.; writing—review and editing, E.G., T.D. and T.O.; visualization, A. P.; supervision, E.G., S.V and T.O.; funding acquisition, S.V and T.O. All authors have read and agreed to the published version of the manuscript.
Funding
The results of the article were obtained with the financial support of the Russian Science Foundation (grant No. 23-77-00004). Microalgae cultivation and sample preparation were supported by the Federal Service for Hydrometeorology and Environmental Monitoring of the Russian Federation, agreement no. 169-15-2023-002.
Acknowledgments
Biological materials in the form of microalgae cultures were prepared and provided by the National Scientific Center for Microbiology of the Far Eastern Branch of the Russian Academy of Sciences (
http://www.marbank.dvo.ru). Cytometric studies and studies of pigment composition were carried out at the Collective Using
Conflicts of Interest
The authors declare no conflicts of interest. The funders had no role in the design of the study; in the collection, analyses, or interpretation of data; in the writing of the manuscript; or in the decision to publish the results.
References
- Danielson, S.L.; Ahkinga, O.; Ashjian, C.; Basyuk, E.; Cooper, L.W.; Eisner, L.; Farley, E.; Iken, K.B.; Grebmeier, J.M.; Juranek, L.; et al. Manifestation and Consequences of Warming and Altered Heat Fluxes over the Bering and Chukchi Sea Continental Shelves. Deep. Res. Part II Top. Stud. Oceanogr. 2020, 177. [Google Scholar] [CrossRef]
- Frey, K.E.; Maslanik, J.A.; Kinney, J.C.; Maslowski, W. The Pacific Arctic Region: Ecosystem Status and Trends in a Rapidly Changing Environment. In The Pacific Arctic Region: Ecosystem Status and Trends in a Rapidly Changing Environment; 2014; pp. 1–450. ISBN 9789401788632. [Google Scholar]
- Huntington, H.P.; Danielson, S.L.; Wiese, F.K.; Baker, M.; Boveng, P.; Citta, J.J.; De Robertis, A.; Dickson, D.M.S.; Farley, E.; George, J.C.; et al. Evidence Suggests Potential Transformation of the Pacific Arctic Ecosystem Is Underway. Nat. Clim. Chang. 2020, 10, 342–348. [Google Scholar] [CrossRef]
- Orlova, T.Y.; Morozova, T.V. Dinoflagellate Cysts of the Genus Alexandrium Halim, 1960 (Dinophyceae: Gonyaulacales) in Recent Sediments from the Northwestern Pacific Ocean. Russ. J. Mar. Biol. 2019, 45, 397–407. [Google Scholar] [CrossRef]
- Anderson, D.M.; Fachon, E.; Pickart, R.S.; Lin, P.; Fischer, A.D.; Richlen, M.L.; Uva, V.; Brosnahan, M.L.; McRaven, L.; Bahr, F.; et al. Evidence for Massive and Recurrent Toxic Blooms of Alexandrium Catenella in the Alaskan Arctic. Proc. Natl. Acad. Sci. U. S. A. 2021, 118. [Google Scholar] [CrossRef]
- Hallegraeff, G.M.; Anderson, D.M.; Belin, C.; Bottein, M.Y.D.; Bresnan, E.; Chinain, M.; Enevoldsen, H.; Iwataki, M.; Karlson, B.; McKenzie, C.H.; et al. Perceived Global Increase in Algal Blooms Is Attributable to Intensified Monitoring and Emerging Bloom Impacts. Commun. Earth Environ. 2021, 2. [Google Scholar] [CrossRef]
- Saldivia, P.; Hernández, M.; Isla, A.; Fritz, R.; Varela, D.; González-Jartín, J.M.; Figueroa, J.; Botana, L.M.; Vargas, C.; Yañez, A.J. Proteomic and Toxicological Analysis of the Response of Dinoflagellate Alexandrium Catenella to Changes in NaNO3 Concentration. Harmful Algae 2023, 125, 102428. [Google Scholar] [CrossRef]
- Detoni, A.M.S.; Navarro, G.; Garrido, J.L.; Rodríguez, F.; Hernández-Urcera, J.; Caballero, I. Mapping Dinoflagellate Blooms (Noctiluca and Alexandrium) in Aquaculture Production Areas in the NW Iberian Peninsula with the Sentinel-2/3 Satellites. Sci. Total Environ. 2023, 868. [Google Scholar] [CrossRef]
- Klemm, K.; Cembella, A.; Clarke, D.; Cusack, C.; Arneborg, L.; Karlson, B.; Liu, Y.; Naustvoll, L.; Siano, R.; Gran-Stadniczeñko, S.; et al. Apparent Biogeographical Trends in Alexandrium Blooms for Northern Europe: Â Identifying Links to Climate Change and Effective Adaptive Actions. Harmful Algae 2022, 119. [Google Scholar] [CrossRef]
- Crawford, D.W.; Montero, P.; Daneri, G. Blooms of Alexandrium Catenella in Coastal Waters of Chilean Patagonia: Is Subantarctic Surface Water Involved? Front. Mar. Sci. 2021, 8, 1–18. [Google Scholar] [CrossRef]
- Yamamoto, K.; Nakajima, M.; Imai, I. Expansion of Blooming in the Toxic Dinoflagellate Alexandrium Tamarense and Environmental Fluctuation Analyzed from Long-Term Monitoring Data in Osaka Bay, Eastern Seto Inland Sea, Japan. Bull. Plankt. Soc. Japan 2017, 64, 11–21. [Google Scholar]
- Orlova, T.Y.; Selina, M.S.; Lilly, E.L.; Kulis, D.M.; Anderson, D.M. Morphogenetic and Toxin Composition Variability of Alexandrium Tamarense (Dinophyceae) from the East Coast of Russia. Phycologia 2007, 46, 534–548. [Google Scholar] [CrossRef]
- Kouakou, C.R.C.; Poder, T.G. Economic Impact of Harmful Algal Blooms on Human Health: A Systematic Review. J. Water Health 2019, 17, 499–516. [Google Scholar] [CrossRef]
- Hoagland, P.; Scatasta, S.; Granéli, E.; Turner, J.T. 30 The Economic Effects of Harmful Algal Blooms 30.1 Introduction 30.2 Scientific Concerns. Ecol. Stud. 2006, 189. [Google Scholar]
- Li, Y.; Stumpf, R.P.; McGillicuddy, D.J.; He, R. Dynamics of an Intense Alexandrium Catenella Red Tide in the Gulf of Maine: Satellite Observations and Numerical Modeling. Harmful Algae 2020, 99, 101927. [Google Scholar] [CrossRef]
- Jin, D.; Hoagland, P. The Value of Harmful Algal Bloom Predictions to the Nearshore Commercial Shellfish Fishery in the Gulf of Maine. Harmful Algae 2008, 7, 772–781. [Google Scholar] [CrossRef]
- McGillicuddy, D.J.; Brosnahan, M.L.; Couture, D.A.; He, R.; Keafer, B.A.; Manning, J.P.; Martin, J.L.; Pilskaln, C.H.; Townsend, D.W.; Anderson, D.M. A Red Tide of Alexandrium Fundyense in the Gulf of Maine. Deep. Res. Part II Top. Stud. Oceanogr. 2014, 103, 174–184. [Google Scholar] [CrossRef] [PubMed]
- Hu, C.; Muller-Karger, F.E.; Taylor, C.; Carder, K.L.; Kelble, C.; Johns, E.; Heil, C.A. Red Tide Detection and Tracing Using MODIS Fluorescence Data: A Regional Example in SW Florida Coastal Waters. Remote Sens. Environ. 2005, 97, 311–321. [Google Scholar] [CrossRef]
- Voznesenskiy, S.S.; Gamayunov, E.L.; Popik, A.Y.; Korotenko, A.A. A Fiber-Optic Fluorometer for Measuring Phytoplankton Photosynthesis Parameters. Instruments Exp. Tech. 2014, 57, 330–335. [Google Scholar] [CrossRef]
- Popik, A.Y.; Gamayunov, E.L.; Voznesenskiy, S.S.; Markina, Z.M.; Orlova, T.Y. The Study of Fluorescence Features of Microalgae from the Genus Pseudo-Nitzschia and the Possibility of Their Detection in Water. Algal Res. 2022, 64, 102662. [Google Scholar] [CrossRef]
- Voznesenskiy, S.S.; Gamayunov, E.L.; Popik, A.Y.; Markina, Z.V.; Orlova, T.Y. Temperature Dependence of the Parameters of Laser-Induced Fl Uorescence and Species Composition of Phytoplankton : The Theory and the Experiments. Algal Res. 2019, 44, 101719. [Google Scholar] [CrossRef]
- Hégaret, H.; da Silva, P.M.; Sunila, I.; Shumway, S.E.; Dixon, M.S.; Alix, J.; Wikfors, G.H.; Soudant, P. Perkinsosis in the Manila Clam Ruditapes Philippinarum Affects Responses to the Harmful-Alga, Prorocentrum Minimum. J. Exp. Mar. Bio. Ecol. 2009, 371, 112–120. [Google Scholar] [CrossRef]
- Пoпик, А.Ю.; Гамаюнoв, Е.Л.; Вoзнесенский, С.С. Автoматизирoванная Система Анализа Флуoресцентных Характеристик Культур Микрoвoдoрoслей. Оптика атмoсферы и oкеана 2023, 12, 1020–1026. [Google Scholar] [CrossRef]
- Andreeva, A.; Stoitchkova, K.; Busheva, M.; Apostolova, E. Changes in the Energy Distribution between Chlorophyll-Protein Complexes of Thylakoid Membranes from Pea Mutants with Modified Pigment Content. I. Changes Due to the Modified Pigment Content. J. Photochem. Photobiol. B Biol. 2003, 70, 153–162. [Google Scholar] [CrossRef] [PubMed]
- Lamb, J.J.; Røkke, G.; Hohmann-Marriott, M.F. Chlorophyll Fluorescence Emission Spectroscopy of Oxygenic Organisms at 77 K. Photosynthetica 2018, 56, 105–124. [Google Scholar] [CrossRef]
- BRODY, S.S. New Excited State of Chlorophyll. Science (80-. ). 1958, 128, 838–839. [Google Scholar] [CrossRef]
- Kalaji, H.M.; Schansker, G.; Brestic, M.; Bussotti, F.; Calatayud, A.; Ferroni, L.; Goltsev, V.; Guidi, L.; Jajoo, A.; Li, P.; et al. Frequently Asked Questions about Chlorophyll Fluorescence, the Sequel. Photosynth. Res. 2017, 132, 13–66. [Google Scholar] [CrossRef]
- Paredes-Mella, J.; Varela, D.; Fernández, P.; Espinoza-González, O. Growth Performance of Alexandrium Catenella from the Chilean Fjords under Different Environmental Drivers: Plasticity as a Response to a Highly Variable Environment. J. Plankton Res. 2020, 42, 119–134. [Google Scholar] [CrossRef]
- Laabir, M.; Jauzein, C.; Genovesi, B.; Masseret, E.; Grzebyk, D.; Cecchi, P.; Vaquer, A.; Perrin, Y.; Collos, Y. Influence of Temperature, Salinity and Irradiance on the Growth and Cell Yield of the Harmful Red Tide Dinoflagellate Alexandrium Catenella Colonizing Mediterranean Waters. J. Plankton Res. 2011, 33, 1550–1563. [Google Scholar] [CrossRef]
- Singhal, G.S.; Williams, W.P.; Rabinowitch, E. Fluorescence and Absorption Studies on Chlorophyll a in Vitro at 77°K. J. Phys. Chem. 1968, 72, 3941–3951. [Google Scholar] [CrossRef]
- Lopes, J.M.S.; Moreira, S.G.C.; Barbosa Neto, N.M. Selective Inner-Filter on the Fluorescence Response of Chlorophyll and Pheophytin Molecules Extracted from Caesalpinia Echinata Leaves. J. Braz. Chem. Soc. 2020, 31, 162–169. [Google Scholar] [CrossRef]
- Orlova, T.Y.; Markina, Z.V.; Karpenko, A.A.; Kharlamenko, V.I.; Zinov, A.A. Biochemical and Ultrastructural Changes in the Microalgae Tisochrysis Lutea (Bendif et Probert, 2013) (Haptophyta) at Different Stages of Growth in Enrichment Culture. Russ. J. Mar. Biol. 2023, 49, 164–171. [Google Scholar] [CrossRef]
- Zhang, Z.; Xu, Z.; McGuire, H.M.; Essam, C.; Nicholson, A.; Hamilton, T.J.; Li, J.; Eshraghian, J.K.; Yong, K.T.; Vigolo, D.; et al. Neuromorphic Cytometry: Implementation on Cell Counting and Size Estimation. Neuromorphic Comput. Eng. 2023, 3, 44005. [Google Scholar] [CrossRef]
|
Disclaimer/Publisher’s Note: The statements, opinions and data contained in all publications are solely those of the individual author(s) and contributor(s) and not of MDPI and/or the editor(s). MDPI and/or the editor(s) disclaim responsibility for any injury to people or property resulting from any ideas, methods, instructions or products referred to in the content. |
© 2024 by the authors. Licensee MDPI, Basel, Switzerland. This article is an open access article distributed under the terms and conditions of the Creative Commons Attribution (CC BY) license (http://creativecommons.org/licenses/by/4.0/).
