1. Introduction
Easy access to mental health care is something most people in Pakistan are deprived of. With mental health care becoming increasingly expensive and there being only 1 mental health professional for approximately 500,000 people, the domain of mental health care needs a serious reevaluation [
1,
2]. The inherent elusive nature of diagnosing mental health disorders warrant the need for some kind of automated tool that aids users in their diagnostic journey. Mental health ailments are serious issues faced by people of all ages. These issues can result in varying outcomes. Some cases cause minor hindrances in someone’s day to day life whereas others can result in someone taking their own life. There is no certain explanation as to what someone ends up doing as a result of their deteriorating mental health [
3]. This makes mental health disorders a serious issue that needs to be dealt with swiftly. Mental health refers to a state of well-being in which an individual realizes his or her own abilities to cope with the normal stresses of life, work productively and fruitfully, and is able to make useful contributions to his or her society and community [
4,
5]. This state can be considered as one of the most important factors towards leading a fulfilling life and having an overall positive impact on society in general. On the opposite end of this spectrum, mental health disorders are conditions that can affect your behavior, mood and thinking. They can hinder your ability to carry out mundane everyday tasks and they can be extremely overpowering and can leave the people going through them with feelings of angst, anger and even despair [
6,
7]. These disorders can have life long impacts on people diagnosed and even worse impacts on some of the people who are not diagnosed. Mental health disorders can manifest at any age which makes them some of the most elusive ailments to diagnose. Developing countries like Pakistan where the majority of the population lives below the poverty line face mental health problems on a scale that is difficult to comprehend. This makes mental health assistance something that is not easily accessible [
8,
9]. More importantly, the stigma surrounding mental health care in Pakistan makes its access burdensome. These reasons prove how important it is to further explore and analyze mental health issues and concerns in Pakistan. With approximately 918 million people facing mental health problems worldwide, the mental health dilemma has never been greater. Due to the widespread stigma surrounding mental health which leads to the societal rejection of mental health problems in Pakistan, this crucial issue has not been able to gain the traction it should have. This is one of the major reasons why mental health professionals are not available in all parts of Pakistan [
10,
11]. The implications of this can be estimated from the fact that according to the World Health Organization (WHO) there is one mental health professional for every 500,000 people in Pakistan [
12,
13]. This is a staggeringly low number since the mental health patients in Pakistan approximate out to be 4% of the entire populus. With such low numbers of mental health professionals, there is a dire need for mental health education among the masses and for there to be some platform people can visit to periodically check in on their mental health. Machine learning plays important role in automating diagnsotic processes of t types like cardiac issues [
14] The differetn need for a platform that can accurately classify mental health diseases in people based on their responses to questions asked by mental health professionals cannot be overstated. Mental health disorders are complex and varied, with symptoms that can often overlap or mimic other conditions [
15,
16,
17]. This makes accurate diagnosis and effective treatment a significant challenge for mental health professionals [
18,
19]. A platform that can systematically evaluate an individual’s responses to a standardized set of questions can help to streamline the diagnostic process and provide more accurate and timely diagnosis [
1,
20,
21,
22,
23]. Additionally, such a platform can provide valuable insights into patterns and trends in mental health disorders, helping to inform public policy and allocate resources to where they are most needed. Overall, the development of a robust platform for mental health diagnosis has the potential to greatly improve outcomes for mental health patients, and is an important step towards improving mental healthcare globallyc [
24,
25,
26]. However, the platform does not aim to replace the role of mental health professionals or provide medical advice [
27,
28,
29]. It will solely serve as a tool to support mental health professionals and provide guidance and resources for users. Additionally, the platform and its results may be subject to the limitations and challenges, such as data quality, model interpretability, and user acceptance, which will be addressed through appropriate solutions and strategies.
2. Literature Review
The use of artificial intelligence in the field of mental health is supported by years of research done by the pioneers of this field. These researches focus on all aspects of mental health disease detection, classification and evaluation. The review of these papers shows the following three major categories that have been thoroughly worked on in this field. In their paper (Chung and Teo, 2022) [2] talk about the different mental health diseases they have studied and understood during their research. They discuss possible detection and classification techniques for schizophrenia, depression, bipolar disorder, and anxiety. They conclude that despite there not being any groundbreaking results in this domain, researchers are steadily able to come closer and closer to attaining a solution for mental health disease detection and classification by getting better results with every iteration. In their book (Artificial Intelligence in Behavioral and Mental Health Care, 2016) [3] the authors discuss all of the different ML/DL models and techniques that can be used for mental health disease detection. Going into detail about technologies like Machine Learning, Artificial Neural Networks, Machine perception and sensing, affective computing and many more, they conclude that machines and comprehensive algorithms are able to gain keen insights and generate better inference on patterns that are too complex for human beings to detect. This supports their finding that comprehensive artificial models and algorithms are better at finding disease markers in human beings because of their innate ability to understand the complex correlations in data. (Graham et al., 2019) [4] have reviewed 28 studies that use Electronic Health Records (EHRs) to classify mental health illnesses. They have concluded that using EHRs from mood rating scales, questionnaires on social media platforms and brain imaging data to classify mental health diseases like depression, schizophrenia or other psychiatric illnesses, and suicide ideation and attempts “revealed high accuracies and provided excellent examples of AI’s potential in mental healthcare”. It should be noted that in all of the 28 studies that were analyzed in this report, there were no clear performance metrics that were broadcasted which shows that the implementation of such artificially intelligent. In their research Luxton, D. D. (Luxton, 2013) [5]. Artificial Intelligence in Psychological Practice: Current and Future Applications and Implications the author discusses at length the emergence and prevalence of AI in every field of work today and its bright future with continued and ongoing investments. They consider this and conclude the undoubtable potential of AI in the field of mental health care. Leaning on the historic importance of the field of psychology and its influence on the development of AI itself from the theory of how neurons learn to the “cognitive revolution” in psychology in the 1960s all were critical concepts to the further realization of AI. This intermingling of fields the author describes as a strong reason for AI to become an equally substantial tool in the field of psychology where it may serve to benefit patients, health care providers, and society by enhancing care, increasing efficiency, and improving access to quality services. Ellen L Lee (Lee et al., 2021) [6] and others describe the current state of AI’s use in health care where it has become increasingly used in radiology and oncology yet remains unexceptionally used or researched for neurobiological health. The research is the product of a study to ascertain and provide an overview of the approaches Artificial Intelligence can take expanding its use into mental health by improving and aiding all areas of diagnosis, prognosis, treatment and clinical/technological challenges. Describing some of the areas where AI can outright bring improvement the research deliberates on the objectivity, an efficiency of identification, personalization and empowerment all advancements the use of AI can bring while also discussing the caution its usage should take considering its ethical implications. In this study by Young Tak Jo and others (Jo et al., 2020) [7], several machine learning models were built using global and nodal network properties to classify individuals as schizophrenia patients or healthy controls. The machine learning algorithms used included Support Vector Machine (SVM), multinomial Naïve Bayes (NB), Random Forest (RF), and gradient boosting. The models were assessed using cross-validation, and the accuracy and area under the curve (AUC) were calculated. The XGBoost model based on nodal degree showed the highest performance, with a 66.3% accuracy and an AUC of 0.656. The models based on global network properties generally outperformed those based on nodal properties. The importance of each region of interest (ROI) was also evaluated, revealing patterns of involved brain regions and a higher contribution from ROIs in the right hemisphere. These findings demonstrate the potential of network analysis and machine learning methods in diagnosing schizophrenia and provide insights into the underlying brain connectivity patterns associated with the disorder. In the study conducted by (Srinivasagopalan et al., 2019) [8], a deep learning approach was employed to diagnose schizophrenic patients using fMRI data. The researchers explored various machine learning and deep learning techniques to achieve accurate classification. Logistic regression, support vector machines (SVM), and random forest models were implemented, with logistic regression achieving an accuracy of 0.8277, SVM achieving 0.7988, and random forest achieving 0.8333. However, the most promising results were obtained using a deep learning architecture consisting of three hidden layers and a dropout rate of 50This model achieved an impressive accuracy of 0.9444, highlighting the potential of deep learning for schizophrenia diagnosis. The study provides valuable insights into the effectiveness of different techniques in the context of mental health diagnosis, laying the foundation for future research and advancements in this field. In a study by Pläschke RN (Plaschke et al., 2017) [9], researchers aimed to address the limitations of previous whole-brain functional connectivity studies which achieved successful classifications of patients and healthy controls but provided limited specificity regarding the affected brain systems. To conduct the analysis, separate support vector machine classifications were performed on functional connectivity data obtained from patients suffering from schizophrenia, PD and older adults and young, healthy controls. The researchers utilized 12 task-based, meta-analytically defined networks and employed a nested 10-fold cross-validation scheme with 25 replications. The findings of this study indicate that the pattern-classification approach employed captured associations between clinical and developmental conditions and functional network integrity with a higher level of specificity compared to previous whole-brain analyses. The results for all the networks for Schizophrenia with control range from about 0.61 to 0.79 AUC. SCZ patients could be distinguished above chance from matched HCs based on RSFC in the Rew network with an accuracy of 68%. In a study by Anamika Ahmed and others (Ahmed et al., 2019) [10], researchers focused on the detection of depression, major depressive disorder and anxiety. It has been reported that over 50% of the total population in middle and high-income countries experience at least one of the aforementioned mental illnesses in their lifetime. Researchers proposed a model combining a standard psychological assessment with ML algorithms to diagnose the severity levels of the disorders. The model employed five different types of algorithms, Convolutional Neural Network, Support Vector Machine, Linear Discriminant Analysis, K Nearest Neighbour Classifier and Linear Regression. The algorithms were applied to two different datasets, one for anxiety and one for depression. The study aimed to compare the performance of the five algorithms against the respective datasets using various measurement metrics as evaluation criteria. The results demonstrated that in the proposed model, it was CNN algorithm that yielded the highest accuracy of 96% for anxiety and 96.8% for depression. In the study by Daniel Leightley and others (Leightley et al., 2018) [11], researchers focused on the mental health of soldiers and its impact on their operational effectiveness, health and overall well-being. With the prevalence of traumatic events experienced during military service, the development of PTSD is not uncommon. Although many studies have utilized probabilistic and regression modeling to estimate its likelihood, the increasing complexity and large quantities of data collected call for more sophisticated modeling methods. Therefore, the researchers for this study turned to ML classifiers as a means to generate advanced statistical models that can uncover patterns and behaviors within complex datasets. It has to be noted that the application of ML in PTSD detection has been limited thus far. The single study had utilized supervised ML for prediction, demonstrating the model’s capability to accurately detect probable PTSD in a Danish military cohort, but the study only used one ML technique and a small number of data points. To address the limitations, the dataset for this study consisted for 13,690 subjects and over 22 variables were used for testing. The classifiers used for this study include Support Vector Machines, Random Forests, Artificial Neural Networks and Bagging. The accuracies achieved for all the classifiers were 0.91, 0.97, 0.89 and 0.95 respectively. In another study done by Wanqing Xie and other researchers (Xie et al., 2022) [12], the prevalence of depression and anxiety has been highlighted. The current methods of using Self-Reported Anxiety Scale and Self-Reported Depression Scales are said to have limitations as they provide limited information and may not align with clinical diagnosis. To address this, a new approach is proposed by the researchers to extract features from facial expressions and movements captured in videos recorded while individuals complete the scales. The findings are combined with multimodal data with scale information, and a framework is developed to enhance the accuracy and reliability of the diagnostic process. A model with two branches is constructed, one for each scale. The branches utilize a Convolutional Neural Network to extract the features and a Long Short-Term Memory network is employed to further embed the expressions and capture connections between subsequent frames. The scale scores are transformed into one-hot format and fed into their respective branches, further enhancing the extraction of multimodal data information. The embeddings from both the branches are fused at the end to generate inference results for depression. Three different classification methods were used in this research to generate a classification model, SVM, Naive Bayes and AdaBoost. While SAS and SDS have the accuracy of 83.78% on their own, the model the researchers tested with reached the accuracy of 94.67%. The study done by Jina Kim and others (Kim et al., 2020) [13] presents a novel approach to identify mental illness through analyzing user-generated content on social media platforms. The authors recognized the potential of social media as a valuable source of information for mental health assessment and developed a deep learning model to automatically detect signs of mental illness. By leveraging a large dataset of user posts and associated mental health labels, the researchers trained their deep learning model using recurrent neural networks (RNNs) and attention mechanisms to capture the sequential and contextual information in the text. The findings showcased promising results, demonstrating the model’s ability to accurately detect mental illness with an impressive accuracy of 82of mental health assessment, highlighting the potential of utilizing social media data and deep learning techniques for early detection and intervention of mental health conditions in a scalable and non-intrusive manner. In this paper by Góngora Alonso S and others (Góngora et al., 2022) [14] the researchers aimed to assess the effectiveness of various machine learning algorithms in predicting hospitalization among patients with schizophrenia. They collected a comprehensive dataset comprising demographic information, clinical assessments, and historical records of hospitalized patients. The researchers implemented and compared different algorithms, including logistic regression, decision trees, random forests, support vector machines, and gradient boosting machines. The results of their study indicated that random forest and gradient boosting machines exhibited superior predictive performance, achieving an accuracy of 85% and 83% respectively, in identifying patients at risk of hospitalization. This research provides valuable insights into the potential of machine learning algorithms to aid in the early identification and intervention for individuals with schizophrenia, thereby facilitating more targeted and timely treatment strategies to reduce hospitalization rates.
3. Proposed Methodology
3.1. Dataset
The dataset used for this project was obtained from The local mental hospitalMental Health Institute Pakistan, which provided a rich source of data consisting of 124 information points for each patient record. These information points had varying data formats depending on the type of question being asked. Out of the 124 information points, 69 contained numerical values, while 55 contained string values. The dataset was sampled from a large population of 80,000 patients over a significant period of time, using questionnaires and direct interviews with patients which makes it an invaluable source of information for this study. However, it is important to note that only 900 records contained a valid diagnosis in the diagnosis column, while the remaining 79,100 patient records did not contain any diagnosis in the diagnosis column. This means that the data is suitable for training a supervised learning algorithm using the 900 records, while the unsupervised learning algorithm can utilize the remaining 79,100 records for training. The dataset contains various features that provide insights into different aspects of a patient’s diagnostic journey. These features range from simple information points like the number of visits to a mental health professional and the number of episodes of a particular illness, to more complex features such as whether or not the patient experiences hallucinations, their ability to understand things, and whether they have a history of drug misuse. The comprehensive data points included in this dataset ensure that all aspects of a patient’s mental health condition are thoroughly explored and understood. With this dataset, our proposed solution can effectively classify different mental health diagnoses based on the responses provided by the patients.
Dataset 1 Kaggle Crop Recommendation dataset
The dataset used to train the model is “crop prediction” and is taken from kaggle. The dataset contains values of nitrogen(N), phosphorus(P), potassium(K), temperature and humidity. As the dataset is from Asia so has various numbers of crops that grow in this region and are mentioned in the dataset as well. Whereas the dataset is not labeled so we don’t know the condition of soil whether it is fertile or non-fertile. This classification is important because we can further see if there is need for the fertilizer or not. The dataset consists of 2200 instances whereas all the instances are of non-fertile soil.
Dataset 2: Augmented data
The dataset contains augmented instancs of data from different sources and have generated sufficent number of instances for fertile and non-fertile.
Dataset 3: Combined dataset The dataset that is used in our models is combined dataset that consists of Dataset 1 and Dataset 2. and have total of 12550 instances among which 5300 are fertile and 7250 are non-fertile
3.2. Data Constraints
The primary concerns that our project team encountered were related to the quality of the data. An initial analysis of the data revealed that there were missing values in most of the columns for nearly all records, which presented a severe obstacle to data analysis. This made it difficult to perform any exploratory data analyses that would have enabled the team to better understand the data. As a result, we had to undertake data filtration to improve data quality. The data filtration process included removal of extreme skewed values, garbage values, and repeated values. The dataset was then reduced from 79,100 records to 40,000 records, but it still contained numerous empty and skewed values within a normal range, resulting in collection bias that skewed the data trends. Additionally, only 900 records with valid diagnoses in the diagnosis column were available for the supervised learning algorithm to train on, making it difficult to experiment with deep neural networks. However, despite these limitations, we were able to develop an effective solution that accurately predicts mental health diagnoses based on the data available.
3.3. Data Cleaning
Data preprocessing is a critical step in analyzing and deriving insights from datasets, ensuring data quality, and enabling an accurate analysis. In the context of mental health research, preprocessing plays a pivotal role 20 in preparing the dataset for further analysis. The dataset used in this study was obtained from Fountain House, an organization in Pakistan specializing in mental health support and treatment. The mental health dataset encompassed a wide range of features, including diagnoses, vital signs, treatment details, and demographic information. To ensure the dataset’s quality and relevance to the research objectives, several preprocessing steps were performed. These steps aimed to cleanse the data, handle missing values, transform features, and filter out irrelevant or inconsistent data points.
3.4. Dropping Irrelevant Features
Certain features in the dataset were considered irrelevant due to factors such as insufficient information, redundancy, or lack of relevance to the research objectives. These columns, including SlipID, Firsttreatmentplace, Firsttreatmentbywhome, and others, were dropped from the dataset. By removing these columns, the dataset was streamlined and unnecessary information was eliminated, ensuring a more focused analysis.
3.5. String Embeddings
Next we processed textual data and aimed to convert the information in various columns, such as Symptoms, Causes, Present Illness, and Illness History, into word embeddings for diagnosing a patient. However, the original data was recorded in Roman Urdu with numerous spelling mistakes and a mixture of Roman Urdu and English, making it extremely difficult to extrapolate useful inference and insights from them. To resolve this, we utilized the Google Translate API which not only translated the text but also corrected the spelling mistakes. As a result, all 31 string columns were successfully converted into English sentences and the corresponding embeddings were calculated and stored in separate files. By performing these data cleaning steps, the dataset was transformed into a more manageable and reliable form, which could be used for further analysis and modeling. Each record now contained 31 clean string columns which were then passed to the SBERT language model to generate meaningful string embeddings. Once the embeddings were created, they were merged with the numerical features in the patient instance. The number of features in each patient record now sum out to be 11,974. A preliminary investigation was conducted to assess the significance of string columns in the dataset comprising 700 records with valid mental health diagnoses. Principal Component Analysis (PCA) was employed to determine the relevance of string columns, which contained patients’ responses to various questions. The findings from the PCA test indicated that the string columns made minimal contributions to the final results, as they ranked among the least influential features. Consequently, based on these results, the decision was made to entirely exclude the string columns and proceed exclusively with the columns containing numerical data.
4. Data Preprocessing
4.1. Feature Transformation, Extraction and Handling Missing Values
Several feature transformation and extraction techniques were applied to enhance the dataset’s usefulness for analysis. For example, the height feature was transformed from feet to centimeters to ensure consistency across the dataset. The Informant column, indicating the relationship of the individual providing symptoms, was transformed from a string to an integer by extracting relevant words indicating the relationship. Similarly, the Episode feature, representing visits to a therapist, was transformed from a string to an integer by extracting numerical values. UseDuration, and Dose Frequency which represent the duration of substance use whereas Durations and OnsetAge indicates the duration of the illness and at which age it was diagnosed. These features went through the same extraction process where the strings they contained were replaced by numerical values and ranges. To handle missing values, appropriate strategies were implemented. In some cases, missing values were filled with zeros, while in other cases, specific values such as -1 were assigned to indicate missing or unavailable data. For some specific columns, -1 represented a value that indicates a process was outgoing indefinitely. By addressing missing values, the dataset’s completeness and integrity were maintained.
4.2. Super Classification
Following the preprocessing steps, a super classification task was performed to categorize the dataset into broader diagnostic classes contained in the Diagnostic and Statistical Manual of Mental Disorders, Fourth Edition (DSM-4). The original dataset consisted of 61 unique diagnostic labels, which were further consolidated into four main classes as given in
Table 1. This classification aimed to simplify the analysis by grouping similar diagnoses together and reducing the complexity of the dataset.
4.3. Filtration
After the preprocessing and filtration steps, the dataset was refined to include 40,900 records, consisting of both supervised and unsupervised data. Among these records, 900 were labeled and suitable for supervised training, while the remaining 40,000 records were unlabeled and intended for unsupervised training. The initial filtration process involved filtering the dataset based on specific ranges or criteria relevant to the research objectives. The OnsetAge feature was filtered to include records within the range of 0 to 100 years, 22 ensuring that the dataset focused on individuals within a reasonable age range and excluded any outliers or inconsistent data points. Additionally, several other vital sign features underwent post-processing filtration to further refine the dataset. The LowerBP feature was filtered to only include records within the range of 50 to 130, ensuring that blood pressure values fell within a clinically relevant range. The Respiratory Rate feature was filtered to include values between 0 and 986 breaths per minute, eliminating any outliers or anomalous readings. Weight measurements were filtered to include values ranging from 1 to 192 kilograms, providing a realistic range for individuals’ weights. Temperature values were filtered to fall within the range of 90 to 110 degrees Fahrenheit, allowing for a sensible range of body temperatures. Finally, the Height feature was filtered to include measurements between 43 and 250 centimeters, excluding any extreme or inconsistent height values. By applying these range-based filters, the dataset was refined to include data points that fell within plausible and relevant ranges for each respective feature. This filtration process ensured that the dataset used for both supervised and unsupervised training was cleansed and tailored to the specific requirements of the research objectives. Overall, the refined dataset consisted of 40,900 records, with 900 records suitable for supervised training and the remaining 40,000 records intended for unsupervised training.
5. Data Visualization
5.1. Data Distribution
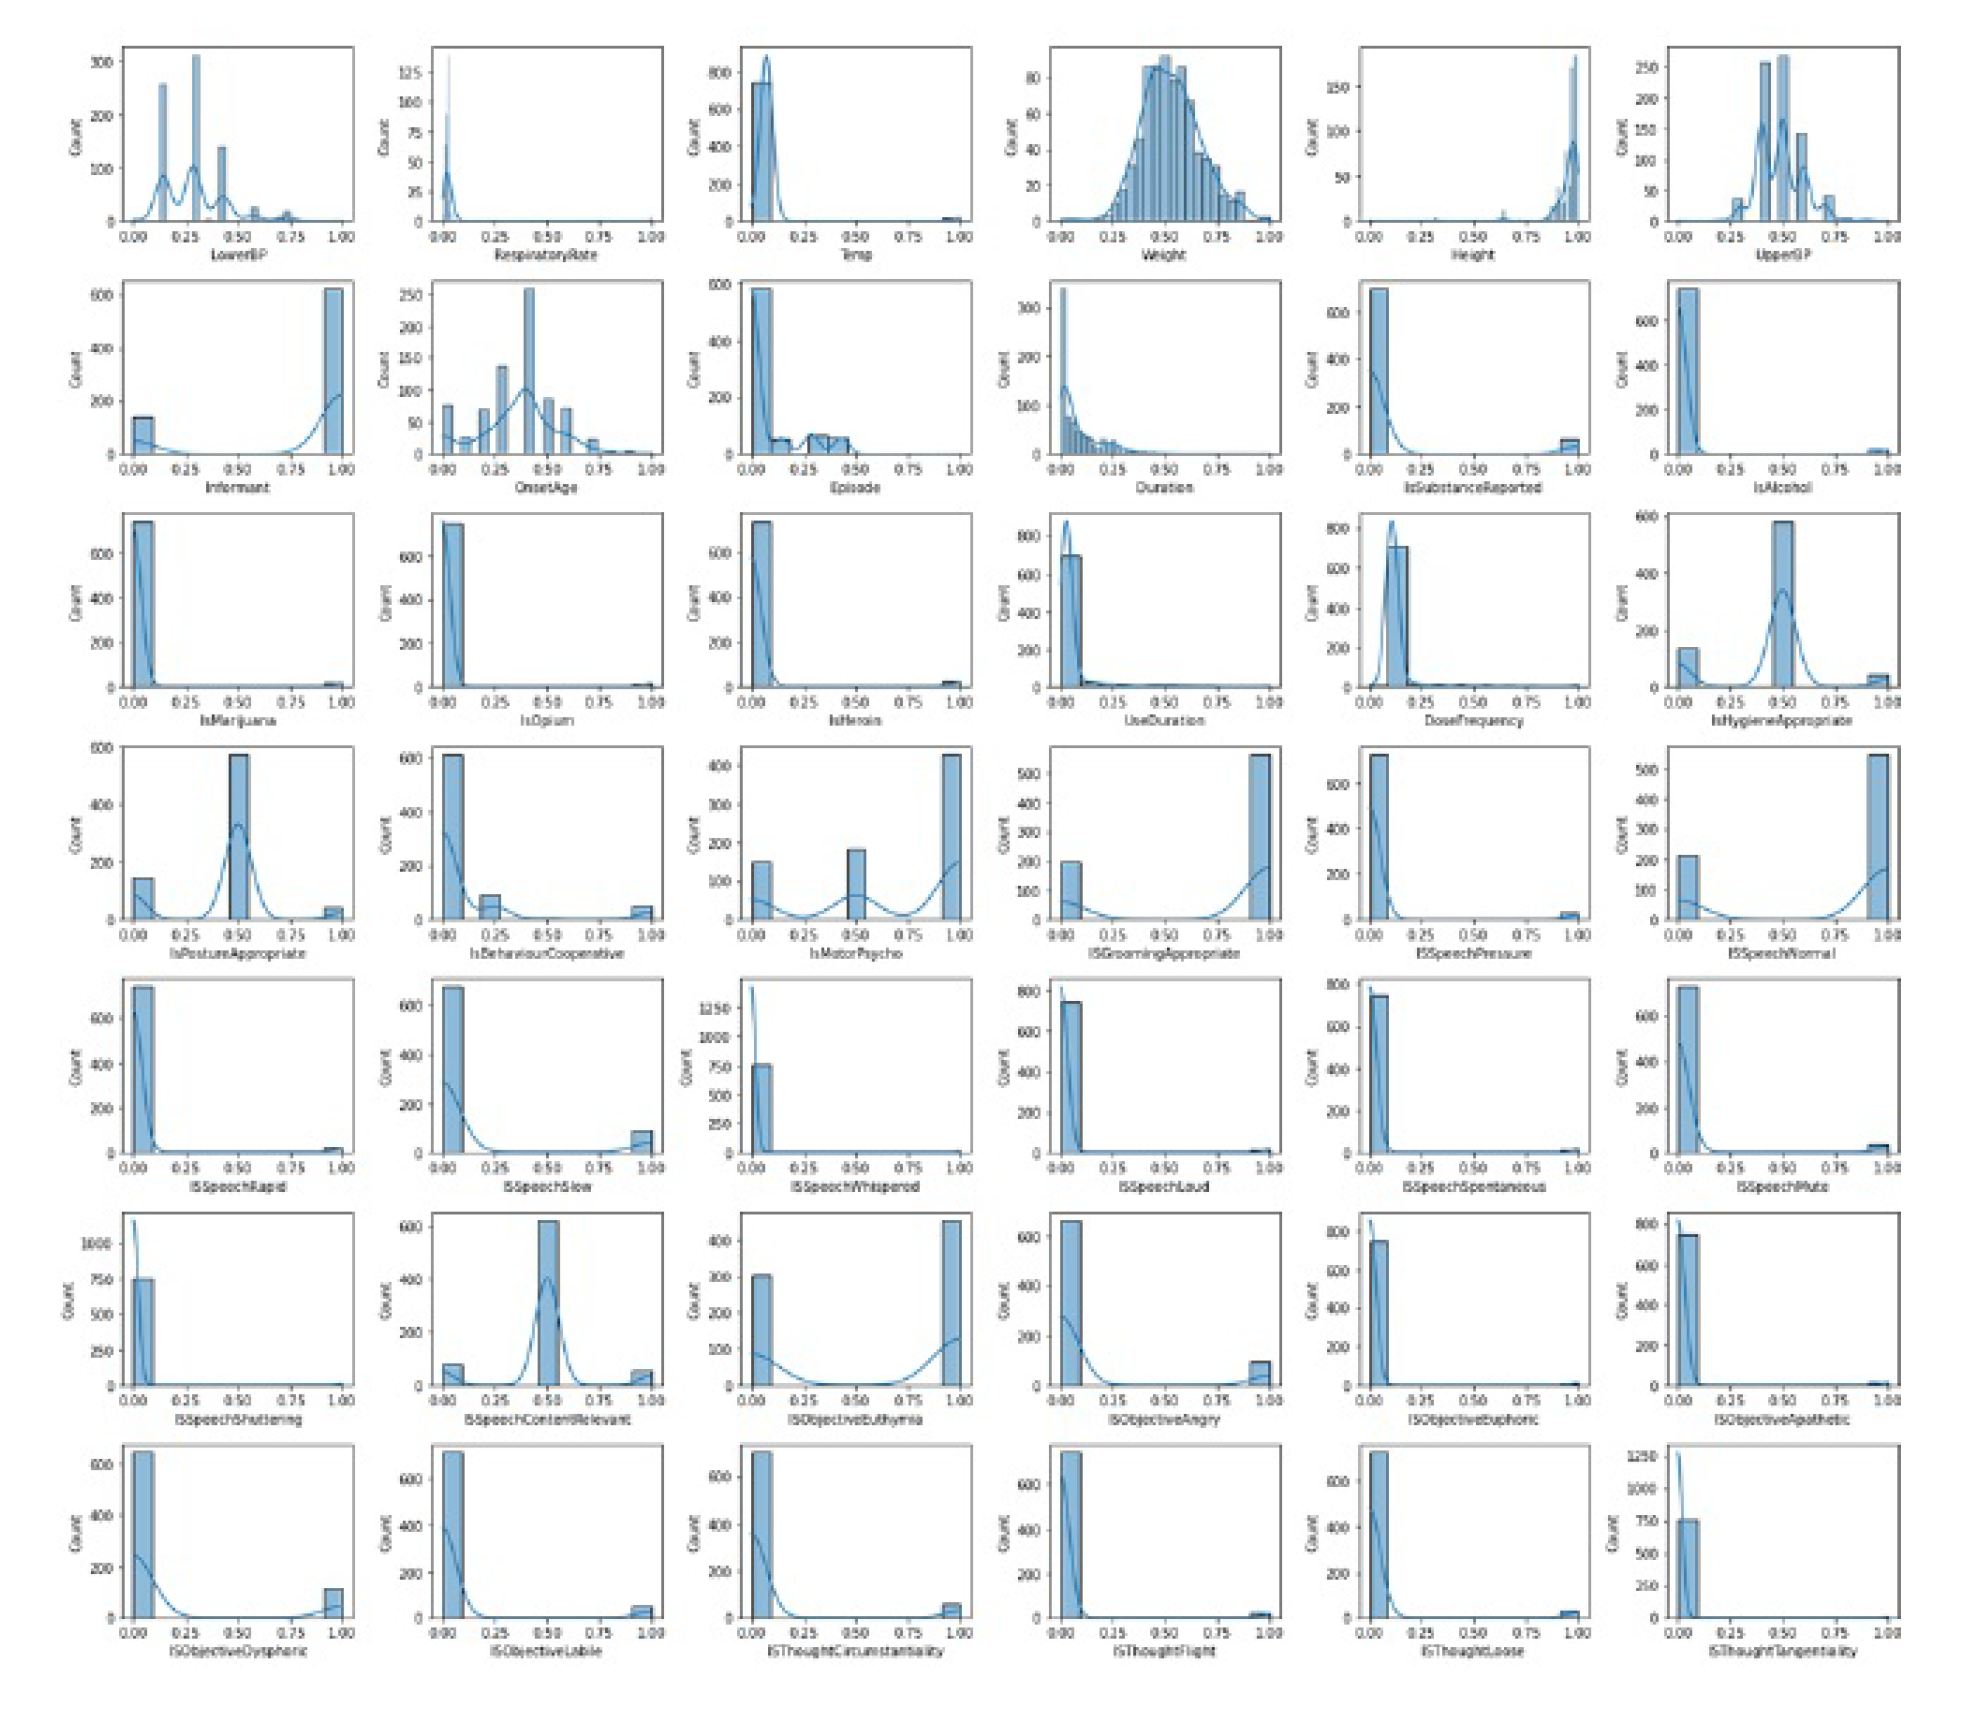
When visualizing the distribution of a dataset through histograms, we can gain insights into the underlying patterns and characteristics of the data. The distribution of weight in the dataset is expected to follow a normal distribution. A normal distribution, also known as a Gaussian distribution or bell curve, is characterized by its symmetric shape, with the majority of data points concentrated around the mean. When plotting a histogram of weight, we would observe a bell-shaped curve, where the peak of the curve represents the most common weight values, and the curve tapers off towards the extremes. This distribution suggests that the dataset contains a diverse range of weights, with the most common weights centered around the mean value. The distribution of the rest of the feature is described as either positively or negatively skewed. Skewness refers to the asymmetry in the distribution of data points. A positively skewed distribution, also known as a right-skewed distribution, is characterized by a long tail on the right side of the histogram, indicating a concentration of lower values and a few extreme high values. On the other hand, a negatively skewed distribution, also known as a left-skewed distribution, exhibits a long tail on the left side of the histogram, indicating a concentration of higher values and a few extreme low values. The distribution of the features are shown below in the
Figure 1.
5.2. Normalization
After visualizing the distribution of the dataset, we performed a data normalization technique known as Min-Max normalization. This process rescales the values of each feature so that they fall within the range of 0 to 1. By applying Min-Max normalization, we ensure that all the feature values are proportionally adjusted to fit within a standardized range. This normalization technique is beneficial for several reasons. Firstly, it can help any intelligent model to train faster and converge more quickly during the training process. This is because the normalization reduces the scale differences between features, preventing one feature from dominating the learning process due to its larger magnitude. It allows the model to effectively learn from all the features and make meaningful comparisons. Secondly, normalizing the data to a common range can improve the training and validation accuracy of a model. When the features have different scales, certain features with larger values may contribute more to the overall prediction, potentially overshadowing the significance of other features. Normalization mitigates this issue by bringing all features to a similar scale, ensuring that each feature’s contribution to the model’s predictions is balanced. Normalized data is shown in
Figure 2
5.3. t-Distributed Stochastic Neighbor Embedding (t-SNE)
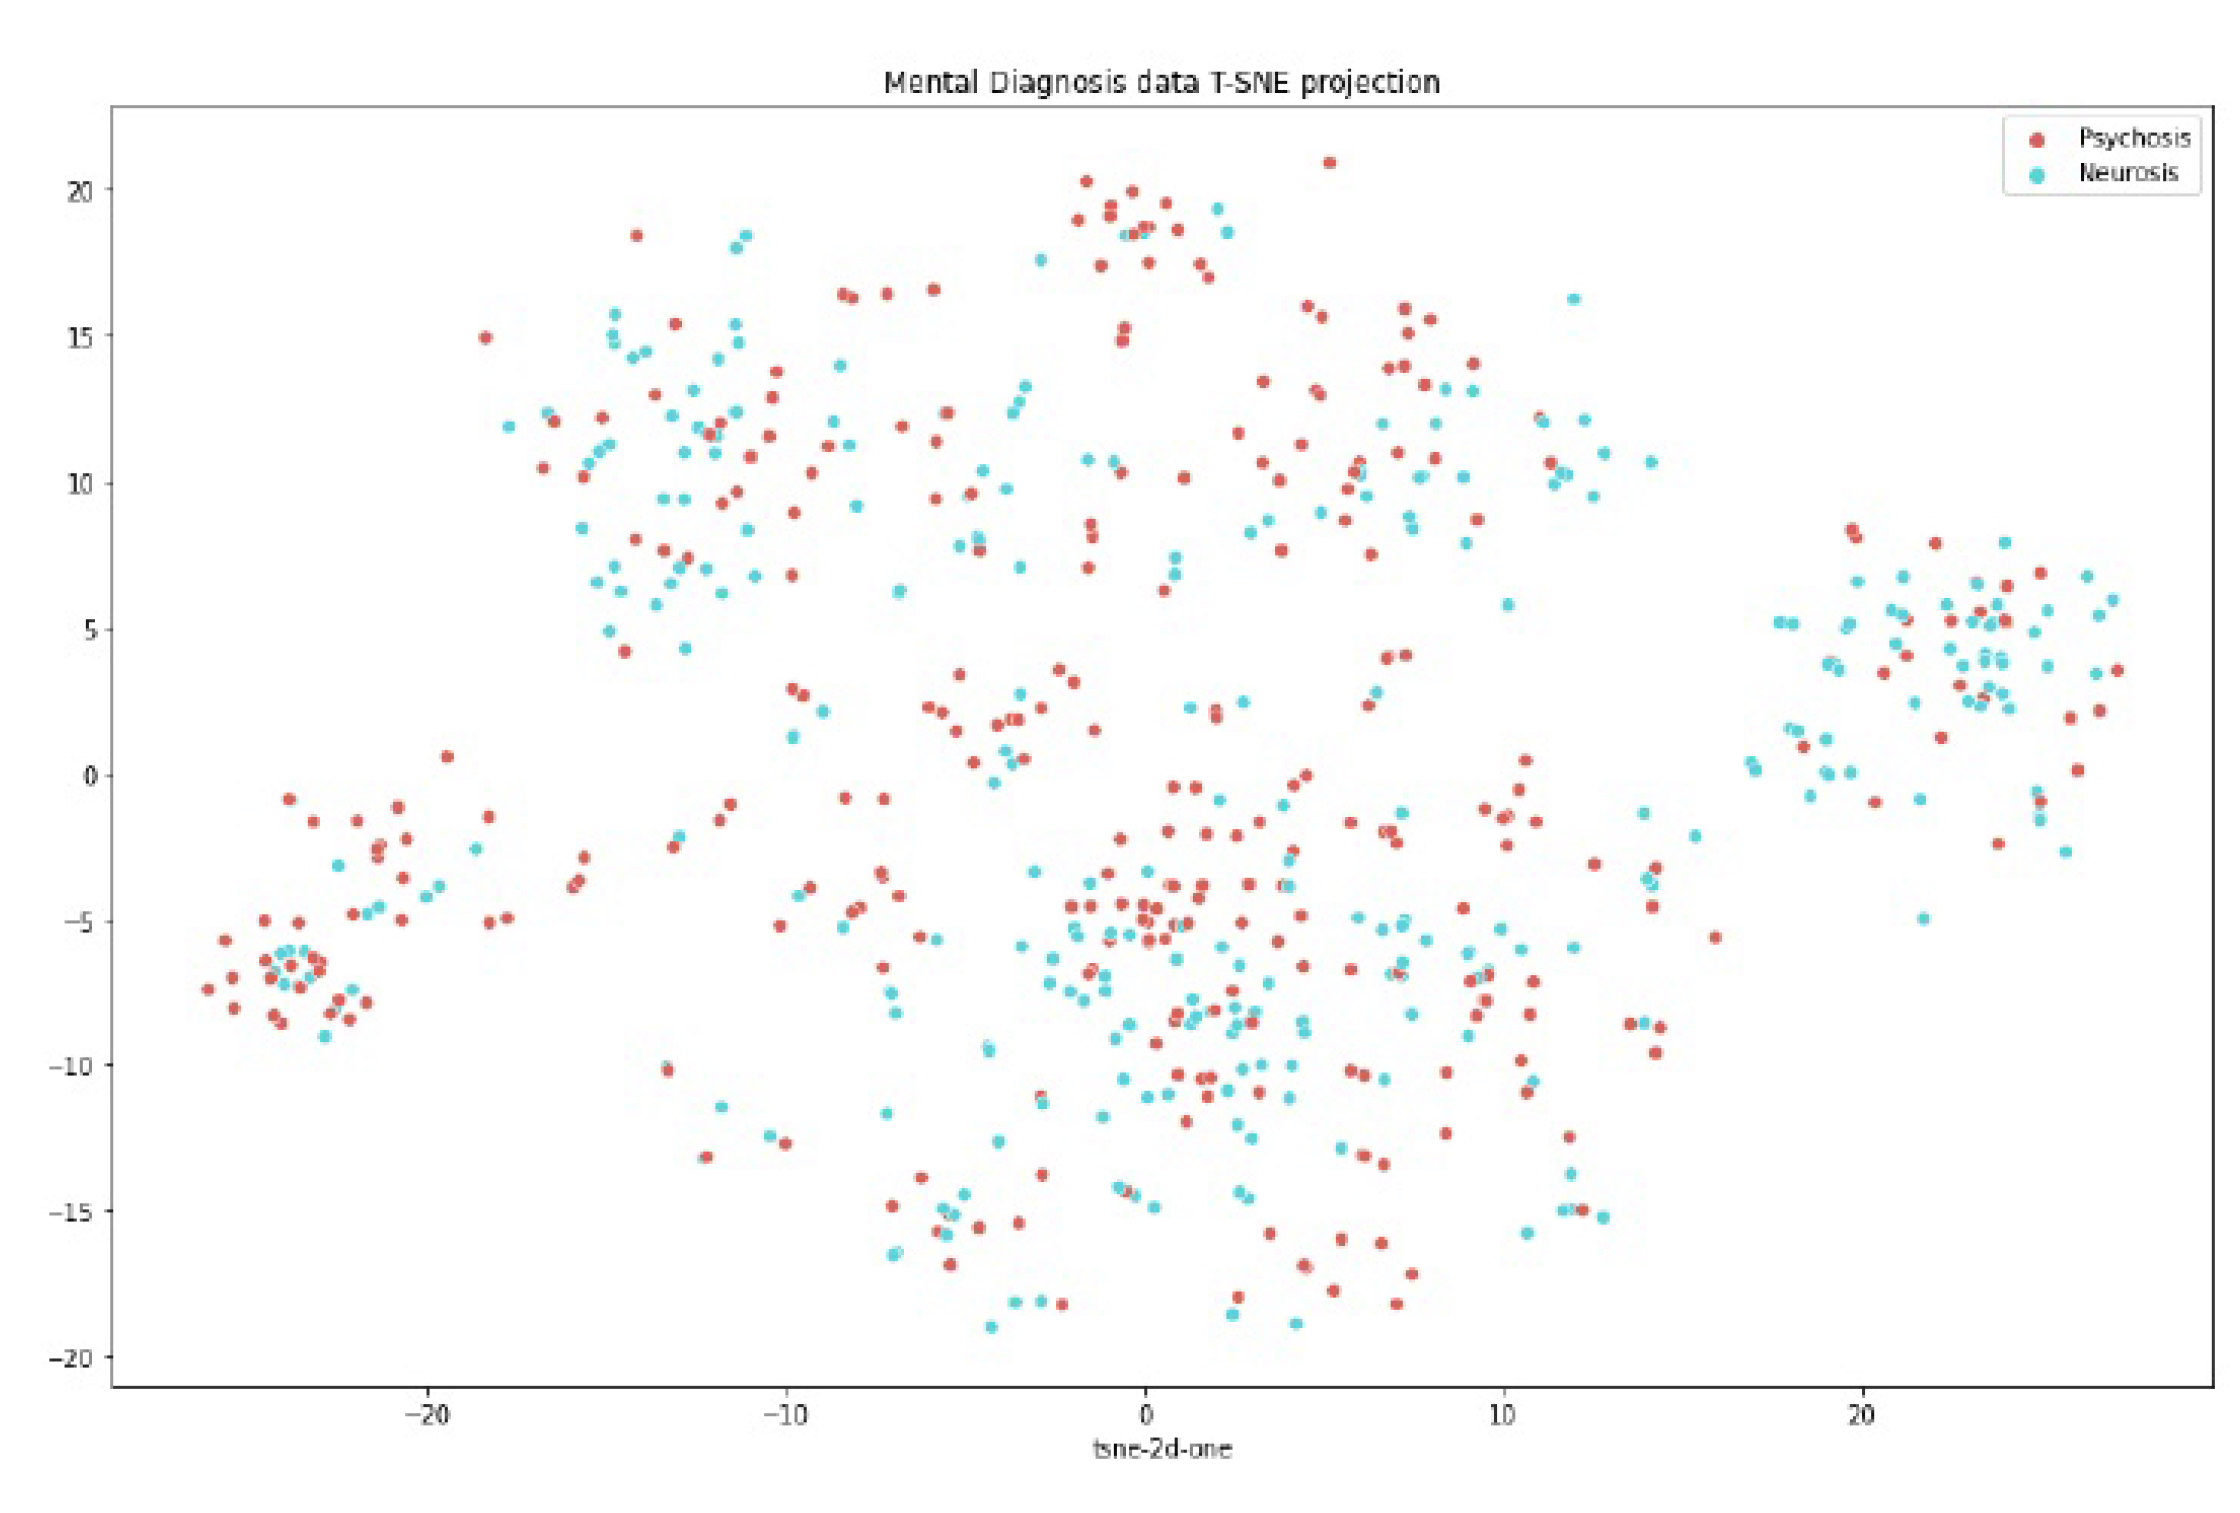
To assess the nature of the dataset and determine if it was linearly separable, we employed t-SNE visualization. By applying t-SNE, we aimed to project the high-dimensional data onto a lower-dimensional space while preserving the pairwise similarities between data points. From the resulting t-SNE visualization, it was observed that the dataset exhibited a lack of clear linear separability. The data points were not distinctly separated into well-defined clusters or regions, suggesting that a linear decision boundary would not effectively separate the data into distinct classes or groups. The t-SNE visualization provided a visual representation of the dataset’s complex relationships and structure. It revealed that the data points were intertwined and overlapping, making it challenging to draw linear boundaries that could distinctly separate different classes or categories. Based on these observations, it can be concluded that the dataset was not linearly separable, meaning that a linear classifier or model may struggle to accurately classify or separate the data points based on their features, this is shown in
Figure 3
5.4. Principal Component Analysis (PCA) and TTest
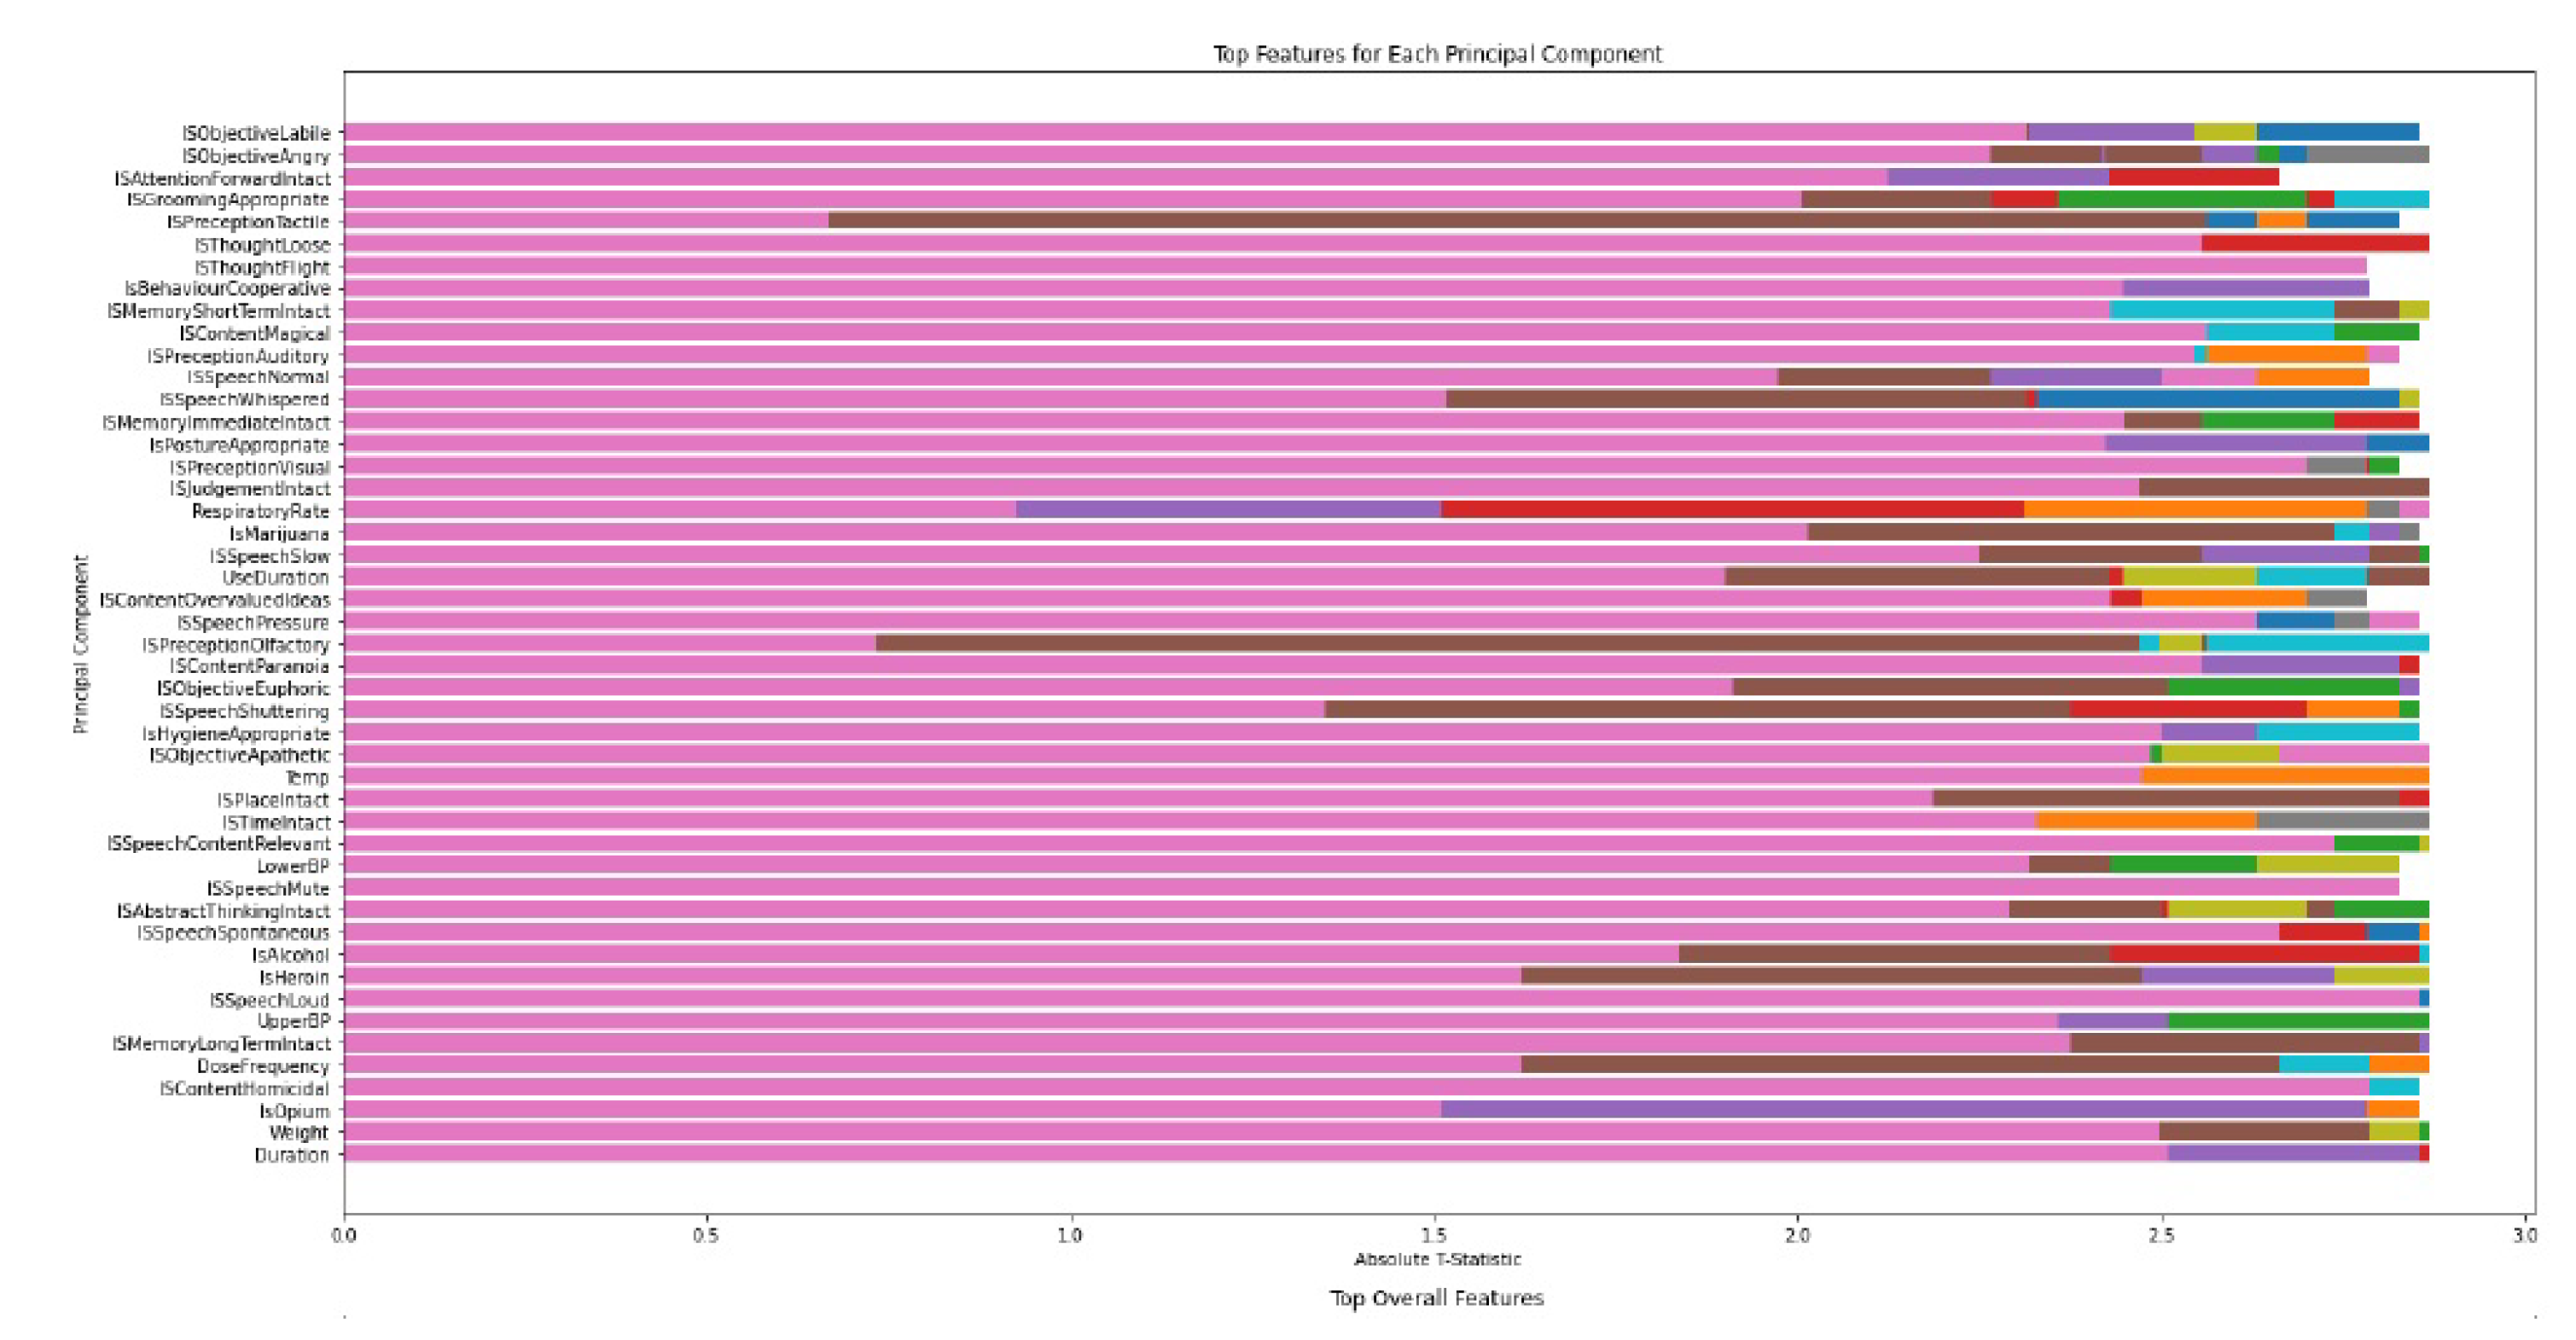
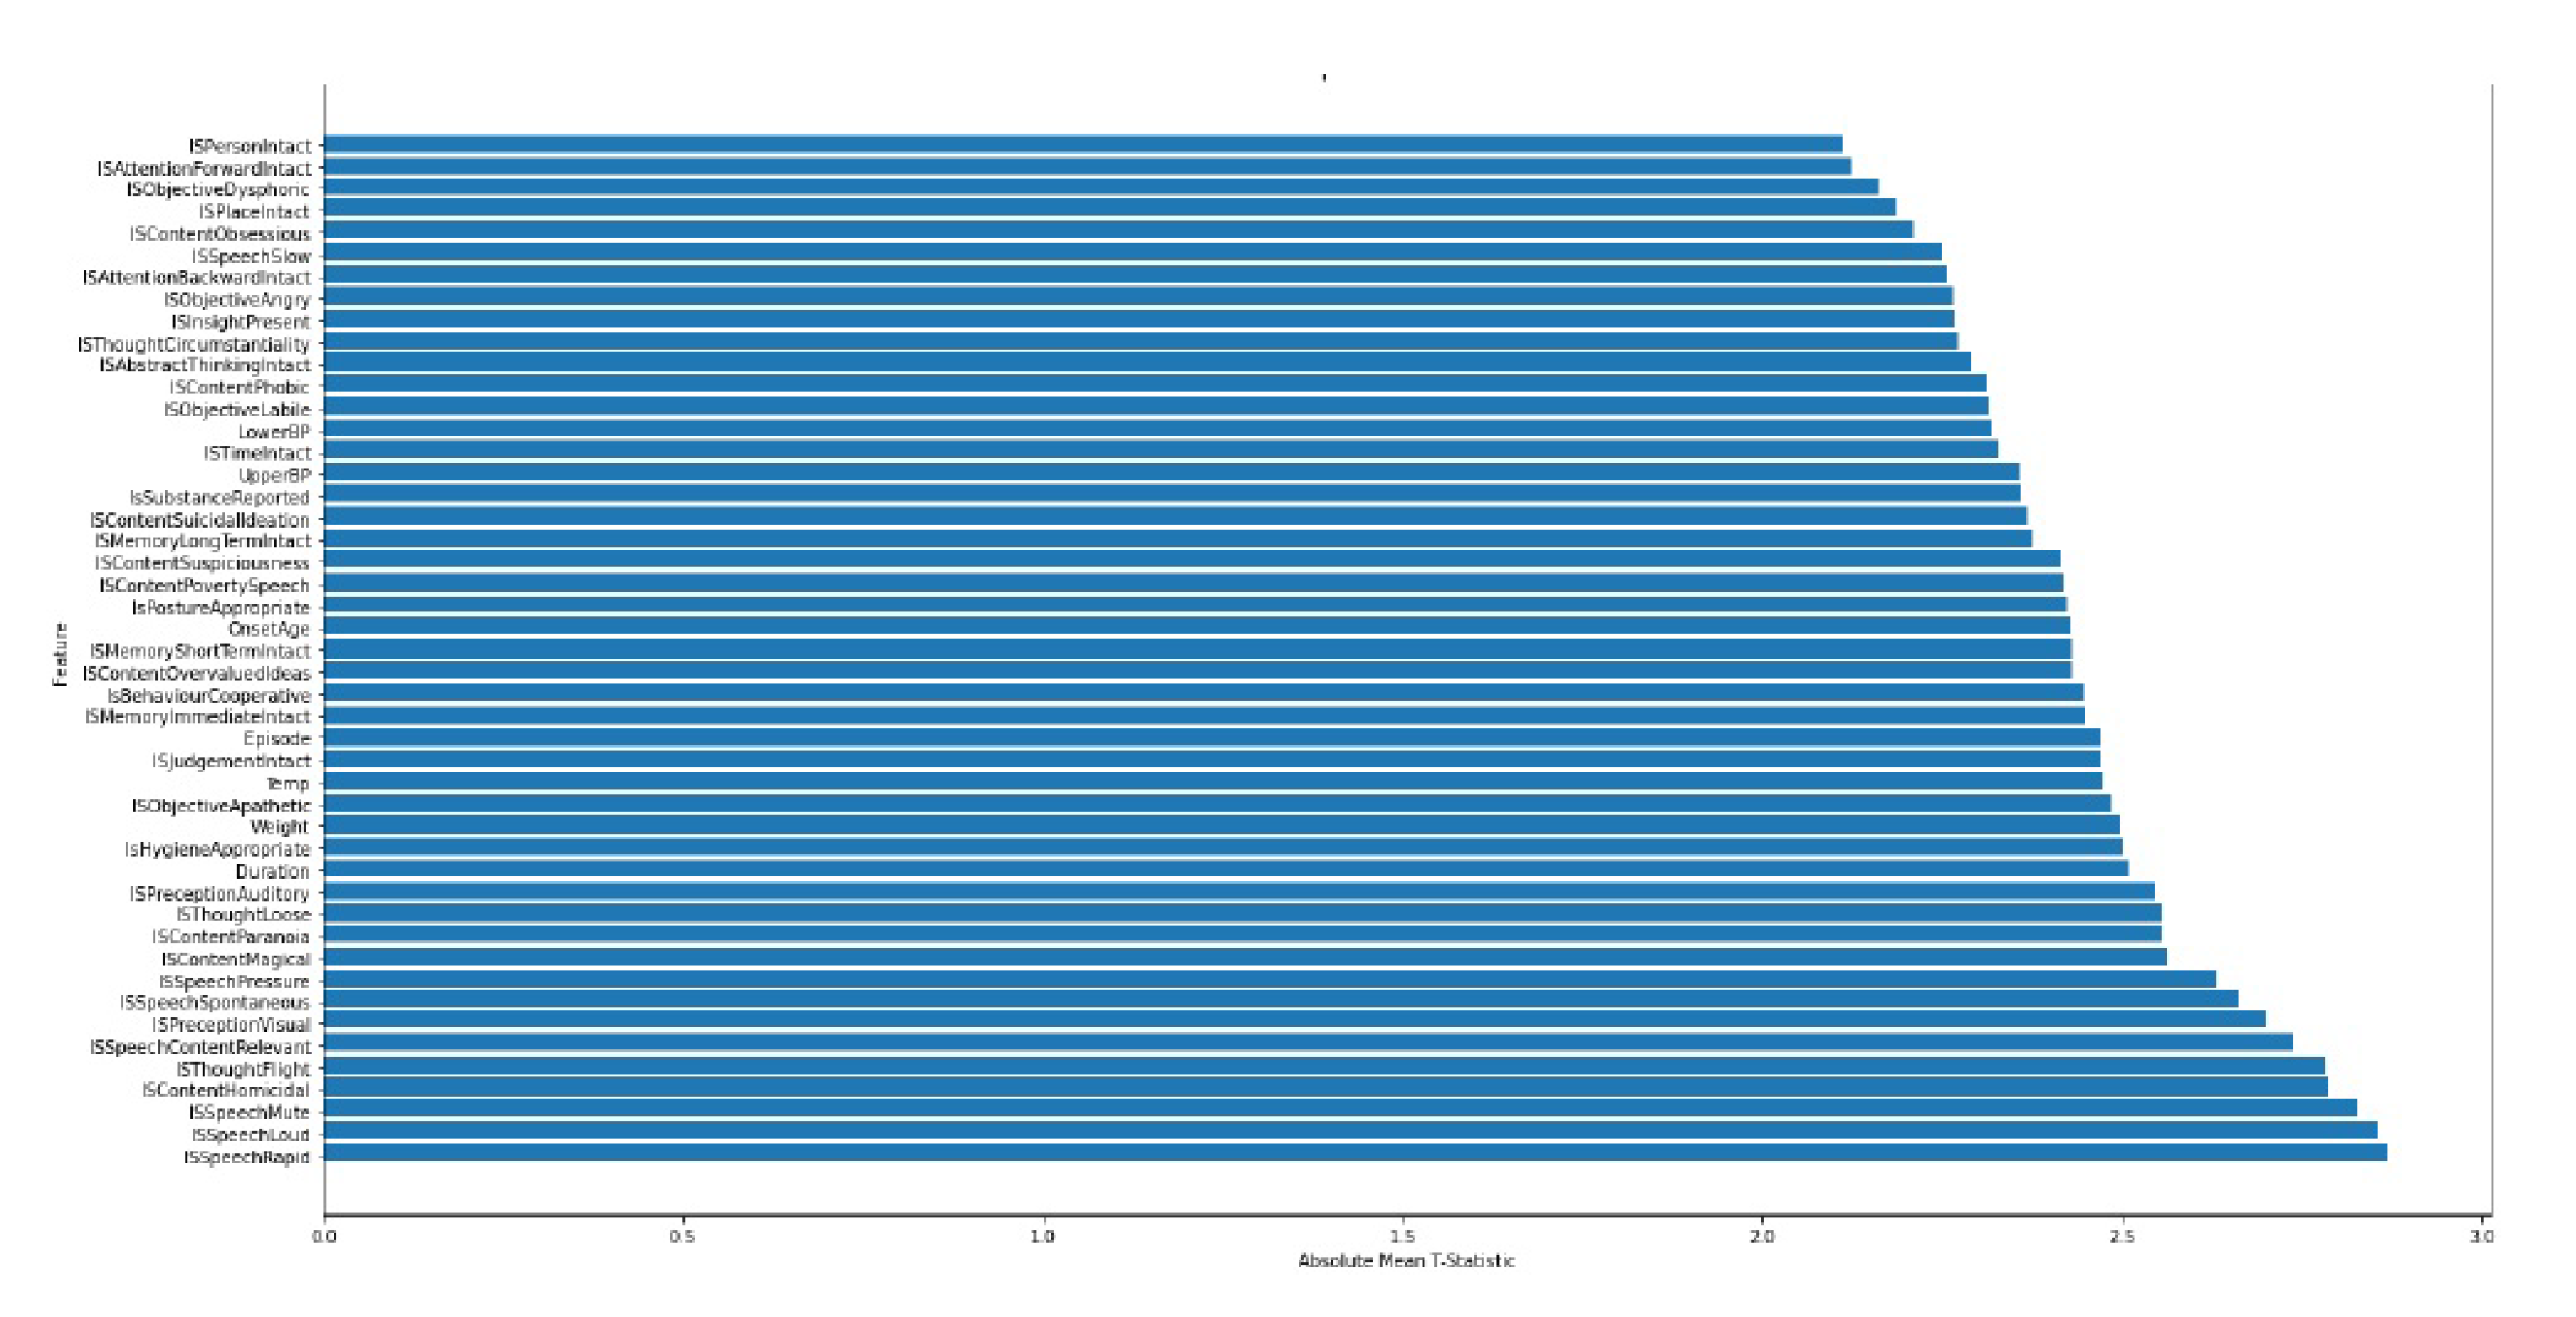
The TTest function which performs t-tests and identifies the most significant features based on the results. Given an original dataset (df) and a dataset transformed using Principal Component Analysis (X_pca), the function calculates t-statistics for each original feature and principal component using ordinary least squares regression. These t-statistics are then stored in a matrix called t_stats. The function proceeds to identify the top features for each principal component by selecting those with the highest absolute t-statistics. These features are stored in a list called most_important_features. Additionally, the function calculates the average absolute t-statistics across all principal components for each original feature, which are stored in an array called abs_mean_t_stats. Finally, the function returns four outputs: top_overall_features (indices of the top features overall), t_stats (t-statistics matrix), abs_mean_t_stats (average absolute t-statistics for each feature), and most_important_features (top features for each principal component). This process enabled us to extract the top 47 columns that have the highest contributing factor to our model.
Figure 4 and
Figure 5 show top features using PCA and TTest respectively. These features are given in the
Figure 4
6. Model Creation
6.1. Unsupervised Learning
One of the objectives of our project was to perform unsupervised learning on the dataset in order to identify any major groupings or clusters within the data. After the data had been cleaned and preprocessed, we utilized Principal Component Analysis (PCA) to determine the intrinsic dimension of the dataset. The Intrinsic dimension in a dataset refers to the minimum number of independent variables or features required to represent the essential structure or information of the dataset accurately. We experimented with varying numbers of clusters and ultimately determined that there were four main clusters present in the data. To arrive at this conclusion, we plotted the variance explained by each additional principal component and identified the "elbow" point where the addition of new components had a diminishing return on the explained variance. The resulting elbow curve indicated that an intrinsic dimension of four was appropriate for our dataset. This analysis enabled us to identify the key characteristics of each cluster and better understand the underlying patterns in the data. By leveraging unsupervised learning techniques such as PCA, we were able to gain new insights into the structure of the dataset that would not have been possible through supervised learning alone as shown in
Figure 6
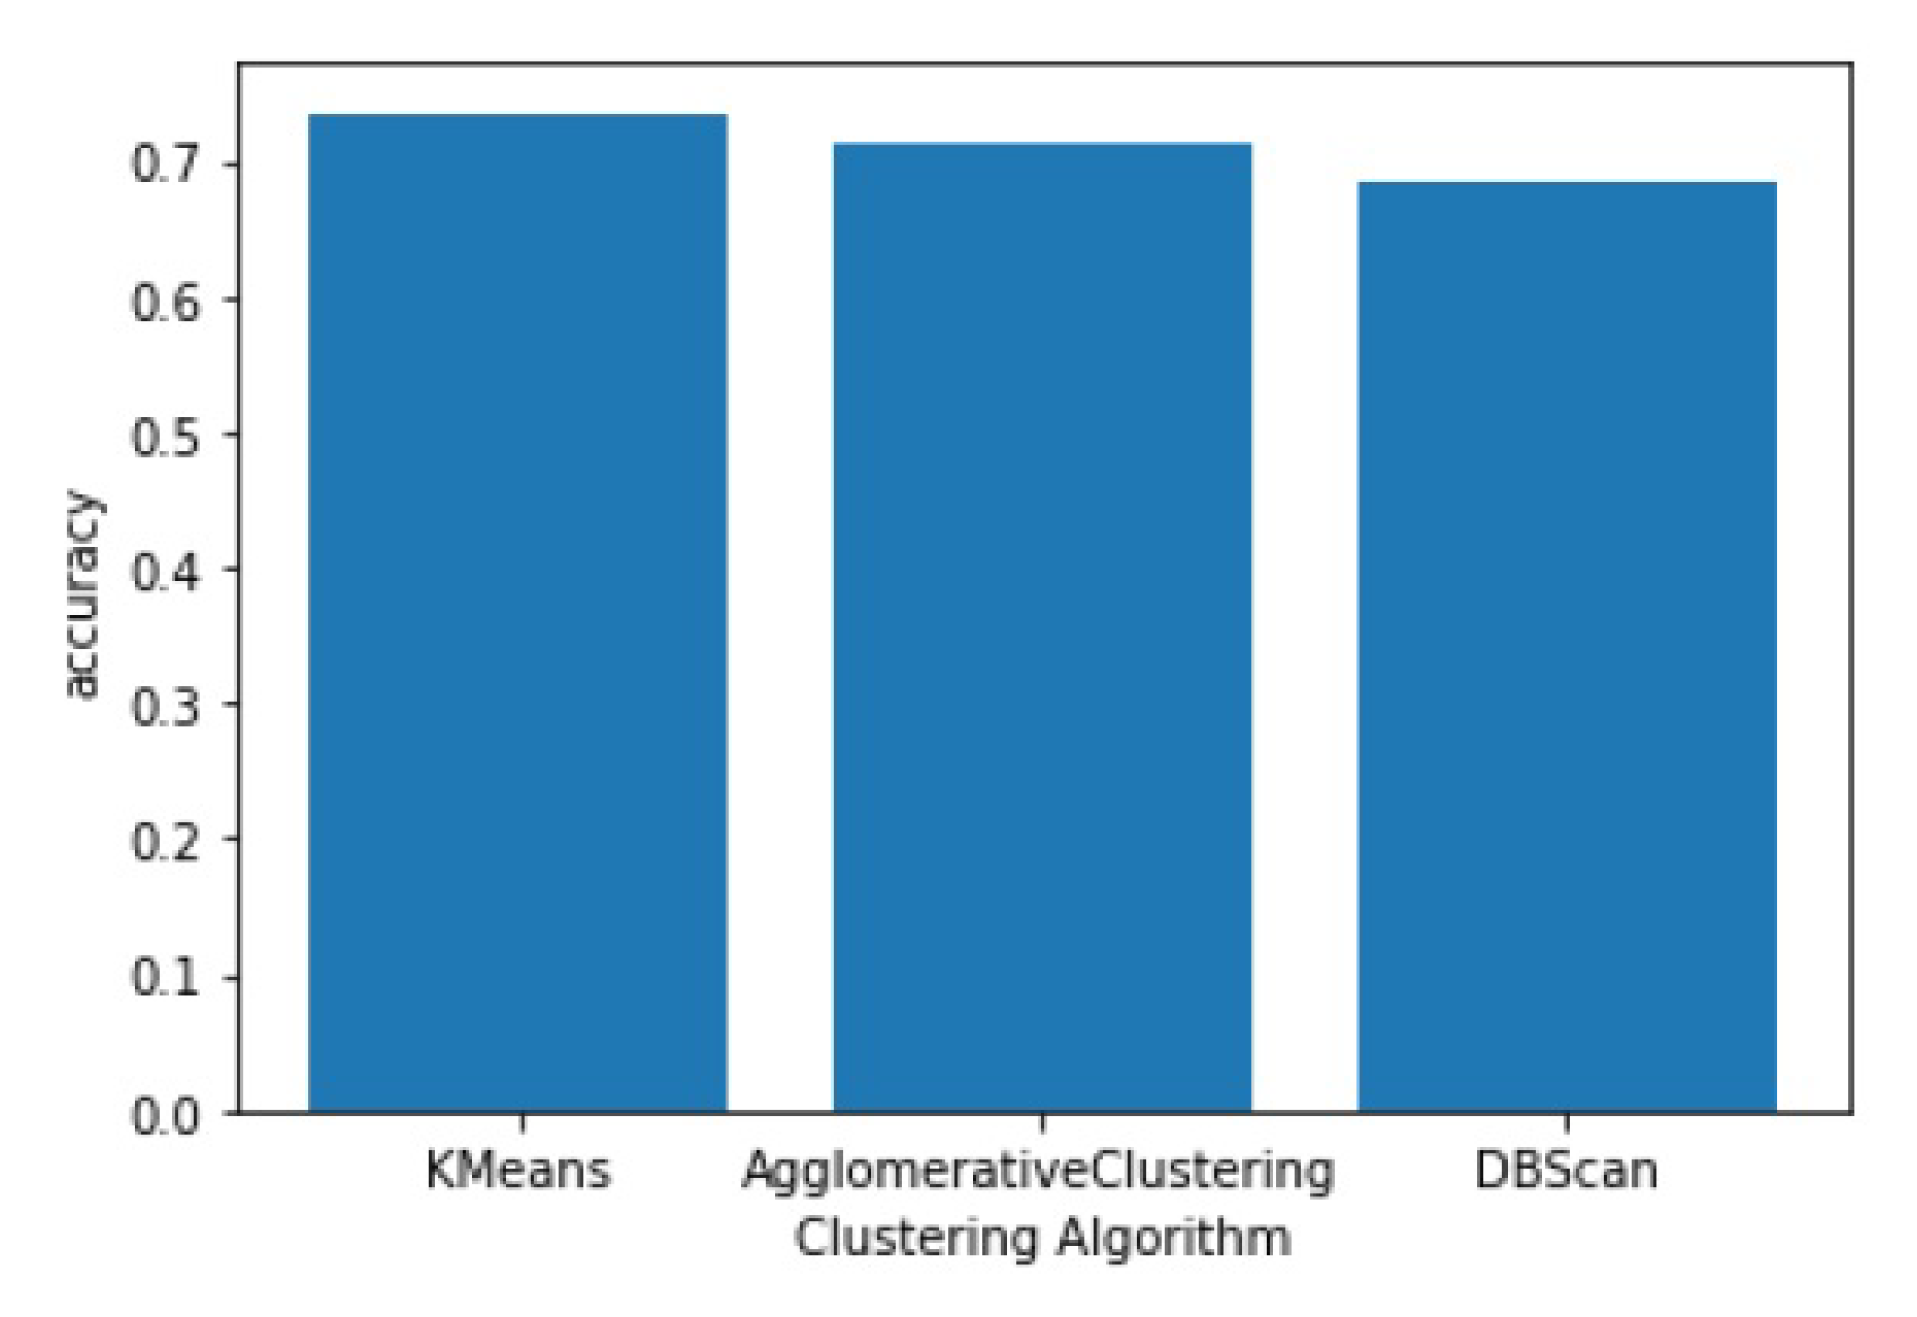
The analysis of the data using Principal Component Analysis (PCA) resulted in the identification of an intrinsic dimension of 4, indicating that there were four primary categories of mental health illnesses in the dataset. These categories were further classified into subcategories for better understanding. To perform clustering on the dataset, three clustering algorithms - DBScan, Agglomerative Clustering, and KMeans Clustering were experimented with. The KMeans Clustering algorithm proved to be the most effective, achieving an accuracy score of 73%. This was accomplished by dividing the dataset into four clusters based on the identified intrinsic dimension. The successful identification of these clusters was a critical step in the accurate prediction of mental health diagnoses using the AI backend as shown in
Figure 7.
6.2. Supervised Learning
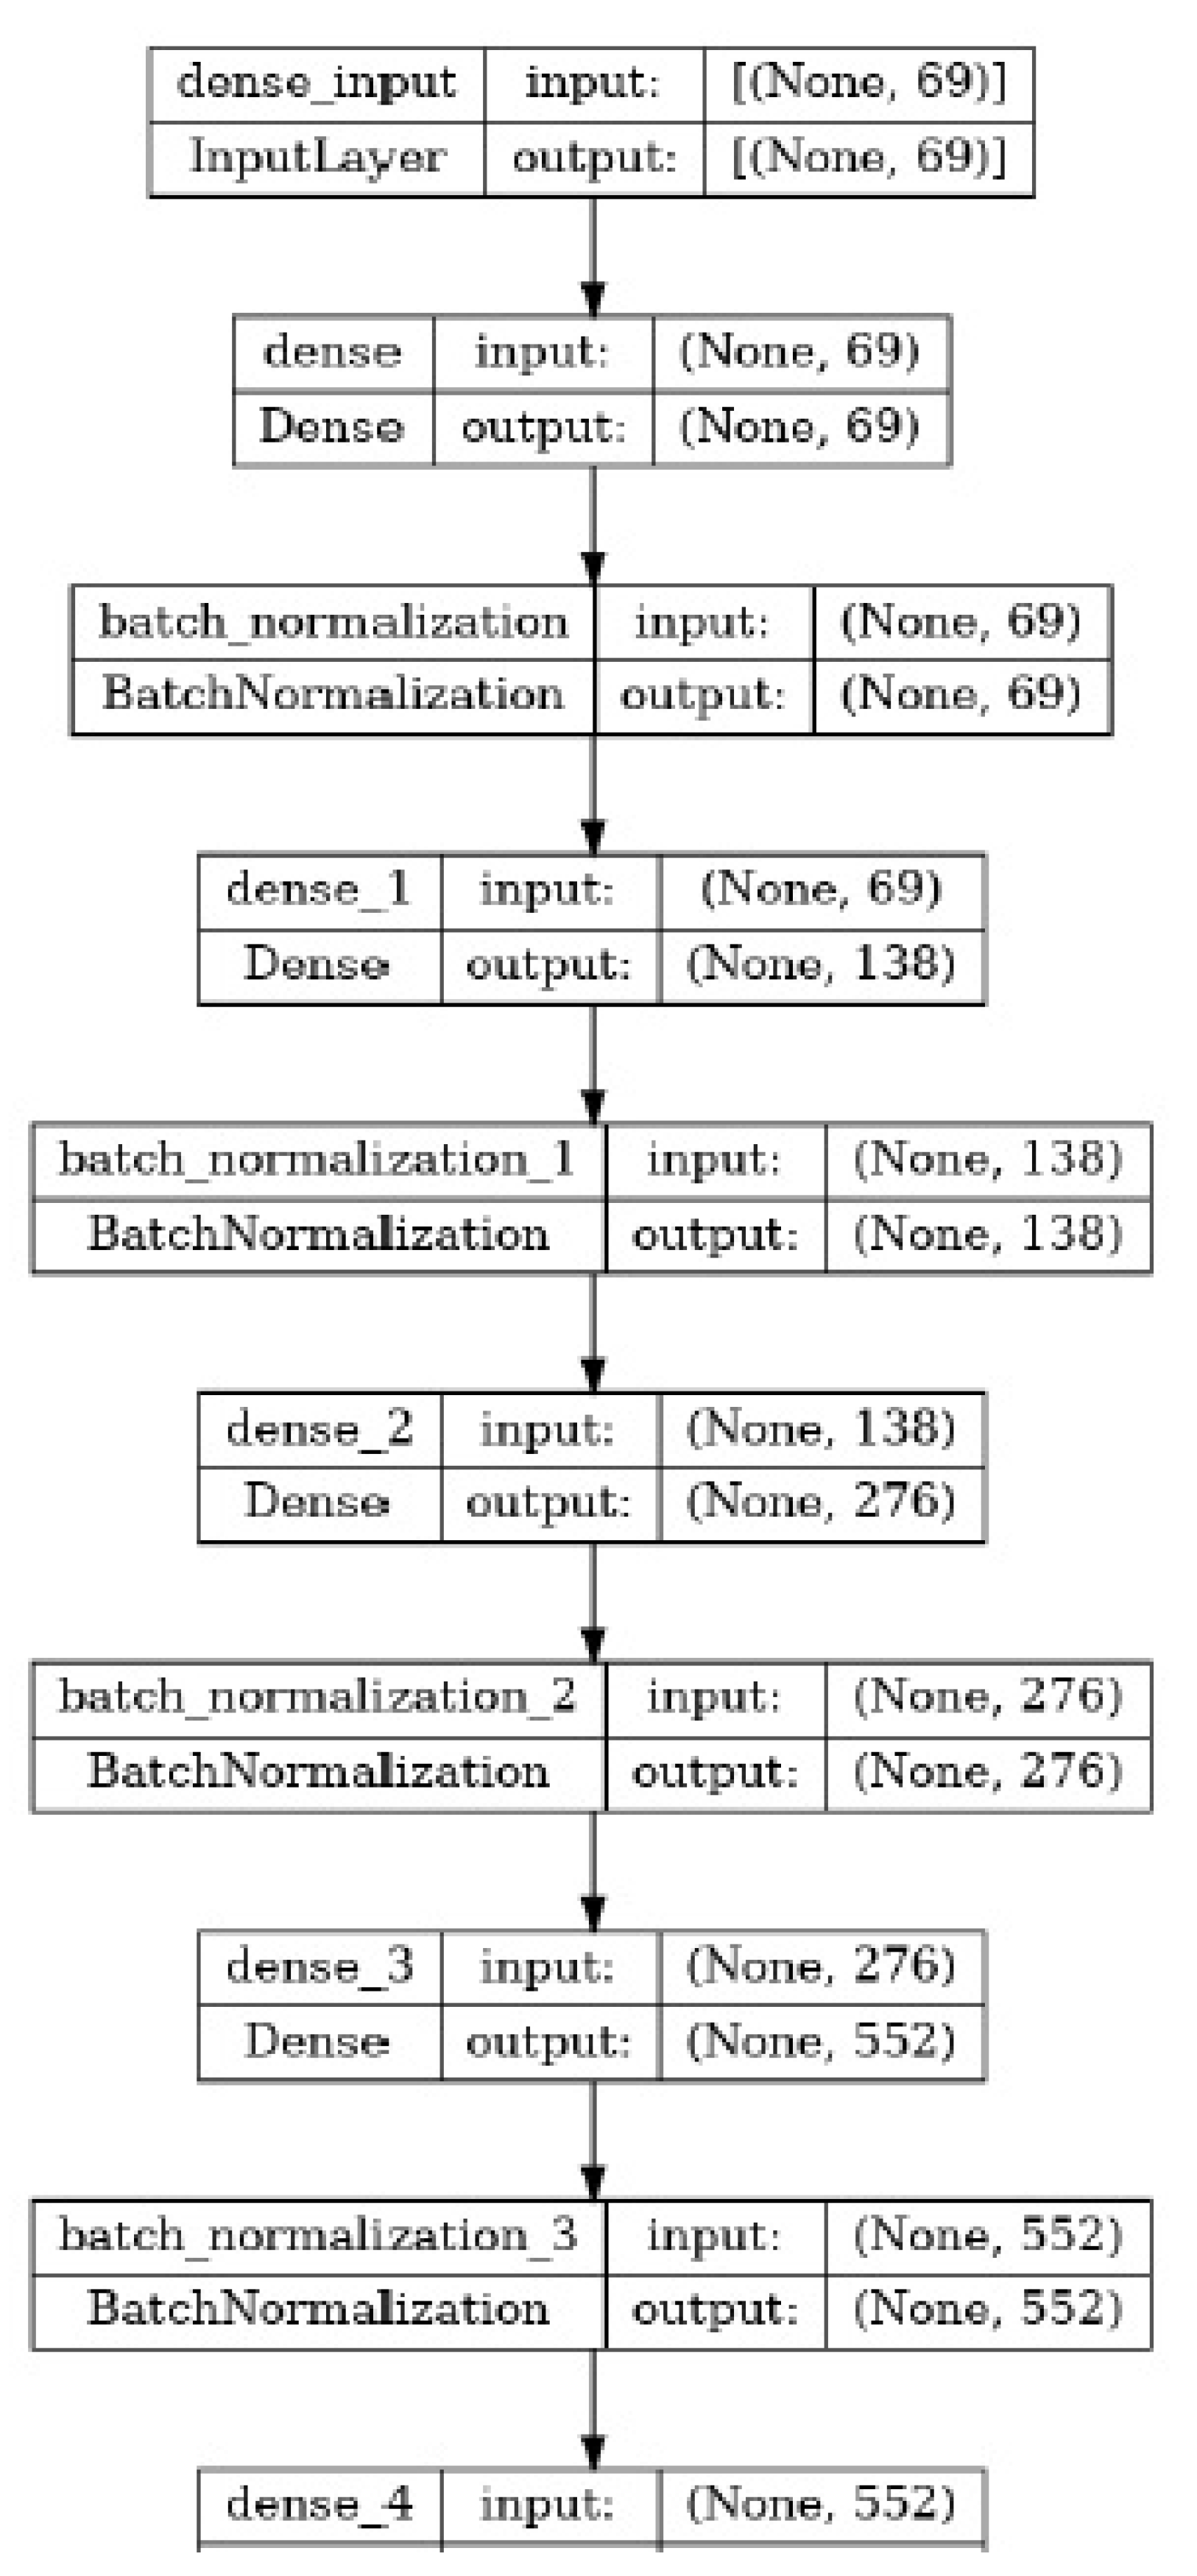
For our non-linear model, we selected three models that have demonstrated strong performance in the medical domain: deep neural networks, Random Forest, and Support Vector Machines (SVM). In this section, we will focus on the deep neural network model. To build our deep neural network model, we experimented with various activation functions and found that a combination of Leaky ReLU and Sigmoid yielded superior results compared to using only Leaky ReLU. This combination allowed the model to capture complex non-linear relationships in the data effectively as shown in the
Figure 8.
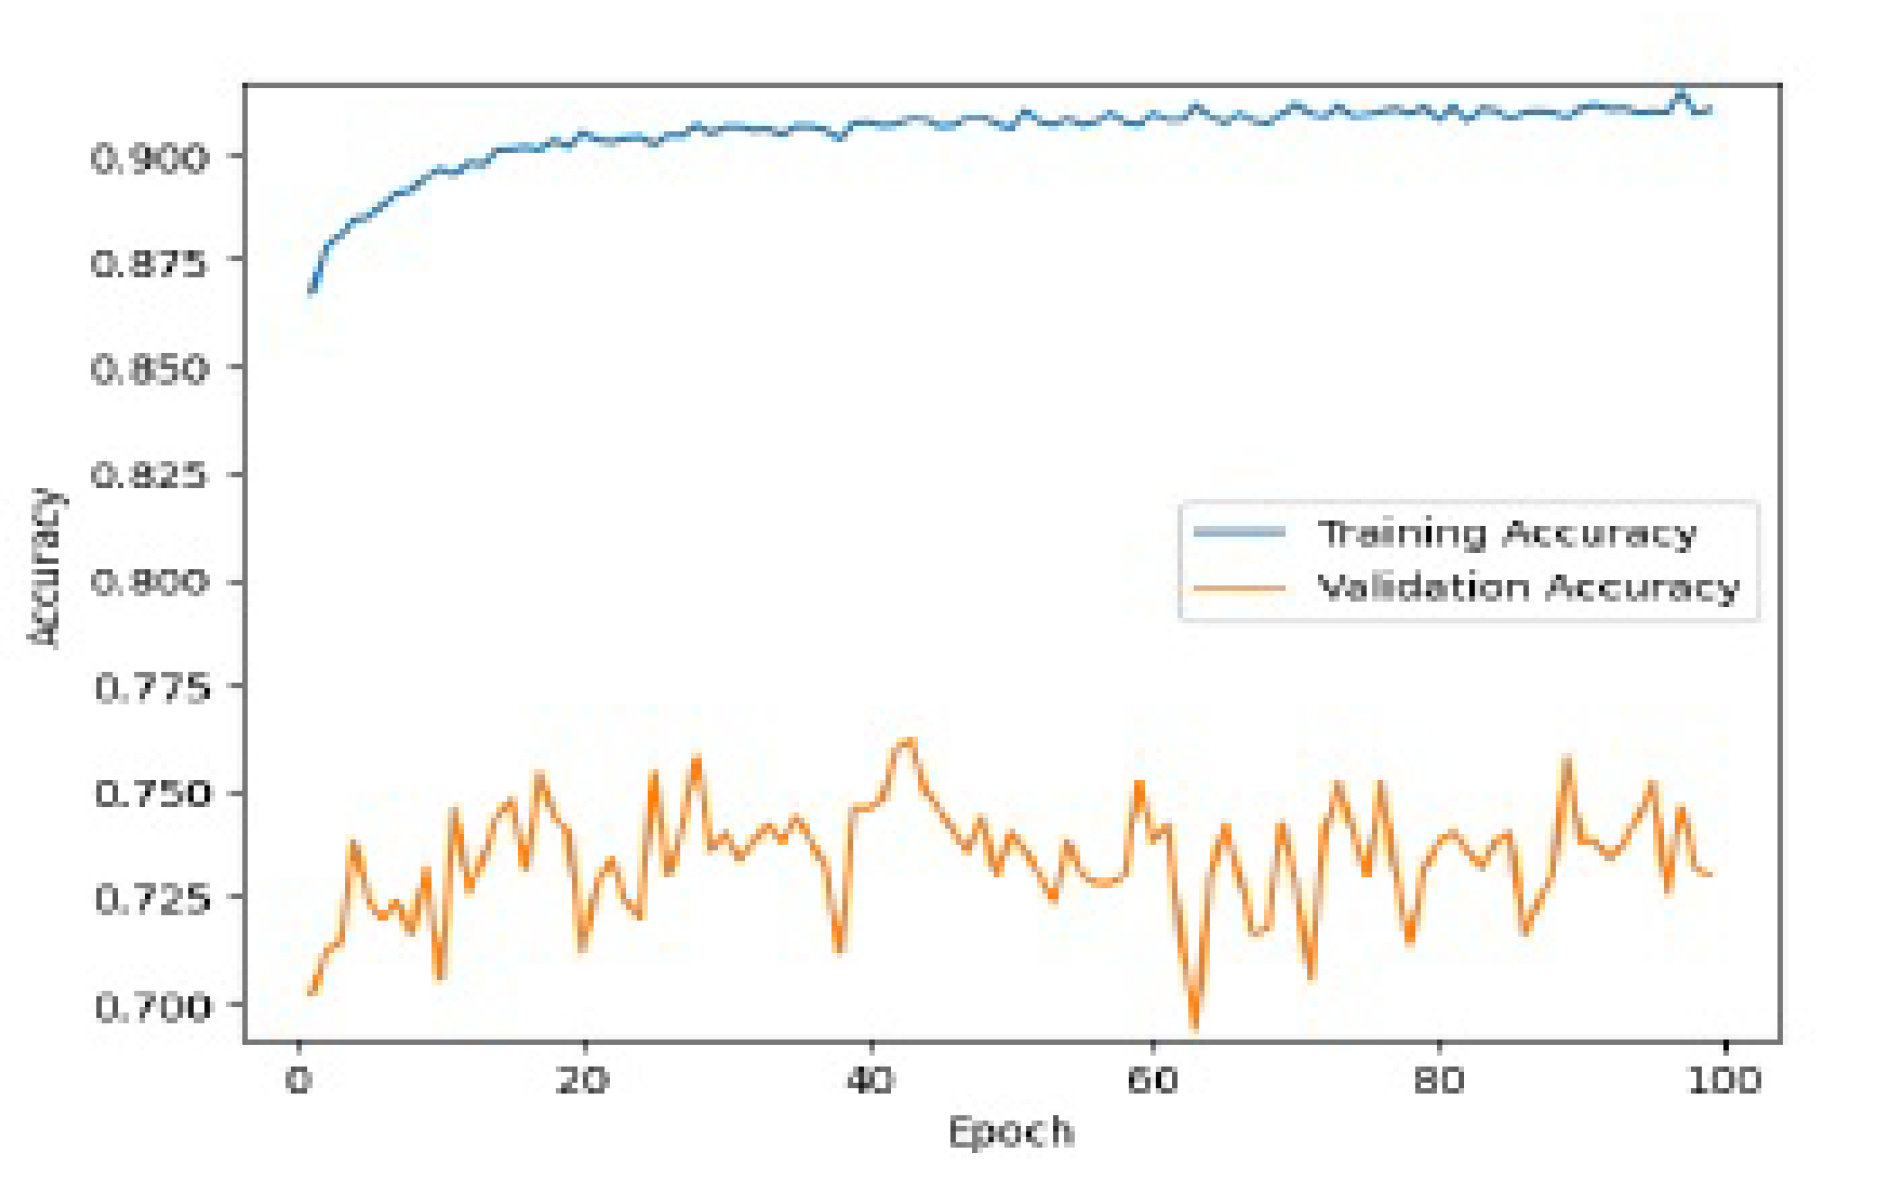
To mitigate overfitting, we employed regularization techniques such as L2 regularization and Batch Normalization. These techniques helped prevent the model from excessively fitting the training data and improved its generalization ability. However, despite implementing these regularization techniques, we observed that our deep neural network model was still prone to overfitting. The model’s performance on the training data was significantly better than on the validation or test data, indicating a lack of generalization. The diagrams below depict the overfitting phenomenon observed in our model:
These diagrams clearly illustrate the widening gap between the training and validation/test performance metrics as the number of training epochs increases. The overfitting phenomenon is evident in the discrepancy between the model’s ability to fit the training data and its performance on unseen data.
To address this overfitting issue, we explored additional techniques such as Early Stopping, Dropout and adjusting the model architecture. Further analysis and experimentation are necessary to refine the deep neural network model and improve its generalization performance.
7. Results
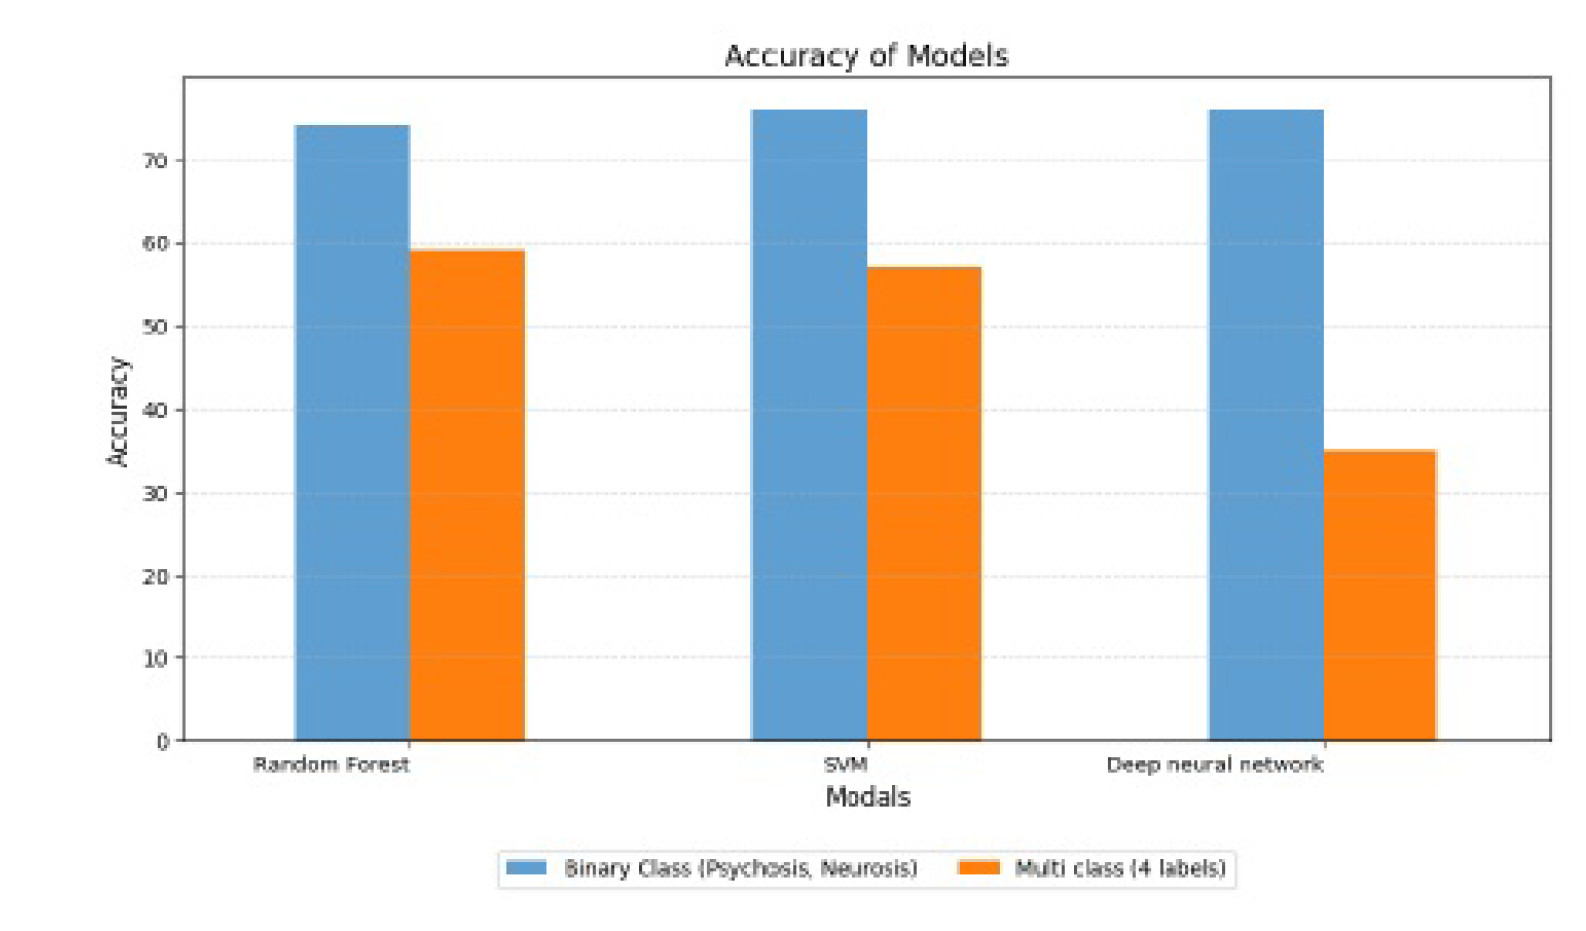
After training the models, we obtained the following accuracy results: 74% for Random Forest, 76% for SVM, and approximately 76% for our deep neural network (prone to overfitting). These accuracy scores represent the models’ performance on the given dataset, indicating the percentage of correctly predicted outcomes. The SVM model achieved the highest accuracy at 76%, followed closely by deep neural networks with an accuracy score of 76%. However, the Random Forest Algorithm exhibited a slightly lower accuracy of around 74%.
7.1. Accuracy Scores
It is important to consider these accuracy scores when assessing the models’ predictive capabilities and selecting the most suitable approach for the specific task at hand.
8. Results and Analysis
This implemented deep learning models in this work are: LSTM, RNN and CNN. And there are four activation functions used on each model to test its output. And the LSTM out performs rest of the models and gave 100% accuracy with all the activation functions. And the second best accuracy is of CNN with 98.8%. Whereas the epochs are 10, batch size is 32 for all the models and activation functions. And mostly the dropout is 0% in all models with all activation functions tested. Accuracy plots are shown in the
Figure 10
8.1. Performance Results for Binary Class Classification
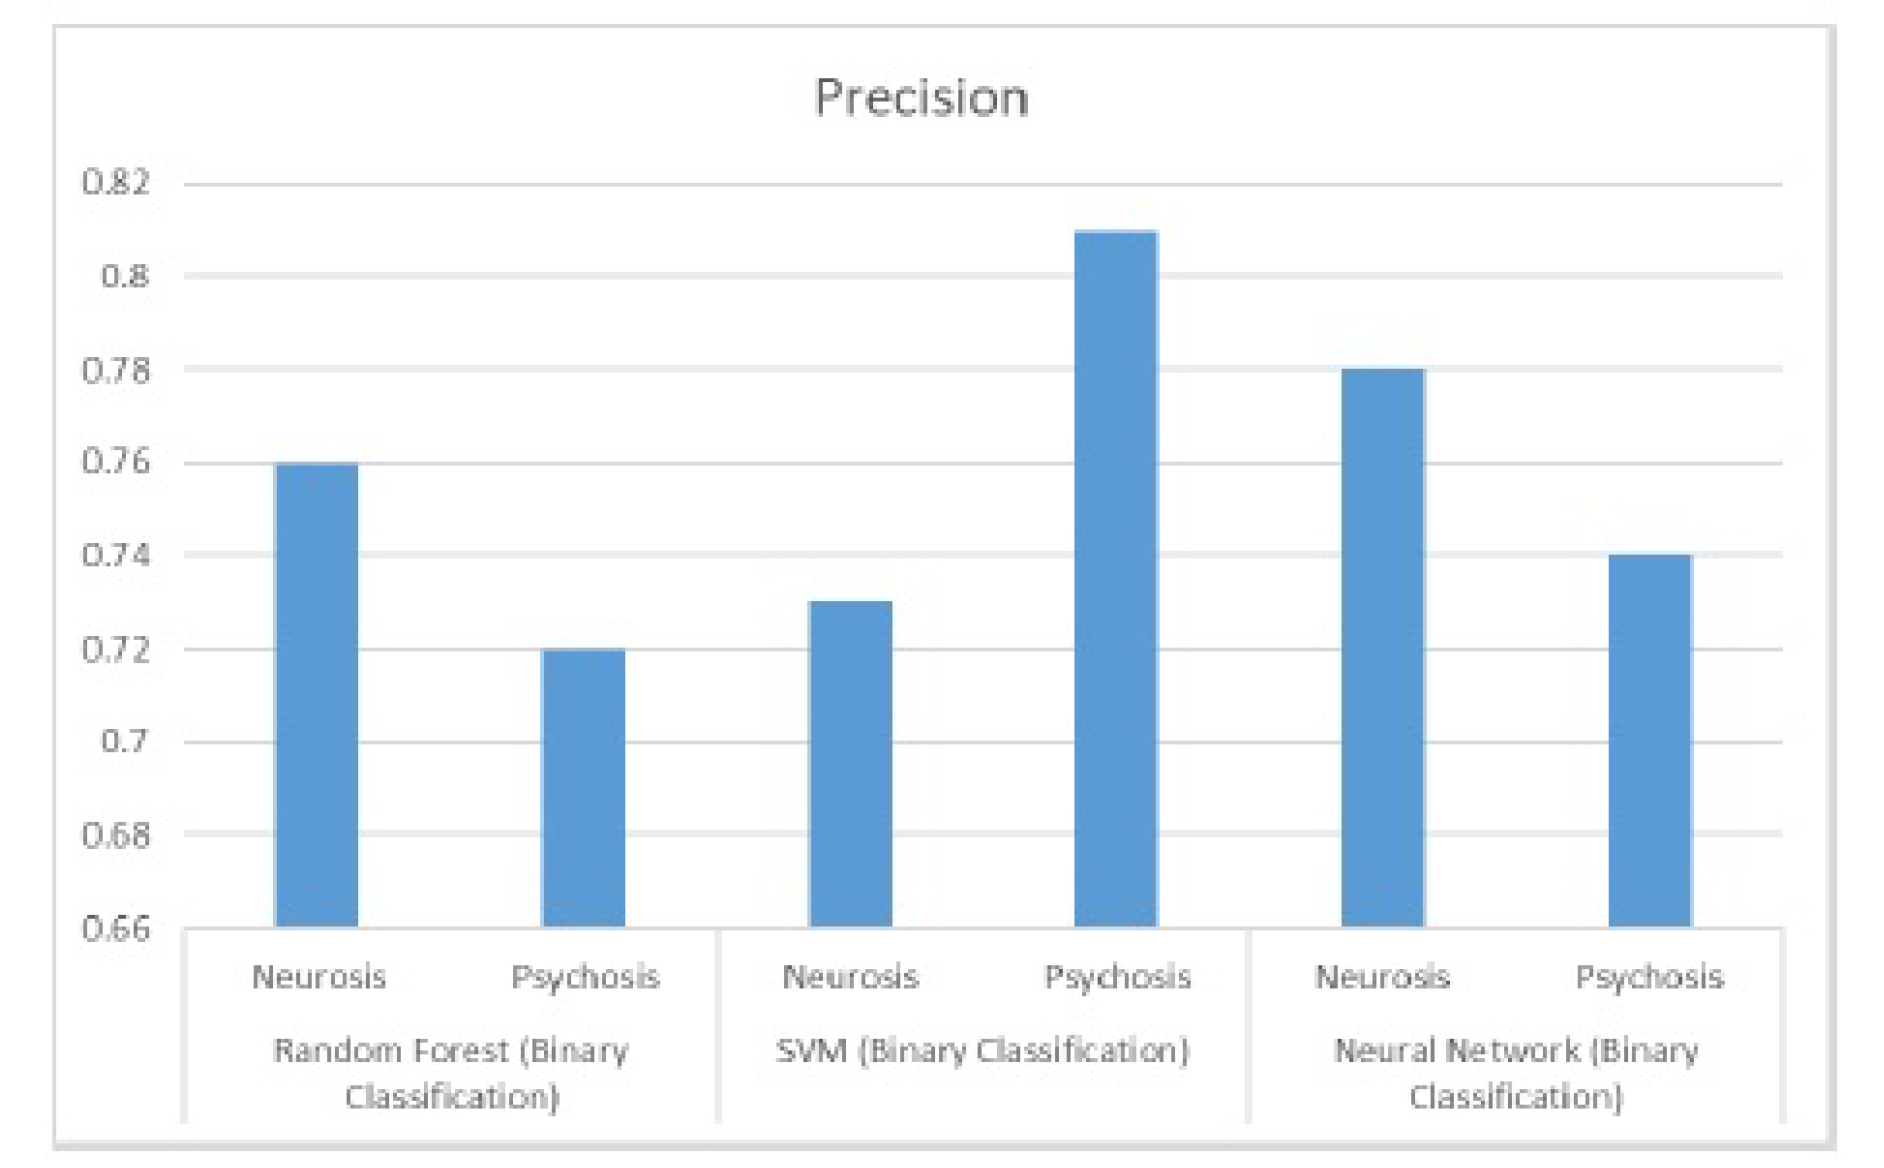
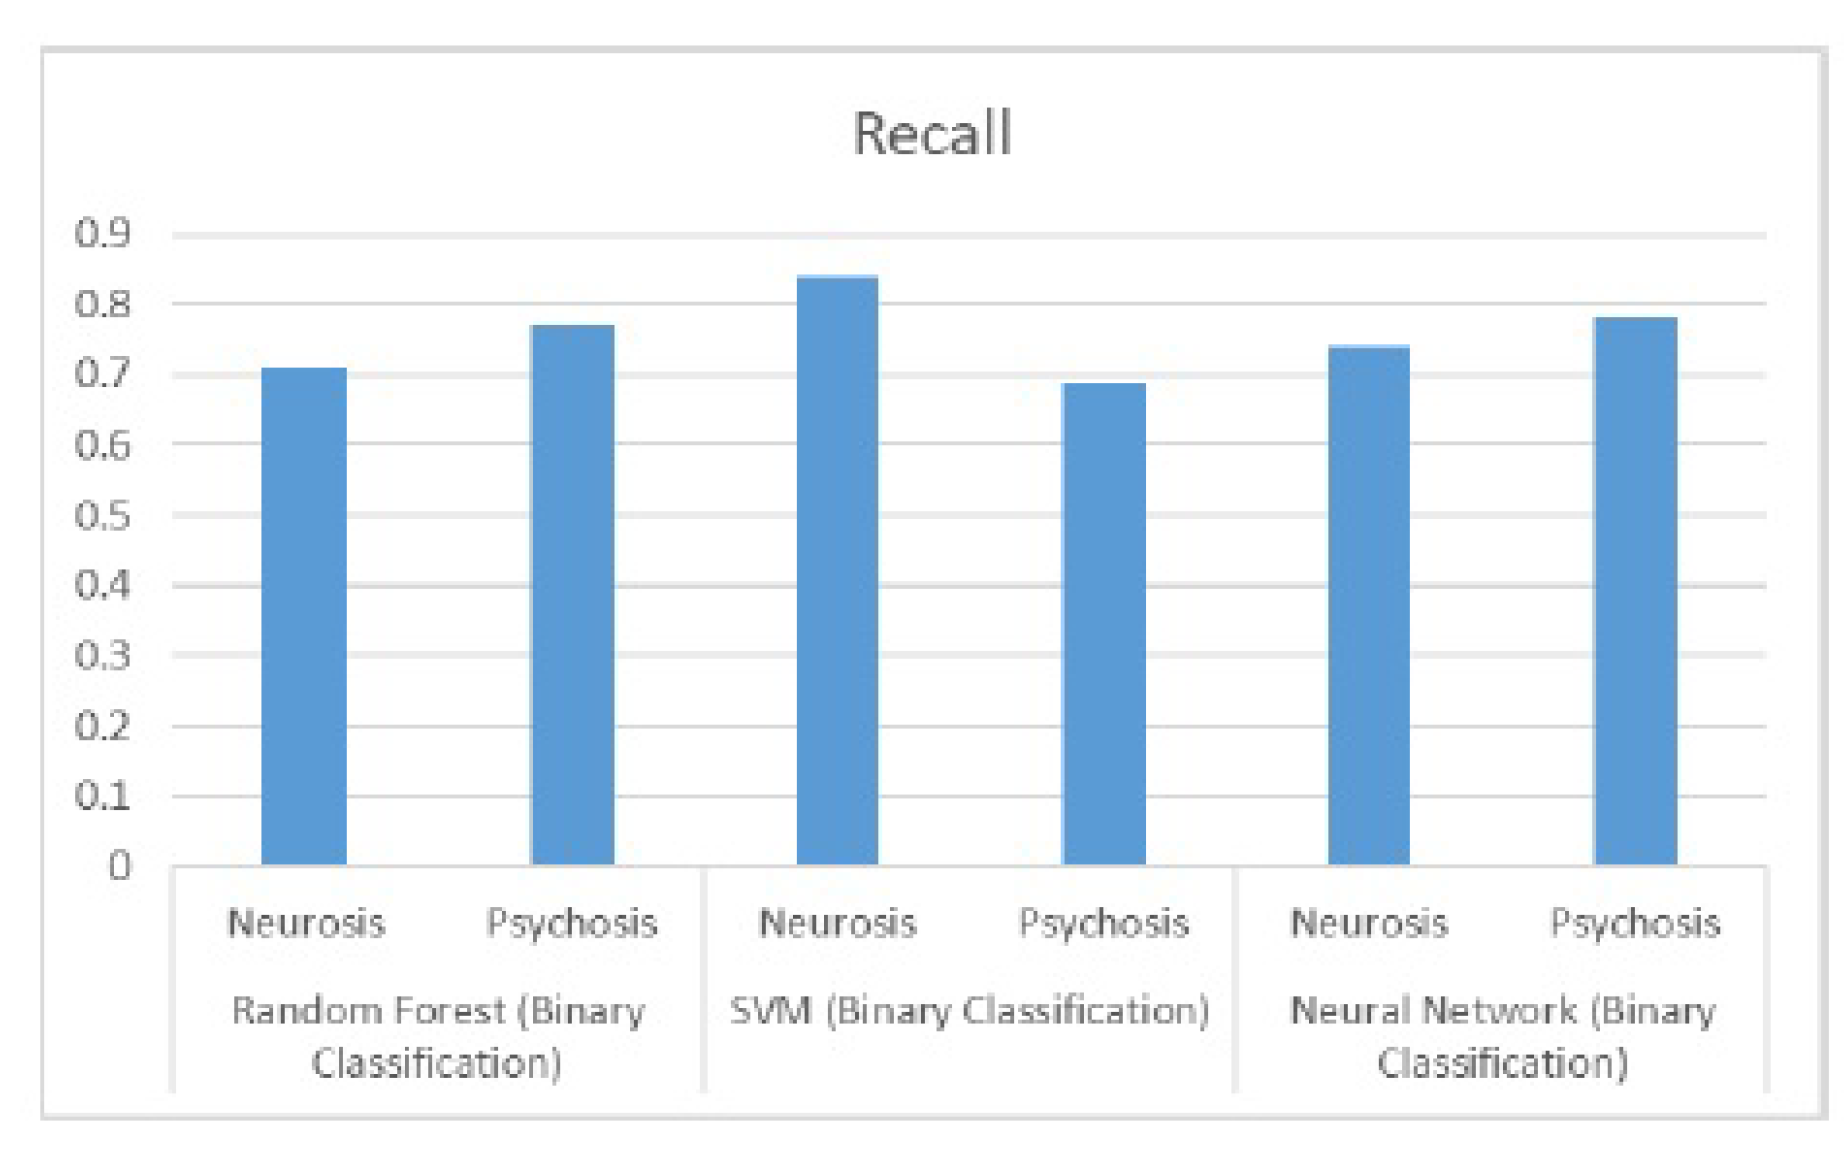
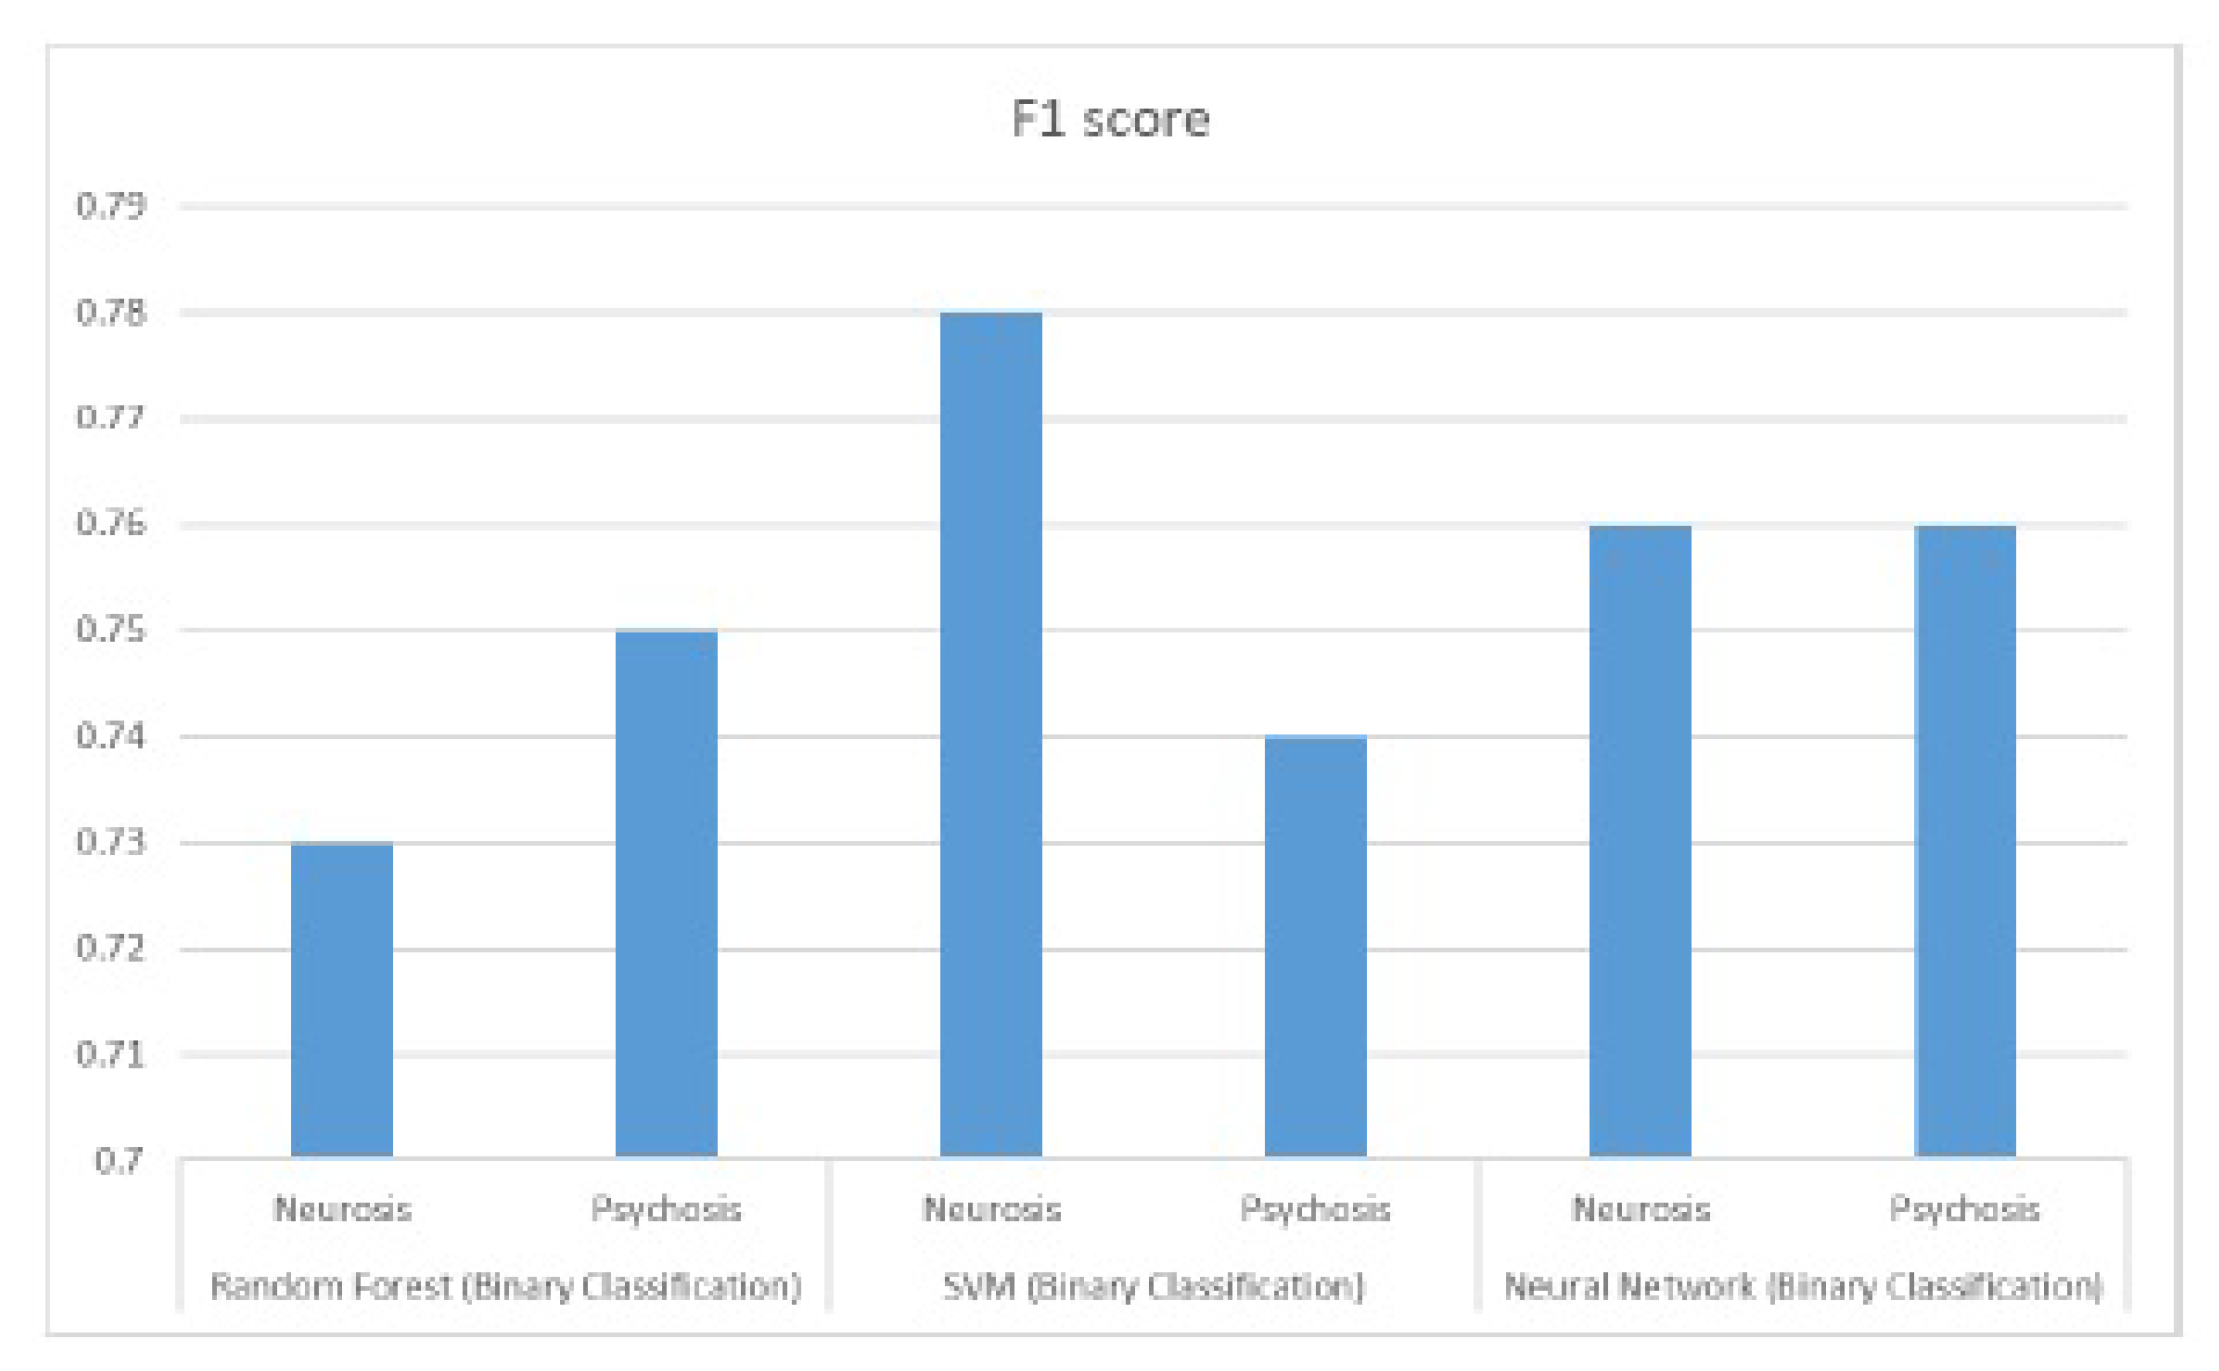
The subsequent data depicts the performance outcomes achieved by three algorithms, namely Random Forests, Support Vector Machines, and Deep Neural Network. These findings played a pivotal role in informing the decision-making process of this project. Precision and recall graphs are shown in the
Figure 11 and
Figure 12 and
Figure 13 respectively.
8.2. Results of Neural Network String Embedding
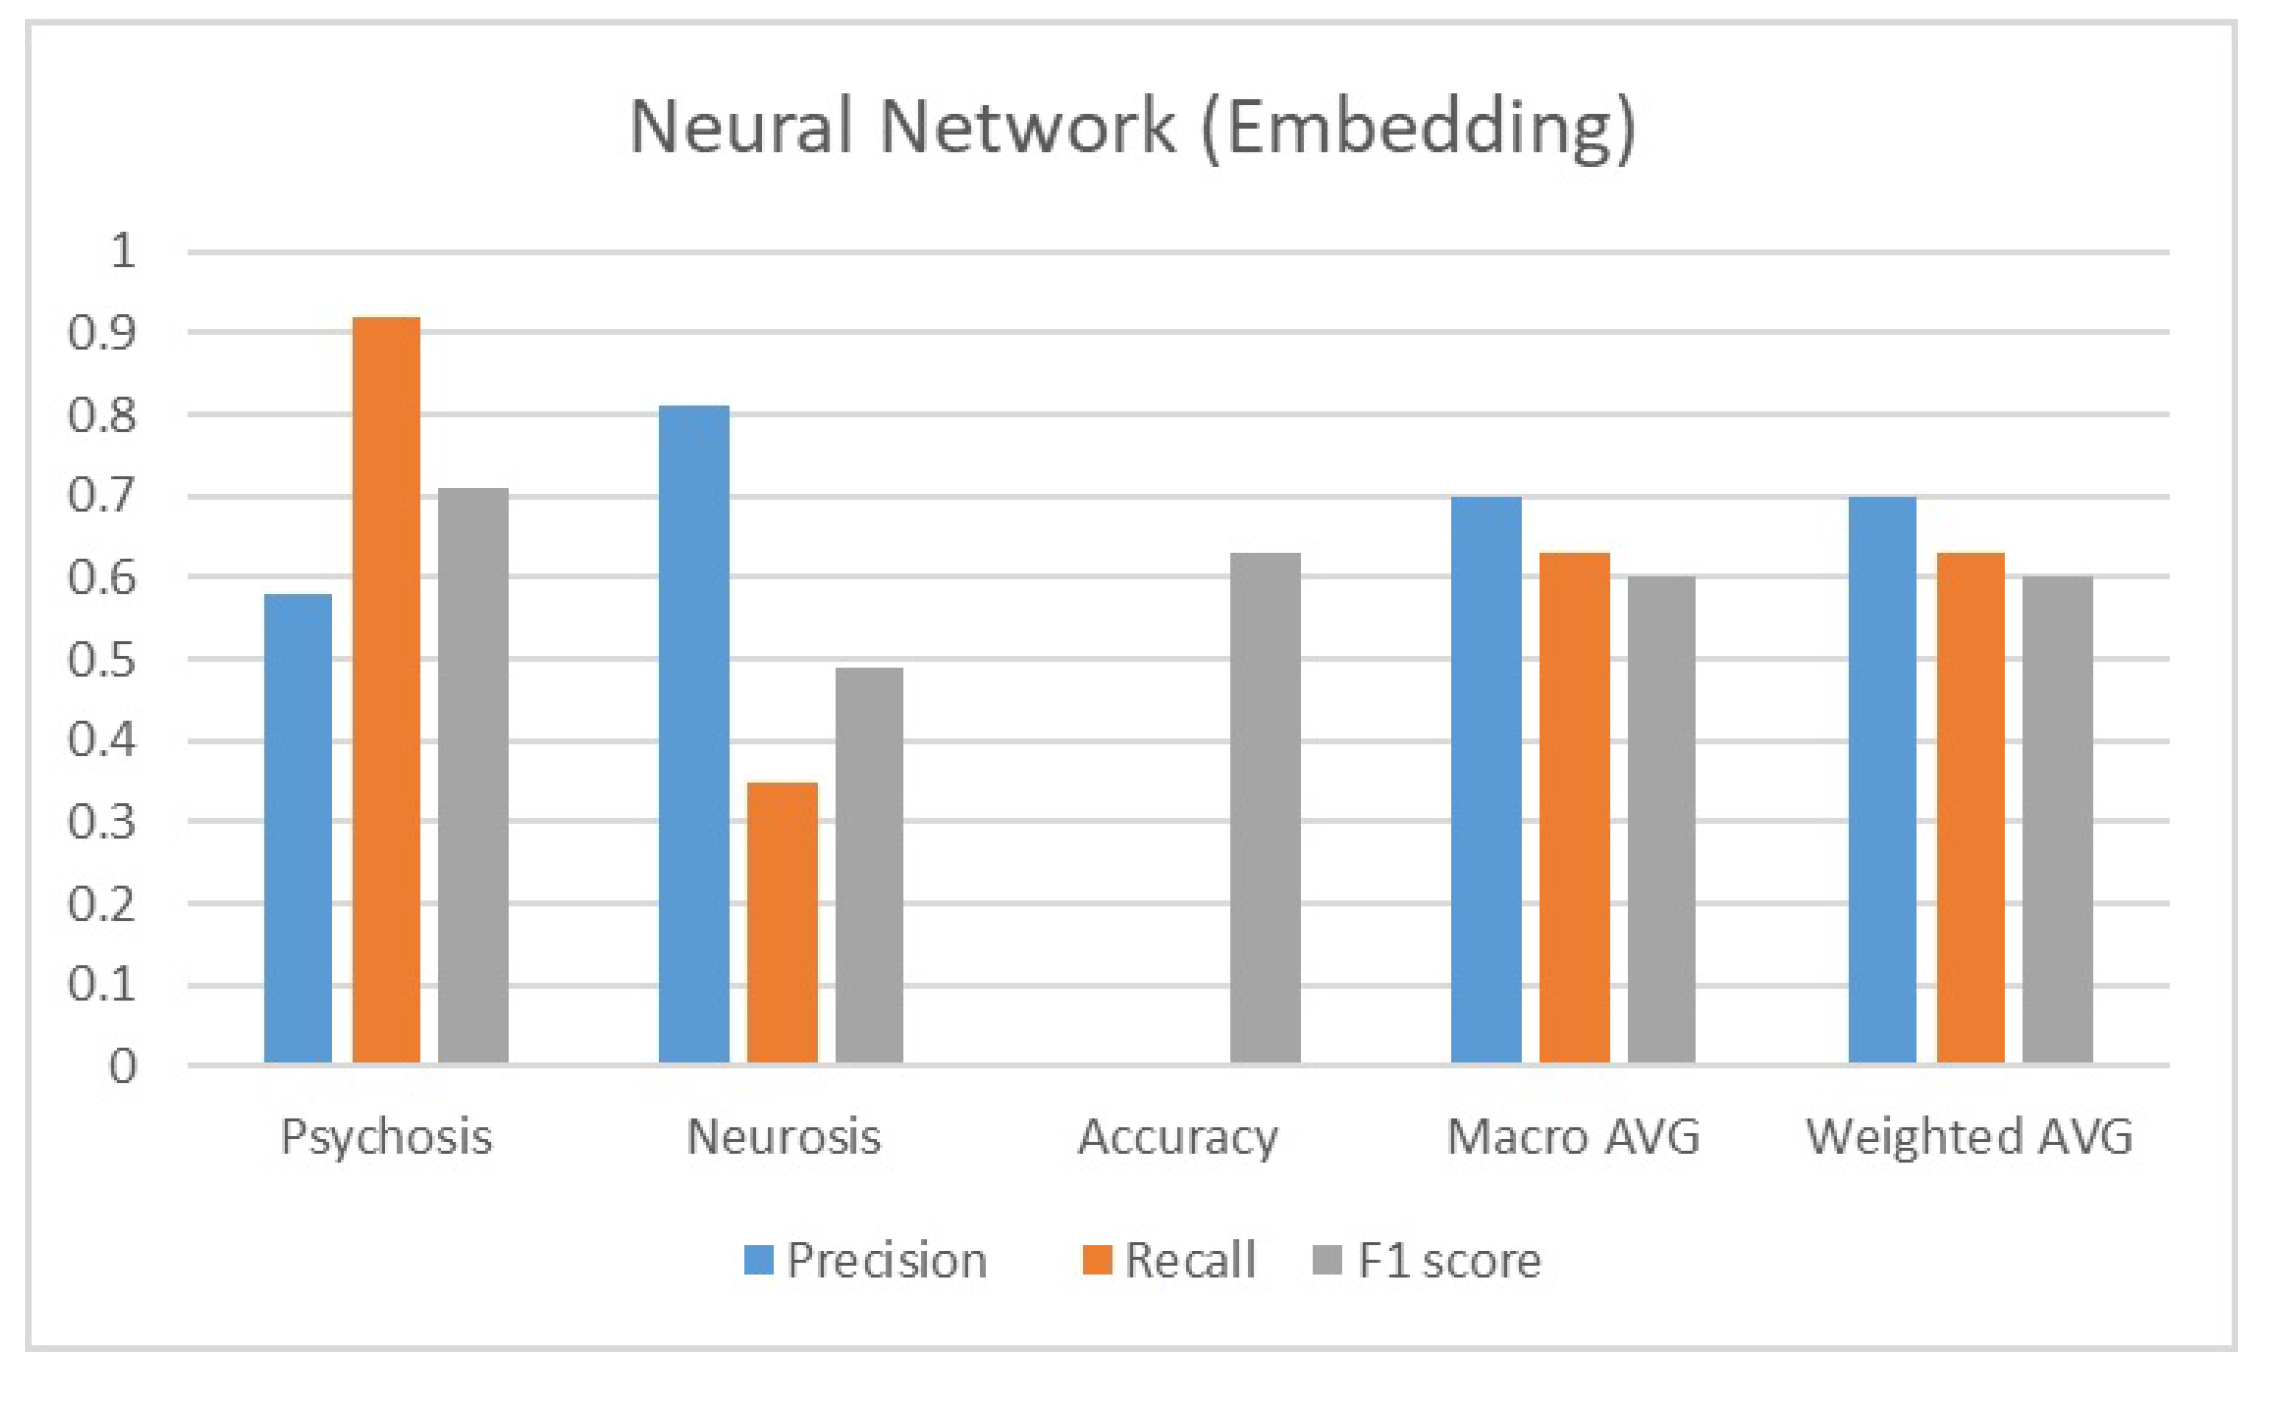
The supervised learning dataset consisted of 764 instances and 11,974 features, comprising string embeddings. A deep neural network was employed to train this data for the purpose of binary classification. Results are shown in
Figure 14 The subsequent section presents the performance evaluation results.
8.3. Performance Results for Multiple Class Classification
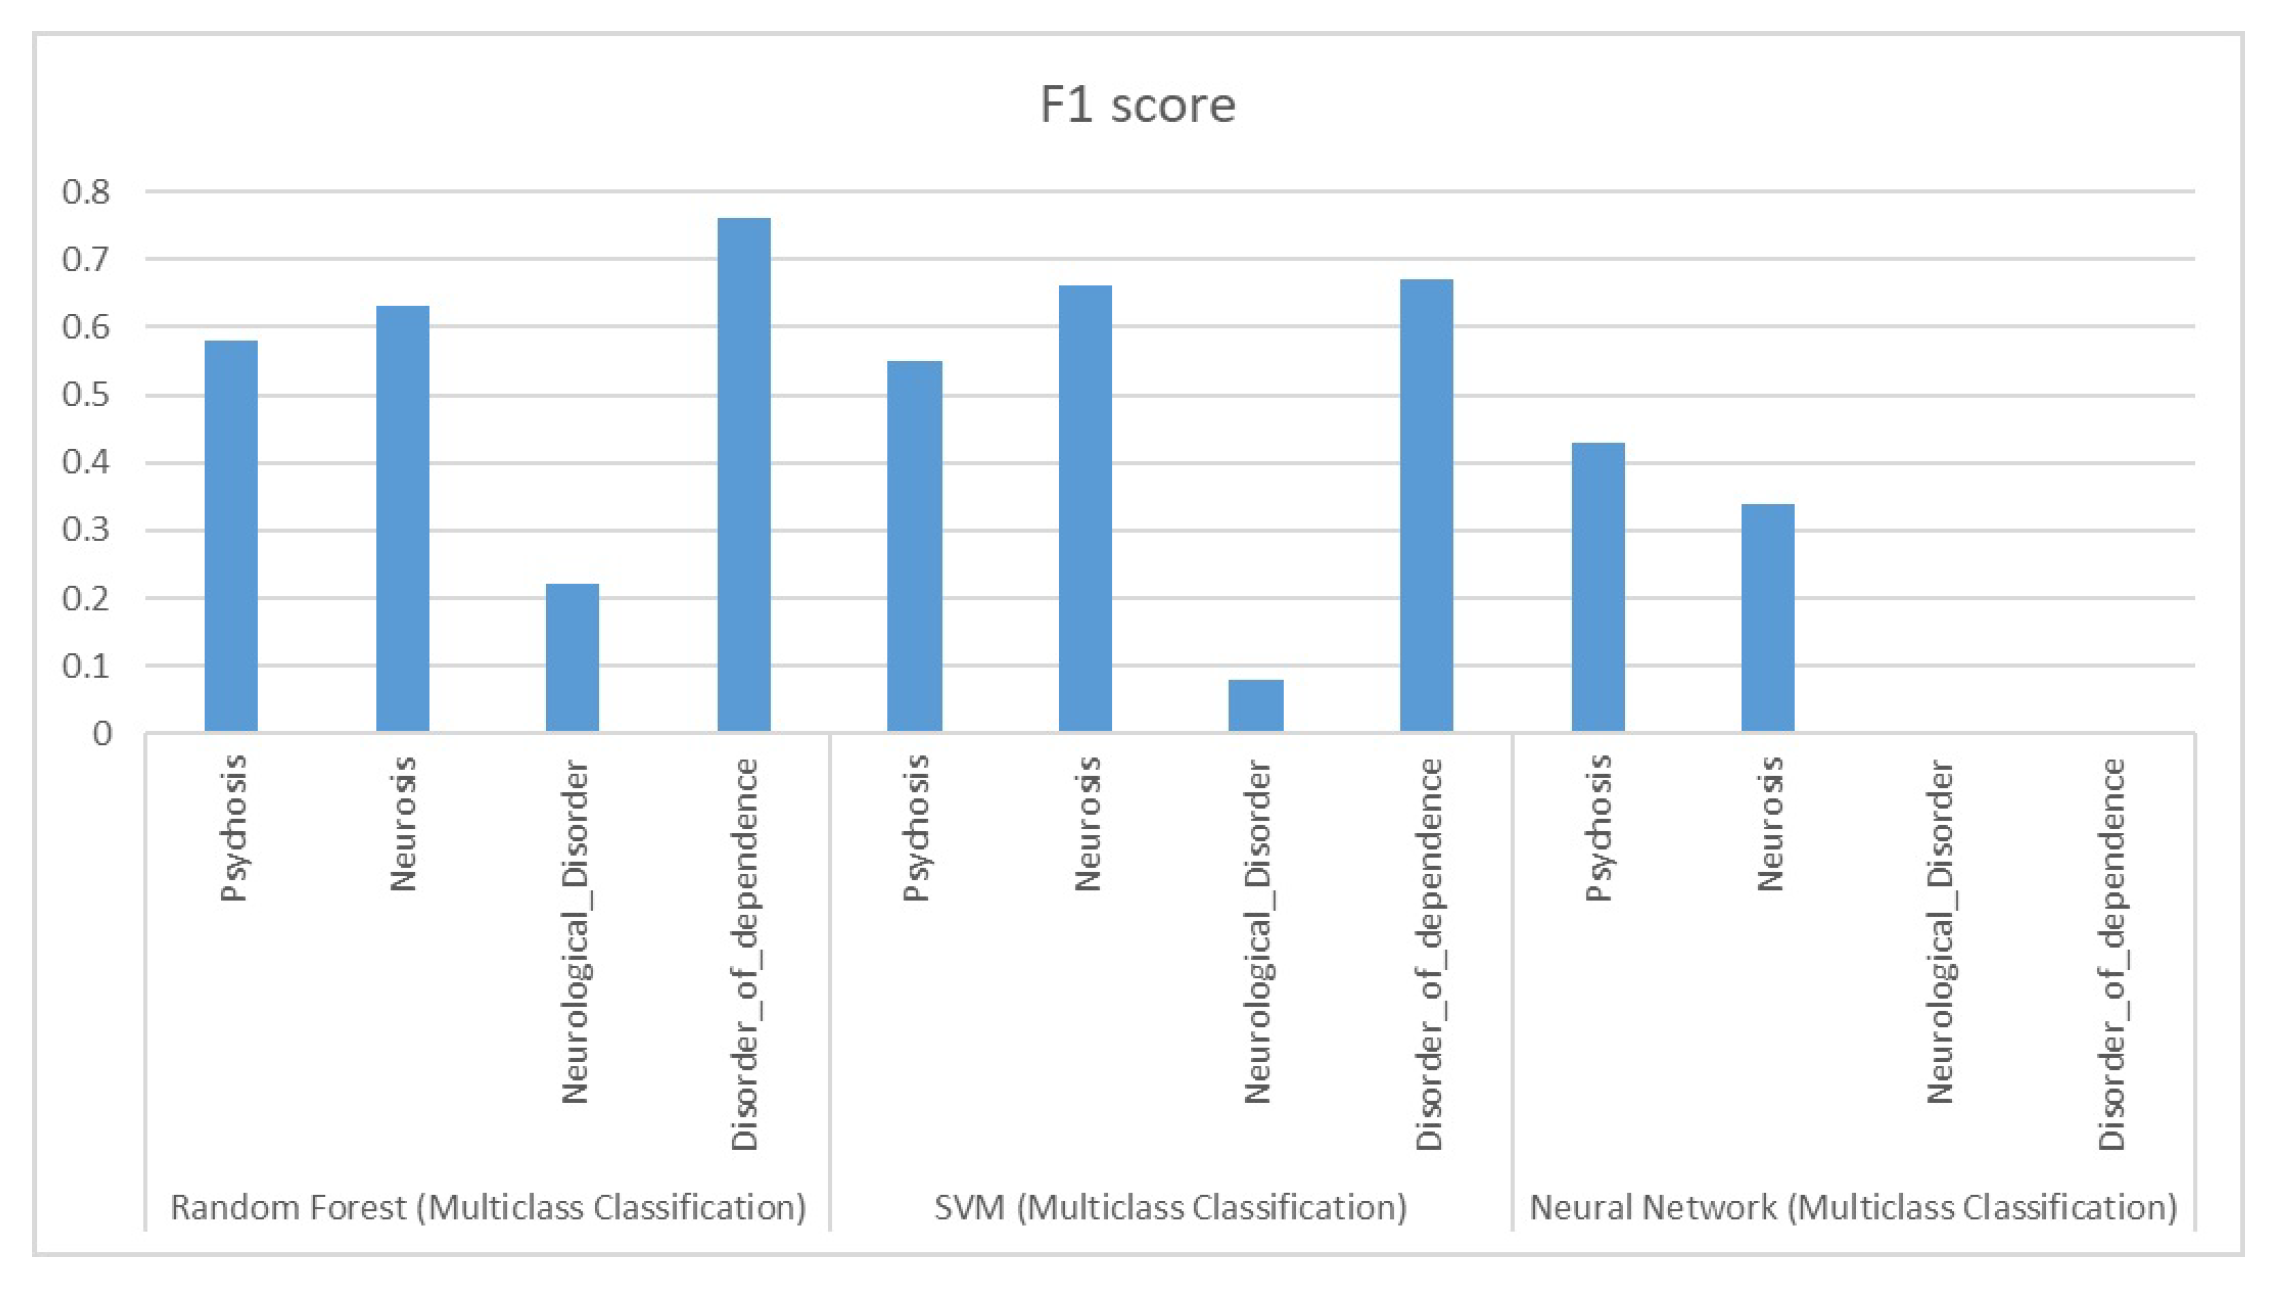
The subsequent data depicts the performance outcomes achieved by three algorithms, namely Random Forests, Support Vector Machines, and Deep Neural Network. These findings played a pivotal role in informing the decision-making process of this project. Fi Scores are shown in the
Figure 15
9. Conclusion
This reseach aimed at accurately diagnose mental health disorders based on the responses a user provides. The research’s main objective is to streamline the diagnostic process for mental health professionals and users and improve the accuracy and timeliness of diagnoses. The proposed solution addresses the problem statement by providing a platform that enables both mental health professionals and users to diagnose mental health illnesses more efficiently and accurately. The platform is user-friendly and can be accessed by both doctors and patients, making it accessible to a wide range of users. The AI model in the backend underwent comprehensive evaluation for accuracy score, F1 score, specificity, and sensitivity, revealing consistent performance across all metrics with a score of 73predictions on unseen data. While this score may be considered relatively modest, it serves as a solid foundation for future improvements. The evaluation results provide valuable insights into the model’s strengths and areas that require enhancement. By analyzing the factors contributing to the current performance and addressing them, the model can be iteratively refined and optimized to achieve higher accuracy and better overall predictions in the future In conclusion, It provides a solution that addresses the problem of the diagnostic process in mental health. The platform has been tested and proven to be effective, accurate, and user-friendly. With the Mental Health Classification, mental health professionals can now diagnose patients more efficiently and accurately, leading to improved mental health outcomes for patients.
10. Future Work
The field of AI-based applications and solutions has a promising future, with recent examples demonstrating the real-world impact of AI. This potential is particularly evident in the diagnosis of mental health diseases, as discussed earlier in this paper. However, there are several steps that must be taken to further develop and improve the project. The first of these steps involves beta testing the web application at the local mental hospital Mental Health Institute, where real-world patients will participate and compare the AI’s predictions to their actual diagnosis. Additionally, testing with mental health professionals will be crucial to assess the effectiveness of the platform as an aiding tool and ensure that it accurately predicts mental health disorders while remaining consistent with their own conclusions about their patients. These two tests are a primary concern to assess the viability and effectiveness of the project. Another essential aspect of this project is enabling the application to take in negative feedback and improve its training and accuracy. This feedback loop will be vital to improving the overall performance of the platform and ensuring its reliability. Lastly, to improve the accuracy, scope, and depth of our model’s predictions, we must continue to expand and refine the dataset produced by this research. By doing so, we can further unlock the potential of this project and showcase its true capabilities. In conclusion, the current stage of this project, including its dataset, AI, and showcasing application, represents only the beginning of its potential. Through ongoing development and refinement, this project has the potential to make a significant impact on the diagnosis and treatment of mental health diseases.
References
- Saleem, M.A.; Tamoor, M.; Asif, S. An efficient method for gender classification using hybrid CBR. 2016 Future Technologies Conference (FTC). IEEE, 2016, pp. 116–120.
- Shah, S.M.; Jahangir, M.; Xu, W.; Yuan, Y. Reliability and validity of the Urdu version of psychosomatic symptoms scale in Pakistani patients. Frontiers in Psychology 2022, 13, 861859. [Google Scholar]
- Ahmed, A.; Sultana, R.; Ullas, M.T.R.; Begom, M.; Rahi, M.M.I.; Alam, M.A. A machine learning approach to detect depression and anxiety using supervised learning. 2020 IEEE Asia-Pacific Conference on Computer Science and Data Engineering (CSDE). IEEE, 2020, pp. 1–6.
- Barry, J. A deep learning approach to diagnosing schizophrenia. UCF 2019. [Google Scholar]
- Tamoor, M.; Osama, S.; Younas, I.; Asif, S. Comparison of different multi objective evolutionary algorithms for bug localization. International Conference on Advances on Applied Cognitive Computing—ACC, 2018.
- Chughtai, I.T.; Naseer, A.; Tamoor, M.; Asif, S.; Jabbar, M.; Shahid, R. Content-based image retrieval via transfer learning. Journal of Intelligent & Fuzzy Systems 2023, 44, 8193–8218. [Google Scholar]
- Tamoor, M.; Gul, H.; Qaiser, H.; Ali, A. An optimal formulation of feature weight allocation for CBR using machine learning techniques. 2015 SAI Intelligent Systems Conference (IntelliSys). IEEE, 2015, pp. 61–67.
- Chung, J.; Teo, J. Mental health prediction using machine learning: taxonomy, applications, and challenges. Applied Computational Intelligence and Soft Computing 2022, 2022, 9970363. [Google Scholar]
- Graham, S.; Depp, C.; Lee, E.E.; Nebeker, C.; Tu, X.; Kim, H.C.; Jeste, D.V. Artificial intelligence for mental health and mental illnesses: an overview. Current psychiatry reports 2019, 21, 1–18. [Google Scholar]
- Jo, Y.T.; Joo, S.W.; Shon, S.H.; Kim, H.; Kim, Y.; Lee, J. Diagnosing schizophrenia with network analysis and a machine learning method. International Journal of Methods in Psychiatric Research 2020, 29, e1818. [Google Scholar]
- Kim, J.; Lee, J.; Park, E.; Han, J. A deep learning model for detecting mental illness from user content on social media. Scientific reports 2020, 10, 11846. [Google Scholar]
- Góngora Alonso, S.; Marques, G.; Agarwal, D.; De la Torre Díez, I.; Franco-Martín, M. Comparison of machine learning algorithms in the prediction of hospitalized patients with schizophrenia. Sensors 2022, 22, 2517. [Google Scholar] [CrossRef]
- Tamoor, M.; Naseer, A.; Khan, A.; Zafar, K. Skin lesion segmentation using an ensemble of different image processing methods. Diagnostics 2023, 13, 2684. [Google Scholar] [CrossRef]
- Tamoor, M.; Younas, I. Automatic segmentation of medical images using a novel Harris Hawk optimization method and an active contour model. Journal of X-ray Science and Technology 2021, 29, 721–739. [Google Scholar]
- Nasir, S.; Taimoor, M.; Gul, H.; Ali, A.; Khan, M.J. Optimization of decision making in cbr based self-healing systems. 2012 10th International Conference on Frontiers of Information Technology. IEEE, 2012, pp. 68–72.
- Nawaz, M.; Adnan, A.; Tariq, U.; Salman, F.; Asjad, R.; Tamoor, M. Automated career counseling system for students using cbr and j48. Journal of Applied Environmental and Biological Sciences 2015, 4, 113–120. [Google Scholar]
- Khan, M.; Naseer, A.; Wali, A.; Tamoor, M. A Roman Urdu Corpus for sentiment analysis. The Computer Journal 2024, p.bxae052.
- Pläschke, R.N.; Gruber, O. On the integrity of functional brain networks in schizophrenia, Parkinson’s disease, and advanced age. Wiley Online Library 2017. [Google Scholar]
- Raza, N.; Naseer, A.; Tamoor, M.; Zafar, K. Alzheimer disease classification through transfer learning approach. Diagnostics 2023, 13, 801. [Google Scholar] [CrossRef]
- Xie, W.; Wang, C.; Lin, Z.; Luo, X.; Chen, W.; Xu, M.; Liang, L.; Liu, X.; Wang, Y.; Luo, H.; others. Multimodal fusion diagnosis of depression and anxiety based on CNN-LSTM model. Computerized Medical Imaging and Graphics 2022, 102, 102128. [Google Scholar] [PubMed]
- Wali, A.; Ahmad, M.; Naseer, A.; Tamoor, M.; Gilani, S. Stynmedgan: medical images augmentation using a new GAN model for improved diagnosis of diseases. Journal of Intelligent & Fuzzy Systems 2023, 44, 10027–10044. [Google Scholar]
- Wali, A.; Naseer, A.; Tamoor, M.; Gilani, S. Recent progress in digital image restoration techniques: a review. Digital Signal Processing, 2023, p.104187. [Google Scholar]
- Khalid, A.; Farhan, A.A.; Zafar, K.; Tamoor, M. Automated Cobb’s Angle Measurement for Scoliosis Diagnosis Using Deep Learning Technique. Preprints 2024. [Google Scholar]
- Lee, E.E.; Torous, J.; De Choudhury, M.; Depp, C.A.; Graham, S.A.; Kim, H.C.; Paulus, M.P.; Krystal, J.H.; Jeste, D.V. Artificial intelligence for mental health care: clinical applications, barriers, facilitators, and artificial wisdom. Biological Psychiatry: Cognitive Neuroscience and Neuroimaging 2021, 6, 856–864. [Google Scholar] [PubMed]
- Leightley, D.; Williamson, V.; Darby, J.; Fear, N.T. Identifying probable post-traumatic stress disorder: applying supervised machine learning to data from a UK military cohort. Journal of Mental Health 2019, 28, 34–41. [Google Scholar]
- Luxton, D.D. Artificial intelligence in behavioral and mental health care. Academic Press 2015. [Google Scholar]
- Malik, Y.S.; Tamoor, M.; Naseer, A.; Wali, A.; Khan, A. Applying an adaptive Otsu-based initialization algorithm to optimize active contour models for skin lesion segmentation. Journal of X-Ray Science and Technology 2022, 30, 1169–1184. [Google Scholar]
- Naseer, A.; Tamoor, M.; Azhar, A. Computer-aided COVID-19 diagnosis and a comparison of deep learners using augmented CXRs. Journal of X-ray Science and Technology 2022, 30, 89–109. [Google Scholar] [PubMed]
- Nasreen, G.; Haneef, K.; Tamoor, M.; Irshad, A. A comparative study of state-of-the-art skin image segmentation techniques with CNN. Multimedia Tools and Applications 2023, 82, 10921–10942. [Google Scholar]
|
Disclaimer/Publisher’s Note: The statements, opinions and data contained in all publications are solely those of the individual author(s) and contributor(s) and not of MDPI and/or the editor(s). MDPI and/or the editor(s) disclaim responsibility for any injury to people or property resulting from any ideas, methods, instructions or products referred to in the content. |
© 2024 by the authors. Licensee MDPI, Basel, Switzerland. This article is an open access article distributed under the terms and conditions of the Creative Commons Attribution (CC BY) license (http://creativecommons.org/licenses/by/4.0/).

