1. Introduction
Ice accumulation on power transmission lines poses a significant risk to the electric power system, leading to structural damage, power outages, and severe economic losses. The added weight from ice can cause lines to sag, break, or collapse, disrupting electricity supply and posing safety hazards[
1,
2,
3,
4,
5,
6]. Detecting and preventing ice buildup is crucial to maintaining infrastructure integrity and minimizing the associated economic and safety risks[
7,
8].
Several countries have experienced significant ice sheet disasters on transmission lines, highlighting the widespread impact of the problem[
9,
10,
11]. The 1998 North American Ice Storm affected parts of the northeastern U.S., causing widespread blackouts and damage to electrical infrastructure, resulting in more than
$5 billion in damage and affecting millions of people. The same 1998 ice storm severely impacted Ontario and Quebec, causing widespread power outages, infrastructure damage, and an estimated
$3 billion in damages. Severe ice sheet events in Siberia, especially in 2001 and 2002, caused significant damage to electricity transmission infrastructure in Russia, leading to costly repairs and economic disruption. An ice disaster on transmission lines in northern France in 2005 caused significant damage to power lines, resulting in power outages affecting hundreds of thousands of people and requiring substantial repair costs. In 2008, a severe ice storm in southern China caused severe damage to power lines, leading to prolonged power outages that affected millions of people and resulted in economic losses of about
$8 billion. In February 2021, an ice sheet disaster on the power grid in Texas left millions of people without power in cold weather, causing significant disruptions and highlighting infrastructure vulnerabilities[
12,
13,
14,
15,
16,
17].
Early detection of ice on power transmission lines is critical to prevent outages and maintain reliability. However, this detection is challenging due to varying climatic conditions and factors like poor visibility and low contrast, which can complicate image-based methods and lead to false positives or missed detections[
18,
19]. Various methods have been developed to detect ice on power transmission lines, including manual inspection, vehicle monitoring, meteorological models, mechanical models, and sensor-based approaches. Manual inspection is labor-intensive, costly, and often impractical, especially in difficult terrains, but remains common. Vehicle monitoring provides precise inspection but is limited to urban areas. Meteorological and mechanical models offer valuable insights but are complex and may lack accuracy due to meteorological influences. Sensor-based methods measure ice mass and thickness but face challenges such as electromagnetic interference and reduced accuracy in certain conditions [
18,
20].
Advancements in computer vision have made image processing a key method for monitoring power transmission line icing (PTLI)[
21]. By using cameras on PTLI towers or deploying UAVs equipped with cameras, operators can efficiently monitor and analyze ice formation. UAVs, designed for mobility and safety, enhance PTLI monitoring by capturing and processing images to extract detailed edge and contour information, increasing the accuracy and reliability of ice thickness measurements[
22,
23]. Traditional methods for detecting ice on power transmission lines, such as the Canny edge detector and Hough transformation, face significant challenges, including sensitivity to noise, difficulty in complex backgrounds, and issues with background interference and poor illumination[
24,
25]. These limitations often lead to false positives, missed detections, and other inaccuracies, highlighting the need for more advanced and precise detection methods capable of reliably identifying ice under diverse conditions.
This research aims to overcome the limitations of current methods and improve the accuracy and reliability of PTLI identification by introducing several innovations:
Enhancing visibility and lighting variations of transmission lines and ice through multi-scale decomposition and adaptive enhancement.
Improving color differentiation for better ice detection.
Dynamically adjusting bilateral filter parameters to enhance edges and reduce noise.
Preserving the integrity of transmission lines and ice edges through edge-preserving techniques.
Using advanced segmentation methods for precise ice detection.
Isolating ice formations with adaptive cropping and intelligent masking.
Combining edge detection methods for robust results.
Ensuring detailed capture through advanced visualization techniques.
These innovations collectively provide a robust and efficient solution for accurately identification ice formations on power transmission lines, overcoming the limitations of existing methods.
2. Materials and Methods
2.1. Materials
2.1.1. Imaging Equipment
This paper utilizes high-resolution binocular cameras, specifically two DH-HV1351UM-ML cameras from Daheng Image Company, to capture images of ice on power transmission lines. The cameras, spaced 8cm apart, offer a resolution of 1280 × 1024 pixels, 10-bit analog-to-digital conversion, and a frame rate of 15 fps. These cameras are designed for precision, featuring adjustable digital gain, flexible shutter times, and programmable control for image settings. Their compact size and low power consumption make them suitable for integration into drones or other platforms for efficient ice monitoring. The physical image is shown in Figure 1.
Figure 1.
Daheng Binocular Vision Camera Structure.
Figure 1.
Daheng Binocular Vision Camera Structure.
2.1.2. Software Tools
The software tools for processing images of ice on power transmission lines rely on Python functions, OpenCV, and custom-developed algorithms. Python functions are key to implementing image processing tasks, such as using OpenCV for edge detection, segmentation, and object recognition. Custom algorithms, also executed through Python functions, address specific challenges like enhancing image contrast and reducing noise. By integrating Python, OpenCV, and custom algorithms, the system efficiently processes images, improving ice detection accuracy and reducing false positives.
2.1.3. Data Set
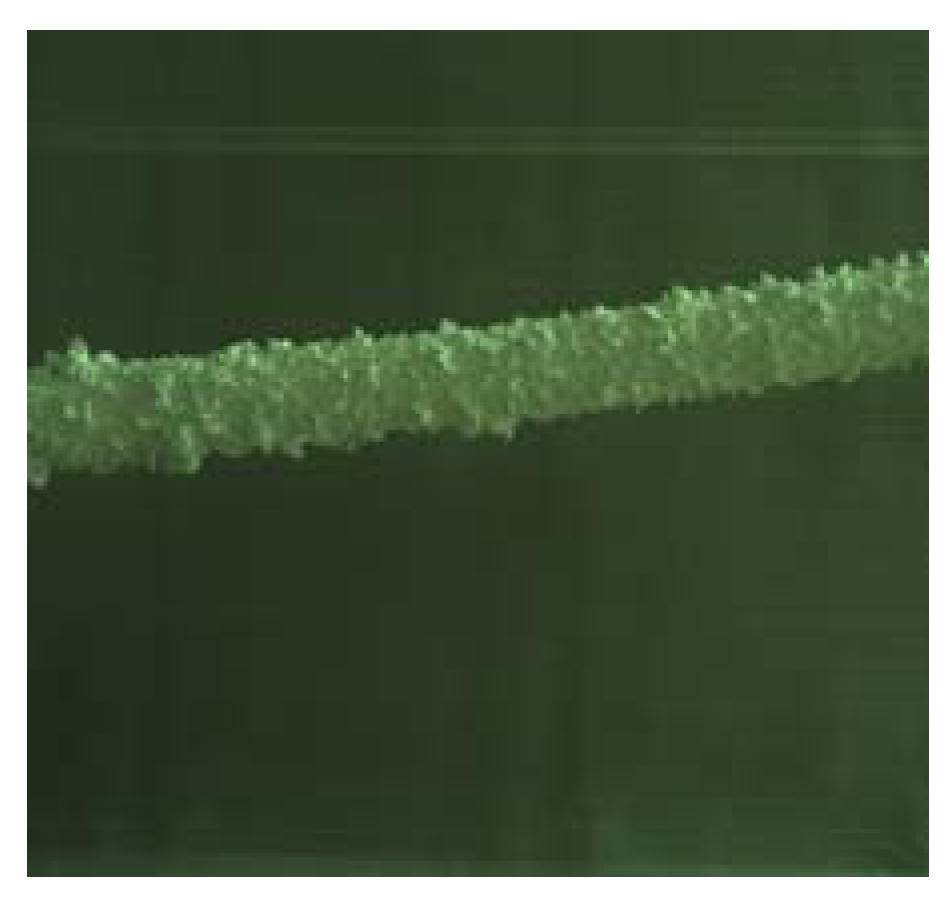
In order to facilitate the collection of ice-covered PTLI image data, a series of scenes were independently constructed to simulate the ice-covered transmission line. This study used long cylindrical pearl cotton (Expandable Polyethylene, EPE) to simulate the transmission channel, and polystyrene foam (Expanded Polystyrene, EPS) was attached to the surface to simulate ice cover. The dataset consists of images taken under various conditions to represent possible scenarios comprehensively. The dataset in this study consists of 200 PTLI images taken at different times with varying lighting and background conditions. The PTLI images were collected using Daheng binoculars in controlled indoor environments, with a dataset of 200 images taken under various lighting and background conditions. The images simulate ice-covered landscapes or white skies. To test the system’s reliability, the proposed method will also be applied to different backgrounds and lighting conditions. This comprehensive approach ensures accurate detection of ice formations on power transmission lines. The PTLI image that has been created is shown in Figure 2.
Figure 2.
Simulation of ice formation on transmission lines.
Figure 2.
Simulation of ice formation on transmission lines.
2.1. Methods
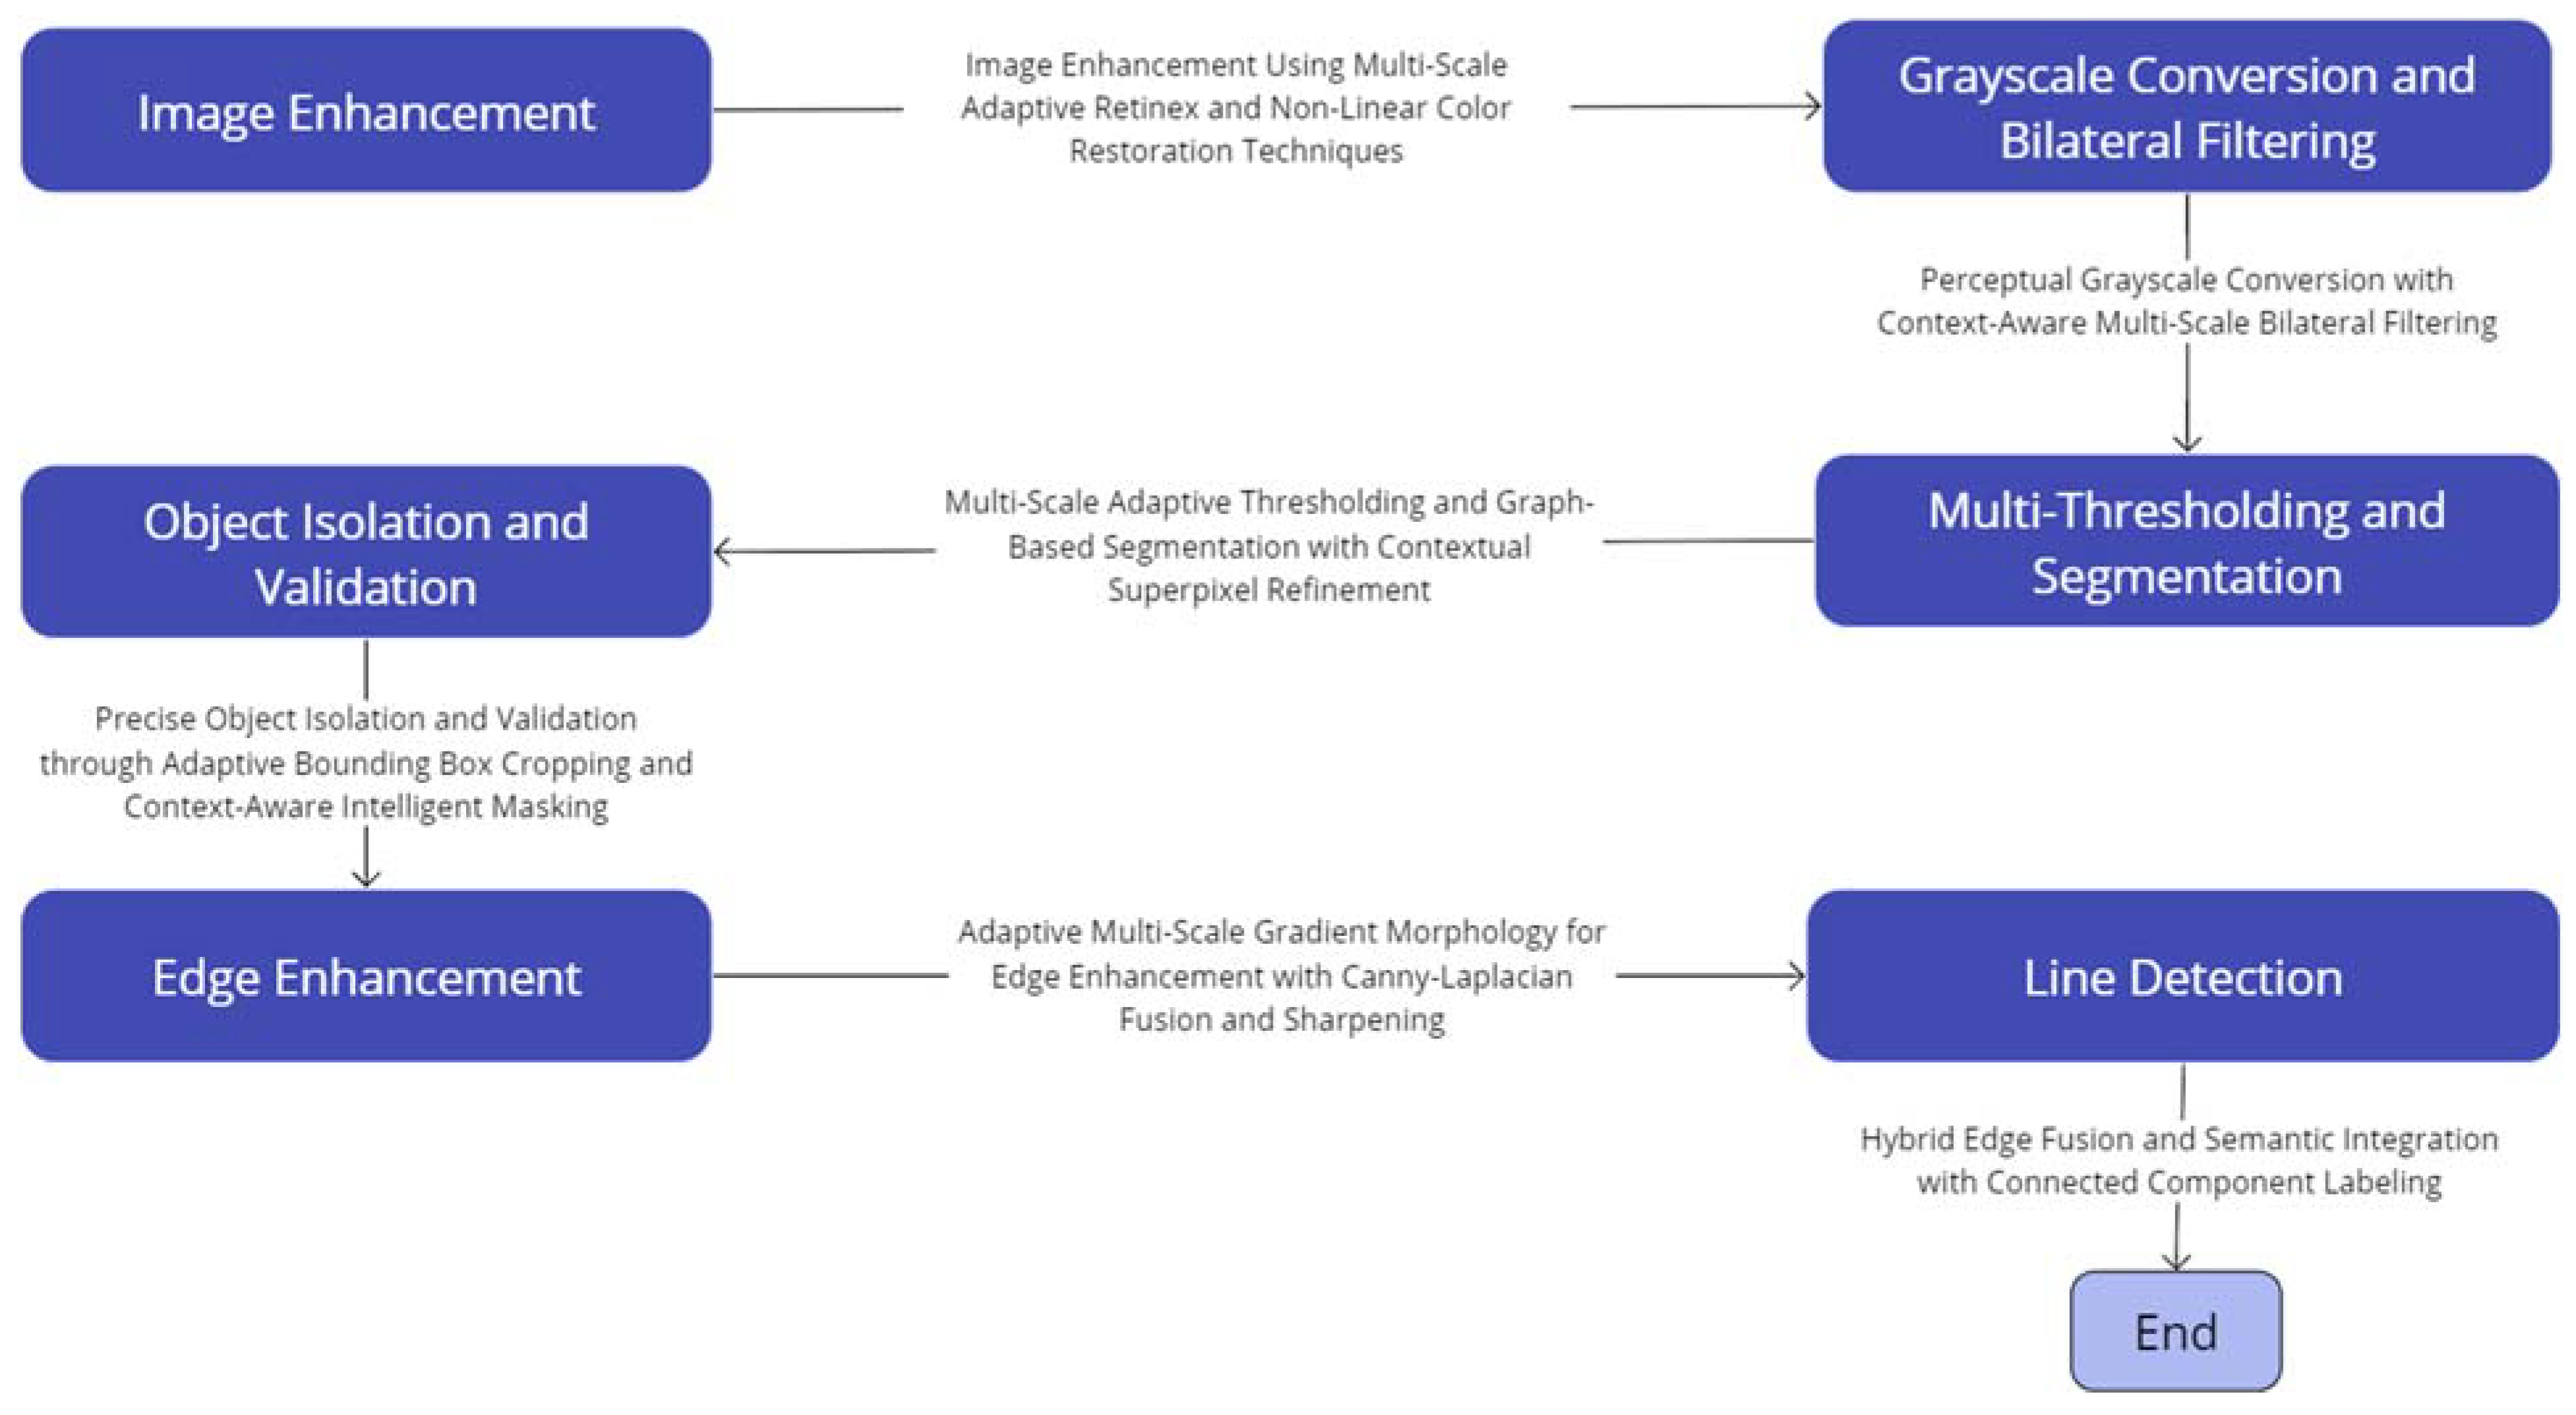
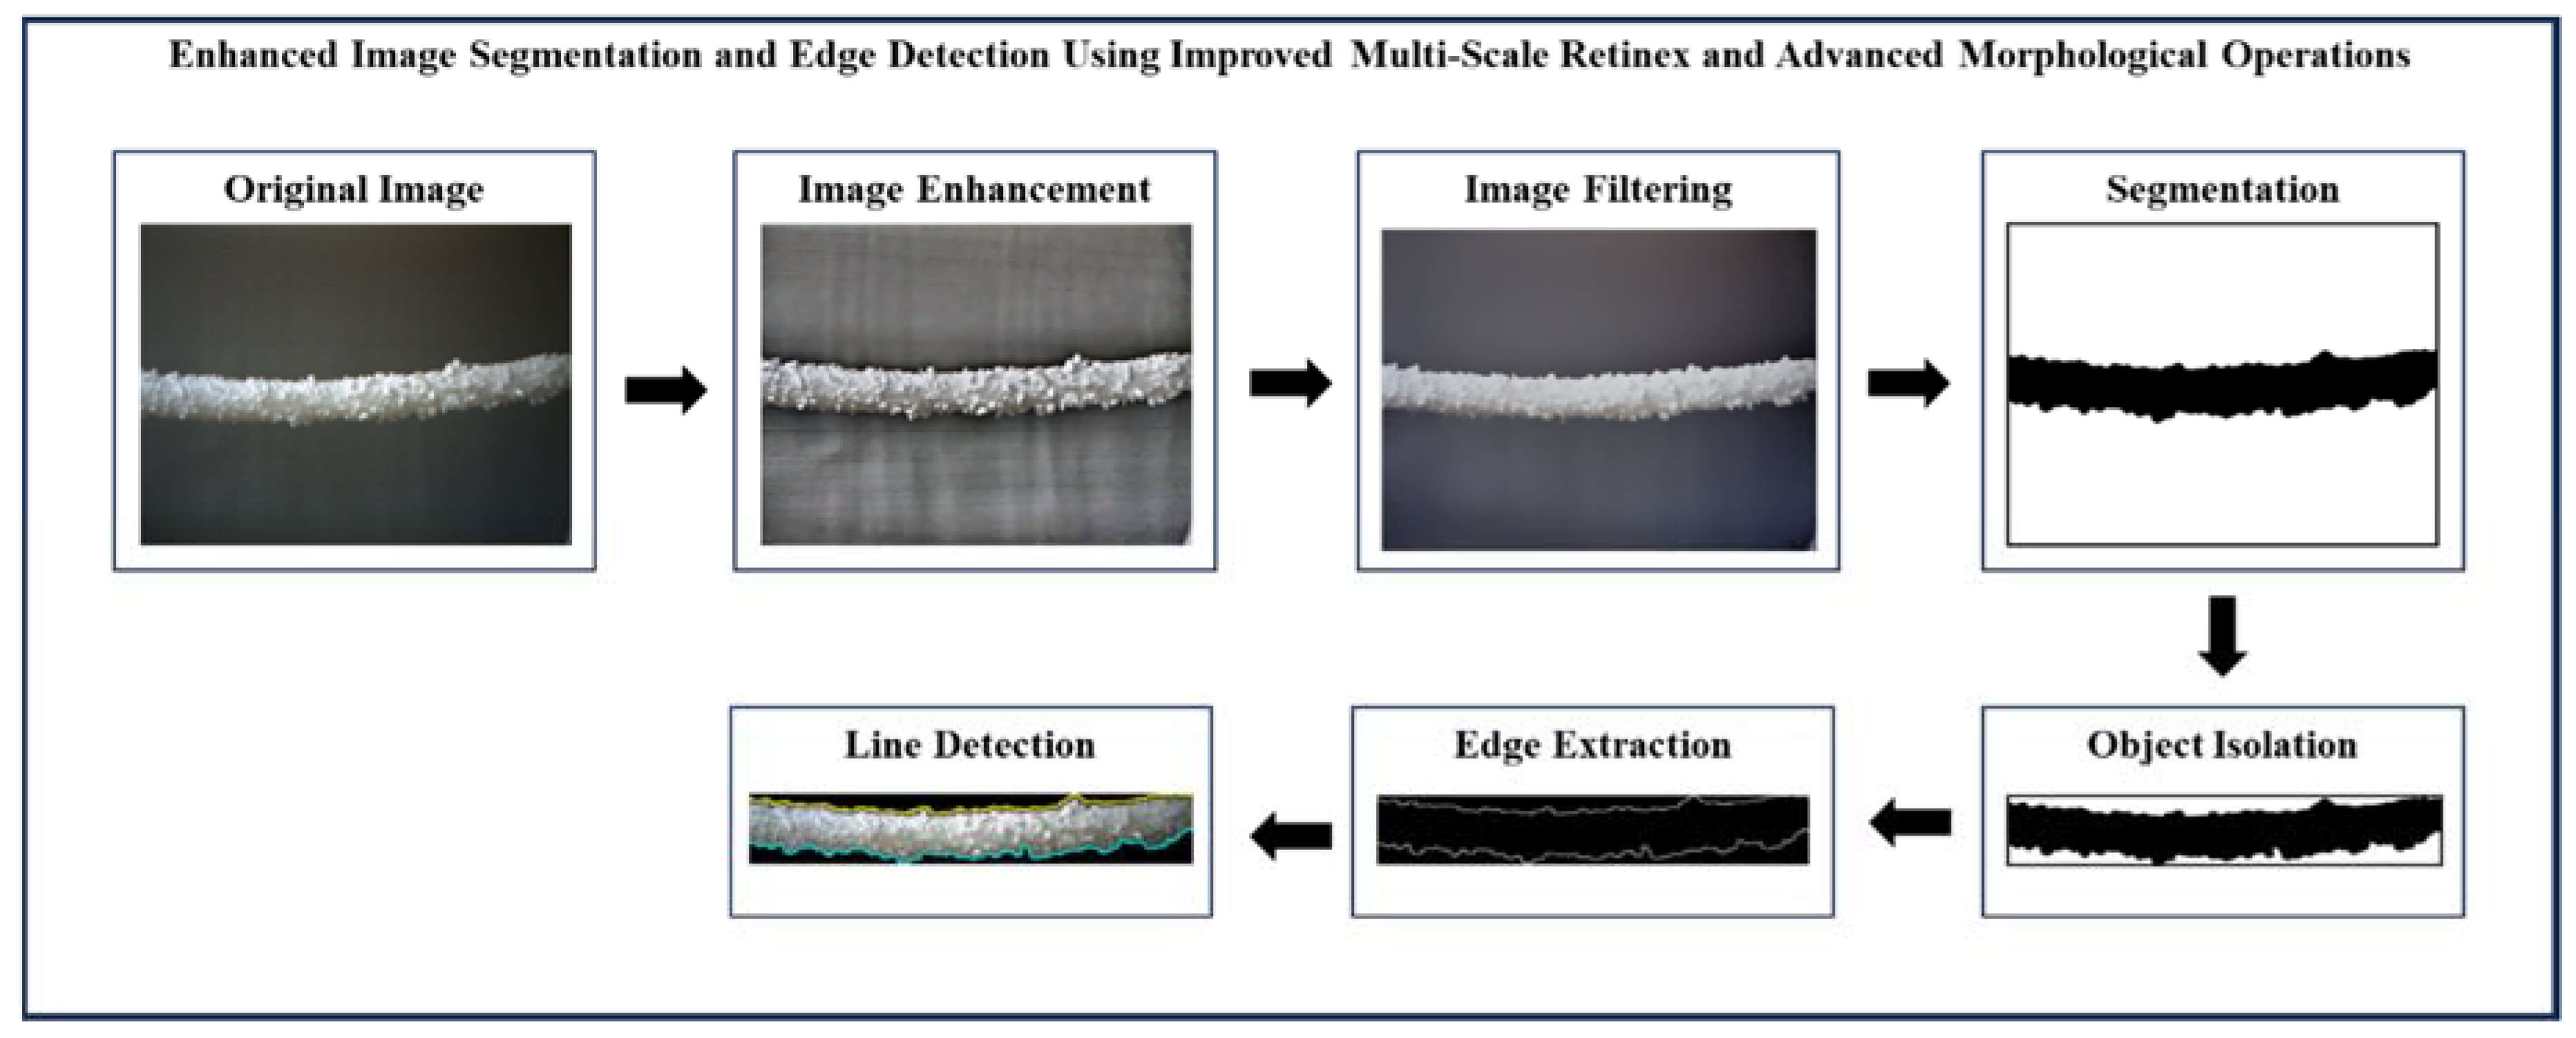
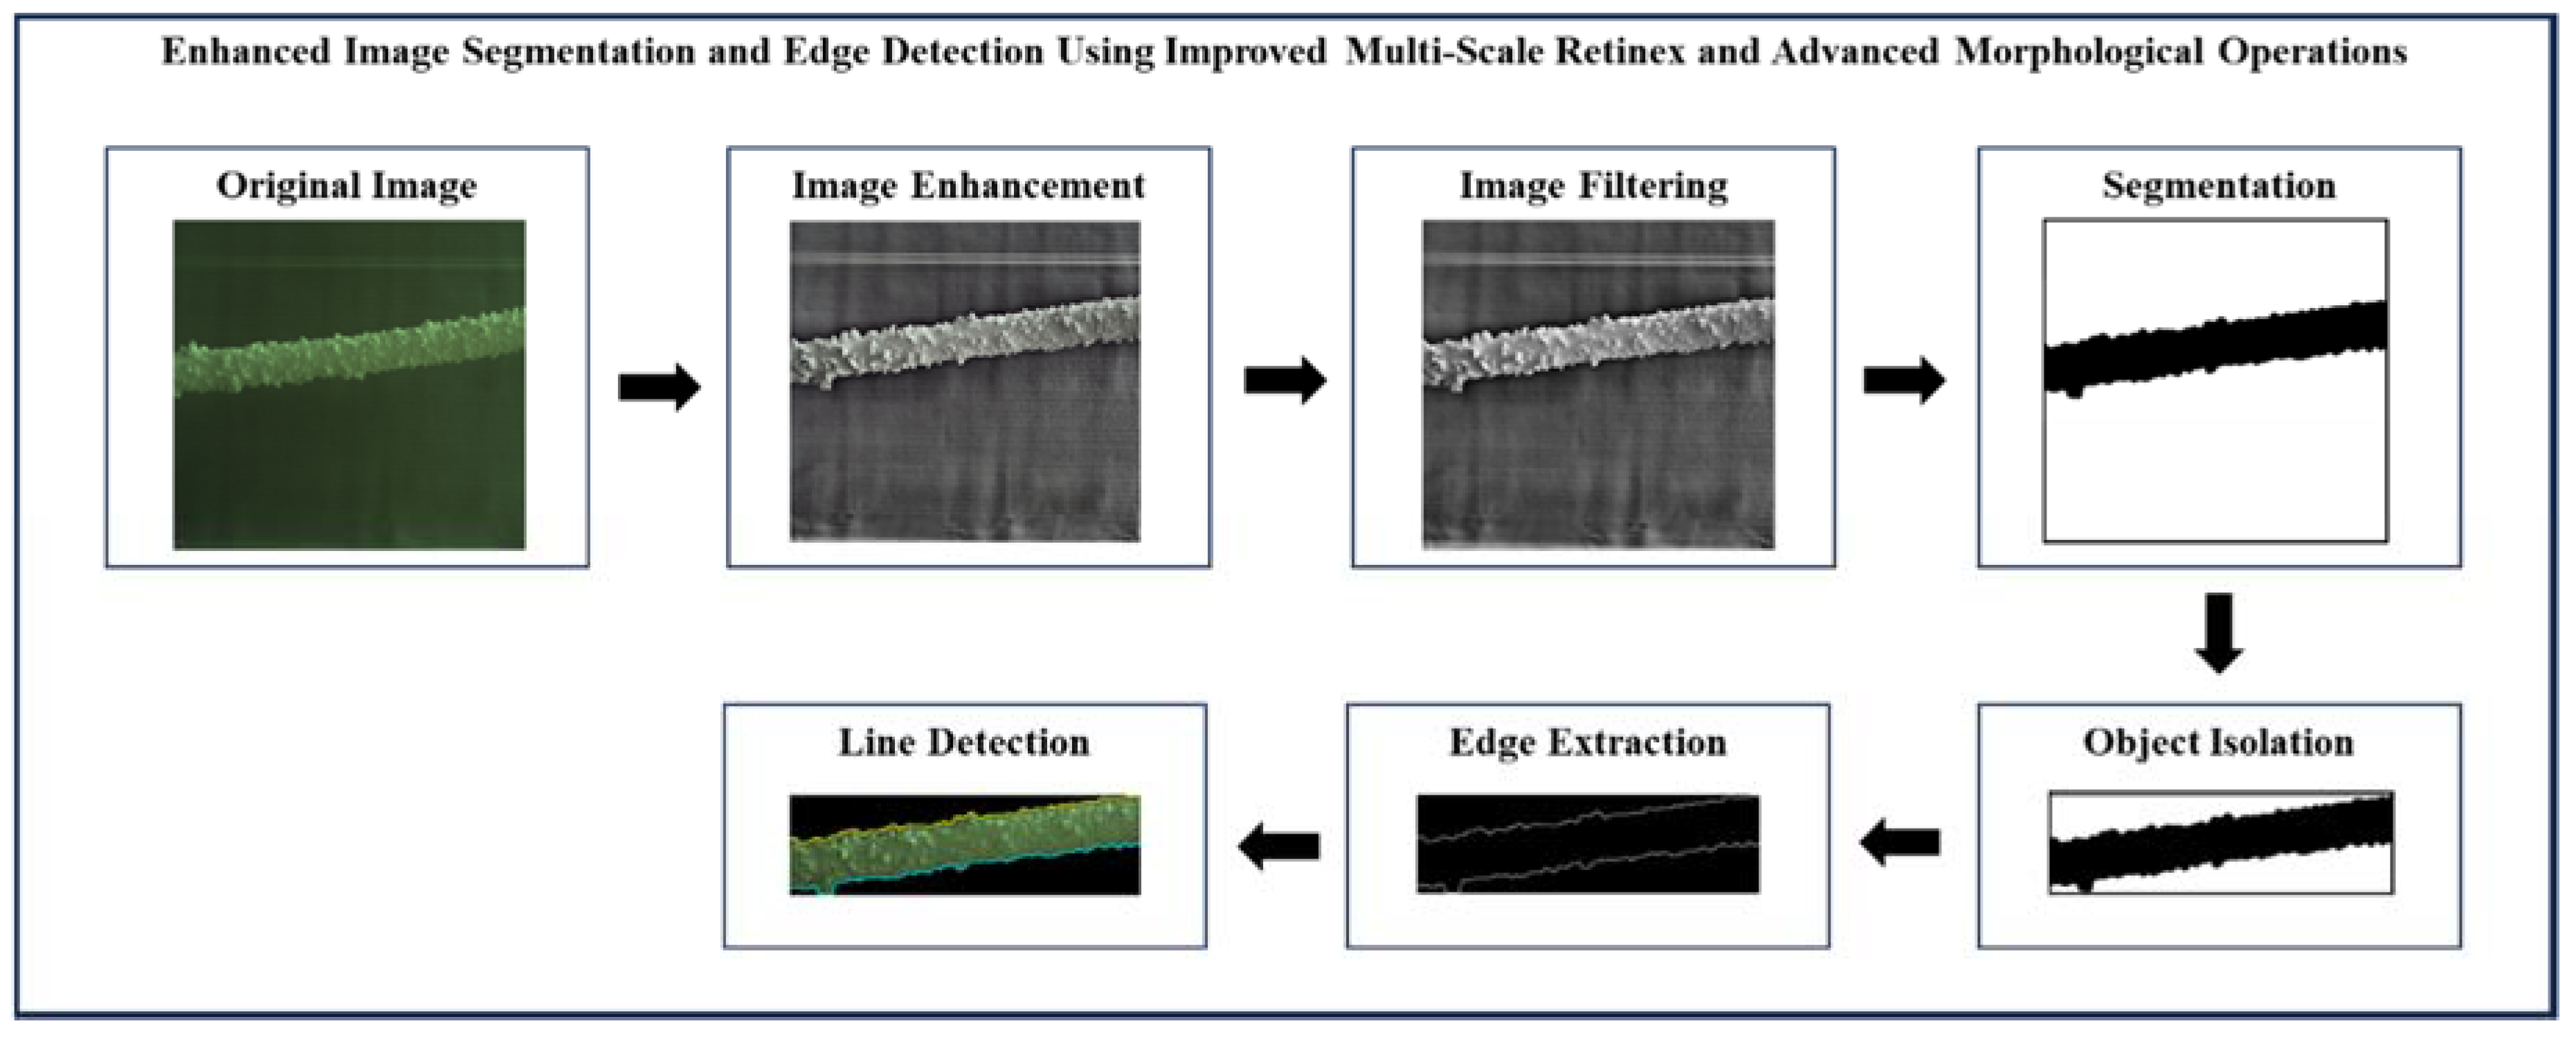
This section outlines the comprehensive methodology employed to detect ice formations on power transmission lines using advanced image processing and machine vision techniques. The methodology is structured into six stages, each encompassing specific procedures and techniques designed to enhance image quality, accurately detect and segment ice formations, and ensure robust analysis. The process begins with image enhancement, including capturing high-resolution images using cameras or drones, followed by preprocessing steps to remove noise and correct distortions. Subsequent stages involve sophisticated techniques for grayscale conversion, bilateral filtering, and edge-aware multi-resolution analysis. Thresholding and segmentation methods are applied to isolate potential ice formations, while object isolation and validation ensure accurate detection by removing non-ice objects. Finally, edge enhancement and multi-scale edge detection are performed to refine and visualize the detected ice formations. The detailed methodology ensures a thorough and reliable approach to capturing, processing, and analyzing images for accurate ice detection on power transmission lines. The block diagram of enhanced image segmentation and edge detection using improved multi-scale retinex and advanced morphological operations is shown in Figure 3. The algorithm in this method is shown in algorithm 1.
Figure 3.
Precision Ice Detection on Power Transmission Lines.
Figure 3.
Precision Ice Detection on Power Transmission Lines.
2.1.1. Image Enhancement
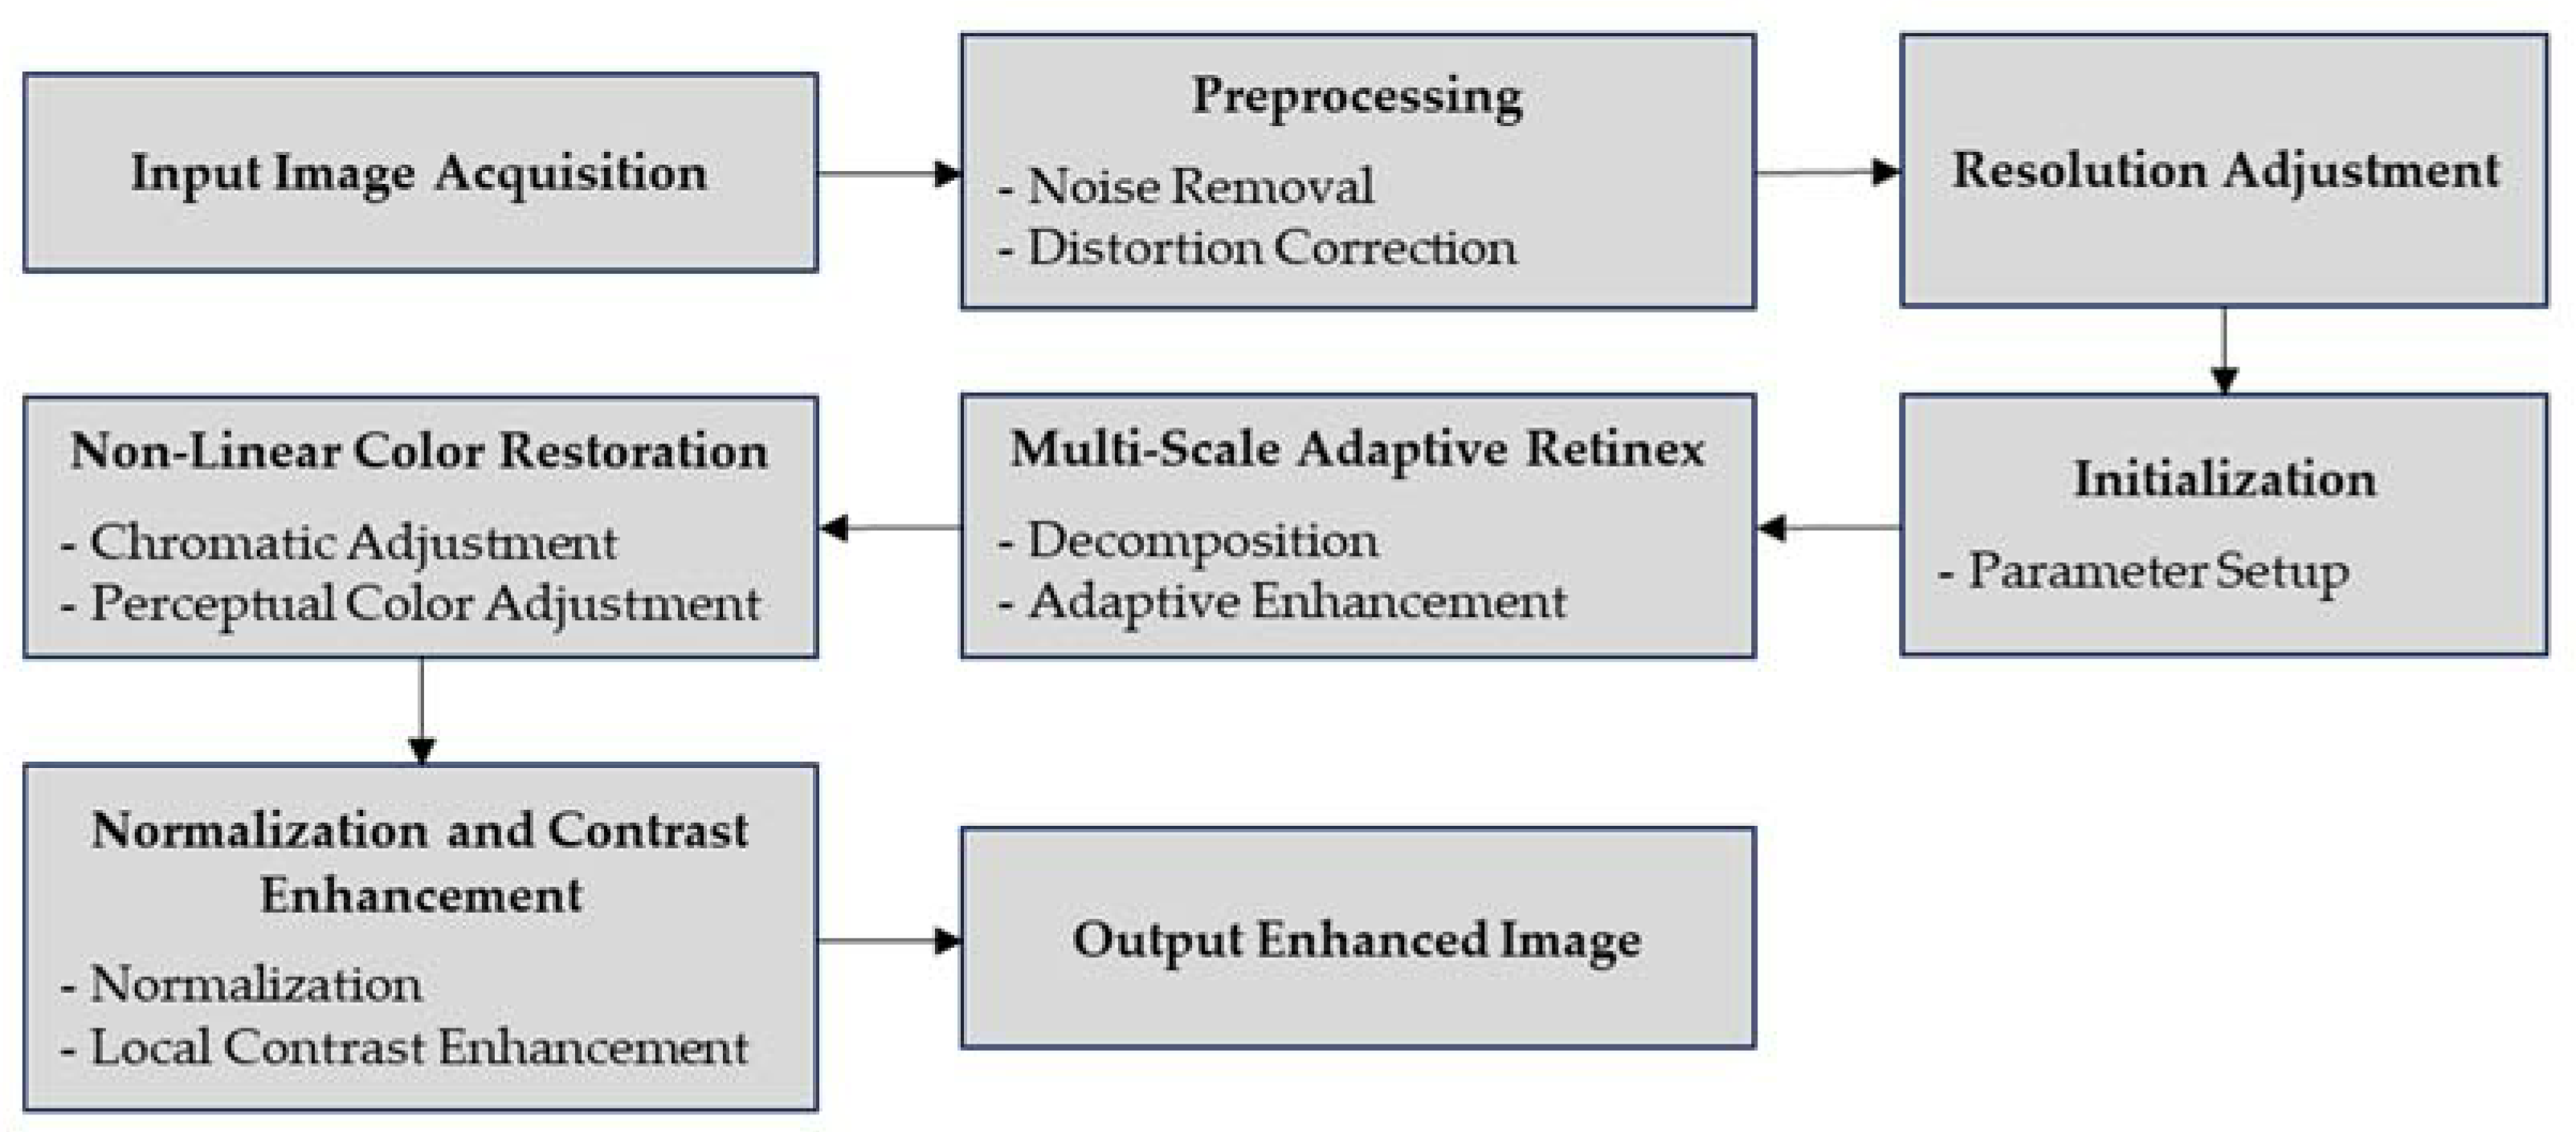
This section details the process of optimizing image quality for accurate ice detection on power transmission lines, including specific equations used in the process. It begins with Input Image Preparation, where high-quality images are captured and then preprocessed to remove noise and correct distortions. Images are resized to a uniform resolution using the following equation:
This equation adjusts an image’s resolution by mapping pixel coordinates from the original resolution to a new resolution . To obtain the pixel value at in the resized image, the equation maps the coordinates from the original image to their new positions in the resized image.
Next, in the Multi-Scale Adaptive Retinex stage, images undergo multi-scale decomposition and contrast enhancement using the following equation:
This equation is part of the Retinex enhancement process, which improves image contrast by adjusting different scales. It produces the final enhanced image by combining images at various scales with weighted Gaussian blurs . The logarithmic difference highlights contrast and details by emphasizing features in the image. The logarithmic difference between the original and blurred images enhances contrast and details.
Non-Linear Color Restoration follows, adjusting colors to enhance visibility, described by the equation:
The equation adjusts image colors for better balance and perceptual accuracy. is the image with corrected color intensity and gamma. simulates human color perception, producing , where colors are adjusted to match human visual sensitivity. Each pixel at coordinates and color channel now reflects colors adjusted for better perceptual accuracy.
Finally, Normalization and Advanced Contrast Enhancement are applied using Contrast Limited Adaptive Histogram Equalization (CLAHE), represented by the equation:
The equation outlines the final enhancement using Contrast Limited Adaptive Histogram Equalization (CLAHE).
is the normalized image, with pixel intensities scaled for uniform brightness.
prevents noise by clipping the histogram, and
divides the image into tiles for localized contrast adjustment.
, shows improved local contrast and clarity, aiding in accurate ice detection on power transmission lines. Figure 4 shows the block diagram of image enhancement.
Figure 4.
The block diagram of image enhancement.
Figure 4.
The block diagram of image enhancement.
2.1.2. Grayscale Conversion and Bilateral Filtering
The next stage, grayscale conversion and bilateral filtering, involves converting images to grayscale while preserving perceptual luminance using the following equation:
where R, G and B represent the red, green, and blue color components of the image, respectively. This formula computes the grayscale value as a weighted sum of the RGB components, with the weights (0.2126, 0.7152, 0.0722) reflecting the human eye’s varying sensitivity to different colors.
Dynamic parameter adjustment fine-tunes the bilateral filter based on image features to enhance edges and reduce noise. The filter smooths while preserving edges using spatial and range Gaussian functions. Here,
is the filtered intensity,
is the spatial neighborhood, then
and
represent distances and intensity differences, respectively. Parameters
and
control spatial and range smoothing, with
as the normalization factor.
Multi-scale bilateral filtering with adaptive guided filtering further preserves fine and coarse ice structures. The multi-scale decomposition is performed using:
In this context,
is the low-pass filtered image at scale
, obtained by convolving the image with a Gaussian kernel
. The convolution operation (*) smooths the image, while guided filtering refines it while preserving edges.
In this process,
is the refined image from the guided filter, which preserves edges using the guidance image
. Coefficients
and
are computed to minimize local differences between the input and output images. Multi-scale decomposition with Gaussian filtering is used to process the image at different resolutions, and guided filtering further refines it based on the guidance image. Finally, edge-aware weighting and multi-resolution analysis use the
Structural Similarity Index (SSIM) to ensure comprehensive enhancement:
In this context,
and
are the mean intensities of images
and
,
and
are their variances, and
is their covariance. Constants
and
stabilize the division. The Structural Similarity Index (SSIM) uses these parameters to measure image similarity based on luminance, contrast, and structure. Figure 5 shows the block diagram of grayscale conversion and bilateral filtering.
Figure 5.
The block diagram of grayscale conversion and bilateral filtering.
Figure 5.
The block diagram of grayscale conversion and bilateral filtering.
2.1.3. Thresholding and Segmentation
Thresholding and segmentation use multi-Otsu thresholding with spatial adaptation to compute thresholds that differentiate ice, transmission lines, and background. The method calculates multiple thresholds
and evaluates within-class variance to refine the segmentation.
Here,
is the class probability and
is the class variance. The goal is to minimize
to find optimal thresholds. Once thresholds are set, segmentation isolates potential ice regions.
where
and
.
is the pixel intensity at
. This method segments the image into regions based on these thresholds. Graph-based segmentation with geometric constraints involves constructing a graph representing the image and performing segmentation with geometric constraints for accurate delineation. Minimize the normalized cut:
The cut measures the total weight of edges separating segments
. For each segment
, it sums the weights
of edges connecting nodes within
to nodes outside
, defined as:
The association measures the total edge weight within each segment
relative to the entire graph
, summing
for edges connecting nodes in
to all other nodes in
.
where
and
are the intensities of nodes
and
, and
is a scaling parameter. This method builds a graph using pixel intensities and edge weights to reflect differences, then applies normalized cuts for segmentation while considering geometric constraints. Superpixel generation with contextual integration simplifies the segmentation process by generating superpixels that focus on areas with potential ice and integrate contextual information for efficient segmentation.
Superpixel Calculation:
where
,
,
are color space differences,
,
are spatial differences, and
and
are normalization factors. Contextual Similarity:
where are superpixels, is the contextual information, and is a threshold for similarity. Enhanced connectivity operations (Dilation, Closing) with topological analysis apply morphological operations to enhance connectivity in segmented regions, refining segmentation quality through topological analysis. Morphological Operations:
where
is the image,
is the structuring element,
denotes dilation, and
denotes erosion. Refined Segment:
where
ϵ is a size threshold to remove small segments. Figure 6 shows the block diagram of thresholding and segmentation.
Figure 6.
The block diagram of thresholding and segmentation.
Figure 6.
The block diagram of thresholding and segmentation.
2.1.4. Object Isolation and Validation
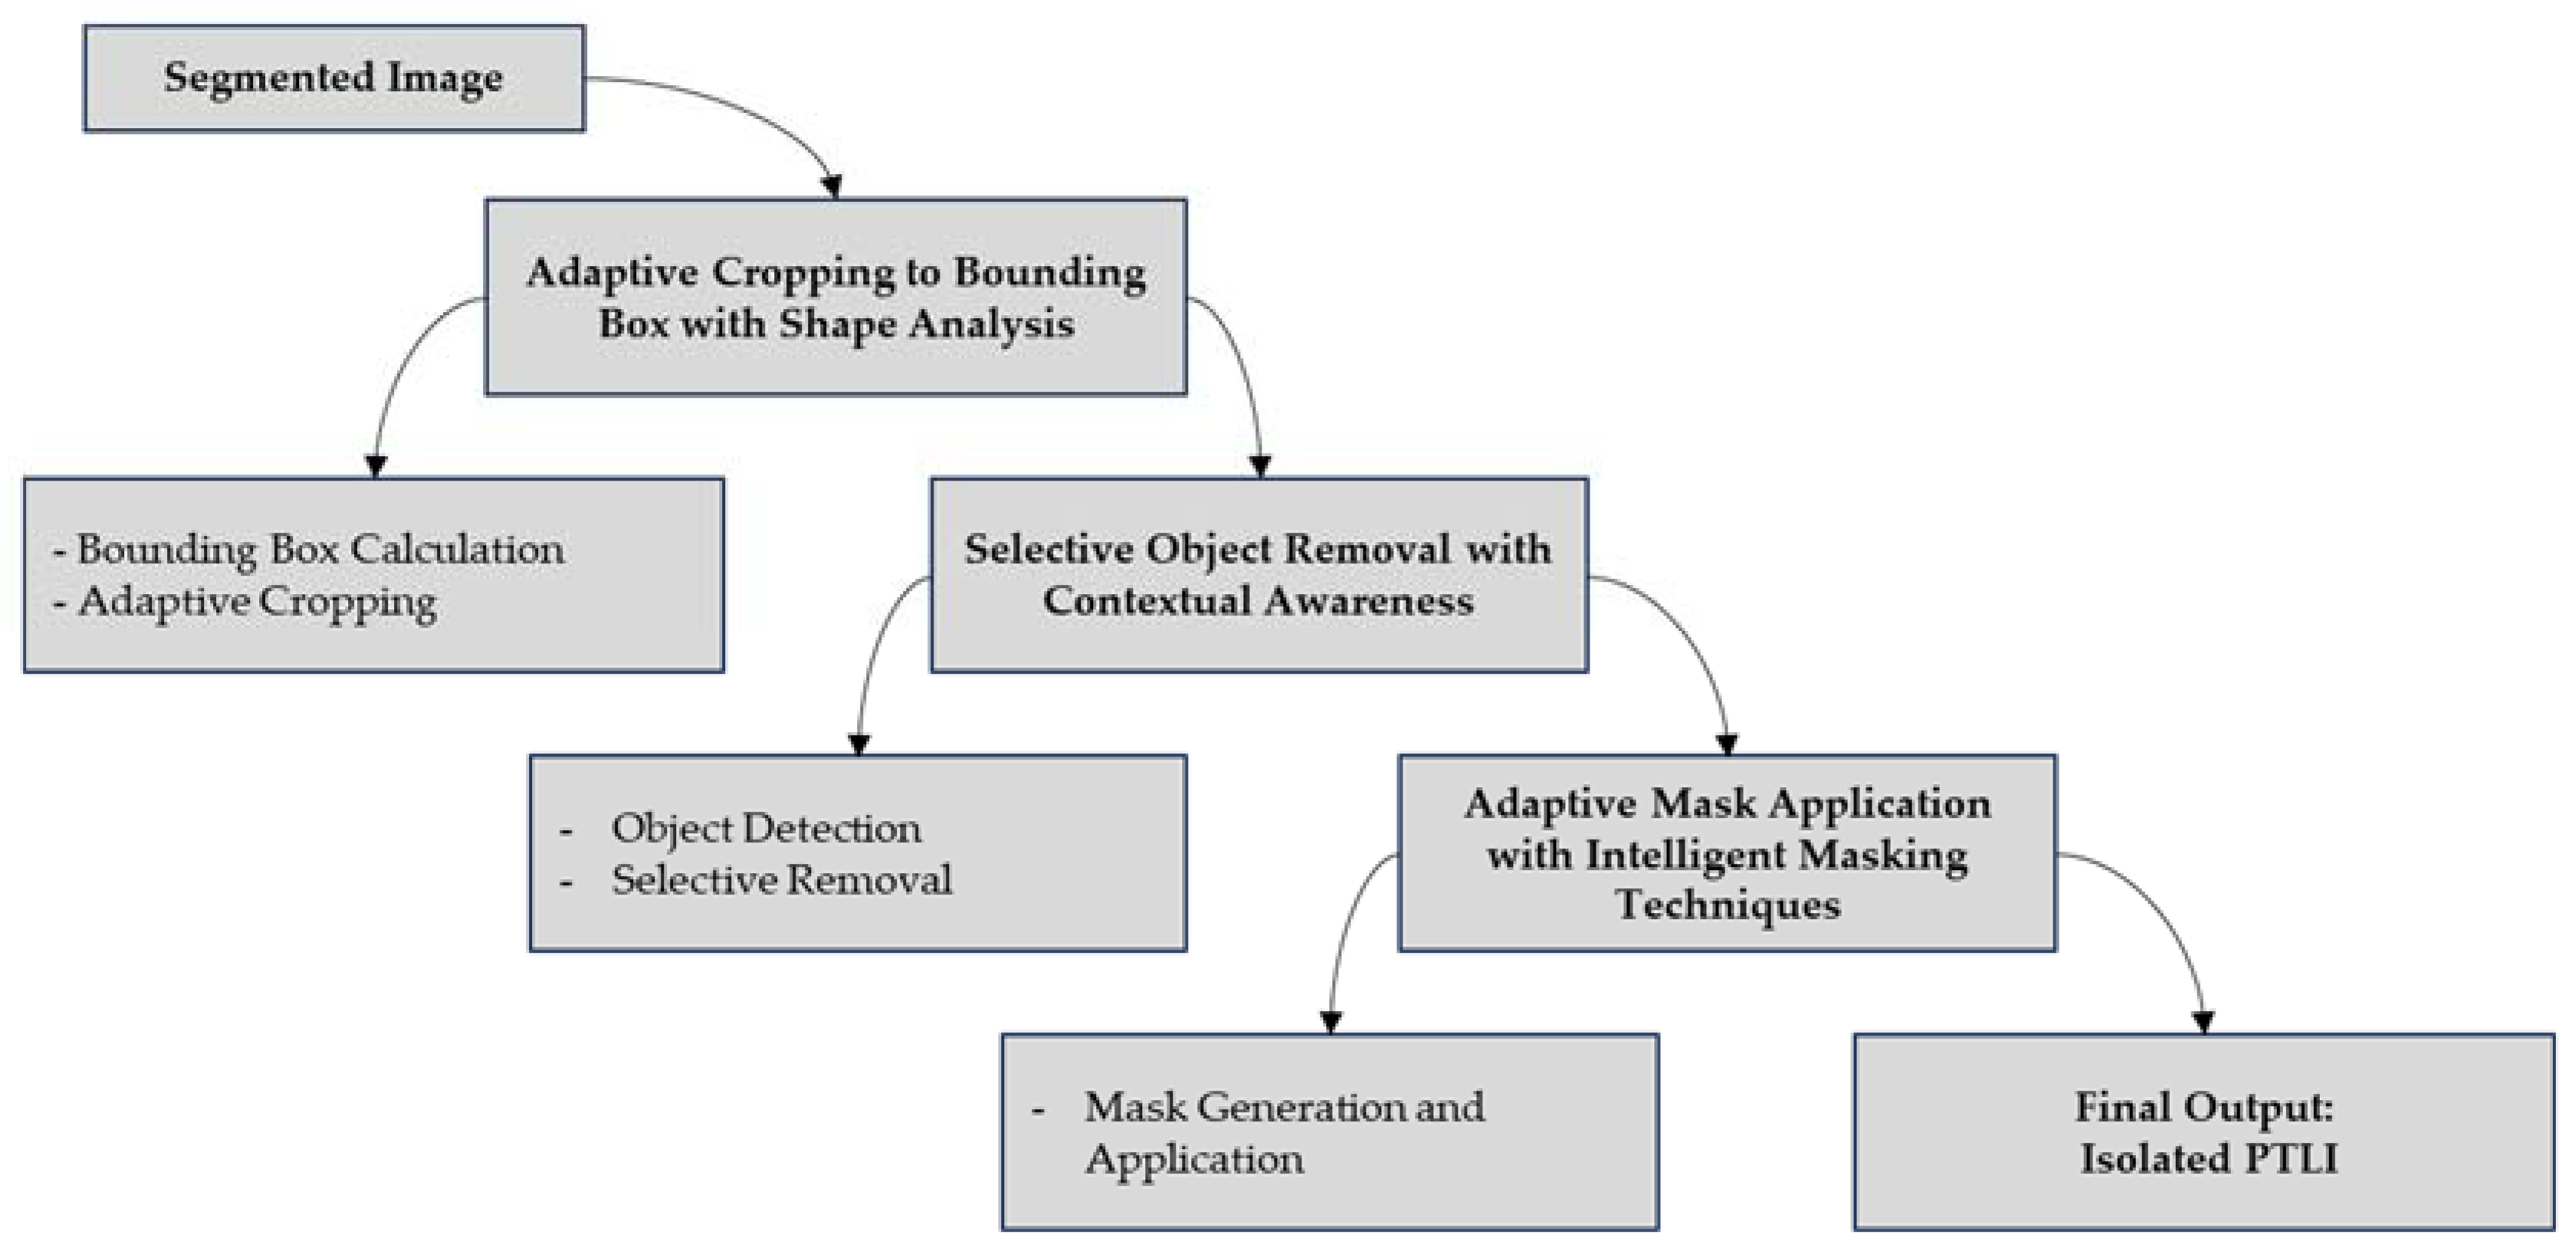
Object Isolation and validation involve several sophisticated techniques to ensure accurate identification and isolation of ice formations. Figure 7 shows the block diagram of object isolation and validation.
Figure 7.
The block diagram of object isolation and validation.
Figure 7.
The block diagram of object isolation and validation.
It begins with calculating bounding boxes around detected ice formations using shape analysis to guarantee precise identification. Bounding box calculation using shape analysis equation, let
be the region
in the segmented image.
Here, are the boundary pixel coordinates of region . The bounding box is a rectangle enclosing , defined by the min and max coordinates of these boundary pixels.
Adaptive cropping is applied to focus on areas containing identified ice formations, effectively removing unnecessary background elements. Adaptive cropping equation,
Here, is the original image, is the bounding box for the region of interest, and is the cropped image based on . The process isolates the relevant region from the original image by removing background elements.
To further refine the analysis, non-ice objects are detected using contextual awareness to understand their spatial relationships and significance, followed by their selective removal to isolate only the relevant ice regions. Object detection with contextual awareness equation,
Here,
is the set of objects for removal, and
determines if a region
should be removed based on context.
returns 1 to remove and 0 to keep each region.
In this process, is the image after removing unwanted objects from the cropped image , resulting in a clean image for further analysis.
Next, intelligent masking techniques are employed, where masks are generated adaptively to isolate ice formations accurately, considering their contours and characteristics:
In this context,
is a binary mask for object
, generated by the function
using parameters
. These masks are then applied to the images to enhance the visibility of ice formations, ensuring clear and distinct isolation from the background. Mask application equation:
In this context, is the image with isolated objects, where denotes the application of the mask to the image . Before masking, is the image with unwanted objects removed. The mask isolates desired objects, producing with clearly highlighted areas.
2.1.5. Edge Enhancement
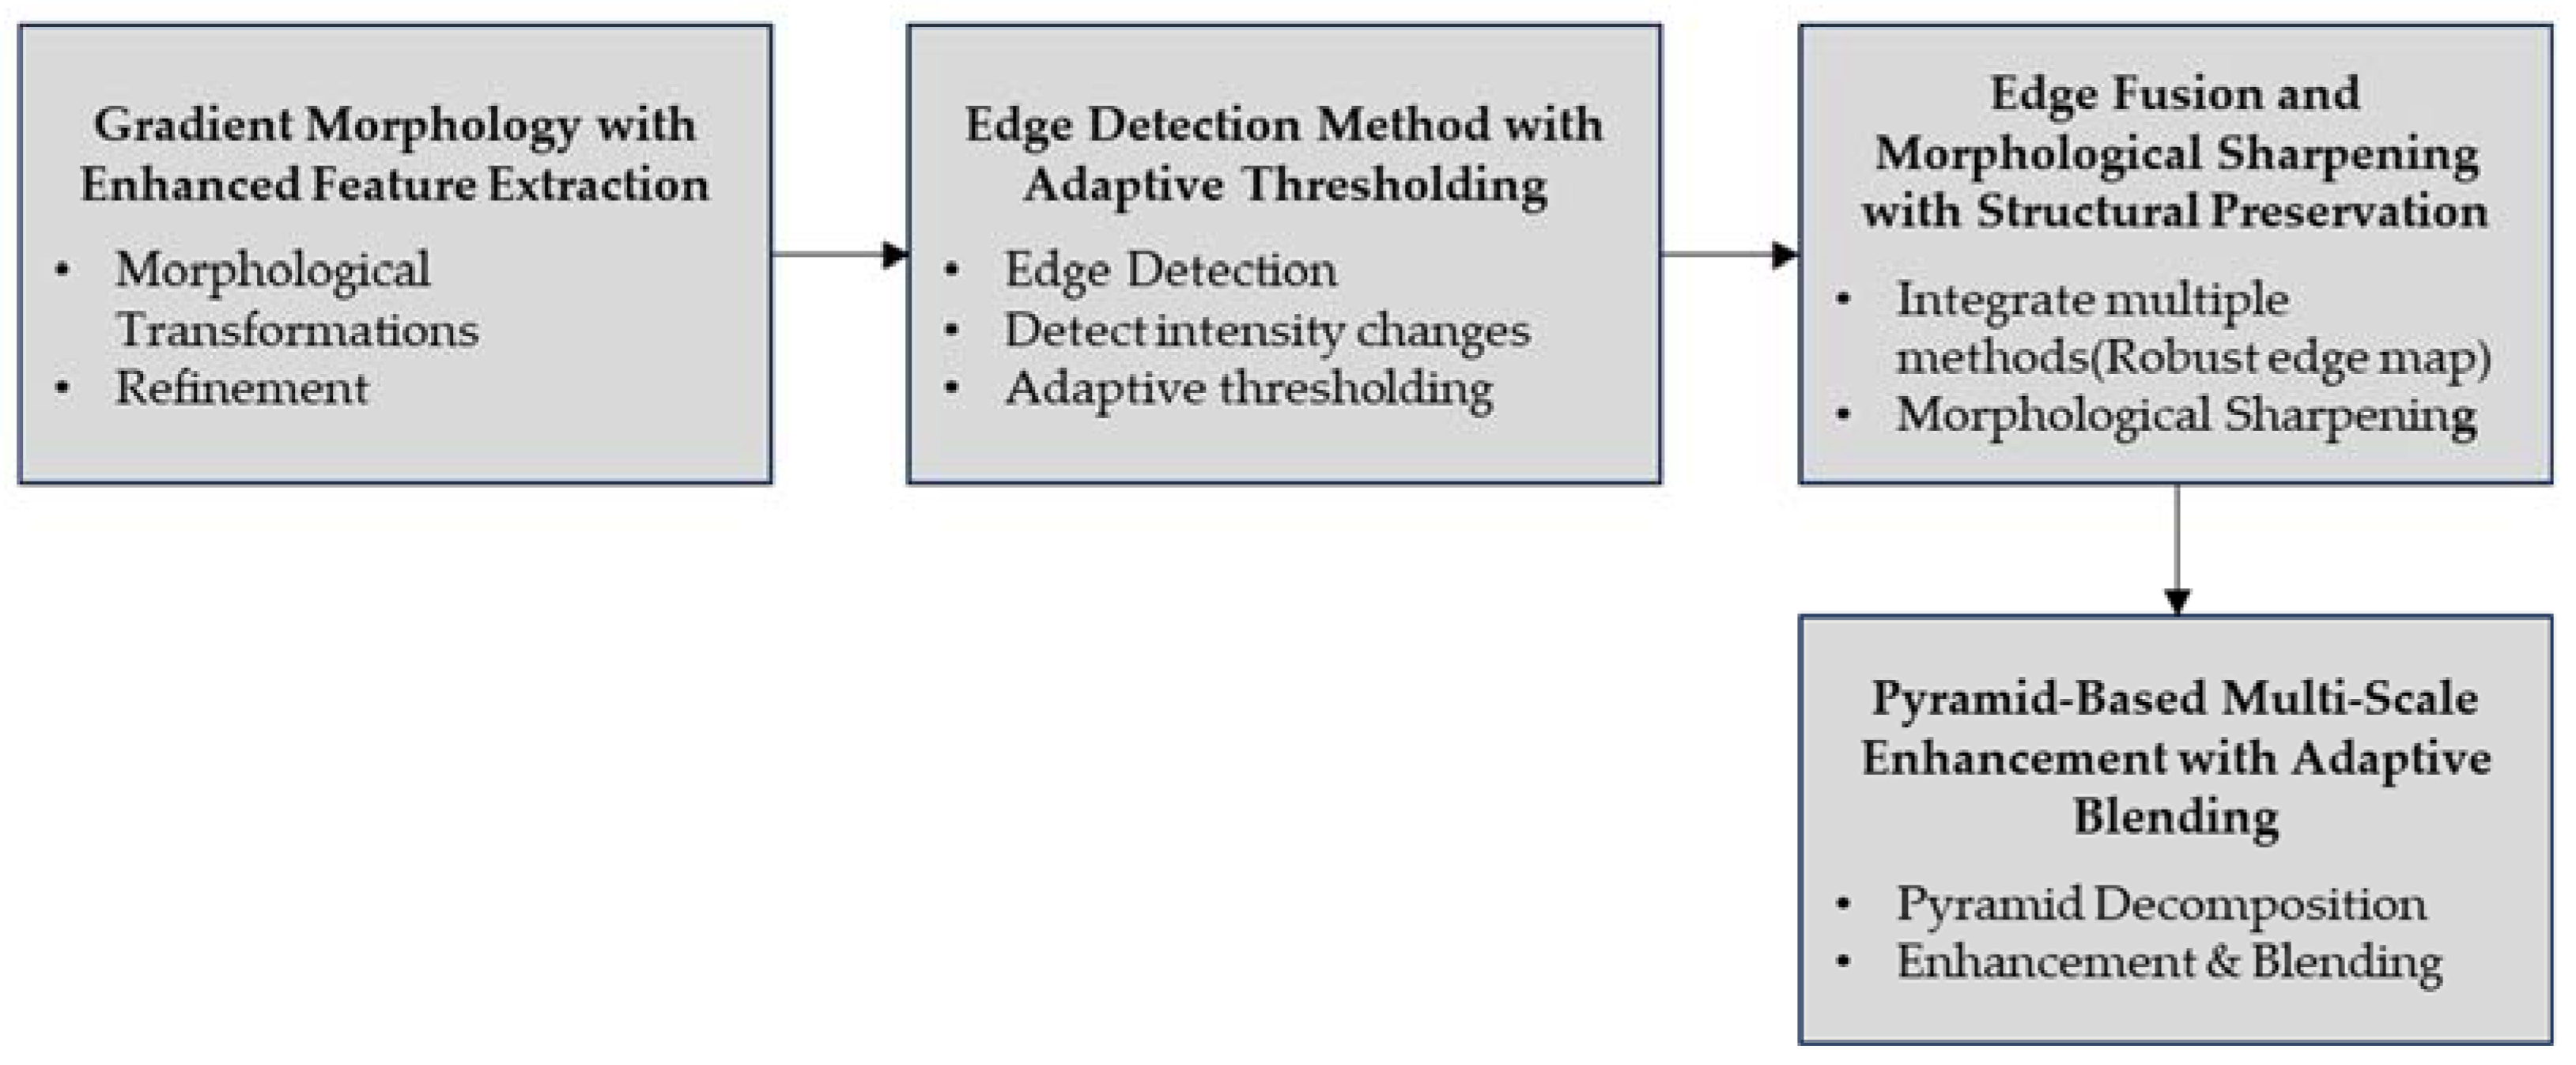
Gradient Morphology with enhanced feature extraction leverages mathematical morphology to process images based on shapes. Figure 8 shows the block diagram of edge enhancement.
Figure 8.
The block diagram of edge enhancement.
Figure 8.
The block diagram of edge enhancement.
This stage involves the refinement of detected edges by further sharpening and clarifying them, which includes smoothing and removing extraneous details to ensure well-defined edges and reduced noise.
Equation for gradient morphology:
is the gradient image derived from
. Morphological operations, dilation and erosion, adjust image structure: dilation
expands the boundaries of regions of interest within the image, while erosion shrinks these regions. The edge detection method with adaptive thresholding employs gradient calculation, non-maximum suppression, and edge tracking by hysteresis to detect a wide range of edges with minimal noise.
Equation for refinement:
In image processing, is the refined edge map, obtained by applying non-maximum suppression () to to thin edges, and edge tracking by hysteresis , to link and preserve significant edges.
Combining Canny and Laplacian methods ensures comprehensive edge detection and adaptive thresholding dynamically adjusts threshold values based on local image characteristics, maintaining accurate edge detection without losing essential details or introducing excessive noise.
Equation adaptive thresholding:
is the combined edge map formed by integrating
from the Canny method and
from the Laplacian method using adaptive thresholding
. This method dynamically adjusts thresholds to capture significant edges while minimizing noise. Edge Fusion and morphological sharpening with structural preservation integrate edges detected from multiple methods to create a robust edge map, compensating for each method’s weaknesses and applying dilation and erosion to sharpen edges while preserving structural integrity, thus enhancing clarity and definition without introducing artifacts. Equation for
morphological sharpening:
is the fused edge map combining various detection methods. It is then refined to produce
, the sharpened edge map. Pyramid-based multi-scale enhancement with adaptive blending involves decomposing the image into a pyramid of multiple scales, allowing for detailed analysis and enhancement at various resolutions. Scale-specific techniques such as contrast adjustment, sharpening, and noise reduction are applied at each pyramid level, and adaptive blending combines these enhancements smoothly, maximizing overall visual quality and detail. Equation for
adaptive blending:
In multi-scale image enhancement, denotes the enhanced image at scale after applying techniques like contrast adjustment and sharpening. These images are combined using blending weights to create , the final enhanced image, ensuring optimal visual quality.
2.1.6. Line Detection
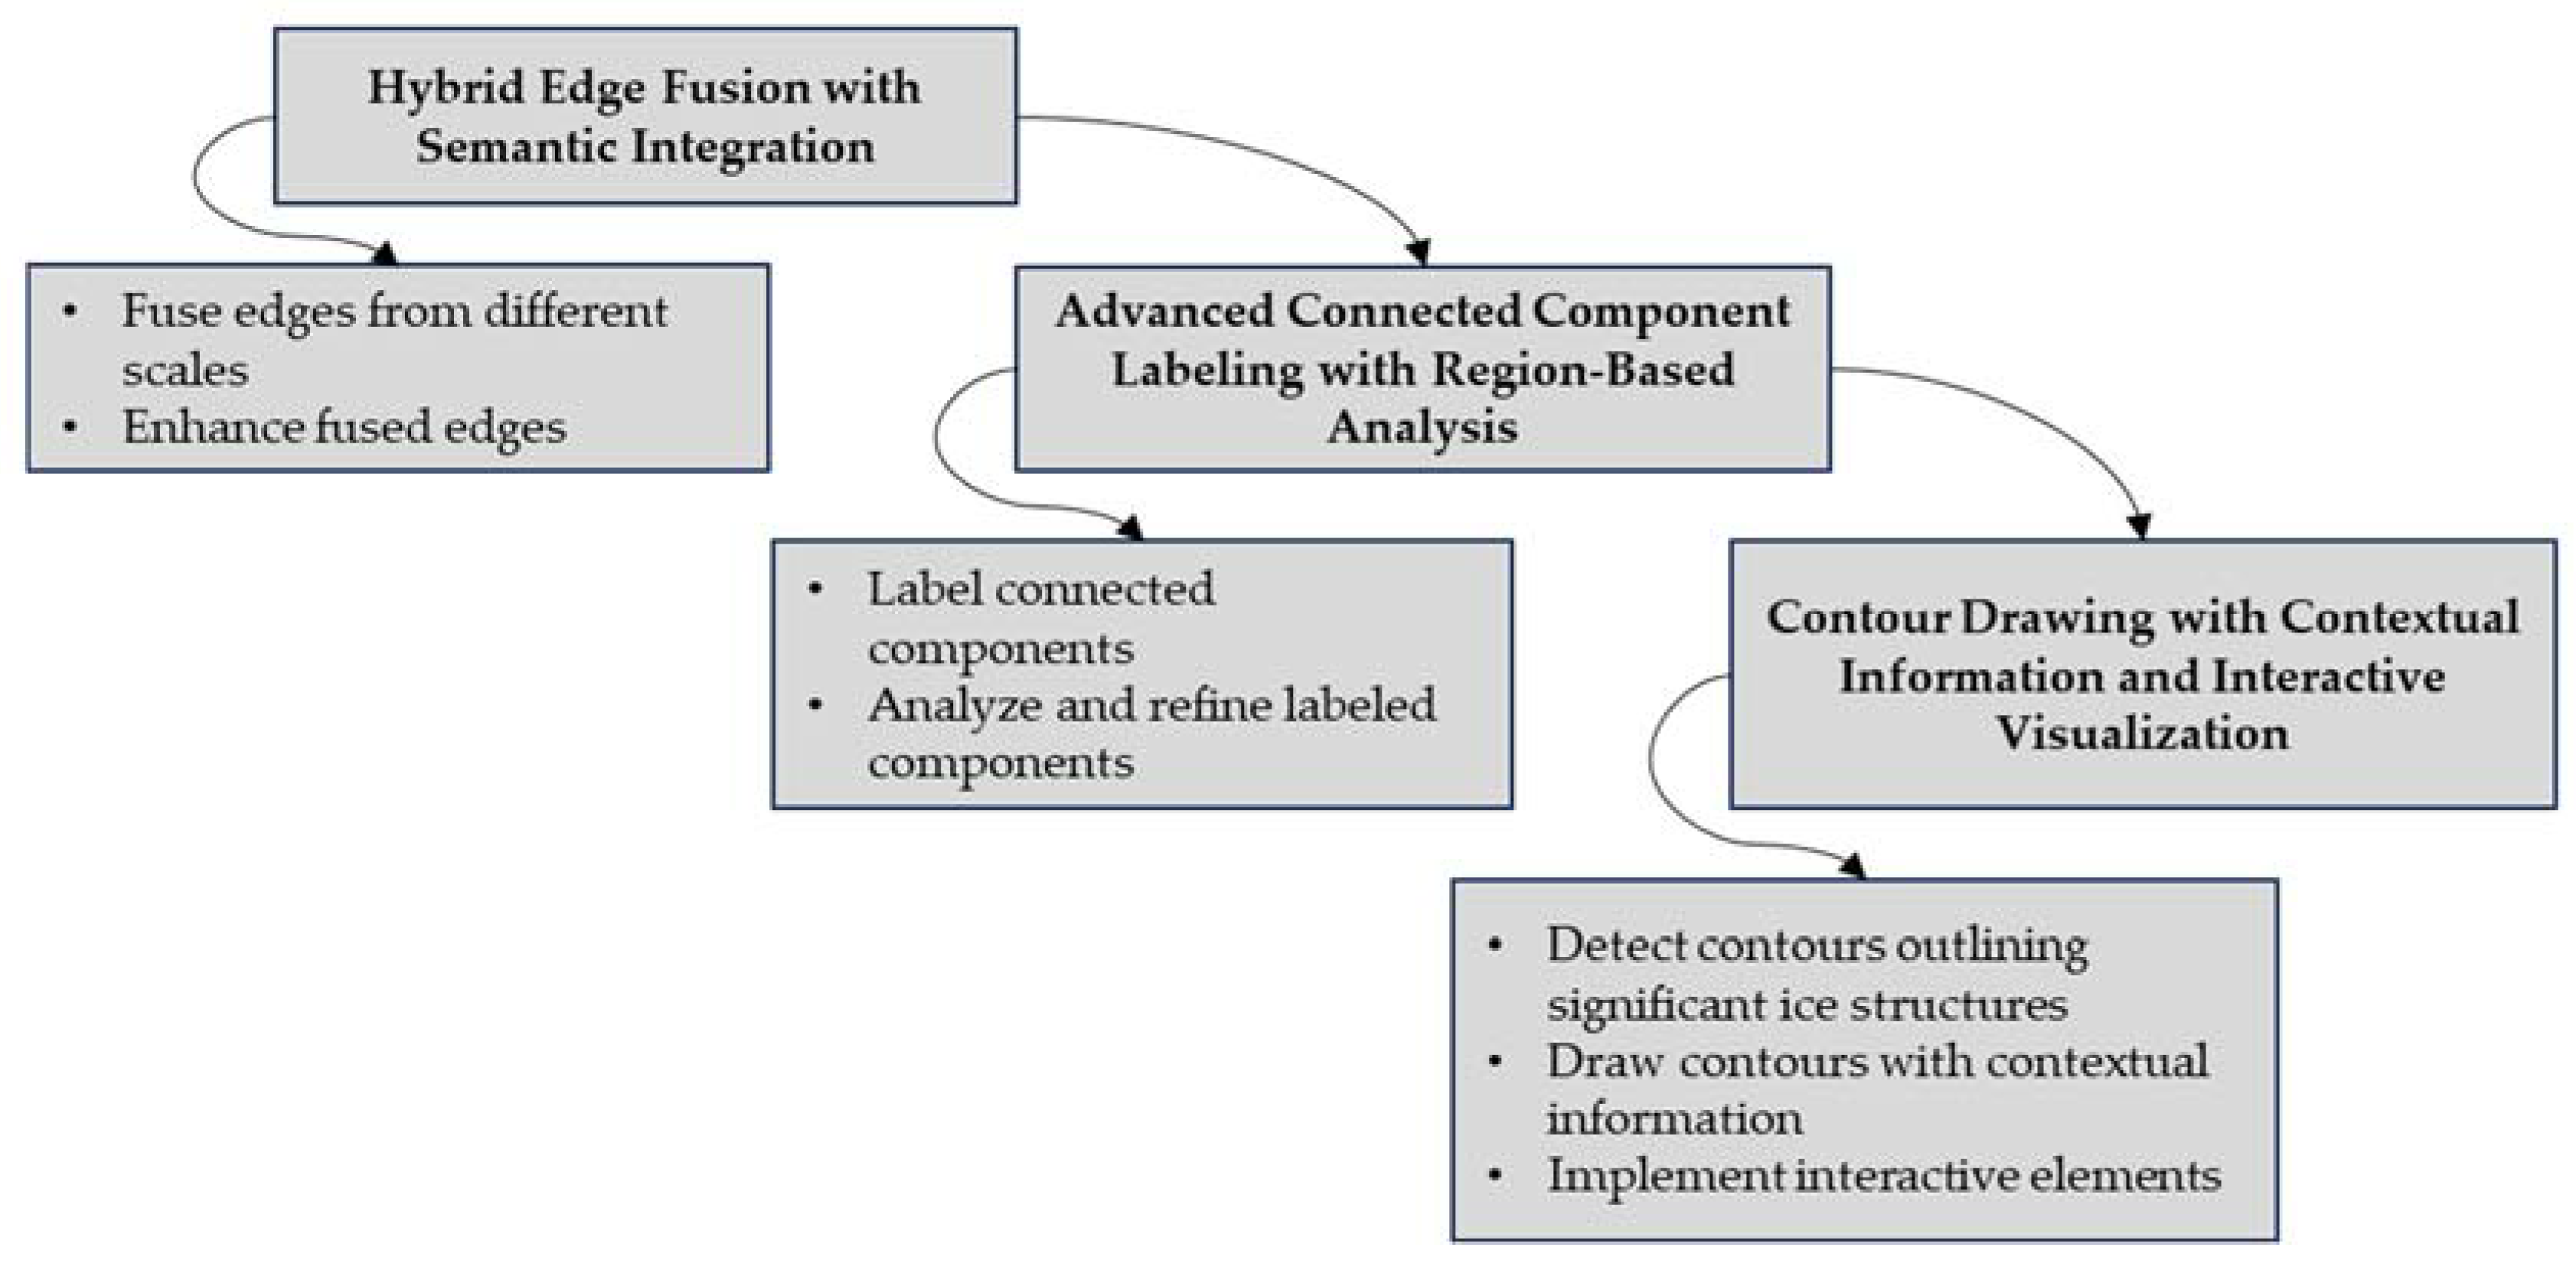
The final stage, line detection on the top and bottom lines of PTLI, begins with hybrid edge fusion with semantic edge integration to fuse edges from different scales and methods into a comprehensive edge map, enhancing them with semantic integration. Figure 9 shows the block diagram of line detection
Figure 9.
The block diagram of line detection.
Figure 9.
The block diagram of line detection.
Equation for semantic enhancement:
In ice detection,
is the fused edge map combining multiple scales and methods. This is enhanced to
using a semantic factor
to highlight and accurately represent ice-related edges. Advanced connected component labeling with region-based analysis labels connected components in the edge map, identifying distinct ice regions and refining them using region-based techniques. Equation for connected component labeling:
In connected component analysis,
labels each pixel for its connected component,
indicates the presence of the
component, and
represents the total number of detected components. Contour drawing detects and outlines significant ice structures with contextual details and interactive features. Final post-processing enhances image quality and smooths out artifacts. Equation for interactive visualization:
In ice structure analysis, denotes contour points of significant formations. The interactive visualization , combines these contours with contextual data using function , enhancing interpretability and exploration of the ice structures.
3. Results and Discussion
In this research, a novel method for power transmission line icing identification is introduced, leveraging a comprehensive, multi-stage image processing approach designed for high accuracy and reliability. The methodology is structured into six meticulously crafted stages, through which visual data are enhanced, analyzed, and interpreted with precision, enabling the accurate detection and isolation of ice formations on power transmission lines. Addressing the challenges posed by varying environmental conditions ensures robust performance across diverse scenarios. The findings from the Enhanced Image Segmentation and Edge Detection application, using Improved Multi-Scale Retinex and Advanced Morphological Operations, underscore the method’s effectiveness in enhancing image clarity, segmenting relevant regions, and accurately identifying icing, even under challenging conditions.
3.1. Individual Stage Performance in PTLI Identification
3.1.1. Image Enhancement Performance
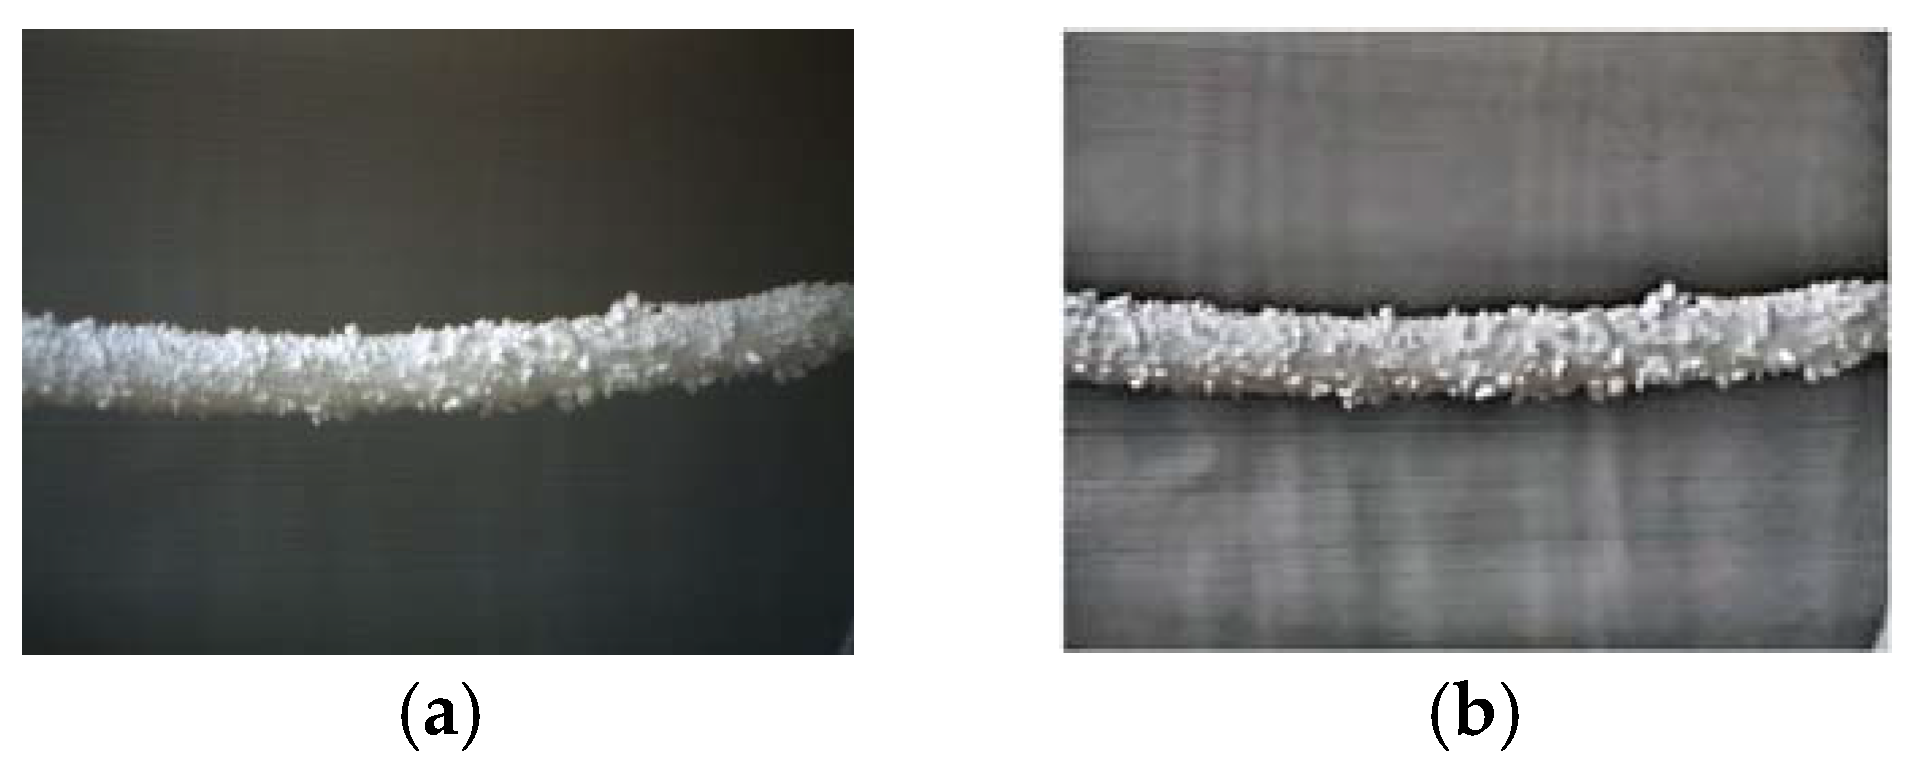
The Image Enhancement Performance section assesses the effectiveness of techniques used to improve the visual clarity of power transmission lines amid potential ice formations. The multi-stage enhancement process, including noise reduction, contrast adjustment, and color restoration, is crucial for making ice more distinguishable from transmission lines. Advanced methods like Multi-Scale Adaptive Retinex and Non-Linear Color Restoration significantly improve image quality, preparing it for further processing. The results highlight the importance of these techniques in achieving precise ice identification under various conditions, with enhanced images showing improved contrast and detail, especially in ice-affected areas. Figure 10 shows the original image and the enhanced.
Figure 10 demonstrates the significant improvements achieved through multi-scale adaptive Retinex and non-linear color restoration, which enhance visibility, contrast, and detail in areas with potential ice accumulation. The enhanced image reveals finer details and makes ice detection more straightforward, ensuring that subtle differences indicative of ice is not overlooked, particularly in poorly lit or low-contrast regions. This enhancement is crucial for accurate ice identification and effective subsequent analysis.
Figure 10.
The enhanced image using Multi-Scale Adaptive Retinex and Non-Linear Color Restoration method: (a) The original image; (b) The enhanced image.
Figure 10.
The enhanced image using Multi-Scale Adaptive Retinex and Non-Linear Color Restoration method: (a) The original image; (b) The enhanced image.
3.1.2. Grayscale Conversion and Bilateral Filtering Performance
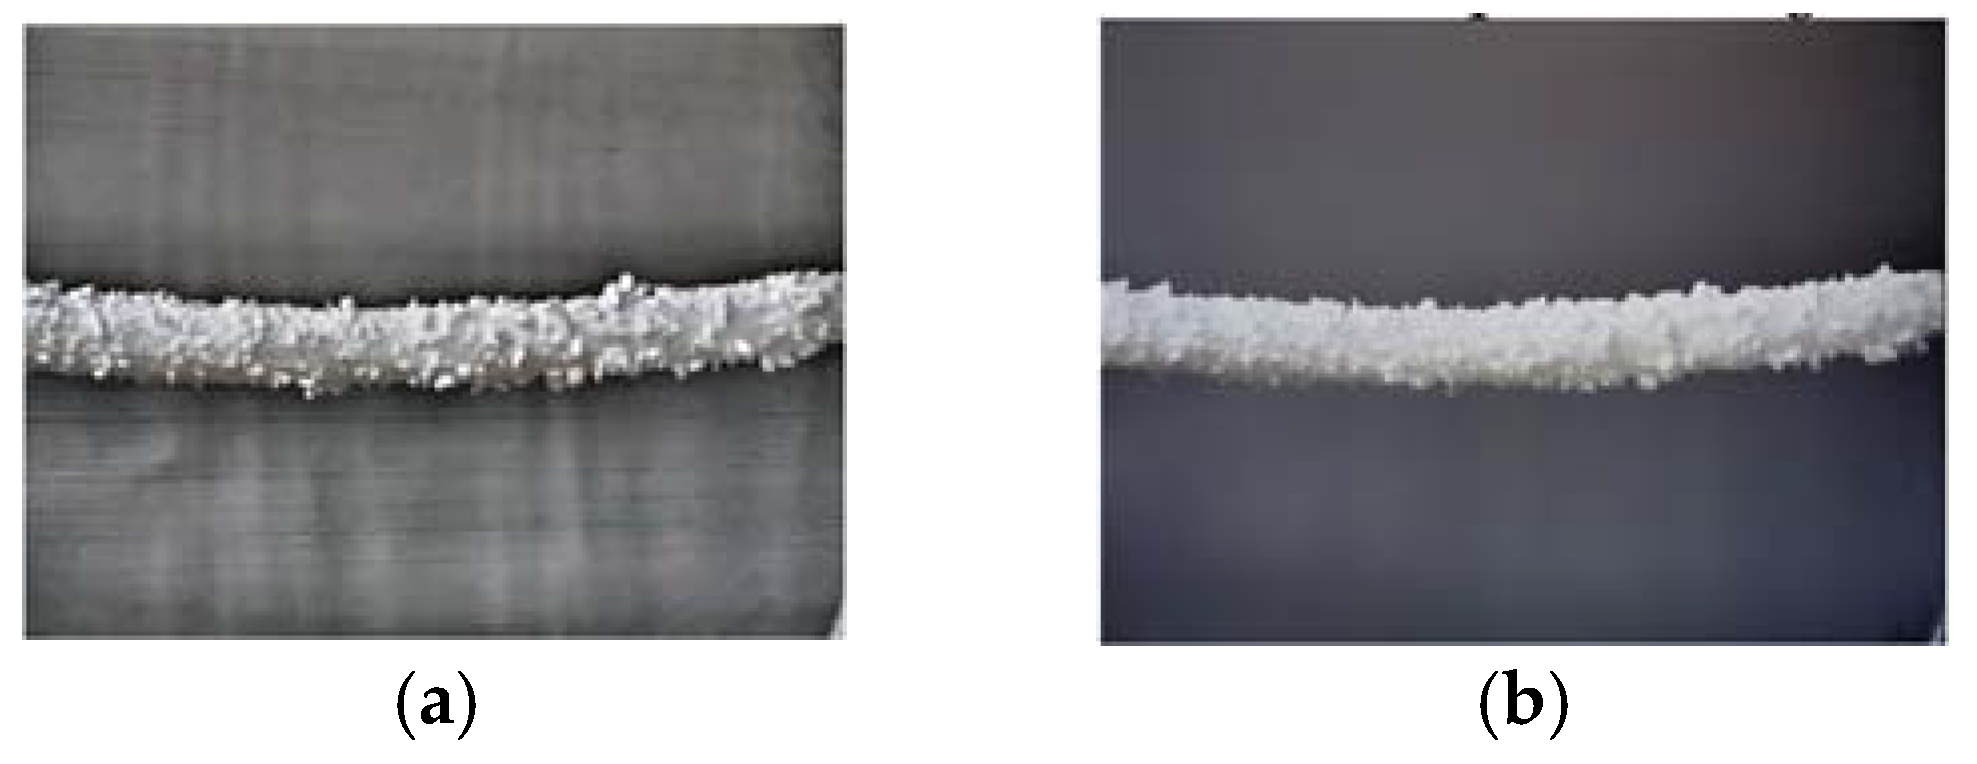
The grayscale conversion and bilateral filtering process is crucial in the image analysis pipeline, transforming color images into grayscale while preserving essential details, such as the contrast between power lines and ice formations. Bilateral filtering further refines this conversion by reducing noise while maintaining edge details. This approach ensures accurate isolation and identification of ice in subsequent analysis stages. Figure 11 illustrates how this process effectively preserves edges and reduces noise.
Figure 11 illustrates the effectiveness of combining Multi-Scale Adaptive Retinex and non-linear color restoration with perceptual grayscale conversion and multi-scale bilateral filtering. The enhanced image (Figure 11a) improves visibility of transmission lines and ice formations under various lighting conditions, while the grayscale conversion and bilateral filtering 11b) preserve essential contrast, reduce noise, and maintain sharp edges. This process is crucial for accurate segmentation and reliable analysis, particularly in complex environments, by retaining important structural details for precise ice identification in subsequent stages.
Figure 11.
The perceptual grayscale conversion with context-aware multi-scale bilateral filtering: (a) The enhanced image; (b) The filtered image.
Figure 11.
The perceptual grayscale conversion with context-aware multi-scale bilateral filtering: (a) The enhanced image; (b) The filtered image.
3.1.3. Thresholding and Segmentation Performance
Thresholding and segmentation are crucial for identifying ice formations on power transmission lines, transitioning from enhanced image data to precise delineation of regions of interest. Advanced techniques like Multi Otsu Thresholding are used to differentiate between ice, transmission lines, and the background, effectively isolating ice even under varying conditions. This process is further refined through graph-based segmentation, ensuring accurate boundary delineation. The combination of these techniques enhances the clarity of ice regions and lays the groundwork for further analysis stages. Figures 12(a) and 12(b) display the results of adaptive and multi-Otsu thresholding, while Figure 12(c) illustrates the proposed method.
Figure 12.
The multi-scale adaptive thresholding and graph-based segmentation with contextual superpixel refinement result: (a) The adaptive thresholding; (b) The multi-Otsu thresholding; (c) The proposed method.
Figure 12.
The multi-scale adaptive thresholding and graph-based segmentation with contextual superpixel refinement result: (a) The adaptive thresholding; (b) The multi-Otsu thresholding; (c) The proposed method.
Figure 12 illustrates the comparative effectiveness of three segmentation methods for detecting ice on power transmission lines. In Figure 12(a), adaptive thresholding is applied, which, while locally adjusting thresholds, sometimes blurs the boundaries between ice and transmission lines, leading to potential segmentation inaccuracies. Figure 12(b) shows the multi-Otsu thresholding approach, which sets multiple thresholds to better distinguish ice from other elements but struggles with incomplete segmentation in areas with overlapping intensities. Finally, Figure 12(c) presents the proposed method, which combines multi-scale adaptive thresholding and graph-based segmentation with contextual superpixel refinement. This approach addresses the limitations of the previous methods, offering a more accurate and comprehensive delineation of ice formations and transmission lines, making it the most effective method among the three.
3.1.4. Object Isolation and Validation Performance
The object isolation and validation stage refine the segmentation results by precisely isolating and validating ice formations on power transmission lines. This process uses adaptive cropping to focus on detected ice regions, selectively removes non-ice elements, and employs adaptive masking to enhance visibility. By ensuring that only relevant areas are analyzed, this stage produces a reliable dataset for further analysis.
Figure 13 demonstrates this method’s effectiveness by cropping the image to the bounding box around the largest segmented region. Figure 13 underscores the importance of image segmentation and object isolation in improving ice detection accuracy on power transmission lines. Initially, segmentation identifies the largest potential ice formation, but it can include irrelevant objects. The object removal step effectively eliminates non-ice elements, reducing false positives and enhancing clarity. Cropping the image to focus on the area of interest further reduces computational load and increases detection accuracy, making the icing identification method more reliable.
Figure 13.
The precise object isolation and validation through adaptive bounding box cropping and context-aware intelligent masking: (a) The segmentation image; (b) The object isolation.
Figure 13.
The precise object isolation and validation through adaptive bounding box cropping and context-aware intelligent masking: (a) The segmentation image; (b) The object isolation.
3.1.5. Edge Enhancement Performance
The edge enhancement stage is crucial for improving the visual clarity of ice formations on power transmission lines by sharpening their boundaries and making them distinct from surrounding elements. This is achieved through a combination of gradient morphology, advanced feature extraction, and Canny-Laplacian edge detection methods, which are further refined by adaptive thresholding. The resulting edge map effectively captures intricate ice details, while fusion and morphological sharpening preserve transmission line structures. As demonstrated in Figure 14, this process significantly enhances the precision of ice formation edges, ensuring accurate identification and analysis for power line maintenance.
Figure 14.
The adaptive multi-scale gradient morphology for edge enhancement with canny laplacian fusion and sharpening: (a) The object isolation; (b) The edge detection.
Figure 14.
The adaptive multi-scale gradient morphology for edge enhancement with canny laplacian fusion and sharpening: (a) The object isolation; (b) The edge detection.
Figure 14 demonstrates the effectiveness of the adaptive multi-scale gradient morphology combined with Canny-Laplacian fusion and sharpening for edge enhancement in detecting ice on power transmission lines. Figure 14(a) shows the successful isolation of objects, setting the stage for detailed edge enhancement. Figure 14(b) highlights how the proposed method produces a sharp and detailed edge map, with gradient morphology refining significant transitions and minimizing minor artifacts. The fusion of Canny and Laplacian edge detection methods captures both fine and broad ice boundaries effectively. The sharpening process further refines these edges, providing a precise and visually distinct representation of ice formations.
3.1.6. Line Detection Performance
The final stage focuses on accurately identifying the top and bottom boundaries of ice formations on power transmission lines, crucial for 3D ice thickness measurements. Using multi-scale edge detection and visualization techniques, a comprehensive edge map is generated, capturing fine and coarse details. Hybrid edge fusion, semantic edge detection, and connected component labeling refine the results, distinguishing distinct ice regions. Contour detection and interactive visualization further enhance the clarity and exploration of the findings. This approach ensures precise representation of ice impact, providing actionable insights into ice thickness and distribution. Figure 15 shows these line detection results.
Figure 14.
The results of line detection achieved through comprehensive multi-scale edge detection and visualization with semantic enhancement: (a) The edge detection; (b) The line detection.
Figure 14.
The results of line detection achieved through comprehensive multi-scale edge detection and visualization with semantic enhancement: (a) The edge detection; (b) The line detection.
The results demonstrate the effectiveness of integrating multi-scale edge detection and visualization techniques with semantic enhancement for accurately identifying ice formations on power transmission lines. This approach significantly improves the detection and delineation of the upper and lower boundaries of the ice layer, essential for precise 3D thickness measurements. Figure 14(b) shows the final edge-detected image, where connected component labeling effectively distinguishes these regions. The use of yellow for the top line and cyan for the bottom line enhances visual clarity, aiding in the assessment of ice extent and distribution. The combination of multi-scale edge detection and hybrid edge fusion captures fine and coarse details, ensuring clearly defined boundaries for reliable analysis.
3.2. Quantitative Evaluation
The effectiveness of the PTLI identification methodology relies heavily on its segmentation process, which includes image enhancement, filtering, and thresholding. Accurate segmentation is crucial for determining the shape and edges of ice formations, impacting the precision of ice thickness measurements. The method’s performance is rigorously evaluated using metrics like accuracy, precision, sensitivity/recall, and specificity. Two evaluation methods are employed: one assesses each stage (image enhancement, filtering, and segmentation) individually, while the other evaluates the overall PTLI identification scheme using comprehensive metrics. This dual approach ensures a thorough assessment of both individual components and the integrated system’s effectiveness and reliability.
Table 1 summarizes the evaluation metrics used.
The table is a confusion matrix used to evaluate the performance of the power transmission line icing (PTLI) identification method. This matrix compares the model’s predictions with the actual, real-world conditions, known as ground truth, to assess its accuracy. It categorizes predictions as either PTLI (indicating the presence of icing) or Not PTLI (indicating the absence of icing). By analyzing this matrix, the effectiveness of the method in correctly identifying the presence or absence of icing on power transmission lines can be determined, providing insights into its overall reliability and precision.
The table categorizes the outcomes of the method’s predictions compared to the ground truth into four types:
True Positive (TP): The method correctly identifies the presence of icing (PTLI).
True Negative (TN): The method correctly identifies the absence of icing (Not PTLI).
False Positive (FP): The method incorrectly predicts icing when there is none.
False Negative (FN): The method fails to detect icing when it is actually present.
The counts of True Positives (TP), True Negatives (TN), False Positives (FP), and False Negatives (FN) are used to calculate key performance metrics like accuracy, precision, recall, and specificity. These metrics quantify the effectiveness of the PTLI identification method: accuracy measures overall correctness, sensitivity evaluates the method’s ability to identify actual ice formations, precision assesses the accuracy of positive predictions, and specificity indicates how well the method distinguishes between ice and non-ice regions. Together, these metrics provide a comprehensive evaluation of the method’s performance.
These evaluation metrics collectively provide a comprehensive assessment of the PTLI identification scheme’s performance, ensuring that the detection and isolation of ice formations are accurately measured.
3.2.1. Performance Evaluation Through Quantitative Metrics for Each Stage
The performance of each stage in the proposed PTLI identification scheme is rigorously evaluated using sensitivity validation metrics, which measure the method’s ability to correctly identify actual ice formations (true positives). Seven distinct methods were tested to assess the robustness of the integration between image processing stages, including image enhancement (E), filtering, thresholding (F), and multi-threshold segmentation (M-S). These methods include:
PTLI identification using image enhancement, filtering, and multi-threshold segmentation;
PTLI identification using image enhancement and multi-threshold segmentation;
PTLI identification using multi-threshold segmentation alone;
PTLI identification using filtering and multi-threshold segmentation;
PTLI identification using image enhancement and filtering;
PTLI identification using filtering alone, and
PTLI identification using image enhancement alone.
The method’s effectiveness was tested using the sensitivity formula on 30 randomly selected PTLI images to analyze each stage of the identification process.
Table 2 shows the sensitivity results for image enhancement, filtering, and multi-threshold segmentation, providing values and percentages that illustrate the effectiveness of these processes in PTLI identification.
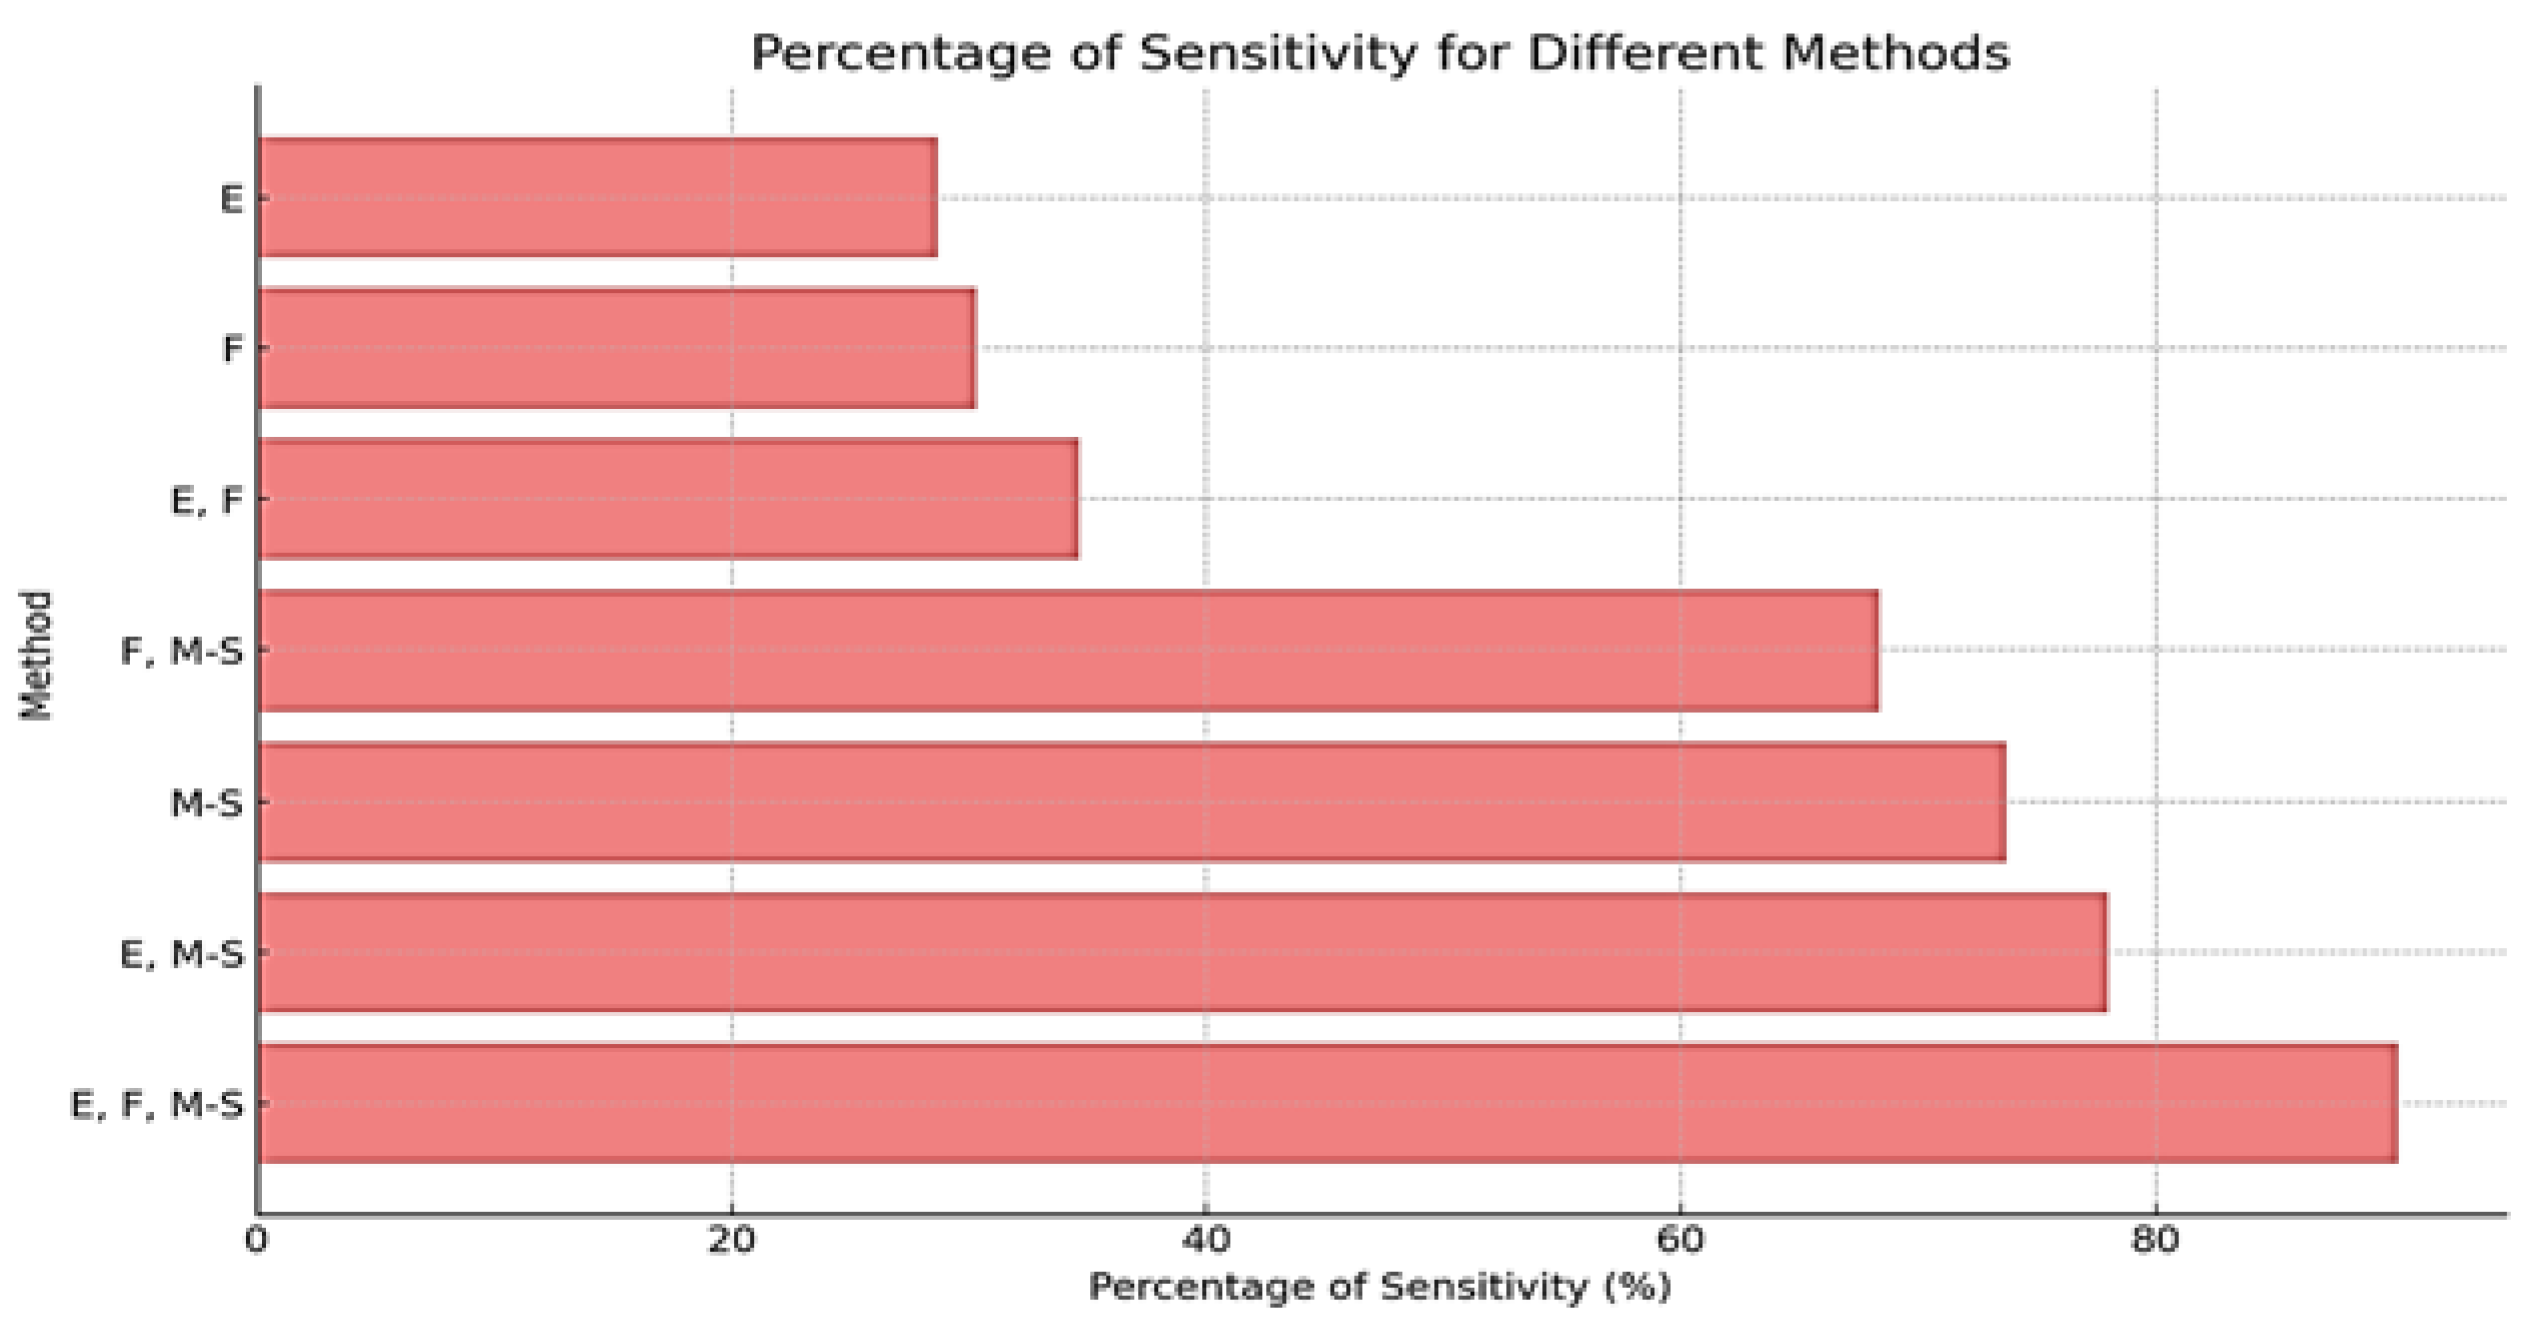
Table 2 shows the sensitivity validation results for different image processing methods in PTLI identification. The method combining image enhancement, filtering, and multi-threshold segmentation achieved the highest sensitivity at 90.18%, proving highly effective in accurately identifying ice formations. Methods that excluded filtering or image enhancement had lower sensitivities (77.98% and 73.69%, respectively), indicating their importance in the process. The absence of multi-threshold segmentation led to even lower sensitivities, underscoring the crucial role of segmentation in accurate ice detection.
Figure 15 shows the sensitivity percentages for different methods, highlighting that the highest sensitivity (90.18%) is achieved when combining image enhancement (E), filtering (F), and multi-threshold segmentation (M-S). Individual methods like E and F have lower sensitivity levels. Figure 16 provides an example of segmentation results from a system that doesn’t integrate all three methods, illustrating the reduced effectiveness without their combination.
Figure 15.
The Percentage of sensitivity for different methods.
Figure 15.
The Percentage of sensitivity for different methods.
Figure 16 illustrates the segmentation results of a system that lacks the integration of image enhancement, filtering, and multi-threshold segmentation. The cyan area shows true positives, where icing is correctly detected, while magenta indicates false positives, and yellow represents false negatives. The black area denotes true negatives. This analysis reveals the system’s limitations in accurately distinguishing between icing and non-icing areas without the full integration of all three methods. It underscores the importance of a multi-stage (enhancement, filter and multi-thresholding) approach for maximizing sensitivity and accuracy in PTLI identification, highlighting that omitting any stage reduces overall effectiveness.
Figure 16.
The example of segmentation results of a system that does not integrate the three methods: (a) Enhancement and multi-thresholding; (b) multi-thresholding; (c) Filter and multi-thresholding; (d) Enhancement, filter and multi-thresholding.
Figure 16.
The example of segmentation results of a system that does not integrate the three methods: (a) Enhancement and multi-thresholding; (b) multi-thresholding; (c) Filter and multi-thresholding; (d) Enhancement, filter and multi-thresholding.
3.2.2. Quantitative Evaluation of PTLI Identification Scheme Performance
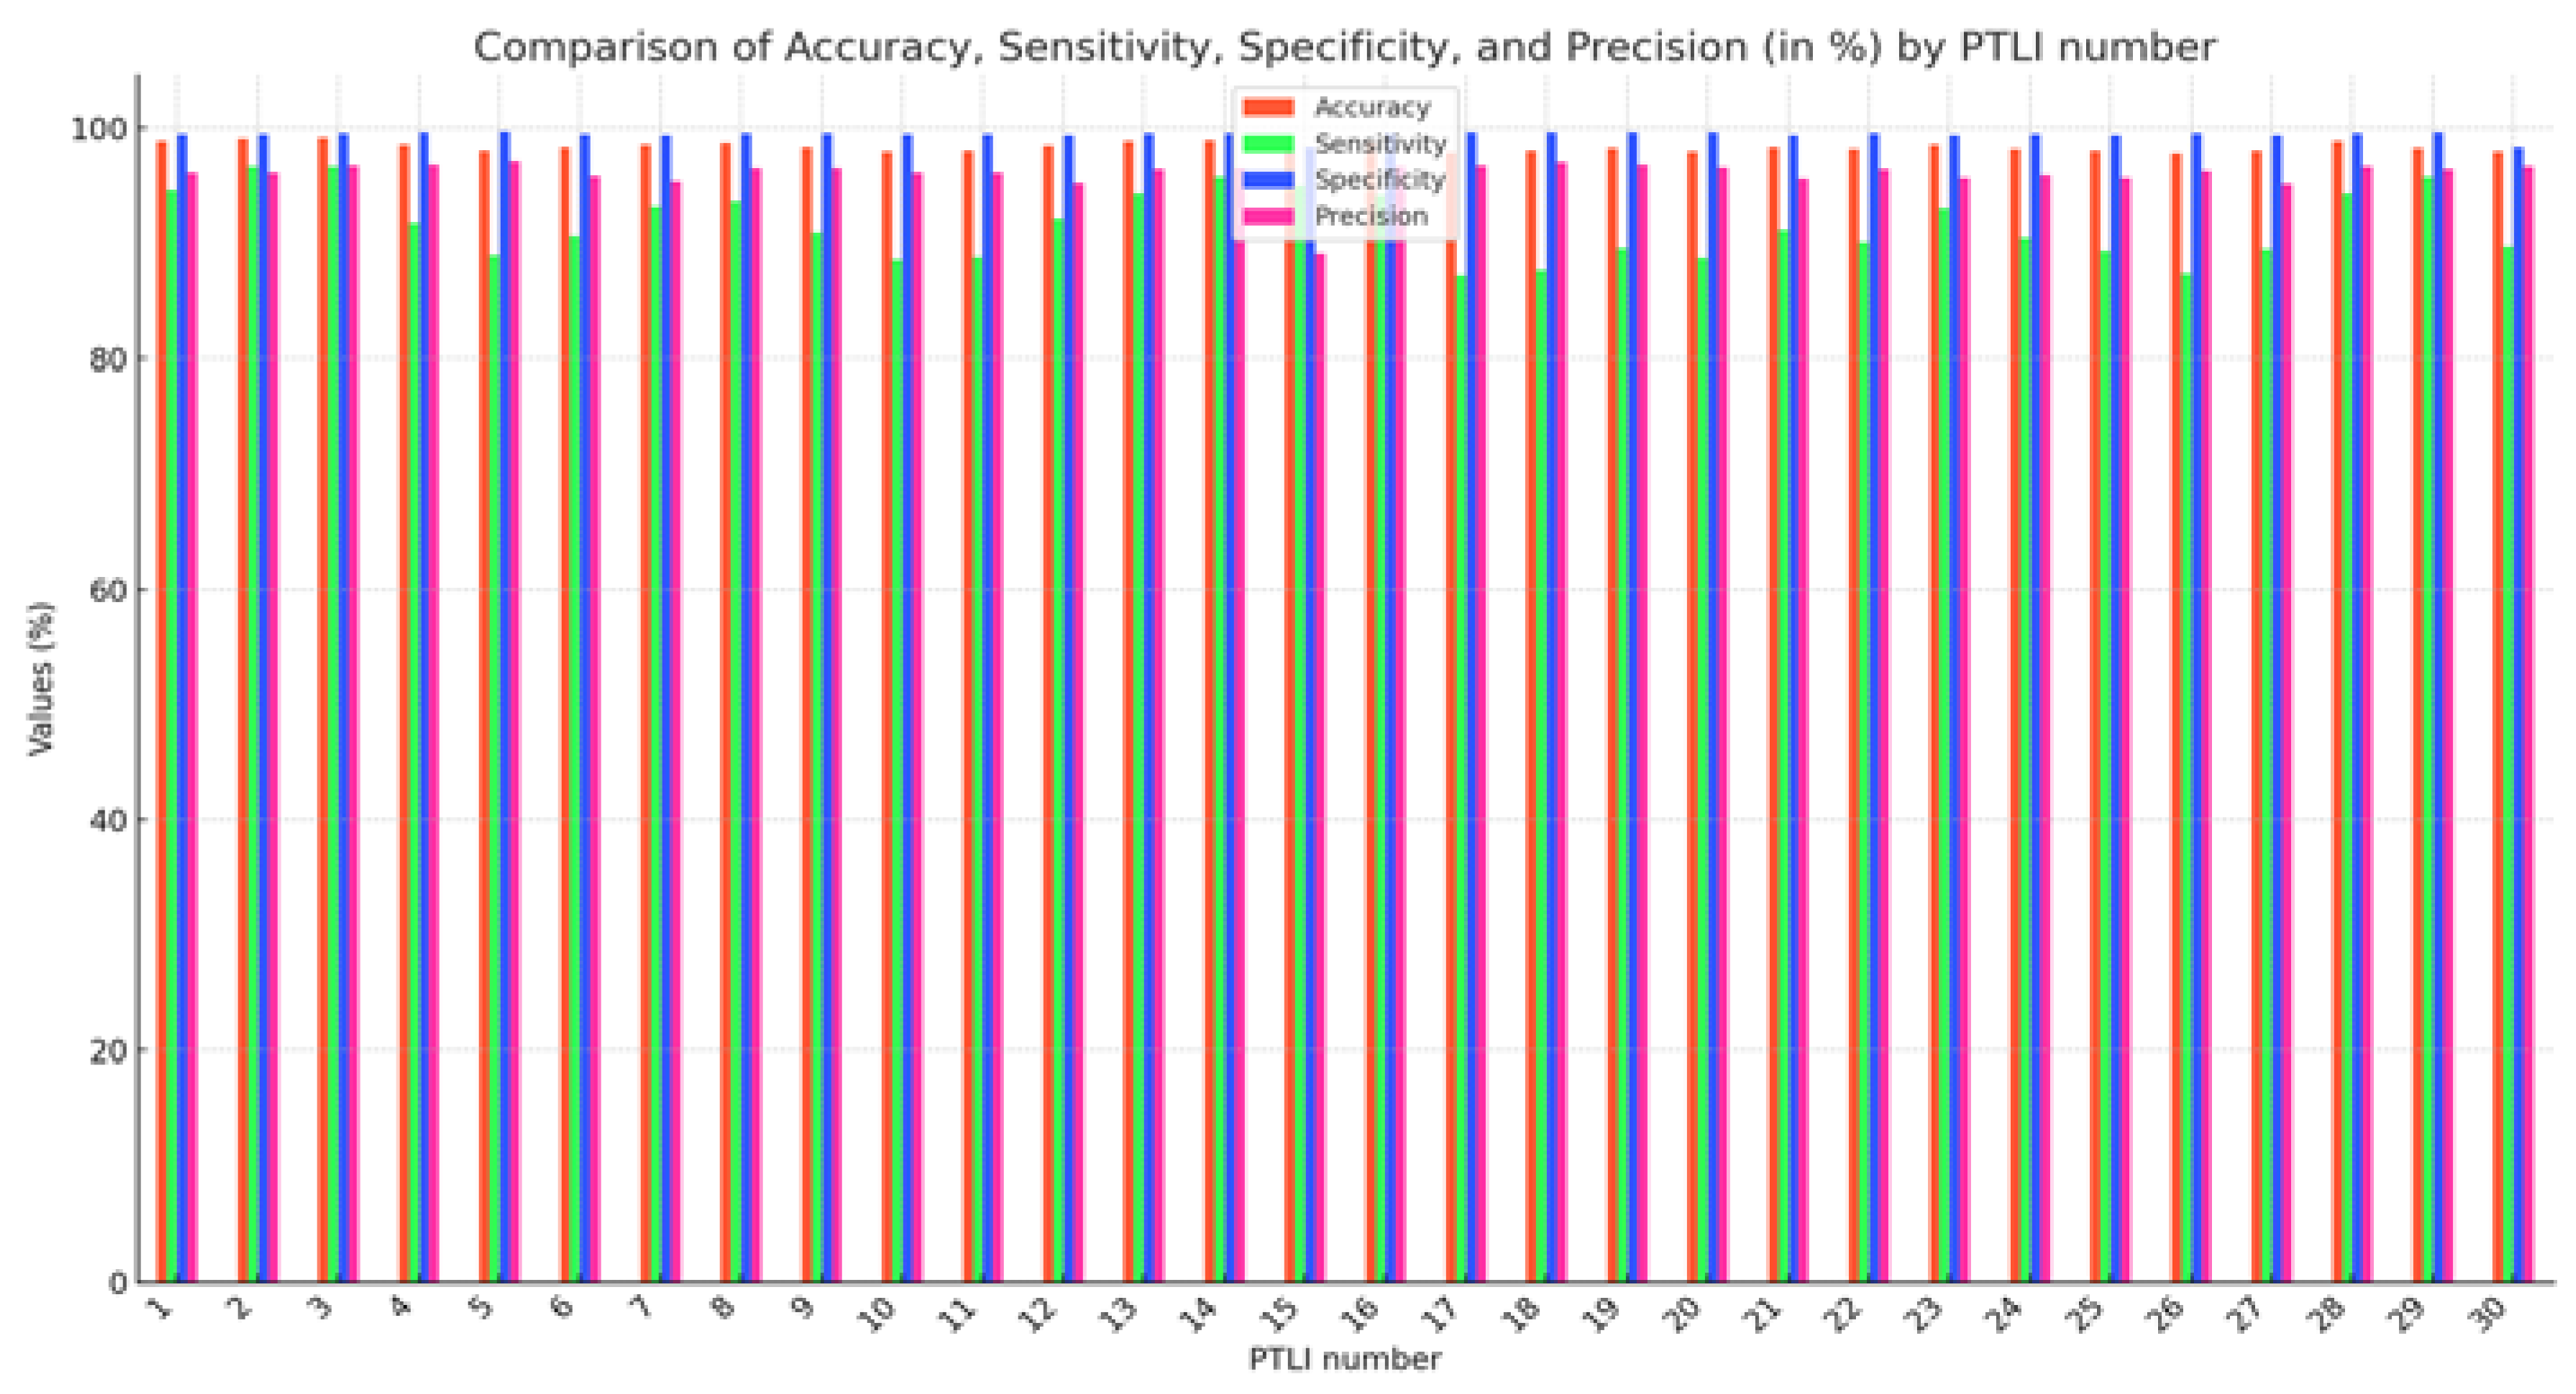
This section provides a detailed quantitative evaluation of the Power Transmission Line Icing (PTLI) identification scheme, using metrics like accuracy, precision, sensitivity/recall, and specificity to assess its effectiveness in detecting and isolating ice formations. The analysis highlights the strengths and areas for improvement in the segmentation process, crucial for the method’s success. Figure 17 compares these performance metrics across different PTLI instances, using distinct colors to illustrate each model’s performance. This evaluation confirms the scheme’s reliability for real-world applications.
Figure 17.
Comparison of Accuracy, Sensitivity, Specificity, and Precision (in %) across different PTLI numbers.
Figure 17.
Comparison of Accuracy, Sensitivity, Specificity, and Precision (in %) across different PTLI numbers.
Figure 17 provides a comparative analysis of four key performance metrics—Accuracy, Sensitivity, Specificity, and Precision—across different PTLI instances. The proposed PTLI identification method shows high accuracy (97.8% to 99.1%) and specificity (often exceeding 99.5%), indicating its reliability in correctly identifying ice formations and distinguishing them from non-ice regions. Sensitivity varies more (87.1% to 96.6%), suggesting that some true ice formations might be missed under certain conditions. Precision remains strong (89.0% to 97.1%), though occasionally affected by scene complexity or environmental noise. Overall, the method is highly effective and reliable, though further refinement may be needed to improve sensitivity in challenging environments. These findings highlight the method’s robustness and areas for potential enhancement, confirming its suitability for real-world applications.
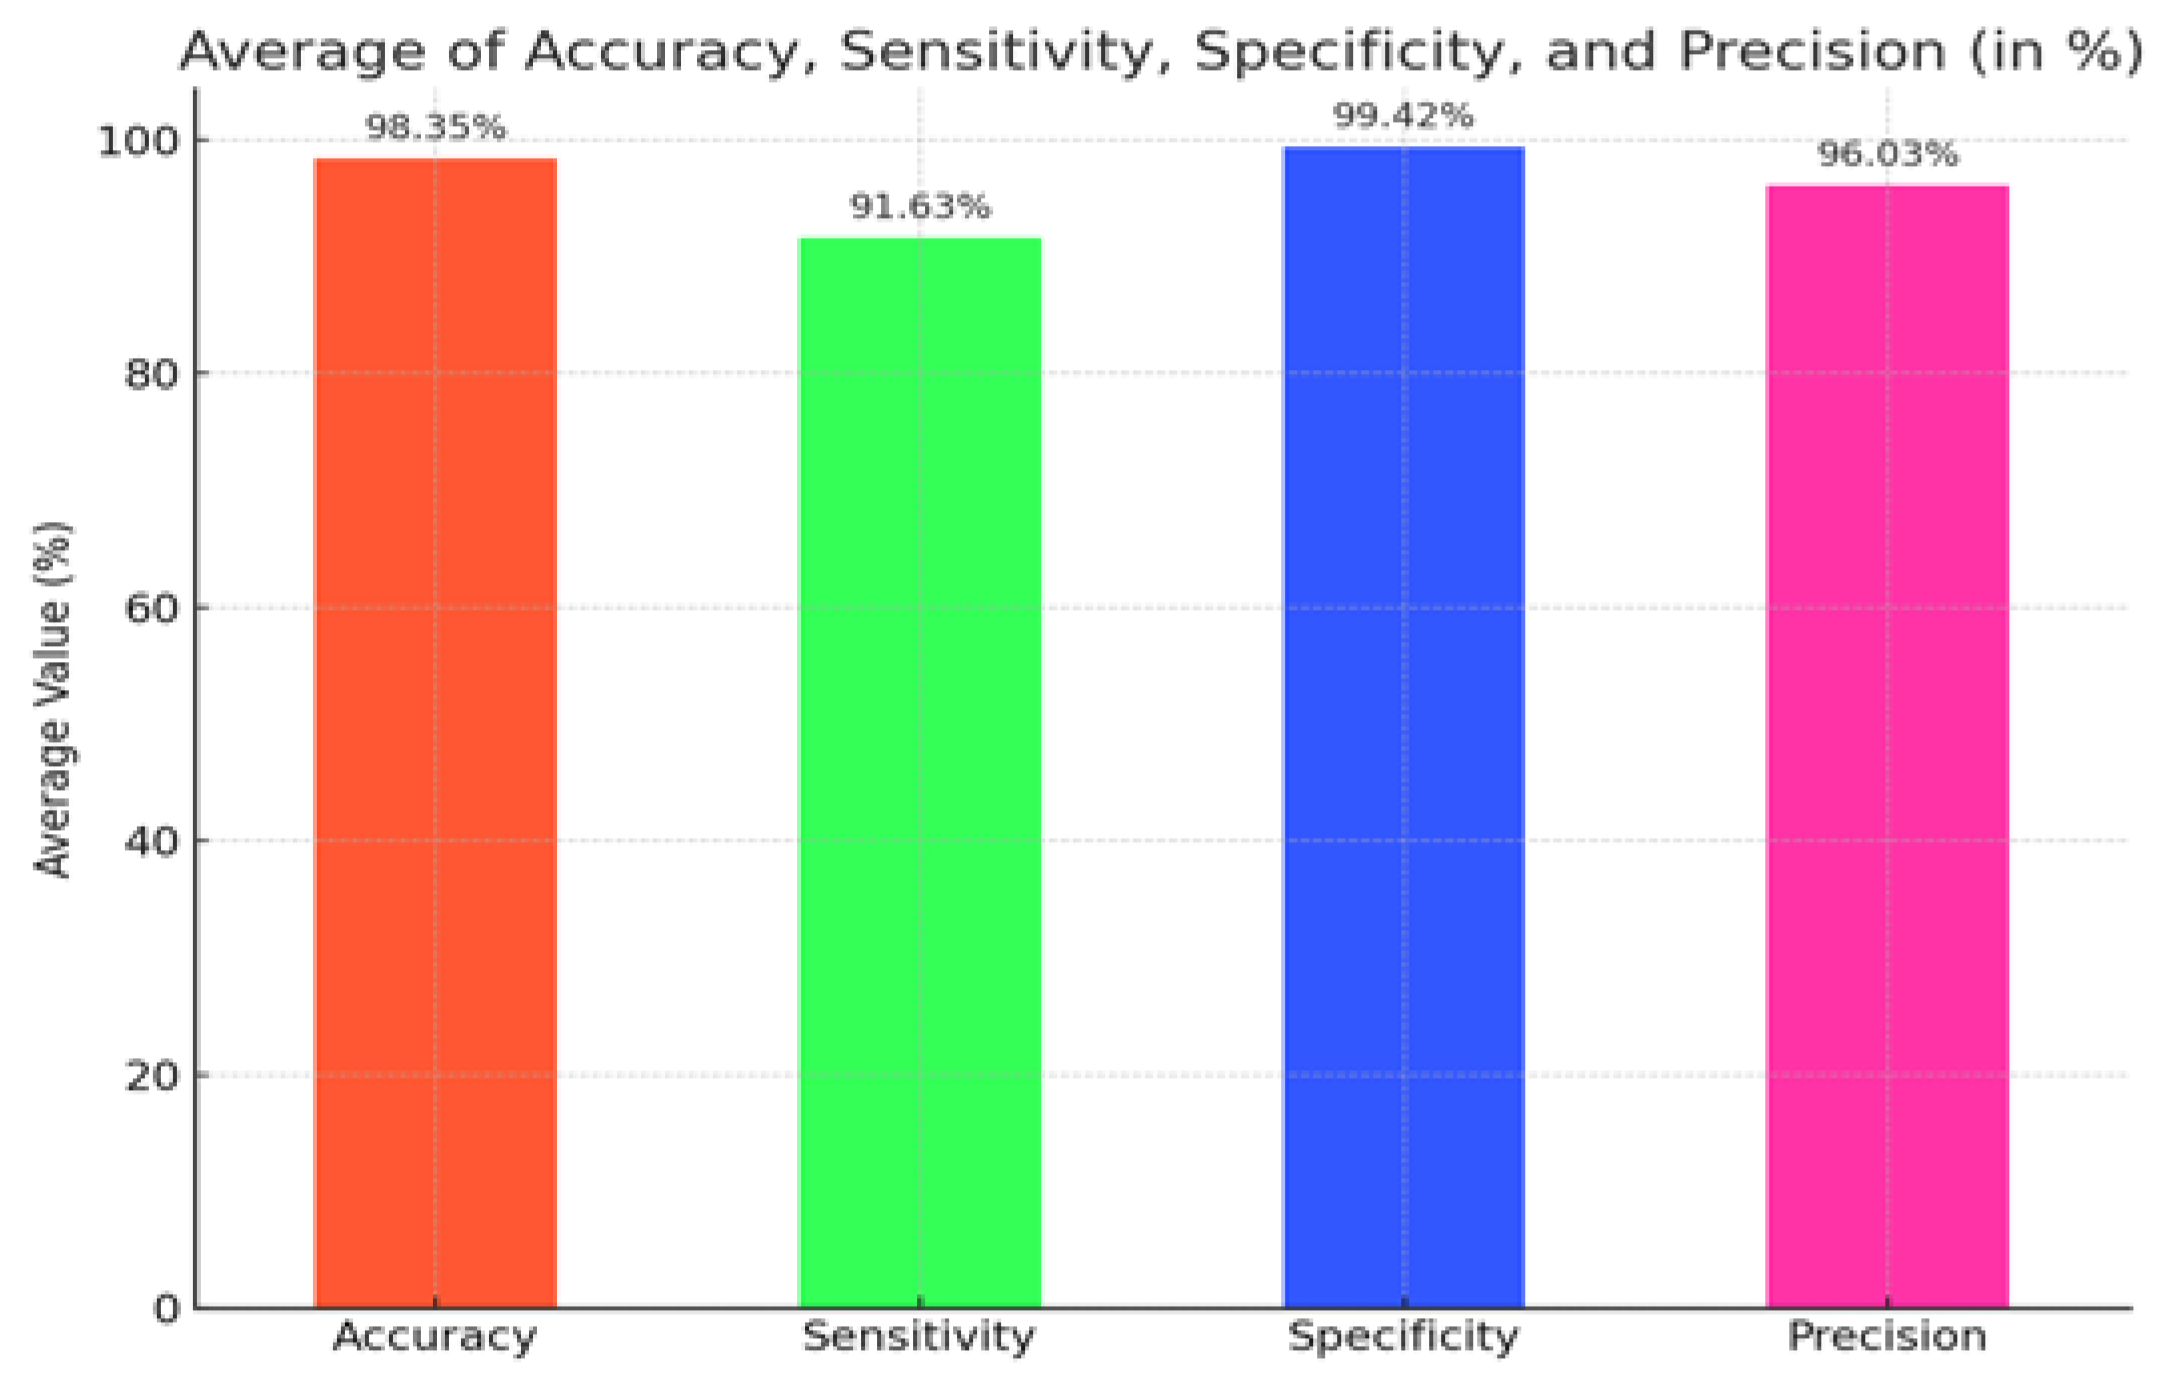
Figure 18 shows a bar chart depicting the average values of Accuracy, Sensitivity, Specificity, and Precision (in %) with data labels, providing a clear comparison of the overall performance across these metrics. The average performance metrics of the Power Transmission Line Icing (PTLI) identification scheme indicate its robustness and reliability, with an average accuracy of 98.35%, specificity of 99.42%, and precision of 96.03%. These values affirm the method’s effectiveness in correctly identifying ice formations and minimizing false positives. However, the slightly lower average sensitivity of 91.63% suggests room for improvement in detecting all true ice formations, especially in challenging conditions. Overall, the high accuracy, specificity, and precision support the method’s practical applicability, while highlighting areas for potential enhancement.
Figure 18.
The bar chart representing the average values of Accuracy, Sensitivity, Specificity, and Precision.
Figure 18.
The bar chart representing the average values of Accuracy, Sensitivity, Specificity, and Precision.
3.3. Application of PTLI Identification in Diverse Scenarios
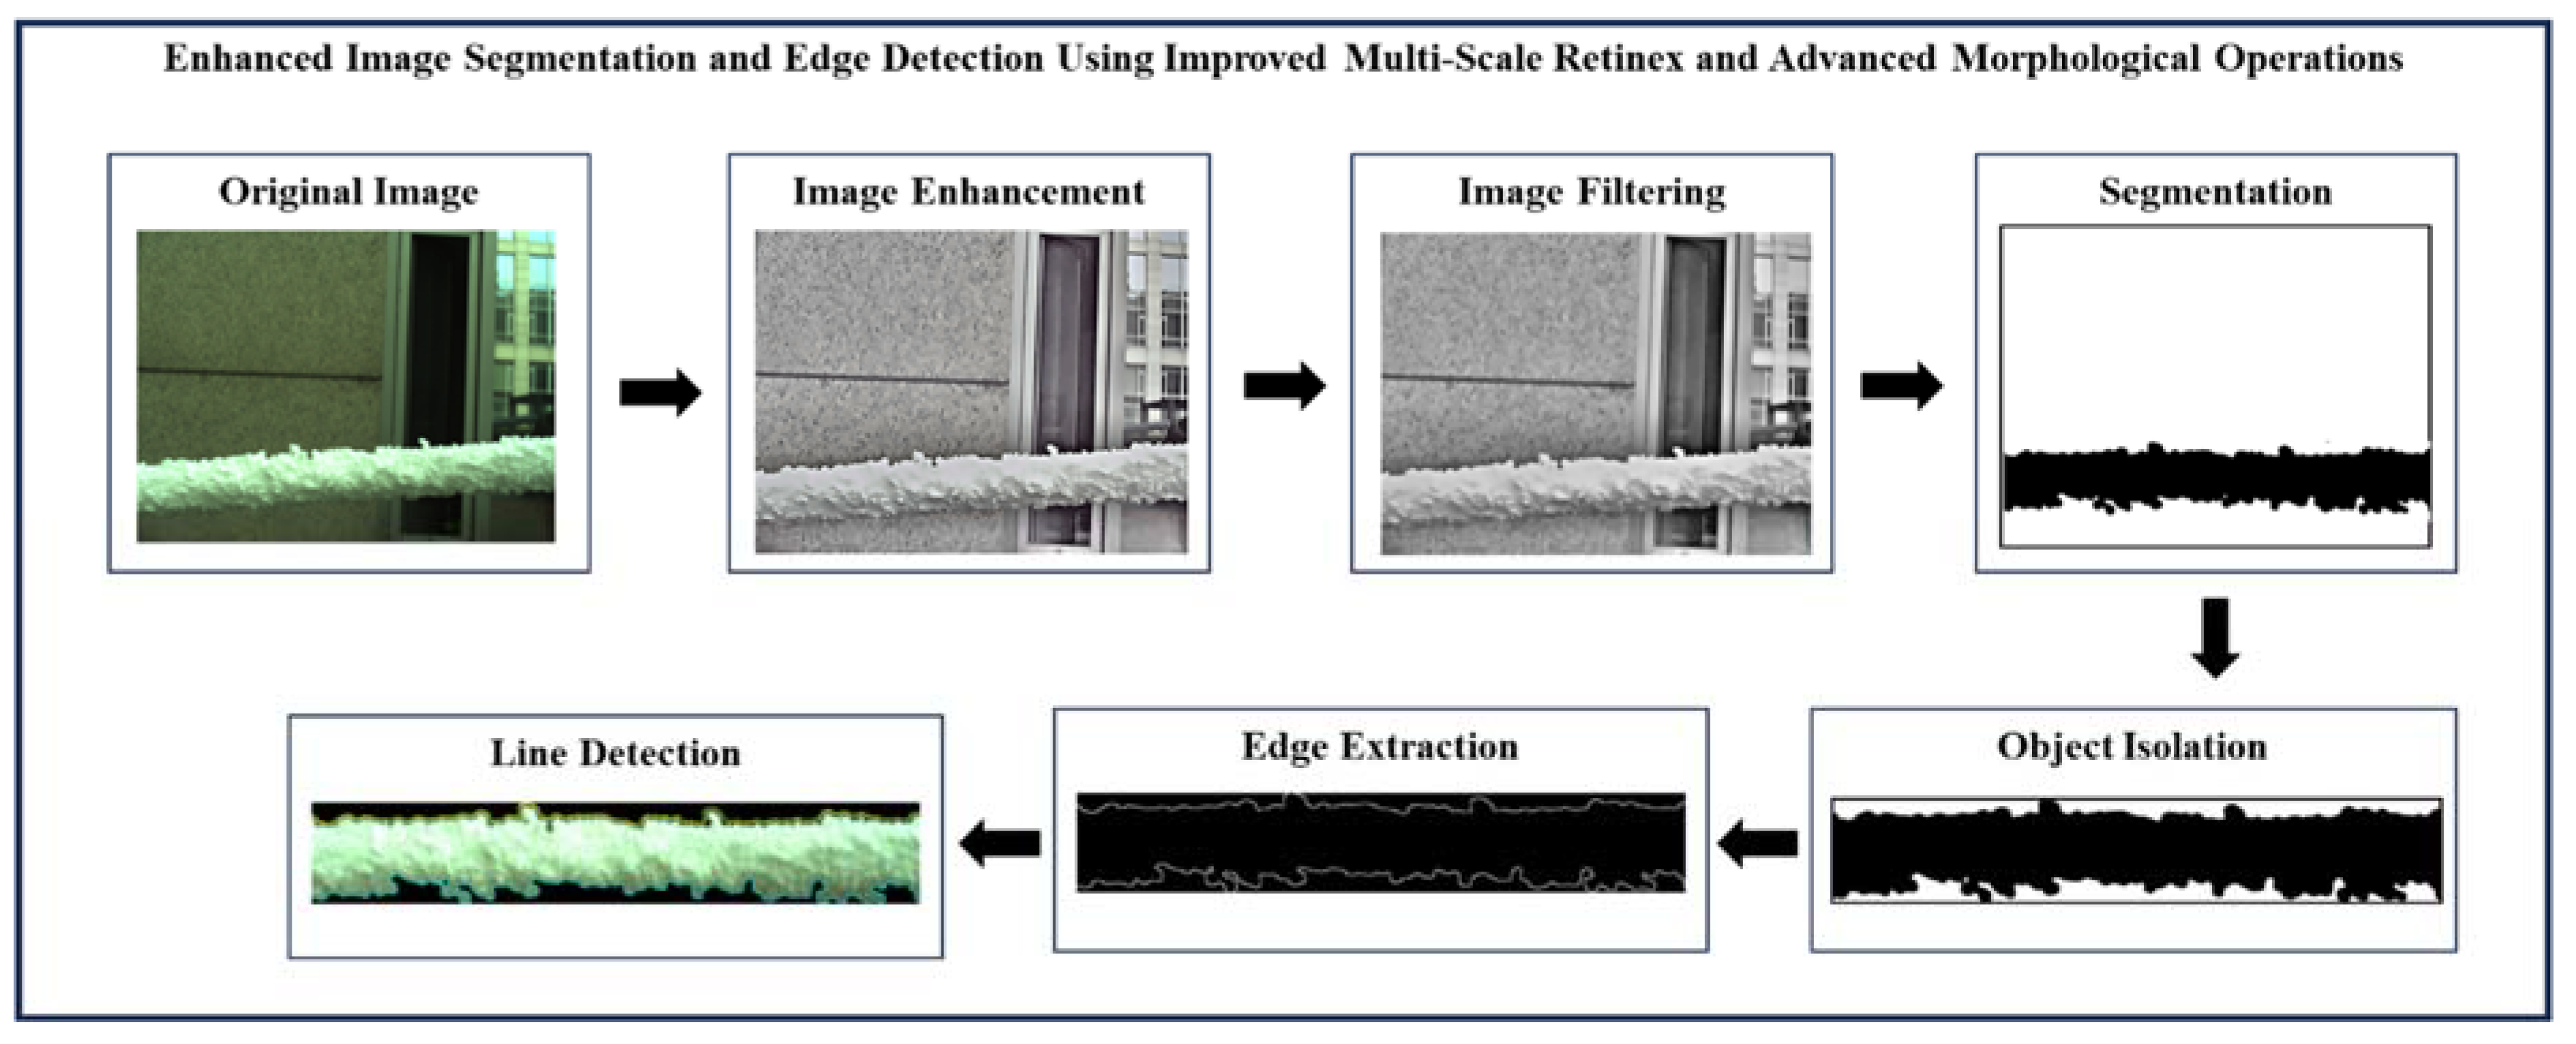
This research evaluates the robustness and adaptability of the Power Transmission Line Icing (PTLI) identification scheme by testing it across diverse scenarios with different lighting conditions and backgrounds. By analyzing three sample images, the study aims to understand how effectively the method identifies and isolates ice formations in challenging environments, thereby validating its practical applicability in real-world settings. Figure 19 illustrates the tested images under diverse conditions: (a) PTLI 1, (b) PTLI 2, and (c) PTLI 3. Figures 20, 21, and 22 illustrate the process of enhanced image segmentation and edge detection using improved multi-scale Retinex and advanced morphological operations.
Figure 19.
The tested images under diverse conditions: (a) PTLI 1; (b) PTLI 2; (c) PTLI 3.
Figure 19.
The tested images under diverse conditions: (a) PTLI 1; (b) PTLI 2; (c) PTLI 3.
Figures 20, 21, and 22 demonstrate the effectiveness of the Enhanced Image Segmentation and Edge Detection methodology, using Improved Multi-Scale Retinex and Advanced Morphological Operations, across three different PTLI scenarios. These figures show the method’s robustness in various conditions:
Figure 20 (PTLI 1): Highlights successful segmentation and edge detection, with enhanced contrast and detail ensuring accurate ice edge identification.
Figure 21 (PTLI 2): Demonstrates the method’s adaptability to changing lighting conditions, maintaining accurate segmentation and edge detection.
Figure 22 (PTLI 3): Shows the method’s ability to isolate ice formations from a complex background, ensuring precise segmentation and edge detection.
Overall, the figures confirm the methodology’s robustness and versatility in accurately identifying and isolating ice formations under varied conditions, validating its potential for practical use in PTLI identification
Figure 20.
The process of enhanced image segmentation and edge detection using improved multi-scale Retinex and advanced morphological operations applied to PTLI 1.
Figure 20.
The process of enhanced image segmentation and edge detection using improved multi-scale Retinex and advanced morphological operations applied to PTLI 1.
Figure 21.
The process of enhanced image segmentation and edge detection using improved multi-scale Retinex and advanced morphological operations applied to PTLI 2.
Figure 21.
The process of enhanced image segmentation and edge detection using improved multi-scale Retinex and advanced morphological operations applied to PTLI 2.
Figure 22.
The process of enhanced image segmentation and edge detection using improved multi-scale Retinex and advanced morphological operations applied to PTLI 3.
Figure 22.
The process of enhanced image segmentation and edge detection using improved multi-scale Retinex and advanced morphological operations applied to PTLI 3.
3.4. Comparison with Existing Methods
This section evaluates the proposed Power Transmission Line Icing (PTLI) identification methodology by comparing its performance with established methods, using ice thickness measurements as the primary benchmark. The comparison aims to highlight the advancements and advantages of the proposed approach, assessing its effectiveness, accuracy, and practical applicability in real-world scenarios relative to traditional techniques.
3.4.1.3. D Measurement-Based Ice Thickness Assessment
This section evaluates the proposed Power Transmission Line Icing (PTLI) identification methodology by focusing on advanced 3D measurement techniques to assess ice thickness. The 3D approach allows for a detailed comparison with existing methods, providing a comprehensive understanding of the proposed method's accuracy and effectiveness in real-world applications. This analysis aims to validate the method's precision in measuring ice thickness and identify potential areas for improvement. Figure 23 illustrates the block diagram of the ice thickness measurement process using 3D techniques.
Figure 23.
The block diagram of the ice thickness measurement process.
Figure 23.
The block diagram of the ice thickness measurement process.
The 3D measurement-based ice thickness assessment involves a multi-step process to accurately measure ice thickness on power transmission lines. It starts with acquiring binocular images, followed by identifying iced transmission lines through edge and line detection. Feature point matching correlates points between images, enabling precise 3D coordinate calculations. These coordinates allow for accurate ice thickness measurement. This comprehensive process ensures reliable monitoring and maintenance of power transmission infrastructure. However, this paper focuses primarily on the iced transmission line identification, edge detection, and line detection processes. The ice thickness measurement is employed not as a primary objective but as a means to evaluate the success of the proposed method. By demonstrating the ability of the proposed methodology to identify and segment ice formations correctly, the paper aims to highlight its effectiveness and reliability.
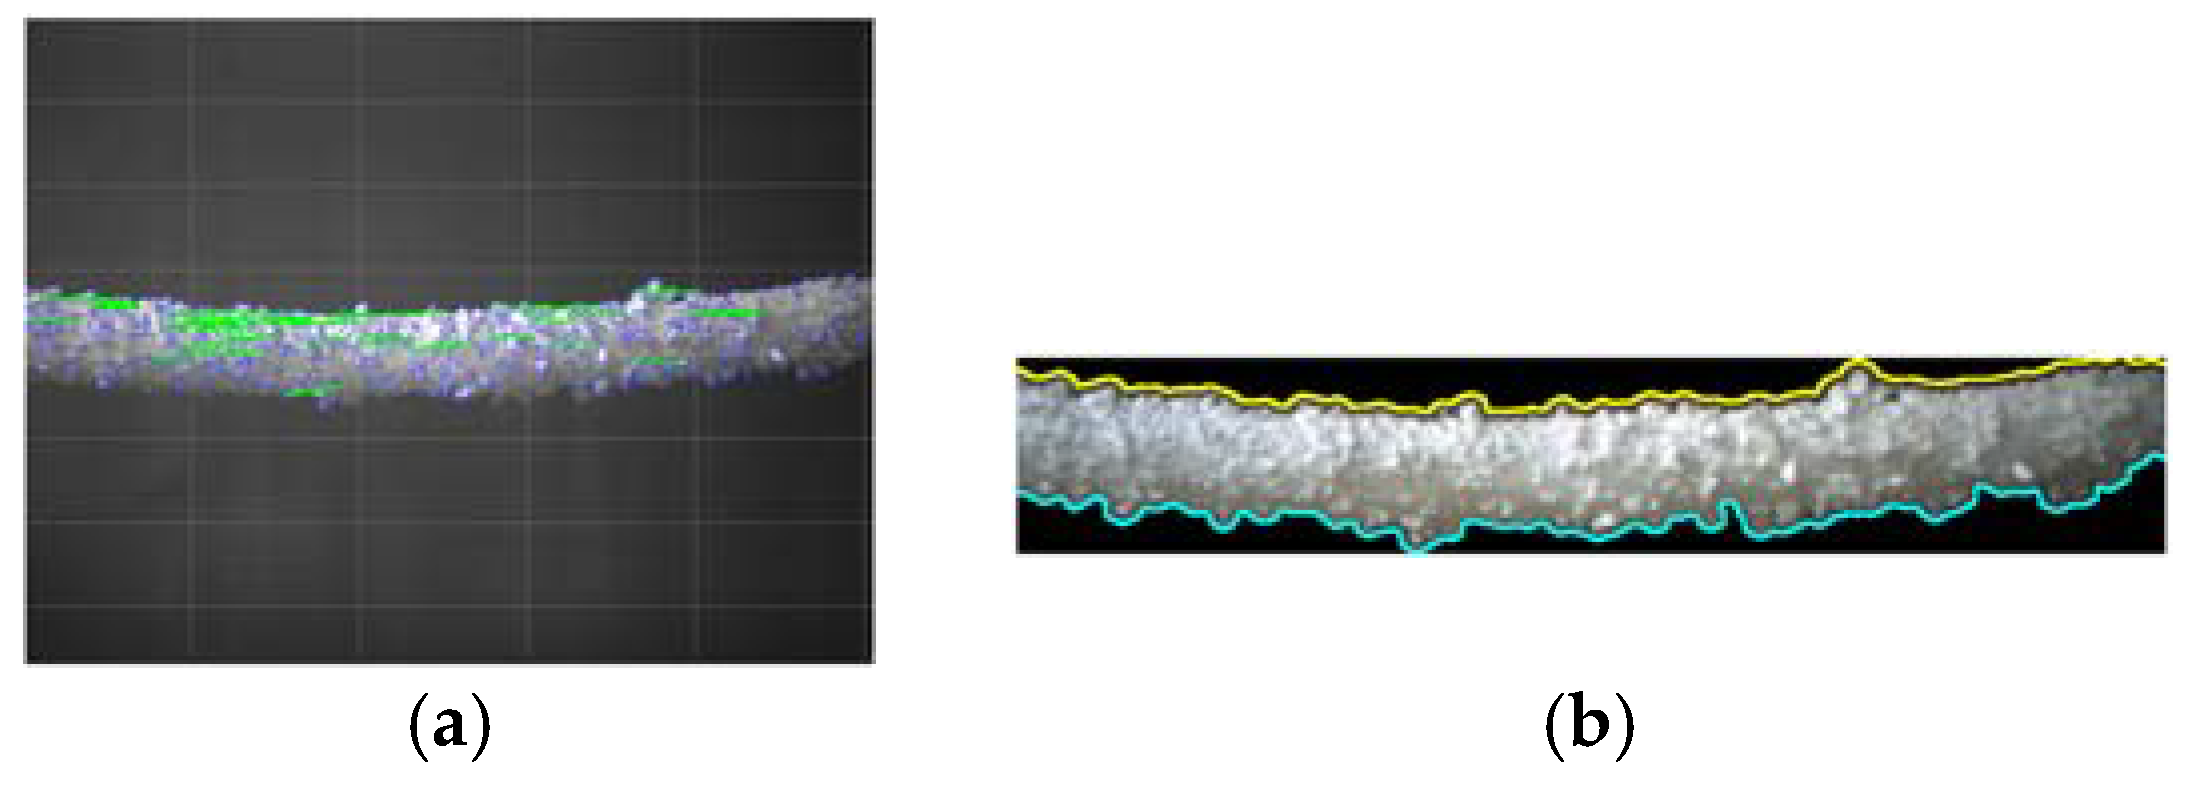
Figure 24 compares edge and line detection between a previous method[
24,
26,
27,
28] (Figure 24(a)) and the proposed method (Figure 24(b)). In the previous method, Canny edge detection (blue) and Hough transform (green) struggle in dimly lit areas, leading to incomplete detection of ice boundaries, impairing ice thickness measurement accuracy. In contrast, the proposed method effectively detects both upper and lower ice boundaries, even under low light conditions, ensuring accurate and comprehensive delineation of the ice formation. This demonstrates the proposed method's enhanced robustness and effectiveness over traditional approaches.
Figure 24.
The edge and line detection process: (
a) The previous method[
24,
26,
27,
28]; (
b) The proposed method.
Figure 24.
The edge and line detection process: (
a) The previous method[
24,
26,
27,
28]; (
b) The proposed method.
Figure 25 compares the segmentation results between the previous[
13] and proposed methods, showing that the proposed method provides clearer and more precise ice boundary delineation.
Figure 25.
The segmentation process: (
a) The previous method[
13]; (
b) The proposed method.
Figure 25.
The segmentation process: (
a) The previous method[
13]; (
b) The proposed method.
Table 3 shows the evaluation result using the validation metrics. The proposed method shows significant improvements in accuracy (98.35% vs. 97.1%) and sensitivity (91.63% vs. 86.22%), indicating better detection of true ice formations. Although specificity is slightly lower (99.42% vs. 99.48%), it remains high, and precision is nearly identical (96.03% vs. 96.24%). Overall, the proposed method is more effective and reliable in identifying and measuring ice thickness.
Table 4 presents the results of ice thickness measurements using three methods: the proposed Method, Method 1 [
24,
26,
27,
28]; (previous method), and Method 2 [
13] (previous method), compared to manual measurements considered the ground truth. Manual measurement results are measured by a micrometer caliper with an accuracy of 0.05 mm. Method 1 [
24,
26,
27,
28] used the Canny transform for edge detection and the Hough transform for line detection. Method 2 [
13] utilized an image processing framework for accurate identification of iced transmission lines, employing multi-level segmentation and mathematical morphology techniques. Previous Method 1 shows the largest deviation from the manual measurements, indicating lower accuracy. Previous Method 2 performs better but still shows significant variation. In contrast, the Proposed Method demonstrates enhanced accuracy and reduced error, offering a more reliable and precise approach to measuring ice thickness.
Table 5 highlights the superior performance of the proposed method for ice thickness measurement compared to Previous Methods 1 and 2. The proposed method achieves the lowest Root Mean Squared Error (RMSE) at 1.20 mm and the lowest Mean Absolute Error (MAE) at 1.10 mm, indicating high accuracy. It also has a high R-squared (R²) value of 0.95, showing strong predictive power and a close fit between predicted and actual measurements. The proposed method demonstrates the least error variability with a Standard Deviation (SD) of 1.20 mm, emphasizing its consistency and reliability. These metrics collectively highlight the proposed method's clear advantages in accuracy, consistency, and reliability over the previous methods.
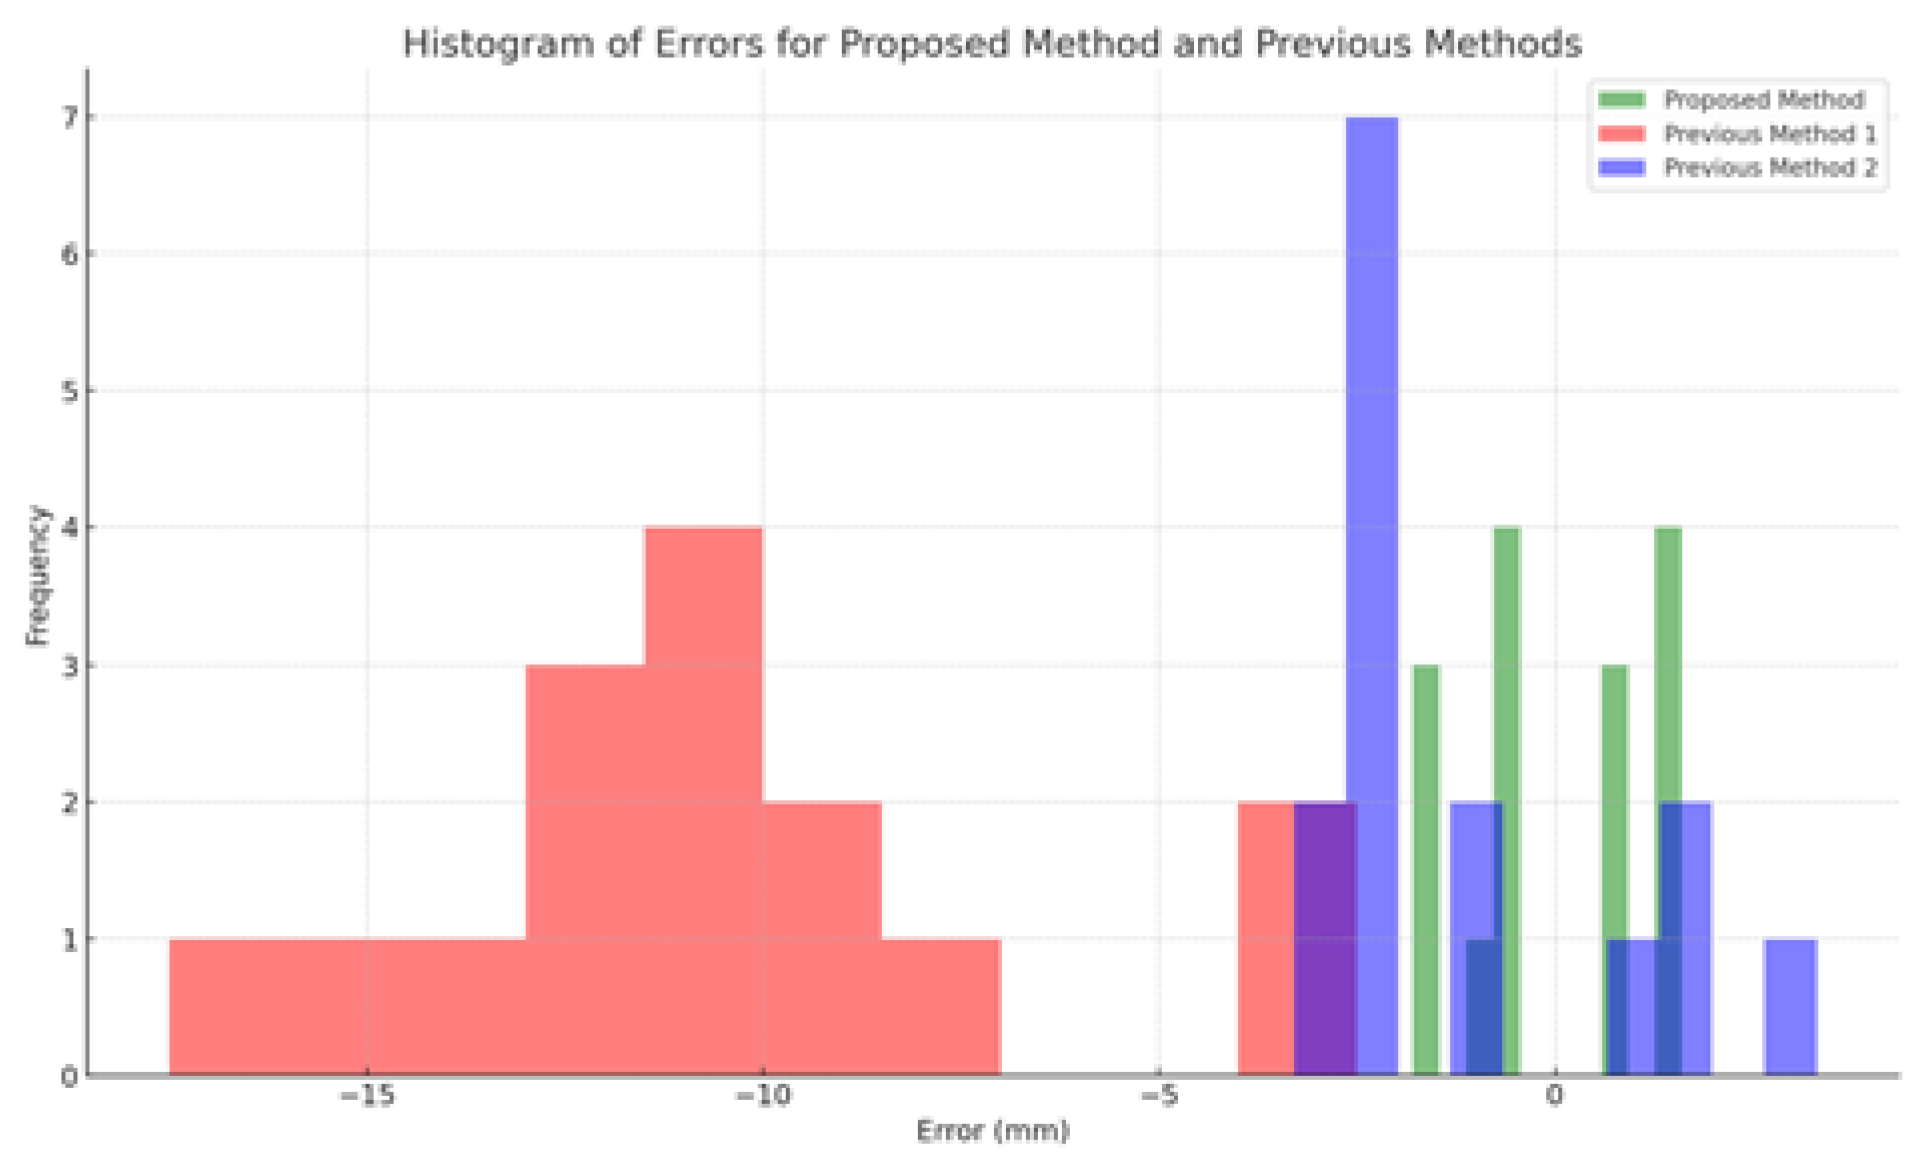
Figure 26 shows histograms of error distributions for each method. The error distribution analysis compares the accuracy and consistency of three methods by examining how closely their errors are centered around zero. The proposed method (green) has a narrow error distribution around zero, indicating high accuracy and consistency with manual measurements. Previous Method 1 (red) shows a broad, predominantly negative error distribution, reflecting larger deviations. Previous Method 2 (blue) has a moderately spread error distribution, more precise than Method 1 but less accurate than the proposed method. This analysis highlights the proposed method as the most accurate and consistent among the three.
Figure 26.
The histogram of error distributions for all three methods.
Figure 26.
The histogram of error distributions for all three methods.
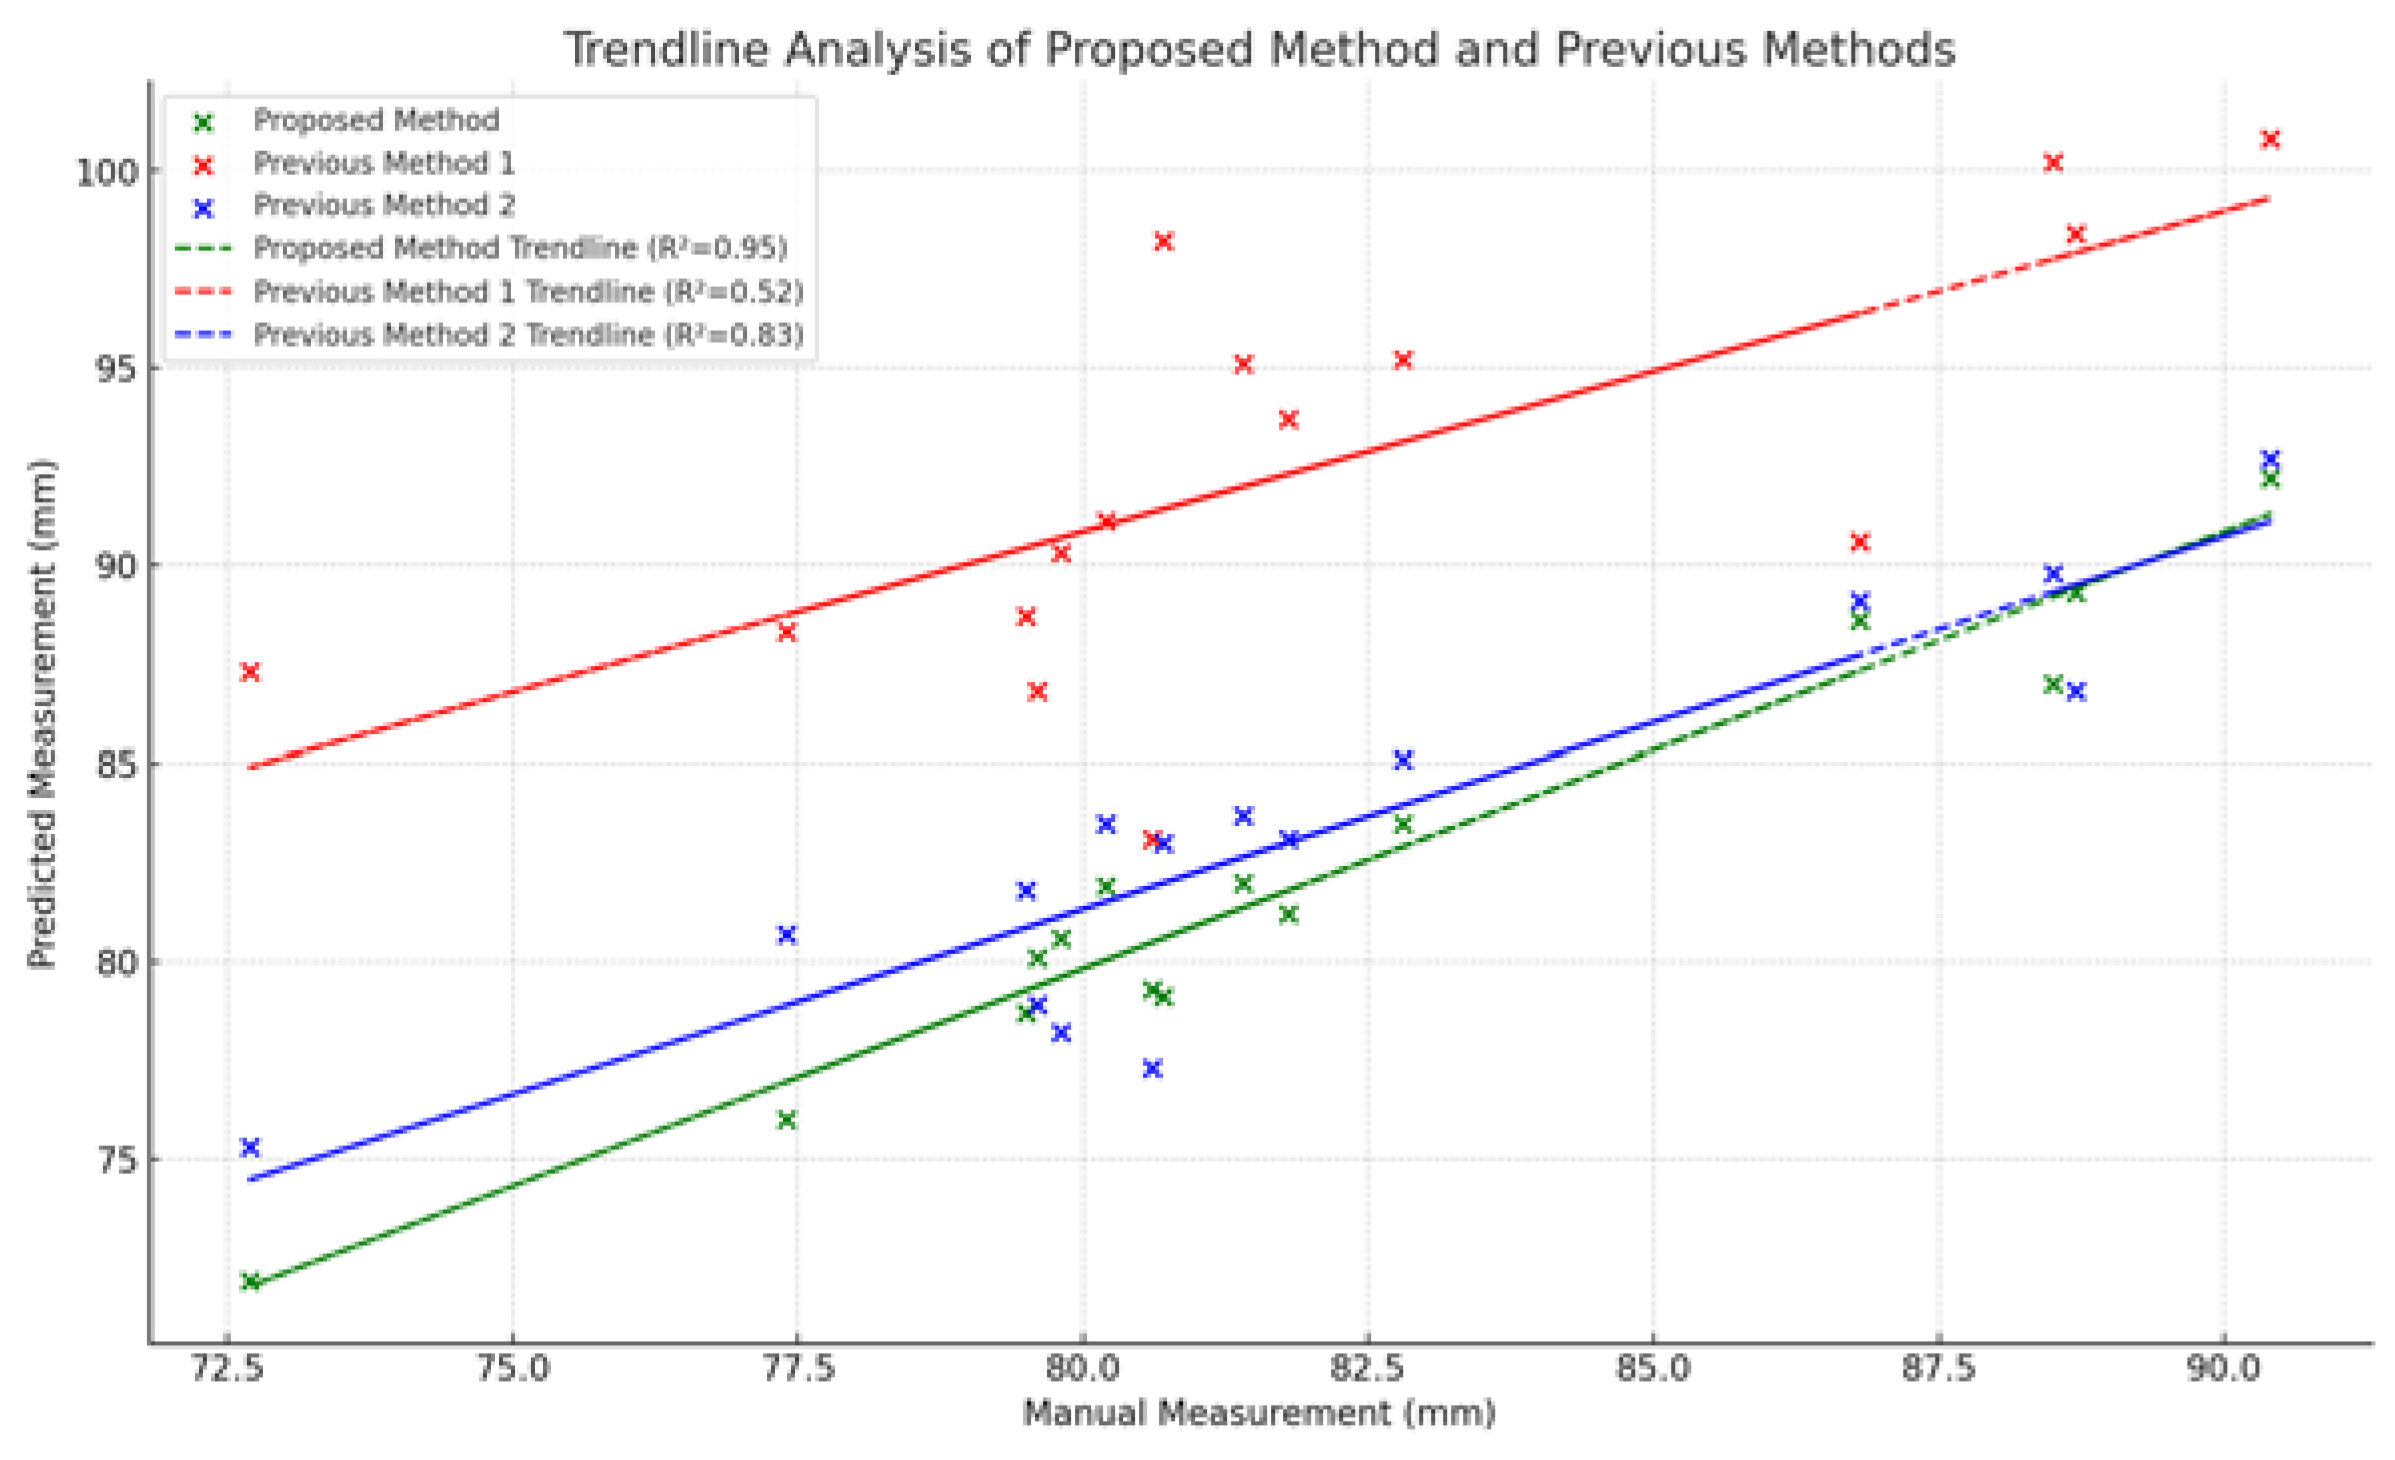
Figure 27.
The trendline analysis for each method.
Figure 27.
The trendline analysis for each method.
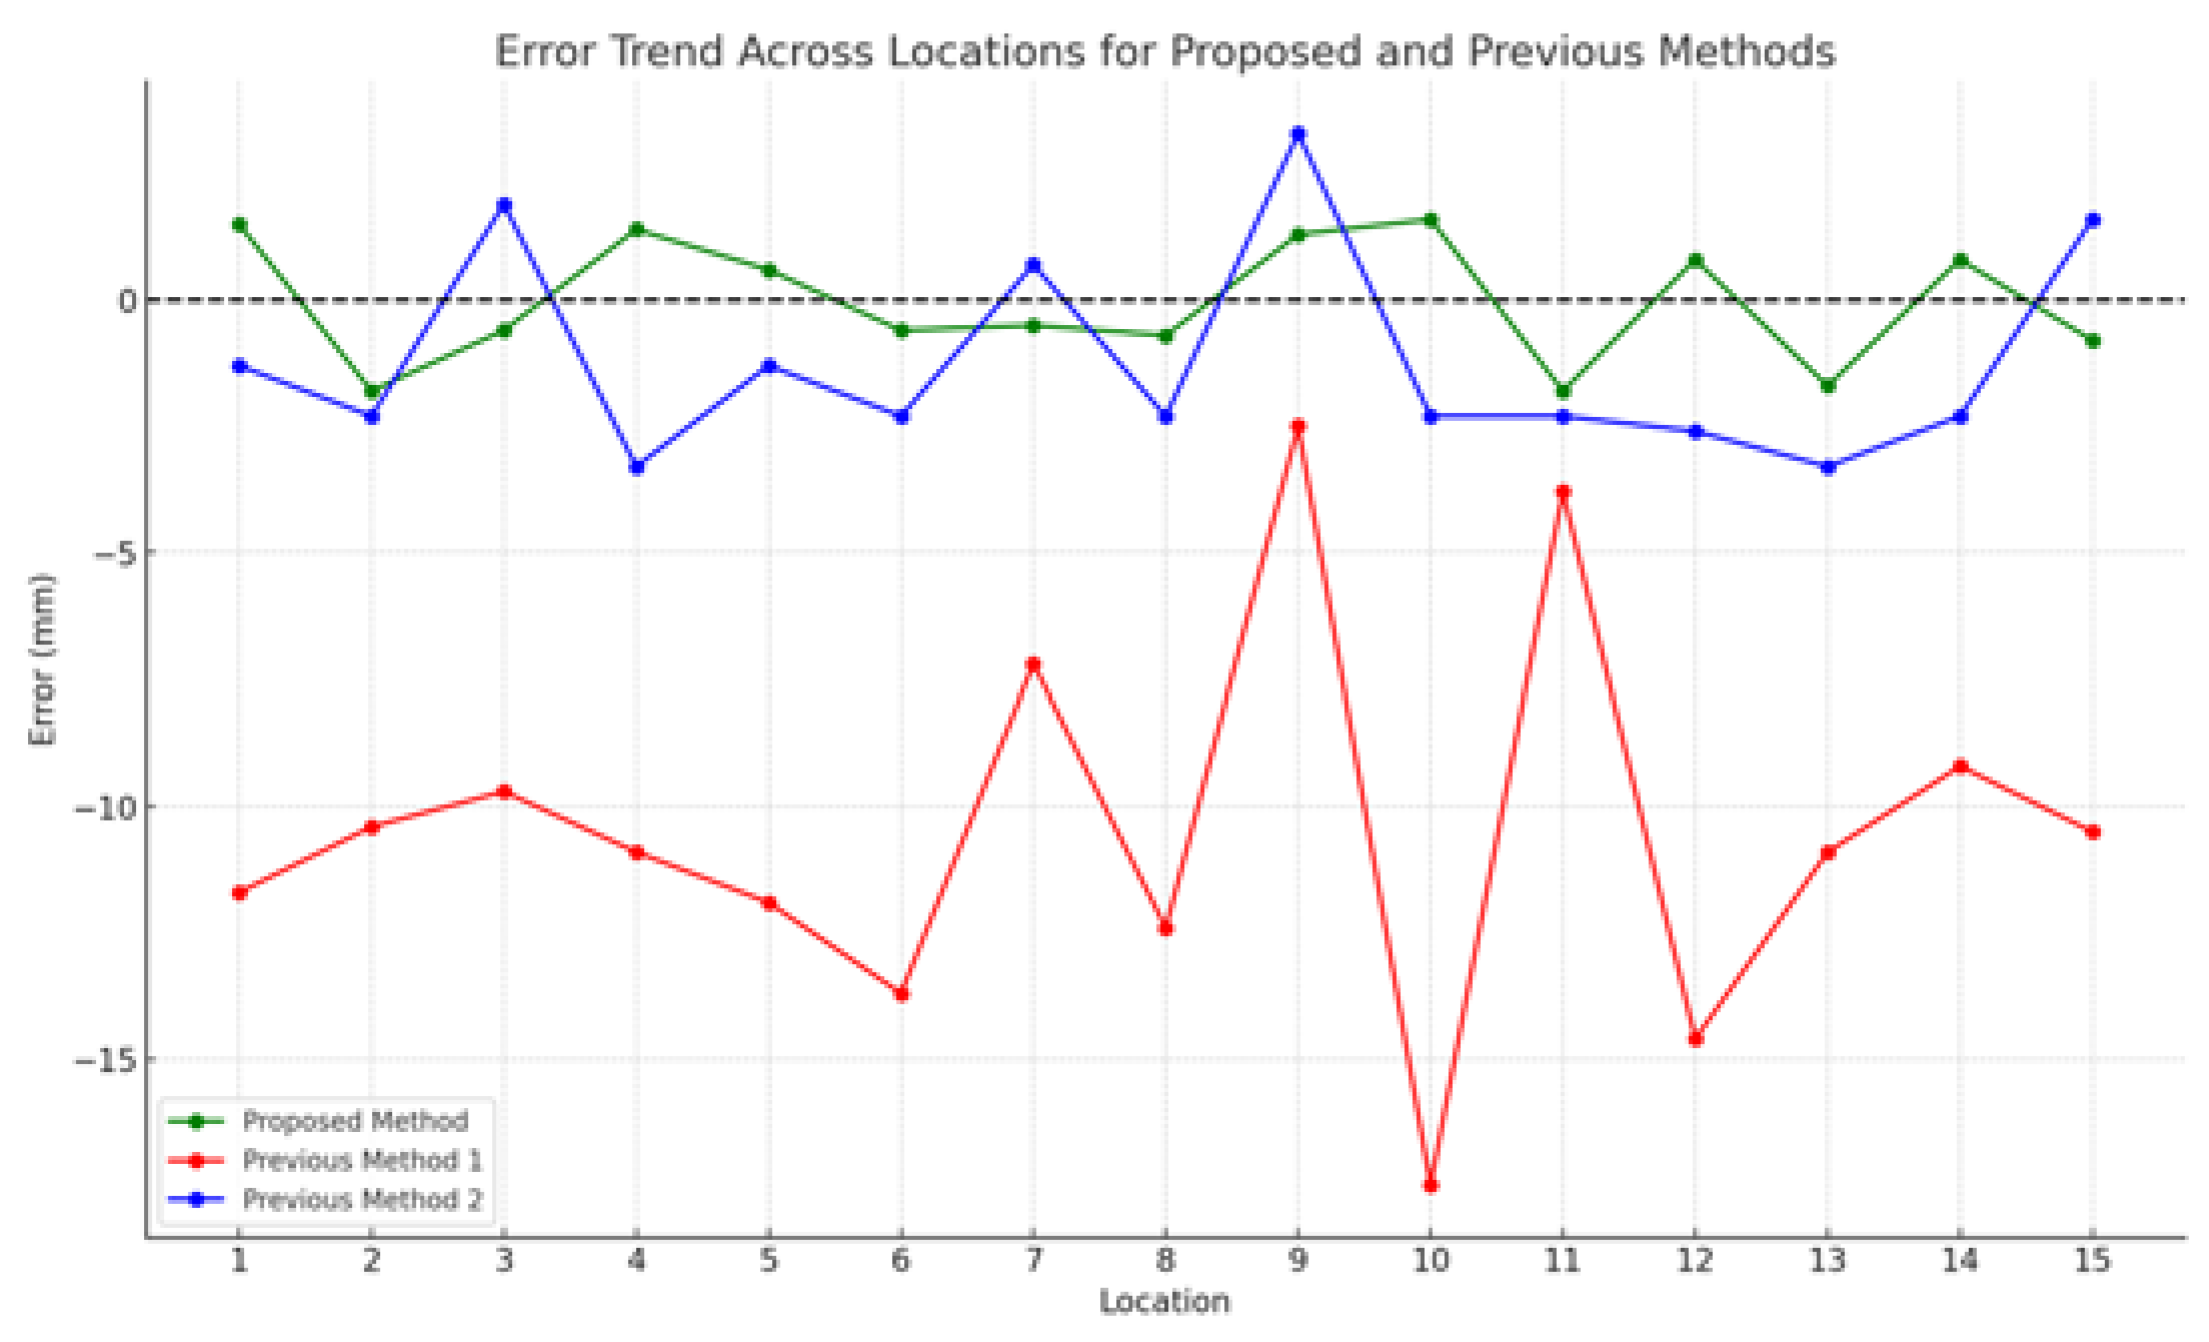
The trendline analysis examines the correlation between manual measurements and predictions from each method, with the R-squared (R²) value indicating the strength of this relationship. Figure 27 shows that the proposed method (green) has a strong linear correlation with manual measurements, reflected in a high R² value of 0.95, making it the most accurate and reliable. Previous Method 1 (red) has a much weaker correlation, with an R² of 0.52, indicating greater variability. Previous Method 2 (blue) shows a moderate correlation with an R² of 0.83, better than Method 1 but less reliable than the proposed method. This analysis confirms the proposed method as the most accurate and reliable for predicting measurements. Figure 28 shows the error trends across different locations for the proposed method and previous method.
The plot illustrates error trends across different locations for the Proposed Method, Previous Method 1, and Previous Method 2. The Proposed Method (green) consistently shows minimal errors close to zero, indicating accurate alignment with manual measurements. Previous Method 1 (red) exhibits consistently negative and larger errors, indicating significant underestimation. Previous Method 2 (blue) shows moderate errors with some variation but performs better than Method 1. Overall, the Proposed Method consistently outperforms the others, maintaining low and consistent errors across all locations.
Figure 28.
The error trends across different locations for the proposed method and previous method.
Figure 28.
The error trends across different locations for the proposed method and previous method.
The analysis shows that the Proposed Method is the most accurate and reliable among the three methods evaluated. It consistently aligns closely with manual measurements, as evidenced by lower RMSE, MAE, and error standard deviation, along with a high R-squared value. In contrast, Previous Method 1 has significant inaccuracies and a weaker correlation with manual measurements, while Previous Method 2 performs better but still falls short of the Proposed Method's accuracy and consistency.
4. Conclusions
This study evaluated the effectiveness of various methods for Power Transmission Line Icing (PTLI) identification, highlighting the superior performance of the Proposed Method. The average performance metrics of the Power Transmission Line Icing (PTLI) identification scheme further illustrate its robustness and reliability. With an average accuracy of 98.35%, the method effectively identifies and isolates ice formations across various scenes, demonstrating its adaptability and precision. The sensitivity, averaging 91.63%, indicates a strong capability in detecting true ice formations, although it also suggests potential areas for further refinement. The high specificity of 99.42% underscores the method’s efficiency in correctly identifying non-ice regions, thereby minimizing false positives and enhancing overall reliability. Additionally, the method’s precision, at 96.03%, reinforces its accuracy in positive identifications, further supporting its effectiveness in practical applications. The analysis conducted in this study underscores the superior performance of the Proposed Method in the measurement of ice thickness, as indicated by its notably low Root Mean Squared Error (RMSE) of 1.20 mm and Mean Absolute Error (MAE) of 1.10 mm, coupled with a strong R-squared value of 0.95. These statistical metrics demonstrate that the Proposed Method provides highly accurate and consistent measurements, closely aligning with manual measurements and outperforming Previous Methods 1 and 2.
The robust performance metrics of the PTLI identification scheme, including an average accuracy of 98.35%, sensitivity of 91.63%, specificity of 99.42%, and precision of 96.03%, highlight its effectiveness in accurately identifying and isolating ice formations across various conditions. These results imply that the method is highly adaptable and precise, making it well-suited for practical applications where accurate ice detection is critical. Furthermore, the Proposed Method’s low RMSE of 1.20 mm, MAE of 1.10 mm, and strong R-squared value of 0.95 indicate its reliability and alignment with manual measurements. This superior accuracy and consistency suggest that the Proposed Method is the most reliable choice for tasks requiring precise measurements, offering significant improvements over previous methods.
Building on the strong performance of the PTLI identification scheme, future research should aim to further enhance its accuracy and reliability. While the method is robust with a 98.35% accuracy, improving sensitivity beyond 91.63% could ensure better detection under varied conditions. Expanding tests to more diverse environmental conditions and ice types would confirm its adaptability, and optimizing computational efficiency would support real-time monitoring applications.
Author Contributions
The ideas and concepts were carried out in collaboration with all authors. N.R.N. and J.X. conceived and designed the experiments; N.R.N. and X.H. performed the experiments; N.R.N. and J.X. analyzed the data; N.R.N. and J.X. wrote the paper. All authors have read and agreed to the published version of the manuscript.
Funding
This research received no external funding.
Institutional Review Board Statement
Not applicable.
Informed Consent Statement
Not applicable.
Conflicts of Interest
The authors declare no conflicts of interest.
References
- Liu, J.; Jia, R.; Li, W.; Ma, F.; Abdullah, H.M.; Ma, H.; Mohamed, M.A. High Precision Detection Algorithm Based on Improved RetinaNet for Defect Recognition of Transmission Lines. Energy Reports 2020, 6, 2430–2440. [Google Scholar] [CrossRef]
- DIng, Z.W.; Zhang, X.P.; Zou, N.M.; Xiong, F.; Song, J.Y.; Fang, X.; Wang, F.; Zhang, Y.X. Phi-OTDR Based On-Line Monitoring of Overhead Power Transmission Line. J. Light. Technol. 2021, 39, 5163–5169. [Google Scholar] [CrossRef]
- Alhassan, A.B.; Zhang, X.; Shen, H.; Xu, H. Power Transmission Line Inspection Robots: A Review, Trends and Challenges for Future Research. Int. J. Electr. Power Energy Syst. 2020, 118, 105862. [Google Scholar] [CrossRef]
- Rodrigues, A. V.; Monteiro, C.; Silva, S.O.; Linhares, C.; Mendes, H.; Tavares, S.M.O.; Frazão, O. A Brief Review on Optical Fiber Sensing for the Power Grid. U.Porto J. Eng. 2022, 8, 18–23. [Google Scholar] [CrossRef]
- Qiao, X.; Zhang, Z.; Jiang, X.; Sundararajan, R.; Ma, X.; Li, X. AC Failure Voltage of Iced and Contaminated Composite Insulators in Different Natural Environments. Int. J. Electr. Power Energy Syst. 2020, 120, 105993. [Google Scholar] [CrossRef]
- Tong, H.; Qiu, R.C.; Zhang, D.; Yang, H.; Ding, Q.; Shi, X. Detection and Classification of Transmission Line Transient Faults Based on Graph Convolutional Neural Network. CSEE J. Power Energy Syst. 2021, 7, 456–471. [Google Scholar]
- Mahin, A.U.; Islam, S.N.; Ahmed, F.; Hossain, M.F. Measurement and Monitoring of Overhead Transmission Line Sag in Smart Grid: A Review. IET Gener. Transm. Distrib. 2022, 16, 1–18. [Google Scholar] [CrossRef]
- Ke, Hongchang and Sun, Hongbin and Zhao, Huiling and Wu, T. Ice Cover Prediction for Transmission Lines Based on Feature Extraction and an Improved Transformer Scheme. Electronics 2024, 13, 2339. [Google Scholar] [CrossRef]
- Gonçalves, A.; Marques, M.C.; Loureiro, S.; Nieto, R.; Liberato, M.L.R. Disruption Risk Analysis of the Overhead Power Lines in Portugal. Energy 2023, 263, 125583. [Google Scholar] [CrossRef]
- Brettschneider, S.; Fofana, I. Evolution of Countermeasures against Atmospheric Icing of Power Lines over the Past Four Decades and Their Applications into Field Operations. Energies 2021, 14, 6291. [Google Scholar] [CrossRef]
- Madi, E.; Pope, K.; Huang, W.; Iqbal, T. A Review of Integrating Ice Detection and Mitigation for Wind Turbine Blades. Renew. Sustain. Energy Rev. 2019, 103, 269–281. [Google Scholar] [CrossRef]
- Haeberli, W.; Whiteman, C. Snow and Ice-Related Hazards, Risks, and Disasters: Facing Challenges of Rapid Change and Long-Term Commitments. In Snow and Ice-Related Hazards, Risks, and Disasters; 2021; pp. 1--33.
- Nusantika, Nalini Rizkyta and Hu, Xiaoguang and Xiao, J. Newly Designed Identification Scheme for Monitoring Ice Thickness on Power Transmission Lines. Appl. Sci. 2023, 13, 9862. [Google Scholar] [CrossRef]
- Sanstad, Alan H and Zhu, Qianru and Leibowicz, Benjamin and Larsen, Peter H and Eto, J.H. Case Studies of the Economic Impacts of Power Interruptions and Damage to Electricity System Infrastructure from Extreme Events; 2020; pp. 7--13.
- Dong, B.; Jiang, X.; Yin, F. Development and Prospect of Monitoring and Prevention Methods of Icing Disaster in China Power Grid. IET Gener. Transm. Distrib. 2022, 4480–4493. [Google Scholar] [CrossRef]
- Zhang, Z.; Zhang, H.; Yue, S.; Zeng, W. A Review of Icing and Anti-Icing Technology for Transmission Lines. Energies 2023, 601. [Google Scholar] [CrossRef]
- Panchalogaranjan, V.; Moses, P.; Shumaker, N. Case Study of a Severe Ice Storm Impacting Distribution Networks in Oklahoma. IEEE Trans. Reliab. 2023, 72, 1442–1452. [Google Scholar] [CrossRef]
- Zhao, Z.; Qi, H.; Qi, Y.; Zhang, K.; Zhai, Y.; Zhao, W. Detection Method Based on Automatic Visual Shape Clustering for Pin-Missing Defect in Transmission Lines. IEEE Trans. Instrum. Meas. 2020, 69, 6080–6091. [Google Scholar] [CrossRef]
- Zainuddin, N Mohd and Rahman, MS Abd and Kadir, MZA Ab and Ali, NH Nik and Ali, Zaipatimah and Osman, Miszaina and Mansor, Muhamad and Ariffin, A Mohd and Rahman, M Syahmi Abd and Nor, S.F.M. and others} Review of Thermal Stress and Condition Monitoring Technologies for Overhead Transmission Lines: Issues and Challenges. IEEE Access 2020, 8, 120053–120081.
- Weng, B.; Gao, W.; Zheng, W.; Yang, G. Newly Designed Identifying Method for Ice Thickness on High-Voltage Transmission Lines via Machine Vision. High Volt. 2021, 6, 904–922. [Google Scholar] [CrossRef]
- Rao, Sriram Prabhakara and Rahman, Farishta and Ranganathan, P. Sag Measurement and Quantification in Transmission Lines: A Review. In 2024 IEEE International Conference on Electro Information Technology (eIT); 2024; pp. 596--602.
- Diniz, L.F.; Pinto, M.F.; Melo, A.G.; Honório, L.M. Visual-Based Assistive Method for UAV Power Line Inspection and Landing. J. Intell. Robot. Syst. Theory Appl. 2022, 106, 41. [Google Scholar] [CrossRef]
- Liu, C.; Wu, Y.; Liu, J. The Growth of UAV Aerial Images-Related Power Lines Detection: a Literature Review of 2023. J. Image Graph. 2023, 1, 3. [Google Scholar]
- Nusantika, N.R.; Hu, X.; Xiao, J. Improvement Canny Edge Detection for the UAV Icing Monitoring of Transmission Line Icing. In Proceedings of the Proceedings of the 16th IEEE Conference on Industrial Electronics and Applications, ICIEA 2021; IEEE, 2021; pp. 1838--1843.
- Iqbal, B.; Iqbal, W.; Khan, N.; Mahmood, A.; Erradi, A. Canny Edge Detection and Hough Transform for High Resolution Video Streams Using Hadoop and Spark. Cluster Comput. 2020, 23, 397–408. [Google Scholar] [CrossRef]
- Alka, NU and Jiya, JD and Anene, E. A Hybrid Method for Power Line Detection Using Canny Filter and Hough Transform. In 11th International Conference on Energy and Power Systems Operation and Planning (Icepsop 2020) With Workshop On Empowering Microgrid with Smart Grid Attributes Development In United States of America; 2020; p. 224.
- Guo, Q.; Hu, X. Power Line Icing Monitoring Method Using Binocular Stereo Vision. In Proceedings of the Proceedings of the 2017 12th IEEE Conference on Industrial Electronics and Applications, ICIEA 2017; IEEE, 2018; pp. 1905--1908.
- Song, Z.; Xin, S.; Gui, X.; Qi, G. Power Line Recognition and Foreign Objects Detection Based on Image Processing. In Proceedings of the Proceedings of the 33rd Chinese Control and Decision Conference, CCDC 2021; 2021; pp. 6689--6693.
|
Disclaimer/Publisher’s Note: The statements, opinions and data contained in all publications are solely those of the individual author(s) and contributor(s) and not of MDPI and/or the editor(s). MDPI and/or the editor(s) disclaim responsibility for any injury to people or property resulting from any ideas, methods, instructions or products referred to in the content. |
© 2024 by the authors. Licensee MDPI, Basel, Switzerland. This article is an open access article distributed under the terms and conditions of the Creative Commons Attribution (CC BY) license (http://creativecommons.org/licenses/by/4.0/).

