1. Introduction
Thermal pollution arises when the heat generated by industrial activities, electronic devices, and vehicles is released into the atmosphere, posing a threat to marine ecosystems. Utilizing heat exchangers and appropriate cooling agents can facilitate the retrieval of this dispersed heat. It is crucial to carefully choose the most suitable heat exchanger configuration and cooling medium to efficiently recover waste heat energy [
1,
2]. Plate heat exchangers are widely employed for heat transfer between hot and cold fluids. These exchangers utilize thin metal plates arranged in a specific pattern, inducing flow turbulence and enhancing heat transfer efficiency. The design involves multiple thin plates aligned to create space between them, with one pipe for cold fluid and another for hot fluid. Heat transfer occurs through the plate walls between the fluids, resulting in increased efficiency. Due to their effectiveness, plate heat exchangers are extensively utilized across various industries [
3].
Various efforts have been undertaken to enhance heat transfer efficiency and reduce transfer time in heat exchangers. Recent advancements in nanotechnology have facilitated these improvements. Typically, heat transfer enhancement involves modifying the design, often through blade adjustments [
4]. Moreover, enhancing the thermal properties of heat transfer fluids can also increase heat transfer within heat exchangers [
5,
6,
7,
8]. Zheng et al. [
9] investigated the impact of nanofluids (Al
2O
3, SiC, CuO, and Fe
3O
4) on water in a plate heat exchanger at varying mass fractions (0.05, 0.1, 0.5, and 1%). They found that at a mass fraction of 1% and volume flows ranging from 3 to 9 L/min, the heat transfer rate increased by 21.9% compared to pure water. Additionally, they developed an experimental model for the Nusselt number based on their findings. Ajeeb et al. [
10] conducted an experimental study on a plate heat exchanger utilizing Al
2O
3 nanofluids prepared at various low concentrations (0.01, 0.05, 0.10, 0.15, and 0.20 vol%) in combination with base fluids including distilled water and a mixture of distilled water with ethylene glycol (15 and 30% ethylene glycol). The experiments covered a range of flow rates from 0.03 to 0.093 l/s. The findings revealed that increasing the concentration of nanoparticles led to improved heat transfer, reaching a maximum enhancement of 27% with a 0.2 vol% concentration of Al
2O
3 in distilled water, albeit accompanied by an 8% rise in pressure drop. However, the heat transfer enhancement diminished with higher proportions of ethylene glycol, with a maximum enhancement of 19.1% observed at 0.2 vol% for Al
2O
3 nanofluid with 30% ethylene glycol.
Many researchers recommend using hybrid nanofluids in plate heat exchangers to enhance performance compared to conventional nanofluids. Hybrid nanofluids, by integrating diverse nanoparticles like metal oxides and carbon nanotubes into the base fluid, typically demonstrate superior thermal conductivity compared to traditional nanofluids [
11,
12,
13,
14,
15,
16,
17,
18,
19,
20,
21,
22,
23]. This incorporation leads to significant enhancements in thermal properties. Additionally, the interaction between different nanoparticles within hybrid nanofluids can generate synergistic effects, further improving dispersion, stability, and heat transfer characteristics [
24,
25,
26,
27,
28,
29]. Moreover, hybrid nanofluids exhibit reduced tendencies for particle agglomeration and sedimentation in contrast to conventional nanofluids [
30,
31,
32,
33,
34,
35]. Bhattad et al. [
36] examined hybrid nanofluids consisting of Al
2O
3–MWCNT/water on a corrugated plate heat exchanger. They explored different volume ratios (5:0, 4:1, 3:2, 2:3, 1:4, and 0:5) with a volume fraction of 0.01%, operating within a flow rate of 2 to 4 L per minute and coolant temperatures ranging from 10 to 25 ◦C. Their results demonstrated a notable 15.2% improvement in the heat transfer coefficient. Sundar et al. [
37] evaluated the efficiency and number of transfer units of a plate heat exchanger utilizing Fe
3O
4–SiO
2/Water hybrid nanofluids. Their findings demonstrated that the introduction of hybrid nanofluids resulted in increased plate heat exchanger effectiveness and number of transfer units. Furthermore, these parameters were further enhanced with higher flow rates of nanofluids. Specifically, with a 1.0% volume of nanofluid in the plate heat exchanger, effectiveness and number of transfer units increased by 13.23% and 24.51%, respectively, at a Reynolds number of 571.9 compared to using water alone. Afshari et al. [
38] conducted an experimental study on the heat transfer characteristics of a plate heat exchanger containing 8, 12, and 16 plates. They used TiO
2/water and TiO
2–Al
2O
3/water hybrid nanofluids at a 1 wt.% concentration. Their results showed that the TiO
2–Al
2O
3/water hybrid nanofluid exhibited superior heat transfer rates compared to the TiO
2/water nanofluid. Additionally, they observed a respective increase in the heat transfer coefficient of 7.5%, 9.6%, and 12.3% with 8, 12, and 16 plates when using the TiO
2–Al
2O
3/water nanofluid.
After acknowledging the beneficial impact of nanofluids on improving the thermal performance of plate heat exchangers and recognizing the effectiveness of hybrid nanofluids, limited research has been conducted in this area. Previous studies predominantly focused on Al2O3 or TiO2 hybrids, neglecting the consideration of MWCNTs–SiO2 hybrid nanofluids. Additionally, there is a lack of comparison between the effects of individual nanoparticles and hybrid ones in the literature. Thus, for the first time, we not only investigated MWCNTs, SiO2, and MWCNTs–SiO2 hybrid nanofluids in the heat transfer properties of plate heat exchangers but also examined and validated a comprehensive range of influential parameters in this study.
Thus, in this evaluation, a plate heat exchanger was simulated using computational fluid dynamics with Fluent and Gambit softwares. The system and nanofluid properties were determined through user-defined functions (UDFs) and a C++ program. Ethylene glycol (EG) served as the base fluid, with nanoparticles including SiO2, MWCNTs, and a hybrid combination. The Reynolds-Averaged Navier-Stokes (RANS) method was employed to model turbulent flows, and the nanoparticles were compared in both single-phase and two-phase (mixture model) states. Nusselt number, convective heat transfer coefficient, and pressure drop variations were computed for Reynolds numbers of 60, 120, 180, 240, and 480, and concentrations of 0, 0.11, 0.26, 0.47, 0.62, and 0.86 wt.%.
3. Results and Discussion
3.1. Geometric Model
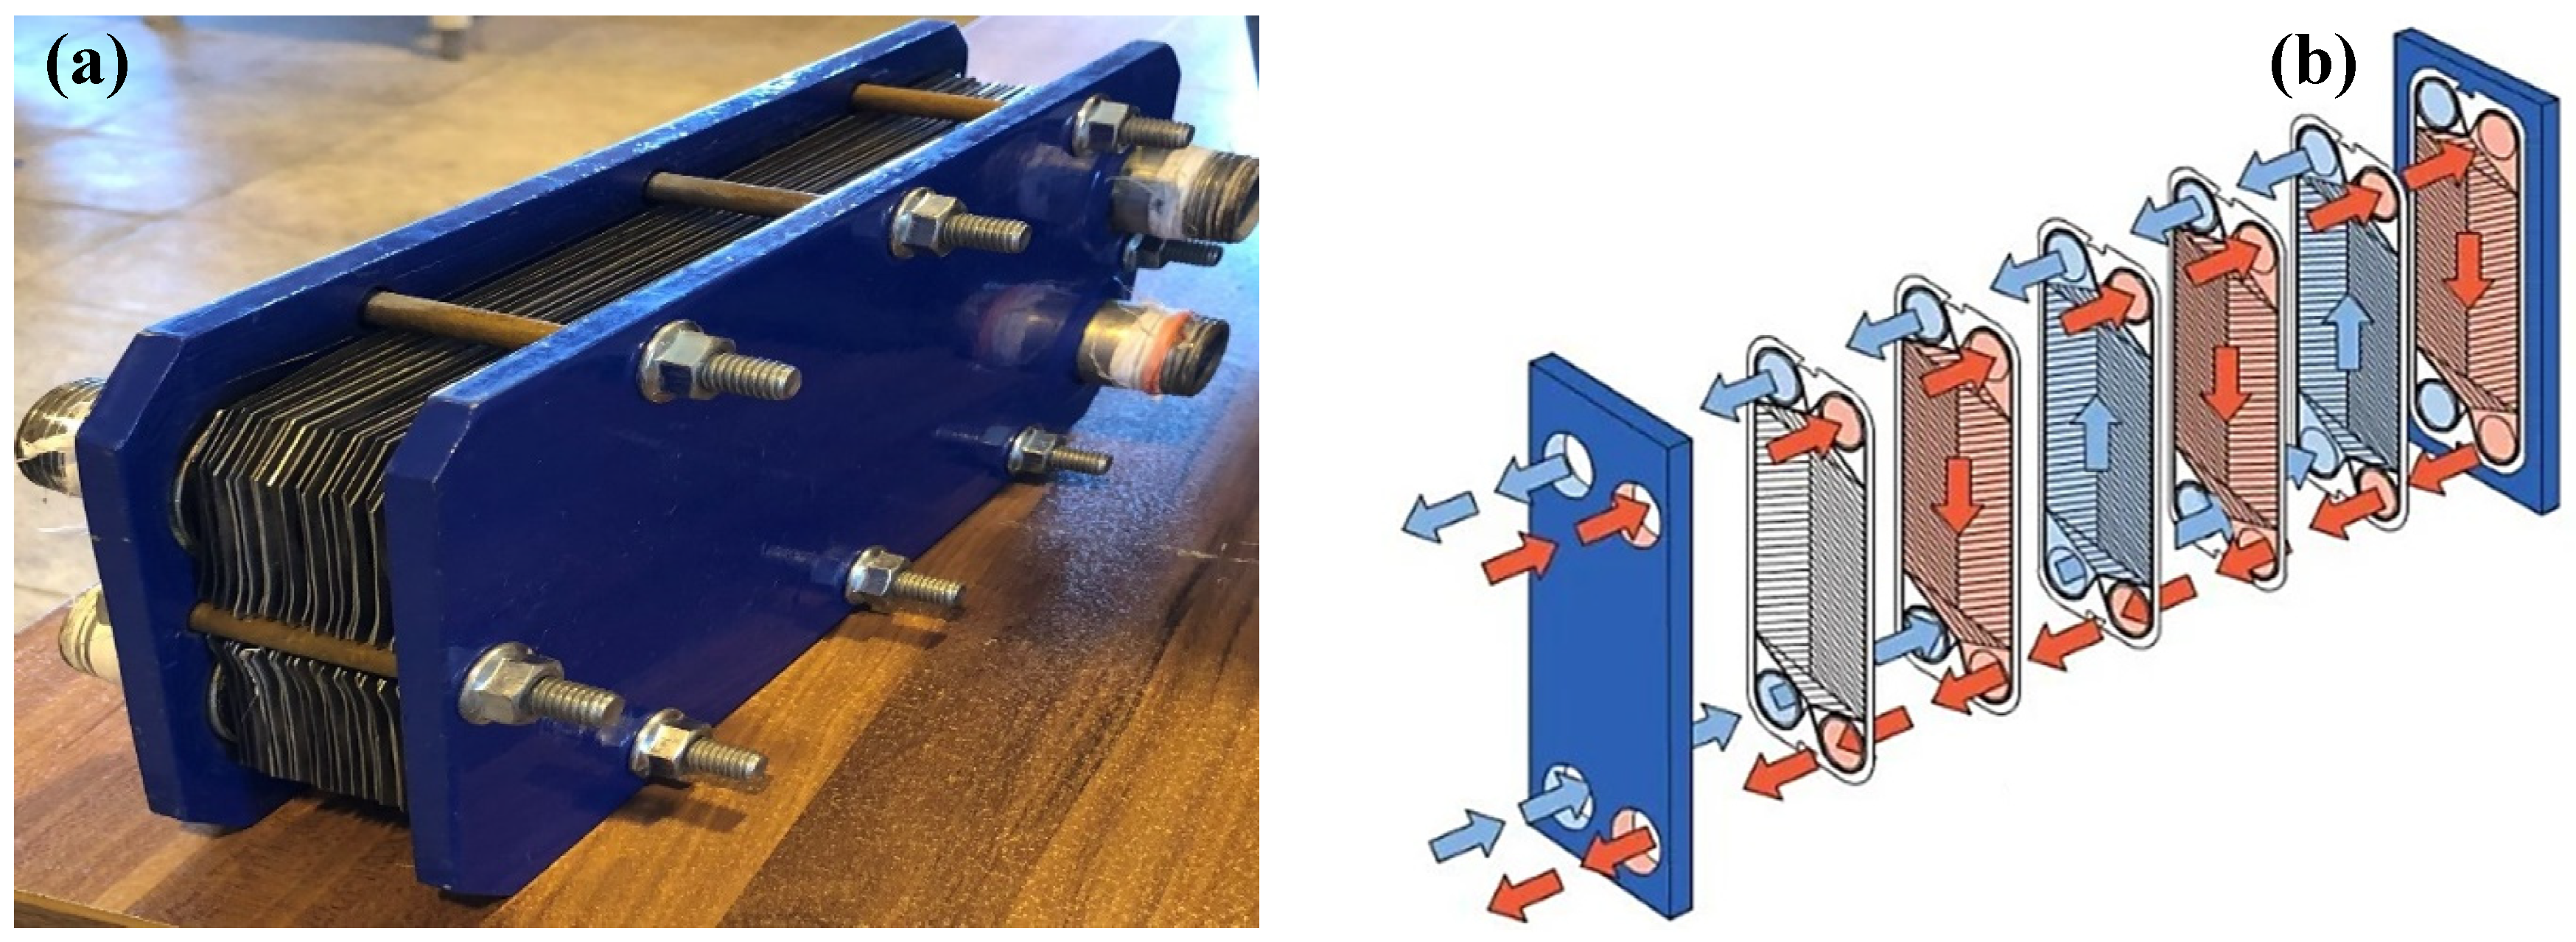
As illustrated in
Figure 1, the geometry of PHE involves placing multiple plates in a stacked arrangement, which were separated from each other by gaskets. As observed in
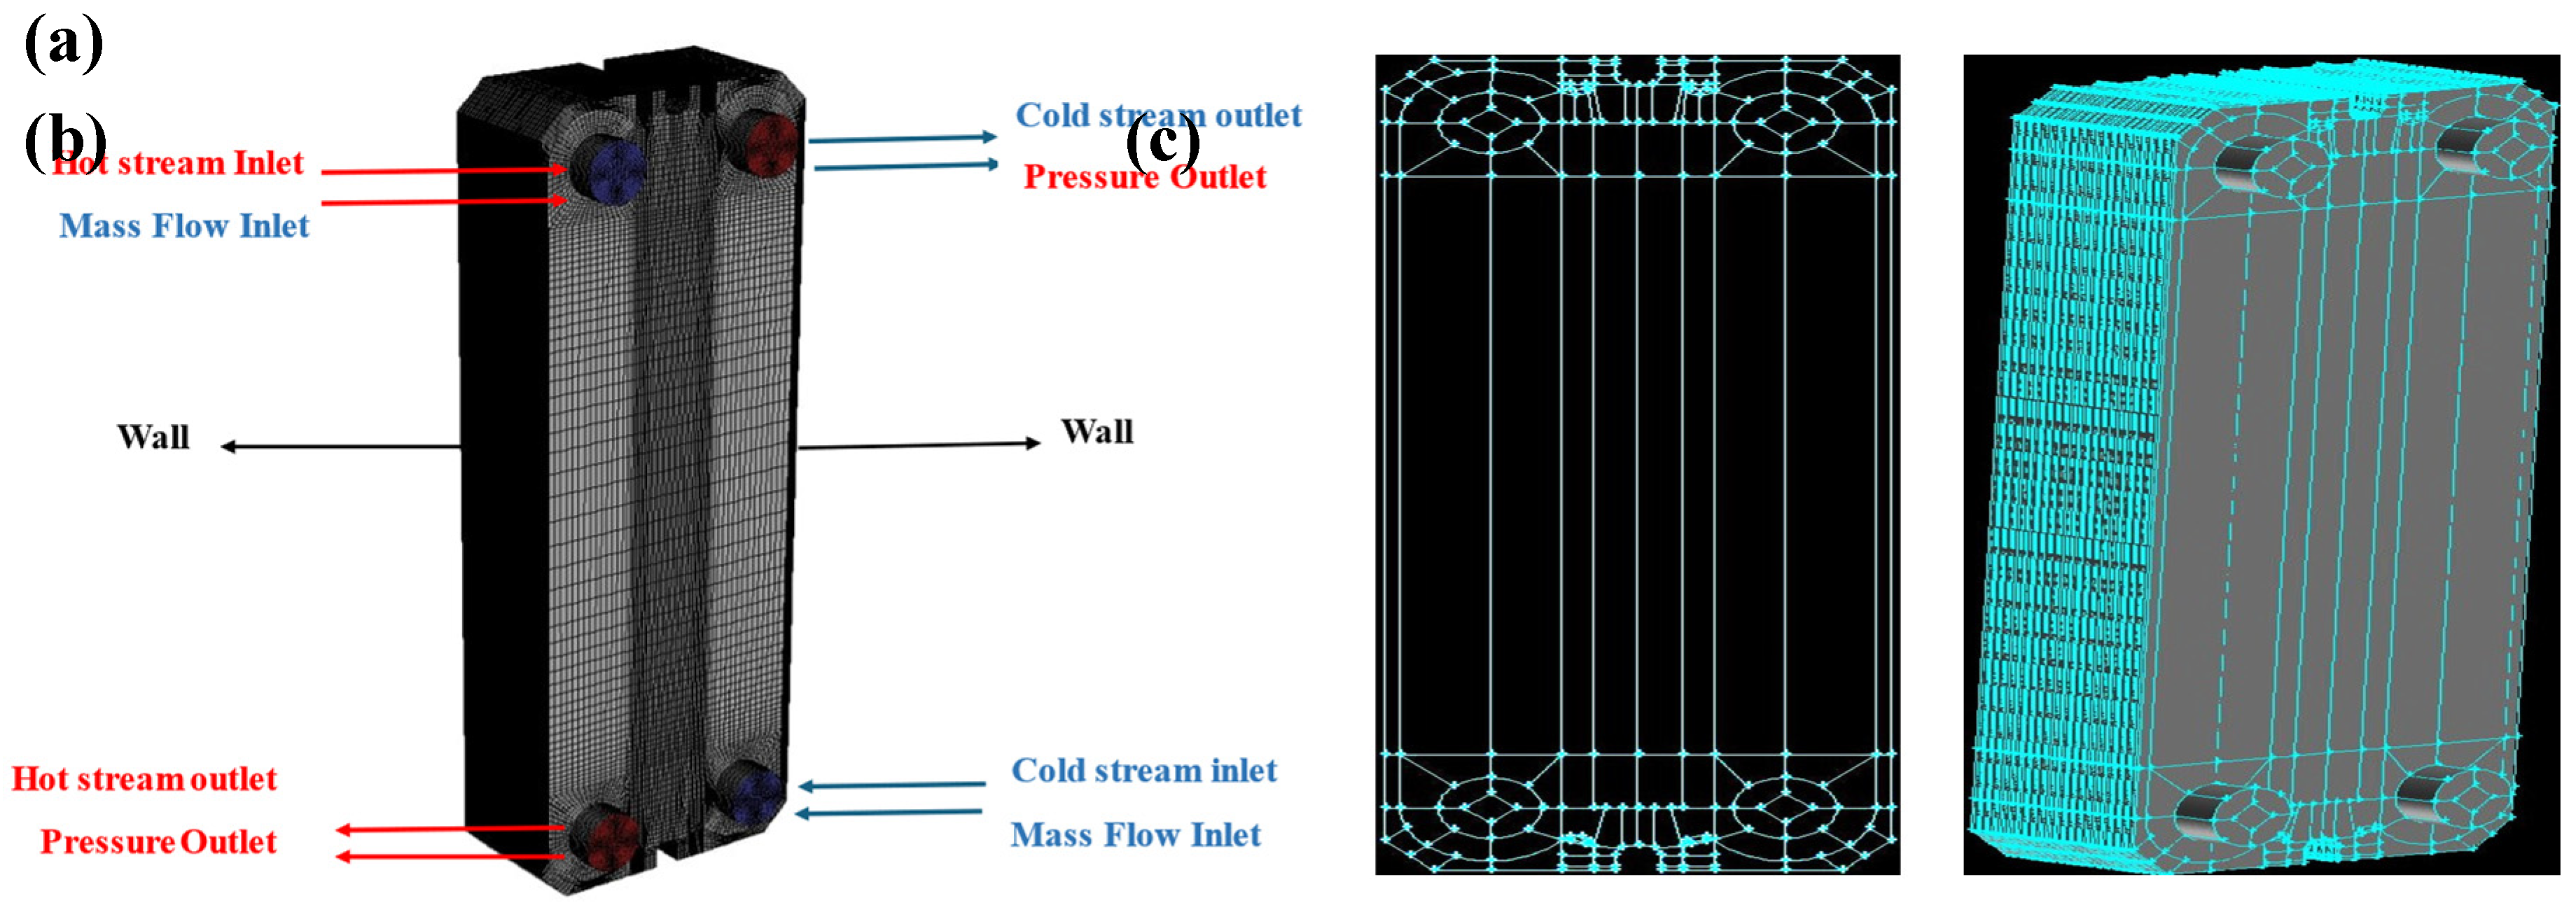
Figure 2a, for heat exchange in the specified PHE, two streams of hot and cold fluids were defined in the Fluent software according to the diagram. The cold stream, with a temperature of 22.4 °C, entered from the bottom of the heat exchanger and exited from the top, maintaining a pressure of 101325 Pa (1 atm). The hot stream, with a temperature of 50.5 °C, entered from the top of the heat exchanger, and after heat exchange with the cold stream at a constant pressure (1 atm), exited from the bottom. In the assessment of heat transfer parameters and pressure drop, hybrid nanoparticles were introduced into the fluid stream at a concentration of 0.86 wt.%. The Reynolds number under investigation spanned from 60 to 480. As stated in
section 2.1, Gambit was employed for domain blocking and mesh generation in this research. As depicted in
Figure 2b-c, the blocking process was based on the selection of appropriate points and the subsequent generation of lines, surfaces, and ultimately volumes. This procedure was established not only for mesh lines but also for mesh surfaces and volumes. The intended mesh was of hexahedral type with a structured arrangement, cast on the geometric blocks, forming a network with an organized structure. Additionally, for more accurate prediction and precise solution of the governing equations of the flow, near the walls of the flow surfaces, a boundary layer mesh has been utilized.
3.2. Solver Settings and Boundary Conditions
In this study, the governing equations underwent resolution in an incompressible and transient fashion employing the finite volume method. Given the low fluid velocity, the resolution of the problem employed a pressure-based solver. This solver facilitated the acquisition of the velocity field through the solution of momentum equations. The pressure field, on the other hand, was ascertained by addressing the pressure correction equation derived through the manipulation of continuity and momentum equations. To augment the precision of the results, advanced discretization methods of higher order were deployed throughout the simulation. For pressure-velocity coupling, gradient, and pressure equations coupled, cell-based least squares, and second order solutions were applied, respectively. While the second order upwind method was used for solving momentum, turbulent kinetic energy, turbulent dissipation rate, and energy equations.
The method applied to the momentum and energy equations for grid discretization involved a second-order accuracy. Furthermore, a second-order algorithm was utilized for pressure calculation. Calculations were carried out with accuracy up to 10
-6 for all equations. To achieve desirable convergence with fewer iterations, a coupled algorithm was used to couple the velocity and pressure equations for steady-state solutions. In transient simulations, this method provides accurate and comprehensive solutions for large time steps. In contrast to the segregated approach, the coupled solution method simultaneously solves a set of coupled momentum equations and pressure-based continuity equations, eliminating the need for solving a pressure correction equation. Following the simultaneous solution of pressure and velocity fields, the remaining equations, such as the energy equation, were solved separately as in the previous method. The Coupled method allows for simultaneous convergence of pressure and velocity equations, enhancing the convergence of the problem; However, it occupies more memory, approximately 3.1 times more, compared to the segregated approach. The boundary conditions governing the problem were determined according to
Table 5. The relaxation factor for pressure and momentum was set at 0.5, while for turbulent kinetic energy, turbulent dissipation rate, and energy, was adjusted to 0.75. Density, body forces, and turbulent viscosity were individually set to a value of 1.
3.3. Grid Independence
Ensuring that the numerical solution results remain consistent regardless of the computational grid is a crucial first step in any numerical simulation. The objective was consistency in results, regardless of the mesh employed. To evaluate this independence, an initial coarse mesh was generated, initiating the simulation. A selected variable underwent scrutiny to examine mesh independence. Subsequently, a finer mesh with an increased number of cells was utilized, and the results were compared with those from the initial stage. If changes proved negligible, the initial coarse mesh was deemed optimal. In instances of significant changes, a finer mesh was reintroduced, and the results were compared to the preceding stage. This iterative process persisted until the mesh achieved the desired fineness, resulting in minor or constant changes with an increased number of cells. Thus, a network with an optimal cell count for numerical simulation was identified. Furthermore, the network had to adhere to standard criteria, encompassing aspect ratio, orthogonality quality, skewness, etc. The augmentation of network cells should not compromise overall network quality.
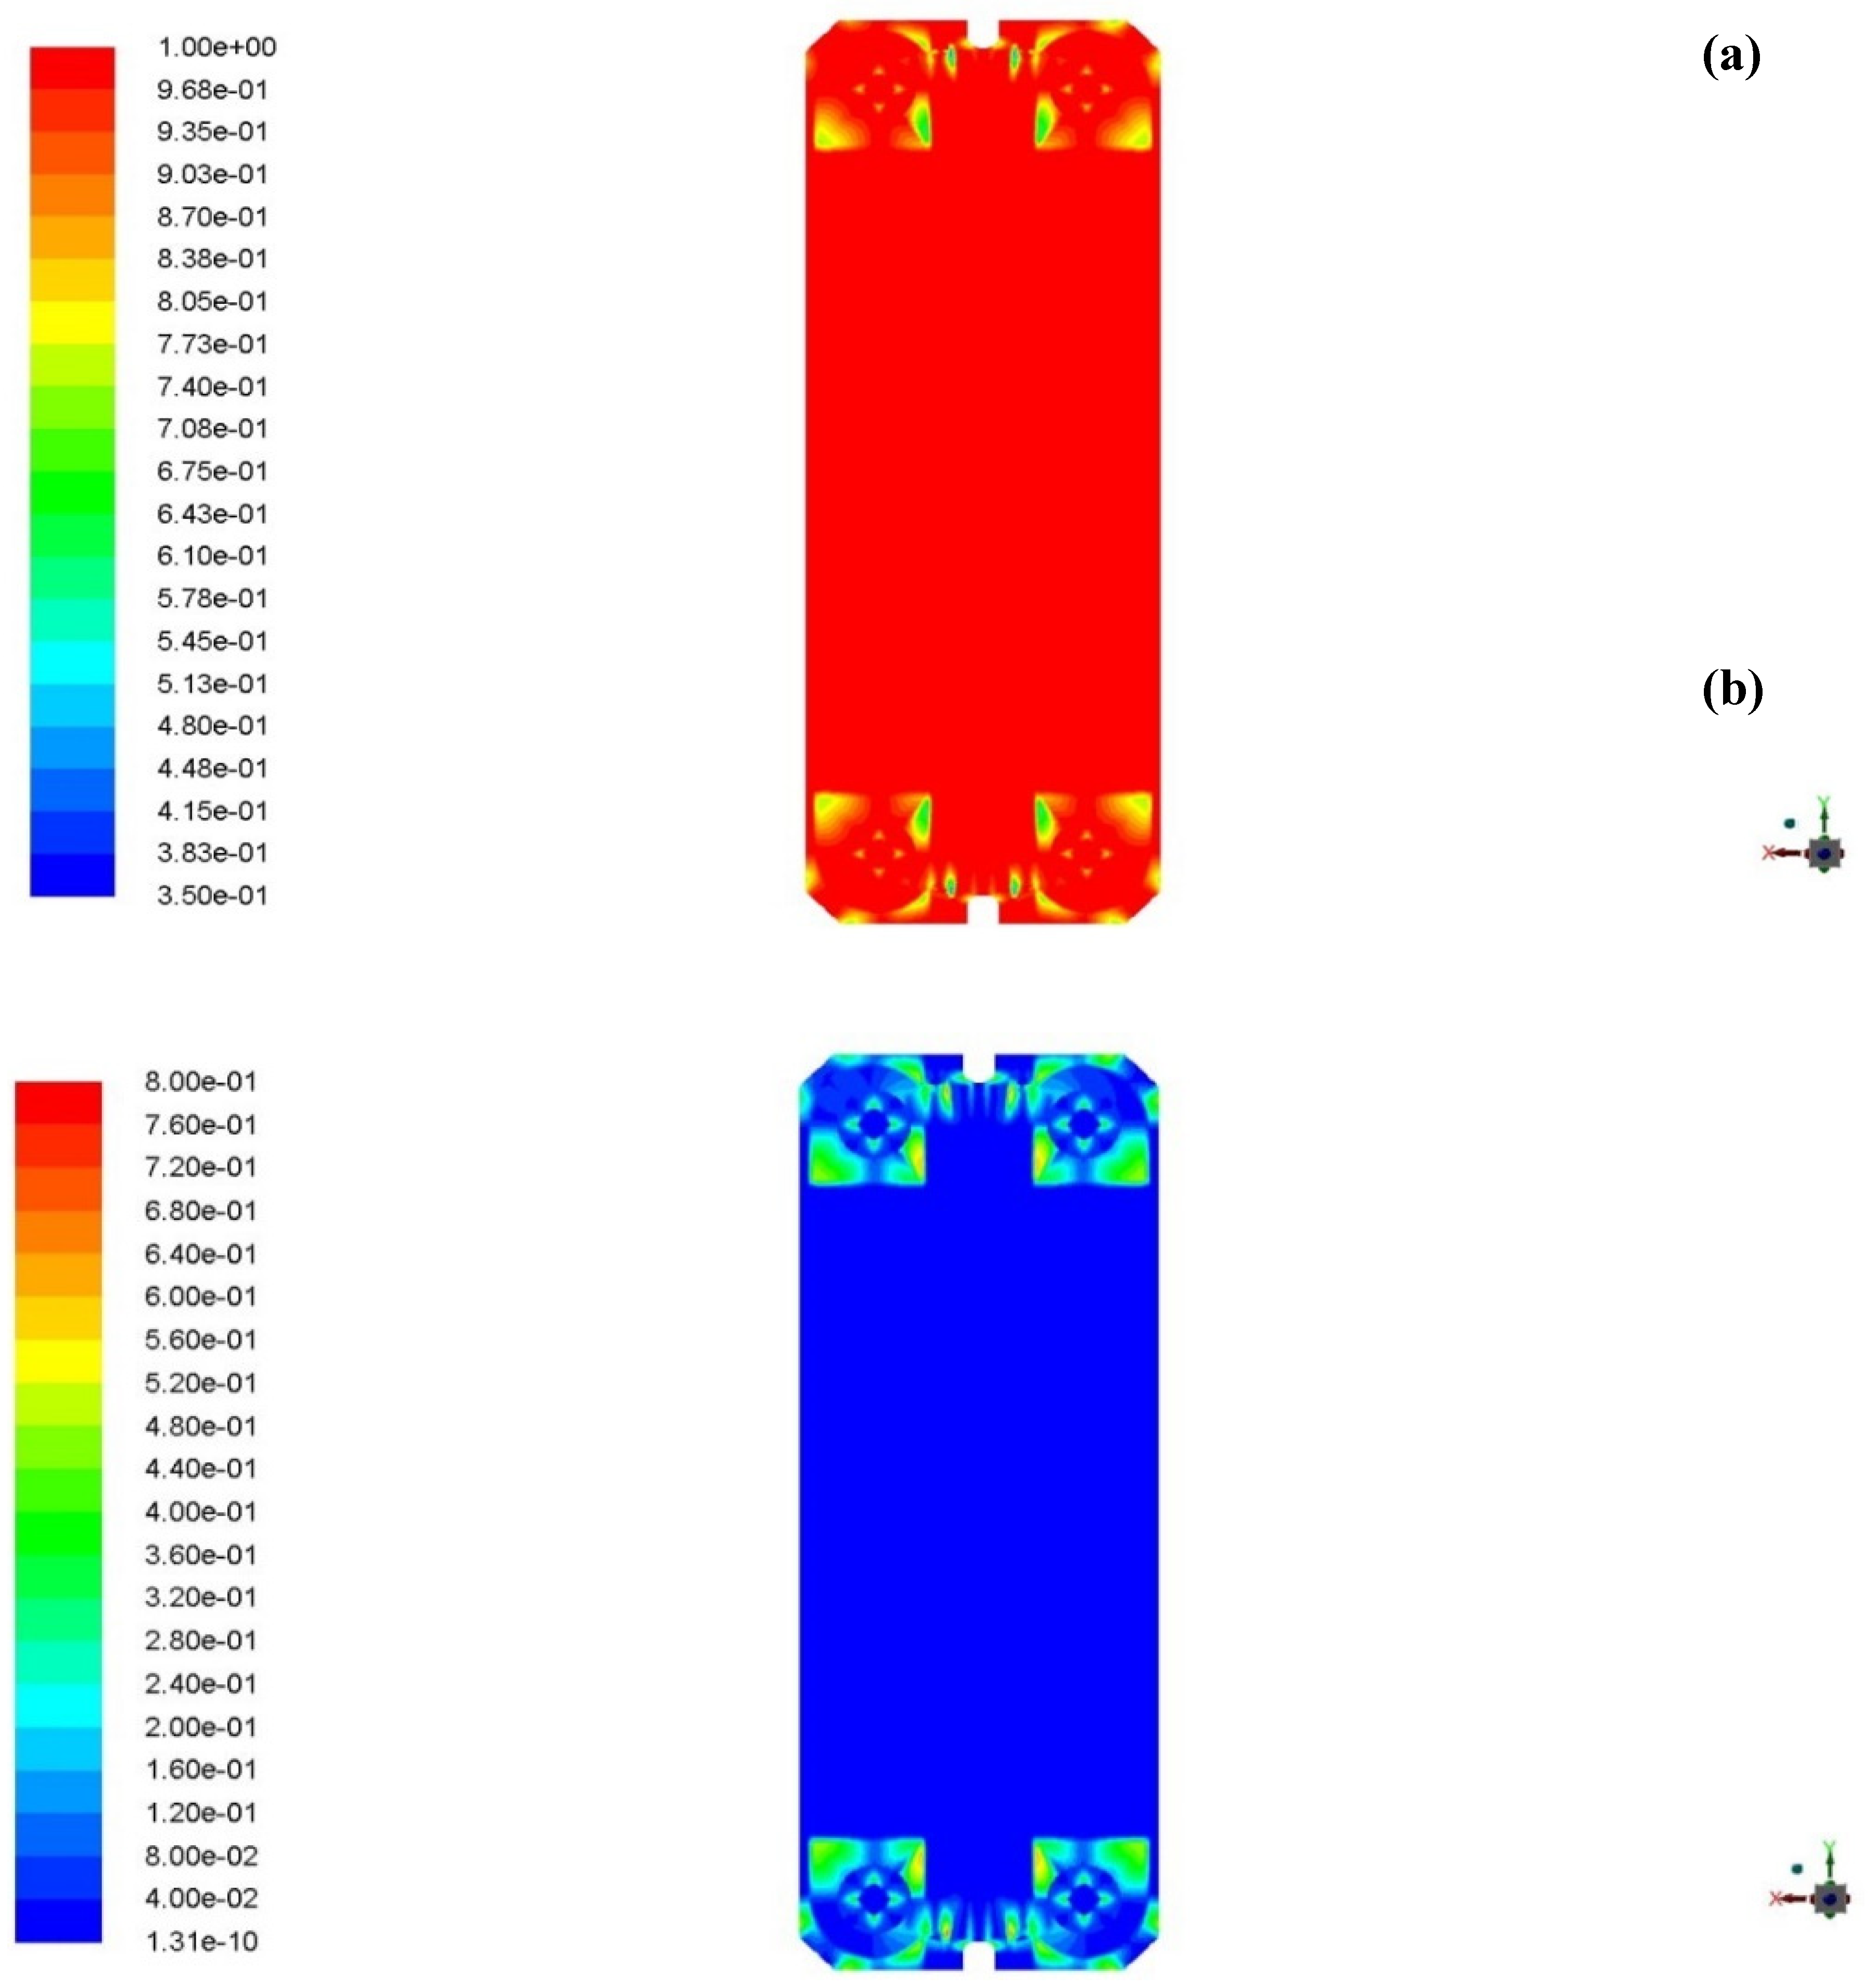
Figure 3a-b illustrates quality contours of the network, with corresponding data specifying aspect ratio, orthogonal quality, and cell equiangular skewness values at 1.000-25.000, 0.367-1.000, and 0.000-0.774, respectively.
As depicted in
Figure 3a, the orthogonal quality parameter showcased the degree of orthogonality quality among cells in the network, with values spanning from zero to one. A proximity to one signified heightened orthogonality and quality, whereas values nearing zero indicated diminished orthogonality. Furthermore, it was apparent that within the central regions of the designated network, where the most substantial heat transfer occurred, the values of this parameter approached one, signifying an exemplary level of network quality. This observation reinforces the notion of superior network performance in regions critical to heat transfer within the specified network. The skewness parameter ranged between zero and one, indicating the grid skewness. A value of zero corresponded to excellent grid quality when the angles of the nodal elements were in degrees, and as the angles became sharper, the value approached one. Non-compliance with this criterion significantly affected the accuracy of the solution, leading to errors in the diffusion term. As observed in
Figure 3b, the skewness parameter in heat transfer-sensitive areas, namely the central regions, exhibited values close to zero, signifying excellent network quality. Other areas, including the inlet and outlet channels, also showed values inclined towards zero, depicting an acceptable description of network quality in these regions.
To assess mesh independence in the numerical results for the heat exchanger, an initial coarse mesh of 311,748 cells was generated, and outlet temperatures for the hot and cold streams were acquired. Subsequently, the cell count was approximately doubled to 749,418 cells. The noticeable slope in the temperature change diagram at the hot outlet prompted an increase in the mesh cell count to around 1,159,080 (approximately 1.6 million). In this scenario, the temperature changes at the outlets of both hot and cold streams in both models remained significant. The mesh cell count was further increased to nearly 1.75 million (1,749,930), maintaining a high slope in the temperature changes at the cold outlet for both models. However, the slope of temperature changes decreased concerning the number of cells in the computational mesh for the hot stream, indicating an approach to an optimal mesh. Subsequently, the mesh cell count reached the maximum examined value, i.e., 3.5 million (3,457,801). In this case, the temperature changes at the outlets of both hot and cold streams for both models became negligible. Consequently, the mesh with 3.5 million cells was deemed suitable for further simulation. Although the mesh with 3.5 million cells provided more accurate numerical results, 1.75 million cells had significantly less computational time and was more economic with an acceptable accuracy. The investigation of mesh independence is presented in
Table 6, categorized into two based on the outlet temperatures of the cold and hot streams into two distinct cases.
In
Figure 4a-b and
Figure 4c-d, the examination of grid independence is illustrated for the first and second states, specifically focusing on the outlet temperature of both the cold and hot streams. The depicted results in
Figure 4a-d reveal negligible differences in the outlet temperature, leading to the selection of 1.75 million cells for the subsequent phases of the study.
3.4. Model Validation
Validation of numerical methods in computational fluid dynamics is essential to ensure the precision of the chosen computational approach. Typically, this involves comparing numerical results with experimental data. However, the reliability of this comparison hinges on the close alignment of the experimental model with the numerical research model. In this study, validation was conducted based on the research by Abbasi et al. [
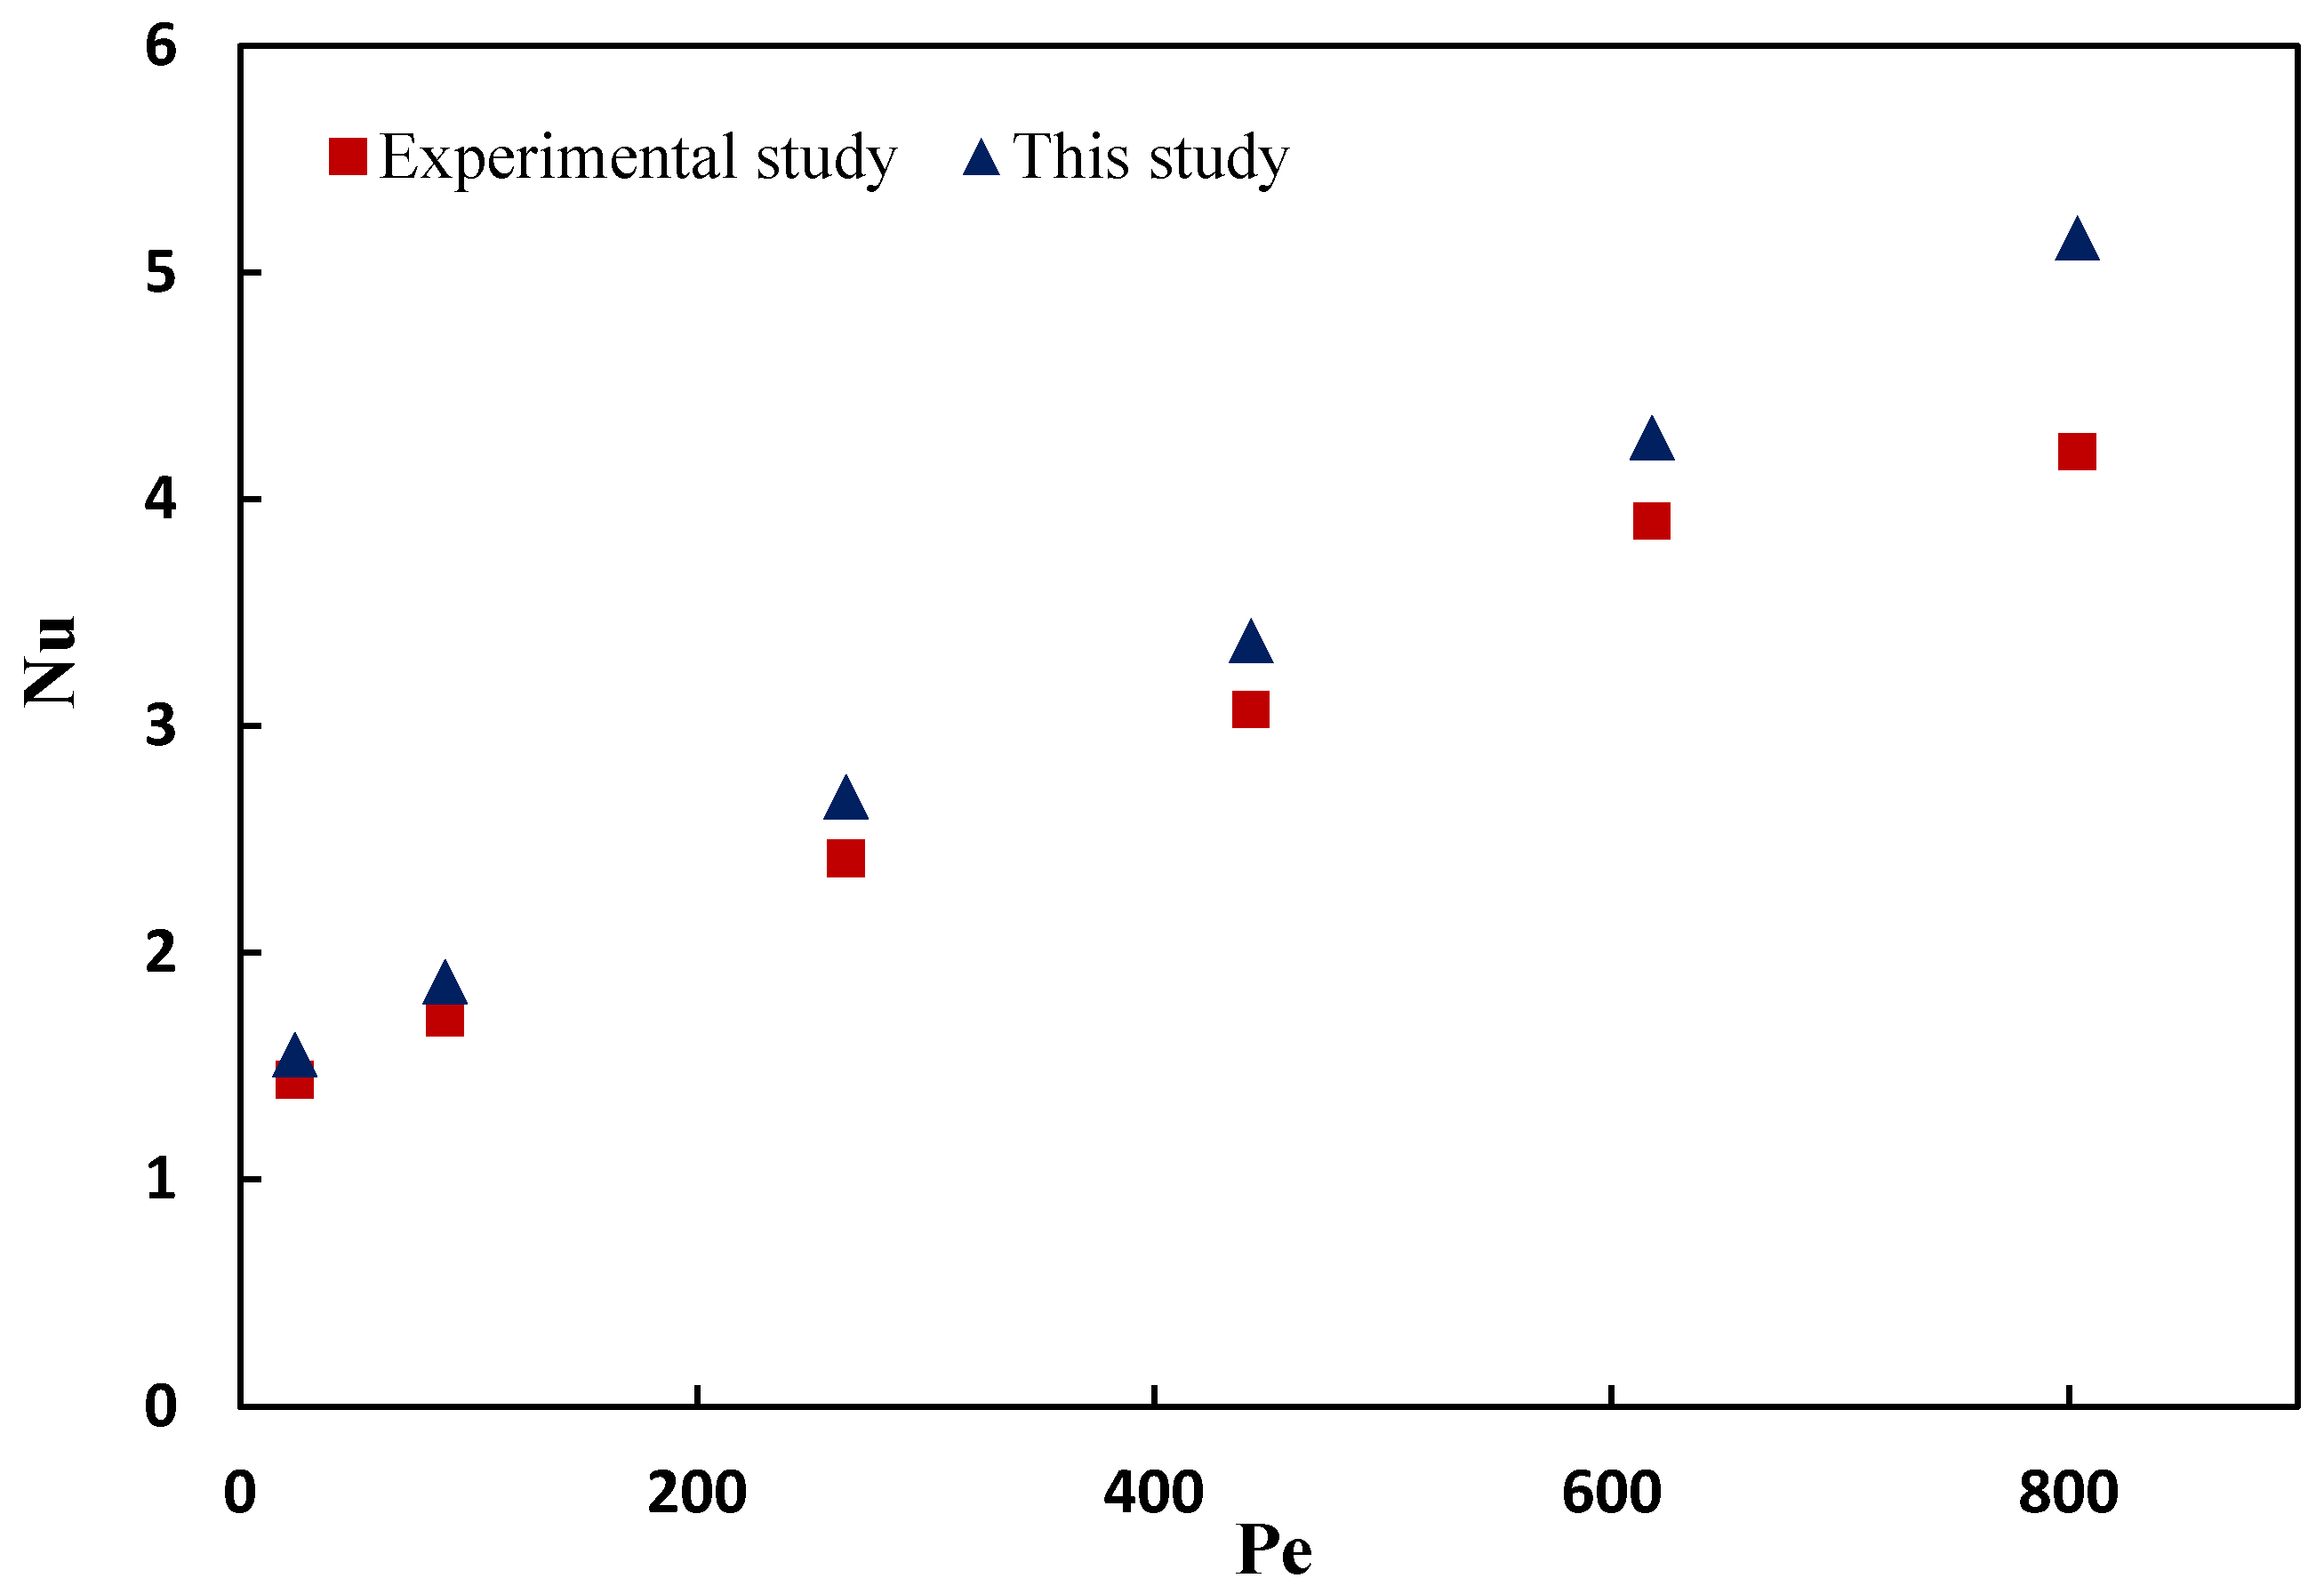
60], carried out within our research group. The geometric parameters employed were consistent with those in the referenced research, with a focus on carboxyl and hydroxyl-functionalized nanoparticles. For this specific validation, non-slip conditions were applied to the carboxyl-functionalized MWCNTs at a volumetric fraction of 0.3%, as illustrated in
Figure 5. The simulation results exhibited a high degree of concordance with experimental findings, affirming the precision of the numerical solution.
3.5. Thermophysical Properties
Following the model verification, our investigation advanced towards its primary objective: examining the impact of hybrid SiO2-MWCNTs presence in EG on heat transfer and pressure drop within an experimental geometry. The outcomes derived from simulations under both single-phase and two-phase conditions were detailed. The convective heat transfer coefficient (h), Nusselt number (Nu), and pressure drop (∆p) emerged as the central subjects of discussion and analysis in this study.
Variations of the Nusselt number as a function of hybrid nanoparticle concentration corresponding to Reynolds numbers of 60, 120, 180, 240, and 480 are illustrated in
Figure 6. To account for limitations in the concentration of the specified nanoparticle in the equations governing its thermophysical properties, specifically the thermal conductivity coefficient, a concentration composition ranging from 0 to 0.86 wt.% was considered. The results revealed a positive correlation between the Nusselt number and the concentration of hybrid nanoparticles. Additionally, at constant concentration, an increase in the Reynolds number led to a higher Nusselt number. For instance, at a concentration of 0.26 wt.%, the Nusselt number values were 10.18, 13.89, 16.93, 16.57, and 27.52 at Reynolds numbers of 60, 120, 180, 240, and 480, respectively. Furthermore, the escalation of the Reynolds number induced a transition to more turbulent flow, diminishing fluid accumulation and stagnation. This turbulent flow played a crucial role in augmenting the Nusselt number, particularly at higher concentrations and Reynolds numbers. The Reynolds number, representing fluid velocity within the channels, was expressed as a non-dimensionalized flow rate in numerical methods. Hence, the justification for the observed relationship between the Nusselt number and the Reynolds number was grounded in the fluid dynamics principles. Notably, the highest Nusselt number for a concentration of 0.86 wt.% was achieved at a Reynolds number of 480, registering a 10.76% increase compared to the base fluid.
Similar trends were identified in a study conducted by Bazdar et al. [
61], where the Nusselt number demonstrated an increase with rising Reynolds numbers and volume fractions of nanoparticles. The enhancement in heat transfer can be justified by the introduction of nanoparticles, resulting in a concurrent increase in the conductive heat transfer coefficient and a reduction in the specific heat capacity of the base fluid. This phenomenon underscored the improved thermal performance observed in the system. The addition of nanoparticles contributed to heightened conductive heat transfer coefficients within the fluid medium. The presence of these nanoparticles facilitated more efficient heat conduction through the medium, promoting an overall enhancement in thermal conductivity. Simultaneously, the reduction in the specific heat capacity of the base fluid further increased the heat transfer efficiency. With a decreased specific heat capacity, the fluid required less energy to undergo temperature changes, thereby promoting more effective and rapid heat transfer processes.
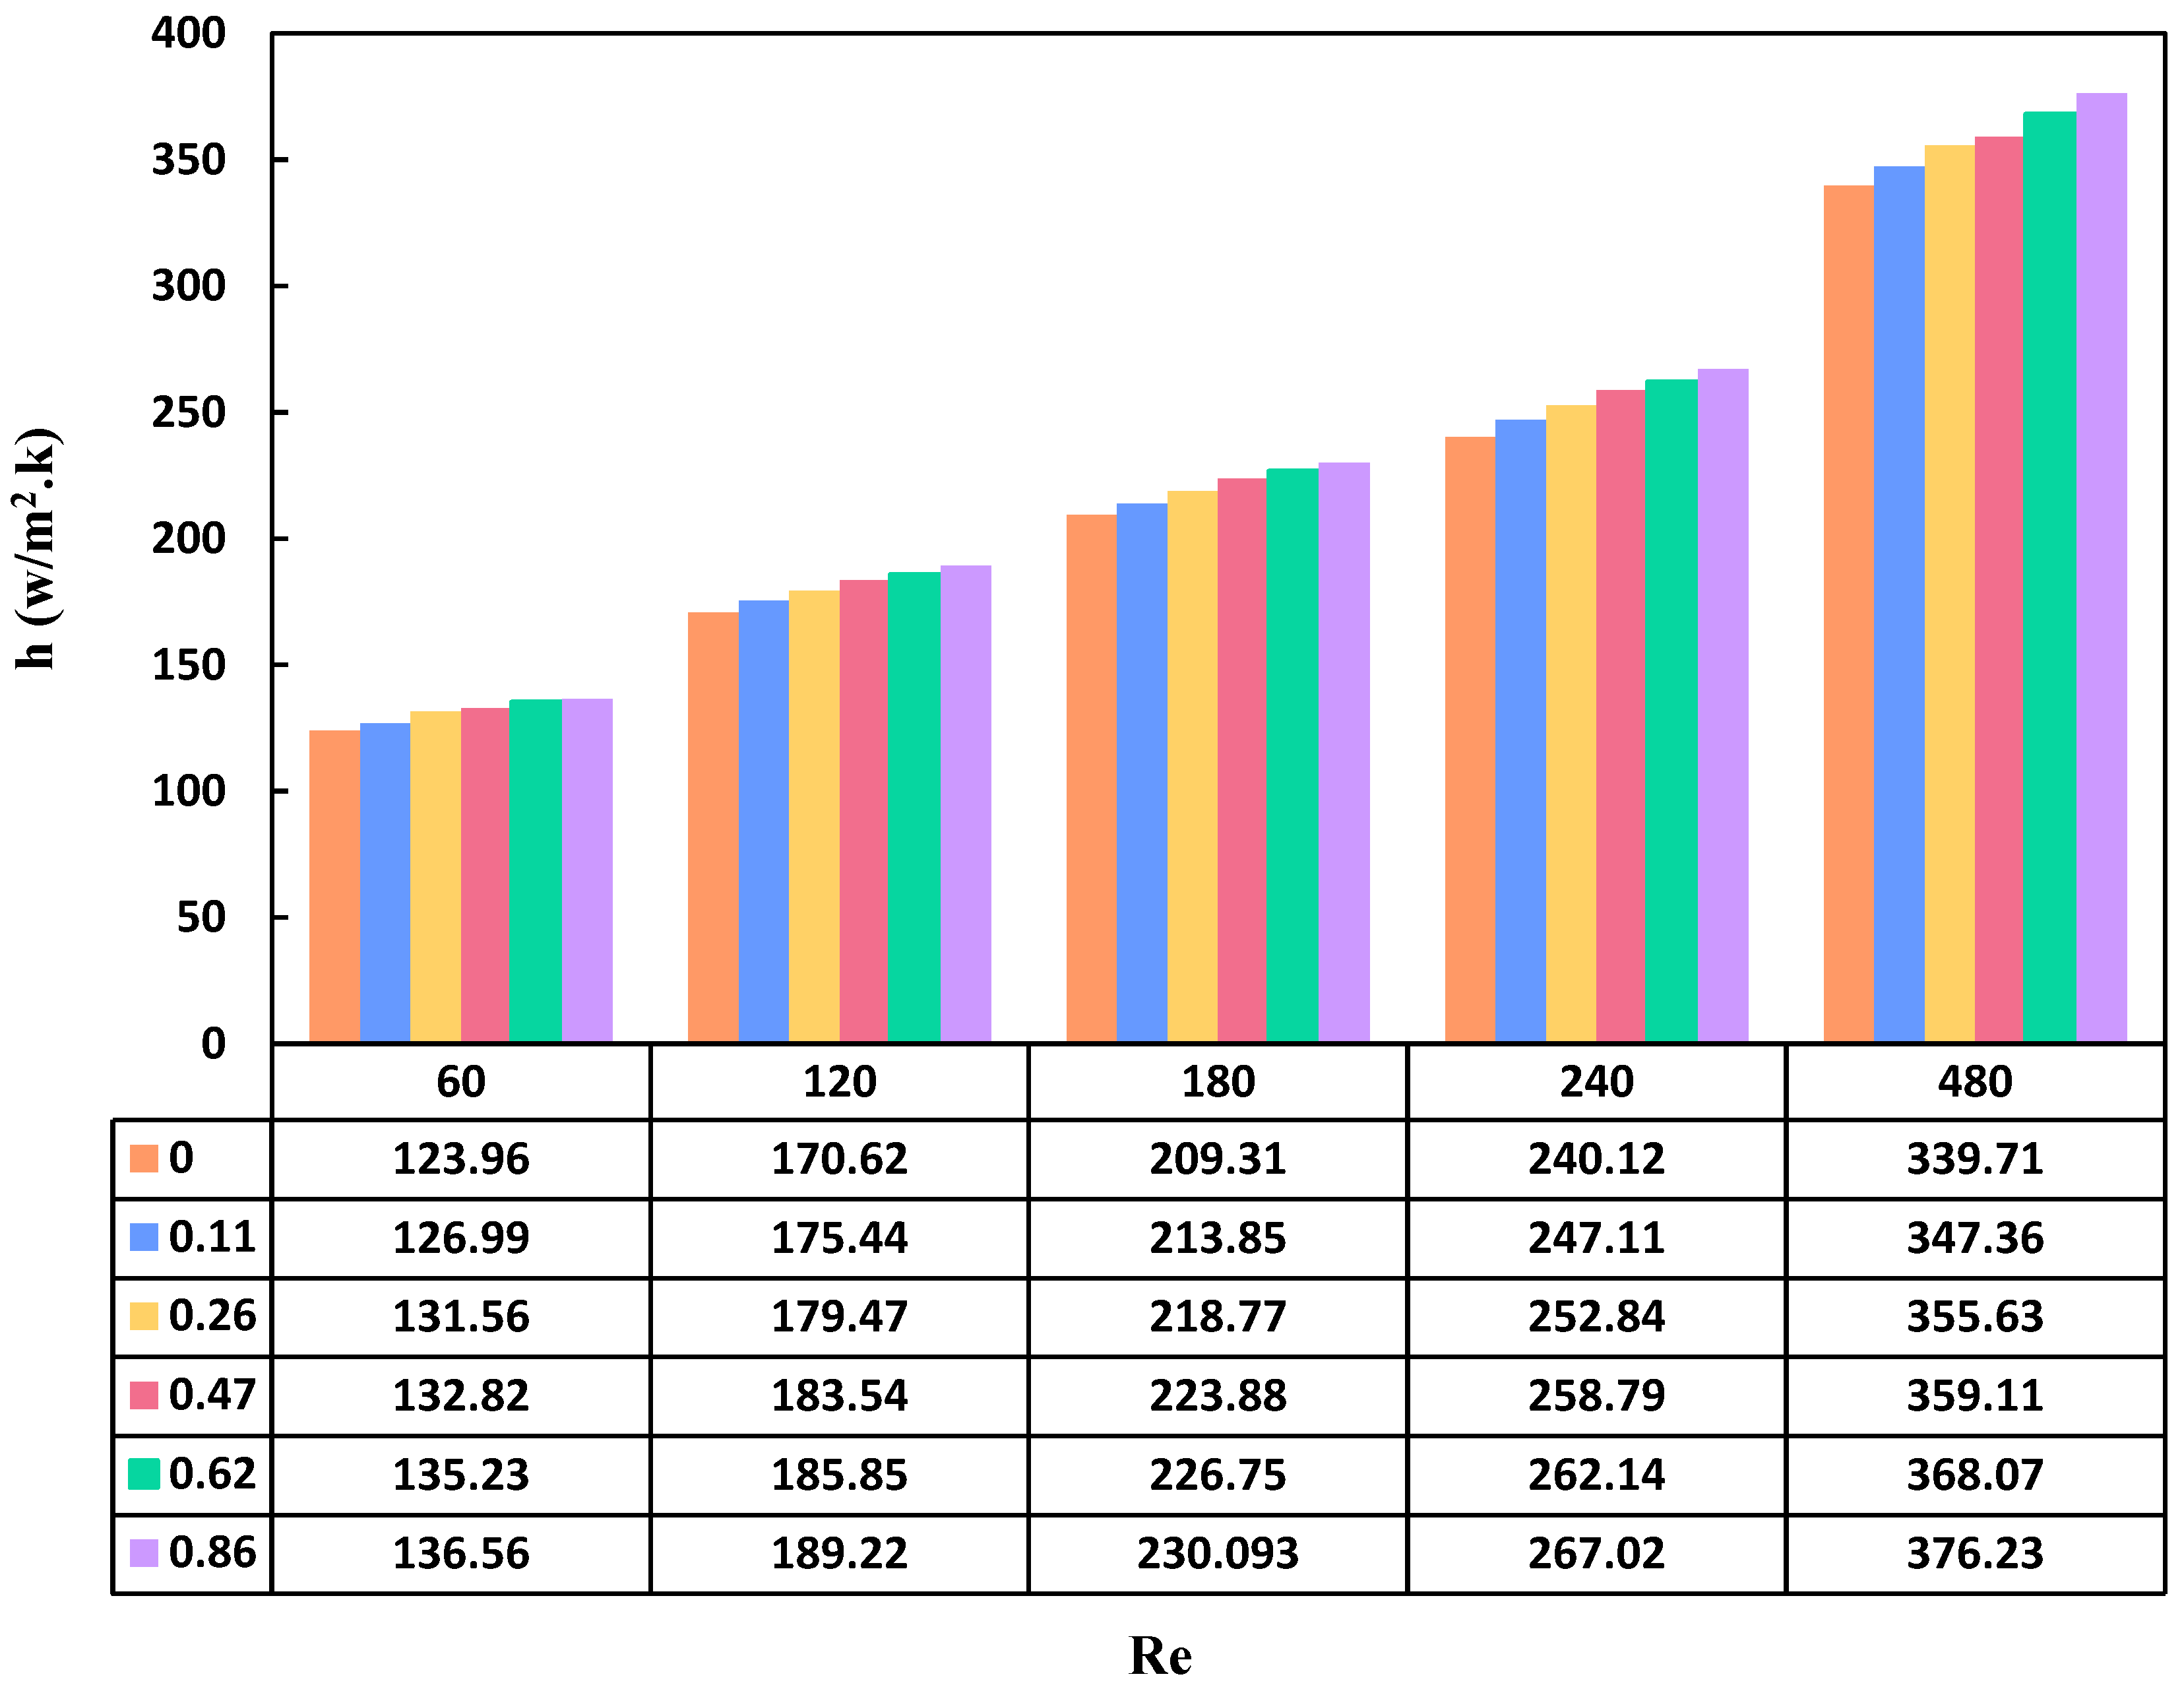
Investigating the effect of nanoparticle concentration (ranging from 0 to 0.86 wt.%) on the convective heat transfer coefficient at different Reynolds numbers (240, 180, 120, 60, and 480) revealed intriguing insights, as illustrated in
Figure 7. Upon analyzing the obtained results alongside equations 27 and 32, a clear direct correlation emerged between the convective heat transfer coefficient, the Nusselt number, and consequently, the Reynolds number. Notably, the variations in the convective heat transfer coefficient demonstrated an increasing trend with higher concentrations. This phenomenon can be attributed to the heightened thermal conductivity exhibited by nanofluids in comparison to the base fluid. Additionally, the proportional relationship between thermal conductivity and the heat transfer coefficient further emphasized this trend [
62]. To illustrate, at a consistent Reynolds number of 60, the heat transfer coefficient for the base fluid, nanofluid with 0.11, 0.26, 0.47, 0.62, and 0.86 wt.% was 123.96, 126.99, 131.56, 132.82, 135.23, and 136.56 W/m
2·K, respectively. Tu et al. [
63] explored the impact of nanofluid concentration on heat transfer across various Reynolds numbers, yielding similar trends in their findings.
Examining the obtained results included studying the profile of the convective heat transfer coefficient in relation to the Reynolds number. While maintaining a constant nanoparticle concentration, an increase in the Reynolds number resulted in an augmentation of the heat transfer coefficient. This phenomenon can be attributed to the escalating viscosity of the nanofluid due to the addition of nanoparticles. The heightened viscosity amplified the volumetric flow rate, acting as a rationale for the increased convective heat transfer coefficient with the Reynolds number. As illustrated in
Figure 7, the profile of the heat transfer coefficient exhibited more significant changes at higher Reynolds numbers compared to lower Reynolds numbers. The maximum heat transfer coefficient value was observed at a concentration of 0.86 wt.% and a Reynolds number of 480, reaching 376.23 W/m
2·K. This indicated a 10.75% increase compared to the base fluid.
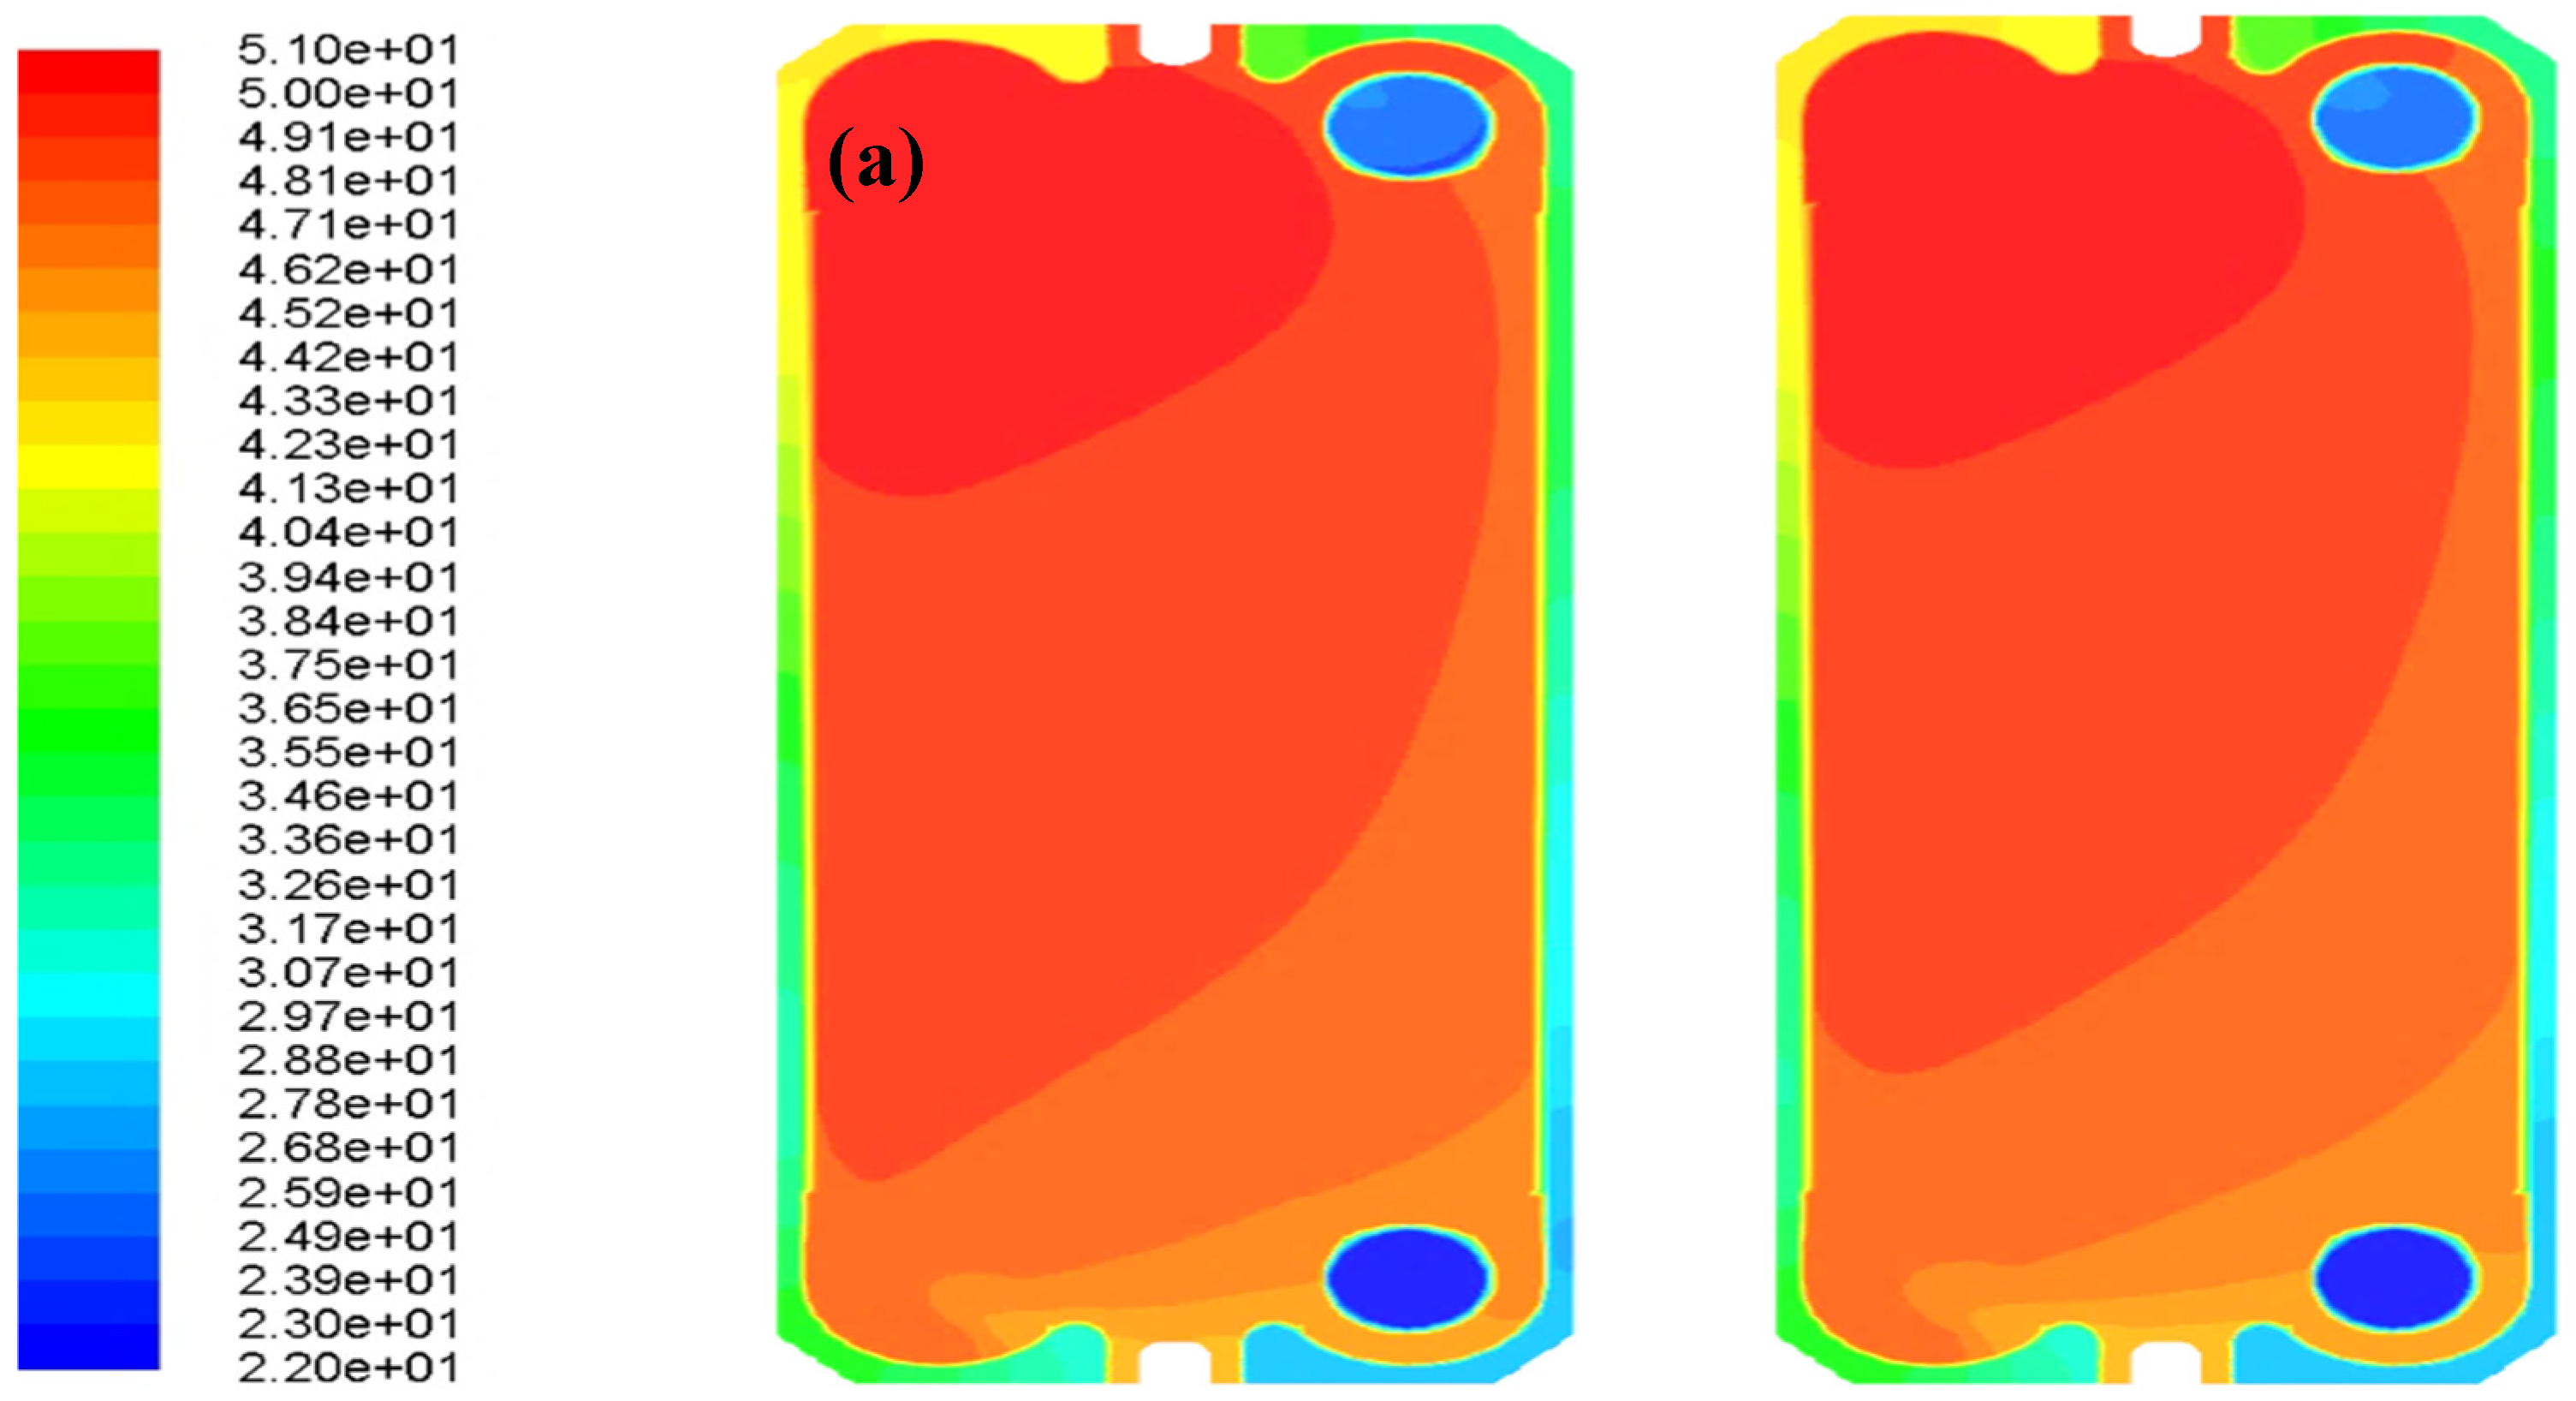
To enhance the comprehension of the nanoparticle’s influence on the convective heat transfer coefficient, temperature contours are displayed for the highest Reynolds numbers and 0 and 0.86 wt.% concentrations in
Figure 8. Increasing concentration of nanoparticles led to a reduction in the temperature of the hot surfaces, which suggested a positive impact of nanoparticles on heat transfer and cooling efficiency.
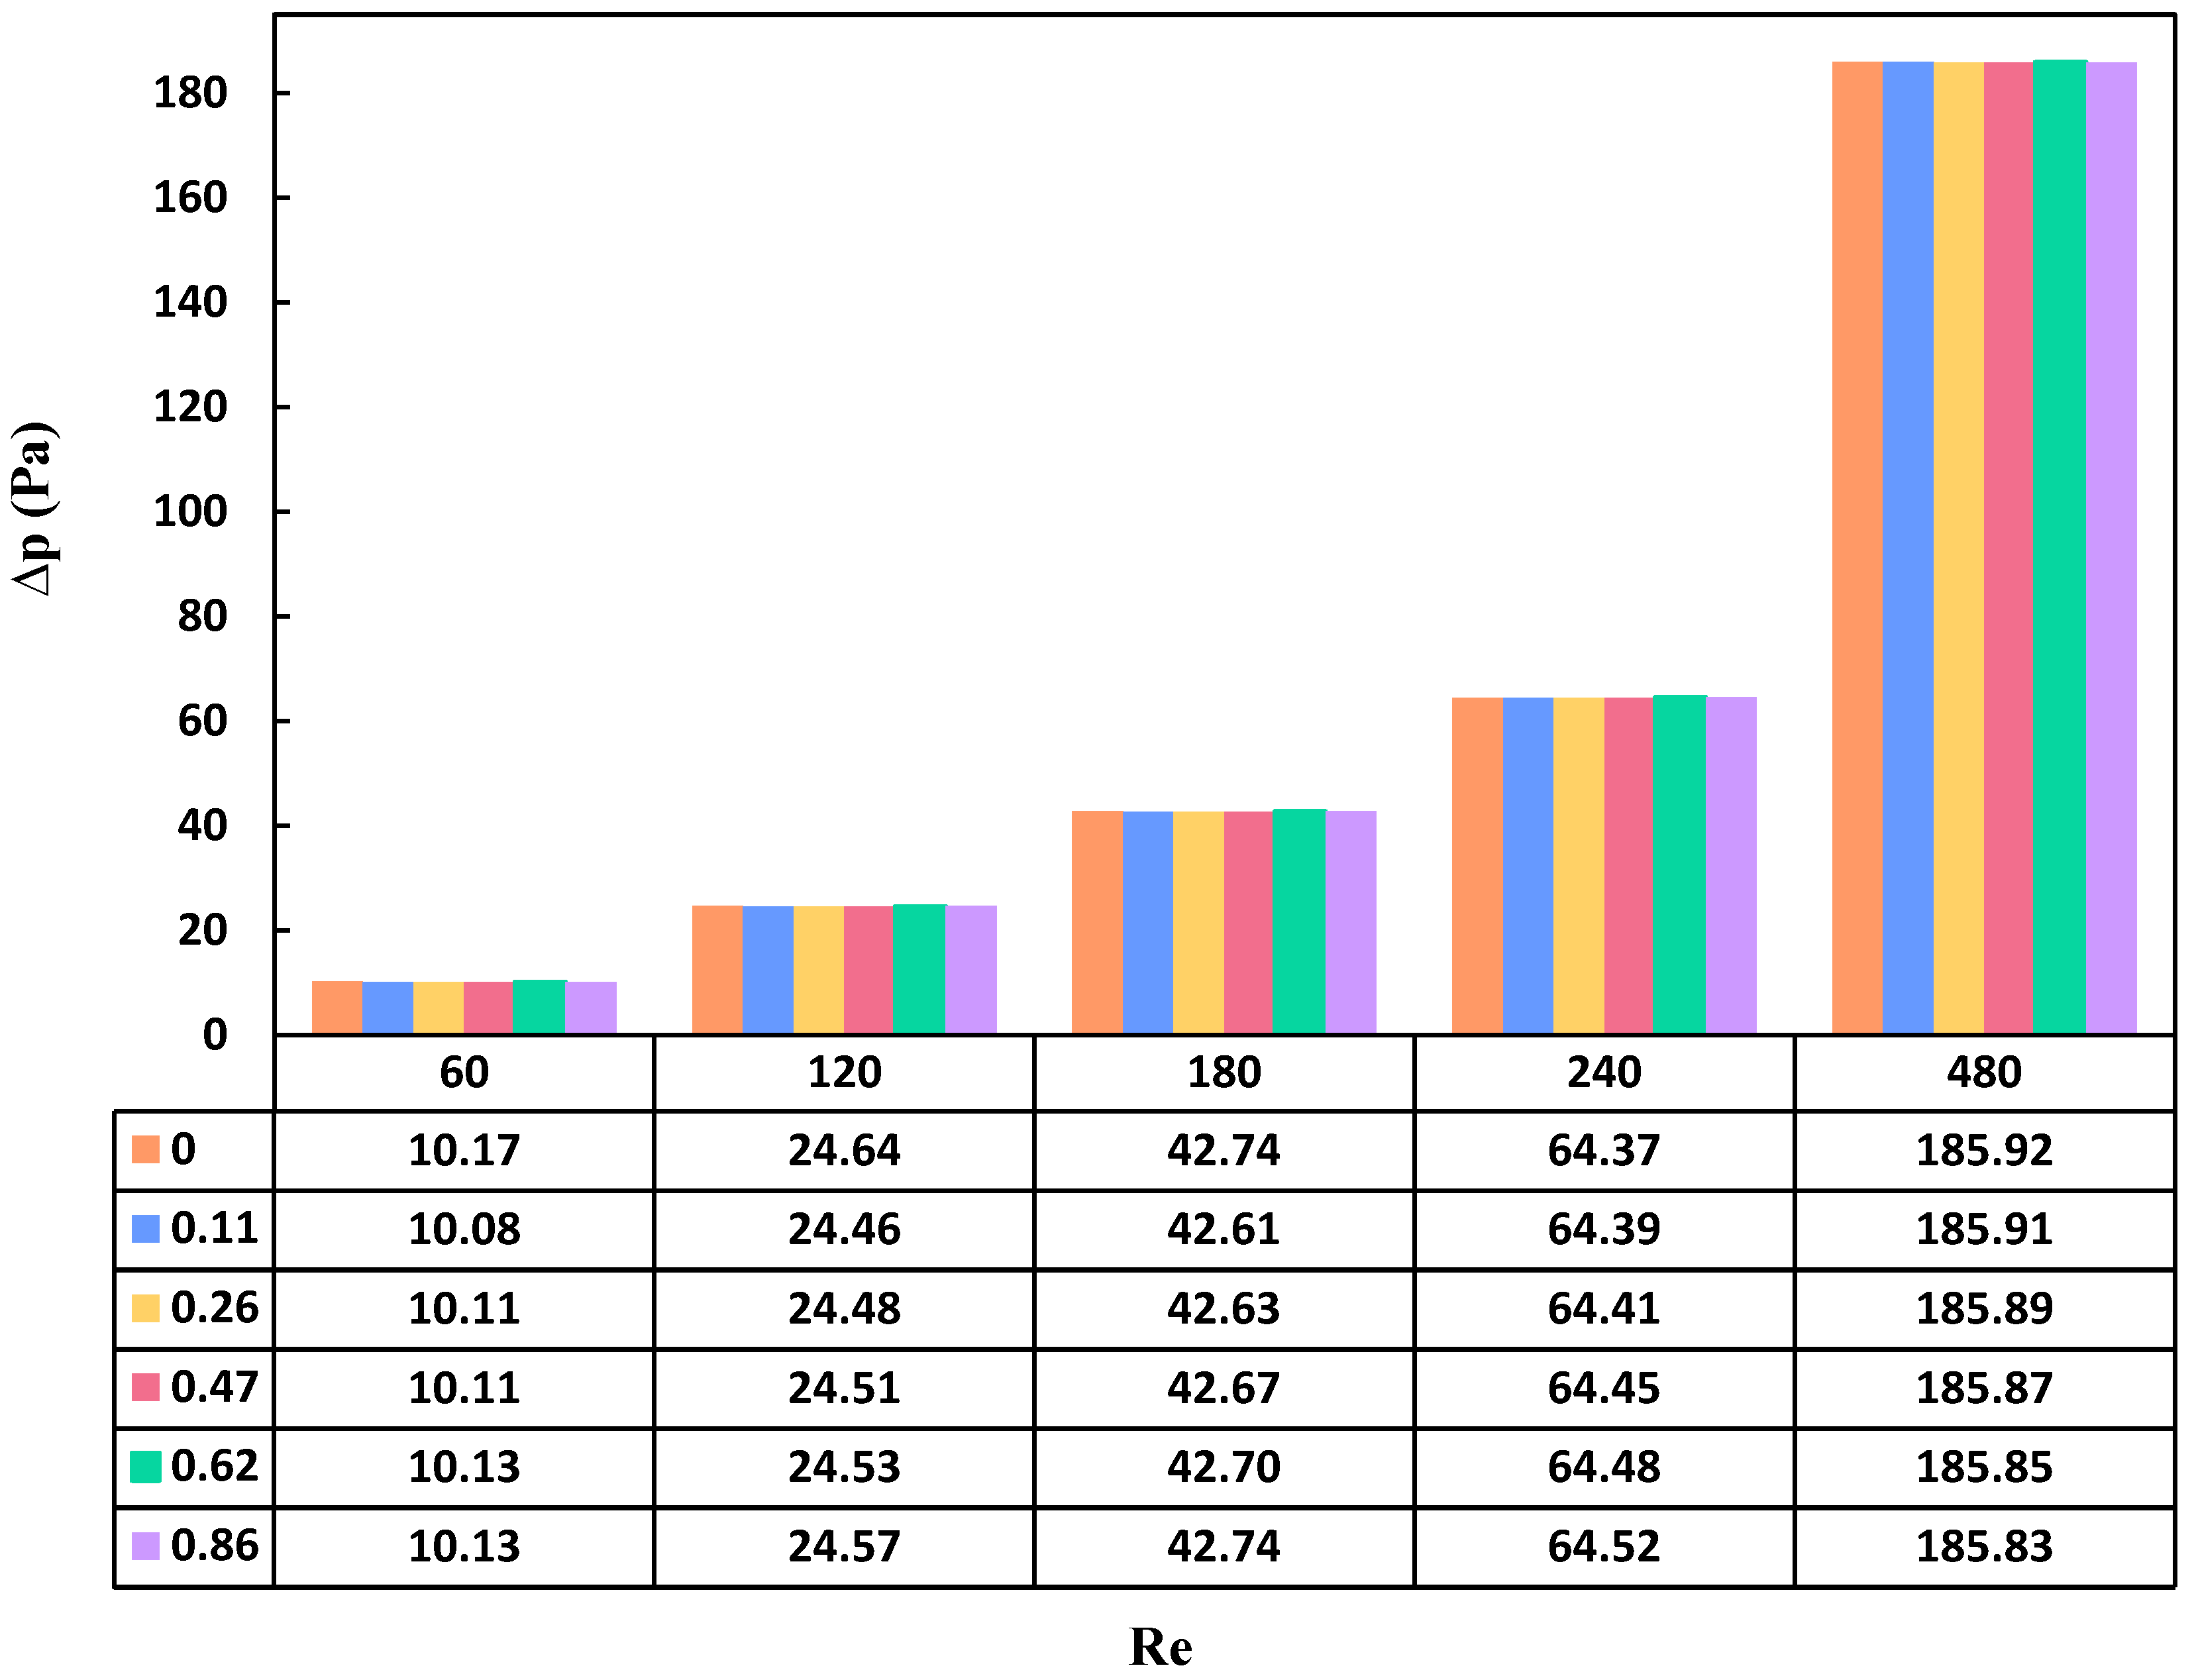
Pressure drop in a PHE correlates directly with the flow’s Reynolds number, the thermophysical properties of the nanofluid, and the hydraulic diameter of the heat exchanger. As depicted in
Figure 9, elevating Reynolds number resulted in a corresponding increase in the pressure drop. This relationship stems from the higher Reynolds number causing an augmentation in flow velocity within the heat exchanger channels, consequently leading to an elevation in pressure drop. Moreover, the introduction of nanoparticles resulted in heightened viscosity and subsequently increased the pressure drop. This phenomenon originated from the alteration of the base fluid’s thermophysical properties upon the addition of nanoparticles. As the nanofluid concentration rose, both density and viscosity increased, contributing to an overall elevation in pressure drop along the plate heat exchanger. Consequently, this amplified the pumping power required for fluid circulation. In summary, using nanoparticles exhibited a positive influence on pressure drop. Although increasing the concentration results in more fraction which resulted in higher pressure drop, the difference was relatively marginal. For example, at a Reynolds number of 60, the pressure-drop values ranged from 37.64 Pa for the base fluid to 52.64 Pa for the highest concentration studied (0.86 wt.%). This suggested that at higher nanoparticle concentrations, the pressure drop in the plate heat exchanger did not exhibit significant variation. Mousavi et al. [
64,
65] explored a similar trend and provided justification for the impact of nanoparticles on the thermophysical properties of a nanofluid with a diesel oil base.
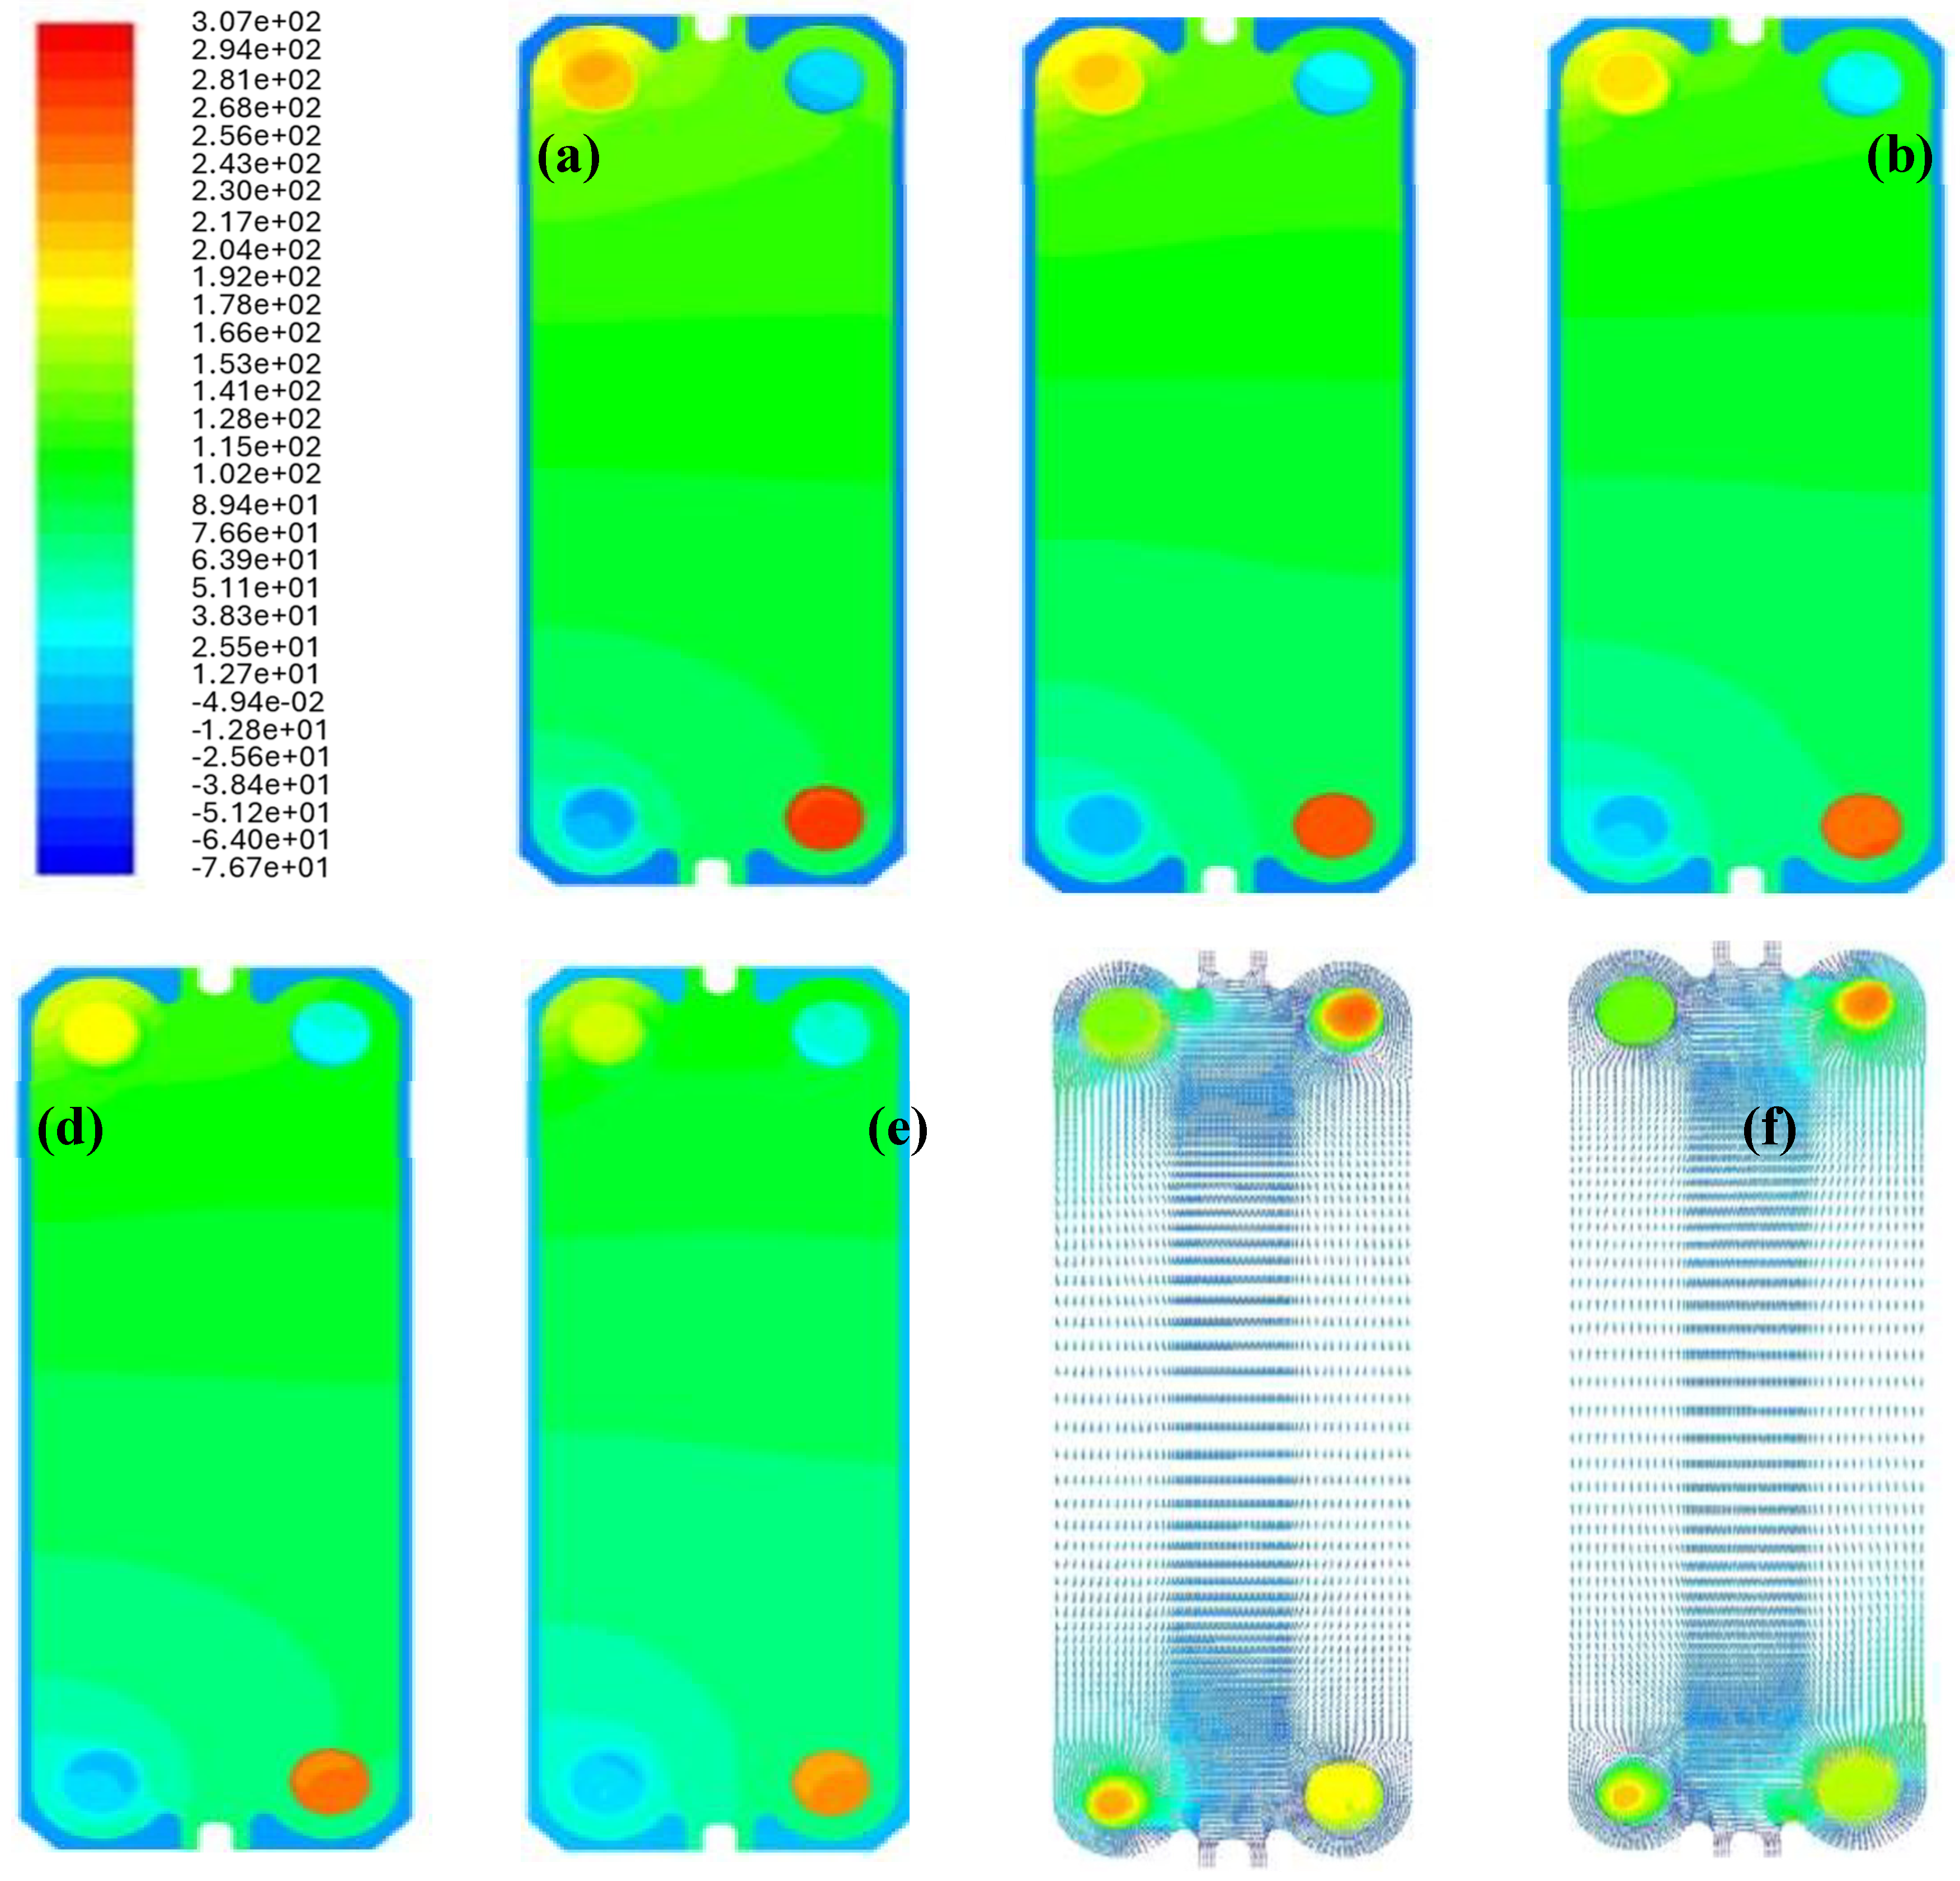
To facilitate visual understanding,
Figure 10 displays a contour plot of pressure on the hot plate for a concentration of 0.86 wt.% at all examined Reynolds numbers, accompanied by velocity vectors on both hot and cold plates. The observation revealed that elevating the Reynolds number correlates with increased velocity, ultimately resulting in an increased pressure drop across the plate.
3.6. Single-Phase and Two-Phase States Comparison
Two general perspectives on nanofluids, namely single-phase and two-phase states, were discussed in
section 2.1. In this study, we adopted the two-phase perspective, which involves a strong assumption of coupling between the two phases and mutual infiltration. This implies that each phase independently possesses its specific velocity vector field, and each control volume contains fractions of both the primary and secondary phases. Consequently, numerical simulations using the two-phase model are expected to yield more accurate results compared to the single-phase approach.
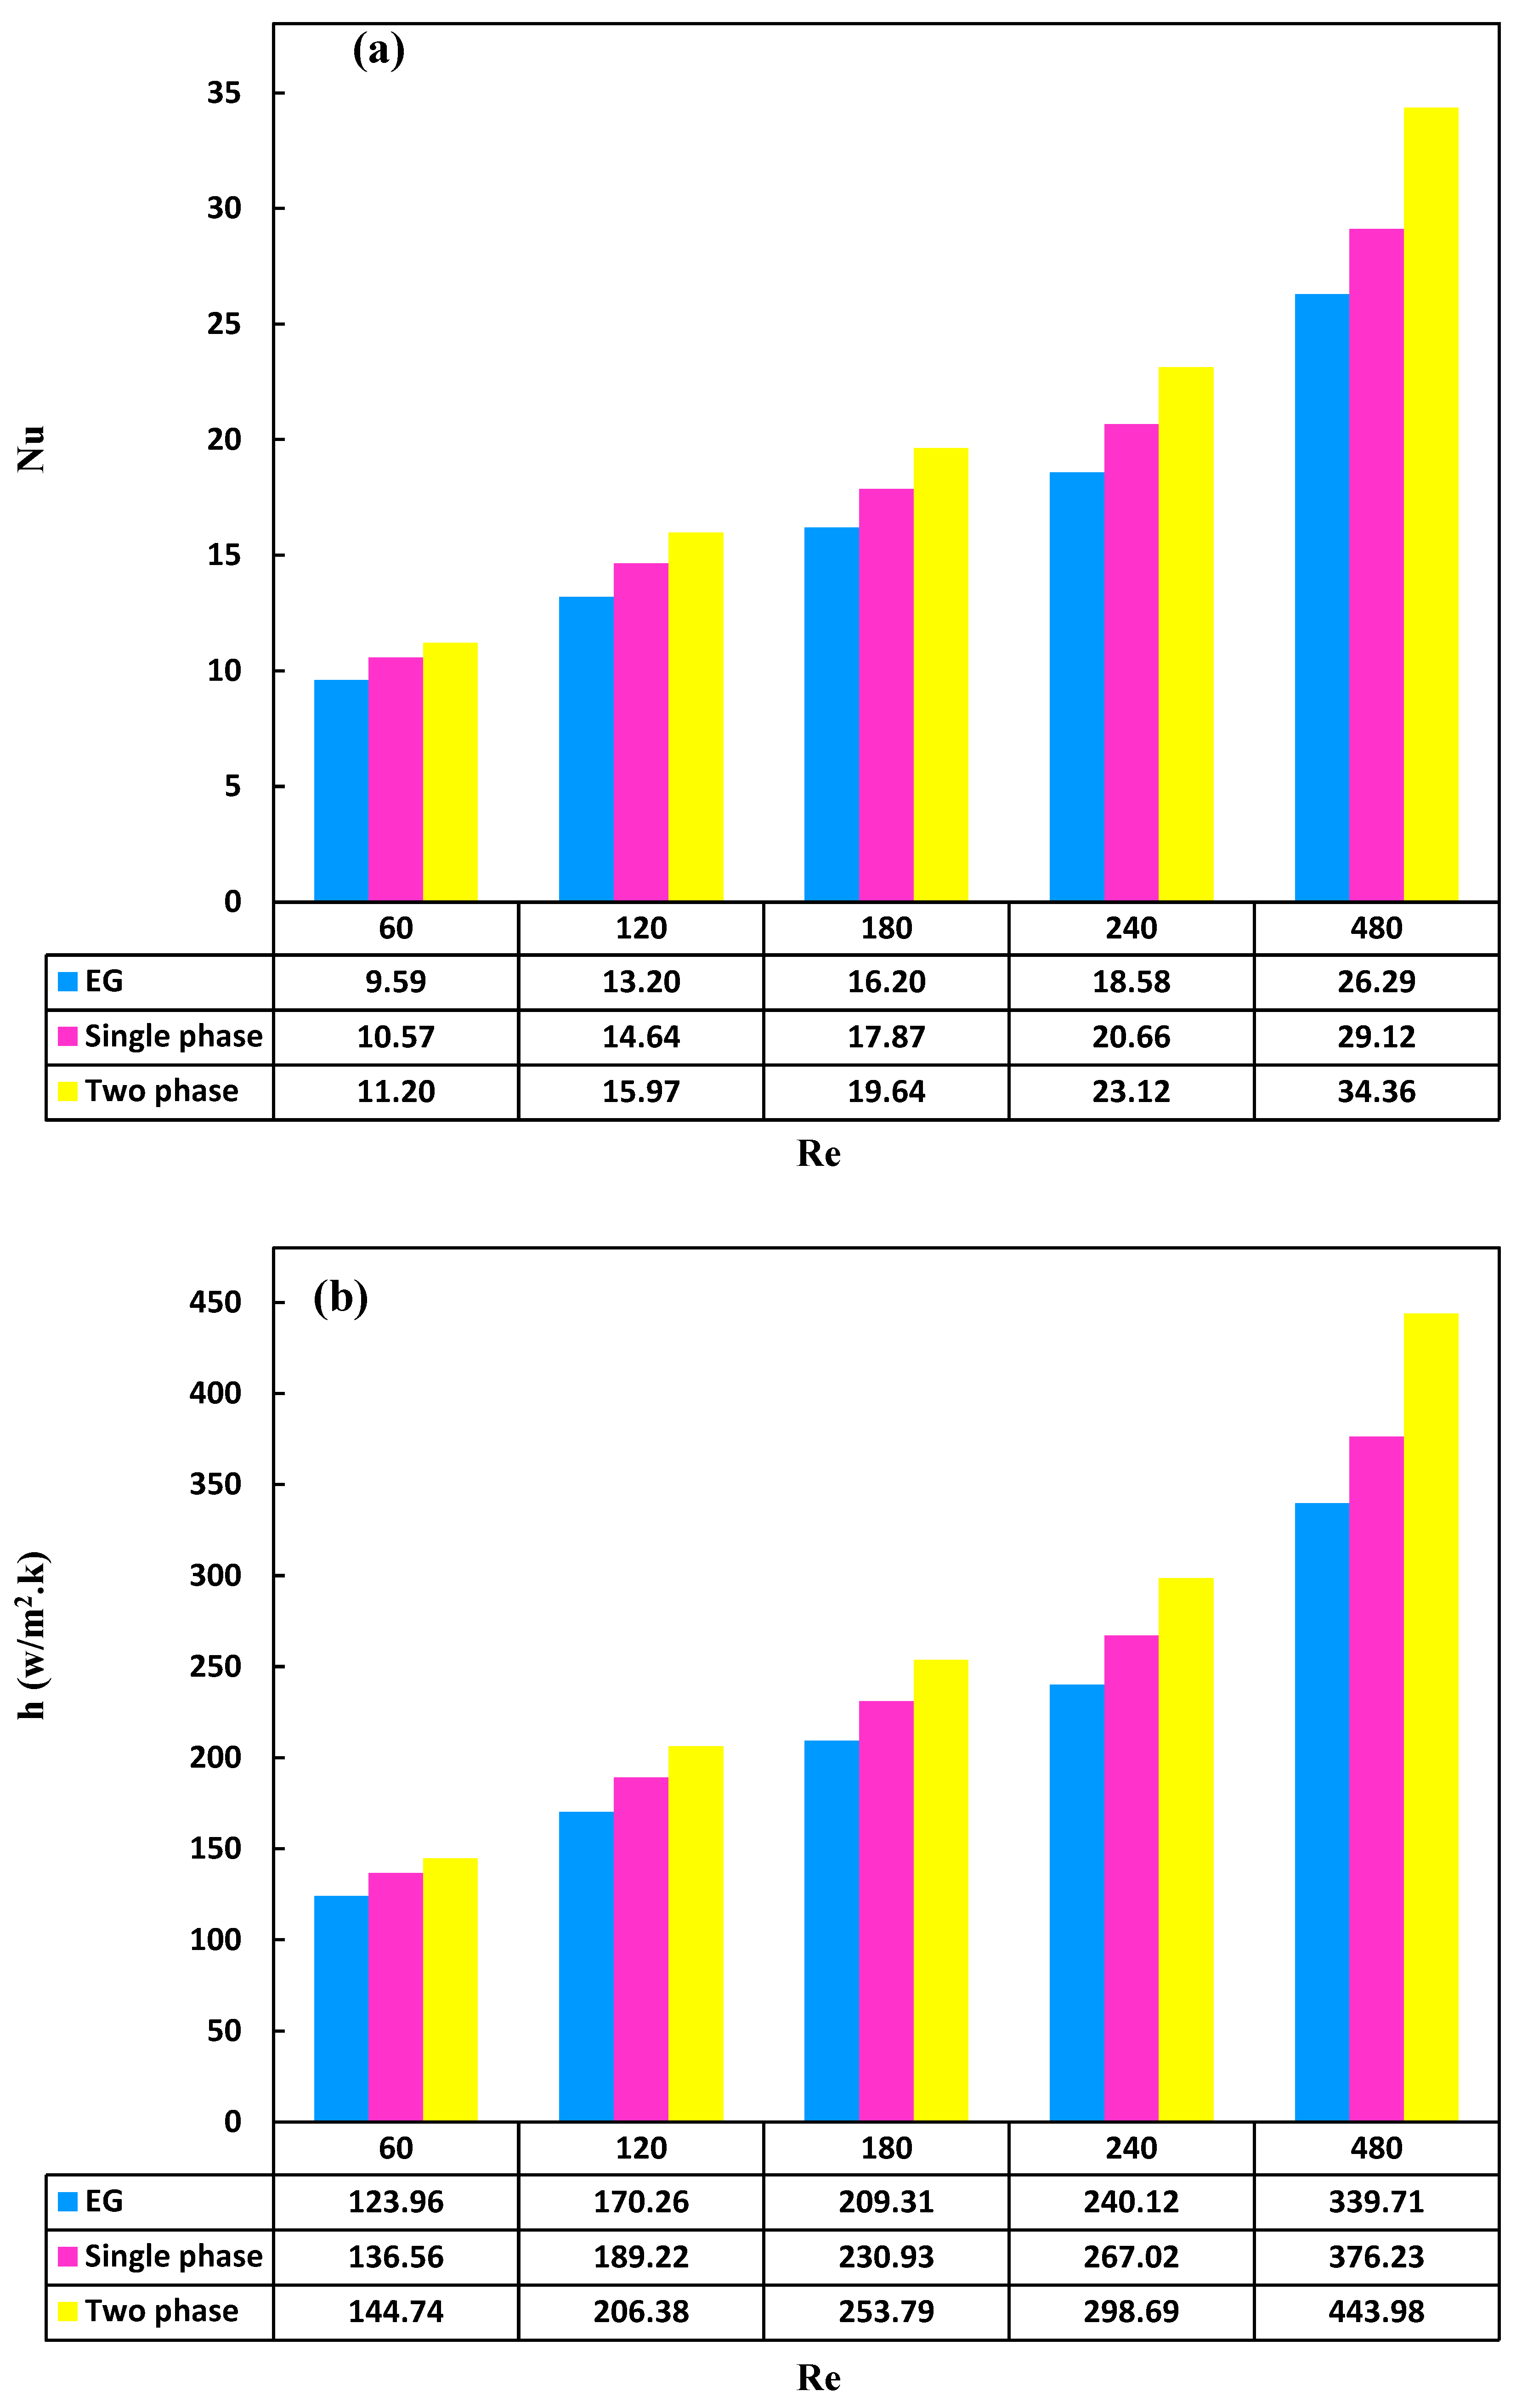
Figure 11a illustrates a comparison between Nusselt numbers for the single-phase and two-phase states at various Reynolds numbers, particularly at the highest concentration of 0.86 wt.%. Based on the achieved results, it was evident that the two-phase state provided more accurate predictions compared to the single-phase approach. The two-phase accommodates all flow parameters, including relative solid phase velocity, drag coefficient, Brownian motion of particles, and other relevant parameters in modeling, providing a more accurate relationship. As the Reynolds number increases, the distinction between the two viewpoints becomes more pronounced. This was attributed to the fact that as the Reynolds number increased, the fluid velocity rose, leading to an enhanced velocity of the secondary phase. This, in turn, intensified particle interactions and enhanced heat transfer. For instance, in the mixed case, the Nusselt number at a concentration of 0.86 wt.% at Reynolds number of 60 was 11.20 and 10.57, and at Reynolds number of 480 was 34.36 and 29.120 for two-phase and single-phase, respectively. The results from both perspectives converged at lower Reynolds numbers compared to higher Reynolds numbers. This convergence may be attributed to the proximity of nanoparticle concentration at lower concentrations and intensified random particle movements with an increase in Reynolds number. As Reynolds number increased, molecular collision within the particles intensified, and the increase in secondary phase velocity led to heightened turbulence in the flow. The elaborated justifications resulted in enhancing heat transfer in the two-phase perspective. Overall, the outcomes from the two-phase method demonstrated a higher level of accuracy, with an average increase of 12.30% compared to the single-phase method and 23.974% compared to the base fluid.
For a better understanding about the impact of the two-phase perspective, a comparison was made between the convective heat transfer coefficient in single-phase and two-phase states and the results are shown in
Figure 11b. As evident in the figure, the two-phase model accurately predicted the fluid flow behavior with a concentration of 0.86 wt.% compared to the single-phase model across various Reynolds numbers. Numerous factors, such as gravity, fluid-particle friction, Brownian forces, Brownian diffusion phenomenon, sedimentation, and dispersion, can interact in the fluid flow. This suggests that the slip velocity between the fluid and particles may not be zero. Therefore, the two-phase state in nanofluids provided better results compared to the single-phase, demonstrating a generally improved alignment with experimental findings [
66]. The discrepancy between outcomes in the two conditions escalated with an elevation in Reynolds number. This observation was substantiated by the inclusion of the gravitational term and drag coefficient in equations 23 and 24. For Reynolds numbers below 1000, the relative velocity of the secondary phase exhibited an augmentation corresponding to the increasing Reynolds number. The velocity gradient at higher Reynolds numbers heightened Brownian motions and turbulence, subsequently amplifying the heat transfer coefficient. For instance, at Reynolds number 60, the heat transfer coefficient for the single-phase was 56.136 W/m
2·K, whereas in the two-phase scenario, it reached 74.144 W/m
2·K. In summary, the multiphase mixed perspective demonstrated superior precision compared to the single-phase condition. This was evident in an 18% elevation in Reynolds number 480 in the two-phase state compared to the single-phase state, with the highest concentration. Additionally, there was a 30.69% increase compared to the base fluid, resulting in an average percentage elevation of 12.30% compared to the single-phase state.
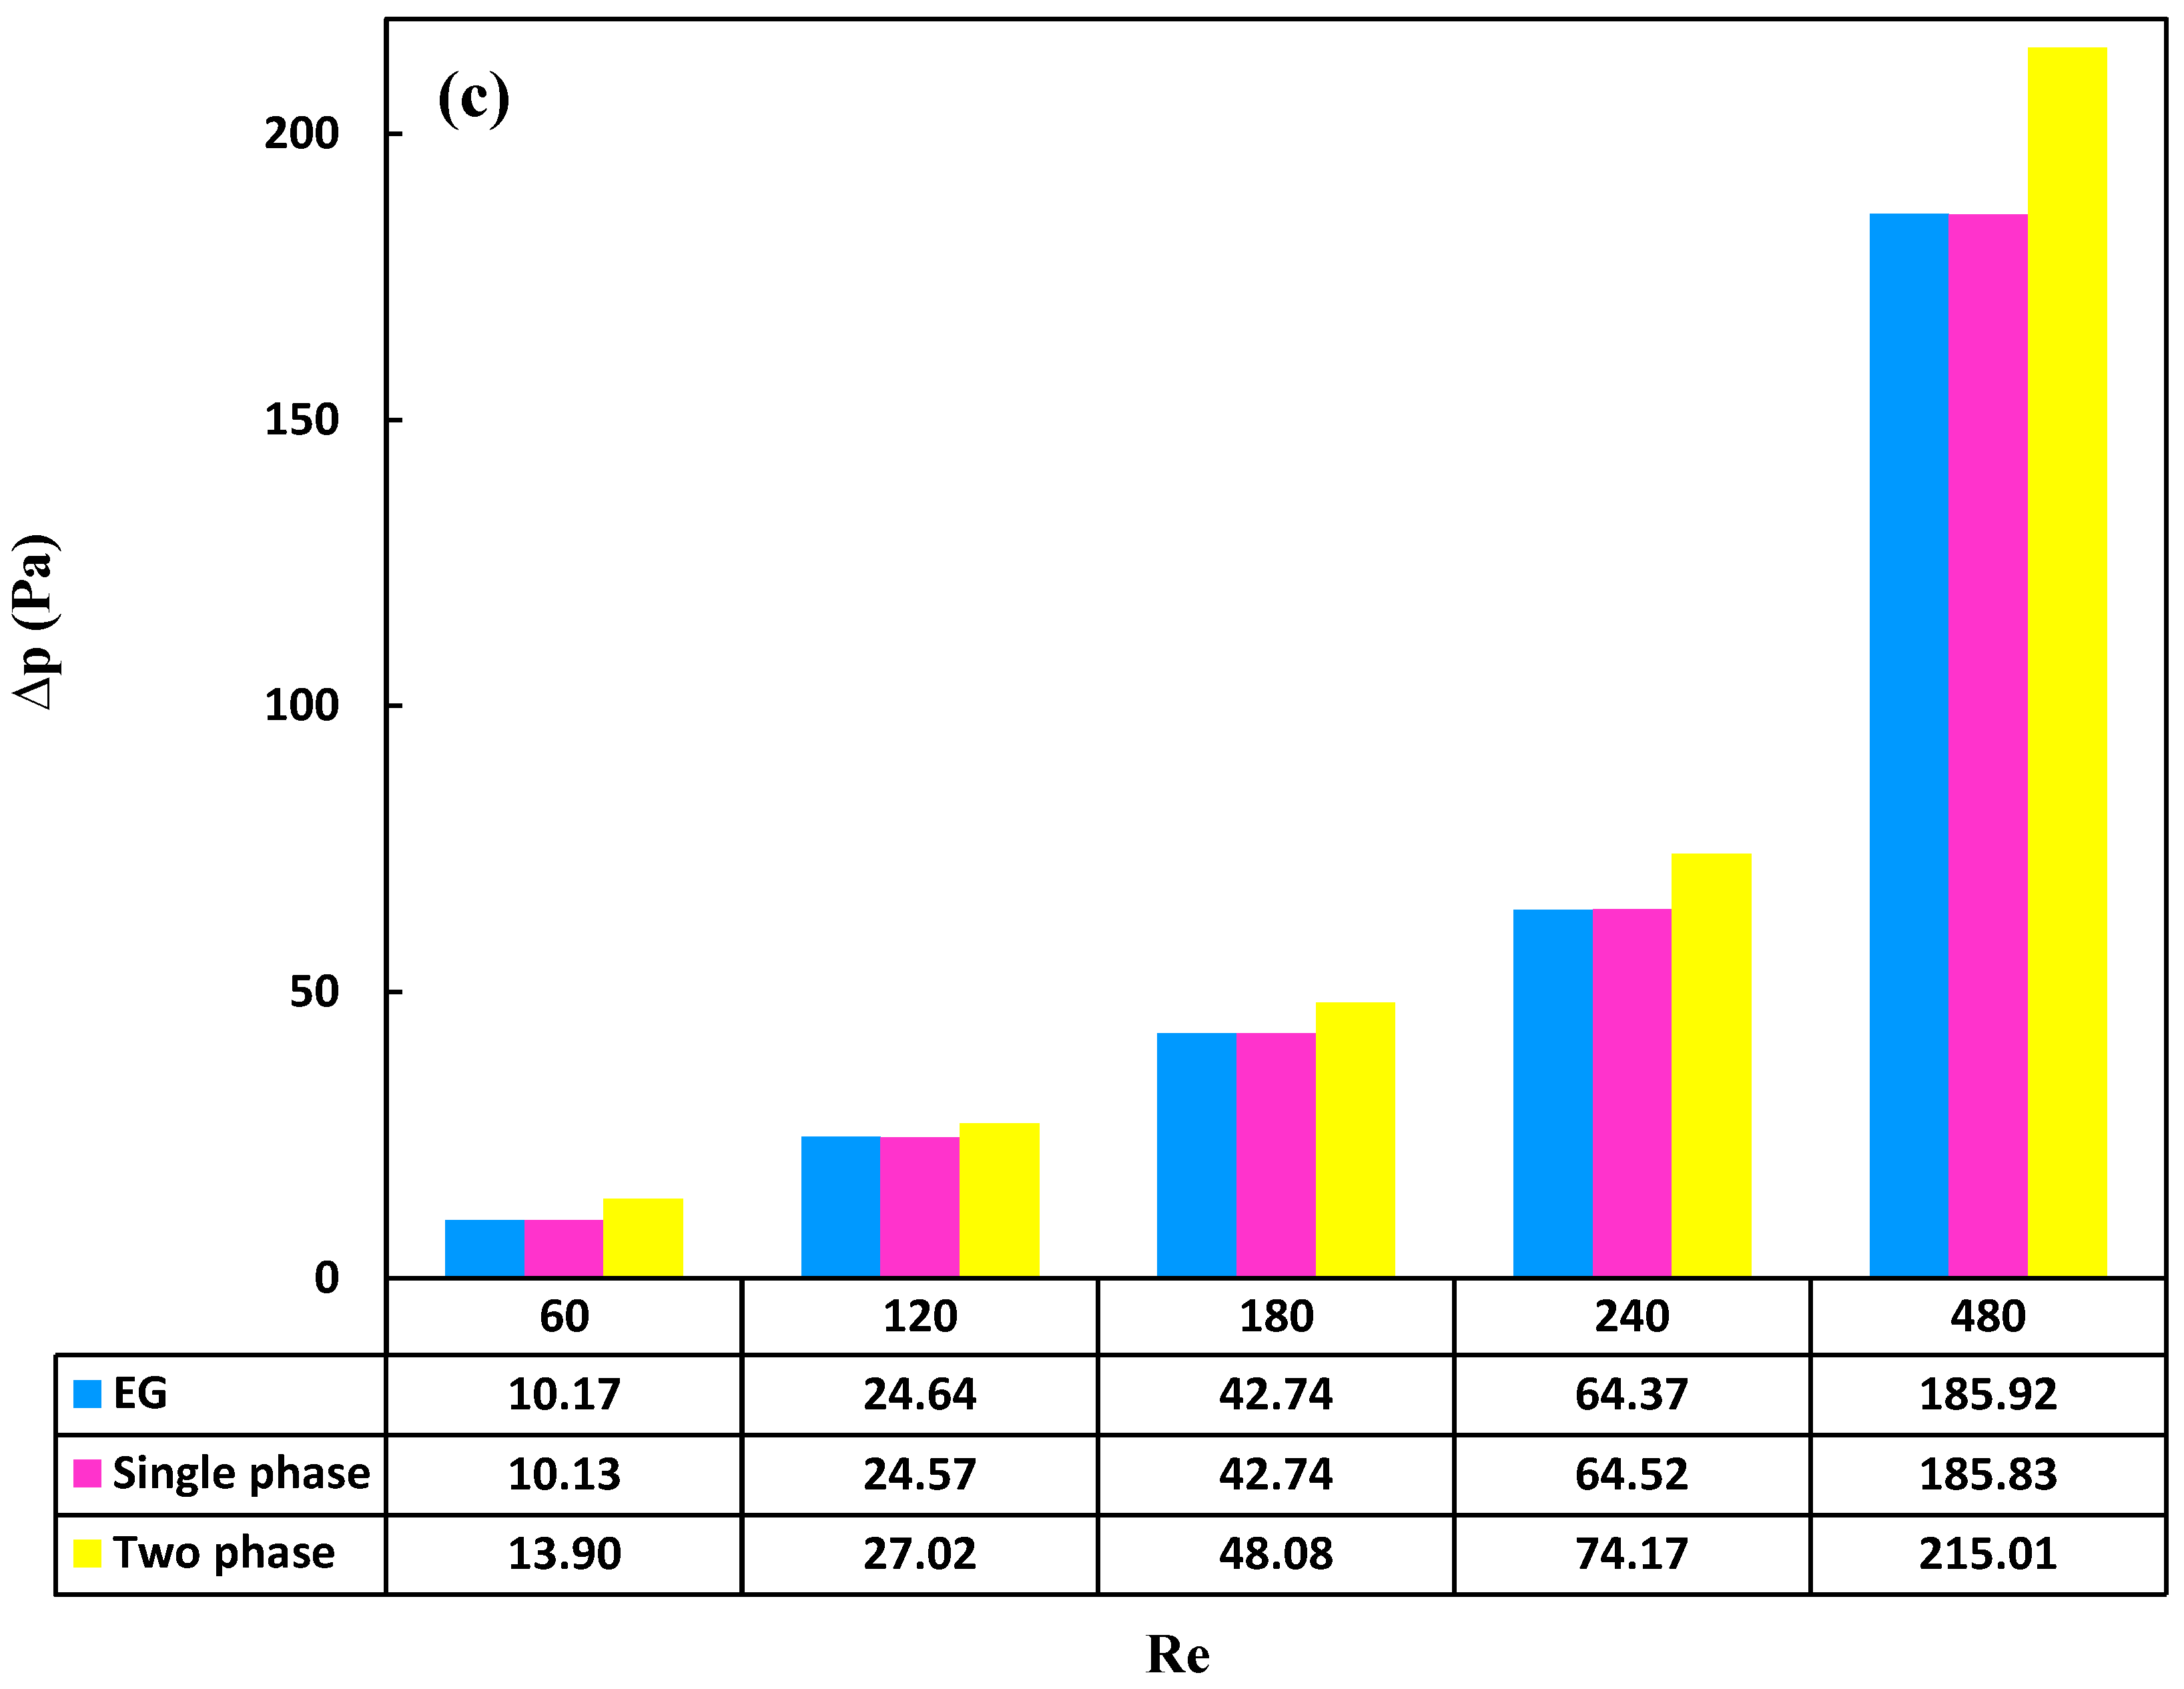
Figure 11c illustrates the outcomes of the identical experiment in both conditions for assessing pressure drop. The pressure drop in the two-phase state was marginally higher compared to the single-phase state which can be attributed to the formulation of the mixed two-phase. This perspective treats secondary phases, which include solid nanoparticles, as discrete entities and analyzes momentum and multiphase equations separately for each phase. In the two-phase state, the velocity of the secondary phase becomes a significant parameter distinguishing it from the single-phase state. With an increase in the Reynolds number, the total fluid velocity, relative velocity, and particle viscosity all experience an increase. Given these definitions, it can be asserted that the pressure drop in the two-phase state is slightly higher than in the single-phase state. For example, at Reynolds number 480, the pressure drop for the single-phase condition was 83.185 Pascal, whereas for the mixed two-phase scenario, it was 01.215 Pascal. In general, based on the interpretations provided, the conclusion can be drawn that the two-phase state demonstrated superior accuracy in predicting pressure drop. Specifically, at the highest Reynolds number, the increase in pressure drop in the two-phase state compared to the single-phase state and the base fluid was 35%, with an average percentage increase of 26.35%.
3.7. Nano Additives Effect on Synergistic Properties
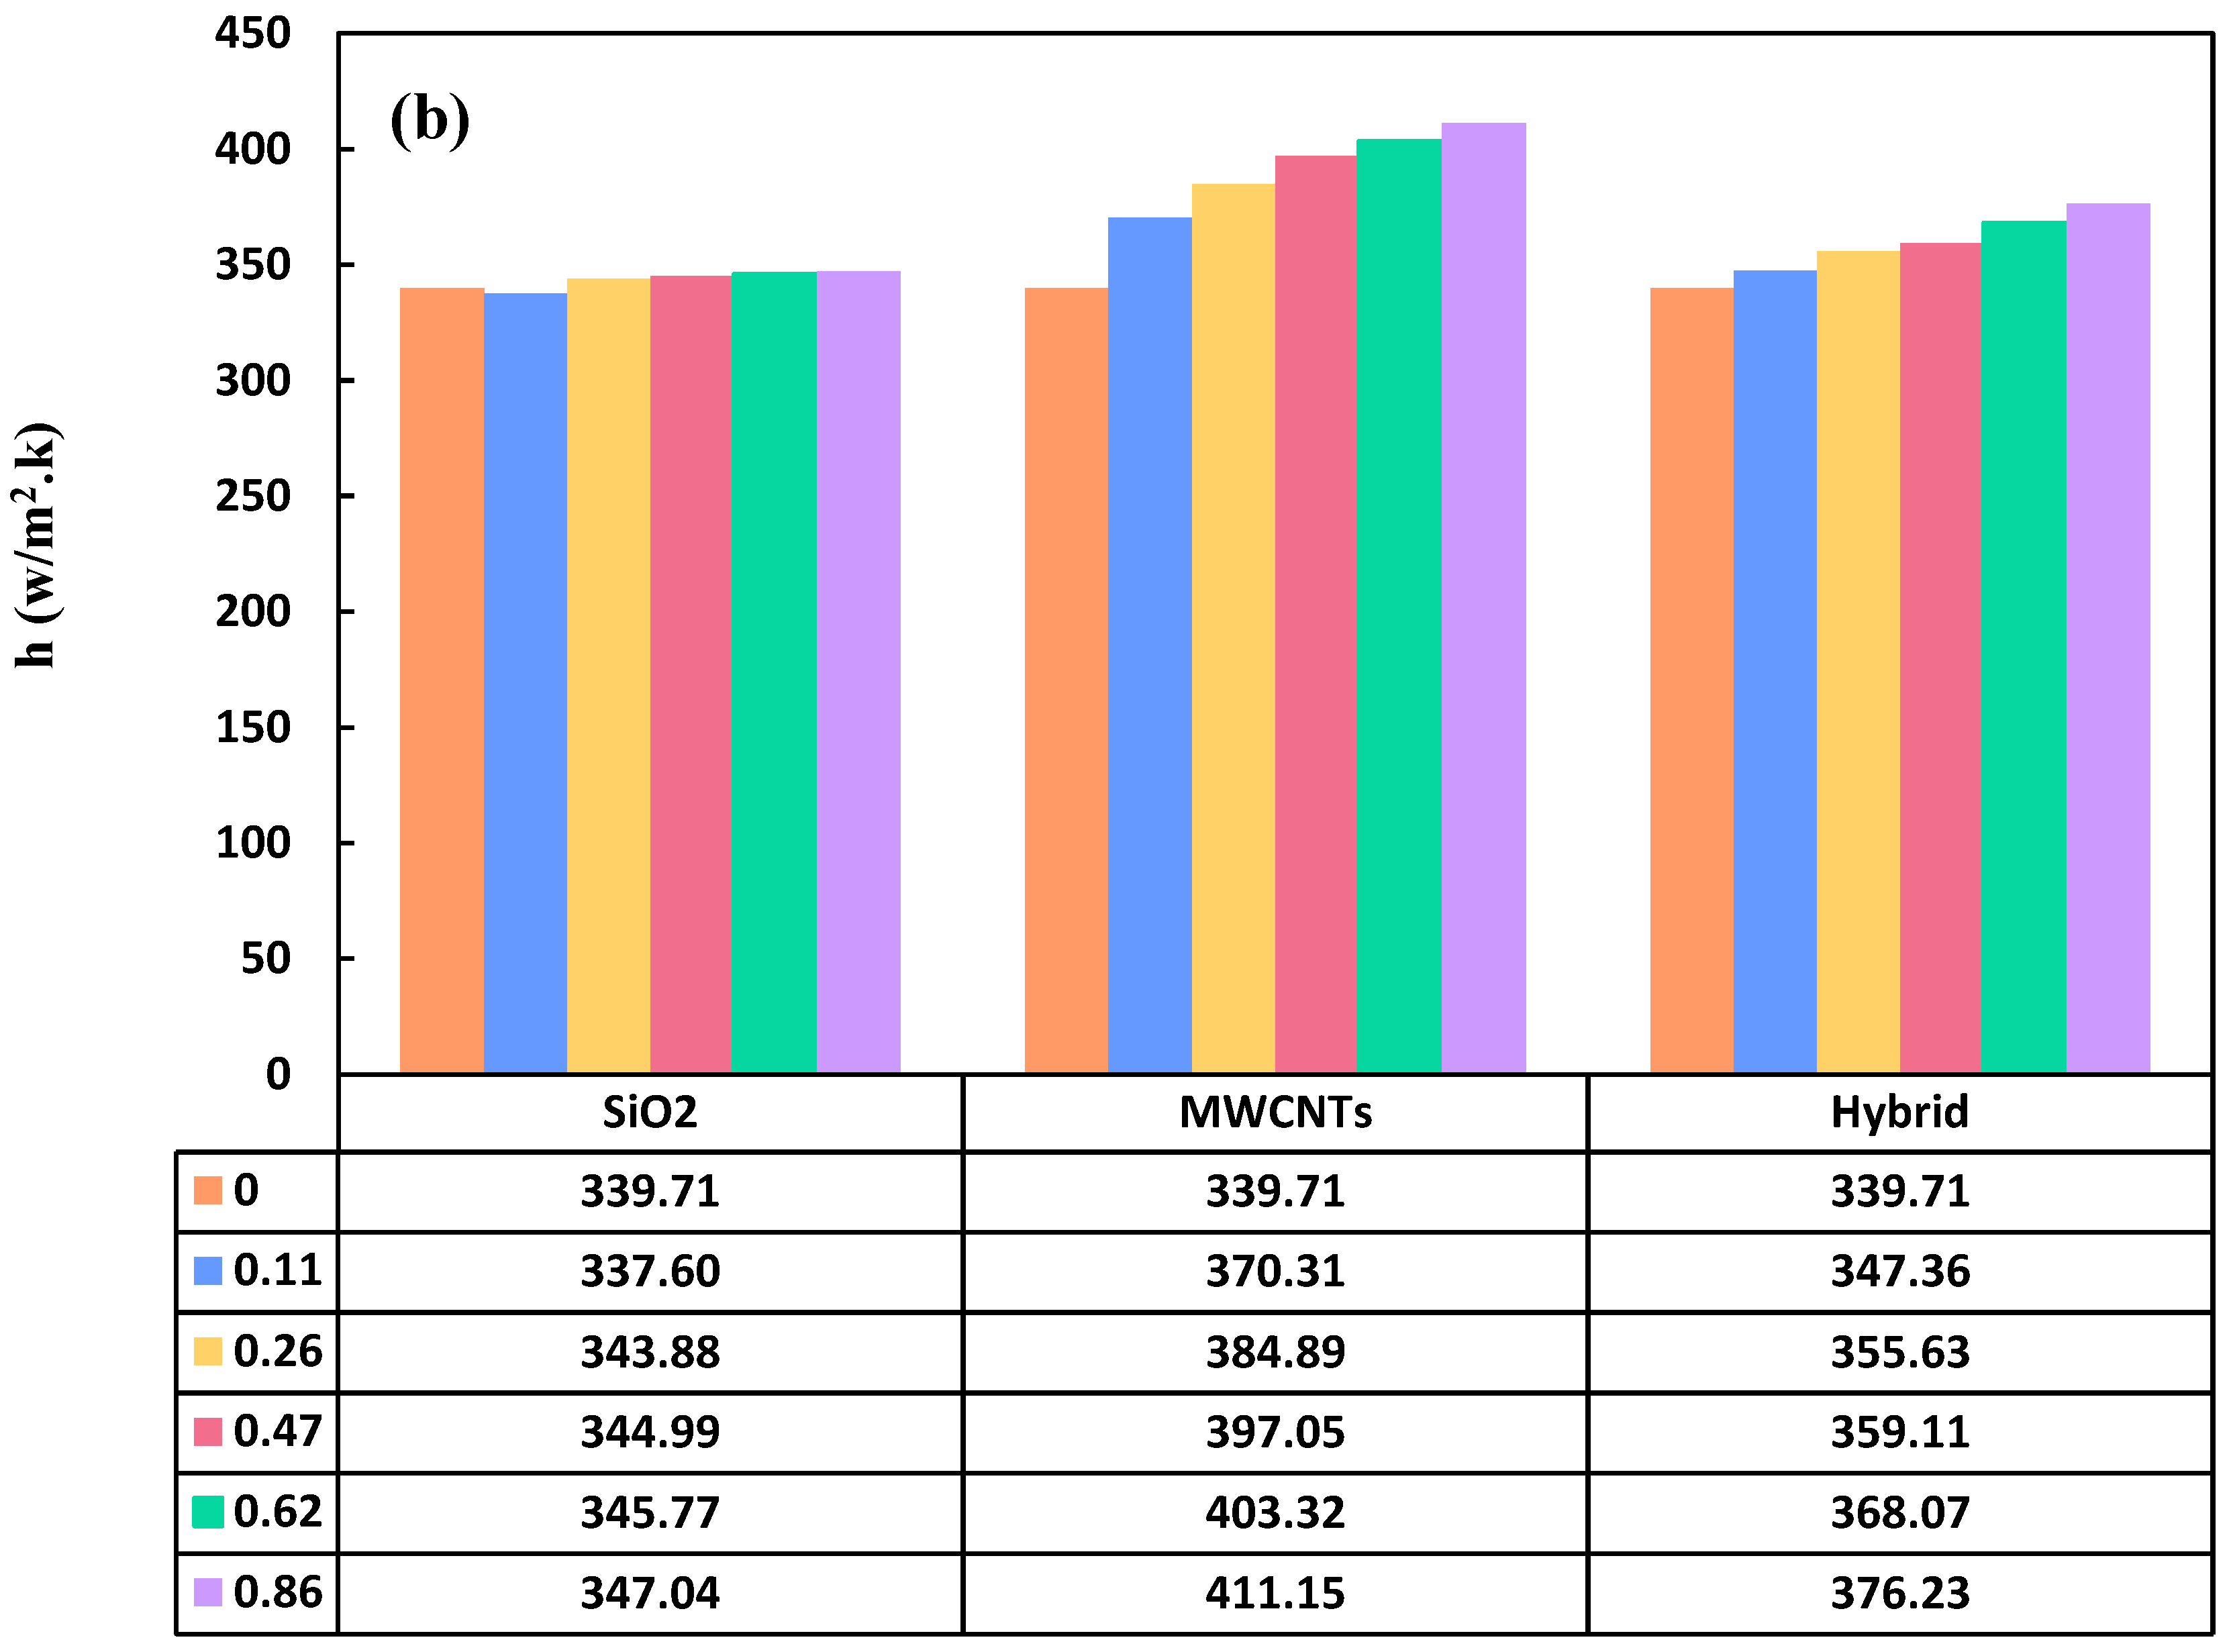
This study investigated the influence of MWCNTs on the convective heat transfer coefficient relative to hybrid and SiO
2 nanoparticles, as depicted in
Figure 12a. The convective heat transfer coefficient exhibited a substantial increase in the case of hybrid nanoparticles, particularly with the incorporation of MWCNTs and SiO
2, compared to SiO
2 alone. This enhancement can be ascribed to two primary factors. Firstly, SiO
2’s thermal conductivity falls within the range of 1.4 W/(m·K), whereas MWCNTs exhibit a thermal conductivity ranging from 2000 to 6000 W/(m·K), making it 1500 to 4000 times higher. Furthermore, the introduction of MWCNTs leads to the occupation of fluid space, forming a network of nanoparticle/nanotube clusters within the fluid through the attachment of SiO
2 particles to the MWCNTs. These clusters effectively mitigate thermal resistance between nanoparticles, contrasting with a nanofluid where particles are well-dispersed, resulting in heightened heat conduction. The second factor encompasses random particle movements, collisions, inter-particle interference, and velocity variations between nanoparticles and the base fluid, all contributing to the potential increase in heat transfer. As nanoparticles experience Brownian motion, they collide with each other and the surrounding fluid molecules, contributing to increased thermal energy exchange. This, in turn, facilitates a more effective transfer of heat between the nanoparticles and the fluid. Moreover, Particle collisions and inter-particle interference disrupt the fluid flow patterns, creating localized turbulence and enhancing convective heat transfer. This increased turbulence facilitates better mixing of the fluid, promoting efficient heat distribution across the system. Variations in velocity between nanoparticles and the base fluid result in dynamic fluid flow patterns, creating regions of higher and lower temperature. These temperature variations contribute to convective currents, promoting heat transfer and distribution throughout the fluid.
The research objective was to substantiate the positive impact of MWCNTs on heat transfer at a constant Reynolds number, particularly with an increasing concentration. The obtained results clearly indicated that addition of the concentration of hybrid nanoparticles led to an improved convective heat transfer coefficient. At the highest concentration, the addition of MWCNTs positively contributed to the convective heat transfer coefficient by 9.28%, 8.41%, and 10.75% compared to hybrid nanoparticles, SiO2, and EG, respectively.
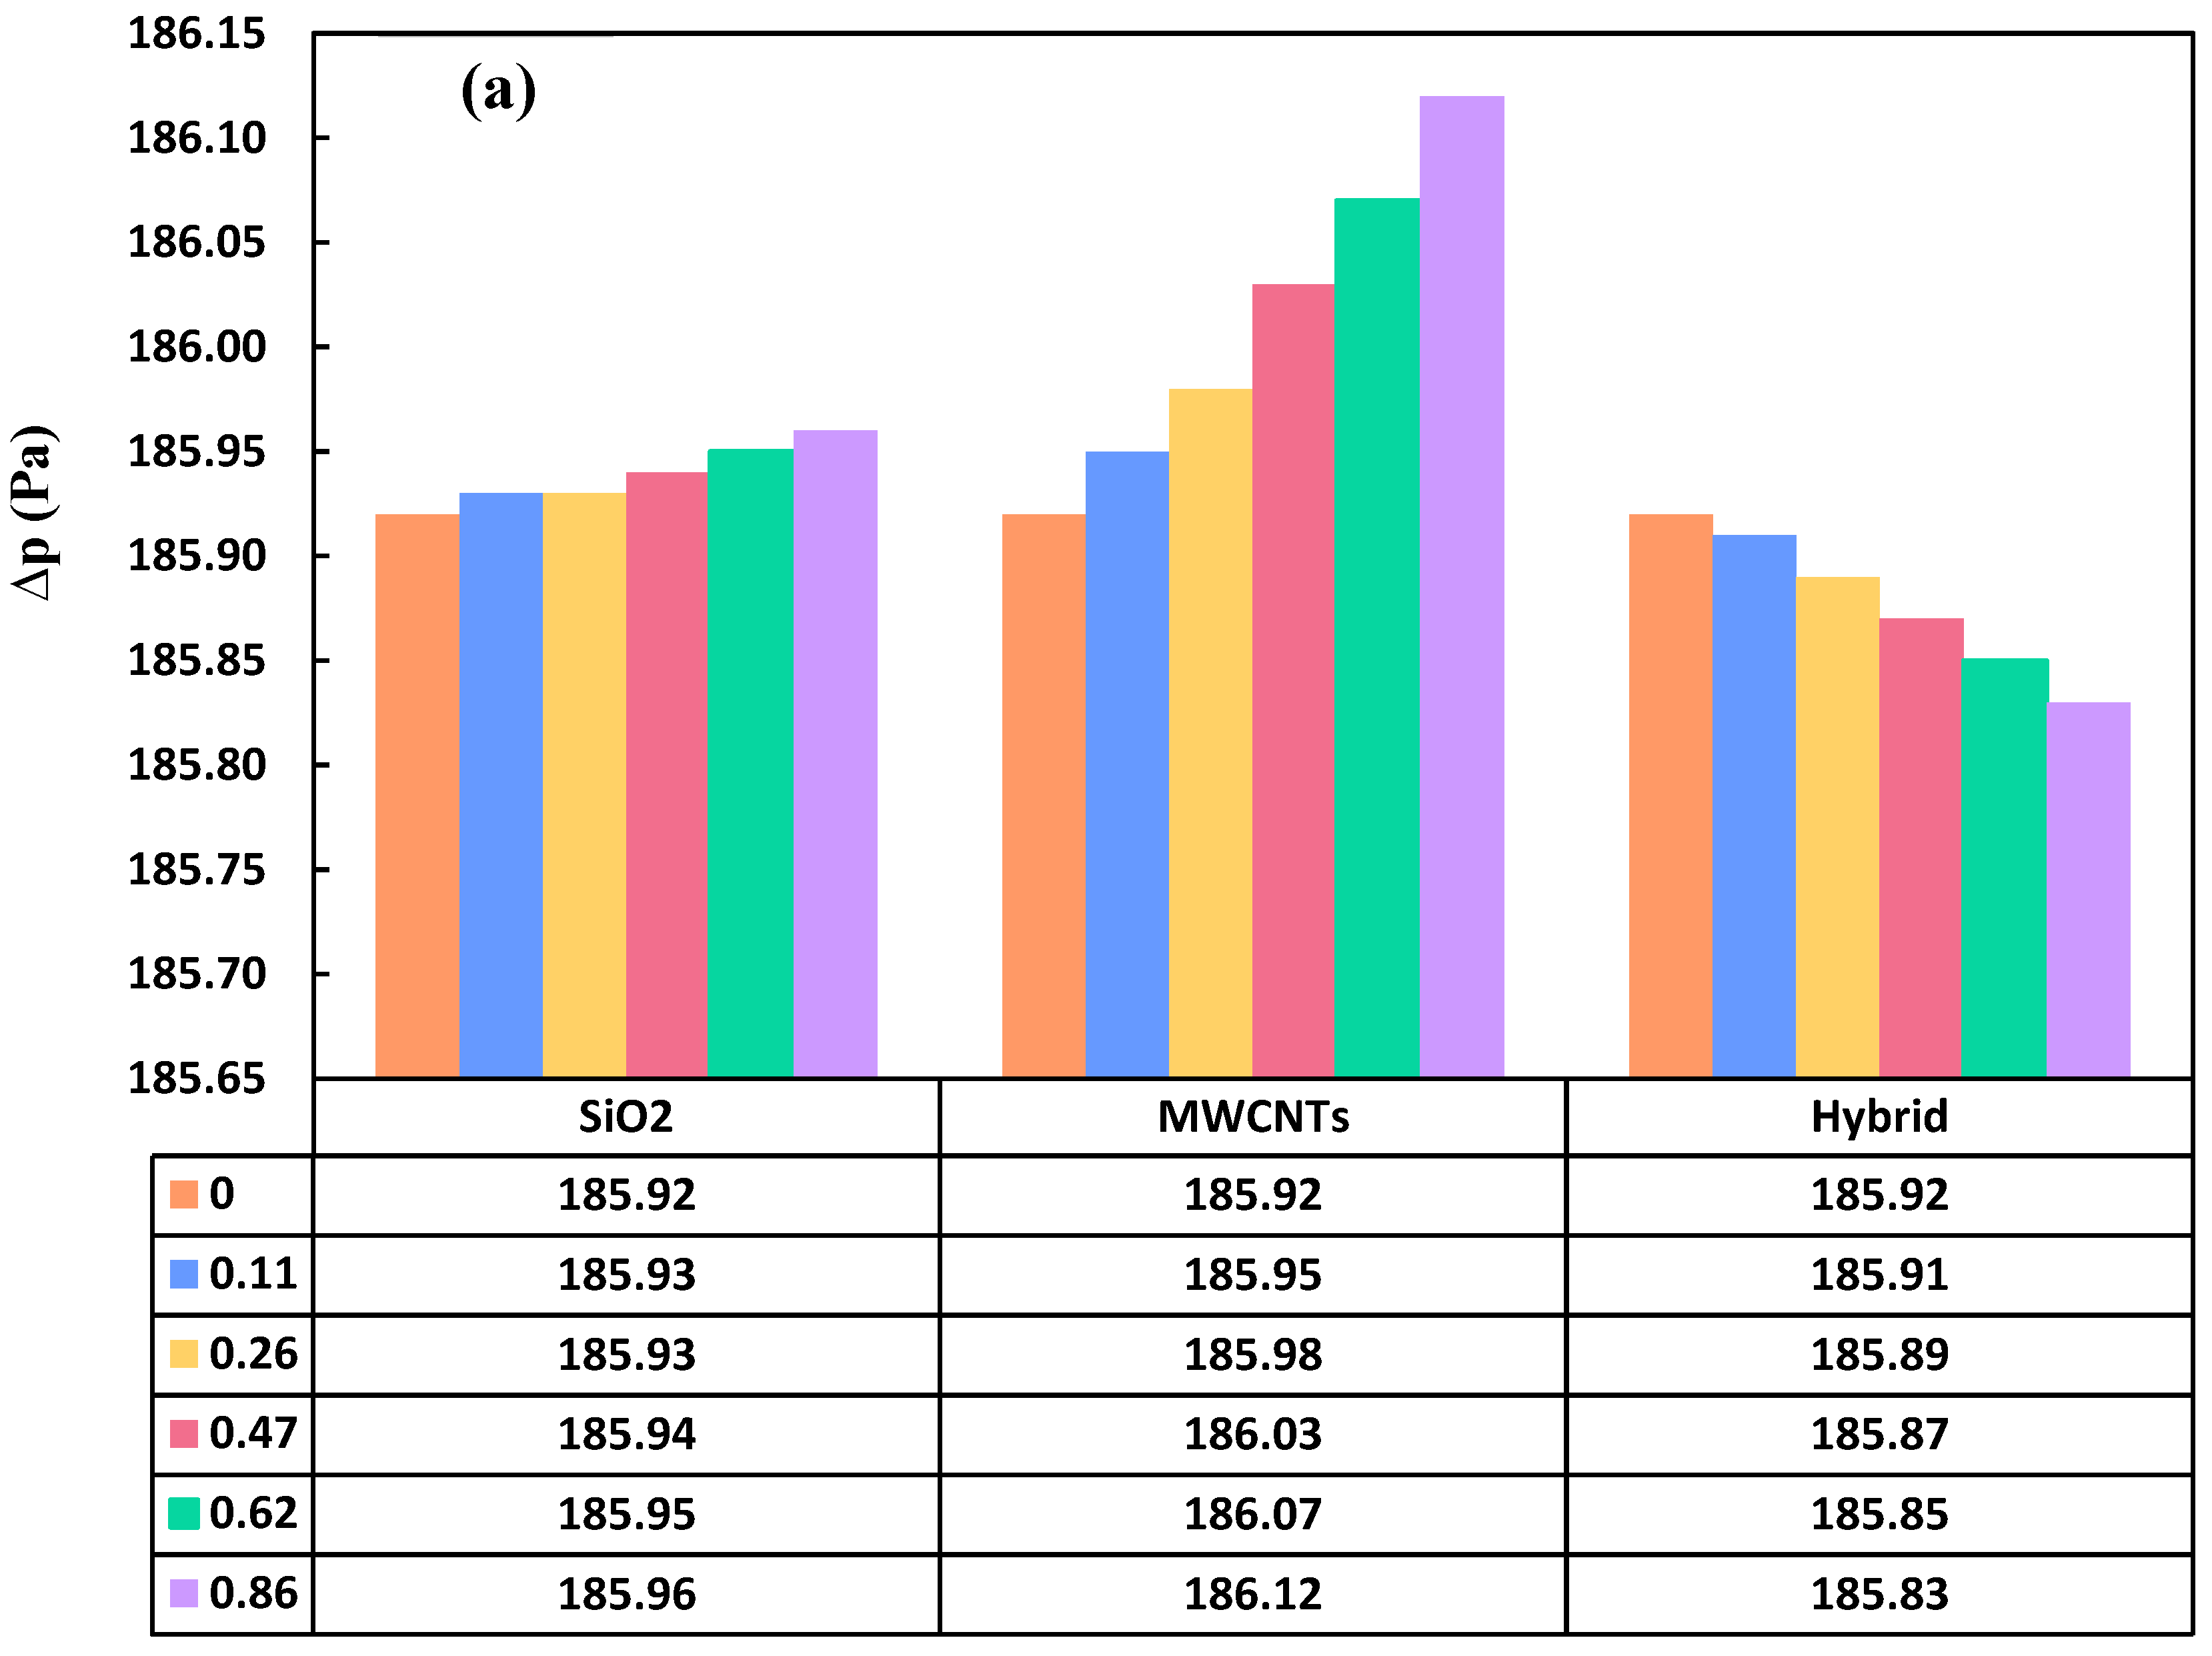
The impact of incorporating MWCNTs into hybrid nanoparticles on pressure drop is depicted in
Figure 12b. Pressure drop is influenced by factors such as thermophysical properties, fluid velocity, and the geometric configuration of the specific plate heat exchanger in consideration. Despite the addition of a new particle and an increase in viscosity, it was observed that the pressure drop of the hybrid nanoparticle was slightly lower than that of SiO
2 nanoparticles. The reduction in pressure drop can be ascribed to the density of the associated particles. SiO
2 has a volumetric mass of 2600 kg/m
3, whereas MWCNTs have a volumetric mass of 1200 kg/m
3. Consequently, the pressure drop in the singular case was higher compared to the hybrid case. Under the highest achievable conditions (Reynolds number of 480 and concentration of 0.86 wt.%), SiO
2 nanoparticles exhibited a marginal increase (0.06%) in pressure drop compared to hybrid nanoparticles. This minor increment suggests that the addition of MWCNTs does not significantly contribute to pressure drop in the heat exchanger.
The incorporation of MWCNTs, hybrid, and SiO2 nano-additives yielded improvements in the heat transfer coefficient by 21.02%, 10.76%, and 2.16%, respectively. Simultaneously, the introduction of MWCNTs, hybrid, and SiO2 nano-additives brought about corresponding adjustments in pressure difference by 0.11%, 0.04%, and 0.02%, respectively. MWCNTs demonstrated the most favorable heat transfer coefficient but the least desirable pressure drop, whereas SiO2 exhibited the least favorable heat transfer coefficient but the most favorable pressure drop. The impact on convective heat transfer coefficients with MWCNTs was 5-10% higher than that observed with the hybrid additives. Notably, the introduction of MWCNTs resulted in increased pressure, while the hybrid additives led to a decrease in pressure due to cluster formation. In summary, the hybrid additive demonstrated the optimal enhancement in heat transfer coefficient and yielded favorable pressure drop outcomes. The cost-effectiveness and adaptability inherent in hybrid nanoparticles, with their synergistic material combinations, position them as promising solutions to overcome specific challenges in cooling technologies. The combination of various materials within hybrid nanoparticles results in synergistic effects, endowing them with properties superior to those of individual components. This synergy translates into enhanced overall performance, increased stability, and improved functionality, making hybrid nanoparticles a compelling choice for diverse cooling applications. Moreover, their tailored functionality and adaptability contribute significantly to elevated thermal management in different industrial sectors.
Figure 1.
(a) Experimental PHE, (b) schematic for counter-current flow mechanism of PHE (obtained from [
39]).
Figure 1.
(a) Experimental PHE, (b) schematic for counter-current flow mechanism of PHE (obtained from [
39]).
Figure 2.
(a) The computational domain and boundary conditions in Ansys Fluent 19.4, computational domain mesh (b) 2–D, and (c) 3–D.
Figure 2.
(a) The computational domain and boundary conditions in Ansys Fluent 19.4, computational domain mesh (b) 2–D, and (c) 3–D.
Figure 3.
Contour plots of mesh quality for (a) orthogonal quality, and (b) skewness.
Figure 3.
Contour plots of mesh quality for (a) orthogonal quality, and (b) skewness.
Figure 4.
Grid independence of outlet temperature of first state (a) hot stream, (b) cold stream, and second state (c) hot stream, (d) cold stream.
Figure 4.
Grid independence of outlet temperature of first state (a) hot stream, (b) cold stream, and second state (c) hot stream, (d) cold stream.
Figure 5.
Variations of Nusselt numbers as a function of Peclet number (simulation and experimental data).
Figure 5.
Variations of Nusselt numbers as a function of Peclet number (simulation and experimental data).
Figure 6.
Variations of Nusselt number at different Reynolds numbers and concentrations.
Figure 6.
Variations of Nusselt number at different Reynolds numbers and concentrations.
Figure 7.
Variations of convection heat transfer coefficient at different Reynolds numbers and concentrations.
Figure 7.
Variations of convection heat transfer coefficient at different Reynolds numbers and concentrations.
Figure 8.
Contour plots of temperature variations on the hot surfaces at Re=480 and concentration of (a) 0 wt.%, and (b) 0.86 wt.%.
Figure 8.
Contour plots of temperature variations on the hot surfaces at Re=480 and concentration of (a) 0 wt.%, and (b) 0.86 wt.%.
Figure 9.
Variations of pressure drop at different Reynolds numbers and concentrations.
Figure 9.
Variations of pressure drop at different Reynolds numbers and concentrations.
Figure 10.
Contour plot of pressure on the hot plate for concentration of 0.86 wt.% at Reynolds numbers (a) 60, (b) 120, (c) 180, (d) 240, (e) 480, and velocity vectors on (f) hot, and (g) cold plates.
Figure 10.
Contour plot of pressure on the hot plate for concentration of 0.86 wt.% at Reynolds numbers (a) 60, (b) 120, (c) 180, (d) 240, (e) 480, and velocity vectors on (f) hot, and (g) cold plates.
Figure 11.
Variations of (a) Nusselt number, (b) convection heat transfer coefficient, and (c) pressure drop at different Reynolds numbers for base fluid and nanofluids with concentrations of 0.86 wt.% in single-phase and two-phase states.
Figure 11.
Variations of (a) Nusselt number, (b) convection heat transfer coefficient, and (c) pressure drop at different Reynolds numbers for base fluid and nanofluids with concentrations of 0.86 wt.% in single-phase and two-phase states.
Figure 12.
Variations of (a) convection heat transfer coefficient, and (b) pressure drop at Re=480 for nanofluids at different concentrations.
Figure 12.
Variations of (a) convection heat transfer coefficient, and (b) pressure drop at Re=480 for nanofluids at different concentrations.
Table 1.
Physical characteristics of PHE.
Table 1.
Physical characteristics of PHE.
| Parameters |
Values |
| Number of plates (N) |
21 |
| Length of plates (L) |
220 mm |
| Width of plates (w) |
80 mm |
| Thickness of plates (t) |
0.05 mm |
| Channel diameter (D) |
19.2 mm |
| Depth of plates (bc) |
1.5 mm |
| Plate area enlargement factor (ɸ) |
1.23 |
Table 2.
Governing equations for both the single–phase and mixture models.
Table 2.
Governing equations for both the single–phase and mixture models.
| Single phase: |
|
|
| Conservation of mass |
,
|
(10) |
|
(11) |
| Conservation of momentum |
|
(12) |
|
(13) |
|
(14) |
| Conservation of energy |
|
(15) |
| Two-phase (mixture model): |
|
|
| Conservation of mass |
|
(16) |
|
(17) |
| Conservation of momentum |
|
(18) |
| |
,
|
(19) |
| Volume fraction |
|
(20) |
| Drift velocity |
|
(21) |
| Slip/Relative velocity |
|
(22) |
| Drag function |
|
(23) |
| Acceleration |
|
(24) |
| Conservation of energy |
|
(25) |
Table 3.
Thermophysical properties of EG [
58].
Table 3.
Thermophysical properties of EG [
58].
| Temperature (°C) |
Density (kg/m3) |
Specific heat (kJ/kg·K) |
Kinematic viscosity (m2/s) |
Thermal conductivity (W/m·K) |
|
0
|
1130.75 |
2.294 |
7.53×10⁻⁶
|
0.242 |
|
20
|
1116.65 |
2.382 |
1.92×10⁻⁵
|
0.249 |
|
40
|
1101.43 |
2.474 |
8.69×10⁻⁶
|
0.256 |
|
60
|
1087.66 |
2.562 |
4.75×10⁻⁶
|
0.260 |
|
80
|
1077.56 |
2.650 |
2.98×10⁻⁶
|
0.261 |
|
100
|
1058.50 |
2.742 |
2.03×10⁻⁶
|
0.263 |
Table 4.
Physical specifications of SiO2 nanoparticles, MWCNTs, EG, and water at 30 °C.
Table 4.
Physical specifications of SiO2 nanoparticles, MWCNTs, EG, and water at 30 °C.
| Material |
Thermal conductivity (W/m·K) |
Electrical conductivity (S/m) |
Density (kg/m3) |
Diameter (nm) |
Ref. |
| SiO2
|
1.38 |
10-21
|
2220
|
20–30 |
[59] |
| MWCNTs |
1500–3000
|
>0.1 |
2100
|
Outer :20–50
Inner: 2–6 |
[52] |
| EG |
0.615 |
6
|
999
|
– |
[59] |
| Water |
0.252 |
1.07 |
1110
|
– |
[59] |
Table 5.
The boundary conditions governing the problem.
Table 5.
The boundary conditions governing the problem.
| Boundary name |
Boundary type |
Value |
| Cold stream inlet |
Mass flow inlet |
4 L/minT=22.4 °C |
| Hot stream inlet |
Mass flow inlet |
=3.28 L/minT=50.5 °C |
| Hot stream outlet |
Pressure Outlet |
P=101325 Pa |
| Cold stream outlet |
Pressure Outlet |
P=101325 Pa |
| Intermediate walls |
Wall |
Coupled, Nonslip (U=0.0, V =0.0) |
| Outer walls |
Wall |
Q=0.0 w/m2, Nonslip (U=0.0, V =0.0) |
Table 6.
The examined cases for mesh independence.
Table 6.
The examined cases for mesh independence.
| Category Number |
Inlet hot stream temperature (°C) |
outlet hot stream temperature (°C) |
Inlet cold stream temperature (°C) |
outlet cold stream temperature (°C) |
Hot stream flow rate (L/min) |
Cold stream flow rate (L/min) |
| 1 |
50.5 |
43.53 |
22.4 |
29.38 |
4 |
3.28 |
| 2 |
60 |
46.75 |
22.4 |
29.87 |
2.26 |
4 |
