1. Introduction
In the rapidly advancing field of precision livestock farming technology, intelligent management has become a key factor in enhancing production efficiency and reducing costs. Particularly within the poultry farming industry, as the global demand for chicken meat and eggs increases, numerous farms are progressively transitioning towards intelligent and automated systems [
1]. Many large-scale poultry farms have developed and implemented intelligent management systems for tasks such as overall temperature control in the henhouses, automated egg collection, and automated feeding, significantly reducing costs. However, many practical issues remain resolved in the refined, intelligent management of individual hens and cages.
Geffen, et al. [
2] utilized a convolutional neural network based on Faster R-CNN to detect and count laying hens in battery cages, achieving an accuracy of 89.6%. Bakar, et al. [
3] demonstrated a novel feature for detecting bacteria or virus-infected chickens by automatically detecting the colour of the chicken's comb. Yu, et al. [
4] propose a cage-gate removal algorithm based on big data and deep learning Cyclic Consistent Migration Neural Network (CCMNN) for the detection of head features in caged laying hens. Wu, et al. [
5] employed super-resolution fusion optimization methods for multi-object chicken detection, enriching the pixel features of chickens. Campbell, et al. [
6] utilized a computer vision system to monitor broiler chickens on farms, analyzing the activity of the broilers through an unsupervised 2D trajectory clustering method.
Establishing and refining a refined, intelligent management system for poultry farms are inseparable from the support of high-quality data. The quality and quantity of the dataset play a crucial role in the training of deep learning based algorithms, the validation of models, and the enhancement of system performance [
7]. Yao, et al. [
8] constructed a gender classification dataset for free-range chickens, which includes 800 images of chicken flocks and 1000 images of individual chickens. Adebayo, et al. [
9] collected a dataset of 346 audio signals for health monitoring of chickens based on vocalization signals. Aworinde, et al. [
10] established a chicken faeces image dataset with data labels containing 14,618 images for predicting the health status of chickens. We have yet to encounter a high-quality dataset of visible light and thermal infrared images for caged laying hens.
This paper explores the construction and application of laying hen datasets and analyses their potential value in intelligent breeding management. We will provide a detailed introduction to the collection, processing, and annotation processes of the laying hen datasets and discuss how to use these datasets to train deep learning models to achieve real-time monitoring of the health status of chickens, disease prevention, behavioural analysis, and counting etc.. This study will provide valuable data resources for researchers and practitioners for precision caged laying hens farming.
2. Materials and Methods
2.1. Data Collection
Before data collection, we devised a detailed photography plan, aiming to meet the diverse characteristics of the data.
2.1.1. Experimental Location
China stands as one of the largest global producers and consumers of eggs, rendering the collection of laying hen data from Chinese large-scale farms highly significant for investigating the utilization of artificial intelligence technologies in health monitoring and behavioural recognition of laying hens. We gathered data from a substantial poultry farm in Hebei, China, where white feather laying hens exceed one million. The housing structure within a single shed consists of a 10-column by 8-tier cage configuration, with partitions every four tiers. Each cage accommodates 6 to 8 laying hens, with an age range of 200 to 300 days. The dimensions of an individual cage are 60cm in length and 60cm in width, with a front height of 50cm and a rear height of 38cm, and the cage floor is inclined at approximately 10°. The data collection apparatus is positioned 60cm from the cage's exterior.
2.1.2. Experimental Equipment
Data collection devices consist of smartphones and chicken inspection robots equipped with visible light cameras and infrared thermal cameras [
11]. The specific parameters of the image acquisition devices are detailed in
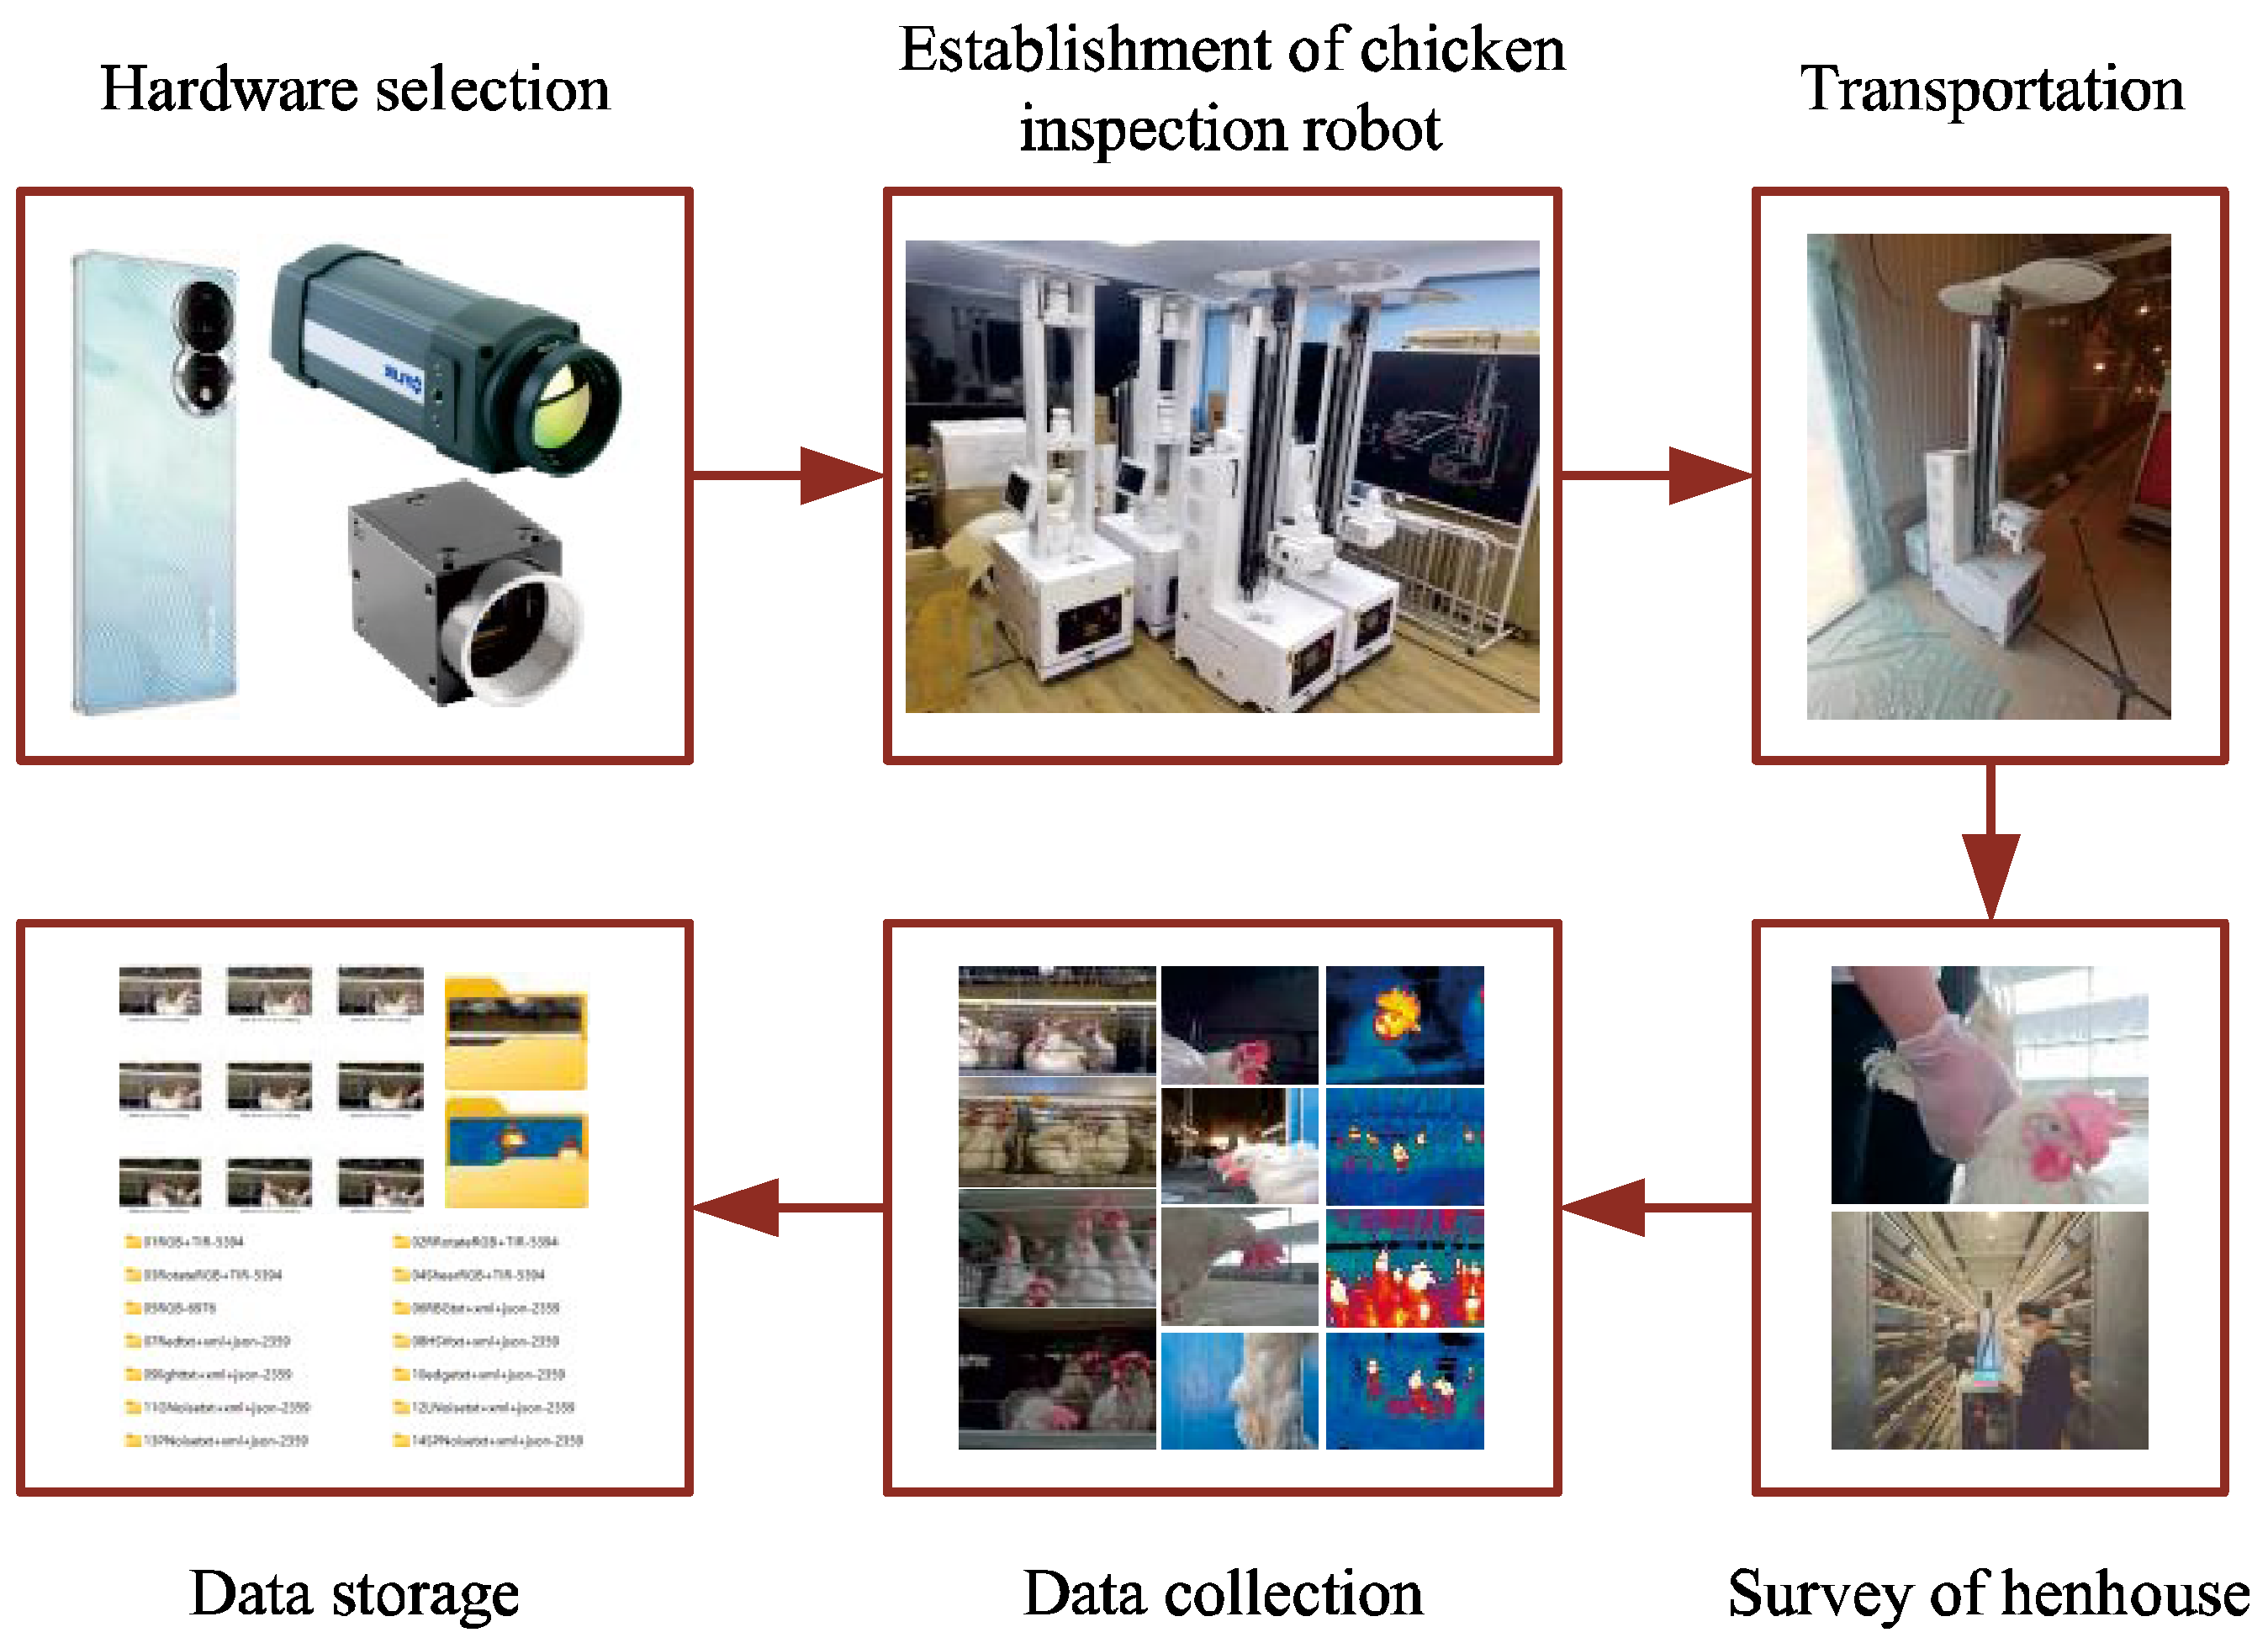
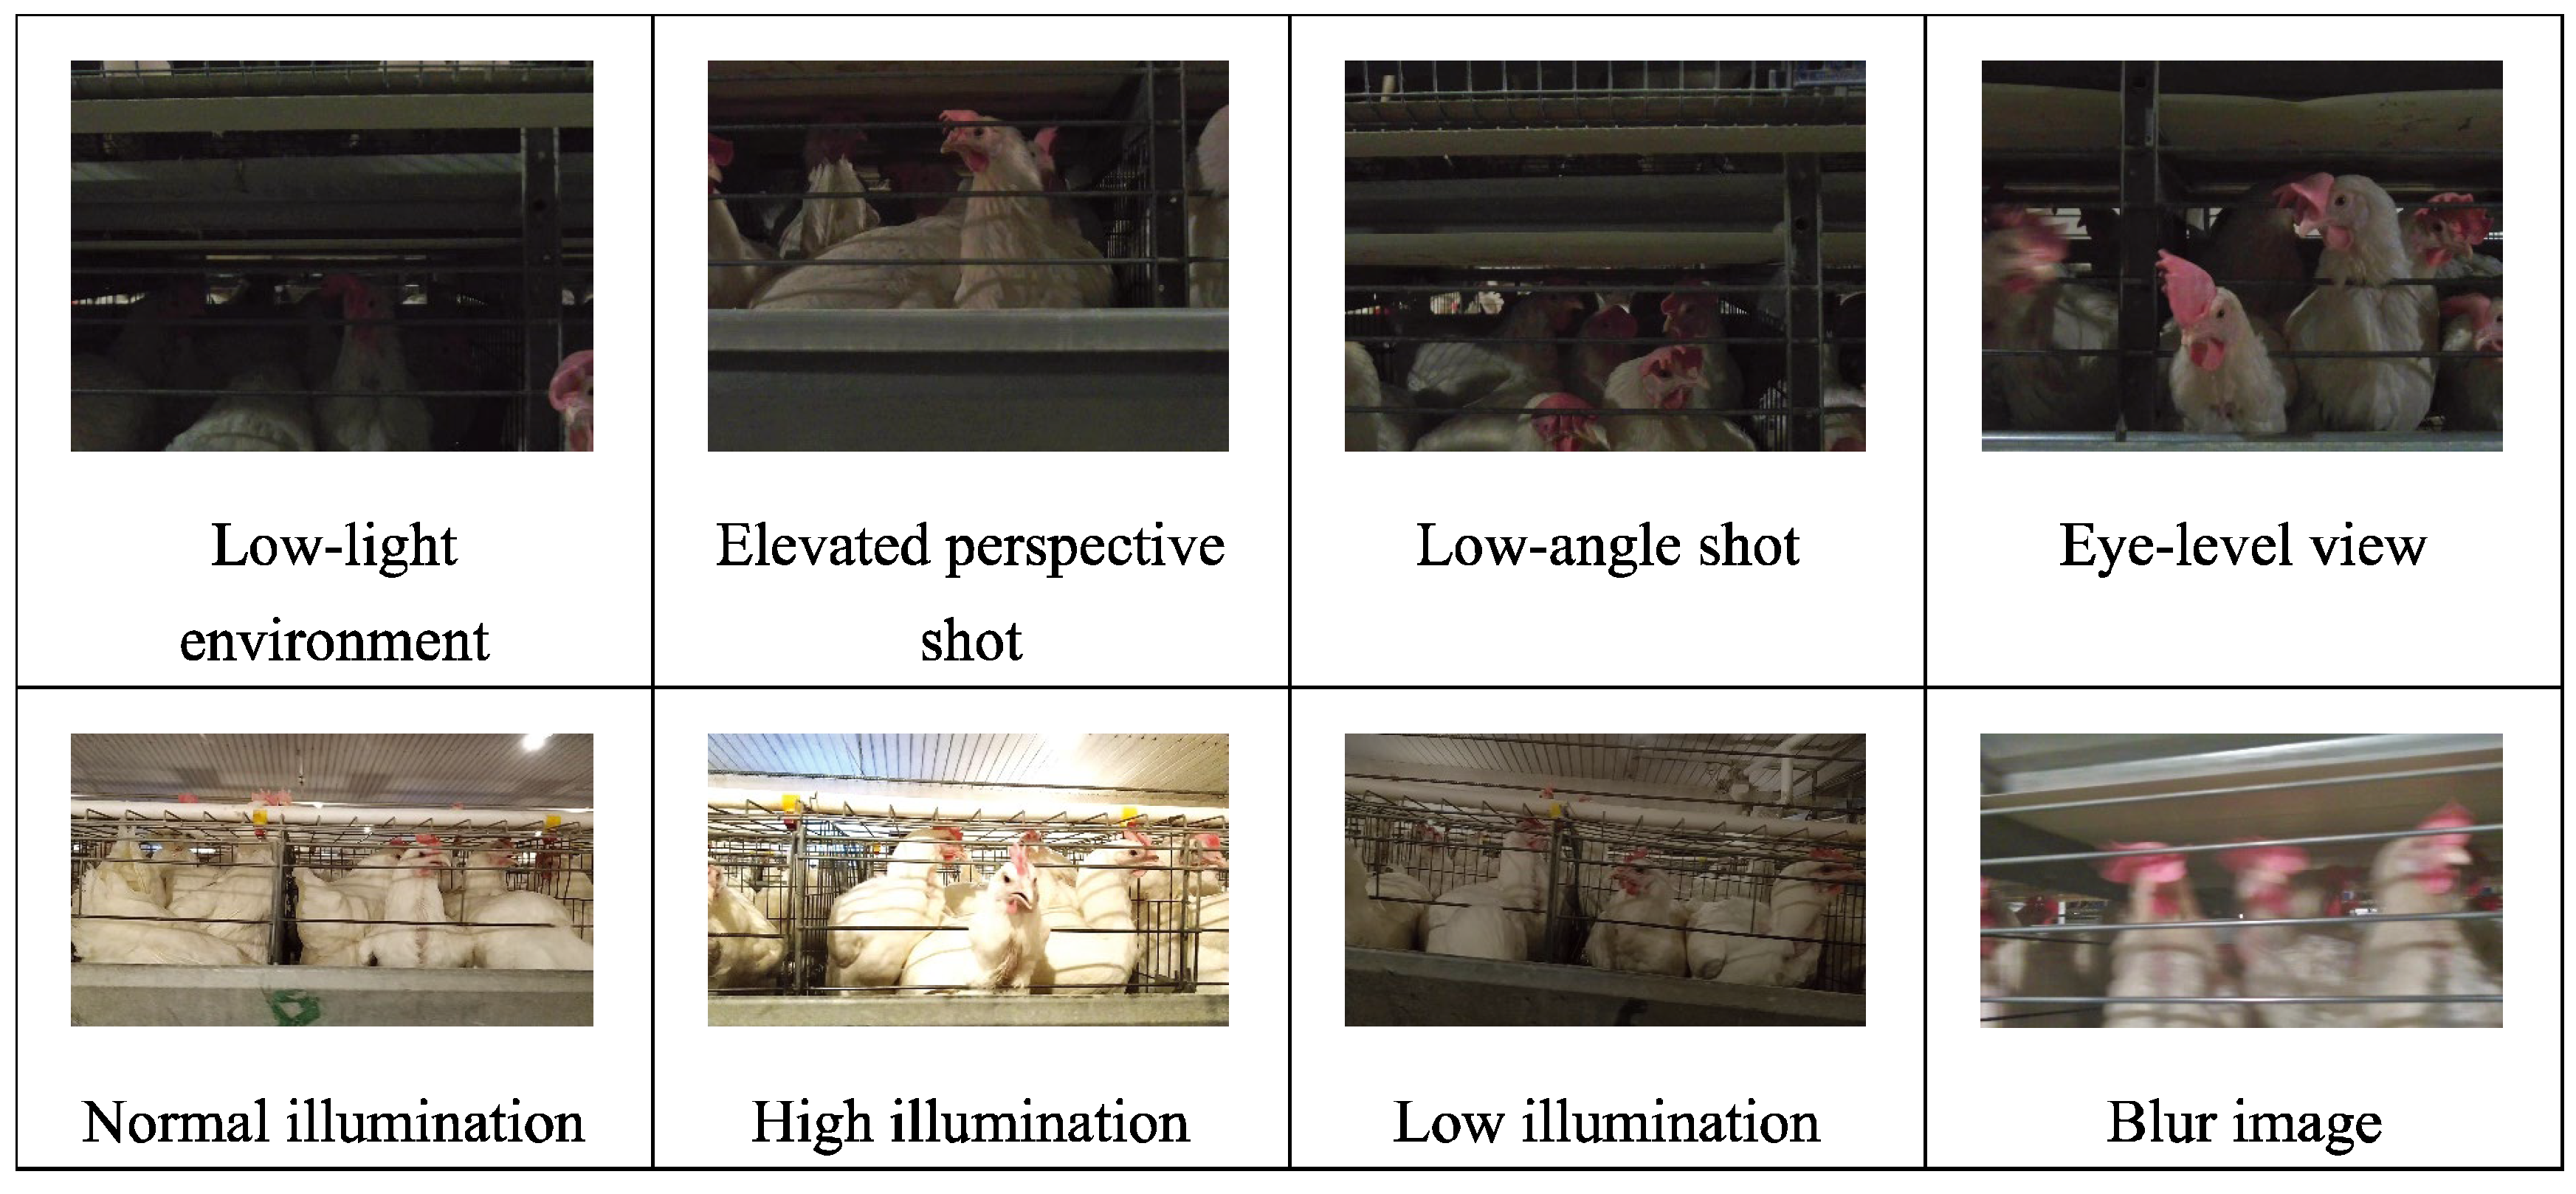
Table 1. Given the varying image qualities produced by the three types of collection devices, the BClayinghens dataset adeptly captures the diversity of images within the henhousing environment, as depicted in
Figure 1.
Notably, during the acquisition of TIR images by the chicken inspection robot, the camera is simultaneously activated to capture RGB images (with approximately a 1-second interval between the two image captures). Consequently, each TIR image of the henhouse has a corresponding RGB image, providing viable data material for the design of image fusion algorithms [
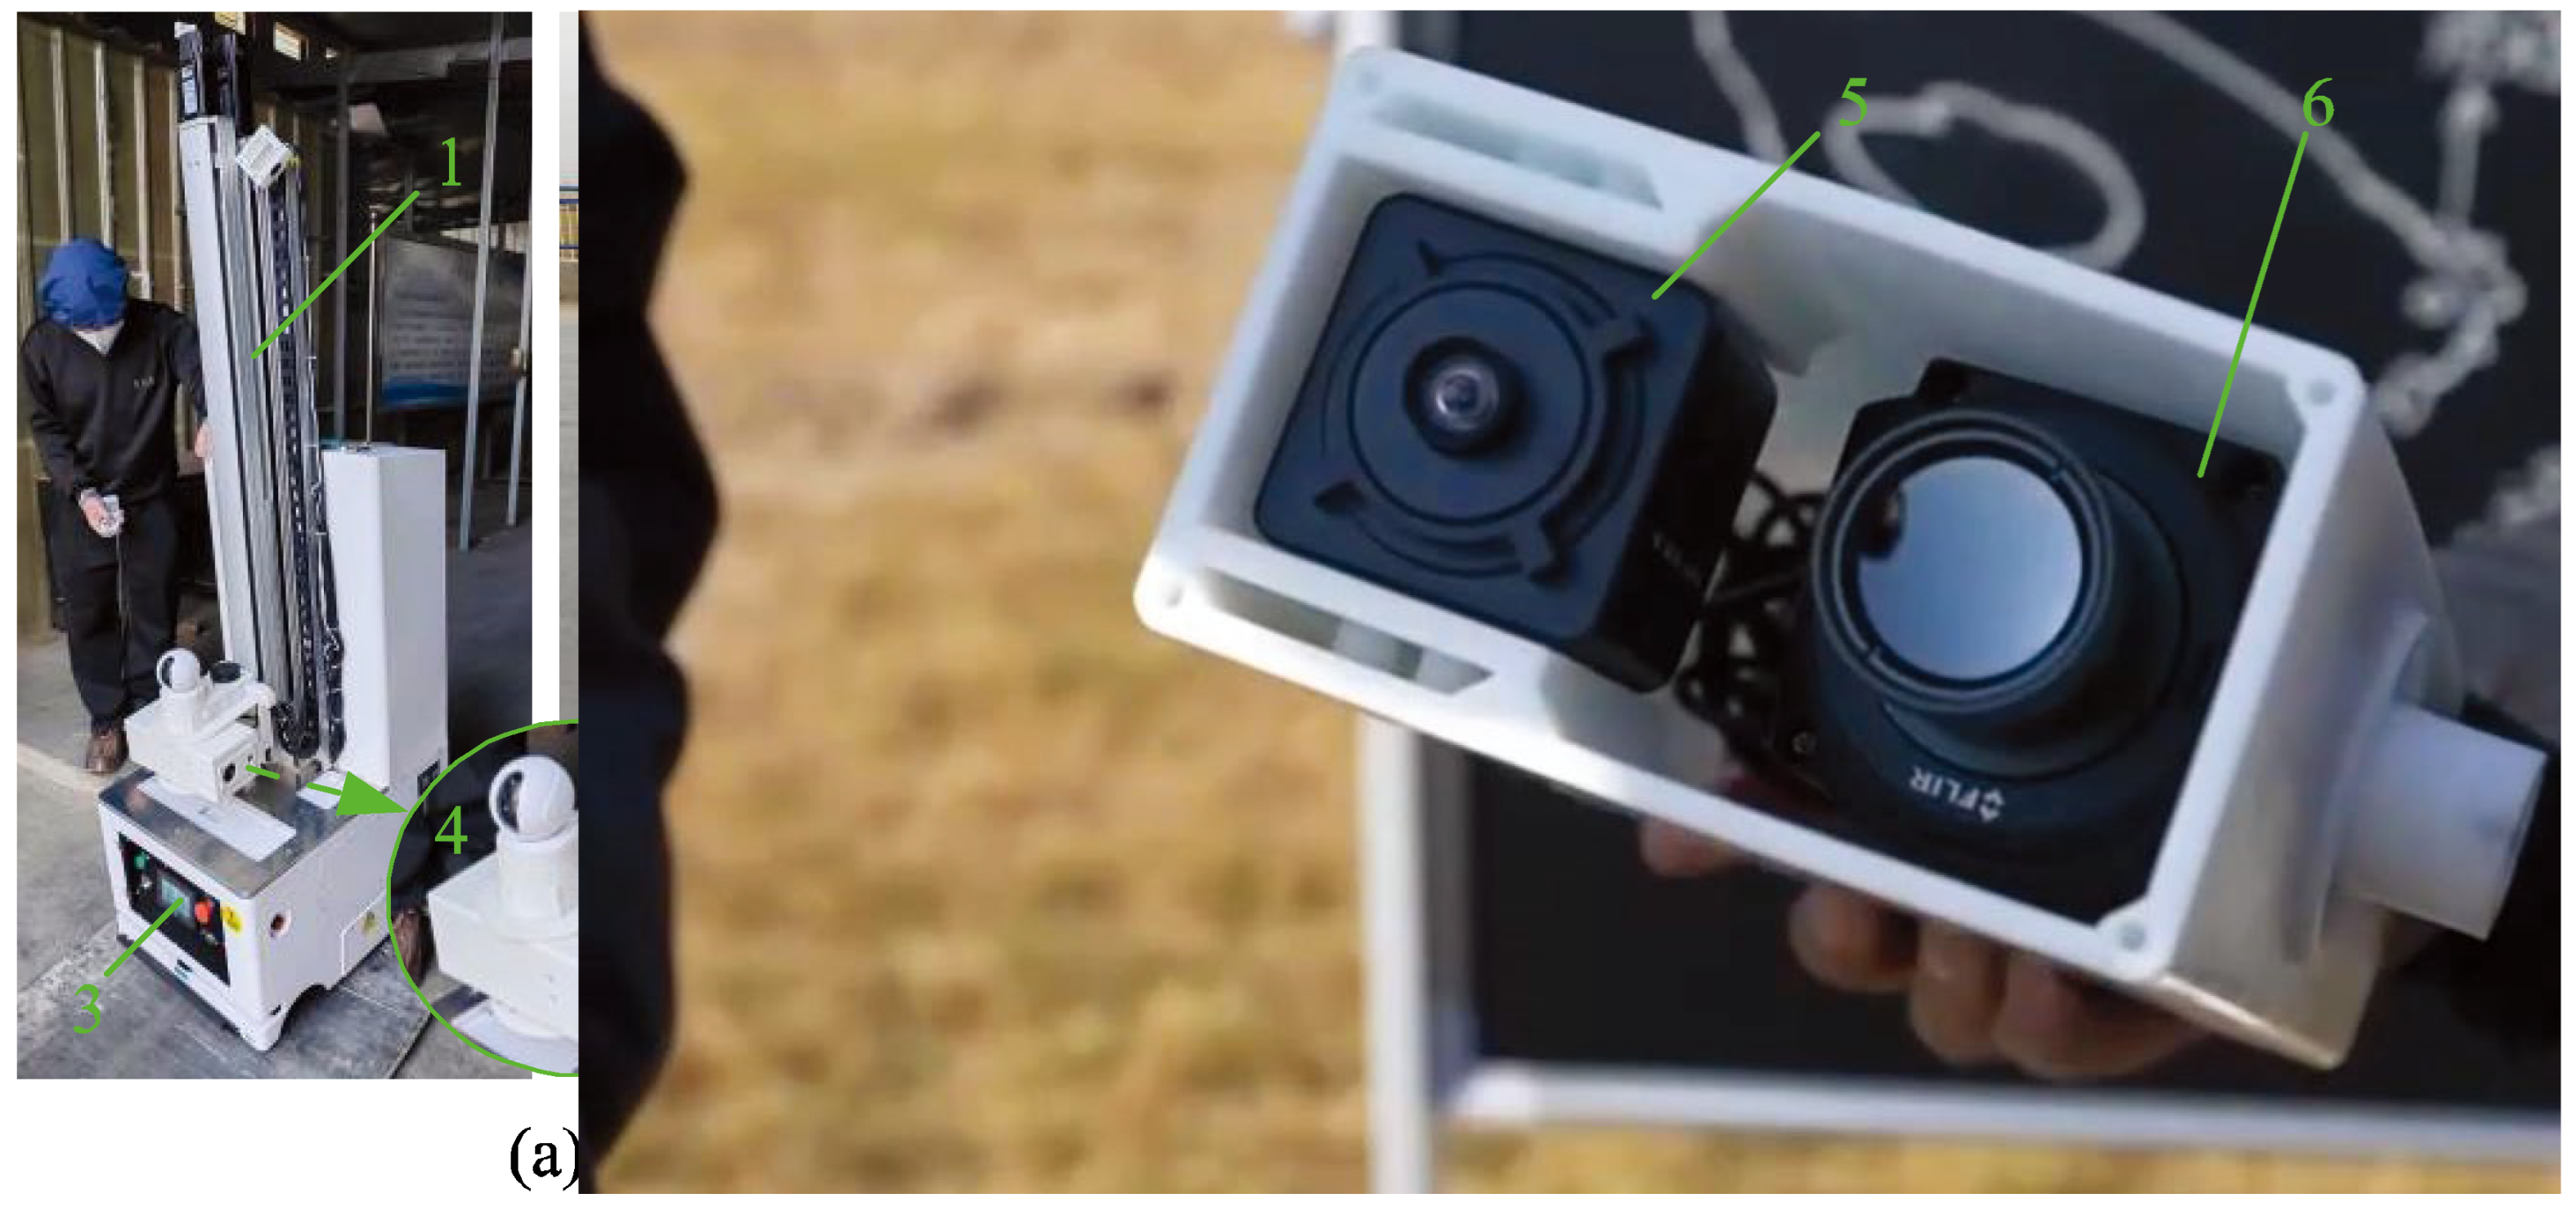
12]. The chicken inspection robot and its image capture devices are showed in
Figure 2. Additionally, by scaling and shifting the RGB images and conducting boundary checks and dimension adjustments, we have achieved coordinate correction between RGB and TIR images.
2.1.3. Experimental Methods
In large-scale poultry farms, the internal environment of the henhouses is uniformly regulated by a central environmental control system. The main factors affecting the experimental data include: resting hens, feed cart feeding, egg laying by laying hens, and pecking behaviors of the chickens. Under a single experiment, the chicken dataset is captured in 12 sessions, as shown in
Table 2.
All images were captured between April 2022 and July 2024, with five experimental sessions carried out at different time intervals, totalling 60 captures. This resulted in 30,993 raw images with a data file size of 6.89 GB.
2.1.4. Data Preprocessing
Data preprocessing encompasses three aspects: 1: For series containing only RGB images, data cleansing is required. Duplicate and chicken-free images are removed to meet the needs of chicken head detection tasks and to facilitate the exploration of performance enhancement in object detection by deep learning algorithms. 2: For a series of images where RGB corresponds to TIR images, the correspondence between RGB and TIR images is verified, and any RGB and TIR images not containing laying hens are removed. 3: The selected data is annotated to distinguish between the chicken head and body parts, which will be beneficial for implementing chicken counting and dead chicken detection tasks. The data annotation work is completed by data annotators, ensuring the accuracy of the data labels.
2.2. Data Augmentations
The limitations of the poultry farm environment can result in a singular environment within the collected laying hen image dataset and a limited number of collections. To better adapt this dataset to various breeding environments and deep learning models, we have employed data augmentation techniques to enrich the existing data. Data augmentation considers the impact of factors such as the breeding environment, collection equipment, and chicken head features on the generalizability of the dataset, making the augmented dataset more accurate and reliable in model expression.
2.2.1. Rotation
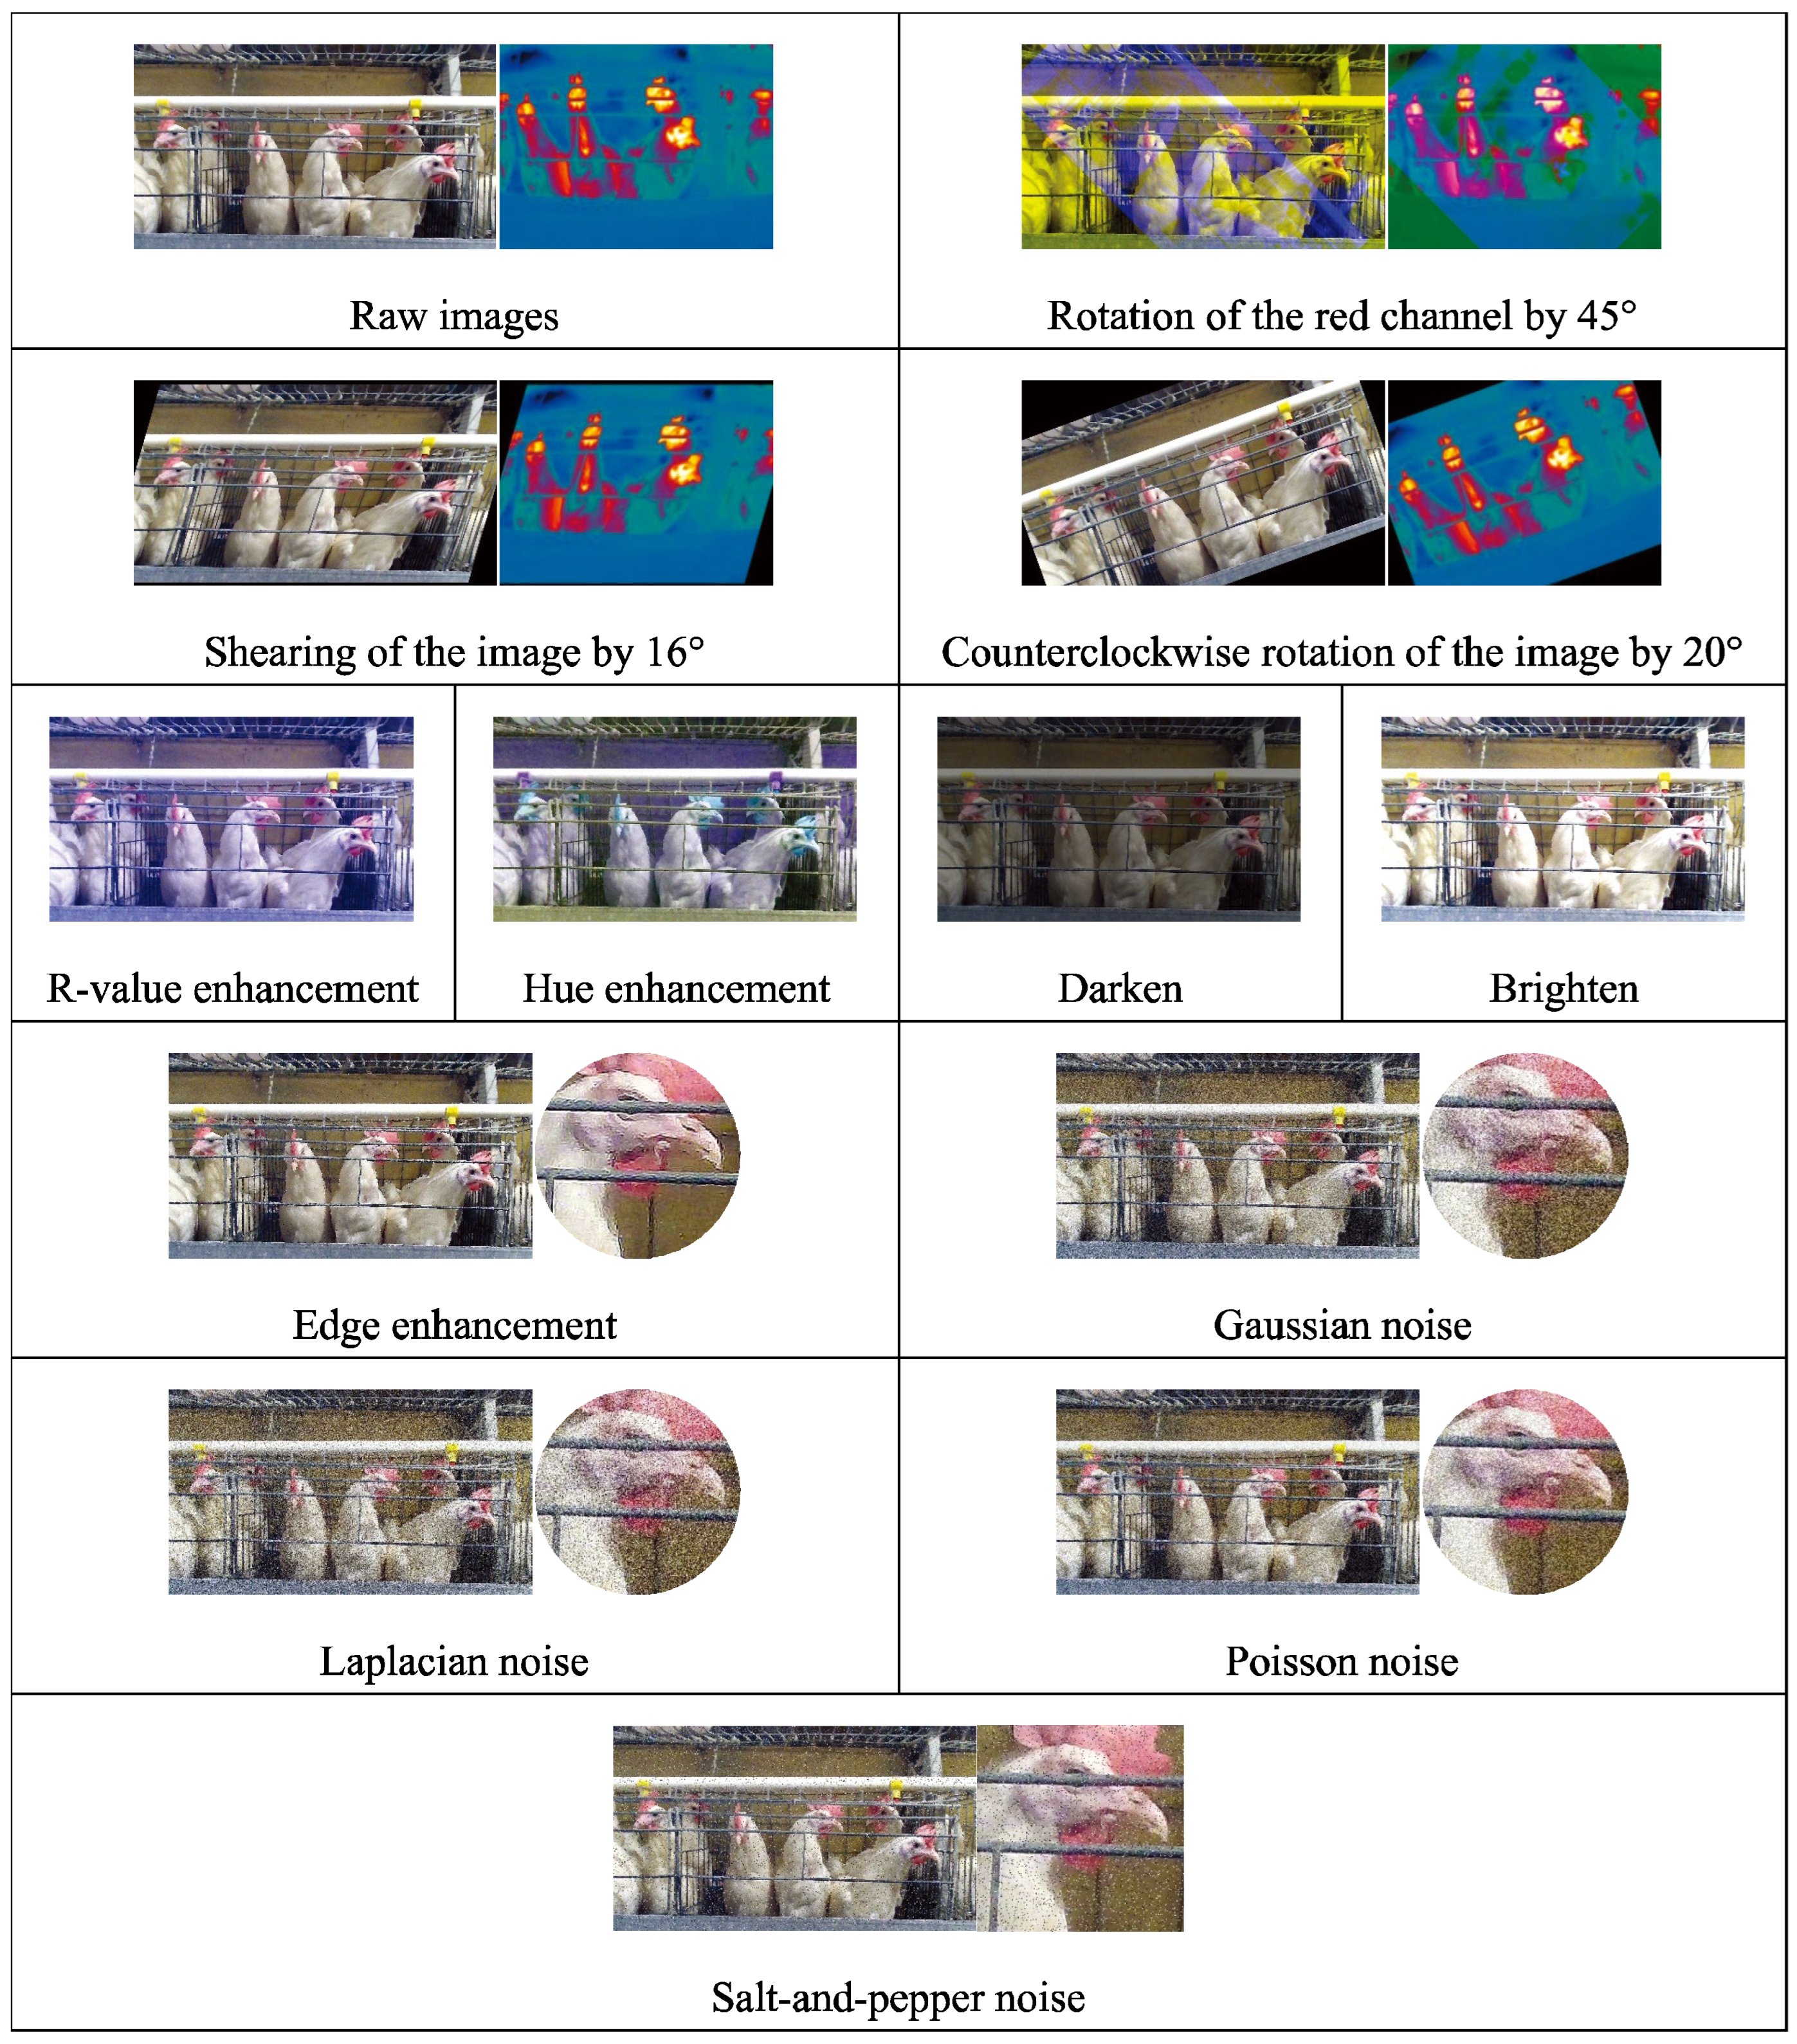
Three rotation methods are used for data augmentation: rotating the image's red channel by 45°, shearing the image in a 16° direction to create a tilt effect, and rotating the image counterclockwise by 20°. Rotation augmentation is primarily used for enhancing RGB-TIR images, and the enhanced RGB images remain corresponding to the TIR images.
2.2.2. R-Value (Redness) Enhancement
The key to accurately identifying laying hens is precisely determining the chicken head. Since the comb colour of a laying hen is red, enhancing the value of the red channel in the RGB image will facilitate the differentiation between the target and the background. We randomly increase the R channel of each pixel of the image by a value between 10 and 100, as follows:
where Renhanced is the red channel value of the pixel at position (x, y) in the enhanced image; △R is a random variable ranging from [10, 100]; Rraw is the red channel value of the pixel at position (x, y) in the raw image.
2.2.3. Hue Enhancement
Hue enhancement can make the model more robust during training and capable of dealing with the impact of hue variation. First, convert the image from the RGB colour space to the HSV colour space. Then, select the hue channel H and add a random value. The hue enhancement is calculated as follows:
where Henhanced is the enhanced H channel value; △H is a random variable ranging from [25, 90]; Hraw is the H channel value of the raw image. Since hue H is periodic (between 0 and 360 degrees), periodic adjustment is made to Henhanced during the enhancement process to ensure it remains within the valid hue range.
2.2.4. Brightness Enhancement
Brightness enhancement is used to simulate lighting variations in different poultry farms, variations in lighting at different heights of chicken cages within the same farm, and imaging differences in image collection by different cameras, thereby increasing data complexity. A multiplication factor is applied to each channel of every pixel in the image, calculated as follows:
where Penhanced is the pixel value of the enhanced image; k is a random variable ranging from [0.5, 1.5]; Praw is the pixel value of the raw image. When k is less than 1, the enhanced image is darker than the raw image; when k is greater than 1, the enhanced image is brighter than the raw image.
2.2.5. Edge Enhancement
Edge enhancement is used to make the edges of the image more pronounced, which can improve the image's visual effect. Incorporating edge enhancement as a step in the laying hen data augmentation process during machine learning model training can enhance the model's ability to recognize edge features of the chicken head (especially the comb part).
2.2.6. Gaussian Noise
Gaussian noise is added for data augmentation to simulate noise interference during the image collection process in the henhouse. A random noise value following a Gaussian distribution is added to each raw image pixel. The enhanced pixel value is calculated as follows:
where PGnew is the pixel value of the image after Gaussian enhancement; the clip function limits the value to the range of 0 to 255; N is the noise value, randomly drawn from a Gaussian distribution with a standard deviation of 51.
2.2.7. Laplacian Noise
Laplacian noise enhancement is added to simulate interference caused by low lighting and high compression rates during image collection in the henhouse environment. A random noise value following a Laplacian distribution is generated for each pixel of the image, calculated as follows:
where PLnew is the pixel value of the image after Laplacian enhancement; the clip function limits the value to the range of 0 to 255; M is the noise value, randomly drawn from a Laplacian distribution with a scale of 51.
2.2.8. Poisson Noise
Statistical noise following a Poisson distribution is added to enhance the robustness of the model, calculated as follows:
where PPnew is the pixel value of the image after Poisson enhancement; the clip function limits the value to the range of 0 to 255; λ is the noise value, randomly drawn from a Poisson distribution with a scale of 40.
2.2.9. Salt-and-Pepper Noise
Salt-and-pepper noise is added for data augmentation to simulate interference in images due to low-quality cameras, wireless transmission errors, storage media damage, and other similar issues. The proportion of pixels covered by noise points in the image is defined as 10%, and within this 10%, white (salt) or black (pepper) pixel points are randomly introduced.
The raw images were processed using the methods above, as illustrated in
Figure 3. Before data augmentation, there were 30,993 raw images, with 2,359 xml, json, and txt data labels each. It is important to note that the laying hen data obtained through the above data augmentation methods include not only the laying hen images but also the corresponding xml, json, and txt data labels for the augmented laying hen images, or the TIR images corresponding to the RGB images. This allows for the support of various model training tasks. After data augmentation, there are 61,133 images and 63,693 data labels (21,231 XML, JSON, and TXT data labels each).
3. Results and Analysis
3.1. Data Description
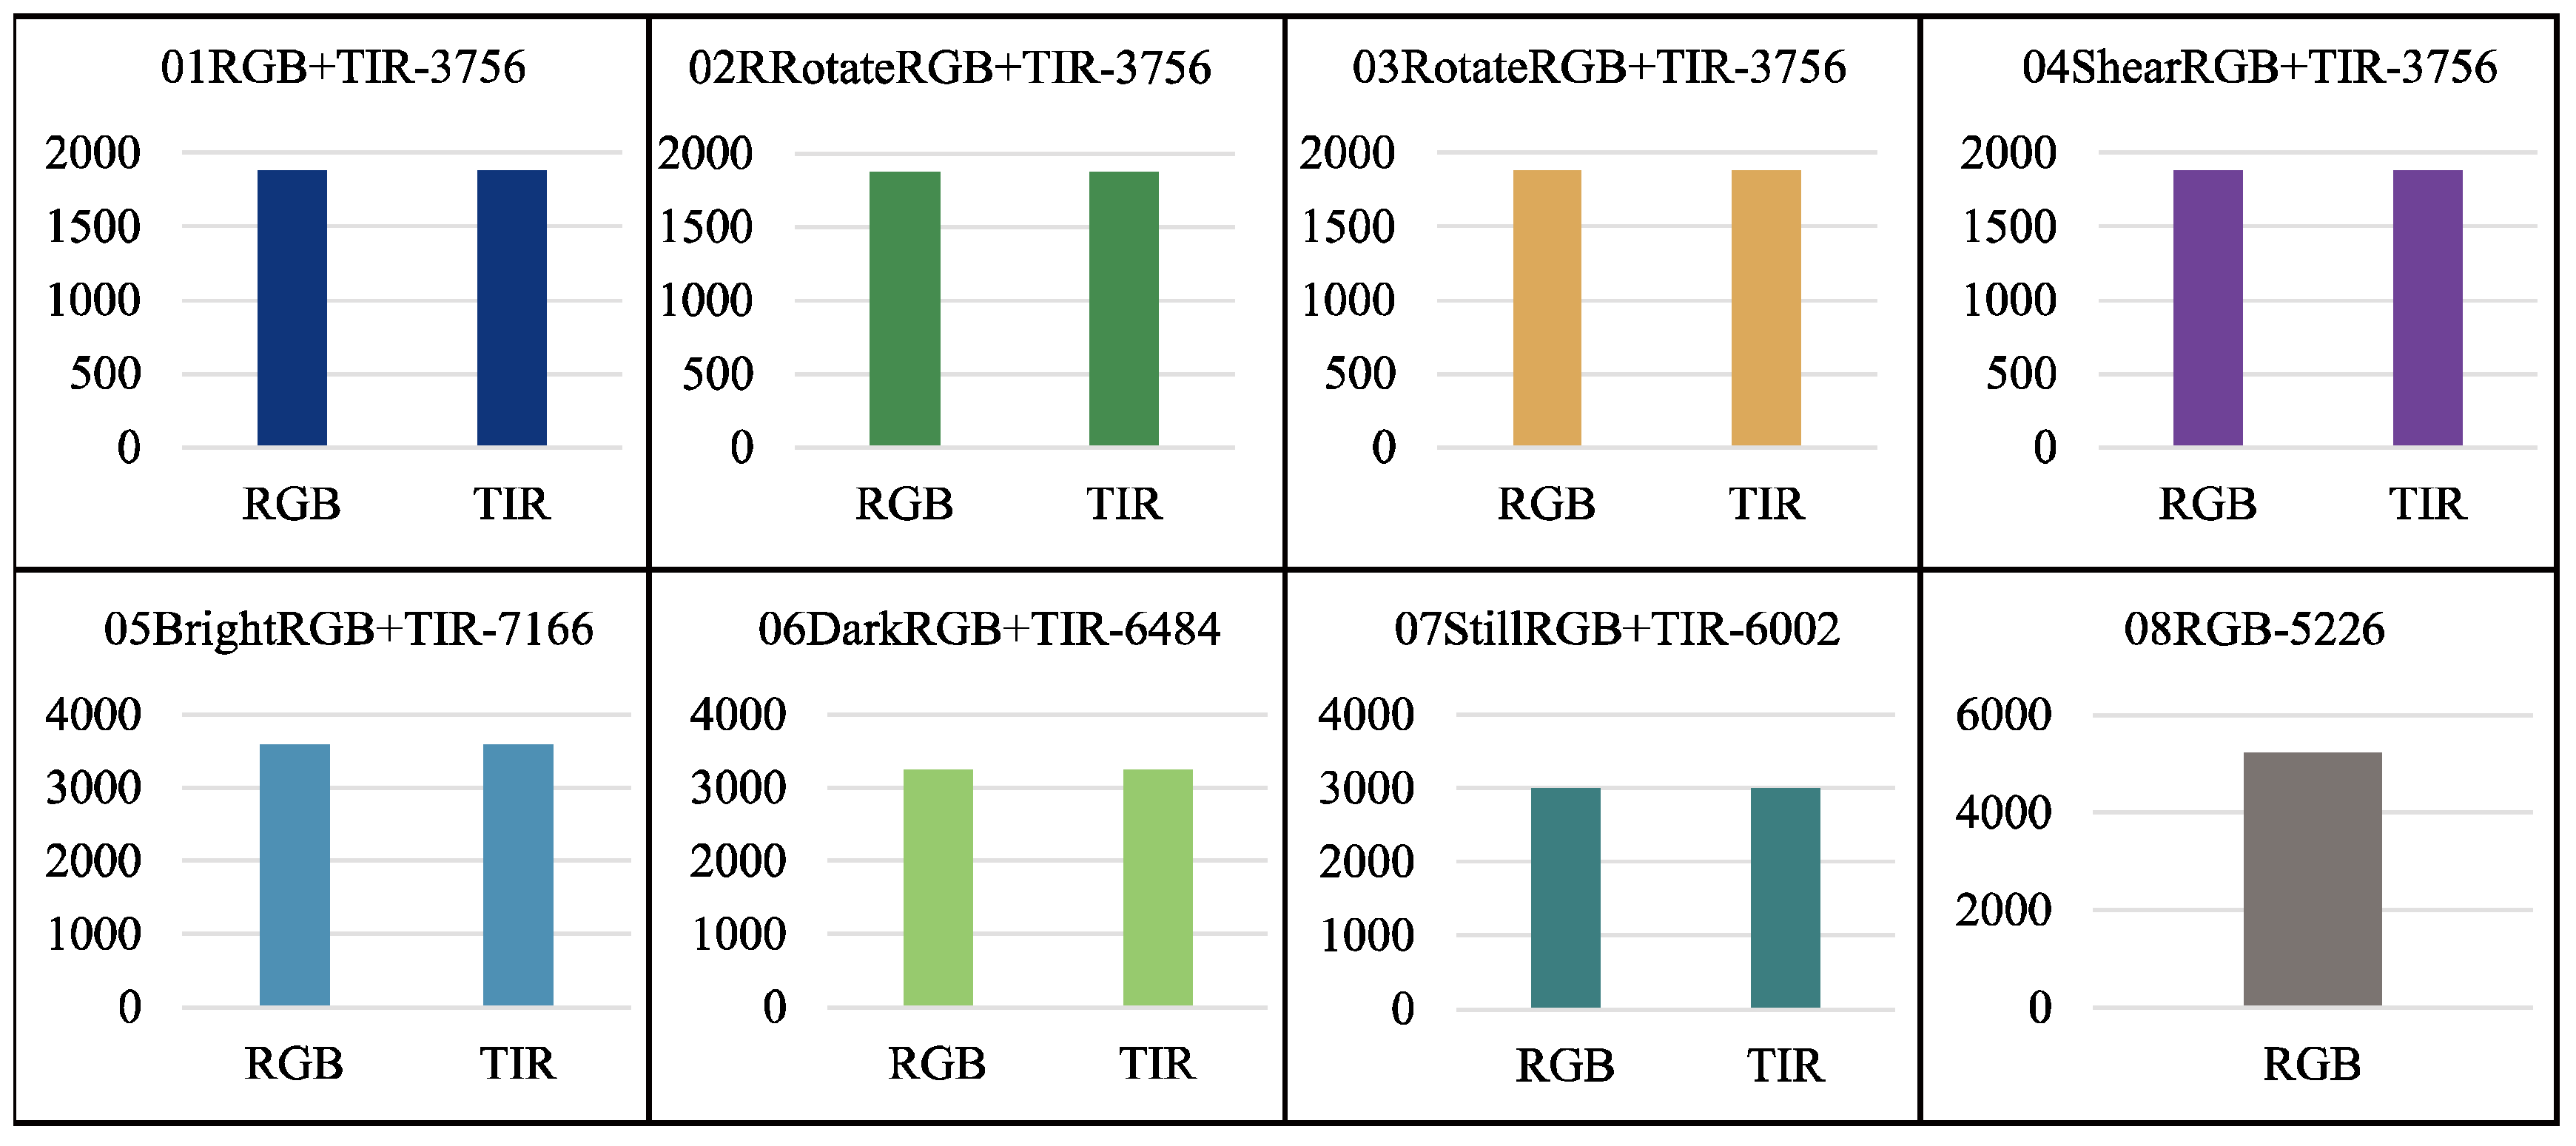
This dataset encompasses three categories of imagery data about laying hens: RGB image data, paired RGB and Thermal Infrared (TIR) image data, and RGB image data incorporating chicken head annotation information. Specifically, the dataset comprises 5,226 RGB images of individual hens, constituting 8% of the total dataset. The paired RGB and TIR images number 34,676, representing 57% of the dataset. The RGB images annotated with chicken head information total 21,231, accounting for 35% of the dataset.
3.1.1. Data Environment
A robust dataset must consider both the quantity and quality of the images and the diversity of the environment [
14], taking into account a variety of photographic perspectives, lighting conditions, and background contexts.
Figure 4,
Figure 5 and
Figure 6 depict the range of complex environments captured within the dataset.
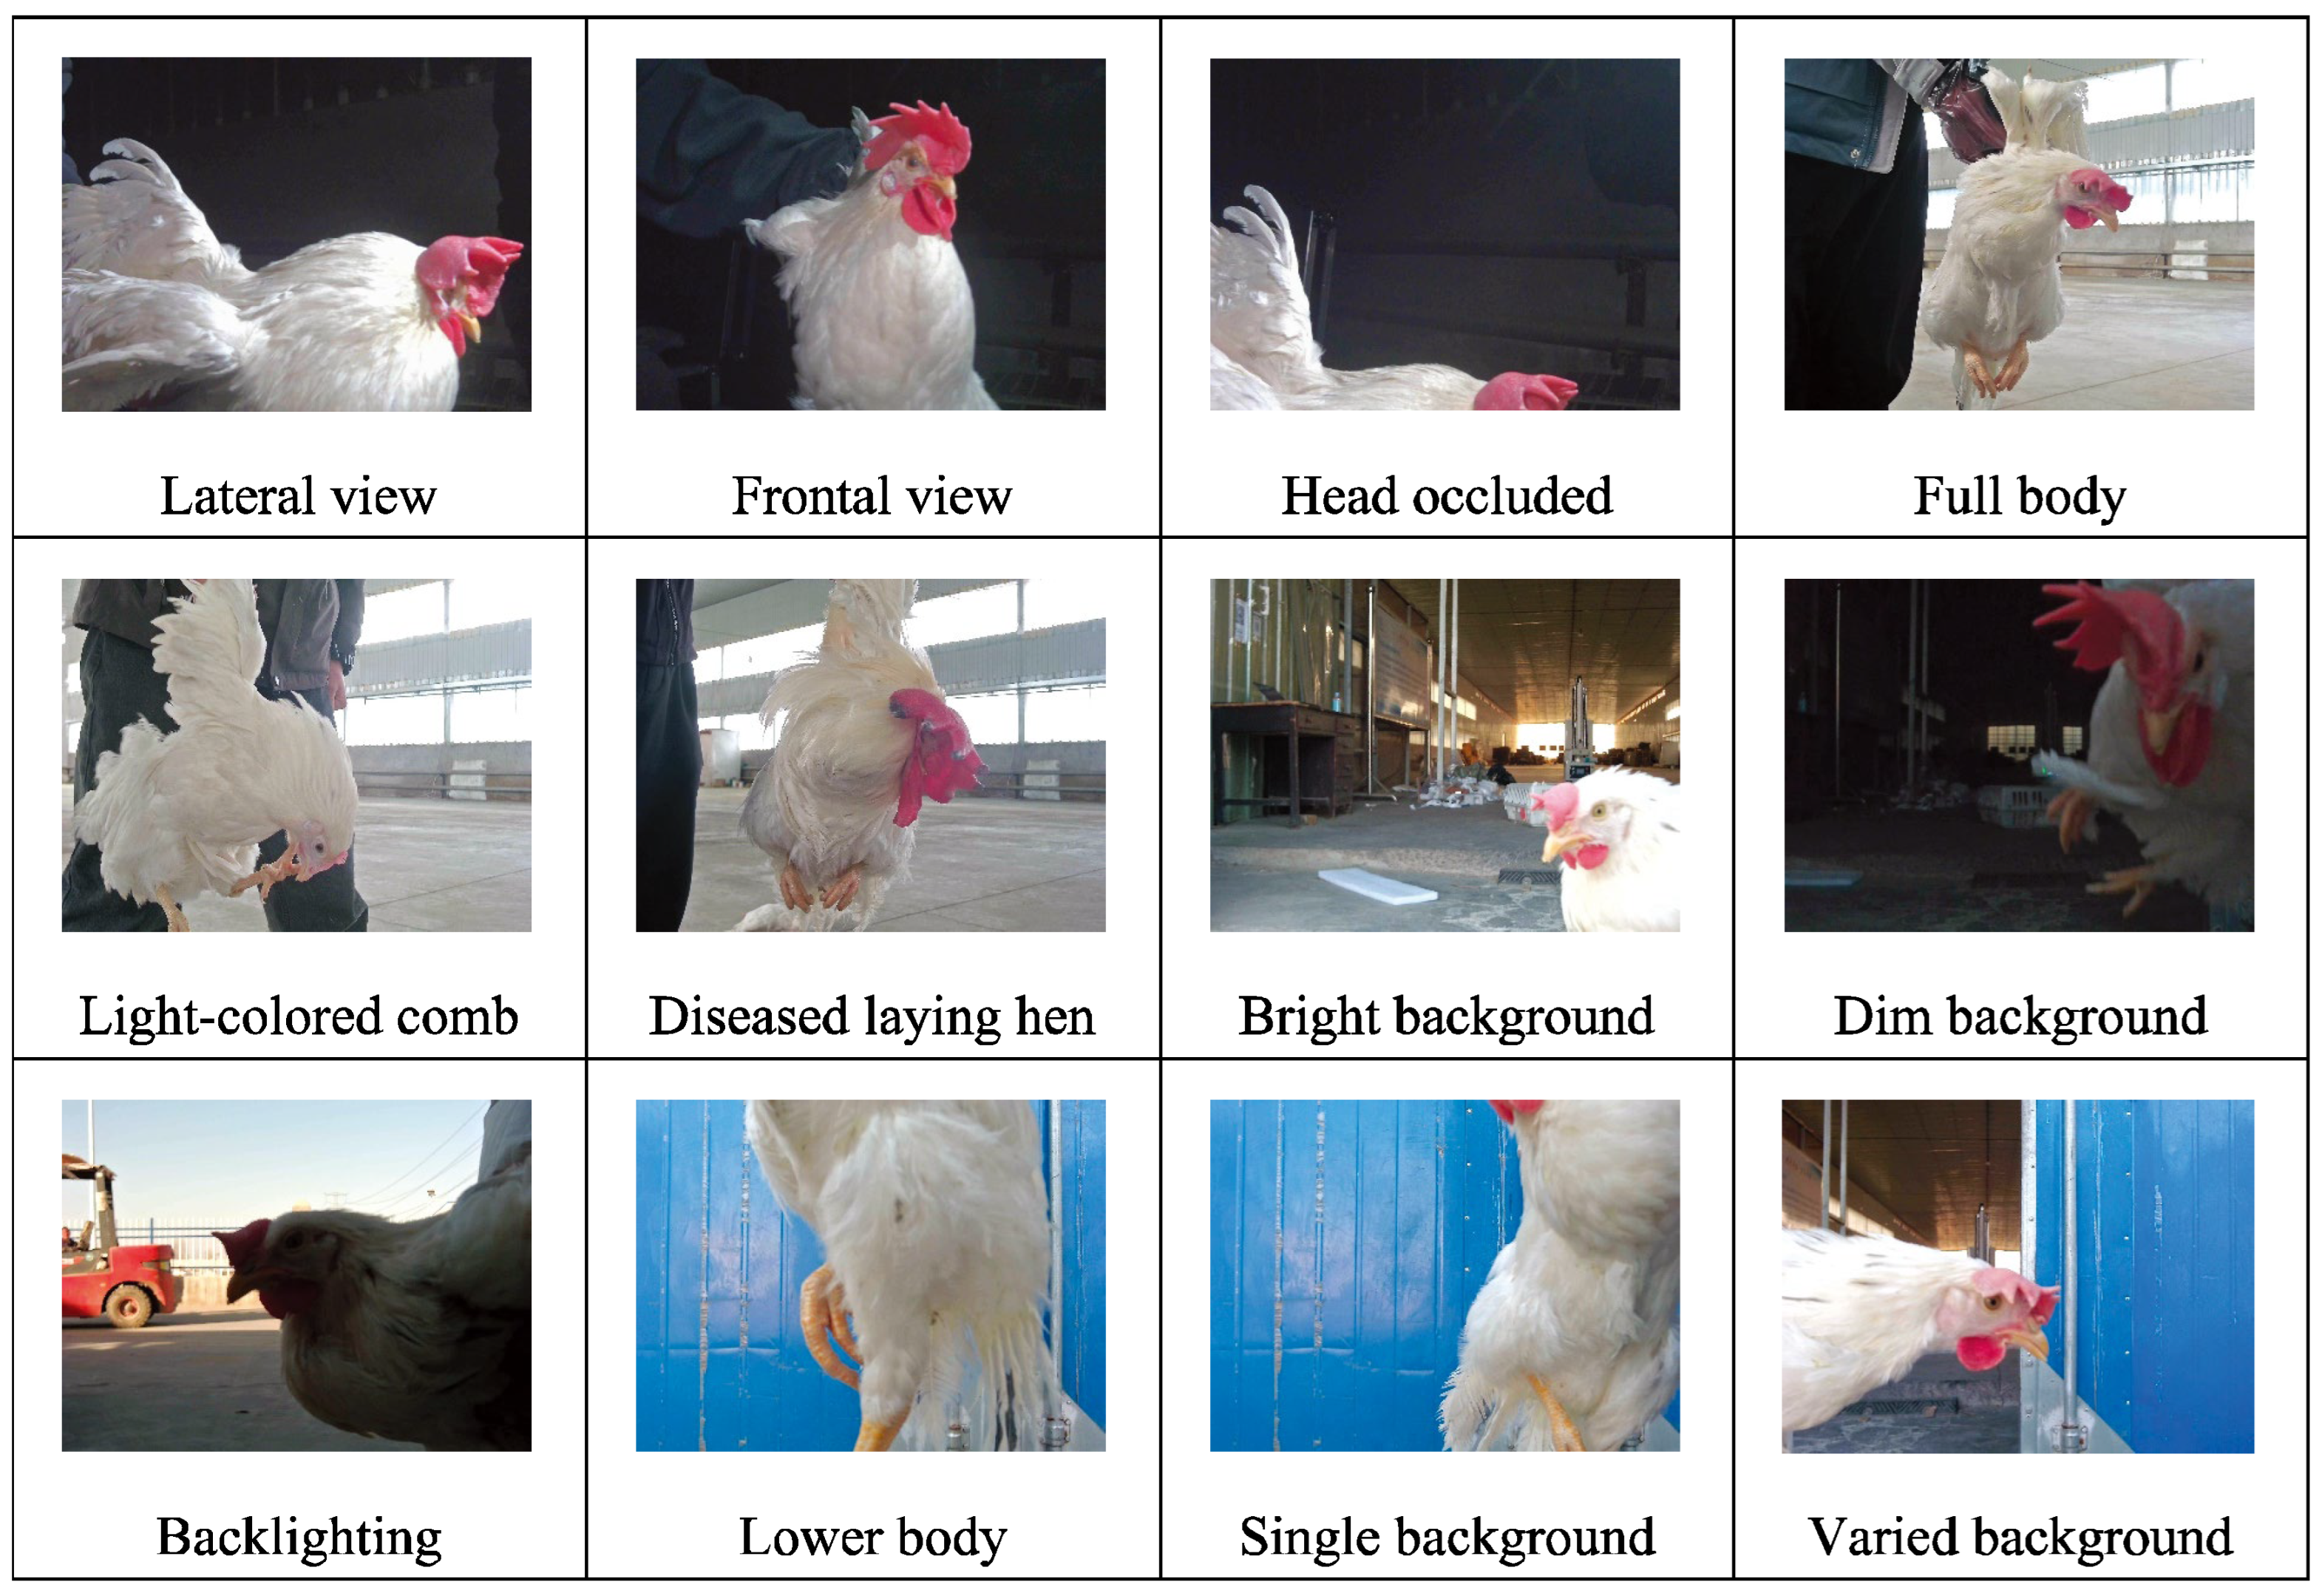
(1) We collected data on individual laying hens in a natural environment, as illustrated in
Figure 4. During photography, complete and partial images of the hens were captured under various natural lighting and background conditions. The data obtained from the natural setting are conducive to analyzing the morphology of free-range laying hens [
15] and assessing their health state.
(2) The activity states of caged laying hens were photographed, considering the variations in cage lighting and camera angles, as depicted in
Figure 5. The dataset of caged laying hens can be utilized to analyze flock activity levels, detect deceased hens within cages, and calculate hen population numbers.
(3) An innovative image acquisition technology that fuses RGB images with TIR images was introduced [
16], as shown in
Figure 6. Corresponding RGB and TIR images were taken at different distances, angles, and with varying numbers of hens, capturing multimodal image data. The image fusion technique overcomes interference caused by camera shake in RGB images and provides data support for studying infectious diseases among hen flocks.
Due to the slightly wider field of view in TIR image compared to RGB images (with the TIR image resolution being lower than that of the RGB images), we employed image correction [
17] methods to transform the coordinates and dimensions of the RGB images onto the TIR images to align these two kinds of image. Using the
xywh notation for image correction, the calculation method for the two-dimensional coordinates of pixels and the dimensions of length and width in the TIR image is as follows:

where x represents the x-coordinate in the RGB image with the top-left corner as the origin; y represents the y-coordinate in the RGB image with the top-left corner as the origin; w denotes the raw width of the RGB image; h denotes the raw height of the RGB image; Tx signifies the x-coordinate in the transformed TIR image; Ty signifies the y-coordinate in the transformed TIR image; Tw denotes the width of the transformed TIR image; Th denotes the height of the transformed TIR image; kx is the scaling factor for the x-coordinate, taken as 0.09661 in this paper; ky is the scaling factor for the y-coordinate, taken as 0.09558 in this paper; kw is the scaling factor for the image width, taken as 0.09672 in this paper; kh is the scaling factor for the image height, taken as 0.09618 in this paper; bx is the adjustment factor for the x-coordinate offset, taken as 8.66434 in this paper; by is the adjustment factor for the y-coordinate offset, taken as 10.1642 in this paper.
To ensure that the transformed coordinates and dimensions do not exceed the boundaries of the TIR image, boundary checks and dimension adjustments are performed on the corrected TIR images. The adjusted width Tadjust(w) of the TIR image is calculated as follows:
The adjusted height Tadjust(h) of the TIR image is calculated as follows:
Furthermore, data augmentation techniques have been applied to the dataset to expand it, including operations such as rotation, hue transformation, brightness transformation, and the addition of noise.
3.1.2. Annotations and Labels
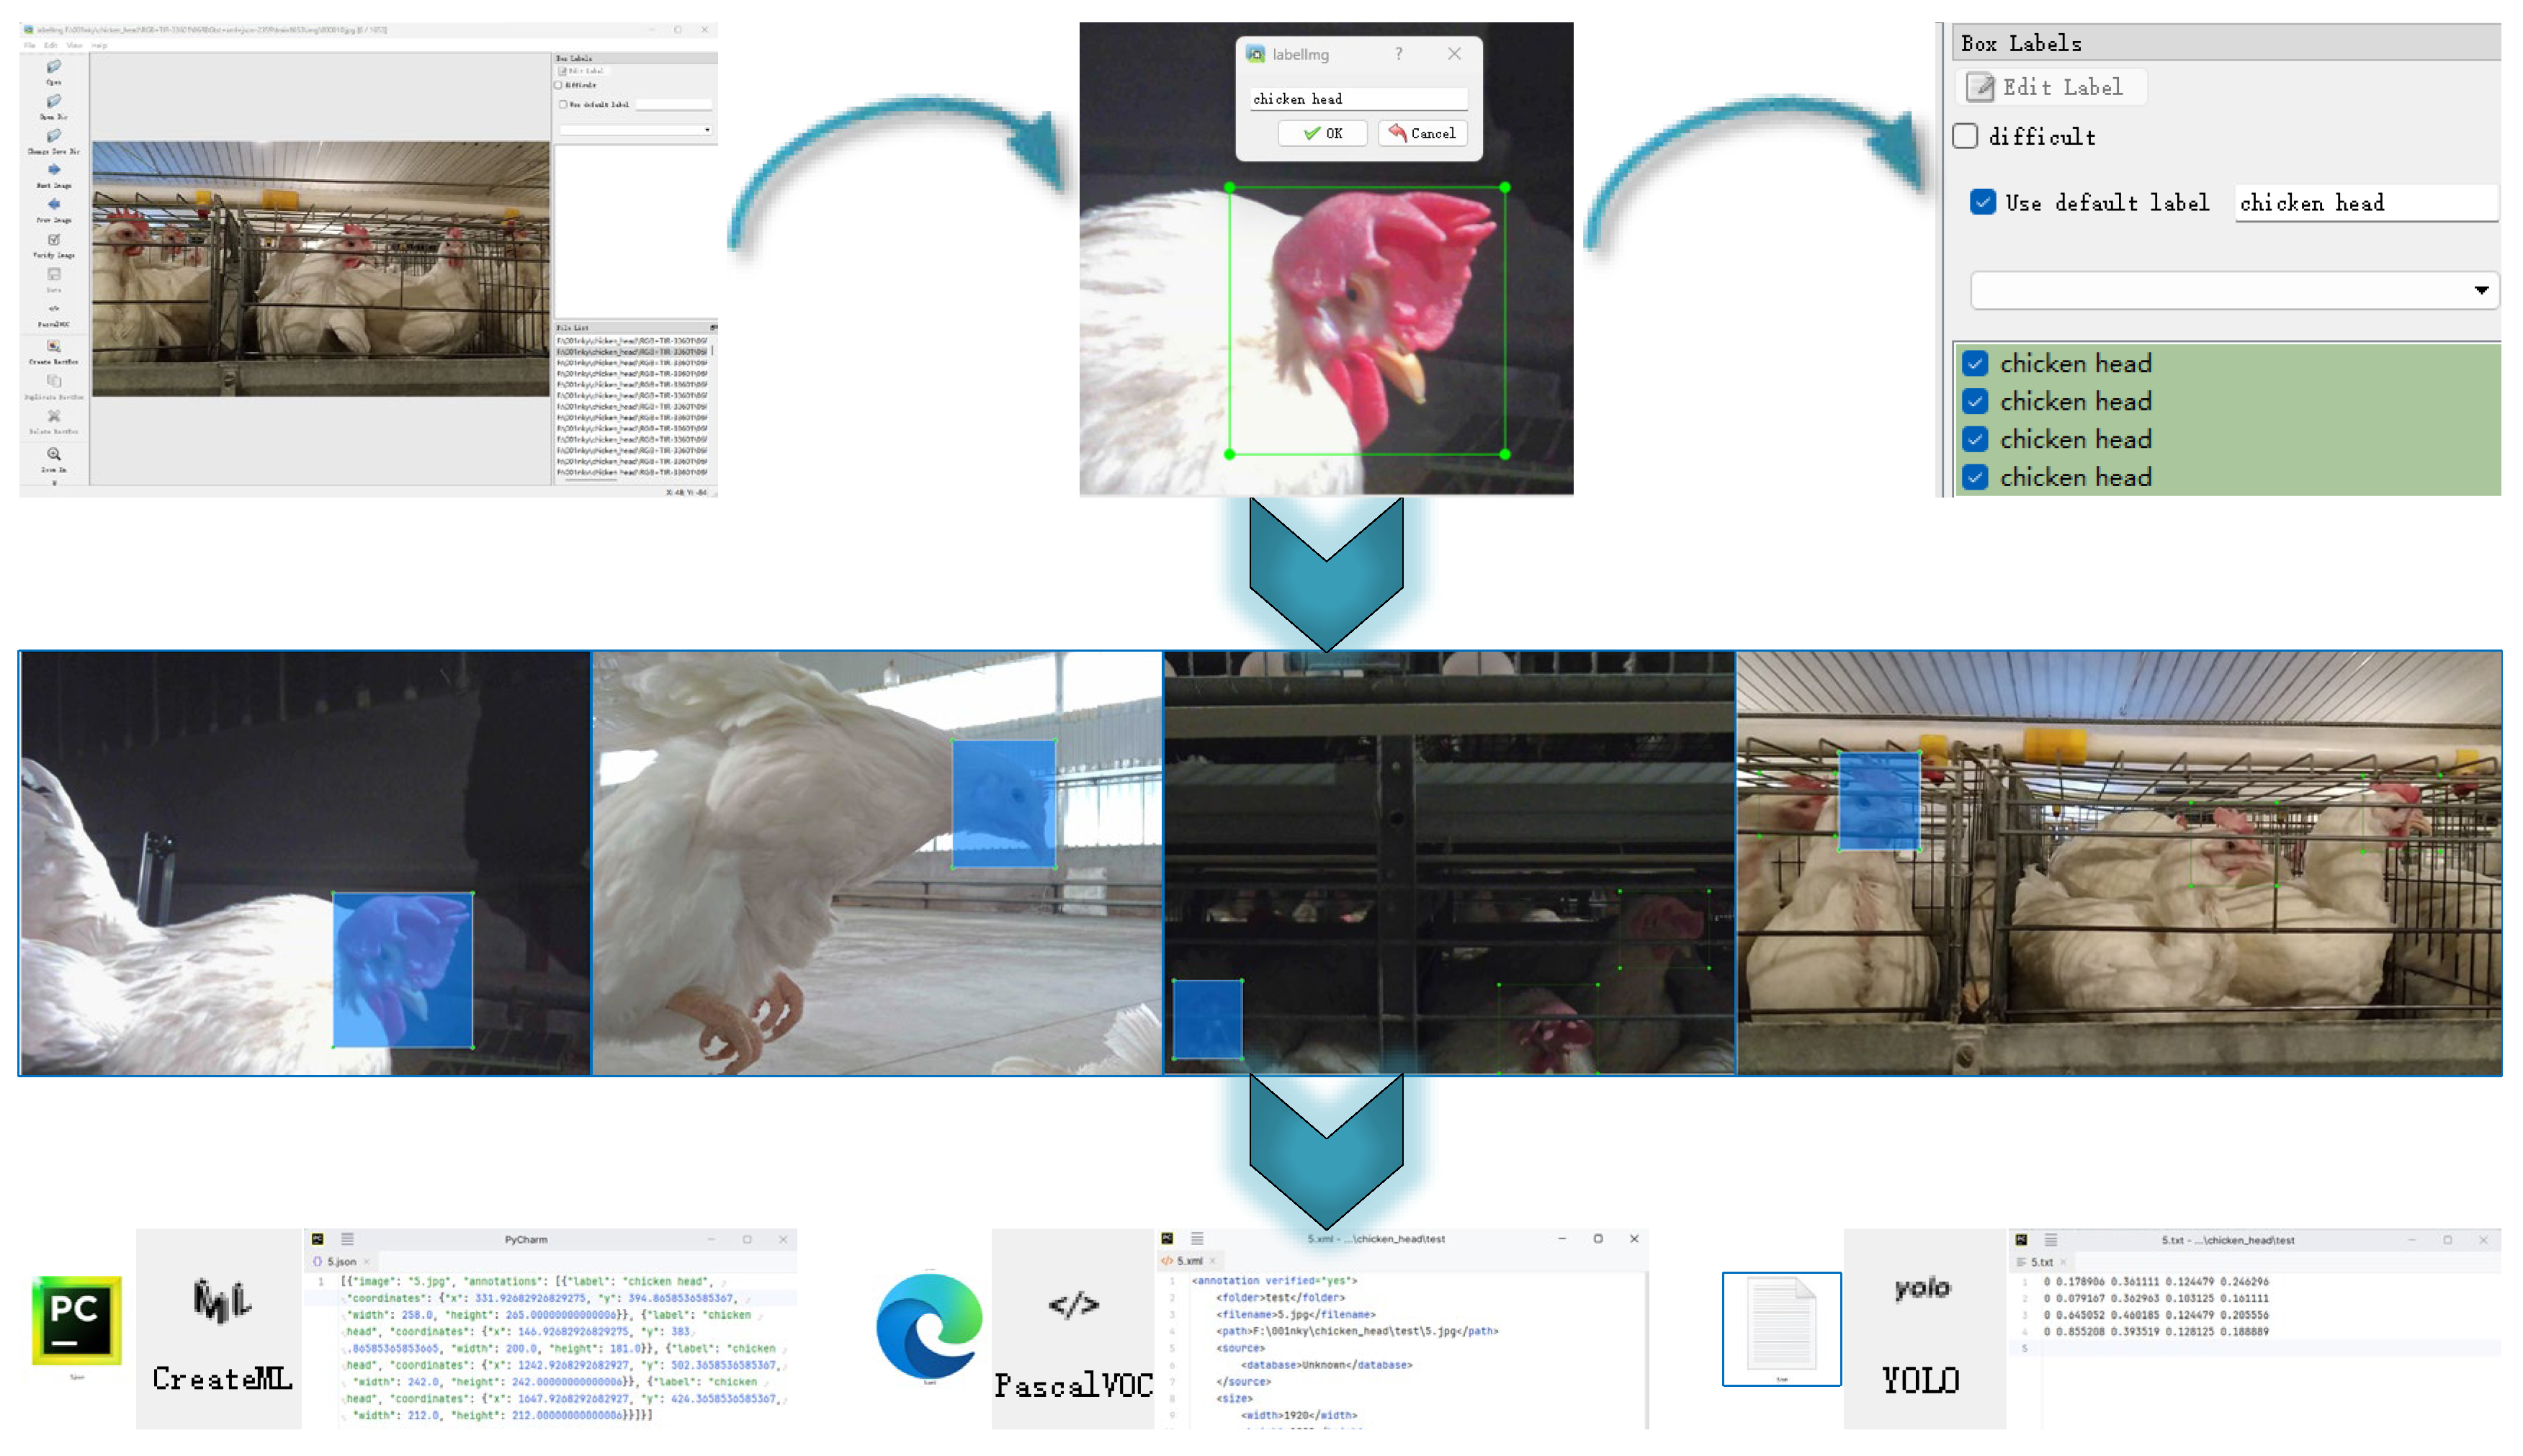
In the collected images of caged laying hen flocks, annotations for chicken heads were performed, with the data annotation task accomplished by 10 data annotators, ensuring the precision and standardization of the data. The annotations provide location information for the heads of the hens within the images, marked with rectangular frames, using the LabelImg annotation software.
As shown in
Figure 7, for the same image, we provide annotation information in three different formats: xml, txt, and json. The xml format annotation files include the images' size, category, and location information, adhering to the annotation standards of datasets such as PASCAL VOC and YOLO. The txt format is a plain text file containing only category and location information, commonly used for YOLO format annotations, and is characterized by its simplicity and ease of parsing. The json format annotation files include image size, category, location, and other information, with a level of lightness between xml and txt formats. The three data annotation formats we provide can meet the needs of different application scenarios.
3.1.3. Data Folders
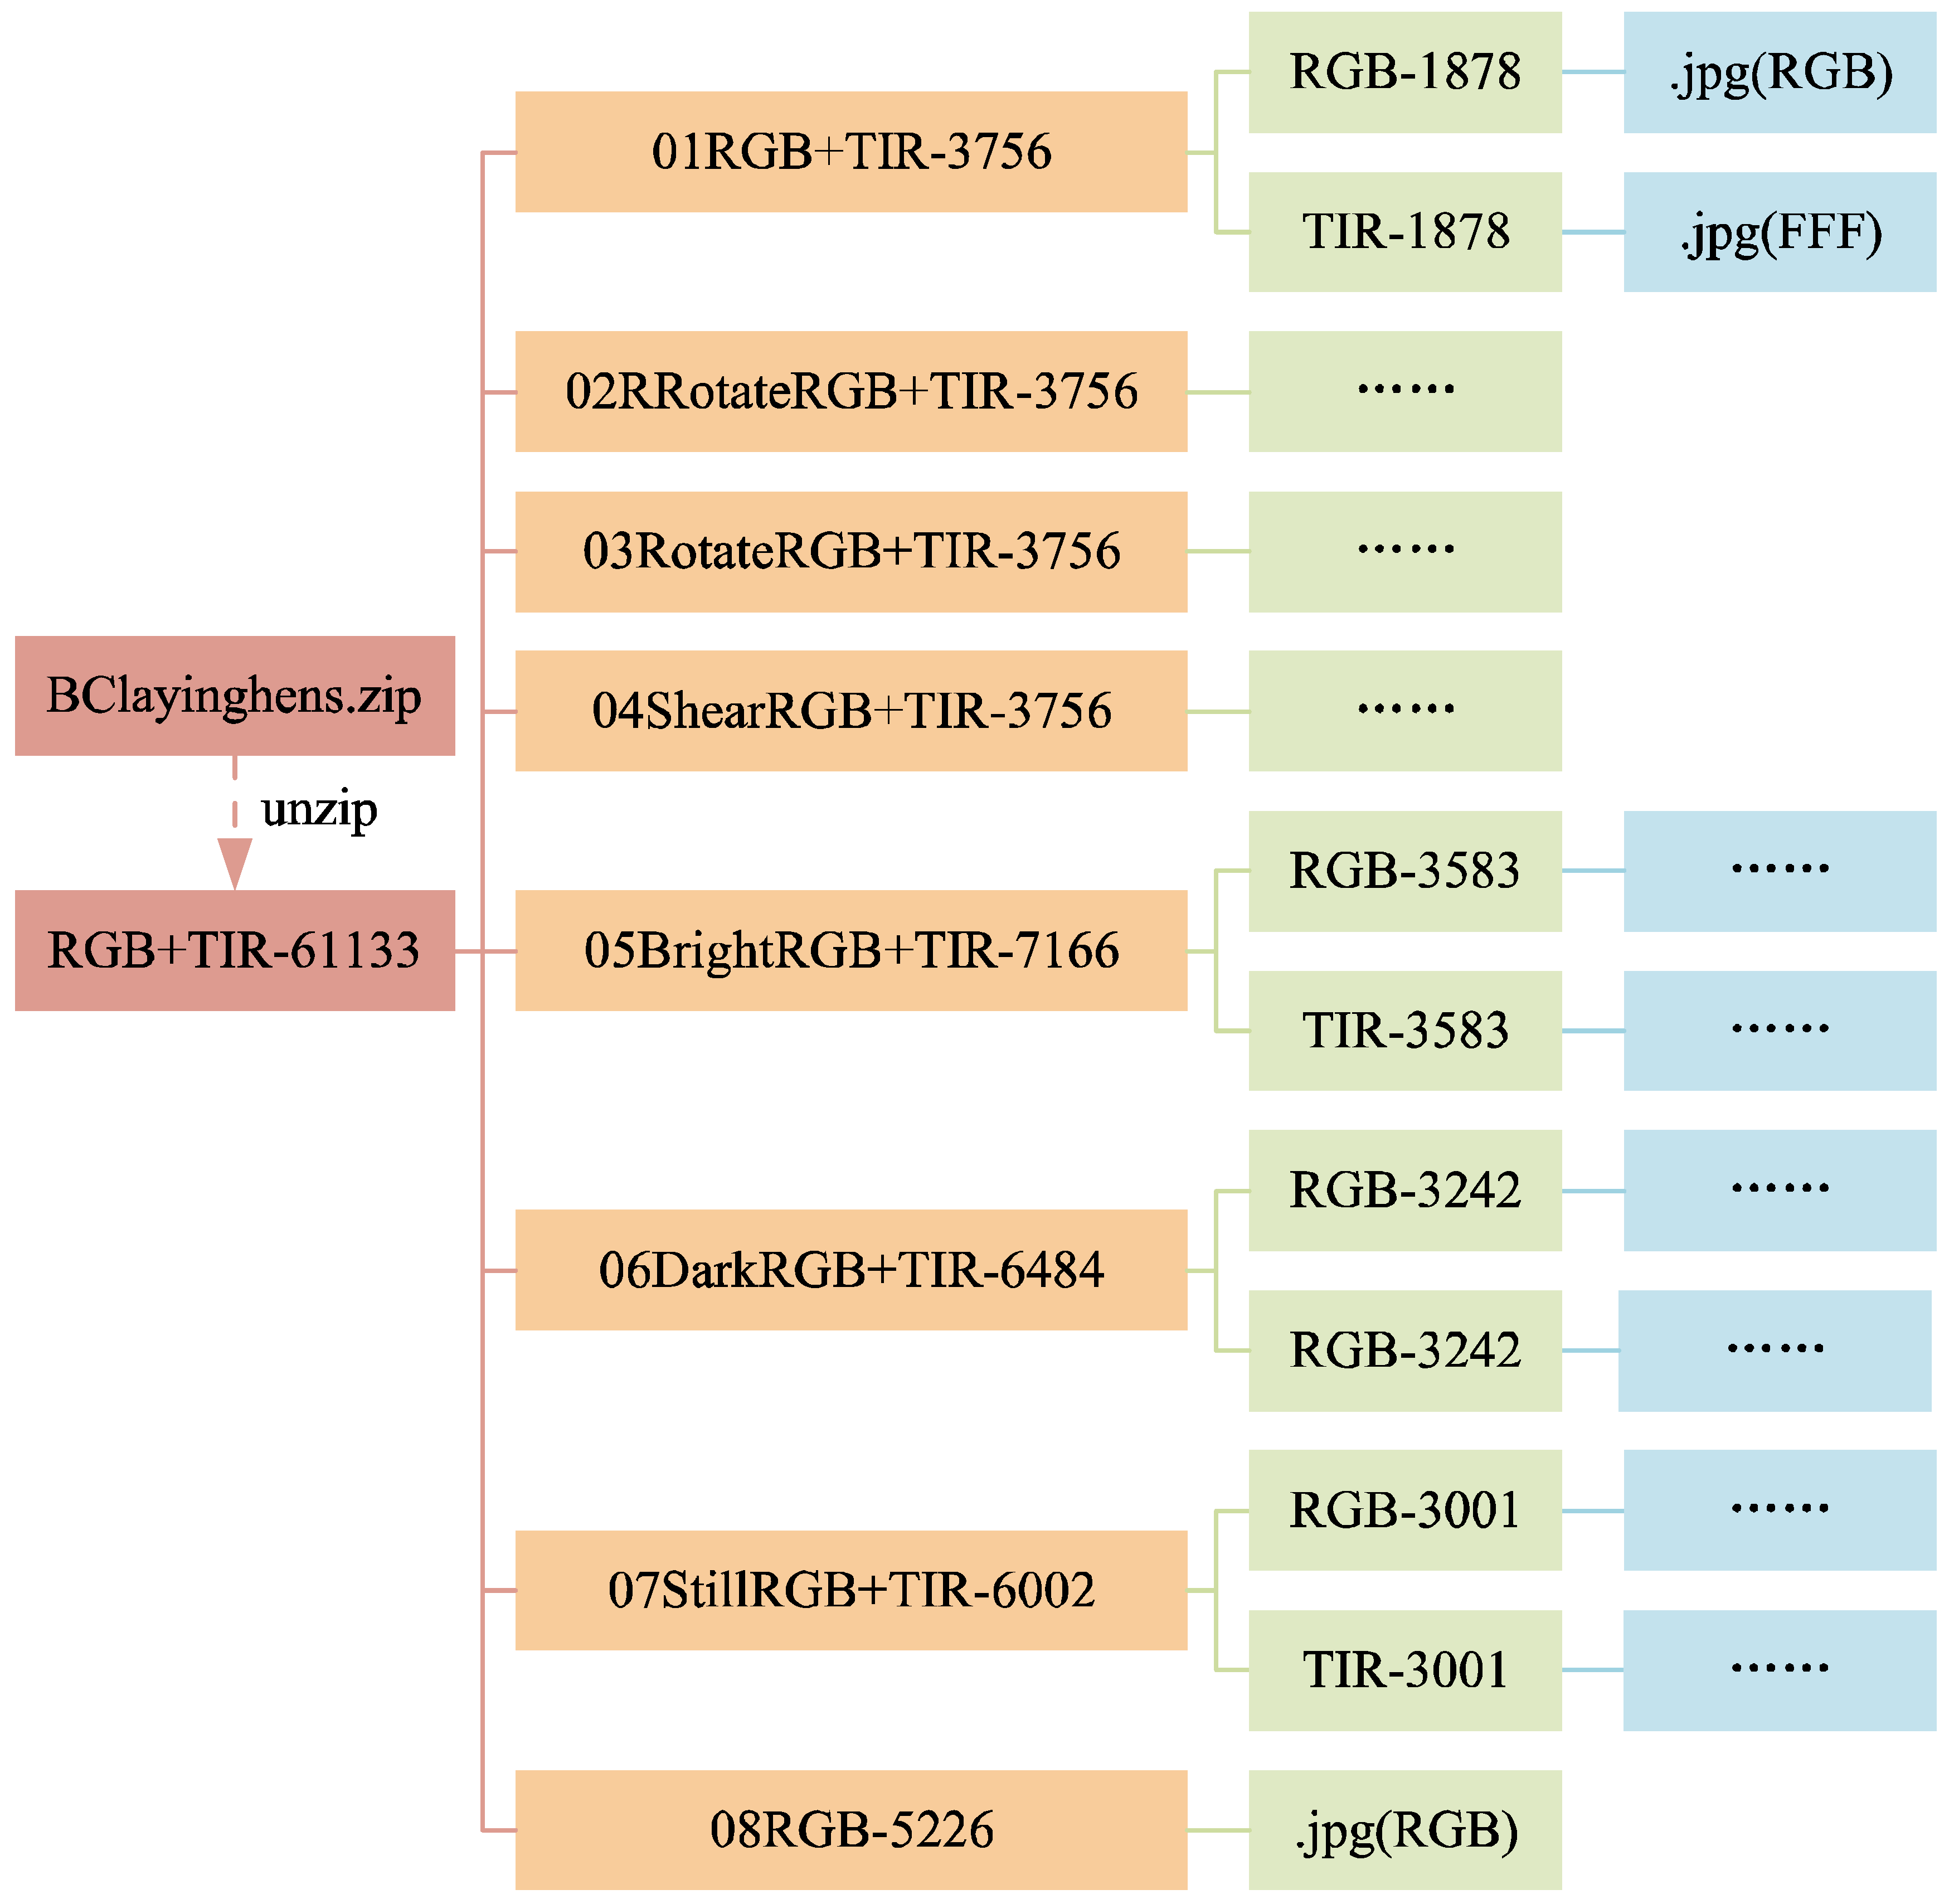
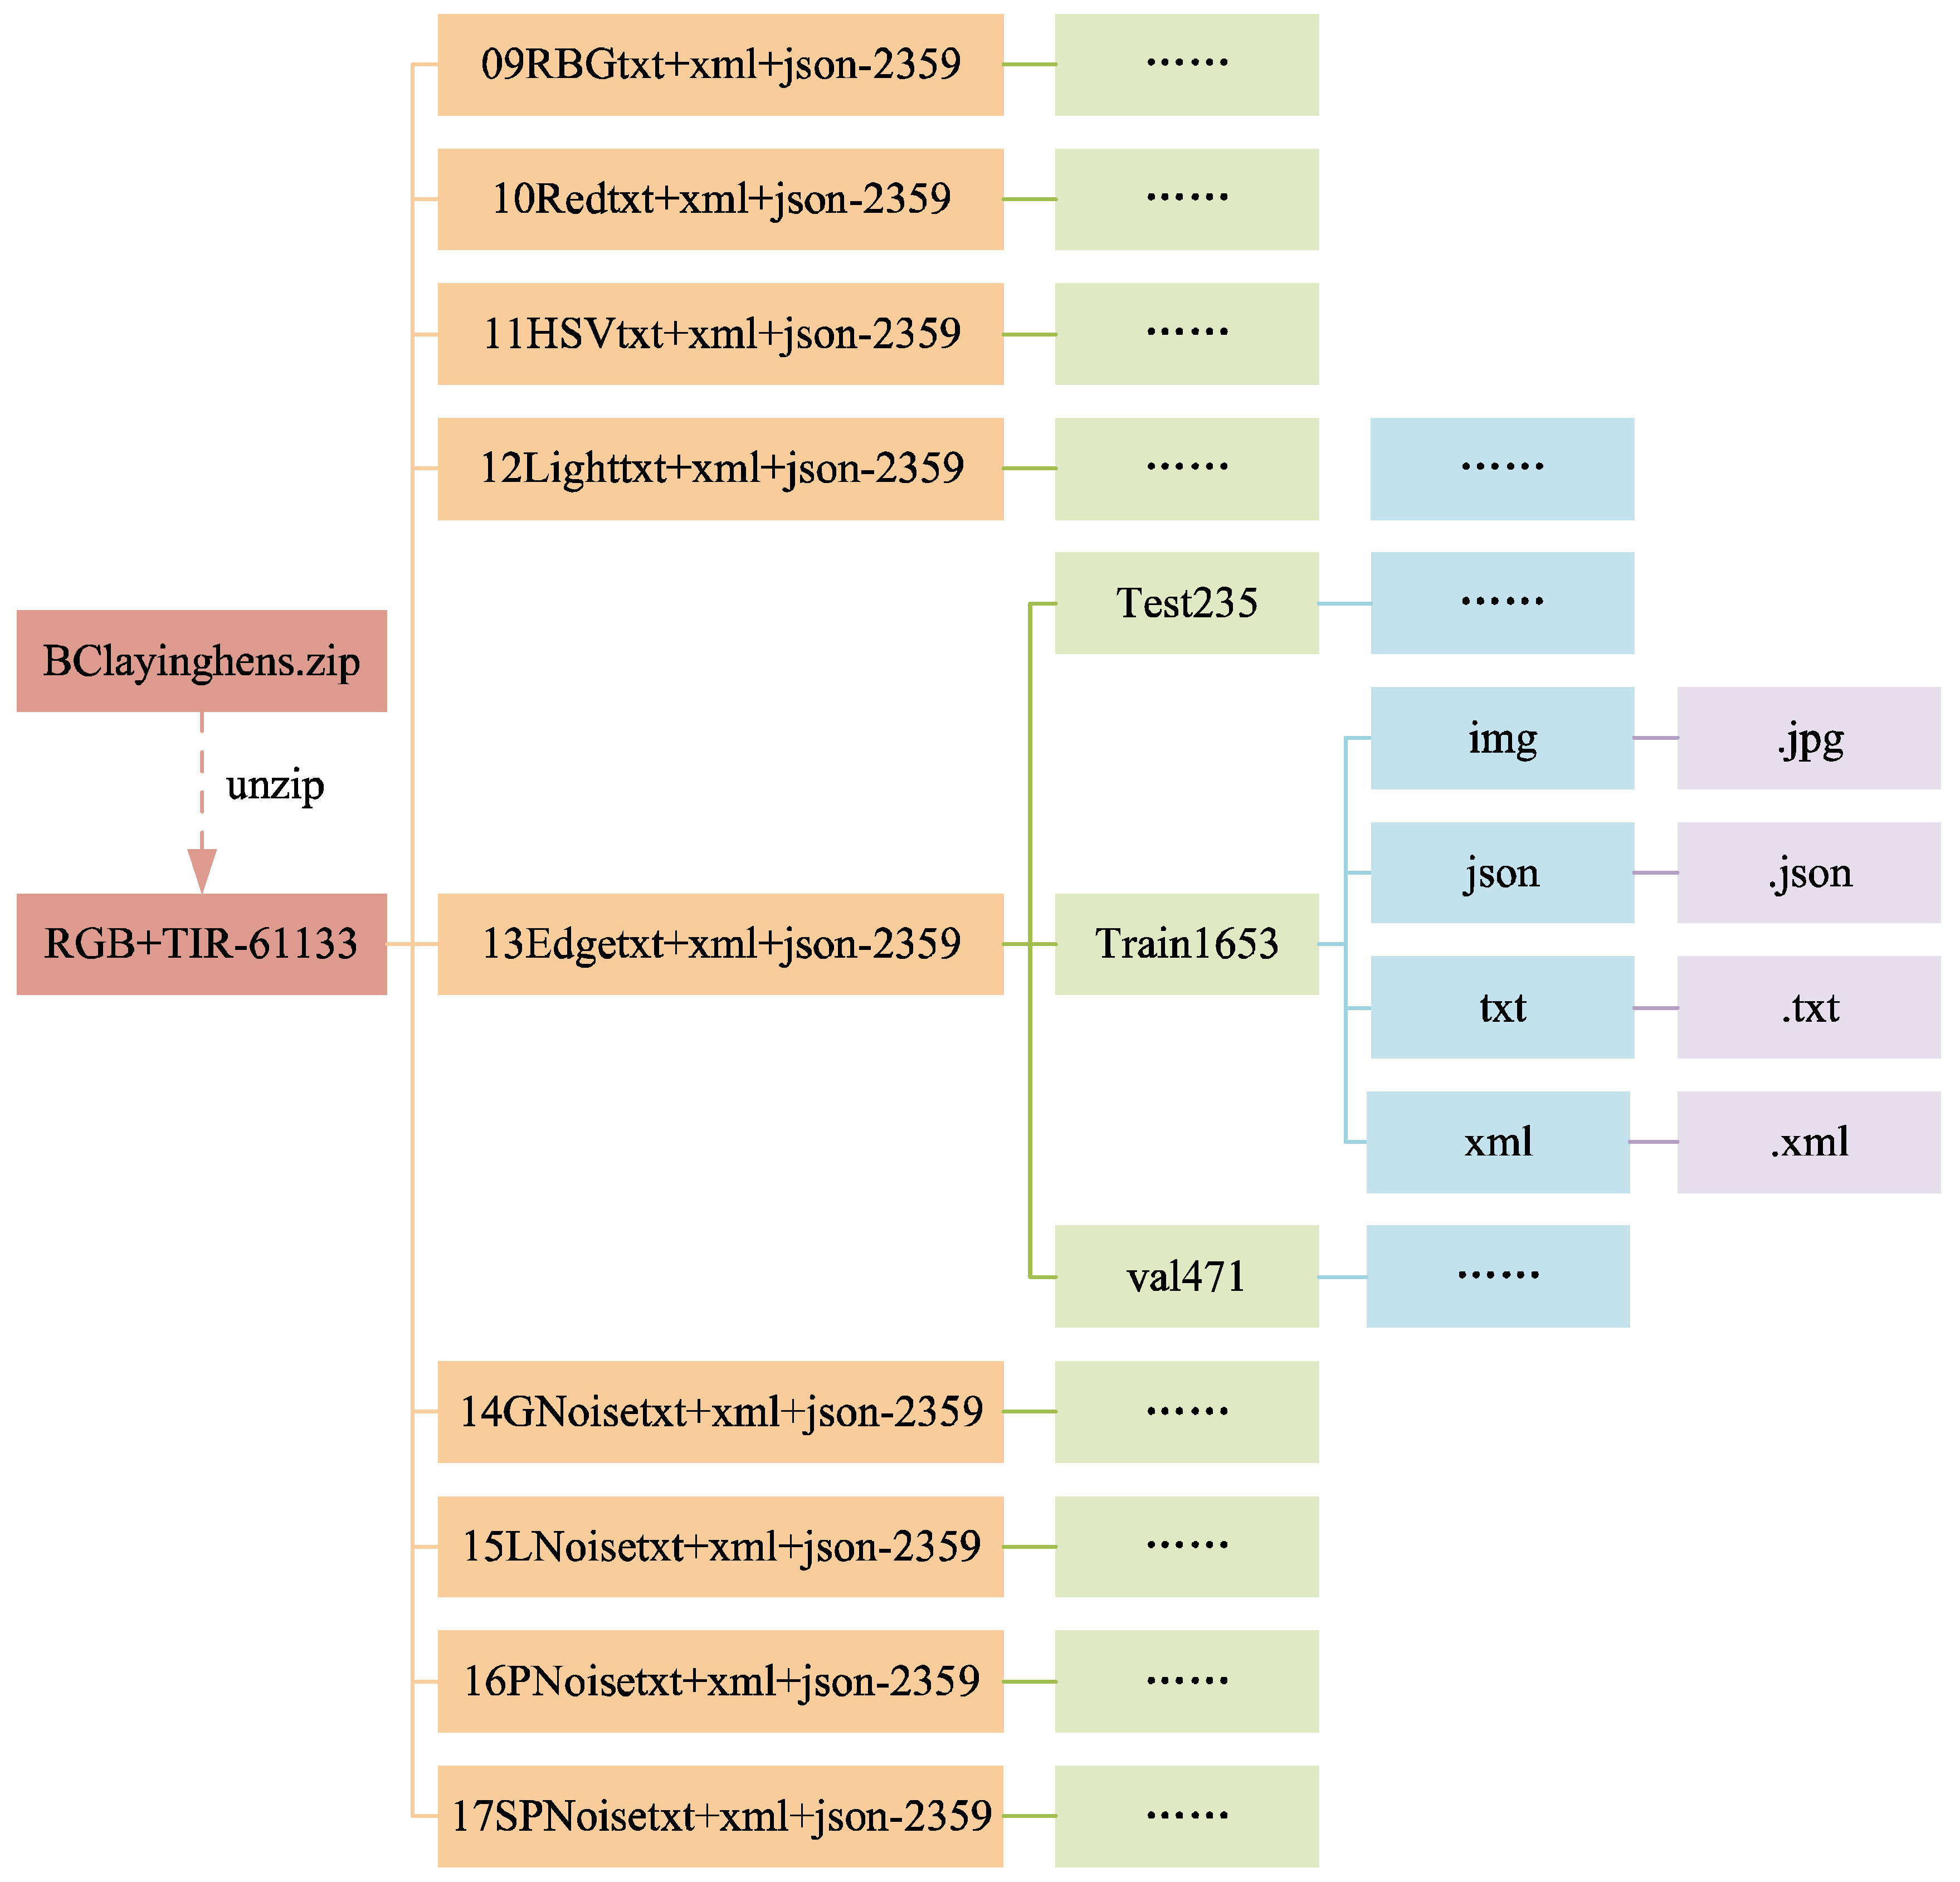
The structure of the data folders is shown in
Figure 8 and
Figure 9. In
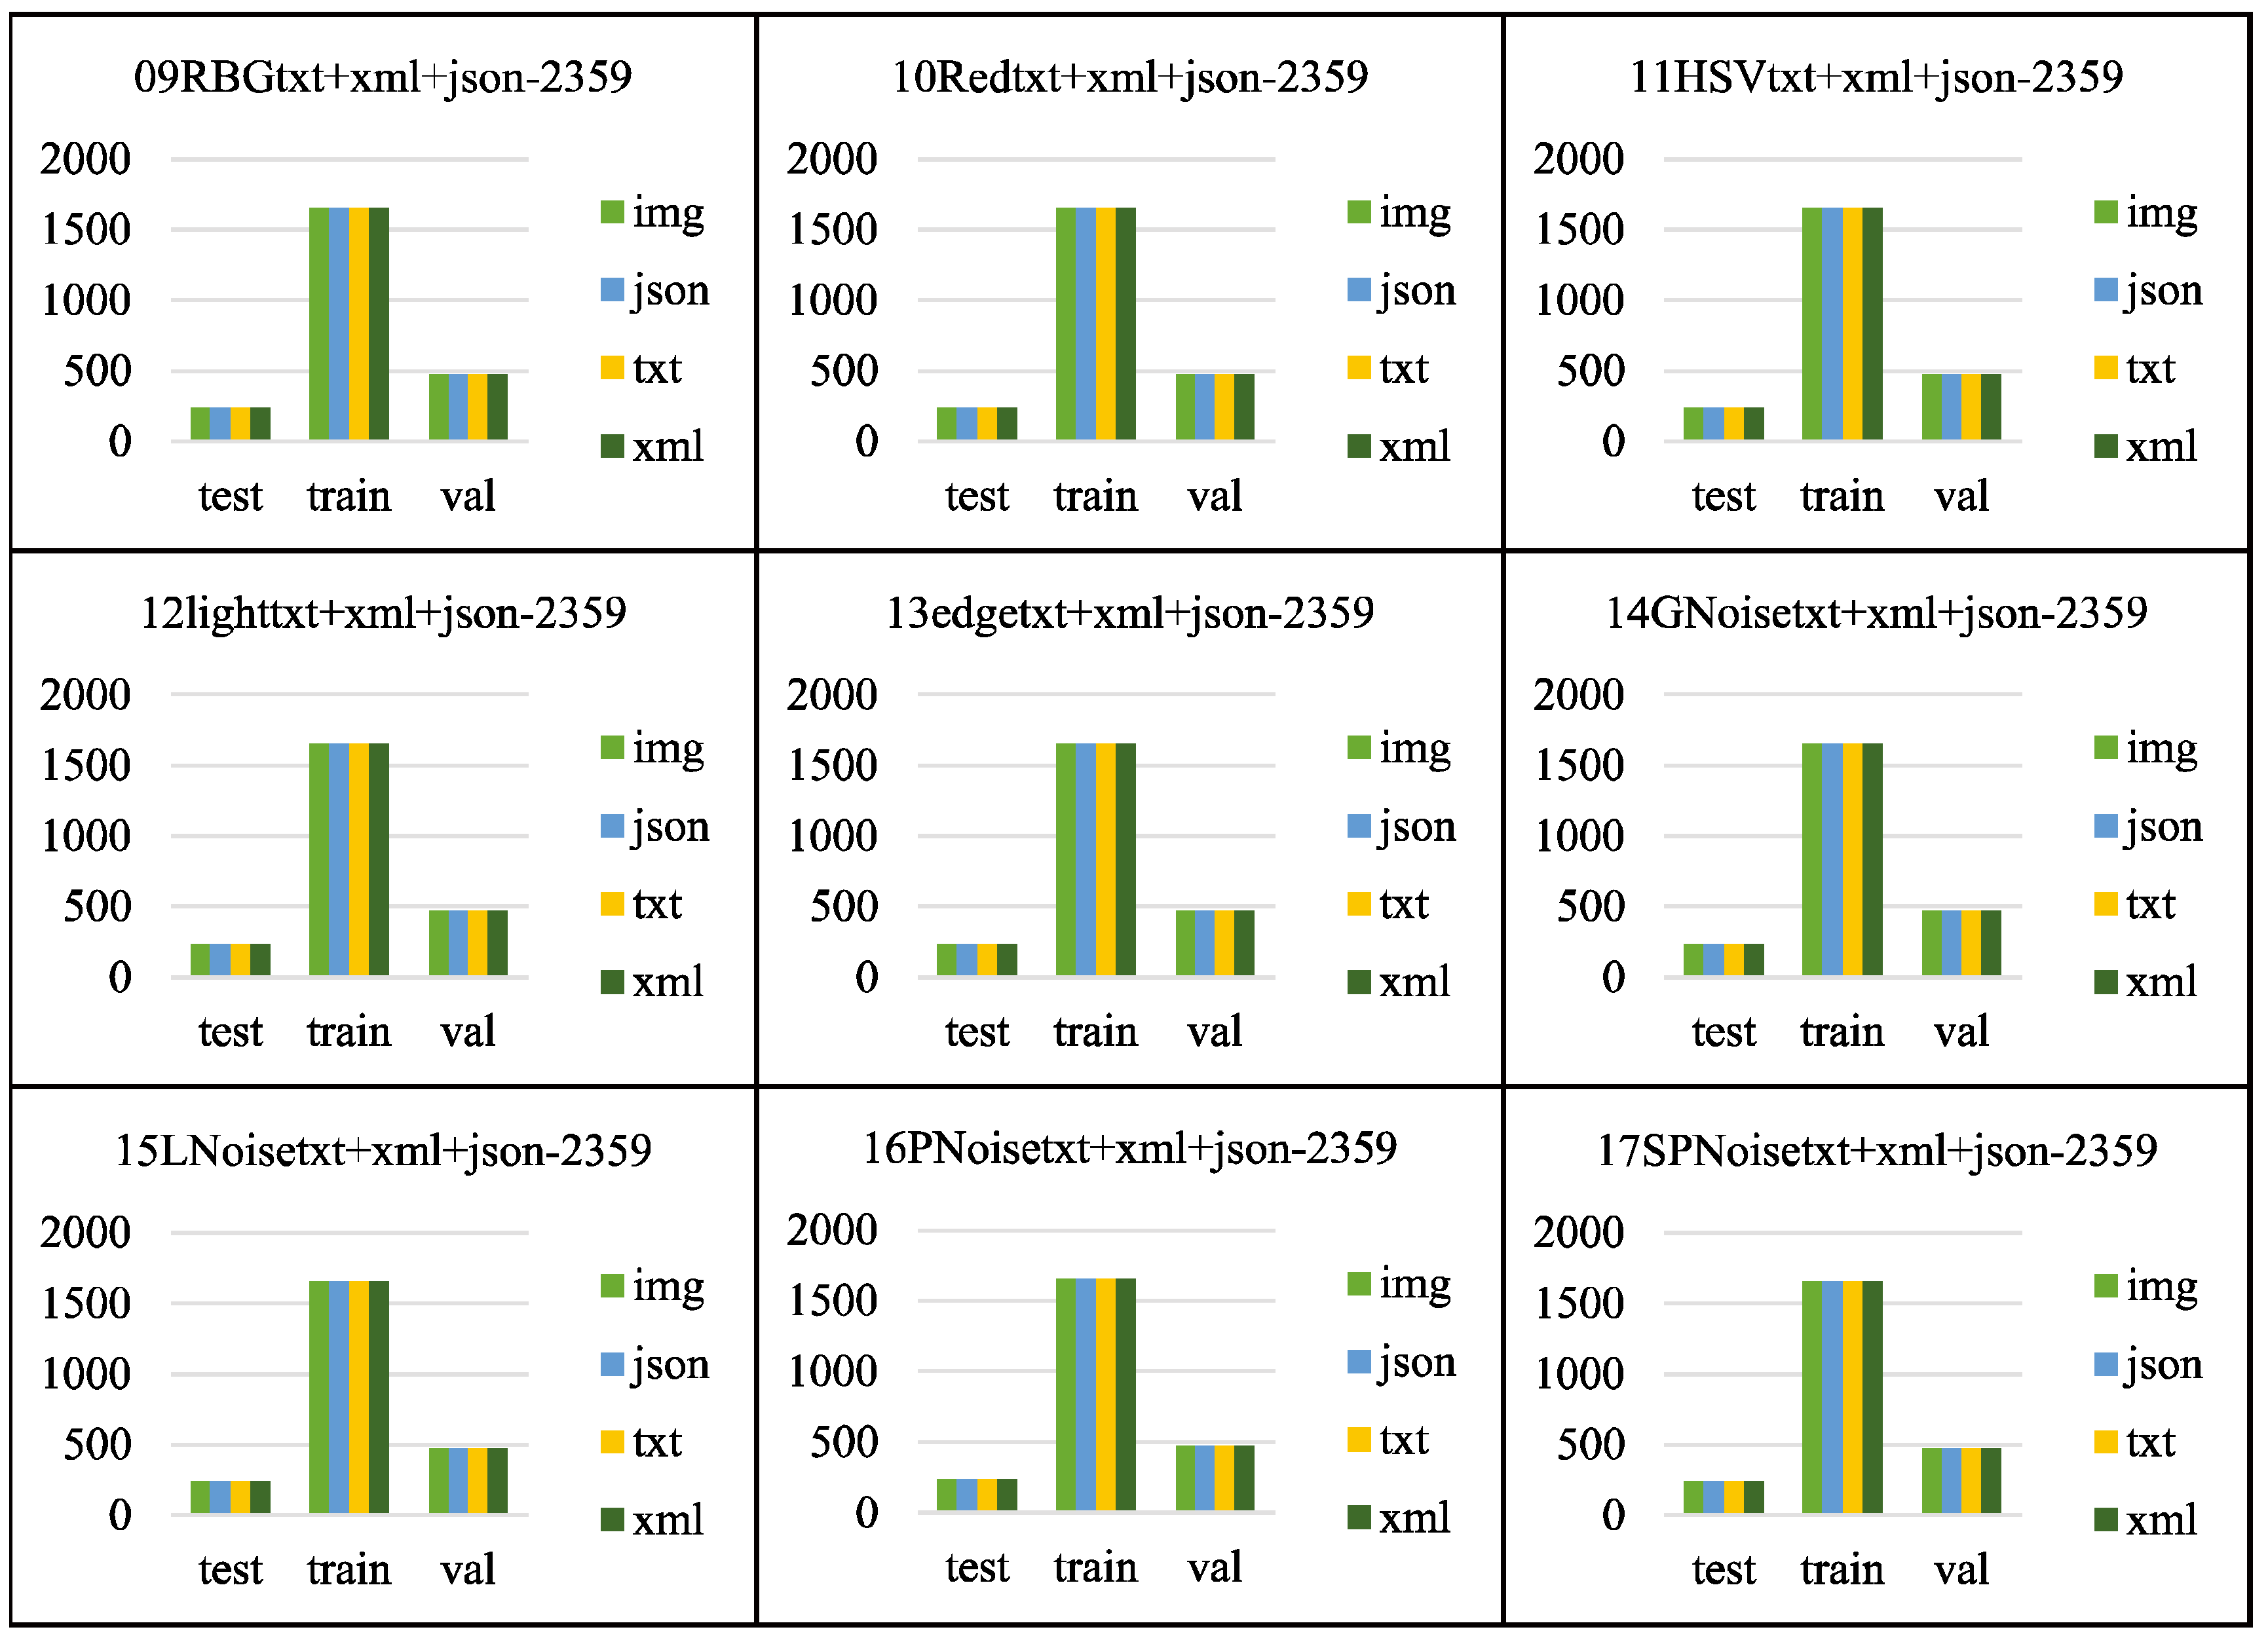
Figure 9, the folders from 09RBGtxt+xml+json-2359 to 17SPNoisetxt+xml+json-2359 have divided the dataset in a ratio of 7:2:1, with the training set (folder train1653) accounting for 70%, the validation set (folder val471) accounting for 20%, and the test set (folder test235) accounting for 10%. Each folder for the training, validation, and test sets contains four subfolders: img, json, txt, and xml, for saving the corresponding formats of ten images or labels.
Figure 10 and
Figure 11 shows the file count statistics within the BClayinghens dataset.
3.1.4. Value of the Data
The dataset is applicable for health monitoring and behavioural analysis of caged laying hens and research on chicken head detection and counting of caged hens. It is particularly suitable for classification studies of hens based on deep learning convolutional neural networks.
Multimodal image data from visible light and thermal infrared are provided, supporting research on health monitoring and behaviour recognition of hens through image fusion techniques. The fused images of hens are especially useful for body temperature detection, aiding disease prevention and control efforts in commercial poultry farming.
Different morphological images of individual hens are supplied, which can be utilized for health assessments of laying hens.
The relevant information regarding the BClayinghens dataset is presented in
Table 3.
3.2. Chicken Head Detection
3.2.1. Comparison of Detection Performance of Different Algorithms
The chicken inspection robot in the henhouse should possess high real-time performance during actual use, necessitating the selection of target detection models with superior real-time capabilities for deployment. We have chosen mainstream and novel real-time target detection models to test the dataset, thereby verifying the dataset's outstanding performance across various target detection algorithms. The RT-DETR model [
18] and the YOLO series target detection models (YOLOv5 [
19], YOLOv8 [
20], YOLOv9 [
21], YOLOv10 [
22]) are utilized as baseline testing methods for chicken head recognition. Model training is implemented on a Linux server, using an Intel(R) Xeon(R) Platinum 8375c CPU @ 2.90GHz processor, an NVIDIA RTX A6000 graphics card, CUDA version 11.3, Python version 3.8.18, and the Pytorch deep learning framework, Pytorch version 1.12.0. None of the experiments uses pre-trained weights, with a batch size set to 48 and the number of epochs set to 200.
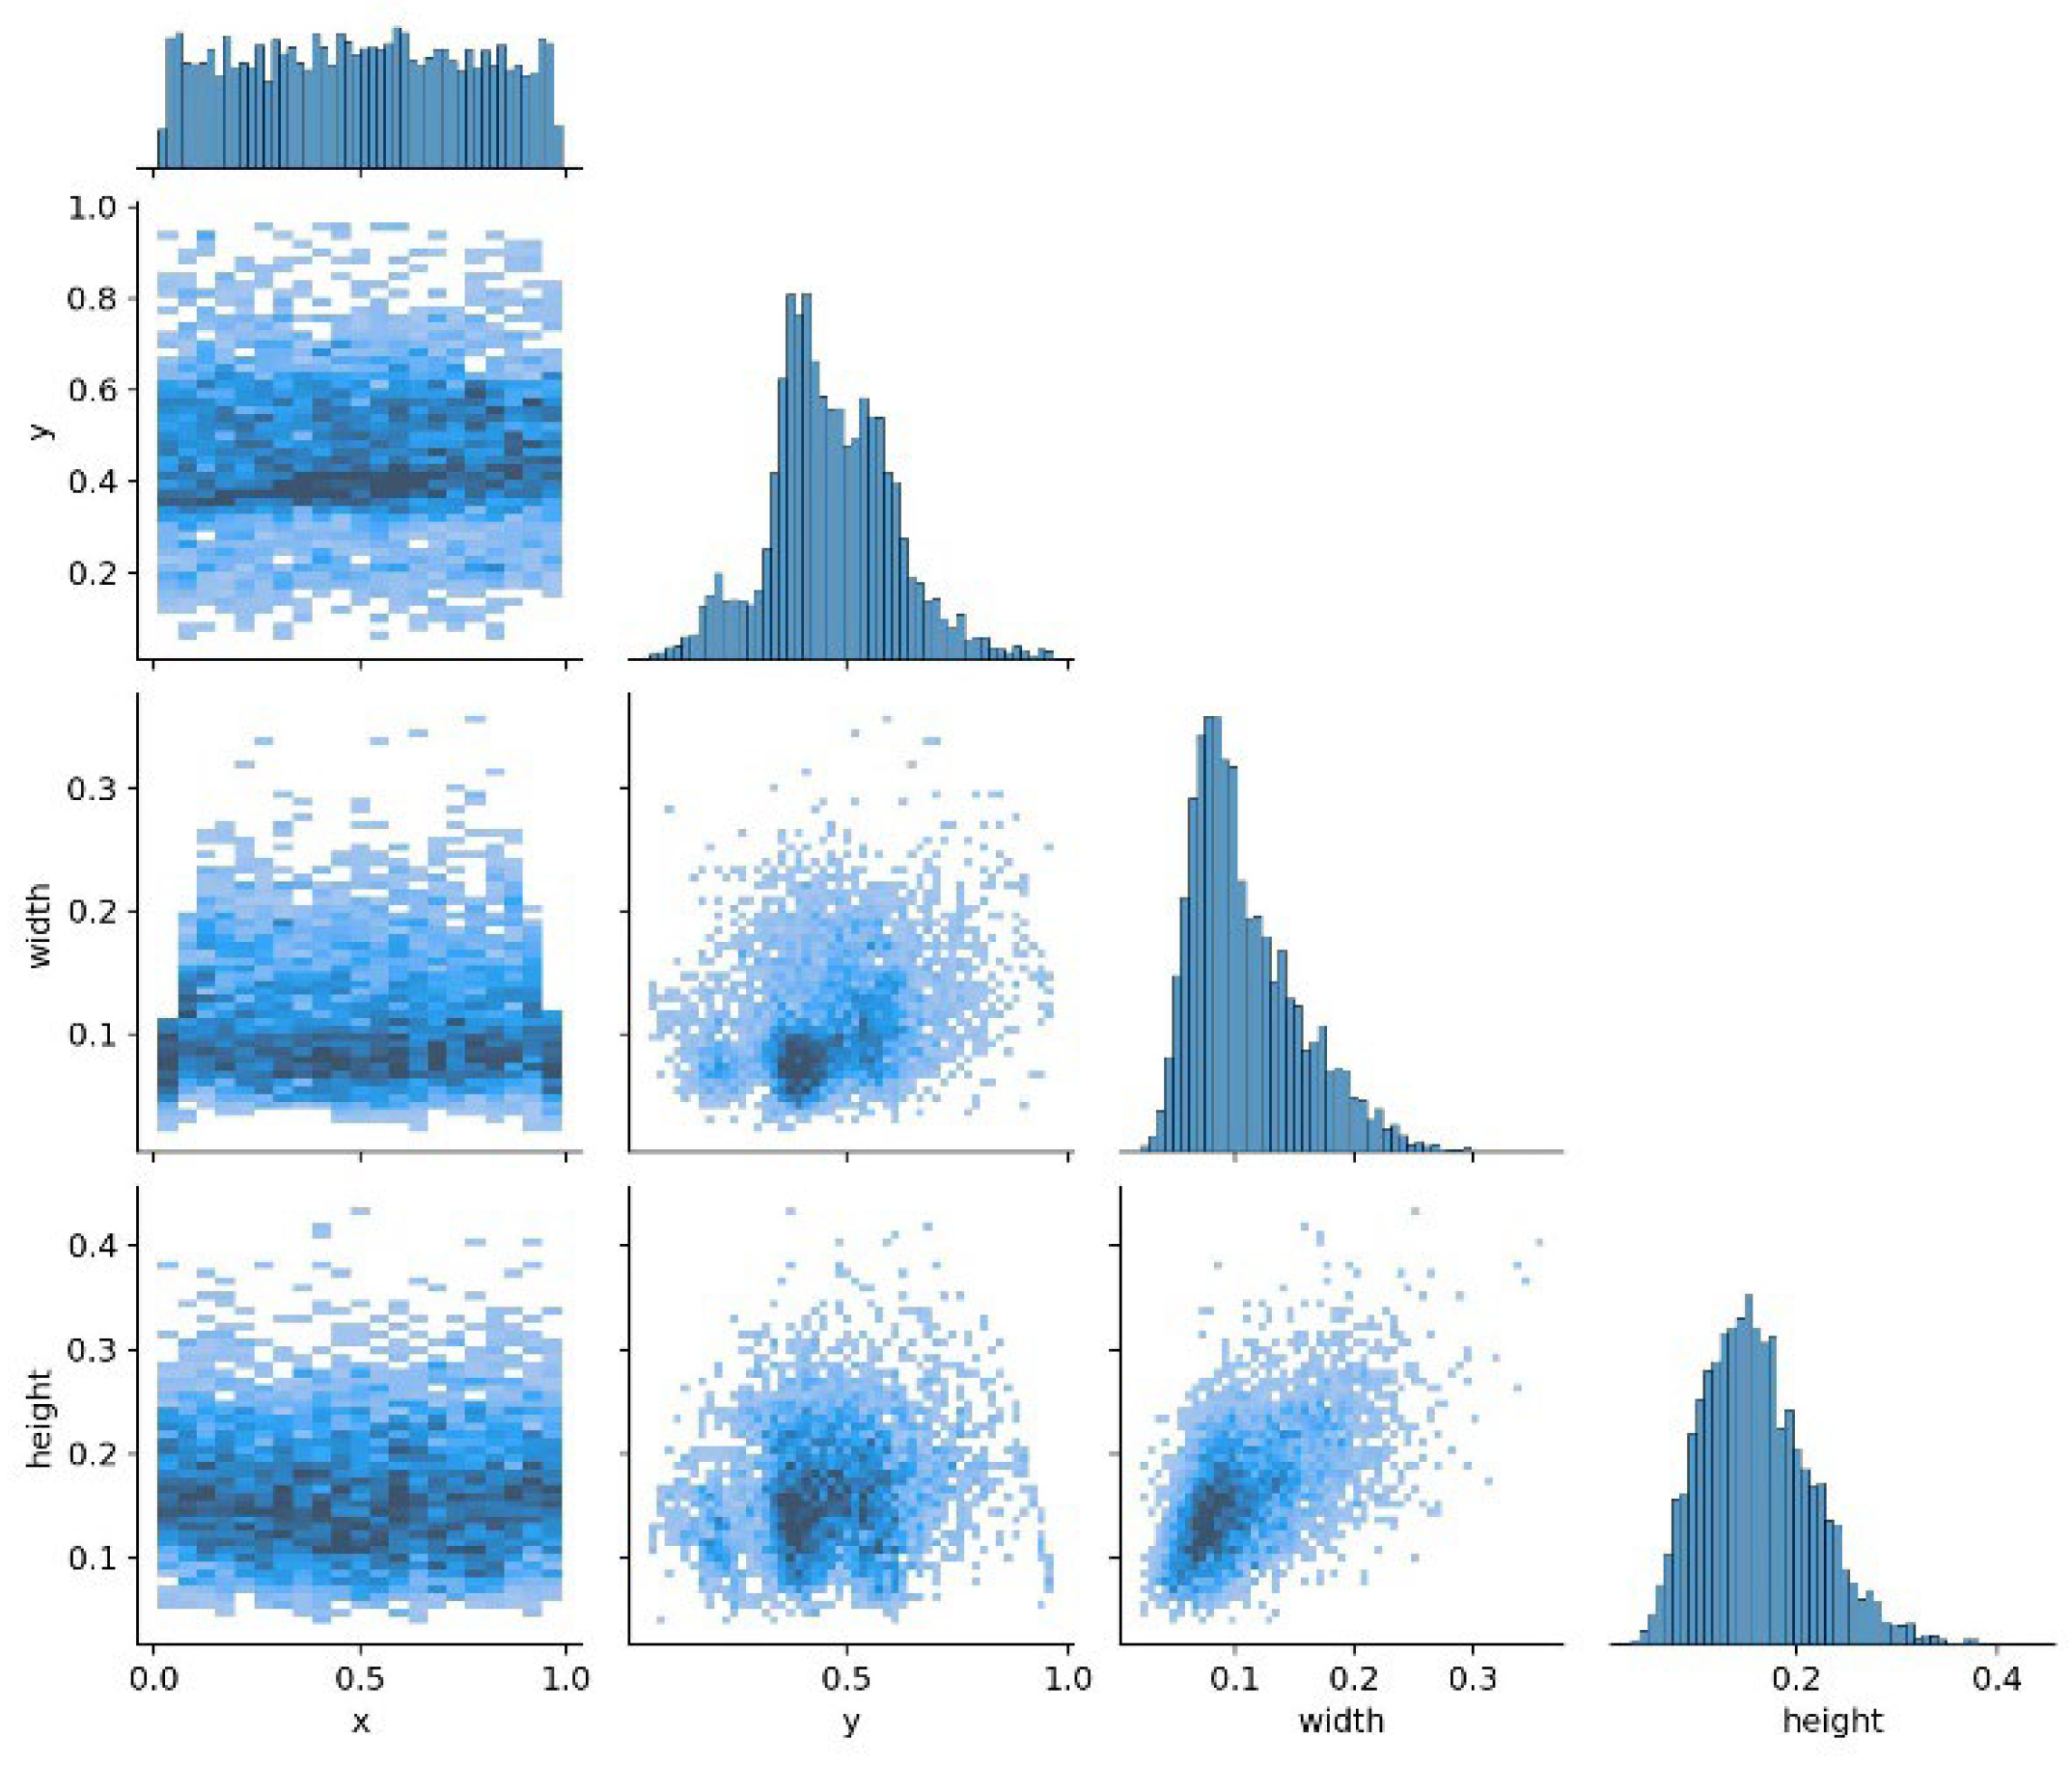
We selected 2,359 images from the BClayinghens dataset to verify the chicken head detection performance of the dataset across different algorithms.
Figure 12 illustrates the distribution of the dataset used during the chicken head detection training process, where the coordinates are normalized values. The x and y coordinates, with a value of 0, represent the upper left corner of the image in the dataset, and a value of 1 represents the upper right corner. It can be observed that the x-coordinates of the chicken head target boxes in the selected data are relatively evenly distributed, the y-coordinates are concentrated in the central area of the image, and the width and height of the target boxes follow a normal distribution. Additionally, a denser concentration of points is shown in areas with smaller widths and heights within the image, indicating a strong commonality in certain specific sizes or positions of the chicken head targets in the dataset. This aggregation can help the model learn the target position and size distribution more accurately, thereby improving detection accuracy.
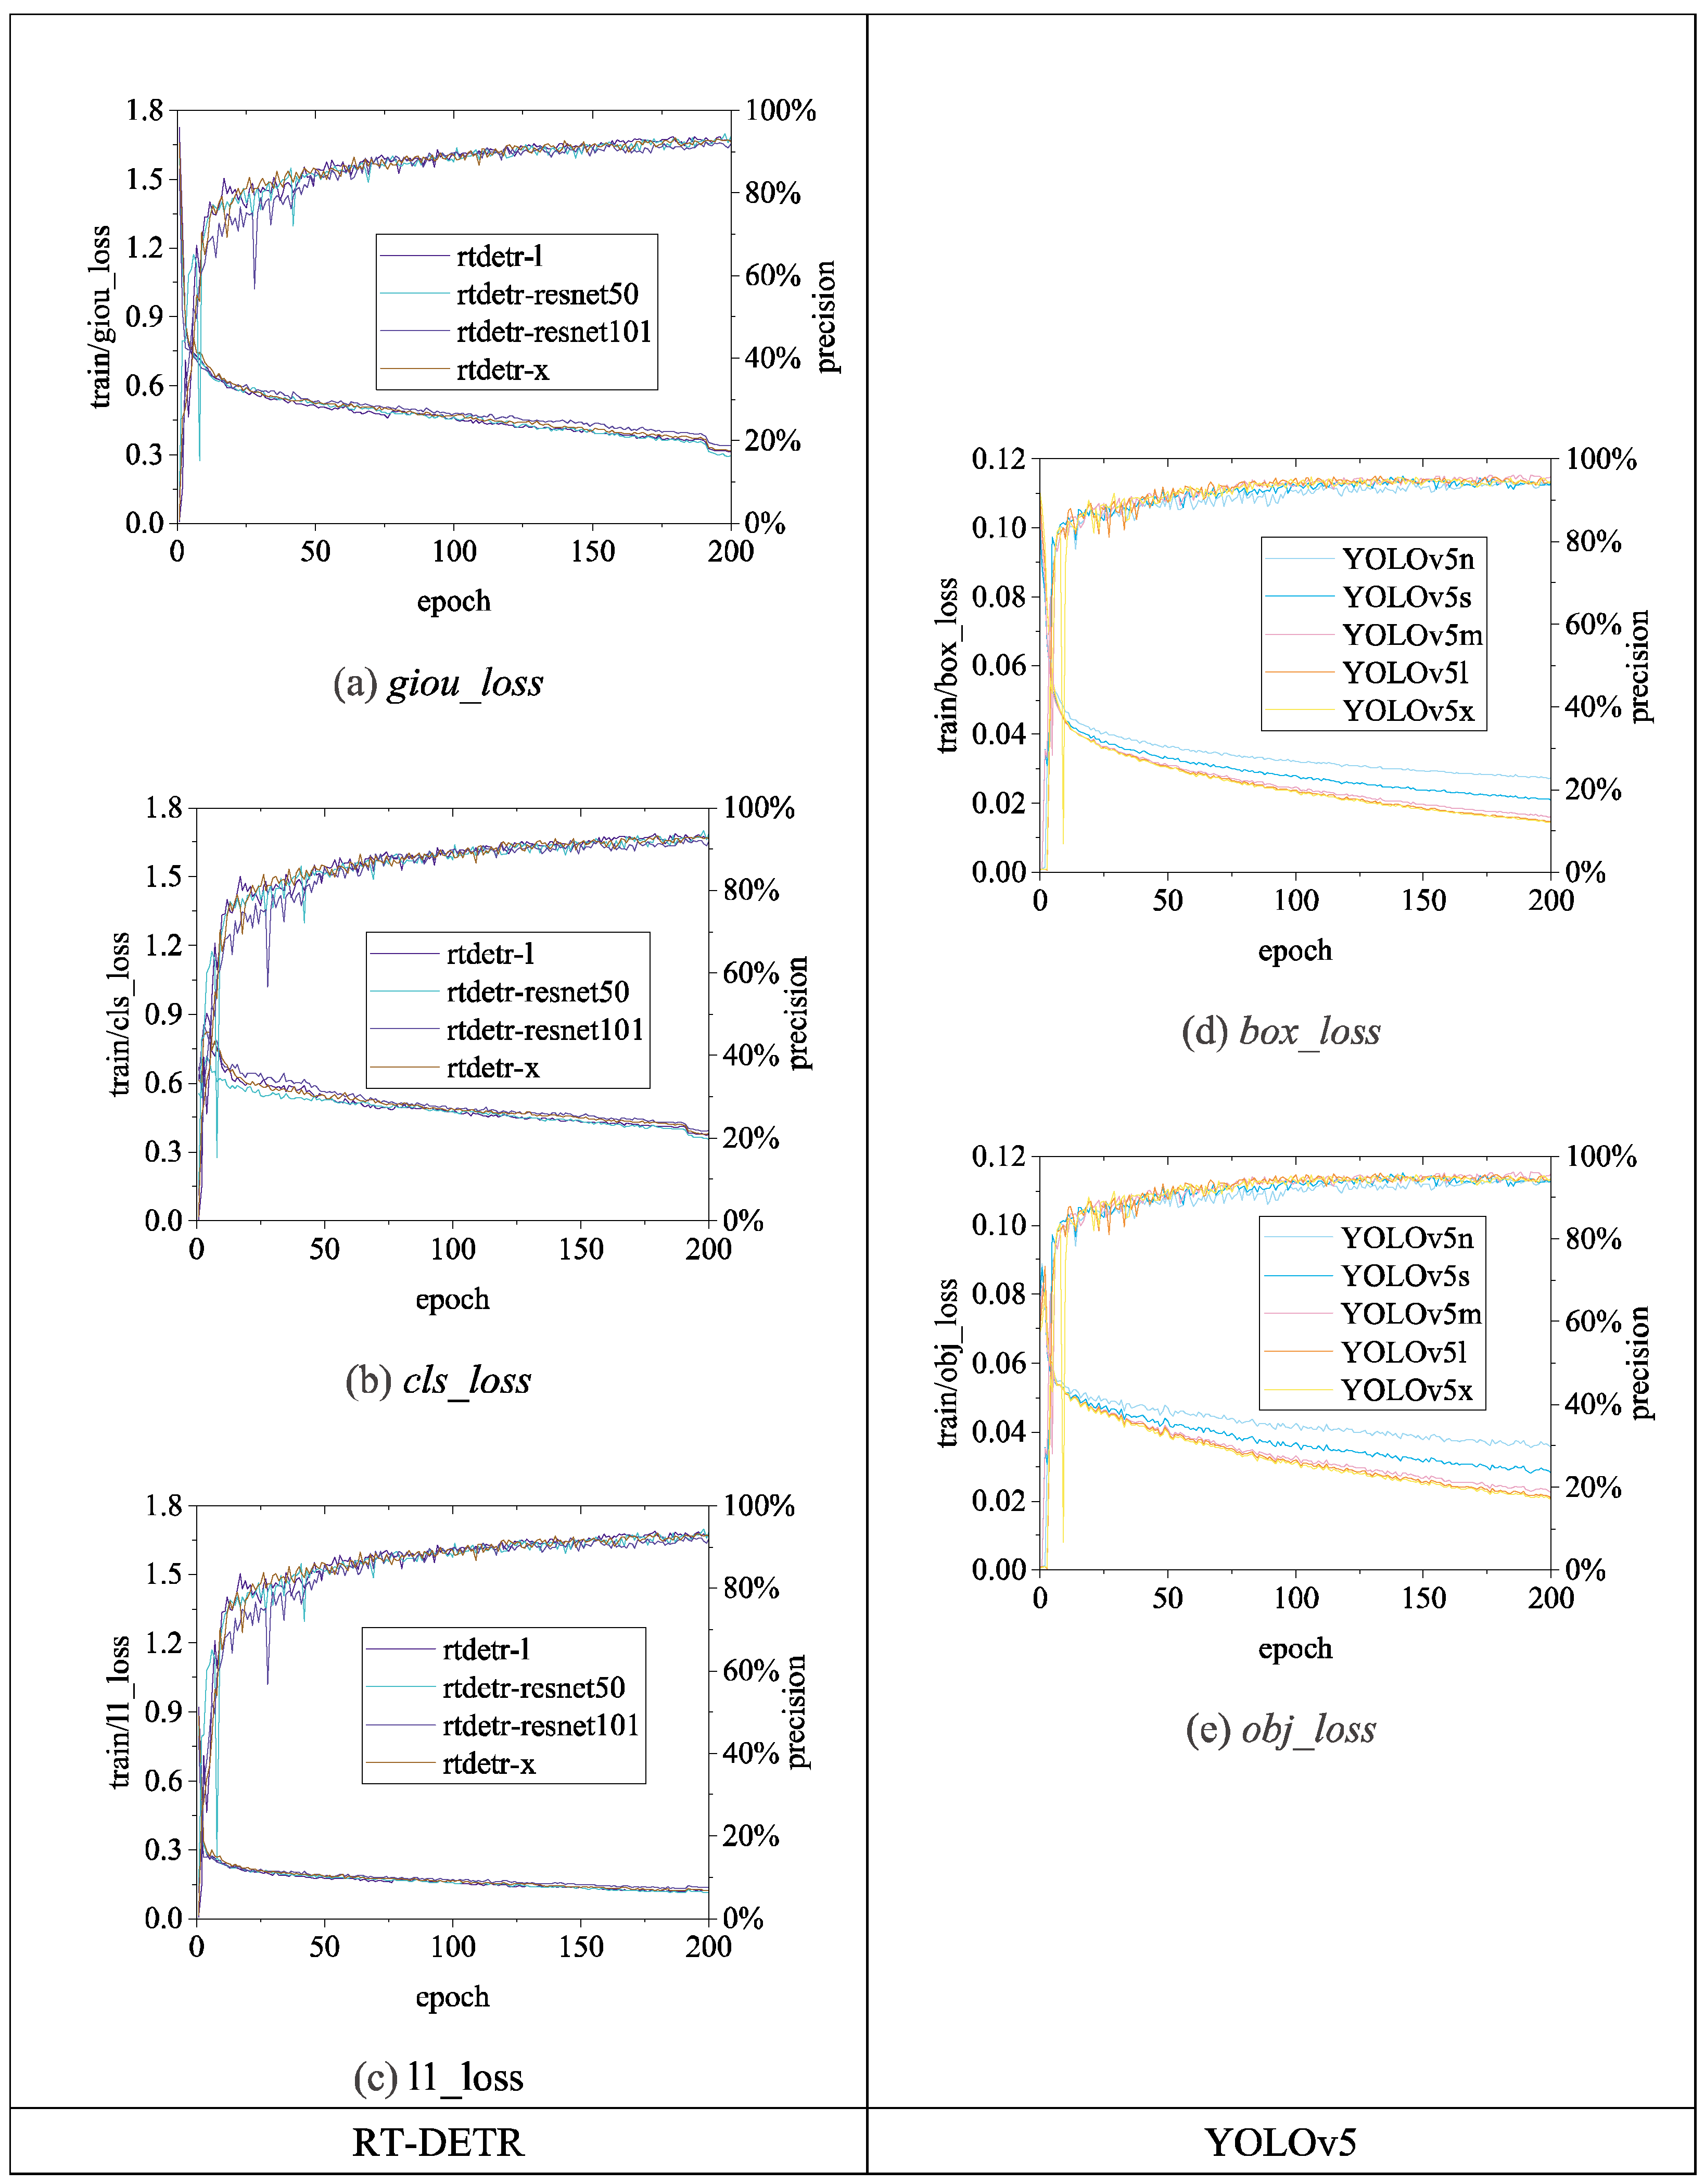
Figure 13,
Figure 14 and
Figure 15 illustrate the variations in
loss values and
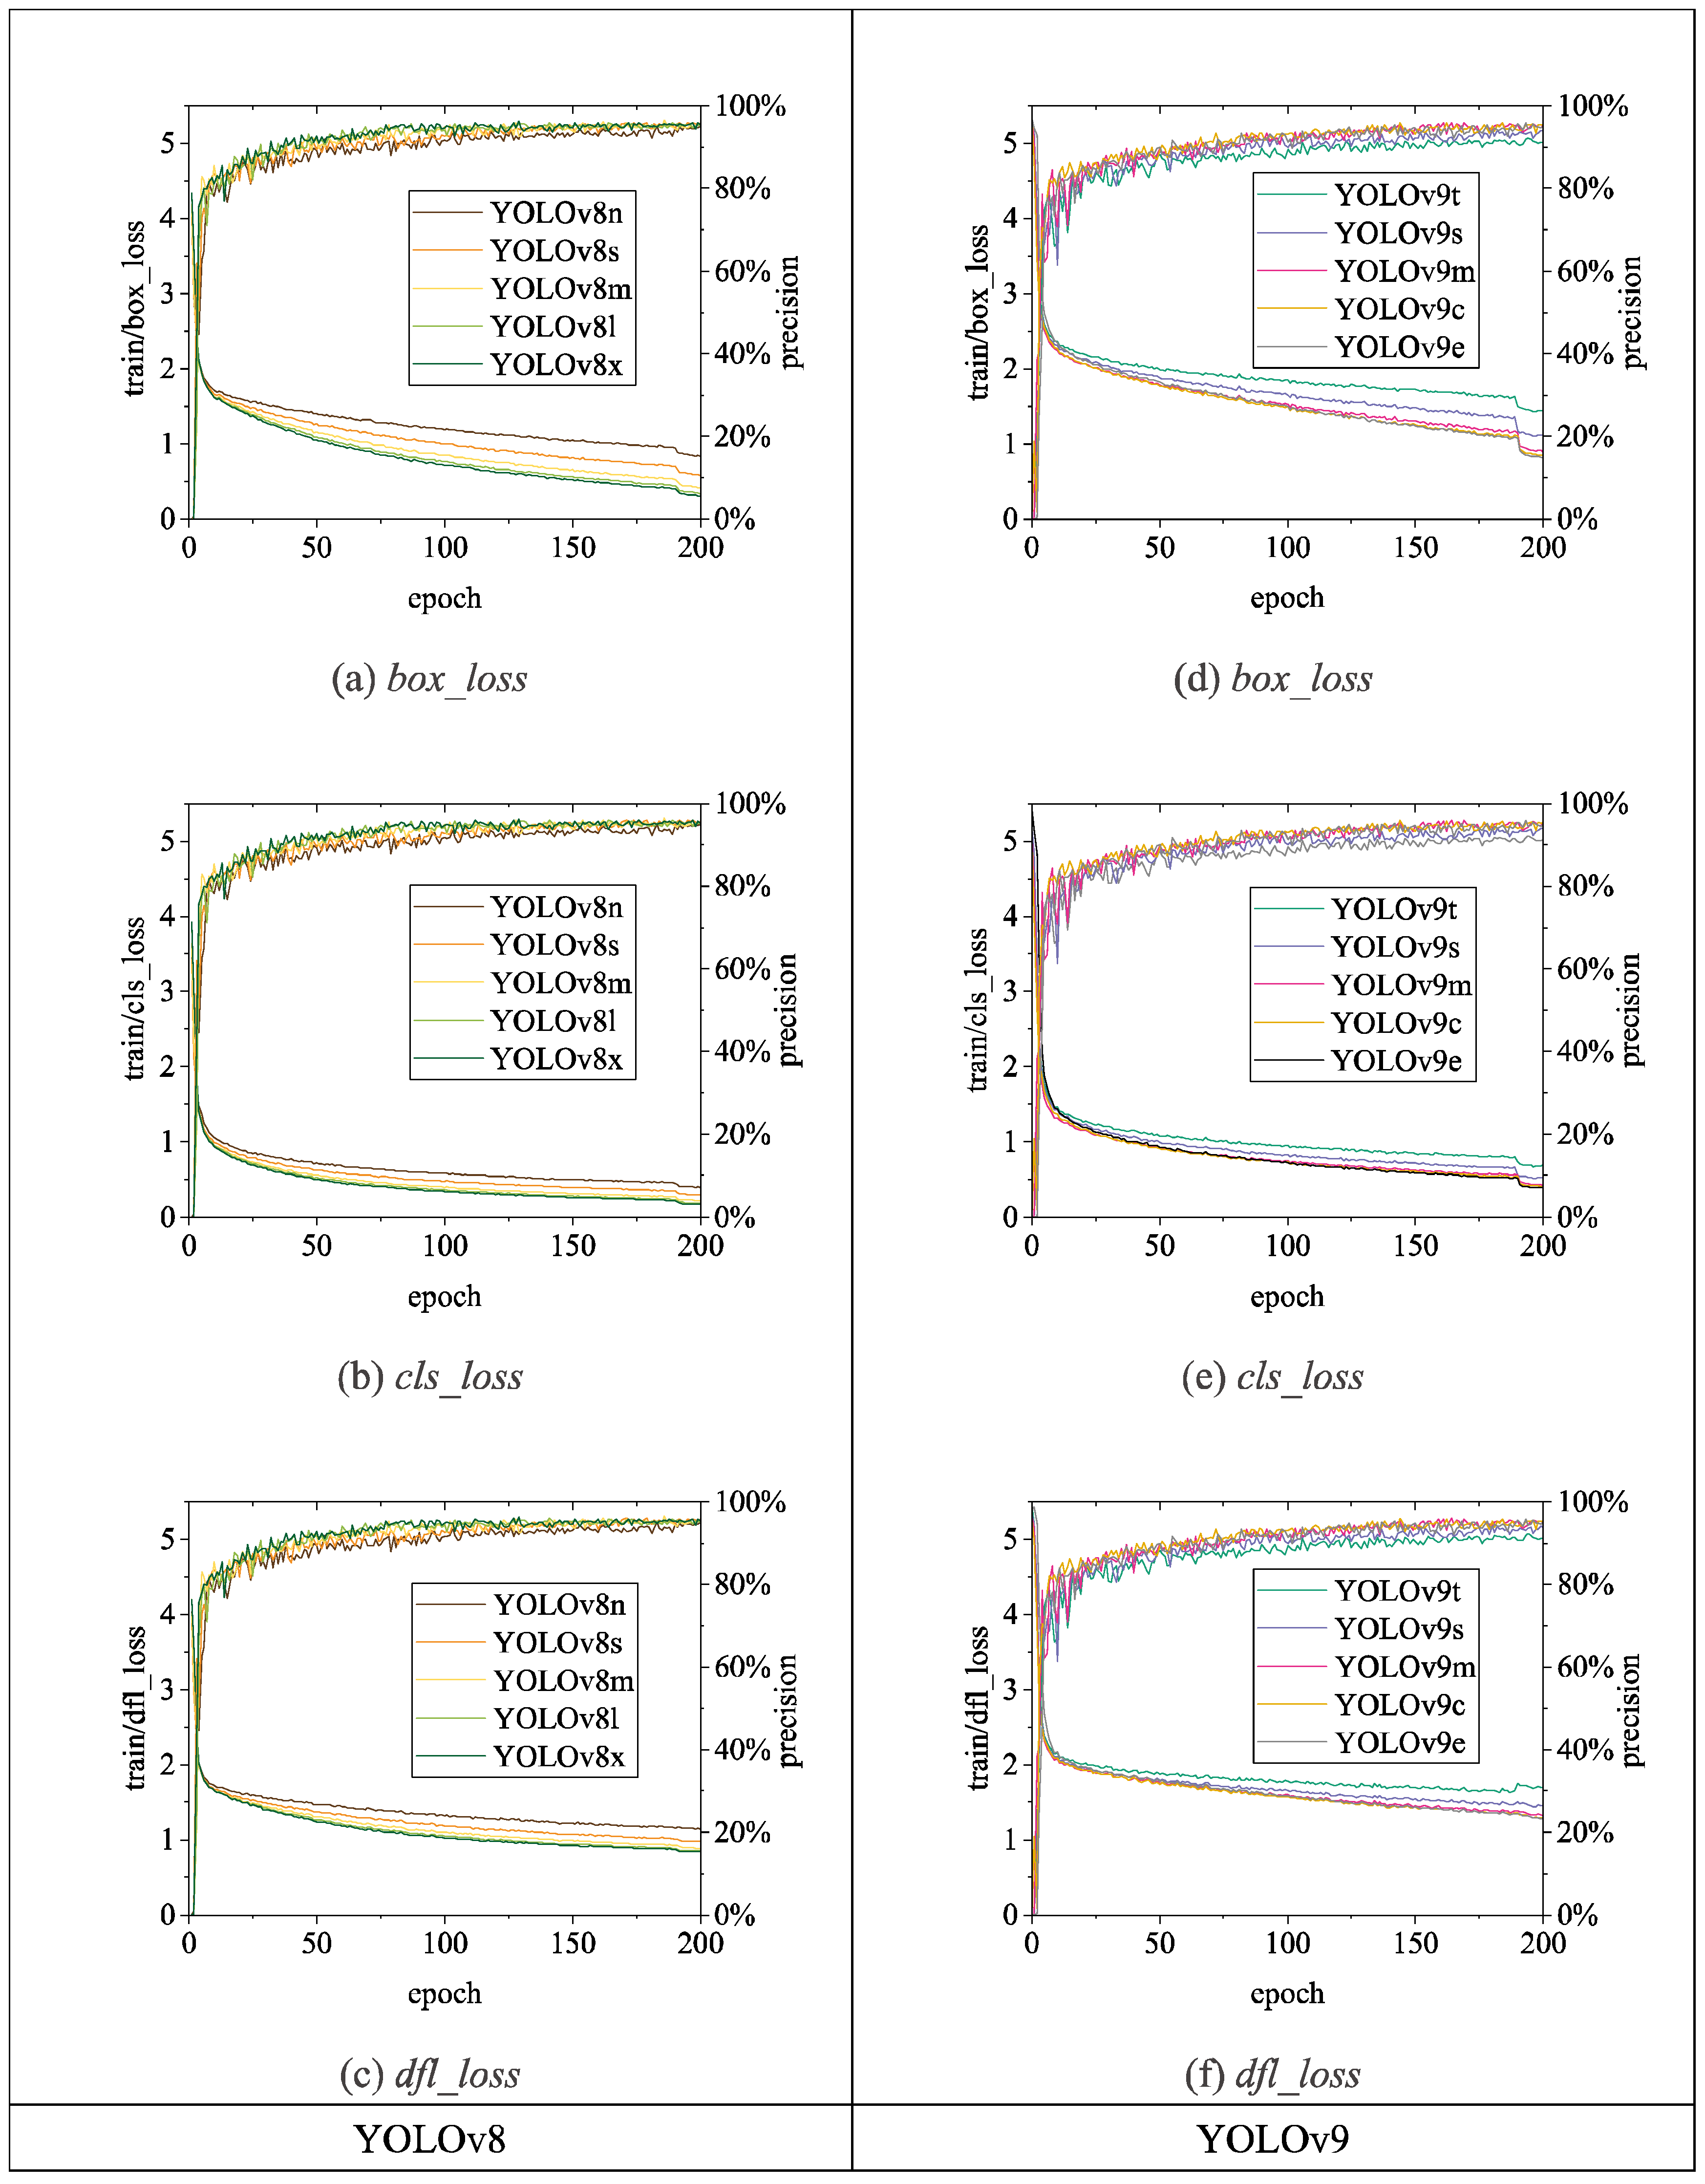
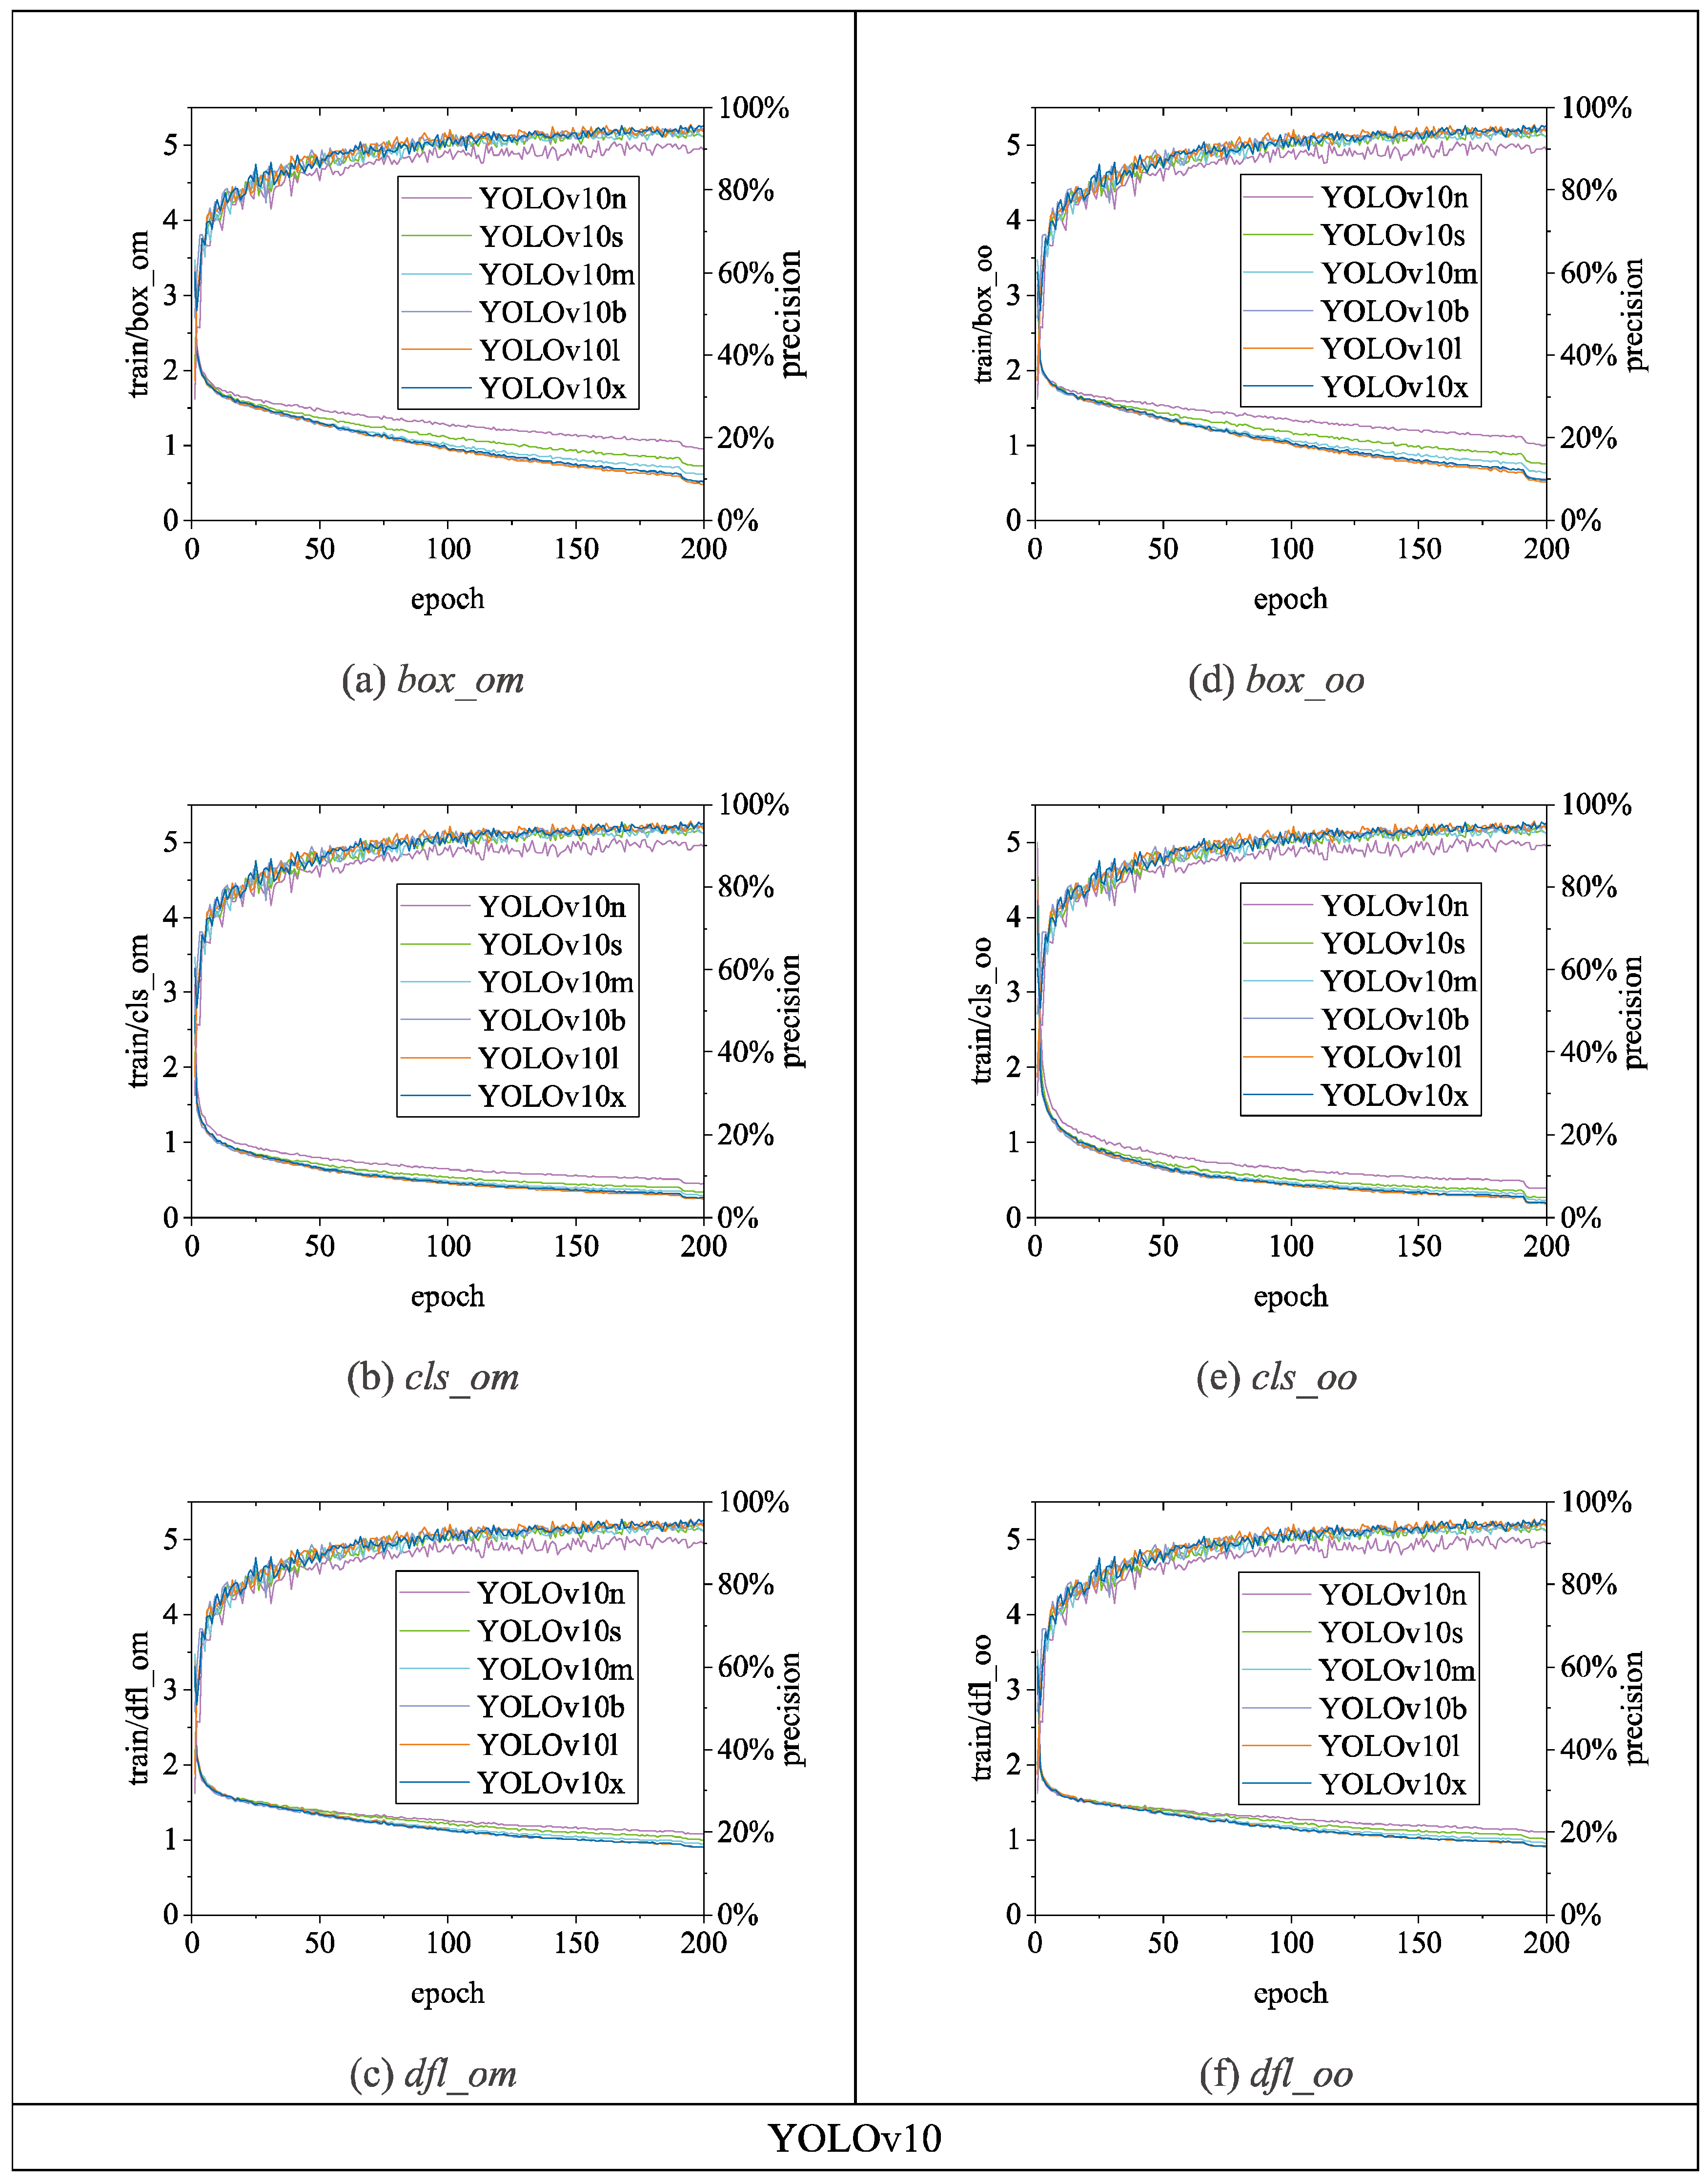
precision during the training process of the RT-DETR and YOLO series chicken head detection models. Given the complexity of object detection tasks, models require optimization across multiple dimensions. To enable models to comprehensively learn various aspects of object detection tasks, different algorithms enhance overall model performance by employing a design philosophy that combines multiple loss functions. Specifically, in
Figure 13,
Figure 14, and
Figure 15, the
loss calculation for RT-DETR includes
giou_loss (Generalized Intersection over Union Loss [
23]),
cls_loss (classification loss), and
l1_loss (Mean Absolute Error) [
18]; YOLOv5 comprises
box_loss (bounding box loss) and
obj_loss (object classification loss); YOLOv8 includes
box_loss,
cls_loss, and
dfl_loss (distribution focal loss); YOLOv9 consists of
box_loss,
cls_loss, and
dfl_loss; YOLOv10 utilizes a dual label assignment strategy, encompassing
box_om,
cls_om,
dfl_om, box_oo,
cls_oo, and
dfl_oo [
22]. Overall, as the number of training epochs increases, the
loss values of all algorithms gradually decrease and stabilize while
precision gradually improves and stabilizes.
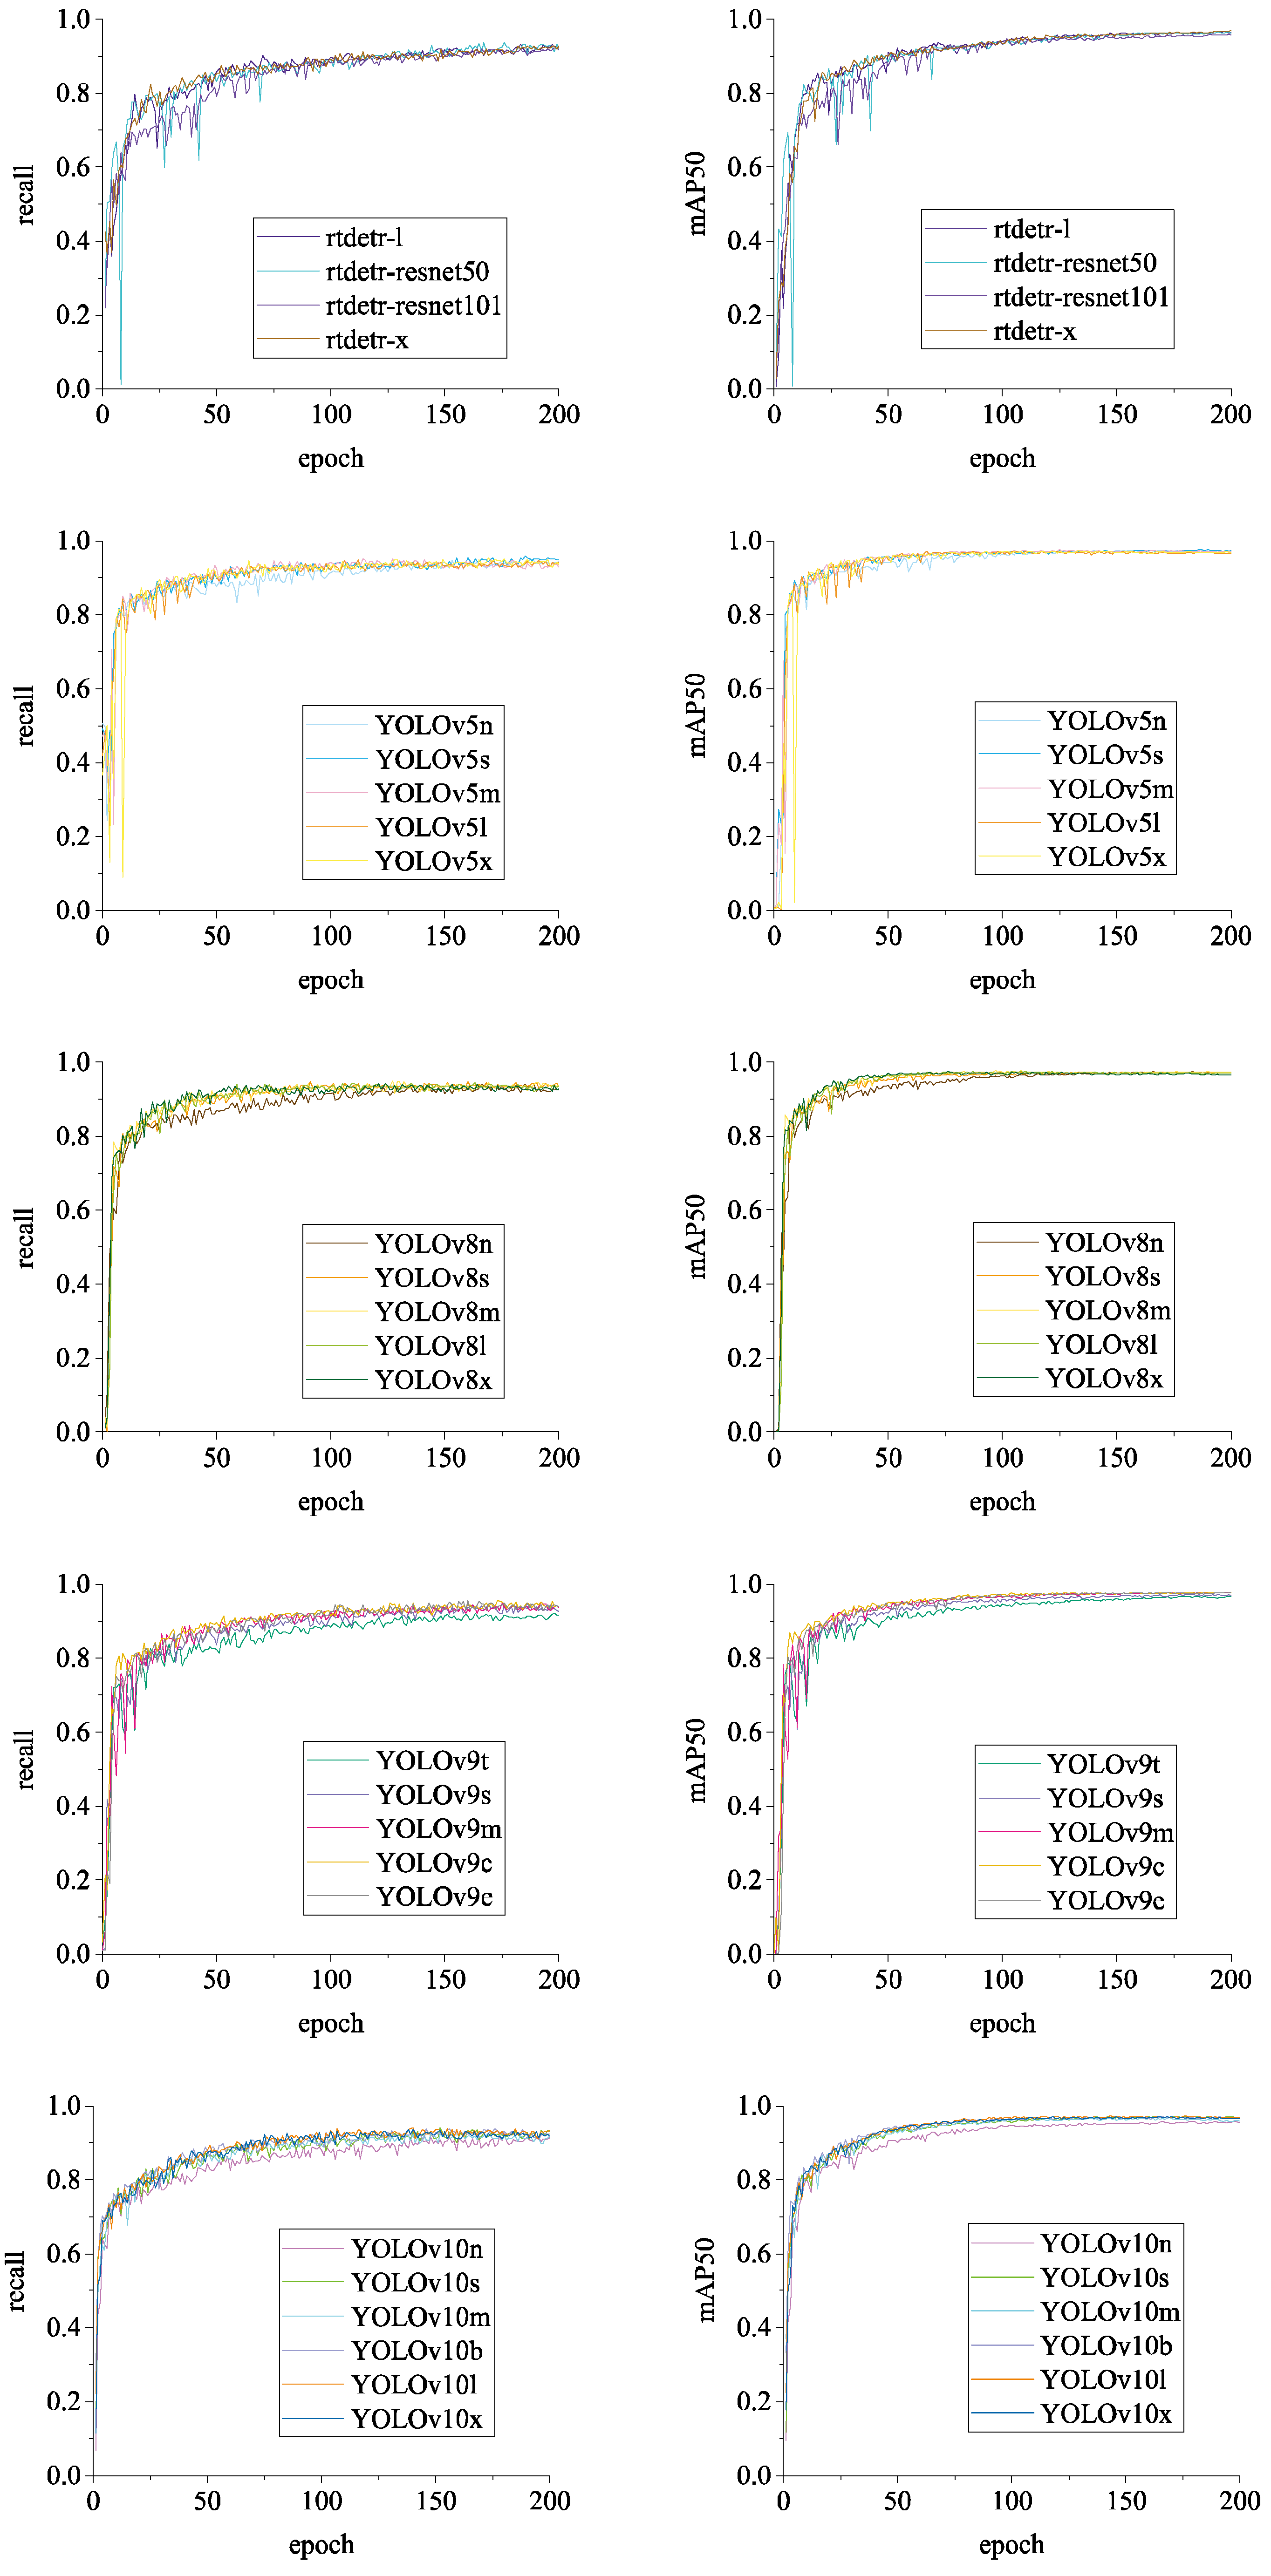
The detection effects of the models are comprehensively evaluated using
Recall and
mAP_0.5 (mean Average Precision at Intersection over Union of 0.5), as shown in
Figure 16. It can be observed that the dataset exhibits a high degree of
average precision across different models and possesses a strong capability to identify chicken head targets. In summary, the BClayinghens dataset is highly quality and adaptable to various object detection algorithms.
3.2.2. Visual Analysis of Chicken Head Detection
Due to the interpretability limitations of deep learning algorithms, we conducted a visual analysis using the inference results of chicken head detection.
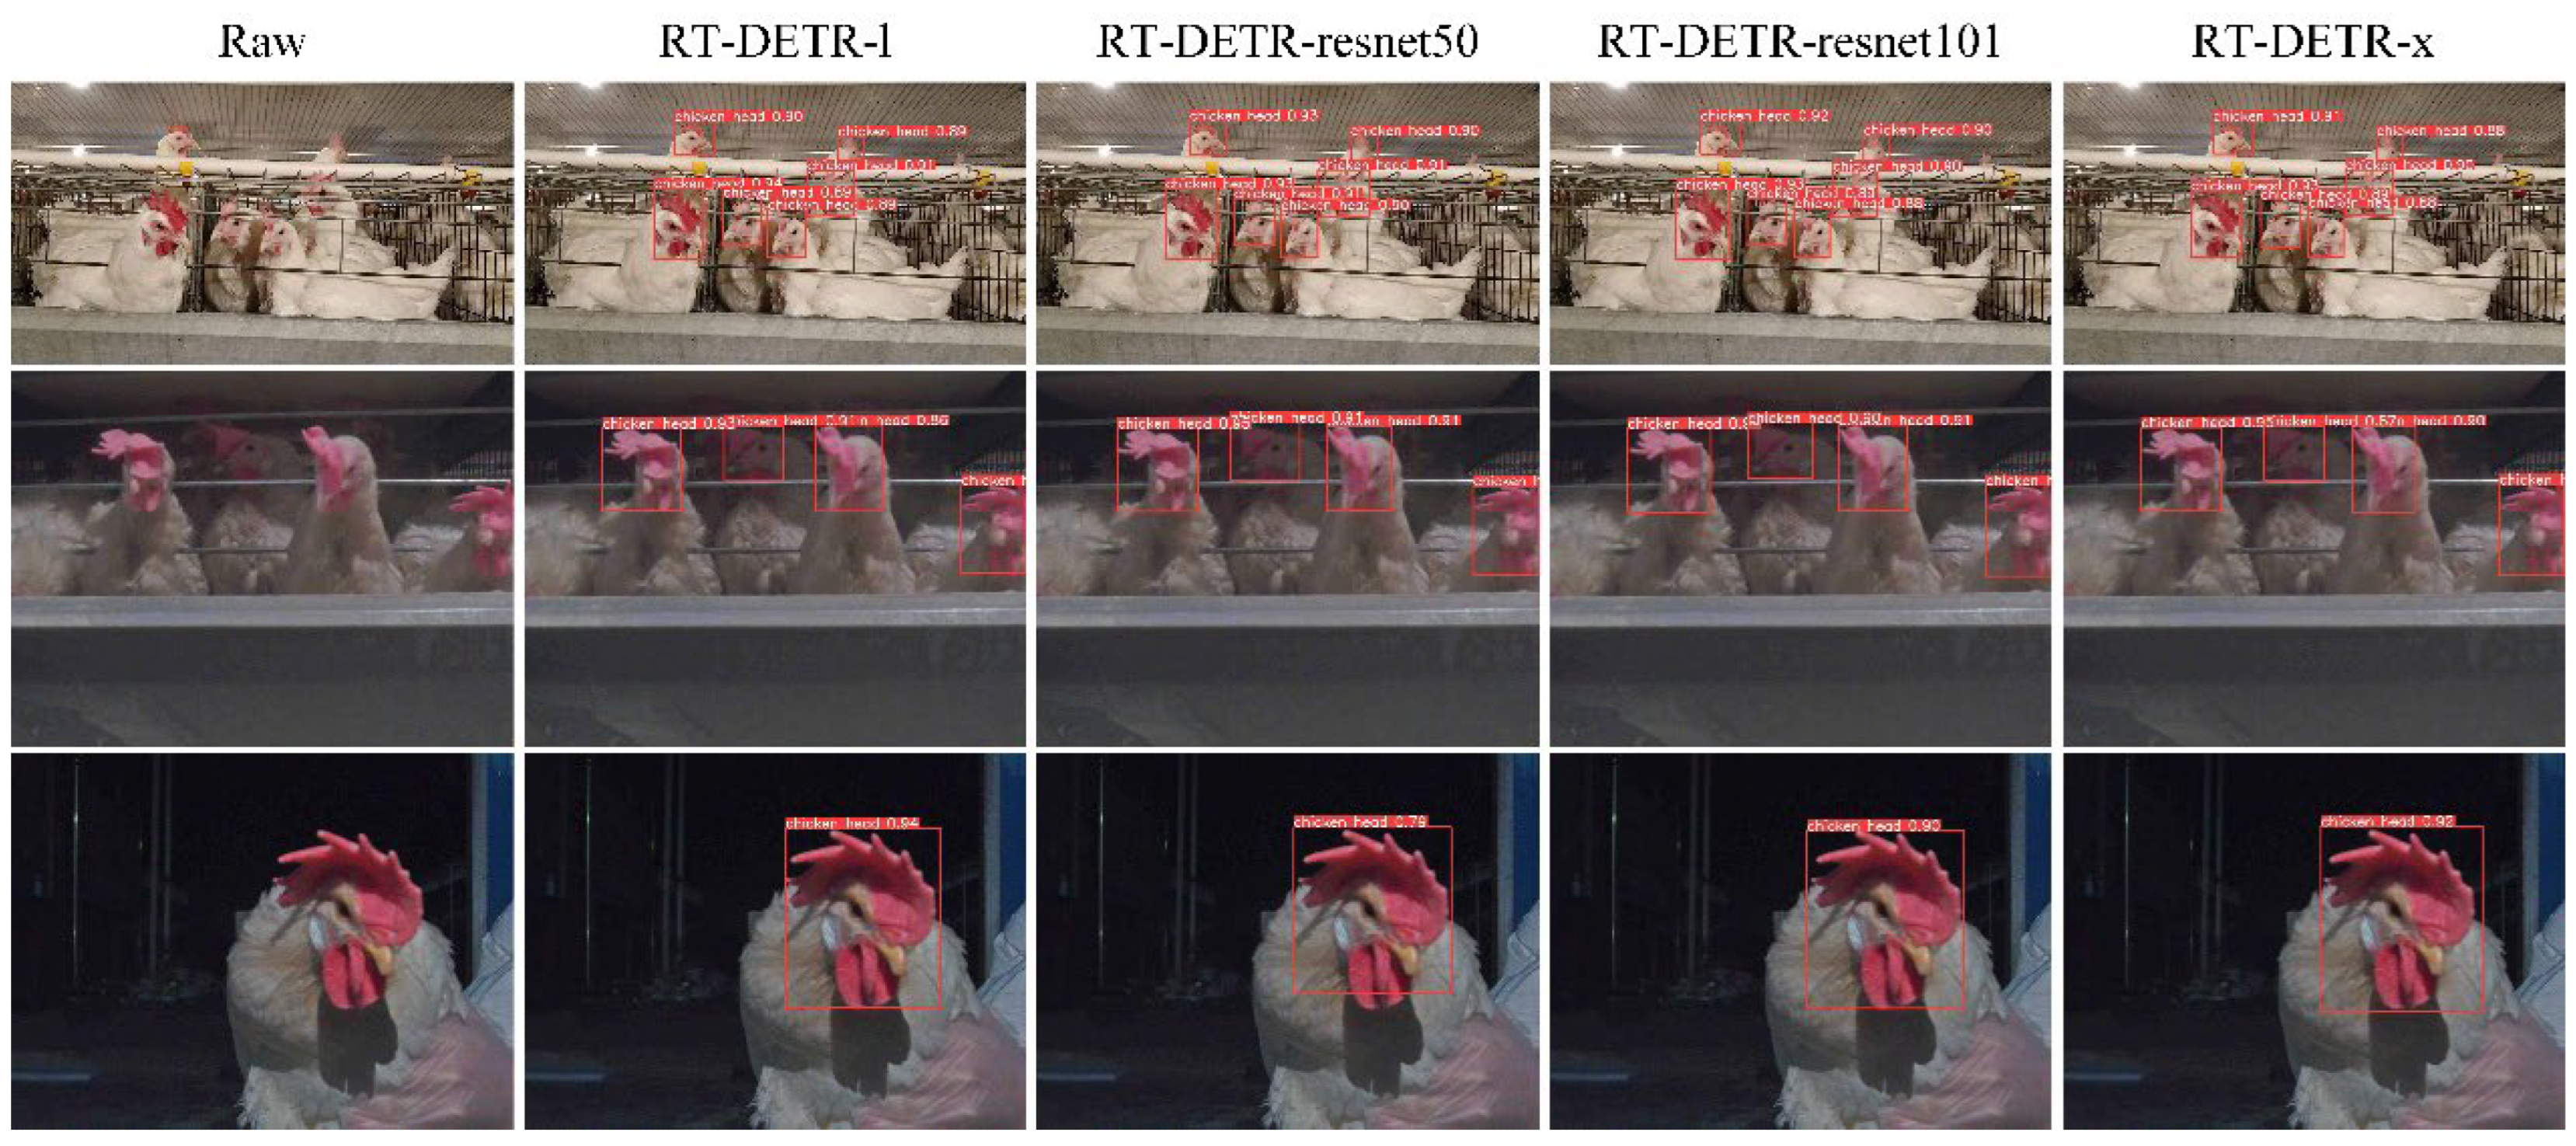
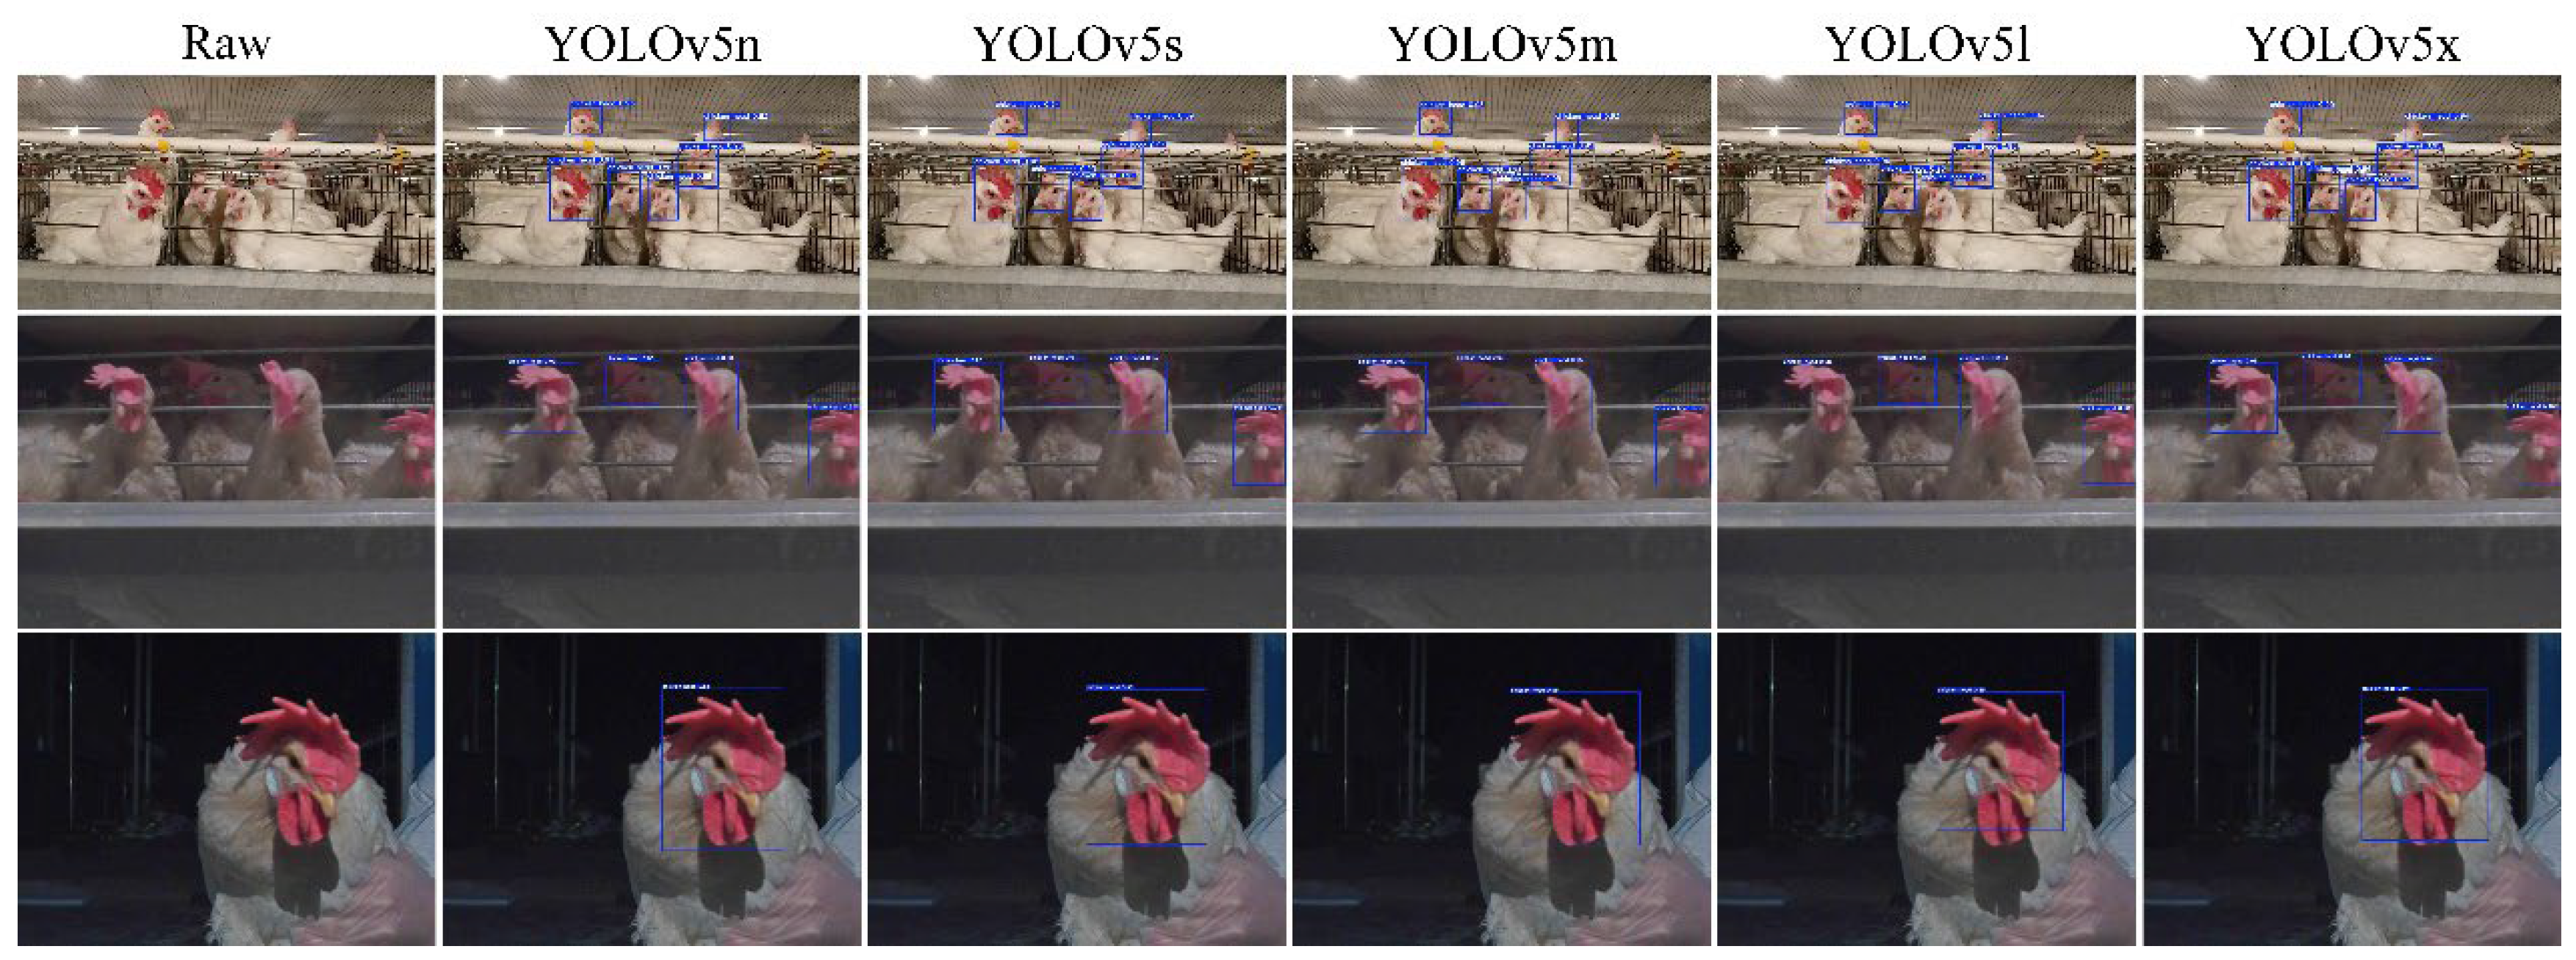
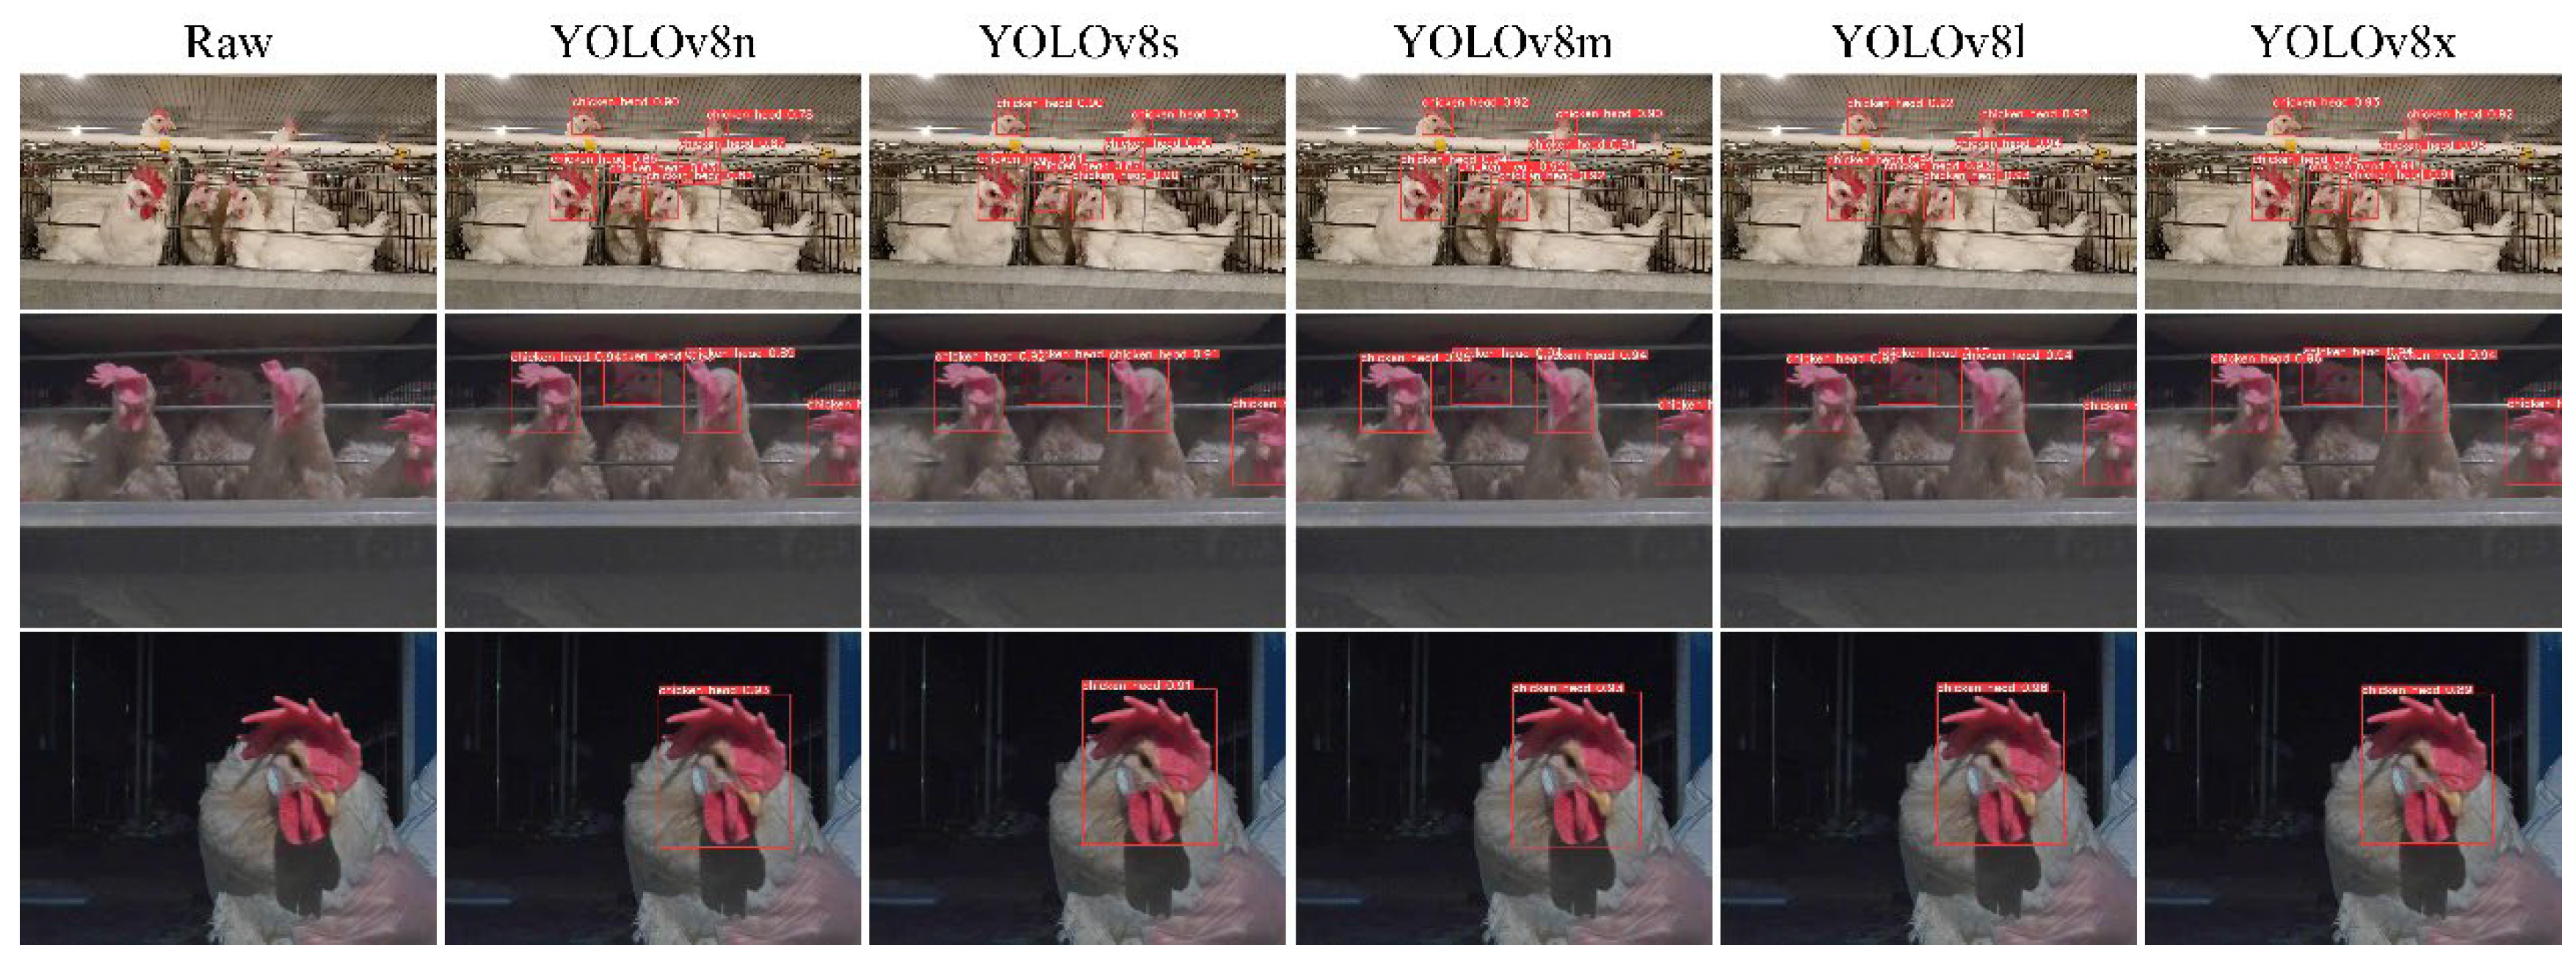
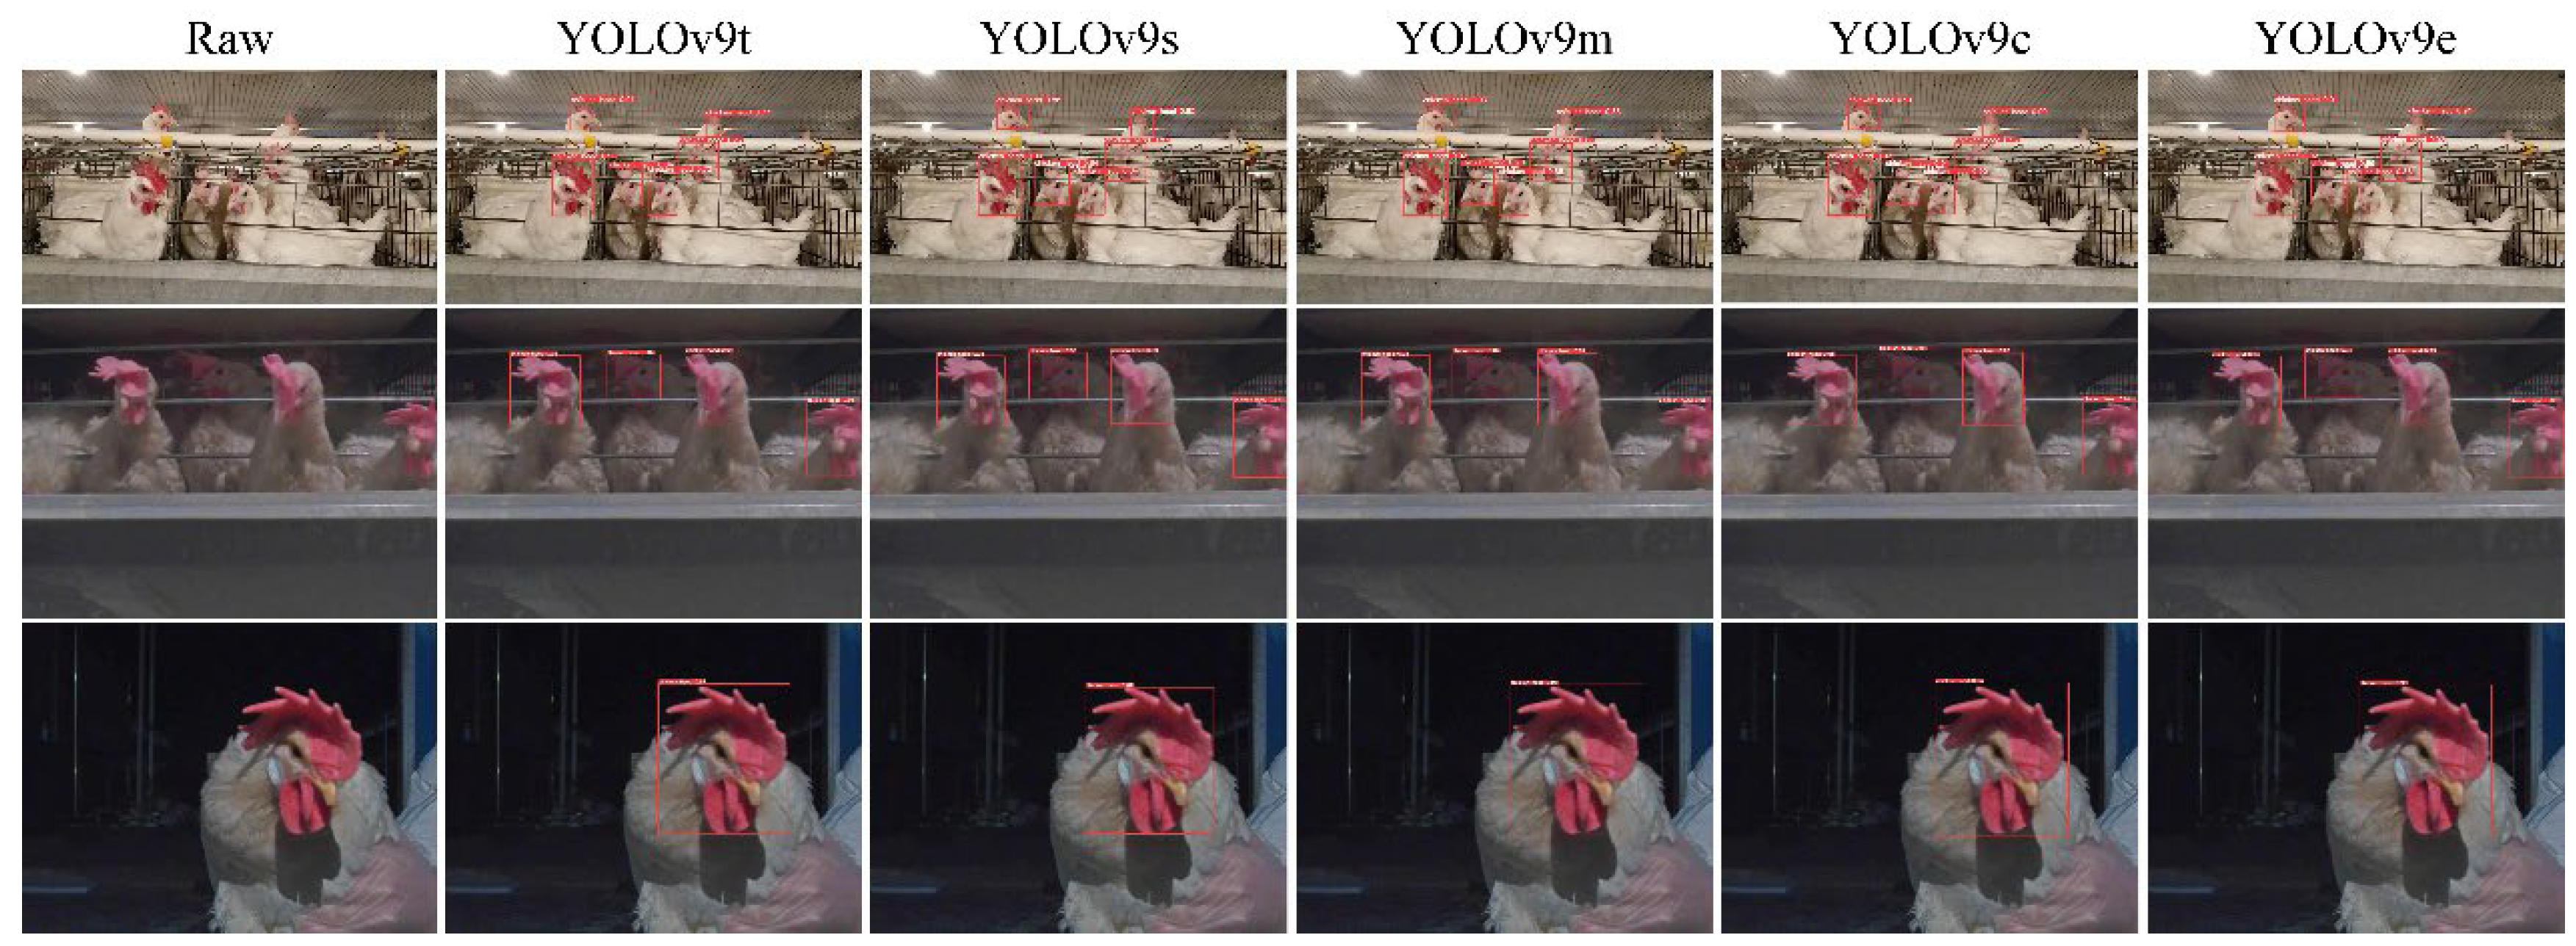
Figure 17,
Figure 18,
Figure 19,
Figure 20 and
Figure 21 demonstrate the recognition effects of different object detection algorithms on laying hen images.
In general, all algorithms can accurately identify the chicken head targets for images of laying hens in various poses with high confidence. The predicted boxes can fully encompass the chicken head area without any missed detections. The RT-DETR series algorithms have chicken head detection confidence, mostly around 0.9, with relatively stable detection results. The YOLOv5 series algorithms have the highest sensitivity in identifying chicken heads, with detection confidence frequently reaching up to 0.98. The YOLOv5 series algorithms have the best learning capability for chicken head features but are prone to false positives in practical applications. The YOLOv8 series algorithms have the highest confidence at 0.97, and the YOLOv9 series algorithms have the highest confidence at 0.98. However, considering the loss values and precision curves during the training process, we found that the YOLOv8 series algorithms consistently have lower loss values than YOLOv9, indicating that the YOLOv8 series algorithms have an advantage in chicken head detection. In comparison, the YOLOv10 series algorithms are less capable of recognizing chicken head targets than others, with the lowest confidence for single chicken head recognition at 0.3. In conclusion, different mainstream object detection models can meet the needs of chicken head identification and provide great convenience for subsequent chicken head temperature detection and deployment on the robot side.
3.2.3. Visual Analysis of Chicken Head Temperature Identification
After applying the object detection algorithm to identify the chicken head using the chicken inspection robot in the henhouse, the position of the chicken head is sent to the information collection and control system in the xywh (coordinates (x, y), width w, height h) format, as shown in equation (7), equation (8), and equation (9). The information collection and control system then invokes the chicken head temperature recognition algorithm and displays the chicken head temperature recognition results on the robot's visualization interface.
During the experimental process, we calibrated the temperature recognition system of the chicken inspection robot in the henhouse to further improve the temperature detection accuracy. The method for correcting the chicken head temperature detection is as follows:
where Tt is the raw chicken head temperature detected by the infrared thermal camera, and Ta is the corrected actual chicken head temperature.
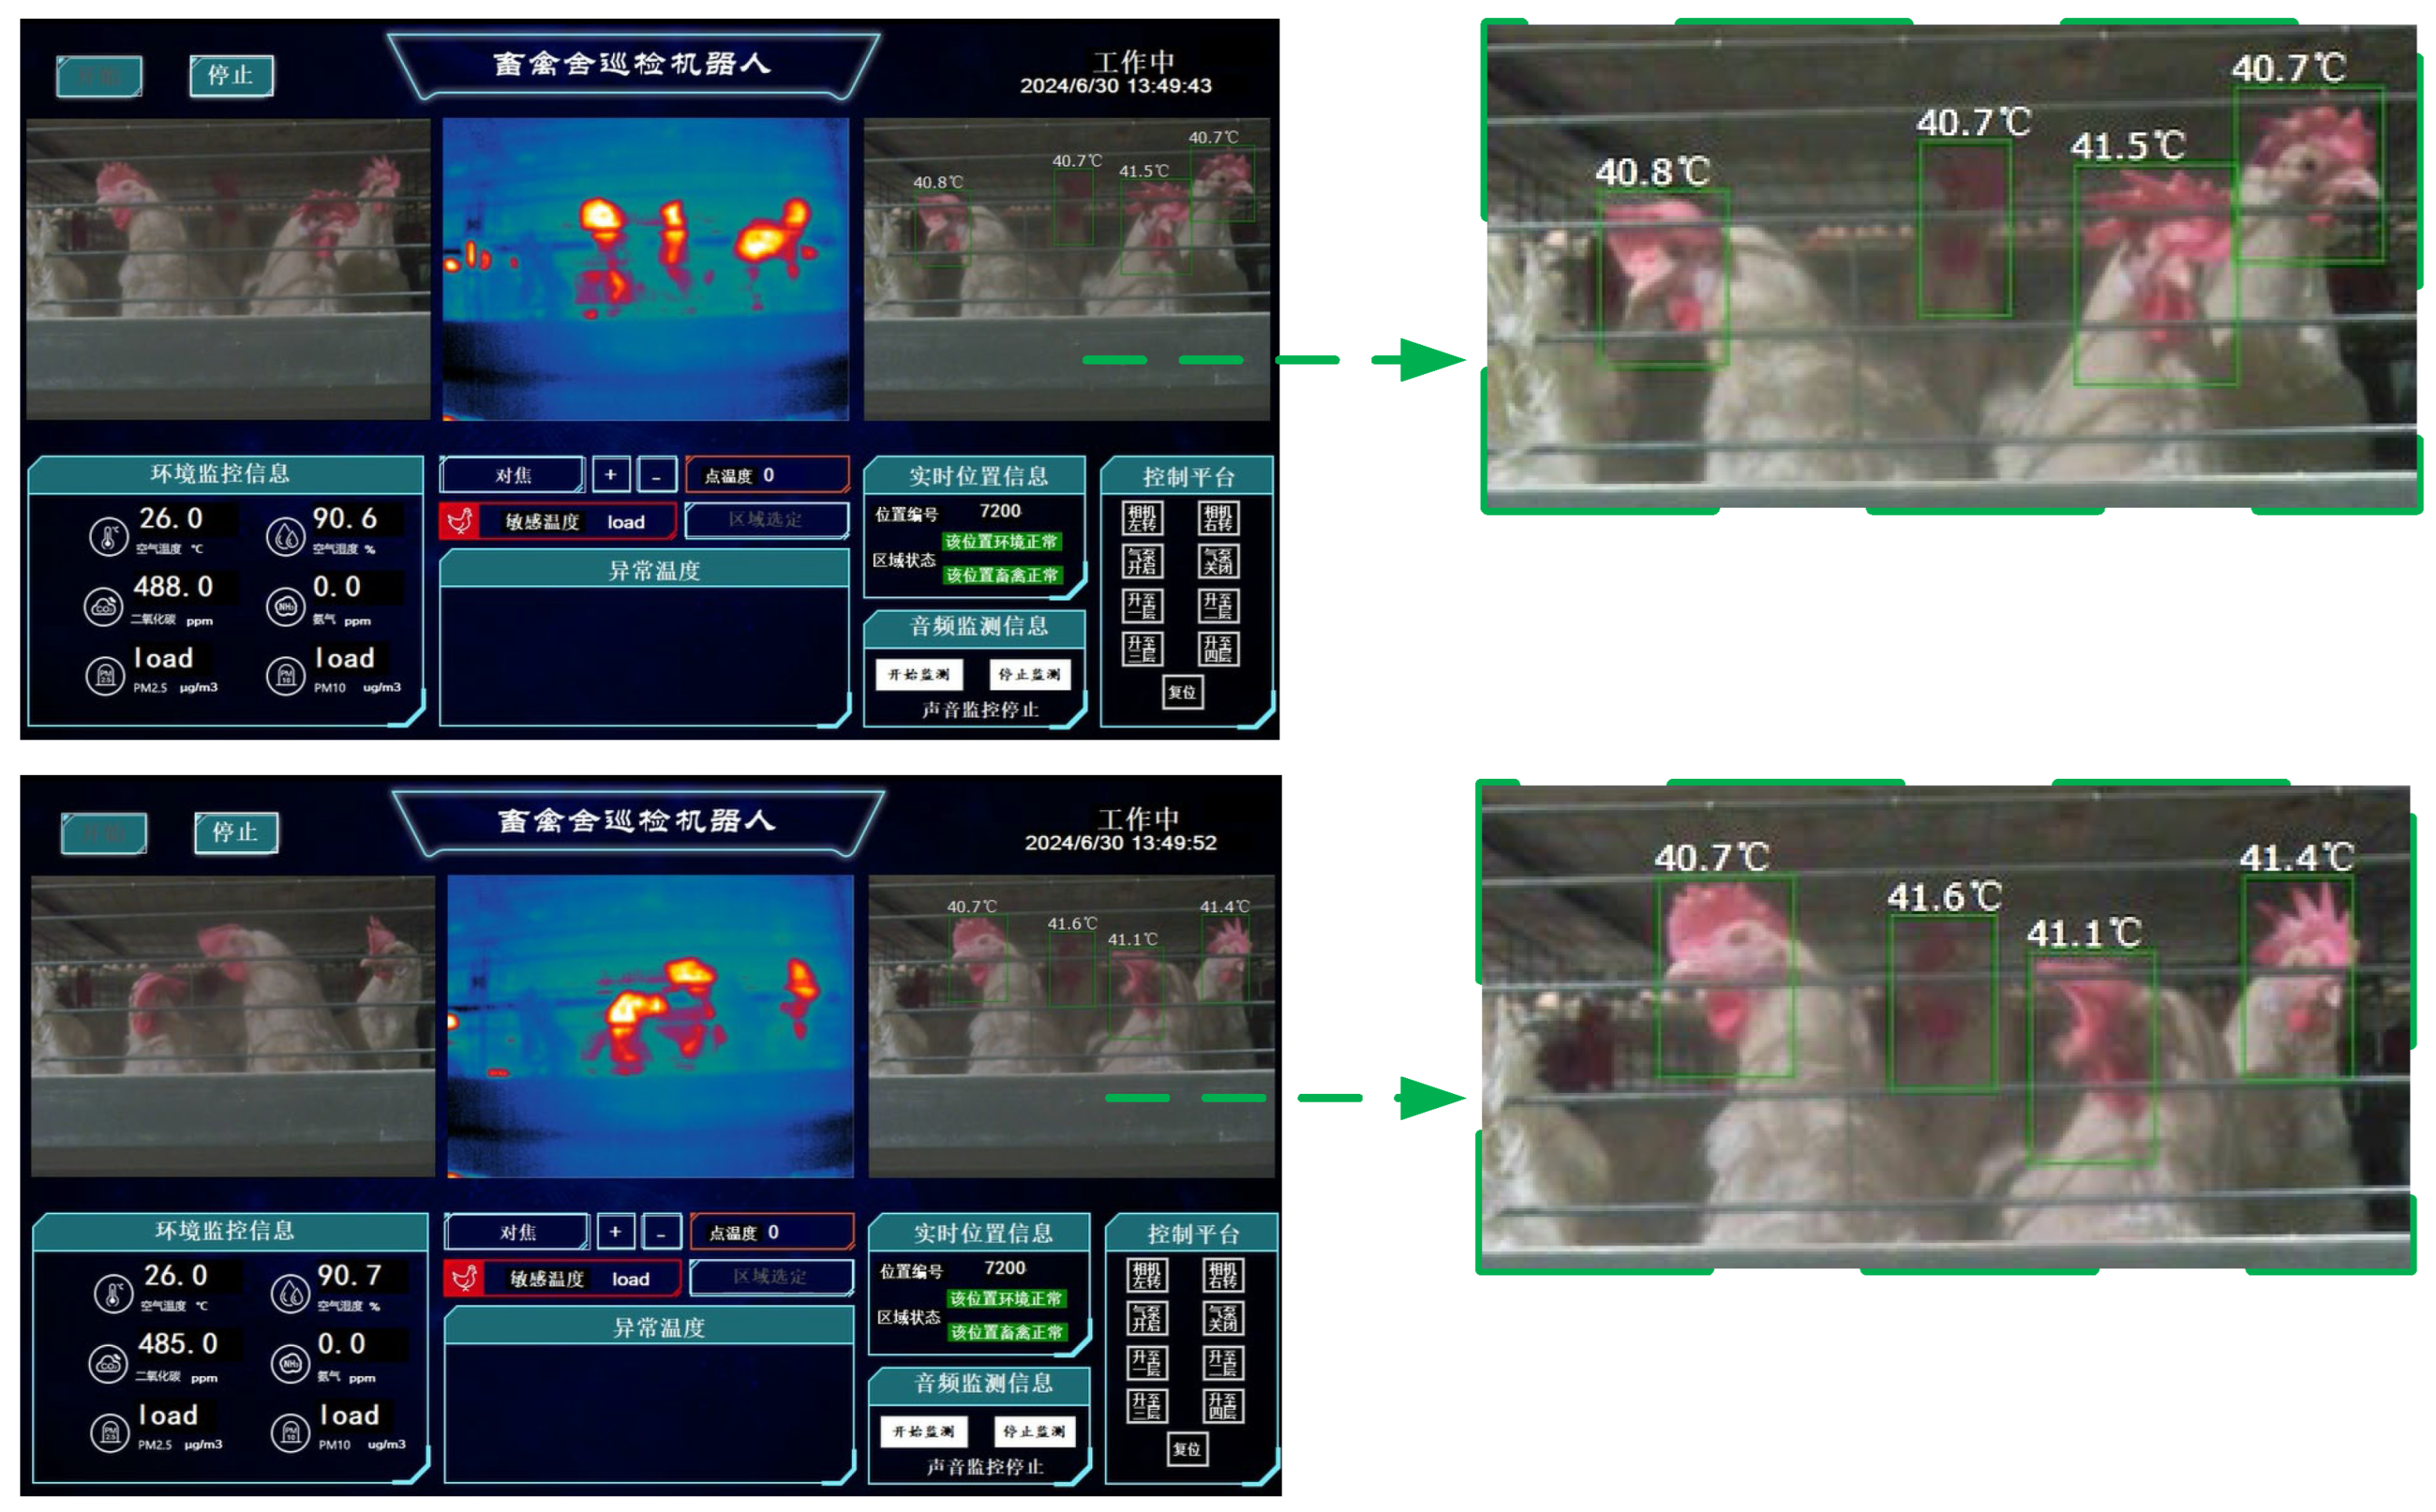
When the detection and recognition results of the chicken head are accurate, the chicken inspection robot in the henhouse can call the temperature detection algorithm to calculate the chicken head temperature. Since the RT-DETR above and YOLO series object detection algorithms can accurately identify the chicken head targets, the effect of chicken head temperature recognition is only related to the temperature recognition system. The YOLOv5n algorithm, which has the highest sensitivity for chicken head detection in the YOLOv5 series, was deployed on the chicken inspection robot in the henhouse to test the effect of chicken head temperature detection. The YOLOv5n algorithm can maintain a fast speed while providing accuracy suitable for edge devices, and the effect of chicken head temperature recognition is shown in
Figure 22.
In
Figure 22, the chicken head temperature is generally around 40°C, the normal temperature for a chicken head, indicating a high degree of temperature recognition accuracy. Moreover, the movement of the chicken and the robot has a minimal impact on the recognition of the chicken head temperature, with the maximum difference in the temperature recognition of the same laying hen's head being 0.4°C and the minimum being 0.1°C. The dataset shows good performance in chicken head temperature recognition, which can provide a strong preference for the refined management and prevention of diseases in the henhouse.
4. Conclusions
In this study, we have established a comprehensive image dataset named BClayinghens, which encompasses RGB and TIR images of flocks within henhouses and RGB images annotated with laying hen head information. The dataset includes images captured under diverse conditions, varying scenarios, sizes, and lighting, making it suitable for various image detection tasks for laying hens and for research in deep learning methods within the caged laying hen production domain. Specifically, it includes (1) RGB images of individual laying hens that can be utilized to evaluate their size, thereby facilitating the calculation of weight and the degree of growth in individual parts; it can also be employed to assess the health status of the hens and to identify deceased or sickly hens. (2) RGB and TIR images of flocks within cages are conducive to monitoring individual and group temperatures, aiding in preventing and controlling diseases within hen populations; they are also useful for detecting deceased or sickly hens in complex cage environments. (3) RGB images with annotated laying hen head information can be applied for counting caged laying hens, simplifying intelligent management for large-scale egg-production facilities. The BClayinghens dataset offers significant contributions to the study of animal welfare for caged laying hens, propelling the advancement of smart henhouse management and enhancing the welfare of the animals.
Author Contributions
Conceptualization, Xianglong Xue; Data curation, Weihong Ma, Xingmeng Wang, Yuhang Guo and Ronghua Gao; Formal analysis, Xingmeng Wang and Ronghua Gao; Funding acquisition, Ronghua Gao; Investigation, Xingmeng Wang and Xianglong Xue; Methodology, Xingmeng Wang, Simon Yang and Yuhang Guo; Project administration, Qifeng Li; Software, Weihong Ma, Xingmeng Wang and Mingyu Li; Supervision, Simon Yang, Lepeng Song and Qifeng Li; Validation, Weihong Ma; Visualization, Weihong Ma and Xingmeng Wang; Writing – original draft, Weihong Ma; Writing – review & editing, Xingmeng Wang, Lepeng Song and Qifeng Li. All authors have read and agreed to the published version of the manuscript.
Funding
This research was funded by National Key R&D Program of China, grant number 2023YFD2000802.
Institutional Review Board Statement
Not applicable.
Informed Consent Statement
Not applicable.
Data Availability Statement
Acknowledgments
This study was funded by National Key R&D Program of China(2023YFD2000802).
Conflicts of Interest
The authors declare no conflicts of interest.
References
- Khanal, R.; Choi, Y.; Lee, J. , Transforming Poultry Farming: A Pyramid Vision Transformer Approach for Accurate Chicken Counting in Smart Farm Environments. Sens. 2024, 24, 2977. [Google Scholar] [CrossRef] [PubMed]
- Geffen, O.; Yitzhaky, Y.; Barchilon, N.; Druyan, S.; Halachmi, I. , A machine vision system to detect and count laying hens in battery cages. Anim. 2020, 14, 2628–2634. [Google Scholar] [CrossRef] [PubMed]
- Bakar, M.; Ker, P. J.; Tang, S. G. H.; Baharuddin, M. Z.; Lee, H. J.; Omar, A. R. , Translating conventional wisdom on chicken comb color into automated monitoring of disease-infected chicken using chromaticity-based machine learning models. Front. Vet. Sci. 2023, 10. [Google Scholar] [CrossRef] [PubMed]
- Yu, Z. W.; Wan, L. Q.; Yousaf, K.; Lin, H.; Zhang, J.; Jiao, H. C.; Yan, G. Q.; Song, Z. H.; Tian, F. Y. , An enhancement algorithm for head characteristics of caged chickens detection based on cyclic consistent migration neural network. Poult. Sci. 2024, (6), 103663. [Google Scholar] [CrossRef] [PubMed]
- Wu, Z. L.; Zhang, T. M.; Fang, C.; Yang, J. K.; Ma, C.; Zheng, H. K.; Zhao, H. Z. , Super-resolution fusion optimization for poultry detection: a multi-object chicken detection method. J. Anim. Sci. 2023, 101, 1–15. [Google Scholar] [CrossRef]
- Campbell, M.; Miller, P.; Díaz-Chito, K.; Hong, X.; McLaughlin, N.; Parvinzamir, F.; Del Rincón, J. M.; O'Connell, N. , A computer vision approach to monitor activity in commercial broiler chickens using trajectory-based clustering analysis. Comput. Electron. Agric. 2024, 217, 108591. [Google Scholar] [CrossRef]
- Nasiri, A.; Yoder, J.; Zhao, Y.; Hawkins, S.; Prado, M.; Gan, H. , Pose estimation-based lameness recognition in broiler using CNN-LSTM network. Comput. Electron. Agric. 2022, 197, 106931. [Google Scholar] [CrossRef]
- Yao, Y. Z.; Yu, H. Y.; Mu, J.; Li, J.; Pu, H. B. , Estimation of the Gender Ratio of Chickens Based on Computer Vision: Dataset and Exploration. Entropy 2020, 22, 719. [Google Scholar] [CrossRef] [PubMed]
- Adebayo, S.; Aworinde, H. O.; Akinwunmi, A. O.; Alabi, O. M.; Ayandiji, A.; Sakpere, A. B.; Adeyemo, A.; Oyebamiji, A. K.; Olaide, O.; Kizito, E. , Enhancing poultry health management through machine learning-based analysis of vocalization signals dataset. Data Brief 2023, 50, 109528. [Google Scholar] [CrossRef]
- Aworinde, H. O.; Adebayo, S.; Akinwunmi, A. O.; Alabi, O. M.; Ayandiji, A.; Sakpere, A. B.; Oyebamiji, A. K.; Olaide, O.; Kizito, E.; Olawuyi, A. J. , Poultry fecal imagery dataset for health status prediction: A case of South-West Nigeria. Data Brief 2023, 50, 109517. [Google Scholar] [CrossRef]
- Han, H.; Xue, X.; Li, Q.; Gao, H.; Wang, R.; Jiang, R.; Ren, Z.; Meng, R.; Li, M.; Guo, Y.; Liu, Y.; Ma, W. , Pig-ear detection from the thermal infrared image based on improved YOLOv8n. Intell. Rob. 2024, 4, 20–38. [Google Scholar] [CrossRef]
- Dlesk, A.; Vach, K.; Pavelka, K. , Photogrammetric Co-Processing of Thermal Infrared Images and RGB Images. Sens. 2022, 22, 1655. [Google Scholar] [CrossRef]
- Hongwei, L.; Yang, J.; Manlu, L.; Xinbin, Z.; Jianwen, H.; Haoxiang, S. , Path planning with obstacle avoidance for soft robots based on improved particle swarm optimization algorithm. Intell. Rob. 2023, 3, 565–80. [Google Scholar]
- Xinxing, C.; Yuxuan, W.; Chuheng, C.; Yuquan, L.; Chenglong, F. , Towards environment perception for walking-aid robots: an improved staircase shape feature extraction method. Intell. Rob. 2024, 4, 179–95. [Google Scholar]
- Tan, X. J.; Yin, C. C.; Li, X. X.; Cai, M. R.; Chen, W. H.; Liu, Z.; Wang, J. S.; Han, Y. X. , SY-Track: A tracking tool for measuring chicken flock activity level. Comput. Electron. Agric. 2024, 217, 108603. [Google Scholar] [CrossRef]
- Ma, W. H.; Wang, K.; Li, J. W.; Yang, S. X.; Li, J. F.; Song, L. P.; Li, Q. F. , Infrared and Visible Image Fusion Technology and Application: A Review. Sens. 2023, 23, 599. [Google Scholar] [CrossRef] [PubMed]
- Fan, J.; Zheng, E.; He, Y.; Yang, J. , A Cross-View Geo-Localization Algorithm Using UAV Image and Satellite Image. Sens. 2024, 24, 3719. [Google Scholar] [CrossRef]
- Lv, W.; Xu, S.; Zhao, Y.; Wang, G.; Wei, J.; Cui, C.; Du, Y.; Dang, Q.; Liu, Y. DETRs Beat YOLOs on Real-time Object Detection. ArXiv 2023, abs/2304.08069.
- Terven, J. R.; Esparza, D. M. C. A Comprehensive Review of YOLO: From YOLOv1 to YOLOv8 and Beyond. ArXiv 2023, abs/2304.00501.
- Varghese, R.; S, M. In YOLOv8: A Novel Object Detection Algorithm with Enhanced Performance and Robustness, 2024 International Conference on Advances in Data Engineering and Intelligent Computing Systems (ADICS), 18-19 April 2024, 2024; 2024; pp 1-6.
- Wang, C.-Y.; Yeh, I.-H.; Liao, H. YOLOv9: Learning What You Want to Learn Using Programmable Gradient Information. ArXiv 2024, abs/2402.13616.
- Wang, A.; Chen, H.; Liu, L.; Chen, K.; Lin, Z.; Han, J.; Ding, G. YOLOv10: Real-Time End-to-End Object Detection. ArXiv 2024, abs/2405.14458.
- Rezatofighi, H.; Tsoi, N.; Gwak, J.; Sadeghian, A.; Reid, I.; Savarese, S. In Generalized Intersection Over Union: A Metric and a Loss for Bounding Box Regression, 2019 IEEE/CVF Conference on Computer Vision and Pattern Recognition (CVPR), 15-20 June 2019, 2019; 2019; pp 658-666. [CrossRef]
Figure 1.
Data Collection Process. Hardware selection: mobile phones, visible light cameras, infrared thermal imagers, and other peripheral hardware; Establishment of chicken inspection robot: assemble the chicken inspection robot and debug the image acquisition.
Figure 1.
Data Collection Process. Hardware selection: mobile phones, visible light cameras, infrared thermal imagers, and other peripheral hardware; Establishment of chicken inspection robot: assemble the chicken inspection robot and debug the image acquisition.
Figure 2.
Chicken Inspection Robot. 1, Lifting device of the chicken inspection robot; 2, Information collection and control system; 3, Locomotion device [
13]; 4, Monitoring and image capture device; 5, Image capture device - Infrared thermal camera; 6, Image capture device - Visible light camera.
Figure 2.
Chicken Inspection Robot. 1, Lifting device of the chicken inspection robot; 2, Information collection and control system; 3, Locomotion device [
13]; 4, Monitoring and image capture device; 5, Image capture device - Infrared thermal camera; 6, Image capture device - Visible light camera.
Figure 3.
Data Augmentation Processing.
Figure 3.
Data Augmentation Processing.
Figure 4.
The dataset contains various morphological variations of individual laying hens.
Figure 4.
The dataset contains various morphological variations of individual laying hens.
Figure 5.
Diverse conditions of caged laying hens in the dataset.
Figure 5.
Diverse conditions of caged laying hens in the dataset.
Figure 6.
Variability in RGB-TIR image pairings presented in the dataset.
Figure 6.
Variability in RGB-TIR image pairings presented in the dataset.
Figure 7.
Data Annotation Process.
Figure 7.
Data Annotation Process.
Figure 8.
Dataset Structure 1.
Figure 8.
Dataset Structure 1.
Figure 9.
Dataset Structure 2.
Figure 9.
Dataset Structure 2.
Figure 10.
File count of BClayinghens dataset 1.
Figure 10.
File count of BClayinghens dataset 1.
Figure 11.
File count of BClayinghens dataset 2.
Figure 11.
File count of BClayinghens dataset 2.
Figure 12.
Chicken Head Detection Dataset Quality Assessment. (x, y) represents the centre coordinates of the chicken head target box; width is the width of the chicken head target box; height is the height of the chicken head target box.
Figure 12.
Chicken Head Detection Dataset Quality Assessment. (x, y) represents the centre coordinates of the chicken head target box; width is the width of the chicken head target box; height is the height of the chicken head target box.
Figure 13.
Loss and precision changes of RT-DETR and YOLOv5 chicken head detection models.
Figure 13.
Loss and precision changes of RT-DETR and YOLOv5 chicken head detection models.
Figure 14.
Loss and precision changes of YOLOv8 and YOLOv9 chicken head detection models.
Figure 14.
Loss and precision changes of YOLOv8 and YOLOv9 chicken head detection models.
Figure 15.
Loss and precision changes of YOLOv10 chicken head detection model.
Figure 15.
Loss and precision changes of YOLOv10 chicken head detection model.
Figure 16.
Model Recall and mAP_0.5 change curves.
Figure 16.
Model Recall and mAP_0.5 change curves.
Figure 17.
Recognition Effect of the RT-DETR Object Detection Algorithm.
Figure 17.
Recognition Effect of the RT-DETR Object Detection Algorithm.
Figure 18.
Recognition Effect of the YOLOv5 Object Detection Algorithm.
Figure 18.
Recognition Effect of the YOLOv5 Object Detection Algorithm.
Figure 19.
Recognition Effect of the YOLOv8 Object Detection Algorithm.
Figure 19.
Recognition Effect of the YOLOv8 Object Detection Algorithm.
Figure 20.
Recognition Effect of the YOLOv9 Object Detection Algorithm.
Figure 20.
Recognition Effect of the YOLOv9 Object Detection Algorithm.
Figure 21.
Recognition Effect of the YOLOv10 Object Detection Algorithm.
Figure 21.
Recognition Effect of the YOLOv10 Object Detection Algorithm.
Figure 22.
Chicken Head Temperature Recognition Effect.
Figure 22.
Chicken Head Temperature Recognition Effect.
Table 1.
Parameters of Experimental Equipment.
Table 1.
Parameters of Experimental Equipment.
| Equipment |
Category |
Specifications |
| Smartphone |
Camera manufacturer |
HONOR |
| Camera model |
ANN-AN00 |
| Resolution |
2592*1944 |
| Visible light camera on the robot |
Camera model |
LRCP20680_1080P |
| Resolution |
1920*1080 |
| Infrared thermal camera on robot |
Camera manufacturer |
FLIR Systems |
| Camera model |
FLIR A300 9Hz |
| Resolution |
320*240 |
Table 2.
Single Experiment Data Collection Plan.
Table 2.
Single Experiment Data Collection Plan.
| No. |
Time |
General state of hens |
Capturing tool |
Image type |
| 1 |
Day 1, 7 a.m |
Looking around |
Smartphone |
RGB |
| 2 |
Day 2, 1 p,m |
Looking around |
Robot |
RGB+TIR |
| 3 |
Day 3, 7 p,m |
Resting |
Robot |
RGB |
| 4 |
Day 4, 9 p,m |
Resting |
Robot |
RGB+TIR |
| 5 |
Day 5, 11 a, m |
Feeding |
Smartphone |
RGB |
| 6 |
Day 6, 5 p,m |
Feeding |
Robot |
RGB+TIR |
| 7 |
Day 7, 2 p,m |
Manual handling |
Smartphone |
RGB |
| 8 |
Day 8, 11:30 a.m |
Large-scale movement of feed cart |
Robot |
RGB |
| 9 |
Day 9, 11 a.m |
Pecking |
Smartphone |
RGB |
| 10 |
Day 10, 04:30 p.m |
Egg collection device movement |
Smartphone |
RGB |
| 11 |
Day 11, 9 a.m |
Excited |
Robot |
RGB+TIR |
| 12 |
Day 12, 3 p.m |
Excited |
Robot |
RGB |
Table 3.
Specifications Table of BClayinghens.
Table 3.
Specifications Table of BClayinghens.
| Subject |
Dataset of Visible Light and Thermal Infrared Images for Caged laying hens, Precision laying hen Farming. |
| Specific Academic Field |
Deep learning based image recognition, counting, health monitoring, and behavioral analysis of caged laying hens. |
| Data Formats |
Raw Images, XML annotations, TXT annotations, JSON annotations. |
| Data Types |
Visible light (RGB) images, Thermal infrared (TIR) Images. |
| Data Acquisition |
A chicken inspection robot together with a smartphone, visible light camera, and infrared thermal imager was used to collect images of laying hens with various poses within a large-scale poultry farm. The collected images comprise RGB and TIR images with resolutions of 2592×1944, 1920×1080, and 320×240, totalling 61,133. The dataset, after compression, is 76.1 GB in size and is available for download in ZIP format. |
| Data Source Location |
Country: China; City: Shengzhou, Hebei; Institution: Shengzhou Xinghuo Livestock and Poultry Professional Cooperative. |
| Data Accessibility |
Repository Name: BClayinghensDirect URL to the Data: https://github.com/maweihong/BClayinghens.git |
|
Disclaimer/Publisher’s Note: The statements, opinions and data contained in all publications are solely those of the individual author(s) and contributor(s) and not of MDPI and/or the editor(s). MDPI and/or the editor(s) disclaim responsibility for any injury to people or property resulting from any ideas, methods, instructions or products referred to in the content. |
© 2024 by the authors. Licensee MDPI, Basel, Switzerland. This article is an open access article distributed under the terms and conditions of the Creative Commons Attribution (CC BY) license (http://creativecommons.org/licenses/by/4.0/).


