1. Introduction
The Middle Atmosphere (MA) is a region that plays an important role in climate, acting as a link between the troposphere (0-15 km) and the thermosphere (>100 km). Emissions of particles and long-lived gases are mainly emitted in the lower atmosphere, whether from natural (volcanoes) or anthropogenic sources (Tett et al., 2007). The upper atmosphere is mainly influenced by solar activity (Beig et al., 2002). The MA is characterised by the presence of the ozone layer and dynamic processes on different spatio-temporal scales that traverse it (Hauchecorne et al., 2009). In the long term, in addition to ozone chemistry, which is highly dependent on temperature (Salby et al., 2002), the increase in GHGs (greenhouse gases) also leads to cooling of the entire MA associated with global warming at the surface (Rind et al., 1988, Beig et al., 2003, Keckhut et al., 2011). While the stratosphere is strongly governed by planetary waves and associated stratospheric heating (Maury et al., 2016), the mesosphere is subject to the impact of gravity waves (Mze et al., 2014), which reverse the horizontal temperature gradient and lead to the generation of mesospheric inversions (Ardalan et al. 2022). On the other hand, changes in the middle atmosphere have an impact on weather conditions (Baldwin and Dunkerton, 2001; Shaw et al., 2014; Charlton-Perez et al., 2018, Mariaccia et al., 2022 and 2023), but also on the highest layers in the thermosphere via space weather (Srivastava et al., 2021), which needs to be better quantified.
In recent years, numerical weather models have seen their vertical domain extended to higher altitudes and spatial resolutions improved (Beagley et al., 2000; Baldwin et al., 2003; Osprey et al., 2010). However, the processes are difficult to model and validate due to the small number of measurements available, particularly in the mesosphere. Weather balloon soundings (Parker and Cox, 1995) and Radio Occultation observations using GNSS (Global Navigation Satellite System) signals from space (Ladstädter et al., 2011) are limited to altitudes of around 30 kilometres. Meteorological sounding rockets are no longer used because of the high costs involved (Keckhut et al., 1999). Observations at nadir in the thermal infrared from space, such as the SSU (Stratospheric Sounder Unit) series, or in the microwave range, such as the AMSU (Advanced Microwave Sounding Unit) series aboard NOAA operational satellites, provide brightness temperatures below an altitude of 45 km and with extended vertical resolutions (around 5-10 km). However, these low-resolution satellite observations provide effective guidance for NWP (Numerical Weather Prediction) numerical weather prediction models in the stratosphere. Observations from research-type sounders, such as those currently in use; MLS (Microwave Limb Sounder) on board the AURA satellite or SABER (Sounding of the Atmosphere using Broadband Emission Radiometry) affiliated to the TIMED mission, cover the mesosphere with better resolution but sometimes with a strong bias (Wing et al., 2018). The data obtained with these satellites is not assimilated into the NWP models because it is used for research purposes. The absence of assimilated observations leads to biases and unrealistic variability in the meteorological analyses of the European centre (Marlton et al., 2021, Mariaccia et al., 2022).
Observations by solar occultation, such as the HALOE experiment aboard UARS (Hervig et al., 1996, Remsberg et al., 2002), make it possible to obtain temperature profiles with a vertical resolution of the order of a kilometre. However, the observation geometry does not allow continuous observations. From molecular scattering, it is possible to deduce temperature profiles in the middle atmosphere above 30 km in the absence of particles in the atmosphere. This technique has been successfully applied to Rayleigh lidar observations for over 40 years (Hauchecorne and Chanin, 1980) at the Haute-Provence observatory in France. From space, by looking at the illuminated limb, it is also possible to obtain global temperature observations using the onion peel method. This method has been applied experimentally to several datasets obtained on different platforms such as Solar Mesosphere Explorer (Clancy et al., 1994), WINDII on UARS (Shepherd et al., 2001), OSIRIS on Odin (Sheese et al., 2012), and more recently to GOMOS observations on ENVISAT (Hauchecorne et al., 2019). These space experiments were not designed to provide temperature profiles and were in fact derived research products. These instruments were complex and enabled sophisticated observations of atmospheric composition (Kyrola et al., 2004). GOMOS, for example, obtained precise altitude registration by pointing to stars. Observations of molecular diffusion could probably be made using much simpler on-board systems that could be flown aboard Cubesats (Keckhut et al., 2022). These systems could then be deployed in constellations to provide operational, continuous observations that are unbiased by atmospheric tides. The OMPS (Ozone Mapping and Profiler Suite) instrument recently put into orbit was not intended to provide temperature measurements by molecular diffusion, as it was previously also dedicated to atmospheric composition. However, it has a simpler instrumental design than GOMOS, using a single image of the limb on a 2D sensor with no moving optics. It is therefore interesting to evaluate the performance of this device, which is suitable for use on a future small platform such as those dedicated to the radiation budget (Mustapha et al., 2023). OMPS data has already been inverted to produce preliminary temperature profiles (Chen et al., 2023). The analysis has been repeated here in order to gain a better understanding of the sources of bias and provide better temporal continuity of the series, and to improve the design of other future systems in space.
The objective of this study is therefore to validate the method of inversion of limb observation data obtained from a CCD imager by comparing them with the long lidar series obtained within the framework of the NDACC (Keckhut et al., 2011) and already validated on several occasions (Singh et al., 1996, Keckhut et al., 2004, Wing et al., 2018) and with MSIS climatological models (Piconne et al., 2002) or with ERA5 meteorological analyses (Bell et al., 2021) widely used by the scientific community. These comparisons will make it possible to highlight the advantages and weaknesses of the OMPS instrument design in order to consolidate the design of smaller instruments for deployment in constellations.
Section 2 of this publication will present the OMPS observations, lidars from the NDACC network and the models used as a reference.
Section 3 will deal with the inversion method.
Section 4 will present comparisons of the inverted OMPS data with the lidar data in conjunction with a variability estimation method described in year 2. Part 5 will discuss the performance and improvements required for a reduced instrument with optimum performance. Finally, the conclusions of this study will be presented in
Section 6.
2. Description of the OMPS Instrument and Validation Data
2.1. OMPS Description
The Ozone Mapping and Profiler Suite (OMPS) consists of nadir-viewing and limb-viewing instruments aboard the Suomi NPP, NOAA-20, and NOAA-21 satellites, whose main objective is to study the composition of the stratosphere (Jaross et al., 2014). These satellites are in sun-synchronous orbit at an altitude of around 830 km, and their position enables them to cover the entire globe (-90 to 90 degrees latitude) 14.5 times a day (14.5 orbits). As the instruments need to receive scattered sunlight to obtain quality observations, the data are selected when the satellite passes through the daytime part of the orbit. The Limb Profiler (LP) instruments, flown ont the Suomi NPP and NOAA-21 satellites, measures the Earth’s radiance in the 290 - 1020 nm spectral range, with sunlight as the main source scattered by atmospheric molecules (Rayleigh scattering) in our field of study (30 - 85 km). We have used the SNPP data.
The operation of the LB is simple. The Earth’s limb is observed via 3 slits with a fixed field of view of 1.85 degrees, covering an altitude range from 0.5 to 100.5 km. The first slit is centred on the satellite ground track and the other two are oriented 4.25 degrees to the right and left of the first (250 km separation at the tangent point). Once the light has been scattered by the Earth’s atmosphere, it enters through one of the 3 slits. Then, in the optical path, it encounters a prism that disperses the light. The spectral range studied is broad, and the ultra-violet range is obtained with better resolution than in the visible and infra-red. This data is then processed and corrected by the OMPS team to provide users with level 1 data for which noise, linearity and calibration problems are eliminated. OMPS differs from the GOMOS instrument, which scanned the limb, in that it uses a CDD detector to simultaneously image the full vertical dimension of the atmosphere.
2.2. Description of Lidar Data
The Network for the Detection of Atmospheric Composition Change (NDACC) is an international network of ground-based remote sensing stations around the world with a number of objectives (Kurylo and Solomon, 1990). The main objective is to monitor changes in stratospheric ozone and the parameters and components that affect its chemical balance at a number of strategic points, and to deduce changes and trends in atmospheric composition. It also aims to create a long-term database to validate the sensors in space. In the mesosphere, these reference data are sorely lacking, making it difficult to estimate trends (Beig et al., 2002). Lidar using molecular scattering is a well-suited technique for deducing a vertical temperature profile in the middle atmosphere (Hauchecorne and Chanin, 1980). The instrument located at the Haute-Provence Observatory has been used to validate a large number of instruments between 30 and 80 km altitude with 40 years of continuous measurements. These include missions such as UARS (Fishbein et al., 1996; Gille et al., 1996; Hervig et al., 1996; Singh et al., 1996; Remsberg et al., 2002, Wu et al., 2003; Keckhut et al., 2004, Ridolfi et al., 2007), ACE (Sica et al., 2008), MLS-Aura and SABER-TIMED (Sivakumar et al., 2011, Wing et al., 2018b). These observations can also be used to ensure continuity and connection between similar sensors successively in space, such as the SSU/NOAA series (Keckhut et al., 2011) or AMSU/NOAA (Funatsu et al., 2008, 2016). The quality of the NDACC lidar is insured by continuous on-site intercomparisons with a mobile instrument (Sing et al., 1996; Keckhut et al. 2004, Wing et al., 2018, 2020) and also software intercomparison (Leblanc et al., 1998) or using satellite observation as geographical transfers (Wild et al., 1995).
2.3. Description of the MSIS and ERA5 Reference Climatologies
MSIS is a climate model developed by the Naval Research Laboratory (NRL) which has recently been updated to version 2.0 (Emmert et al., 2021). It describes the mean behaviour of temperature, the density of numerous chemical species and mass density using an analytical formulation. In particular, it incorporates seasonal variations and fluctuations as a function of altitude, latitude and longitude. The main input data are the date in the year, the geographical coordinates and the altitude range used to obtain a vertical profile.
ERA5 is a hybrid analysis produced by the ECMWF (European Center Medium for Weather Forecast). It is based on meteorological fields provided by a single meteorological model and constantly guided by various global observations covering the last 7 decades. This analysis provides estimates of numerous atmospheric climate variables for each day. The data used is resolved over 137 levels, from the surface to around 80 km (Hersbach et al., 2020).
MSIS and ERA5 operate differently. MSIS covers a wider vertical range from 0 to 1000 km, while ERA5, with its 137 levels, is limited to the mesopause with a so-called ‘sponge’ region in its upper part in the mesosphere. ERA5 provides a wealth of information about the atmosphere, but here we are only interested in temperature, pressure and density profiles. Comparisons already carried out show very good agreement between lidars and meteorological analyses in the stratosphere, but major differences in the mesosphere (Marlton et al., 2021, Mariaccia et al., 2022).
3. Description of the Temperature Inversion Method
The inversion method based on molecular diffusion has been described in many previous works (Hauchecorne and Chanin, 1980; Clancy et al., 1994; Shepherd et al., 2001; Sheese et al., 2012; Hauchecorne et al., 2019; Chen et al., 2023) and is based on the law of perfect gases linking temperature, atmospheric density and pressure and the law of hydrostatic equilibrium linking density and pressure. This method has been widely used for the lidar temperature measurement technique (Hauchecorne and Chanin, 1981). The quality of these observations is mainly due to the quantity of light collected. It should be remembered that the scattering signal observed at the limb from space decreases with the altitude of observation due to the decrease in molecular density. At a certain altitude, this signal becomes small compared to instrumental artifacts. One of the sources of uncertainty lies in the initialisation at the top of the profile, the estimation of noise and therefore the quantity of photons collected, which determines the accuracy of the measurements (Keckhut et al., 1993). The part below 30 km is not used during processing because it is potentially polluted by ambient aerosols and particles (Khaykin et al., 2017). In addition to inversion, measurements from space need to take account of the fact that scattering occurs over the entire light path and that the line of sight passes through different atmospheric layers in different proportions. In order to assess the best spectral range, it is necessary to evaluate the impact of the different components on the inversion according to the different wavelengths available through OMPS and to assess the quality of these correction.
3.1. Initialization Altitude and Stray Light Correction Calculation
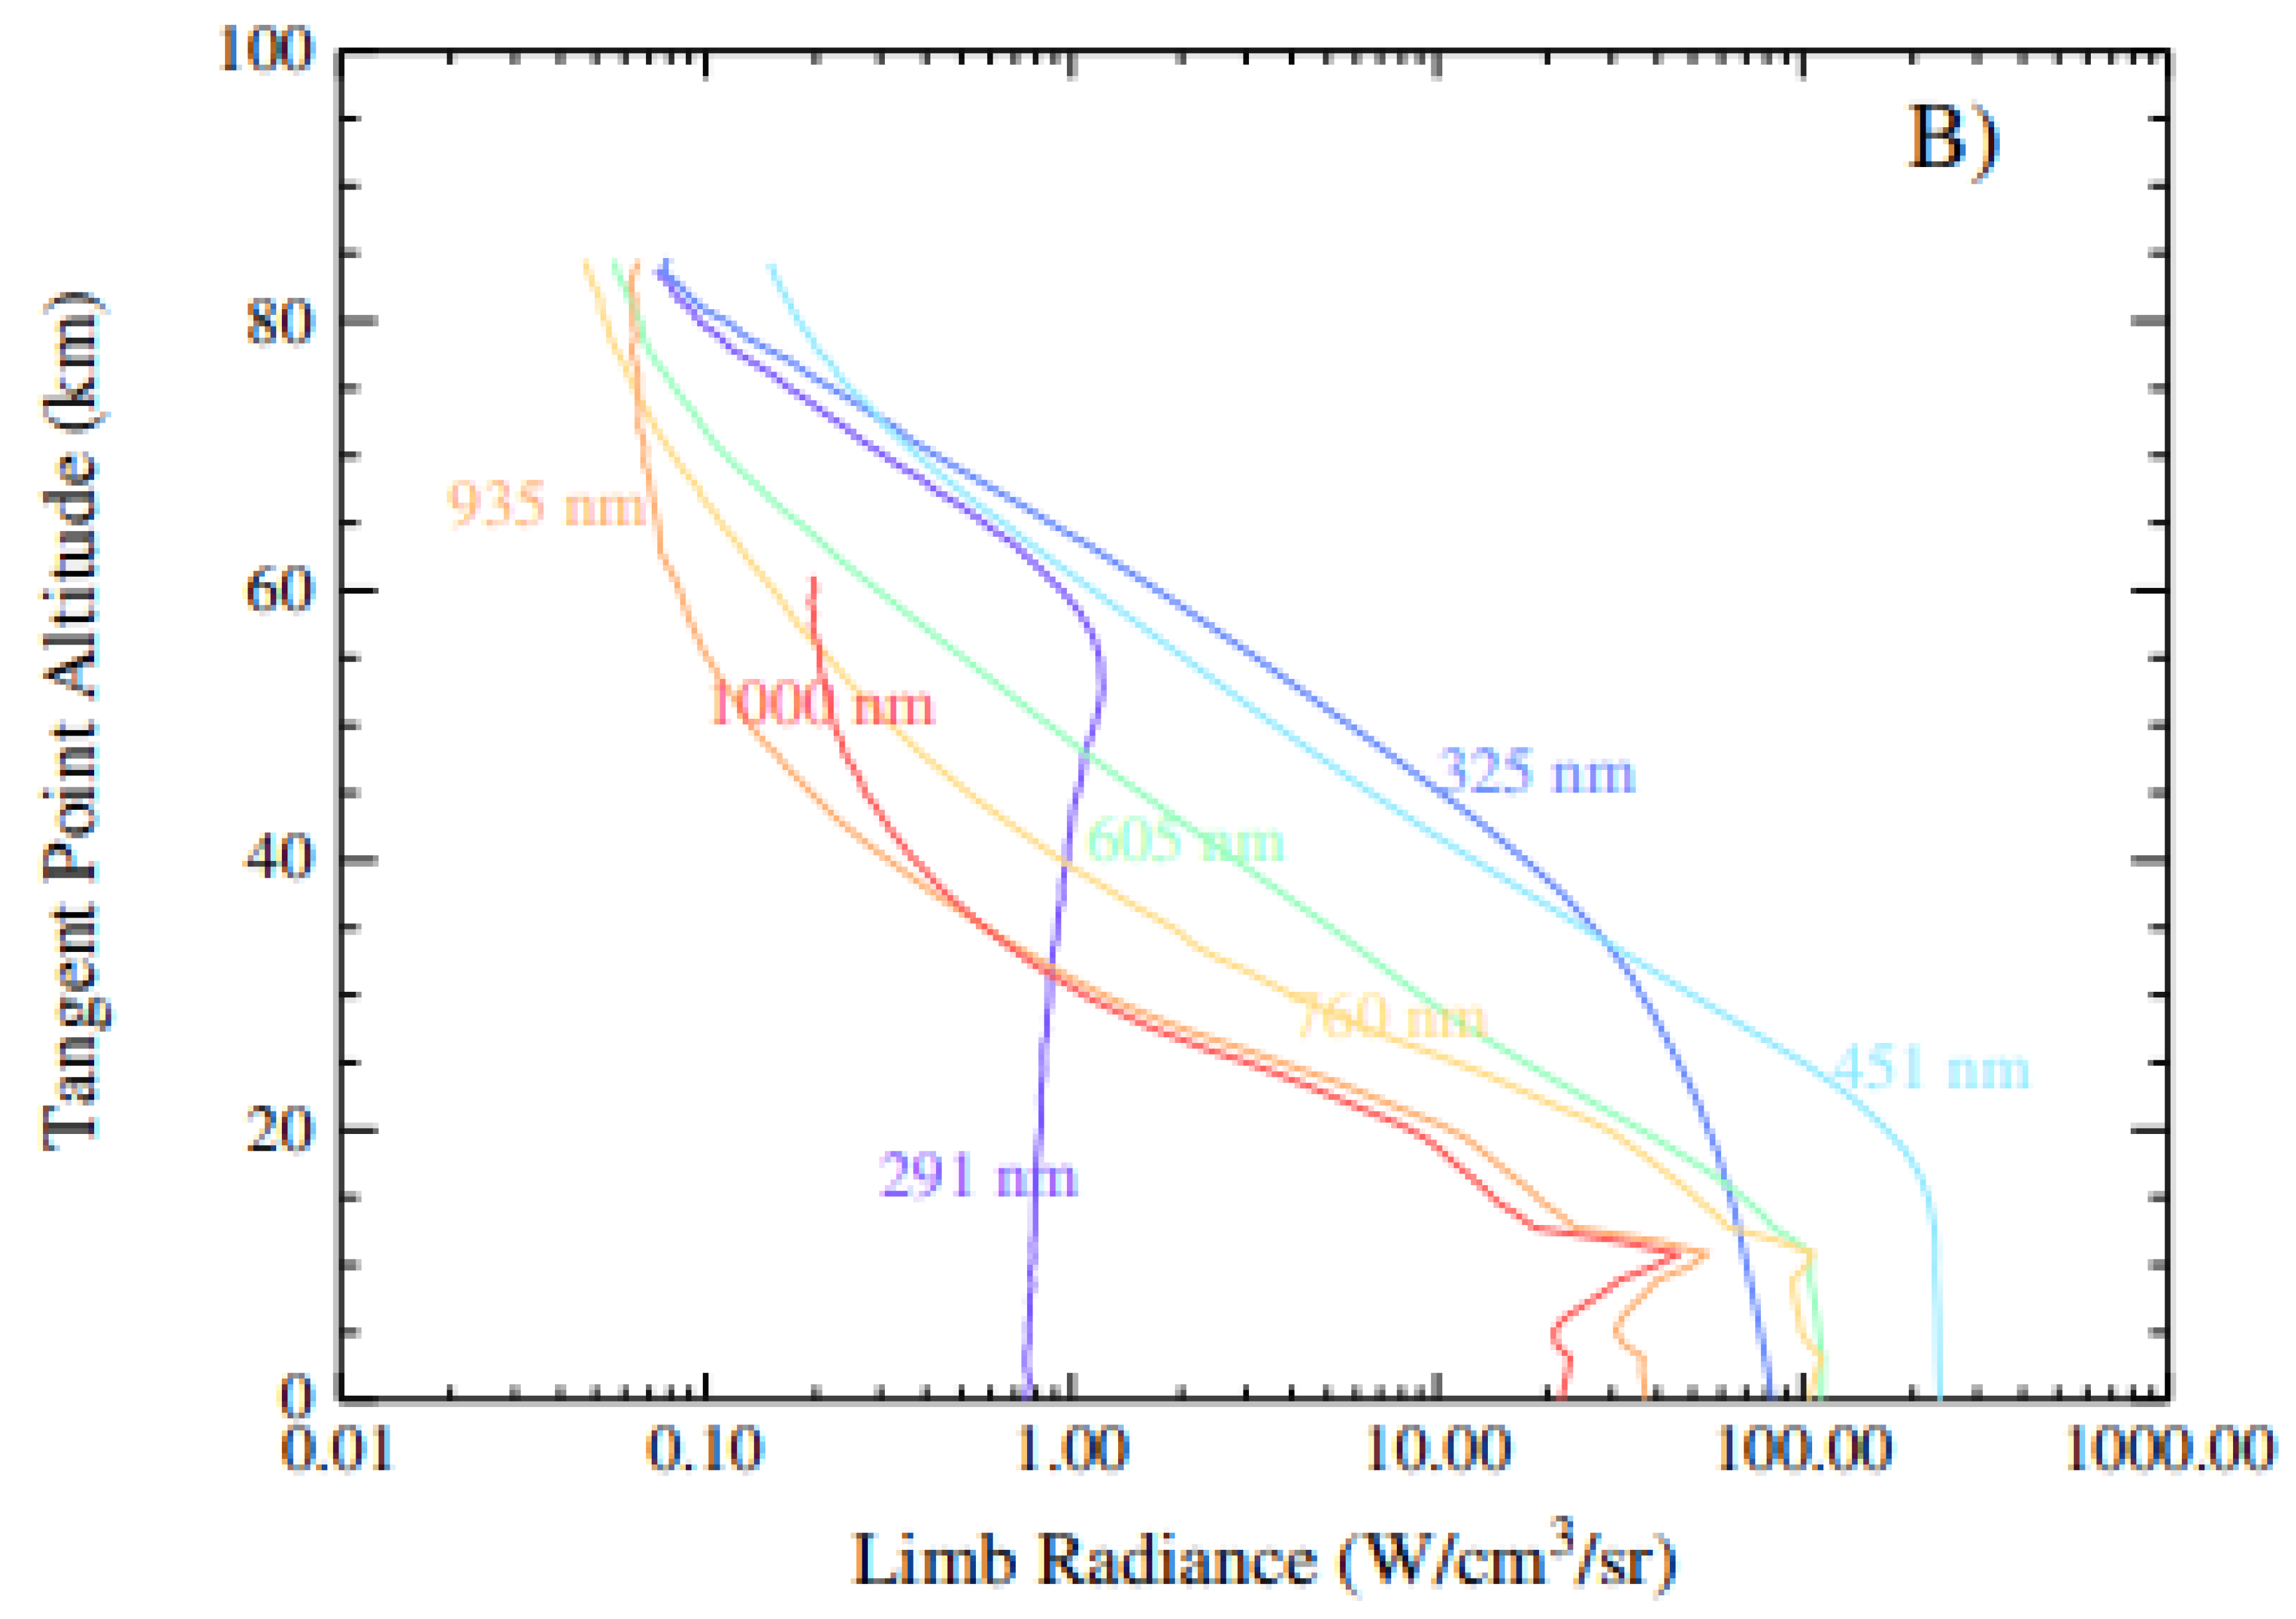
The NASA teams involved in processing the raw OMPS signals estimate only electronic noise, not including other sources of noice or instrument error. Lidar analyses have shown us that these operation are extremely sensitive if even a weak signal remains in the altitude range where noise is estimated (Keckhut et al., 1993). This is made even more critical in the case of the OMPS instrument by the fact that the altitude range is limited to 83.5 km where molecular scattering may be still present in the signal at the highest altitudes. The first step in the process is therefore to establish the altitude range for the inversion, and in particular the initialization altitude (known as the init altitude). This is set at the moment when the radiance measured at the upper layer becomes greater than the radiance measured at the lower layer. We consider that we are in the noise domain when this happens, and the init altitude is set at the lower altitude. In order to estimate the stray light correction we compare the signal from the MSIS model with the observations. We simulate a radiance profile from the MSIS density profile. We calculate a constant signal to remove or add to the signal to obtain the same slope in the simulated MSIS and OMPS radiance profiles in the last 5 kilometres.
The stray light level is therefore estimated using the formula given below:
This new stray light correction is more or less effective depending on the wavelength range. In the visible range in particular, residual scattering must be estimated, otherwise significant differences of up to around 150 K can be observed above 70 km (
Figure 1).
3.2. Onion Peel Method
As mentioned above, the OMPS team provides an integrated radiance profile with 1-km vertical resolution, i.e. the radiance measured on the line of sight is affected by the upper layers. In order to correct for the contribution of the other layers, we apply the so-called ‘onion peel’ technique, which allows us to obtain the radiance value of each layer by ‘removing’ the layers above it:
This method assumes that the atmospheric layers are homogeneous over the viewing distance. It gives excellent vertical resolution (of the order of a km) but does not provide information on horizontal variability better than a few 100 km as a function of altitude (
Figure 10).
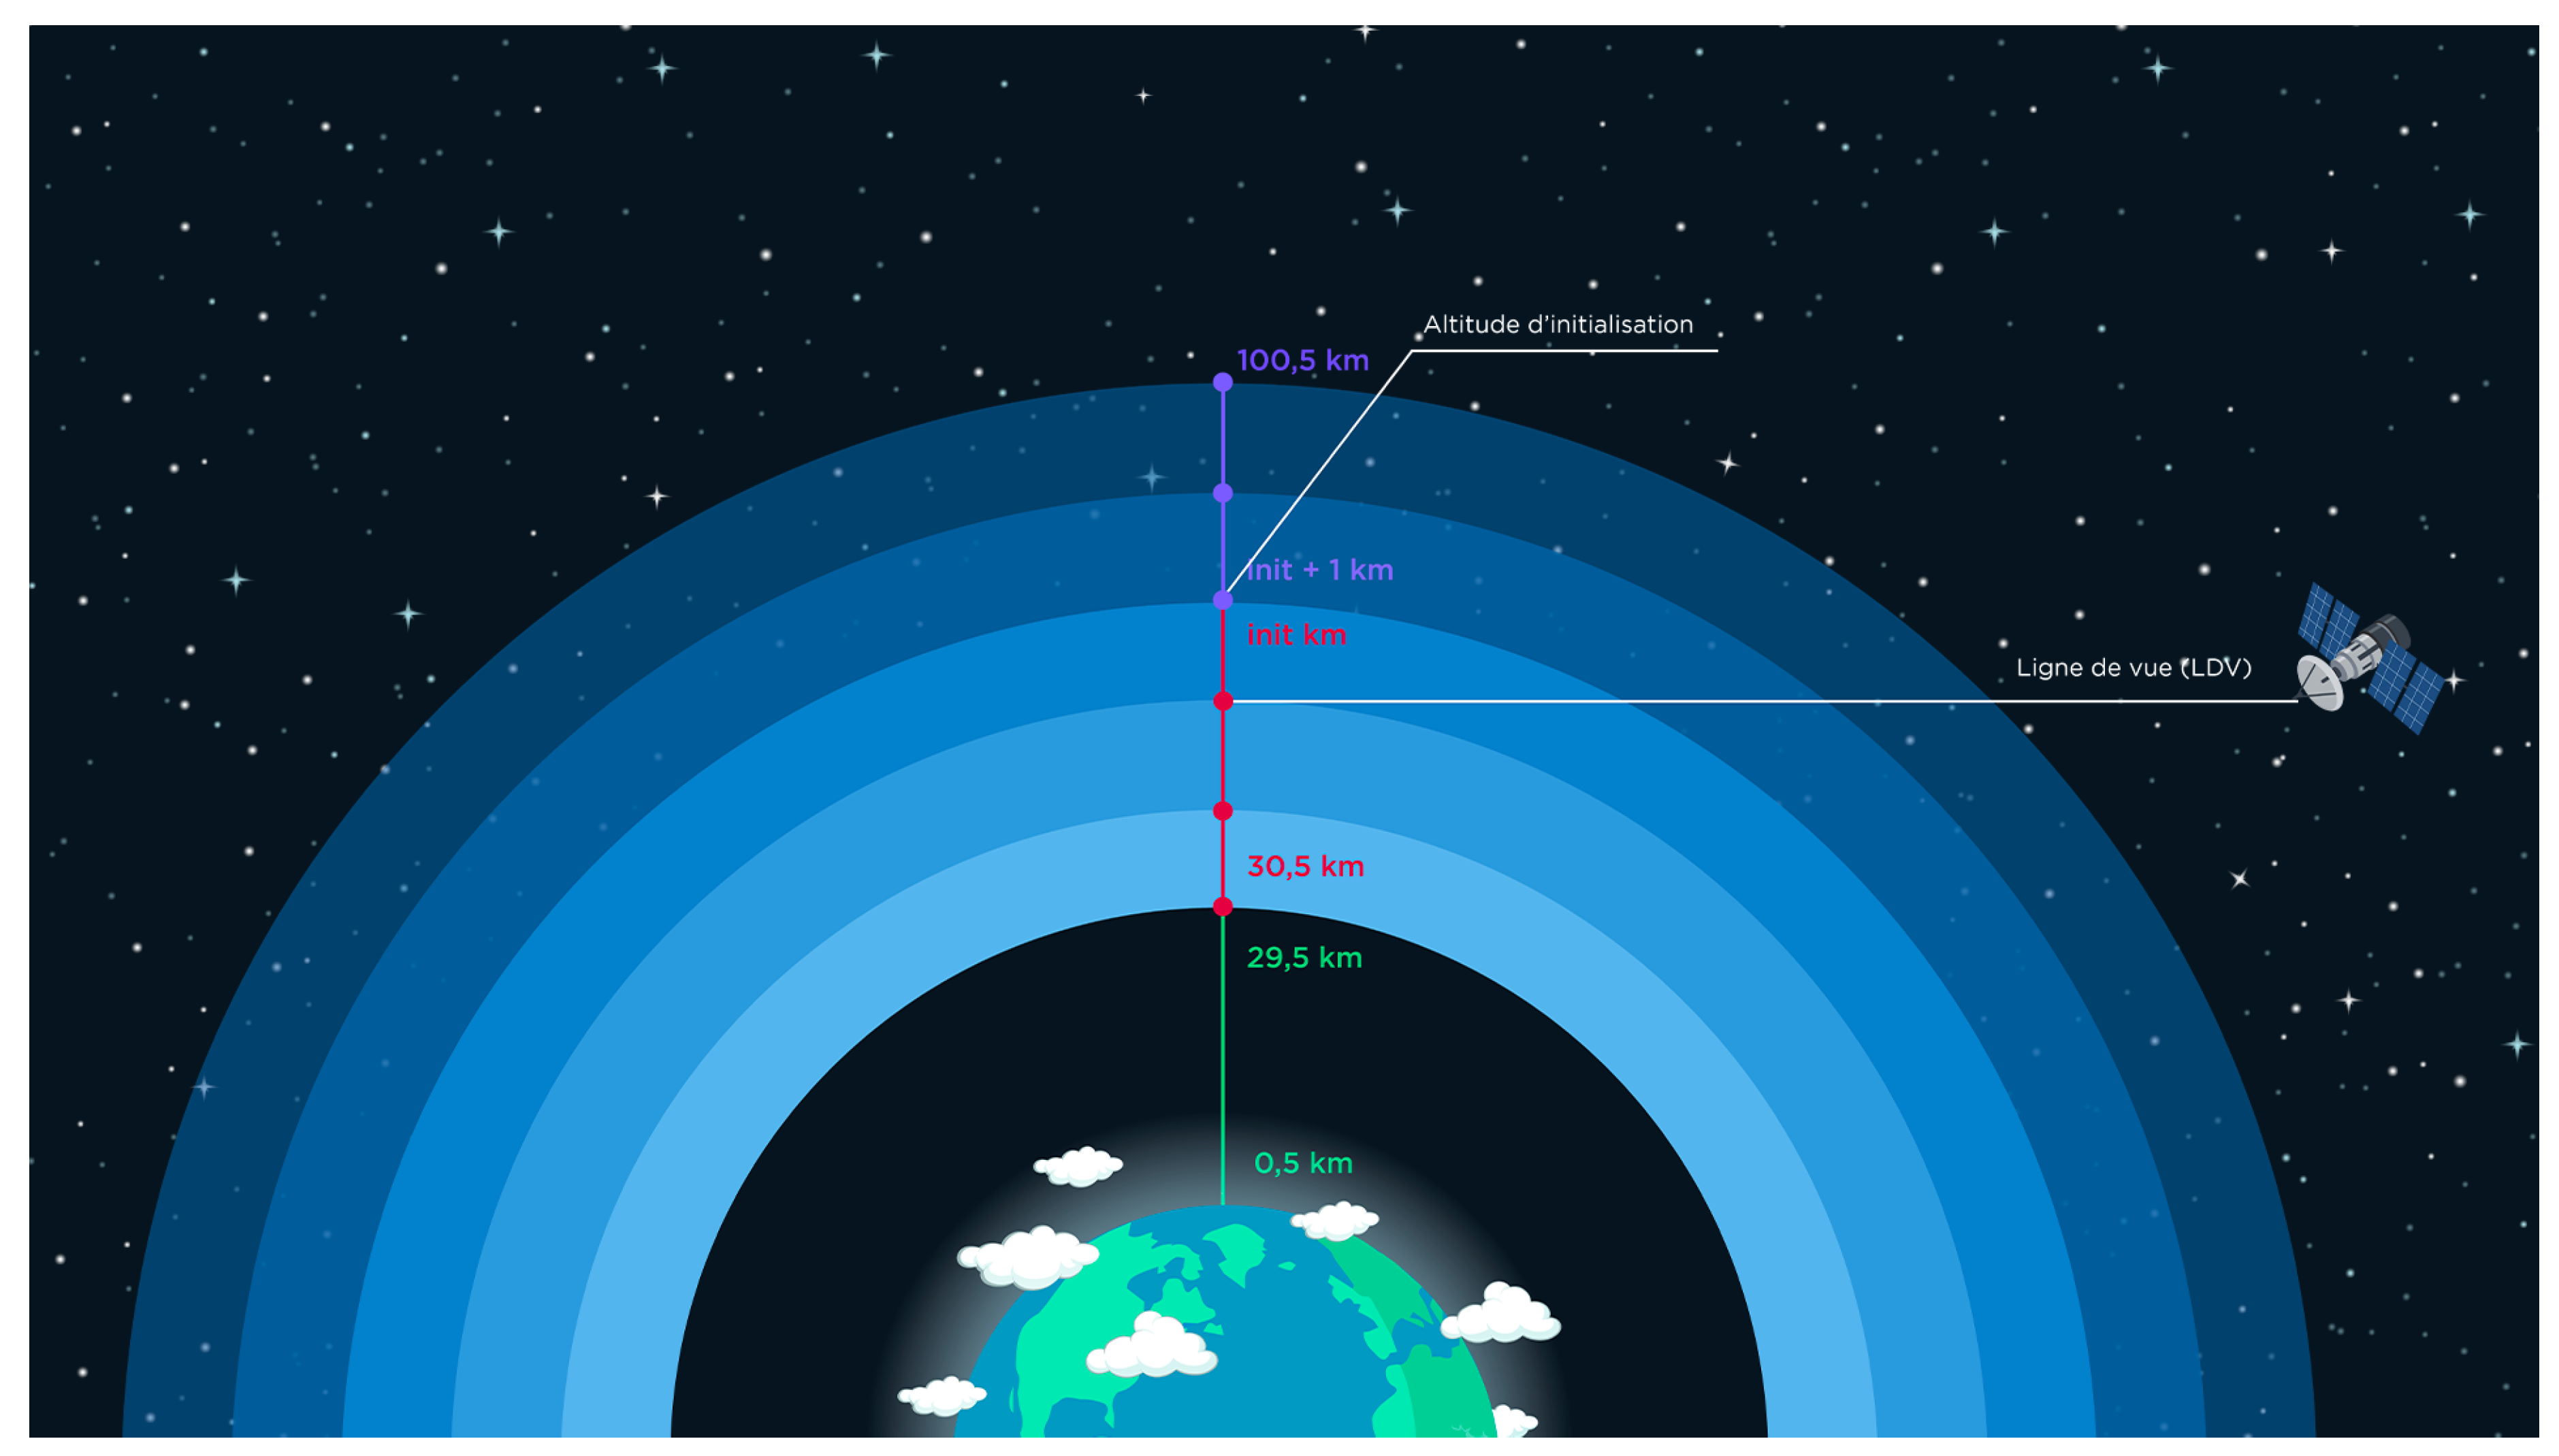
Figure 2.
As indicated in
Section 2.1, the green part of the profile is unused, the red part is the profile measured by OMPS and the violet part is simulated using an inverse exponential thanks to the red part. The initialisation altitude marks the ‘boundary’ between these 2 parts.
Figure 2.
As indicated in
Section 2.1, the green part of the profile is unused, the red part is the profile measured by OMPS and the violet part is simulated using an inverse exponential thanks to the red part. The initialisation altitude marks the ‘boundary’ between these 2 parts.
3.3. Observation Geometry for OMPS Layers
Sunlight entering the instrument is attenuated by the absorption of constituents. In the UV/Visible spectral range, it is mainly O3 and NO2 that cause a reduction in the radiance of the layers observed, particularly around areas where the constituent is in high concentration, in our case the stratosphere. Similarly, molecular scattering (known as Rayleigh scattering) diffuses photons via the molecules encountered, thus reducing the signal received, particularly towards the lowest layers where the density of the air increases. It is therefore necessary to evaluate the distance of each path in order to apply a reduction corresponding to the concentration of the component in the layer under consideration.
By performing the calculation for the highest layer, it is possible to estimate the signal reduction for the layer below, and thus to obtain the calculation for the entire vertical profile. This method assumes that the layers are homogeneous in their composition.
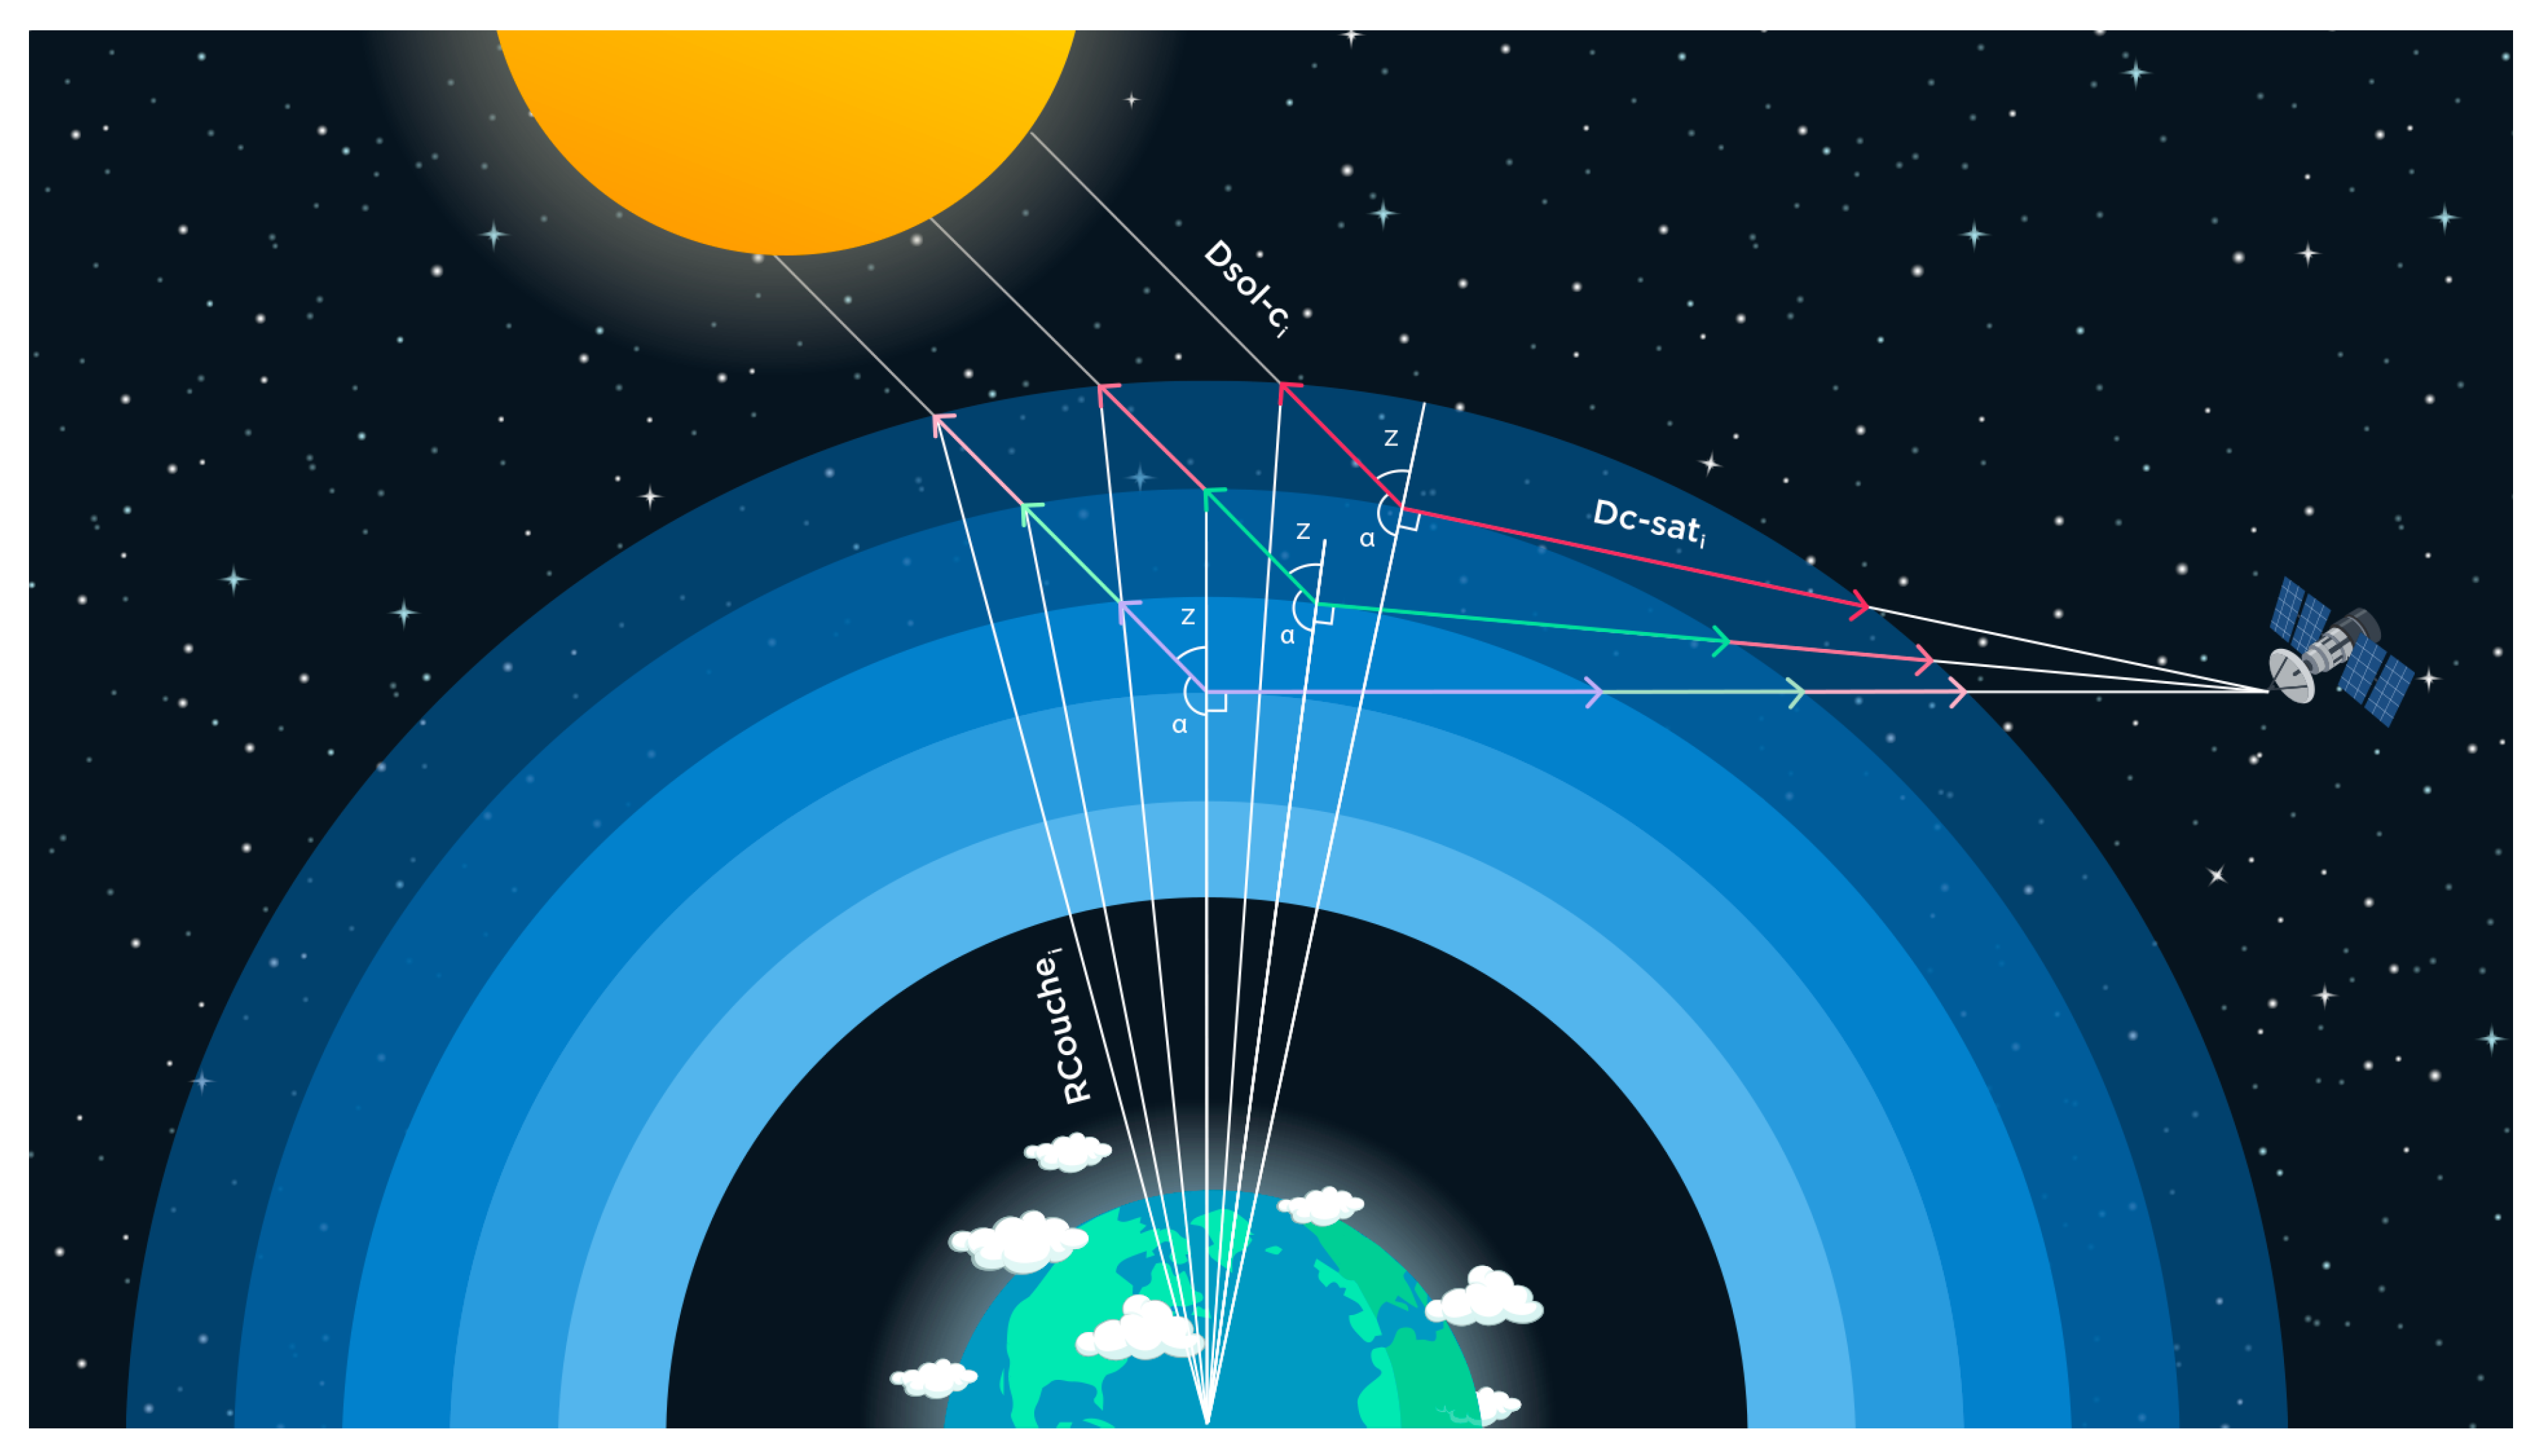
Figure 3.
This diagram illustrates the path taken by the radiance in each layer observed by OMPS. At each layer, the radiance is scattered by air molecules and absorbed by ozone and nitrogen dioxide molecules. represents the radius from the Earth to the given layer, and represents the distance that the radiance in layer i crosses to reach the satellite. Similarly, represents the distance traveled by the radiance arriving from the sun to the layer.
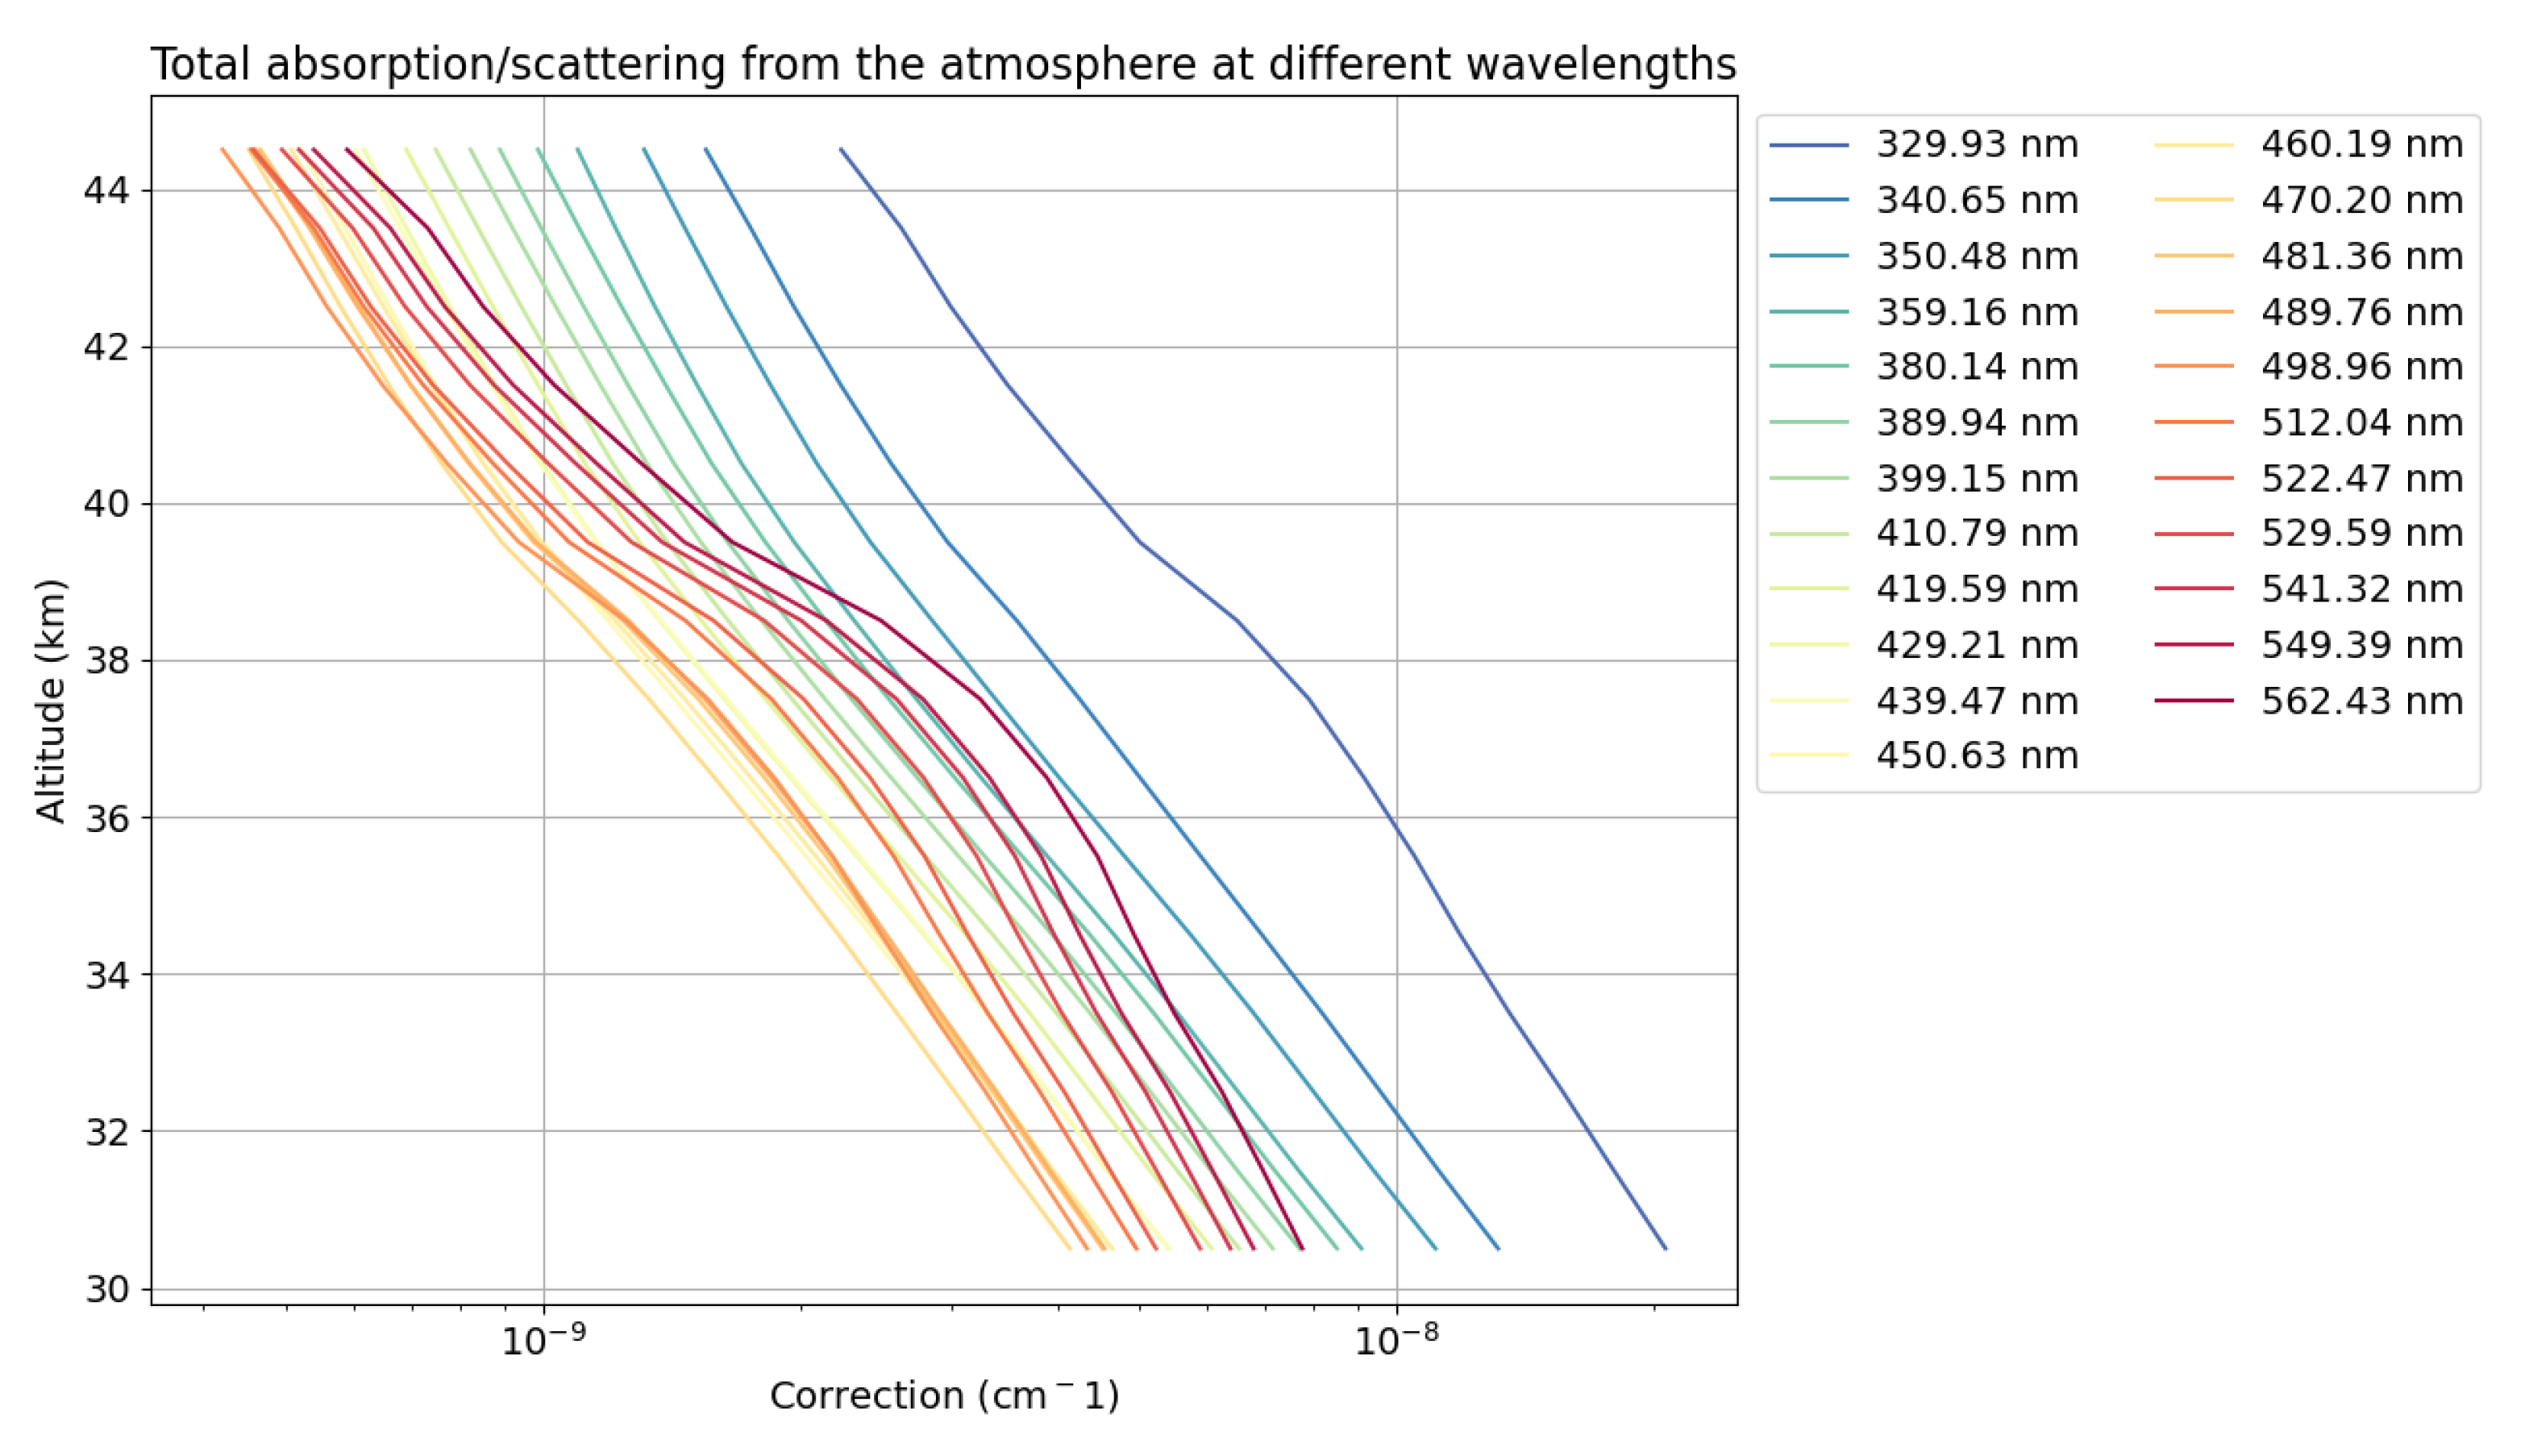
Once the distance matrix has been obtained and using modelled density profiles, modelled NO2 profiles and O3 profile measurements, we can measure all the radiance loss that applies to each observation path. The first thing we notice is that between km 45 and km 30 the total correction that must be applied to the profile to correct it is almost multiplied by 10, whatever the wavelength (
Figure 4).
Next comes the wavelength correction difference. From around 330 nm to 420 nm, the total attenuation of the signal decreases to a minimum as we leave the Huggins absorption band for O3 and Rayleigh scattering also decreases. From 420 nm onwards, despite the fact that Rayleigh scattering continues to fall, we see an increase in the total attenuation of the signal. This is due to the fact that we are entering the Chappuis absorption band for O3. The NO2 correction remains more or less constant throughout the spectrum of the study, with a slight increase up to around 400 nm and then a slight constant decrease. Once again, depending on the wavelengths chosen, the total correction of the profile required is almost multiplied by 10 when taken at the same layer (
Figure 4).
3.4. Diffusion and Absorption of the Various Constituents of the Middle Atmosphere
3.4.1. Rayleigh Scattering
Since our initial hypothesis assumes Rayleigh scattering of the atmosphere above 30 km, we can use the molar mass of the air to find the number of ‘Rayleigh’
molecules in each layer of the atmosphere:
with :
The Rayleigh scattering per molecule is given by the formula below (Bucholtz, 1995):
and
allow us to find the total Rayleigh scattering of a layer :
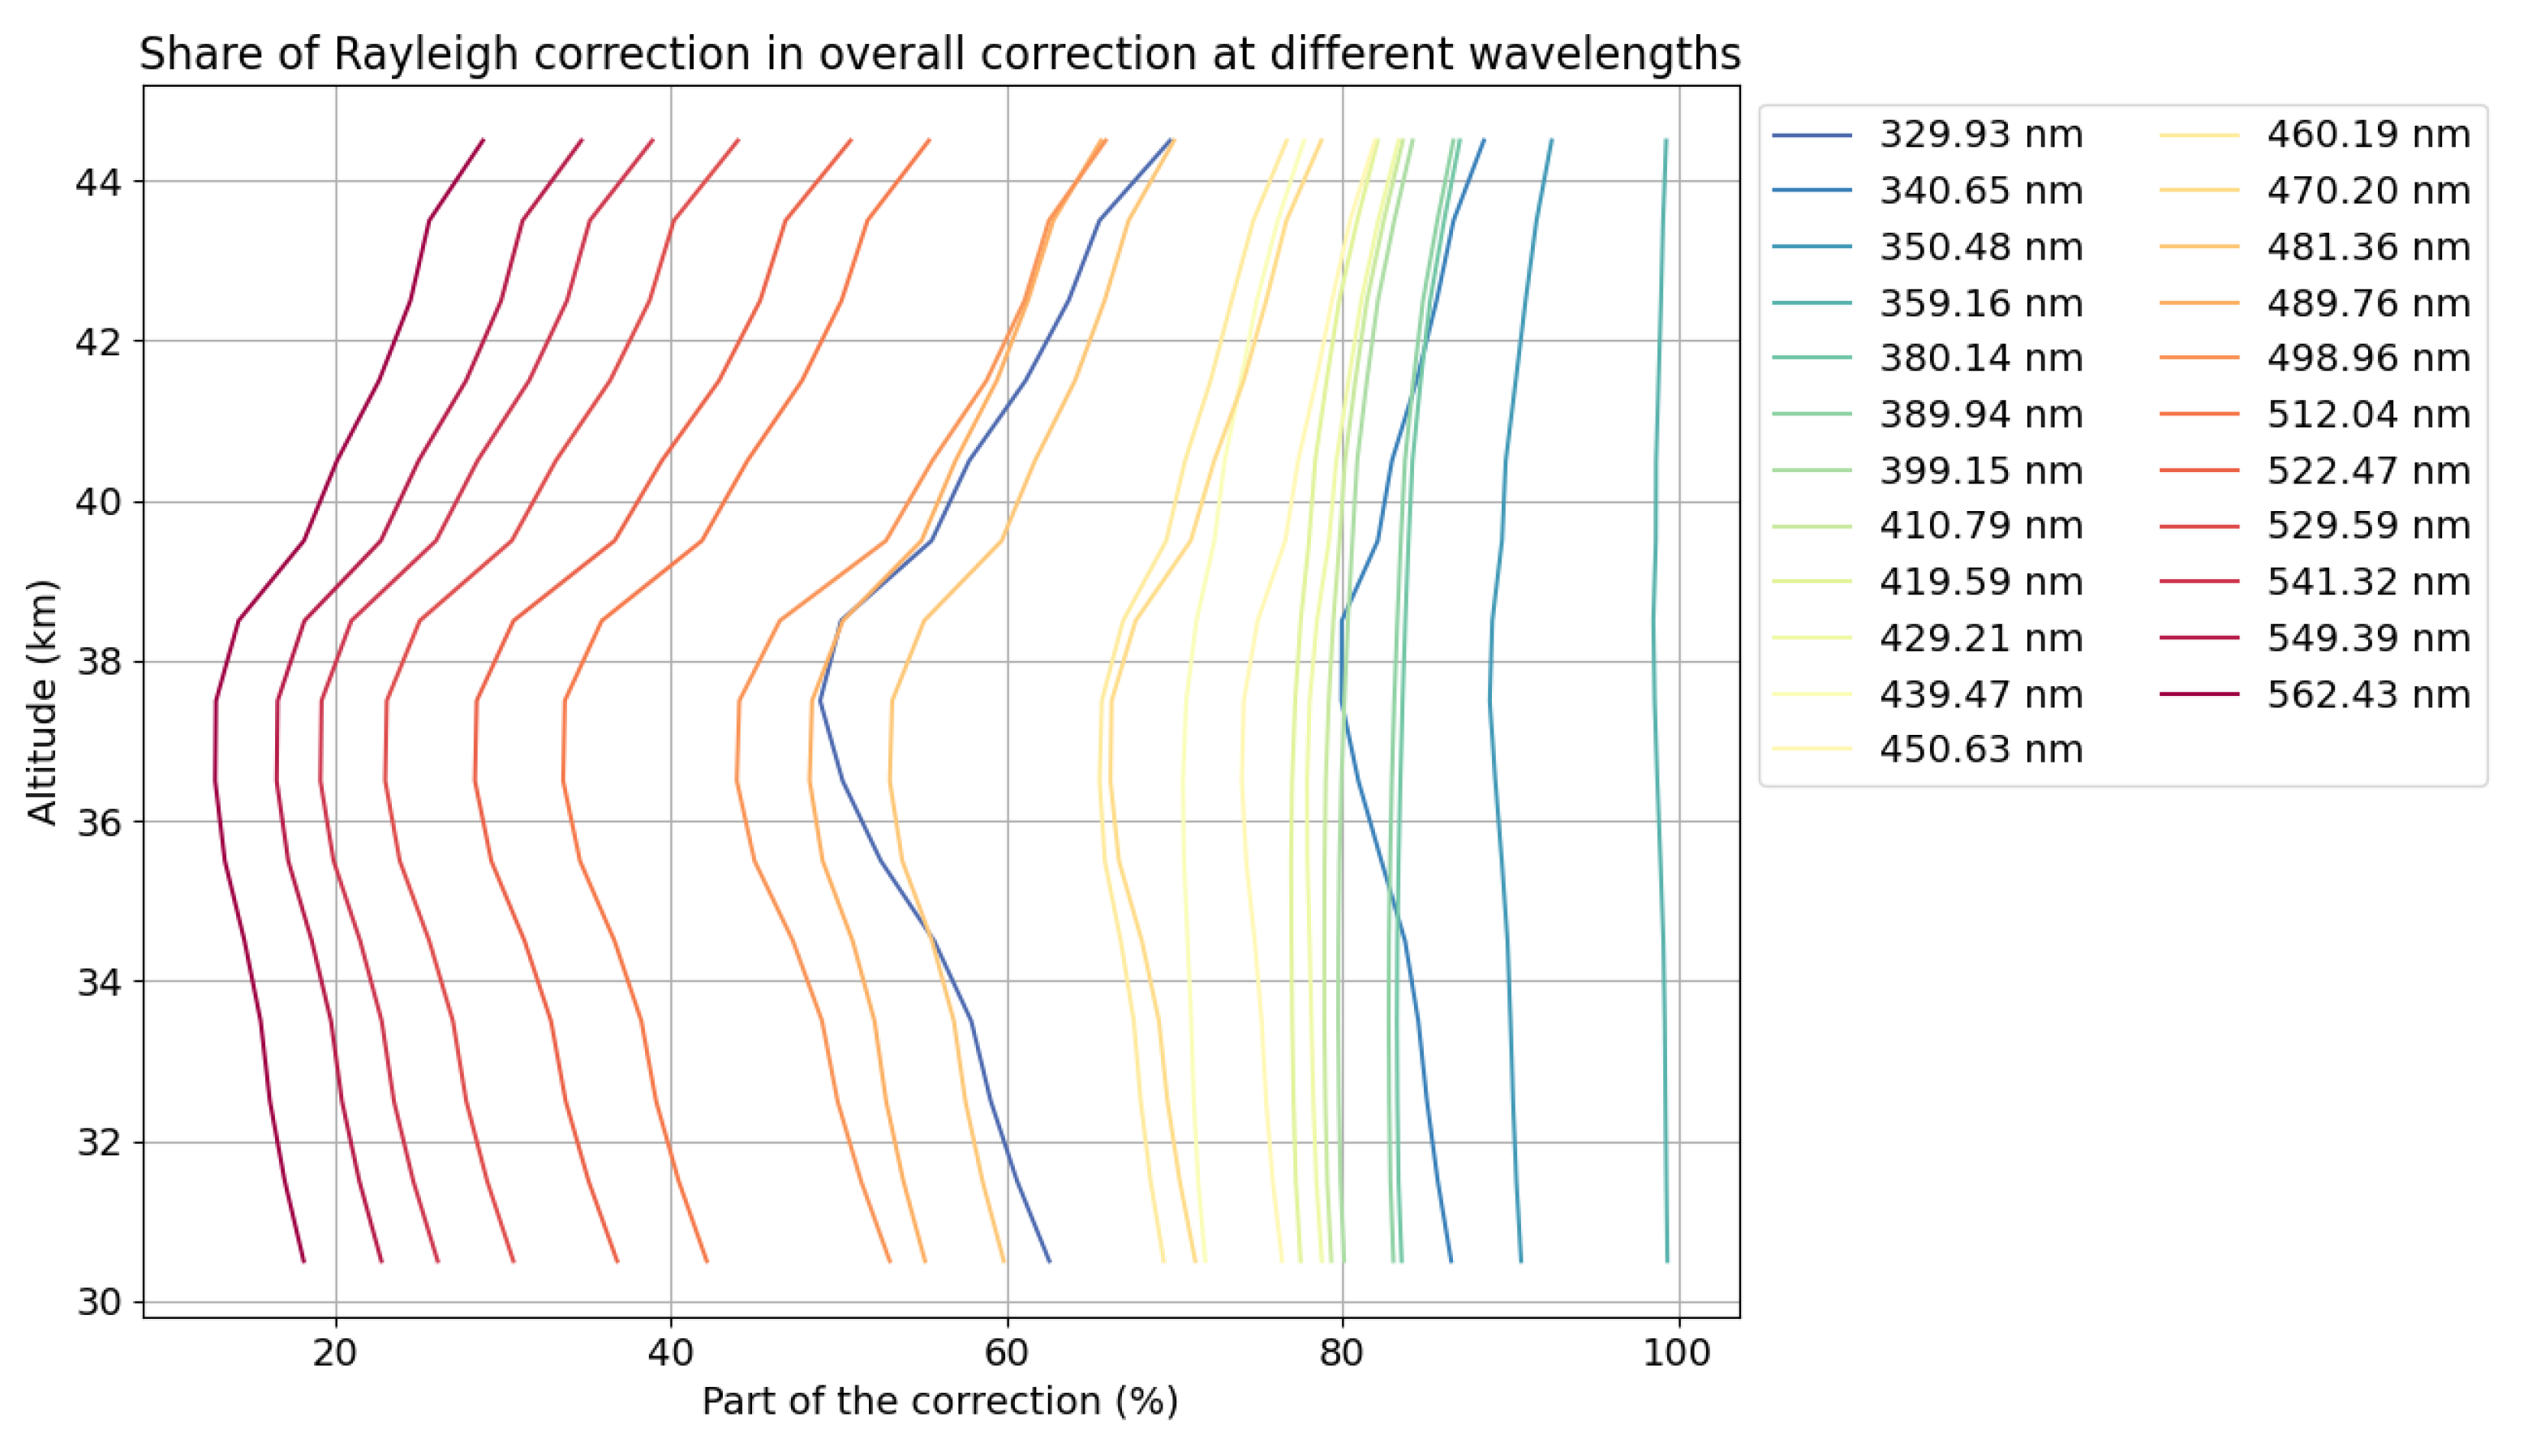
From around 330 to 380 nm, the Rayleight correction’s contribution to total signal attenuation increases to almost 100%, and at these wavelengths it is the greatest source of error. After 380 nm its share gradually decreases, giving way to O3 and NO2 absorption (
Figure 5).
3.4.2. Ozone Absorption
O3 absorption is measured in the laboratory for a given wavelength and temperature (
) (Serdyuchenko et al., 2014). The number of
molecules is measured by the same instrument that measures OMPS radiance profiles (Kramarova et al., 2018). With these 2 values, we obtain the ozone absorption for each layer measured by OMPS:
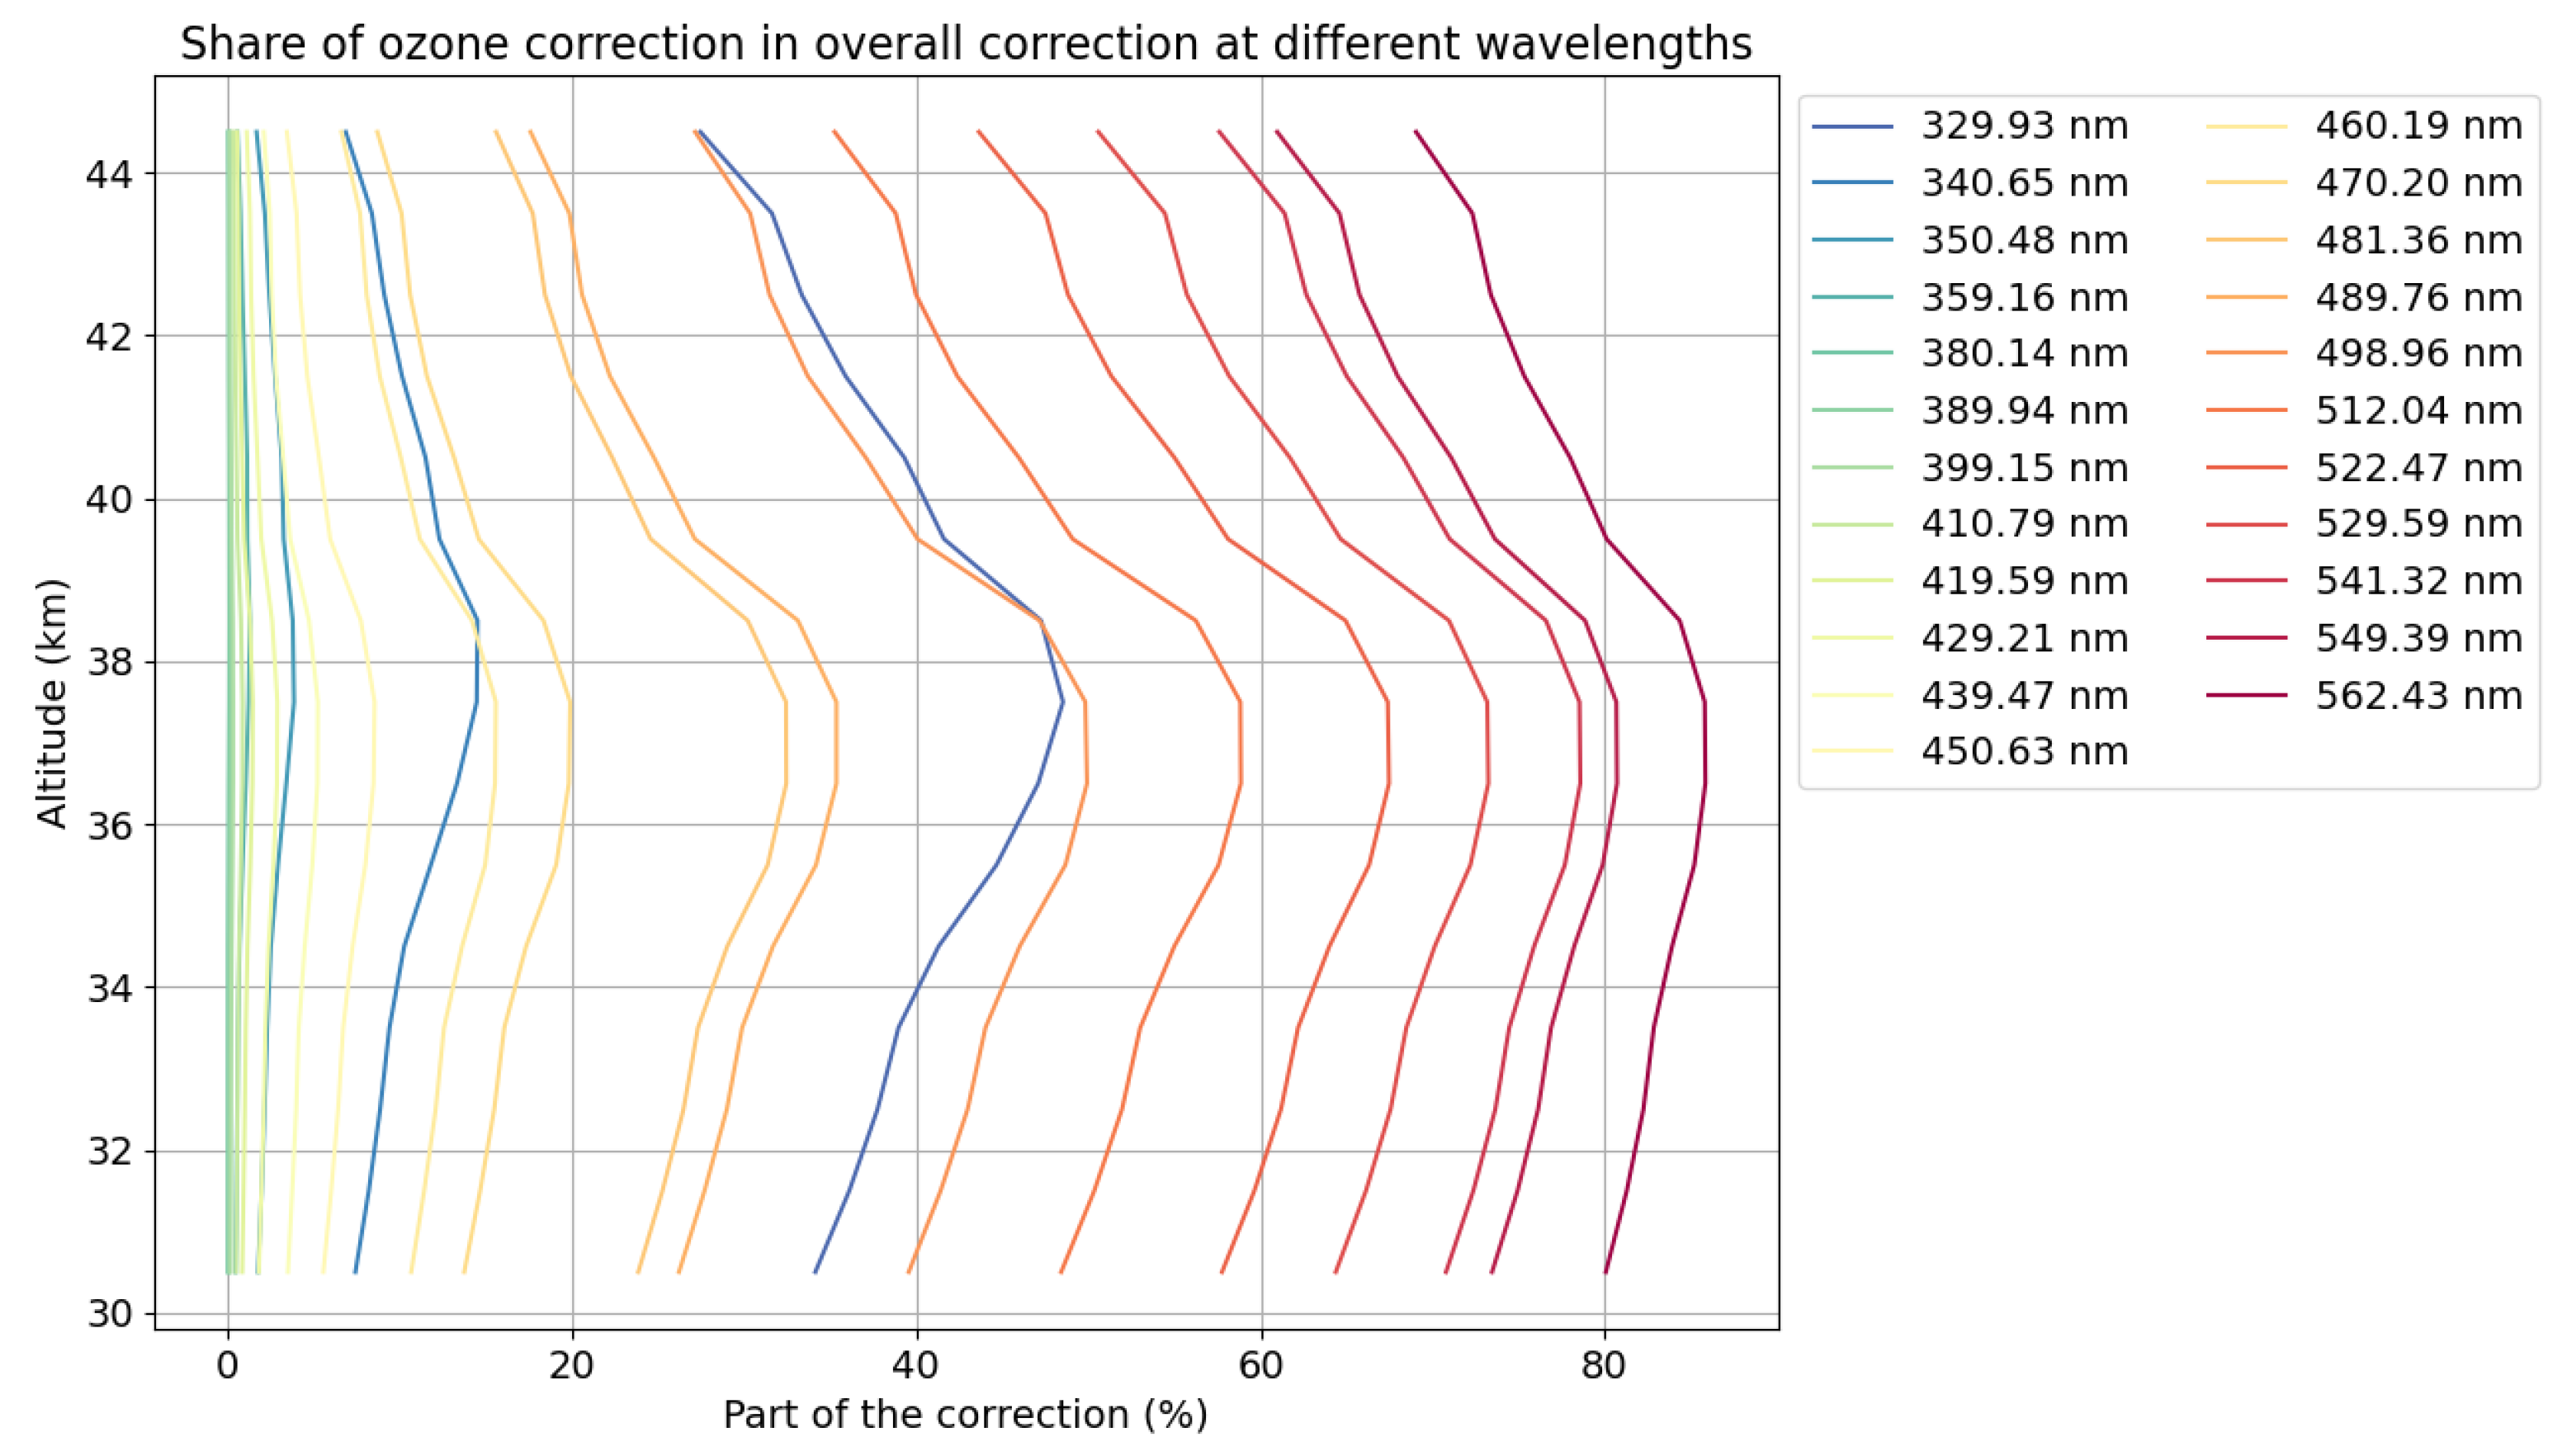
For O3, the effects of the Huggins-Chappuis absorption bands can be seen in the total attenuation of the signal. In the Huggins absorption band, the O3 absorption accounts for a large part of the correction (up to 40%) but as Rayleigh scattering is also very strong at these wavelengths, it is not the most important part of the correction. The proportion then decreases to almost 0% between the 2 absorption bands. Once the start of the Chappuis band is reached, it increases again until it reaches 80%, becoming the largest source of error. It should be noted that the Huggins and Chappuis absorption bands are extremely similar in absorption values, the difference being that Rayleigh scattering is much weaker in the Chappuis band (
Figure 7).
3.4.3. Nitrogen Dioxide Absorption
NO2 absorption is also measured in the laboratory for a given wavelength and temperature (
) (Bogumil et al., 2003). Variations in NO2 concentration are given by the WACCM model (Whole Atmosphere Community Climate Model (Kyrölä et al., 2018)) which is a climate modelling software package developed to study and simulate the complex large-scale interactions between different components of the Earth’s atmosphere, The profiles given are monthly profiles. With these 2 values, we obtain the absorption of Nitrogen Dioxide for each layer modelled by WACCM :
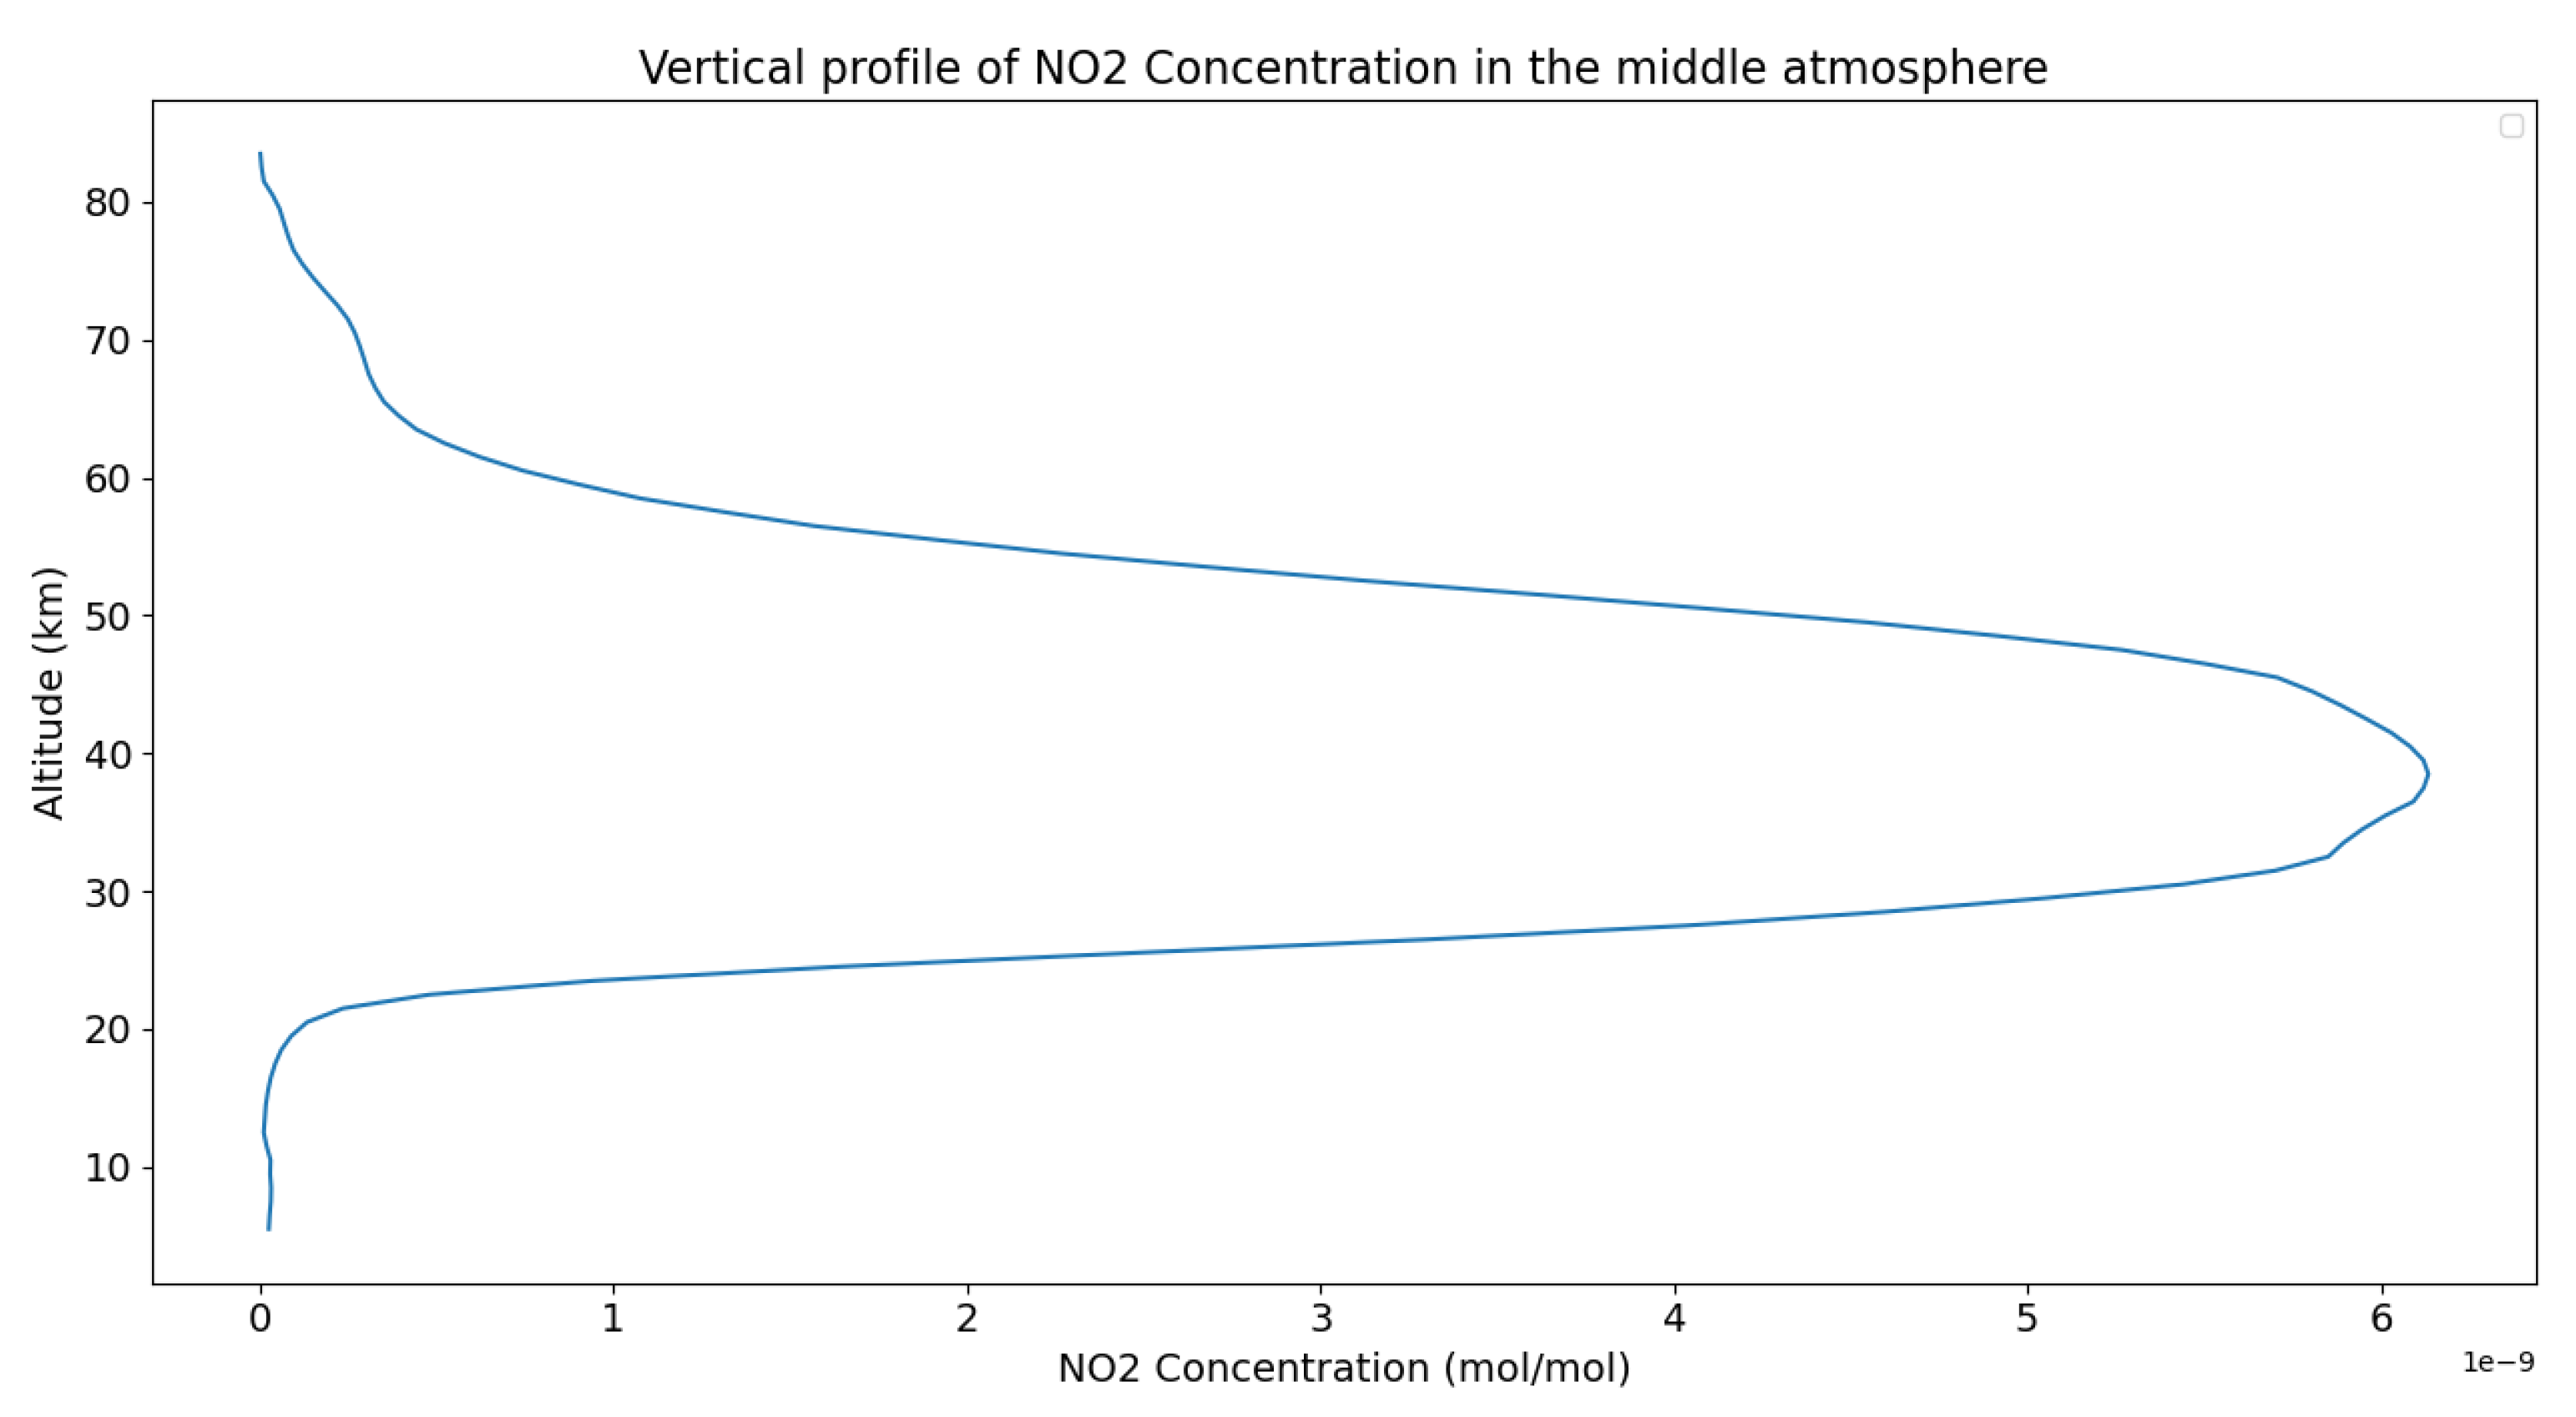
Figure 8.
Example of a NO2 profile in the middle atmosphere
Figure 8.
Example of a NO2 profile in the middle atmosphere
NO2 absorption varies little compared with O3 absorption and Rayleigh scattering in our study area, so the main cause of variation in its share of total signal attenuation comes from the variation in O3 absorption and Rayleigh scattering (
Figure 9).
3.5. Correcting the Attenuation of Radiance Profiles
The total attenuation of the sign as seen in part 3.4, coupled with the light paths calculated in part 3.3, enables the radiance profile to be corrected:
Now that we have corrected for the loss of radiance caused by Rayleigh scattering, O3 and NO2 absorption during the layer-to-satellite ‘path’, we need to correct for the same loss caused during the sun-to-layer ‘path’. First we calculate the Rayleigh phase function (Chandrasekhar , 1950) at our scattering angle :
with :
We then calculate the angular volume diffusion coefficient :
(Note that variations in the zenith angle are negligible, so we will keep the z measured throughout the profile).
As with the layer-satellite ‘path’, the sun-layer ‘path’ also generates radiance losses caused by the combination of the observation geometry and Rayleigh scattering, O3 and NO2 absorption. According to al-Kashi’s theorem, we can write :
with :
As with the layer-satellite path, this matrix continues until the last layer where the treatment is applied, allowing the profile to be corrected.
The newprofil4 and newprofil3 are the radiance profiles received by each layer, but we want the radiance profile that should have been measured by the satellite, so we need to make this last calculation:
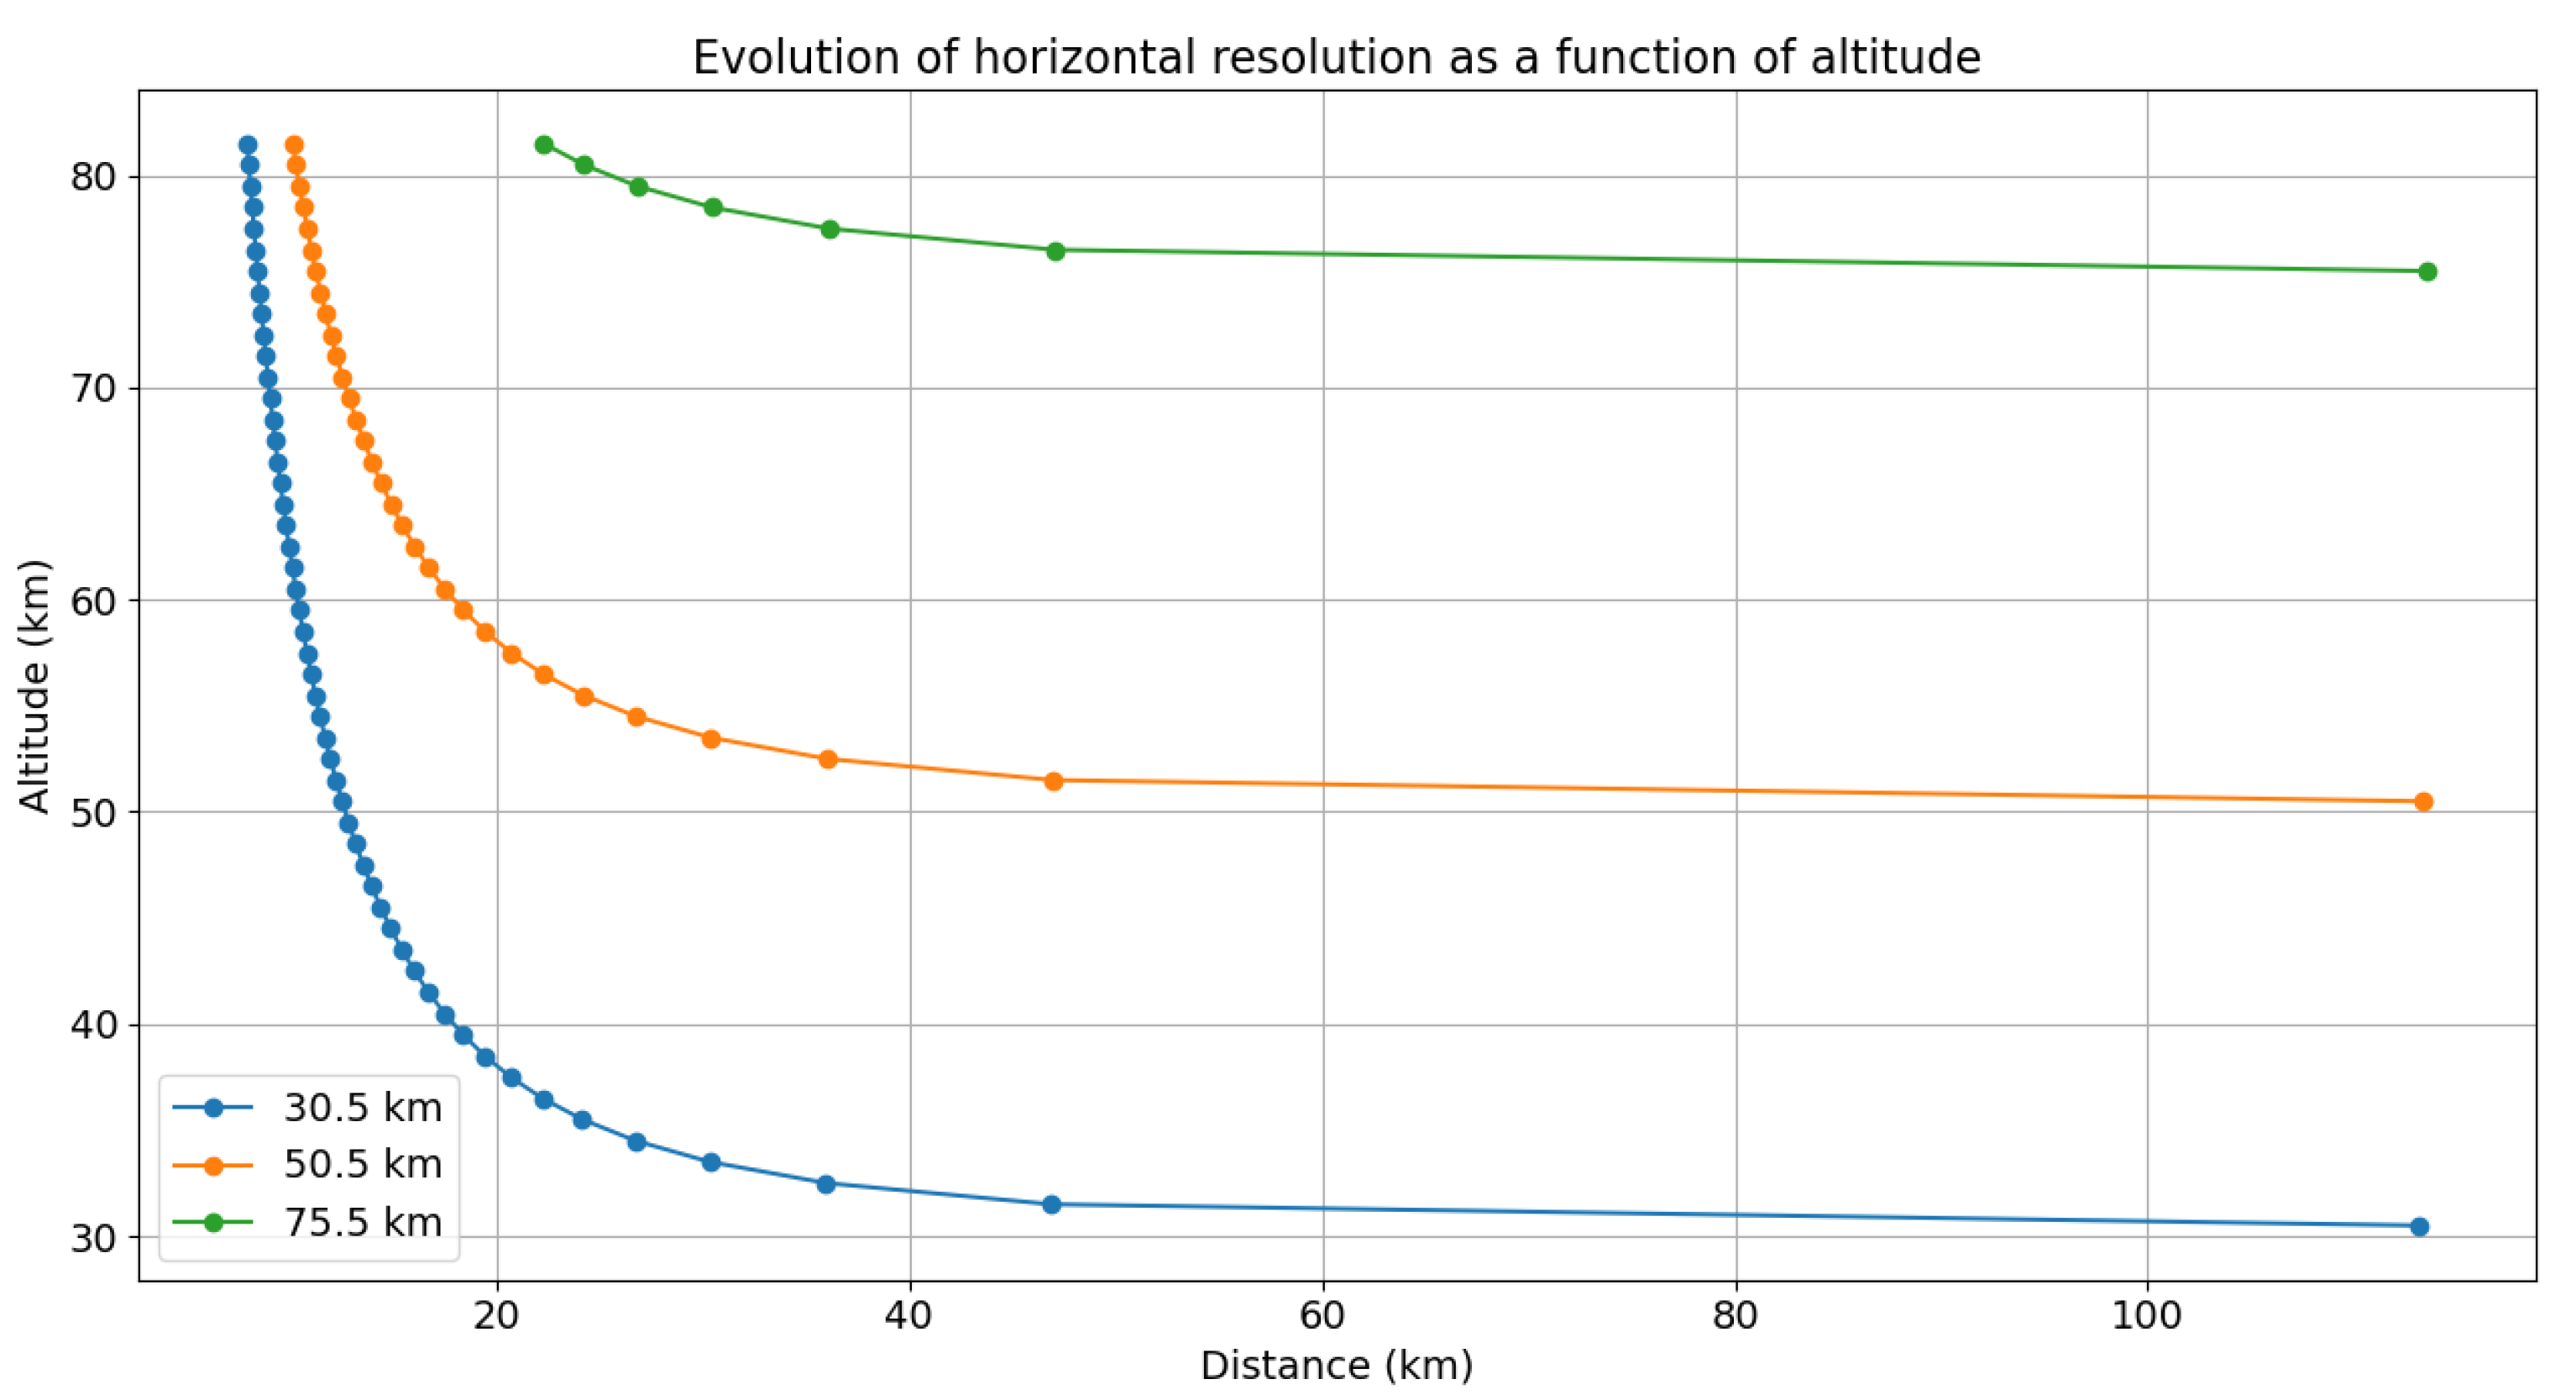
Calculating these 2 paths gives us the horizontal resolution of the instrument. This resolution changes with altitude, but always reaches a maximum at around 110 km, as shown in the figure below:
Figure 10.
Representation of the horizontal resolution for three tangent heights, each point represents a layer measured by OMPS
Figure 10.
Representation of the horizontal resolution for three tangent heights, each point represents a layer measured by OMPS
Figure 11.
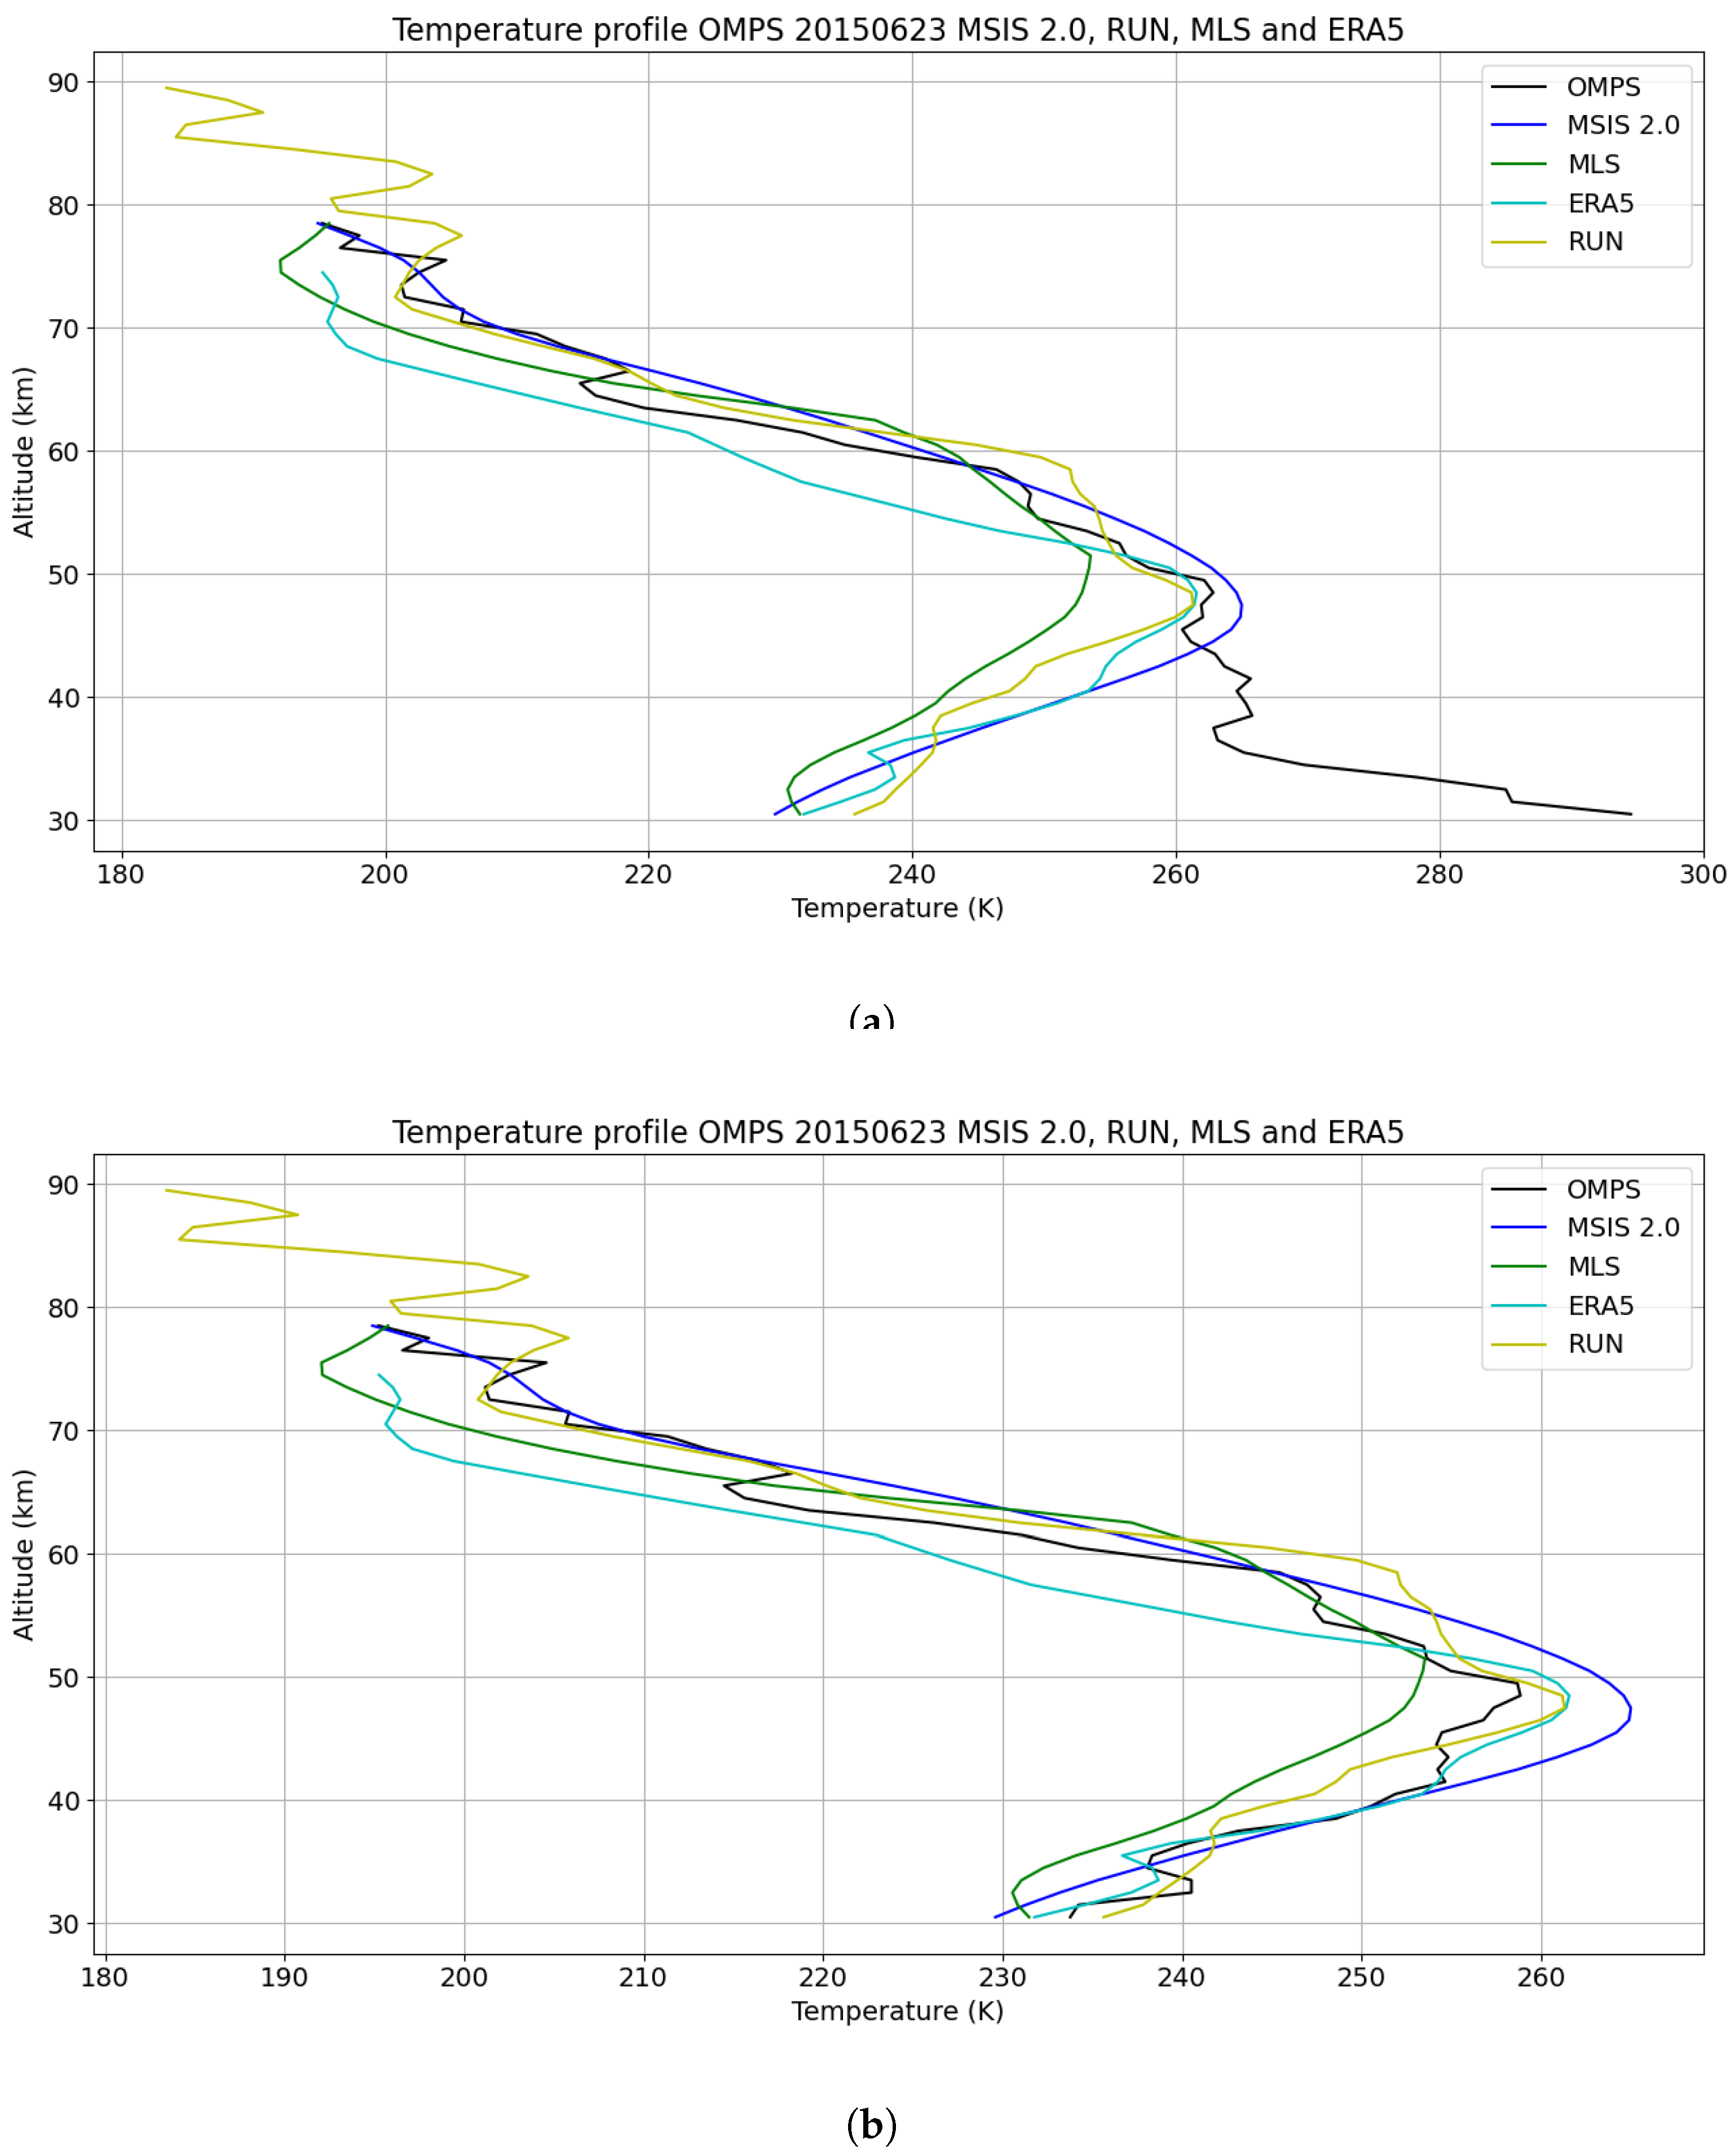
(a) Temperature profile obtained without correction of the radiance profile, (b) the same temperature profile after correction of the radiance profile.
Figure 11.
(a) Temperature profile obtained without correction of the radiance profile, (b) the same temperature profile after correction of the radiance profile.
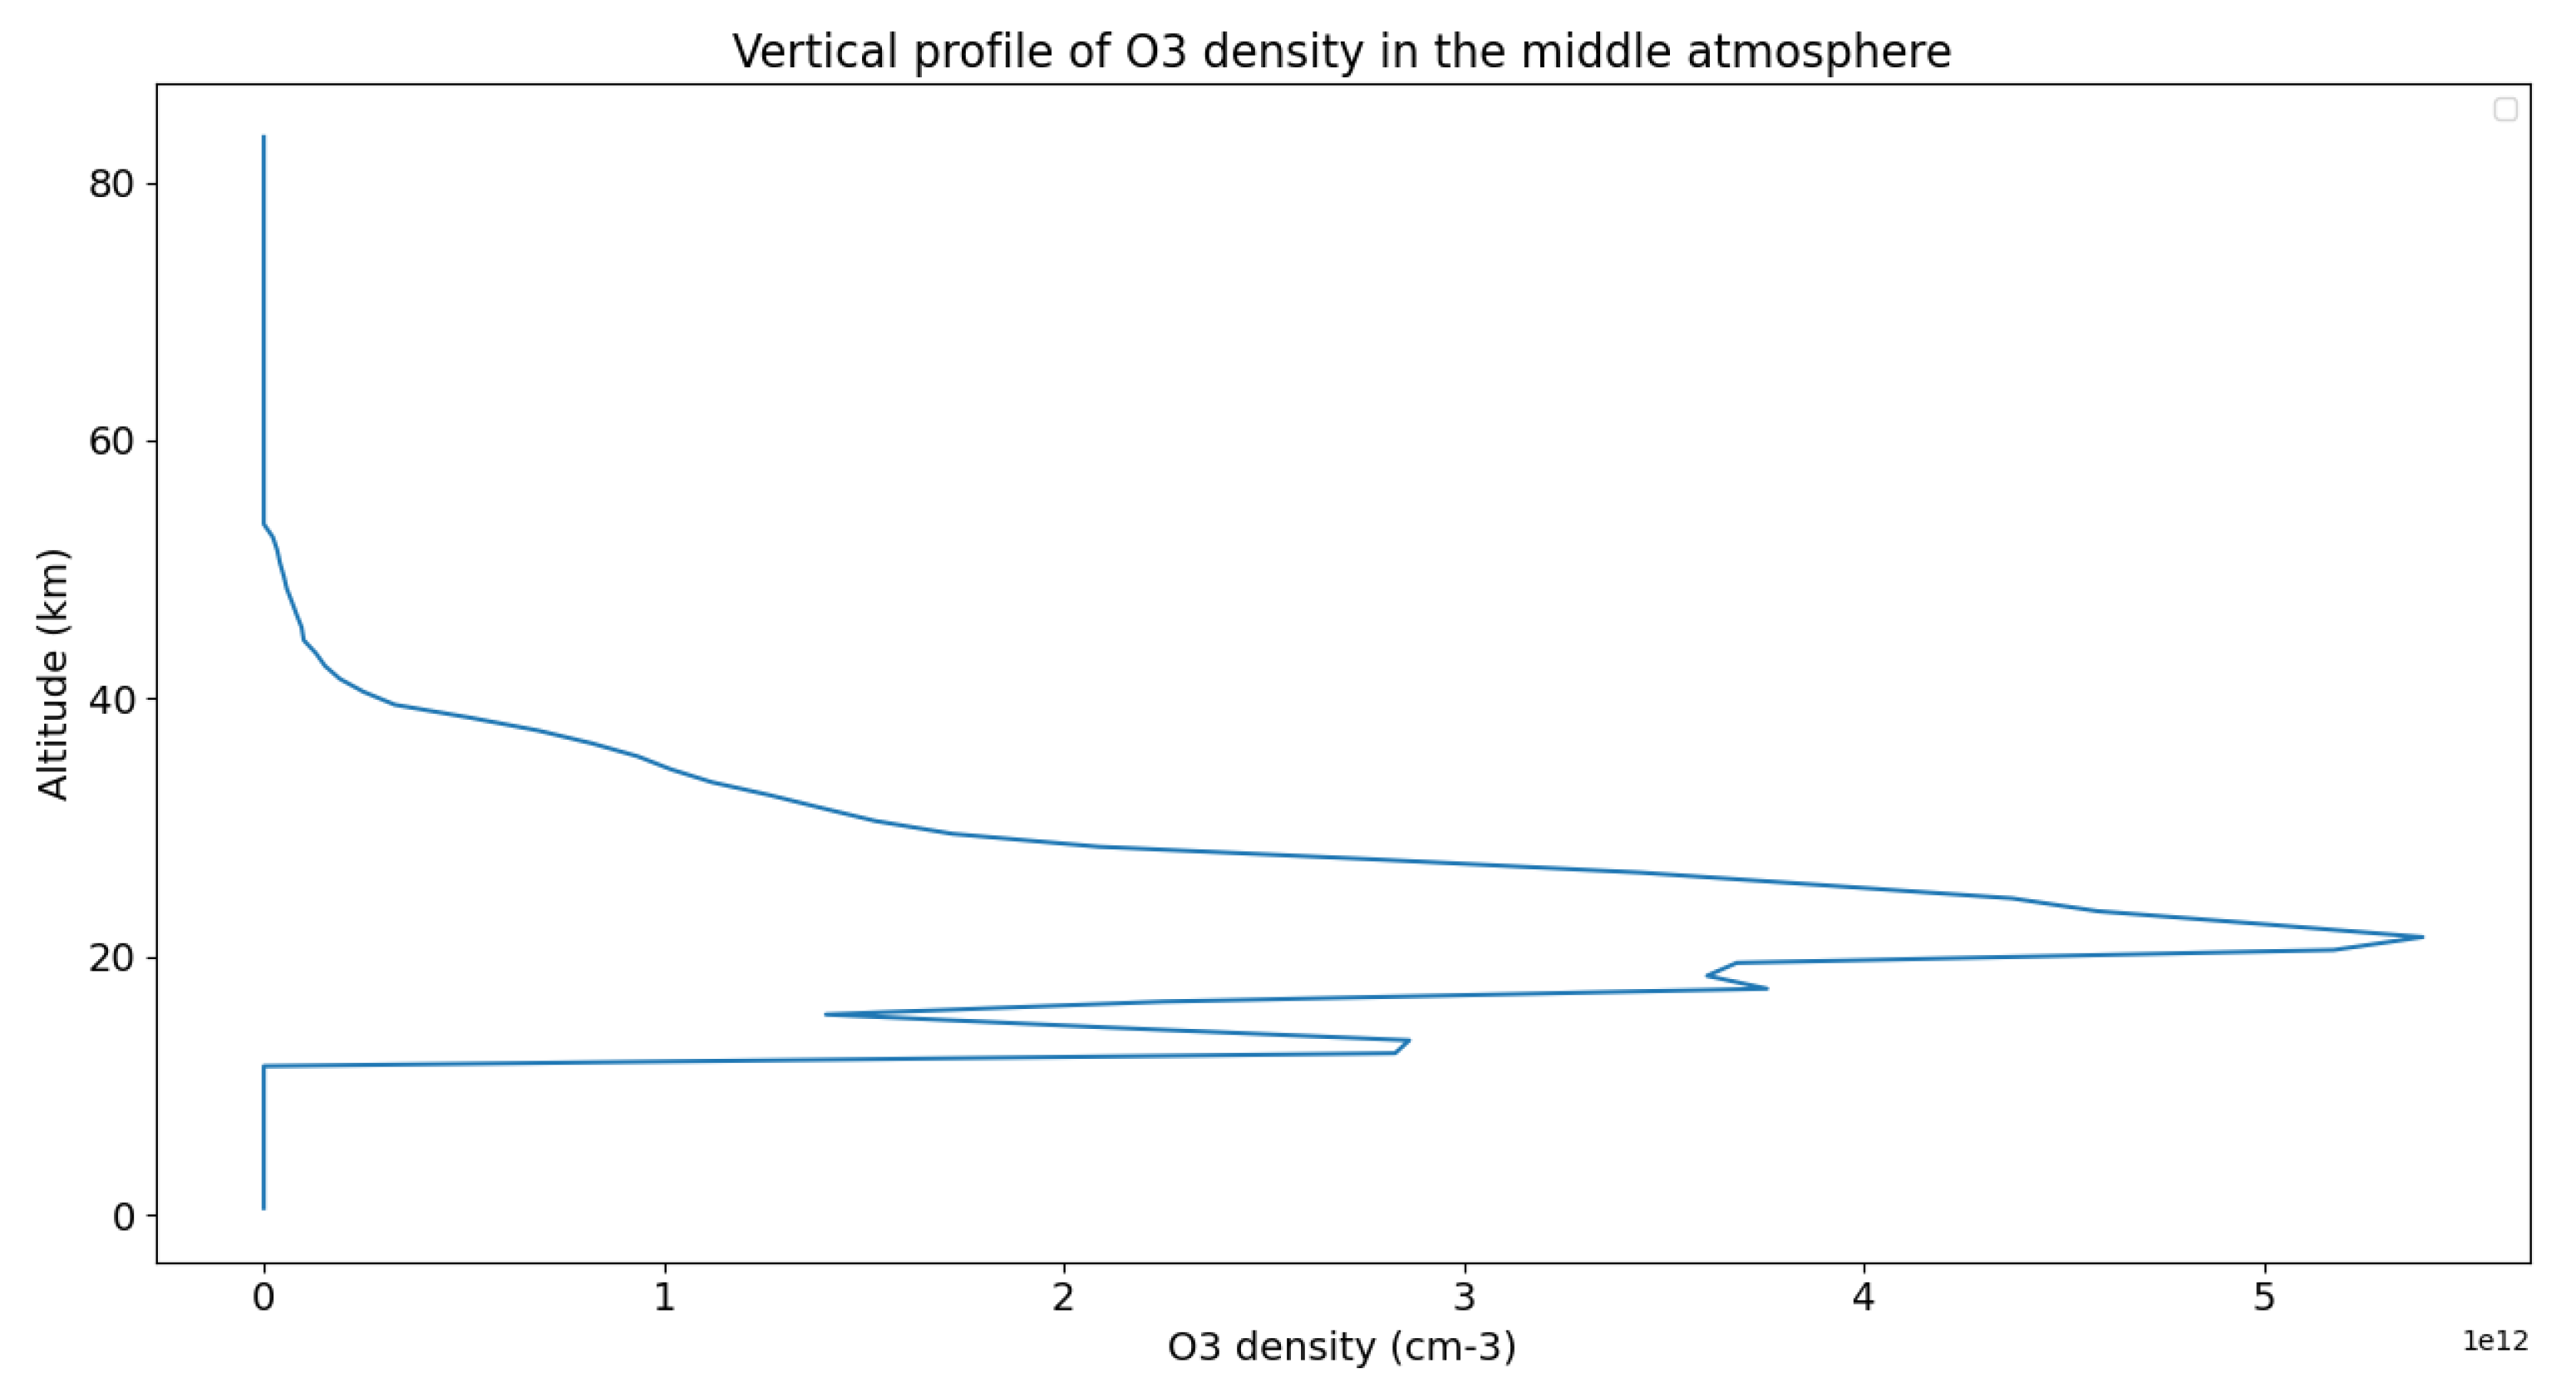
This resolution, combined with the effects of Rayleigh dispersion and O3 and NO2 absorption, results in a variation in the radiance profile obtained, which must be corrected. Below is an example of O3 and NO2 profiles and a curve showing the percentage correction for each of these effects :
Figure 12.
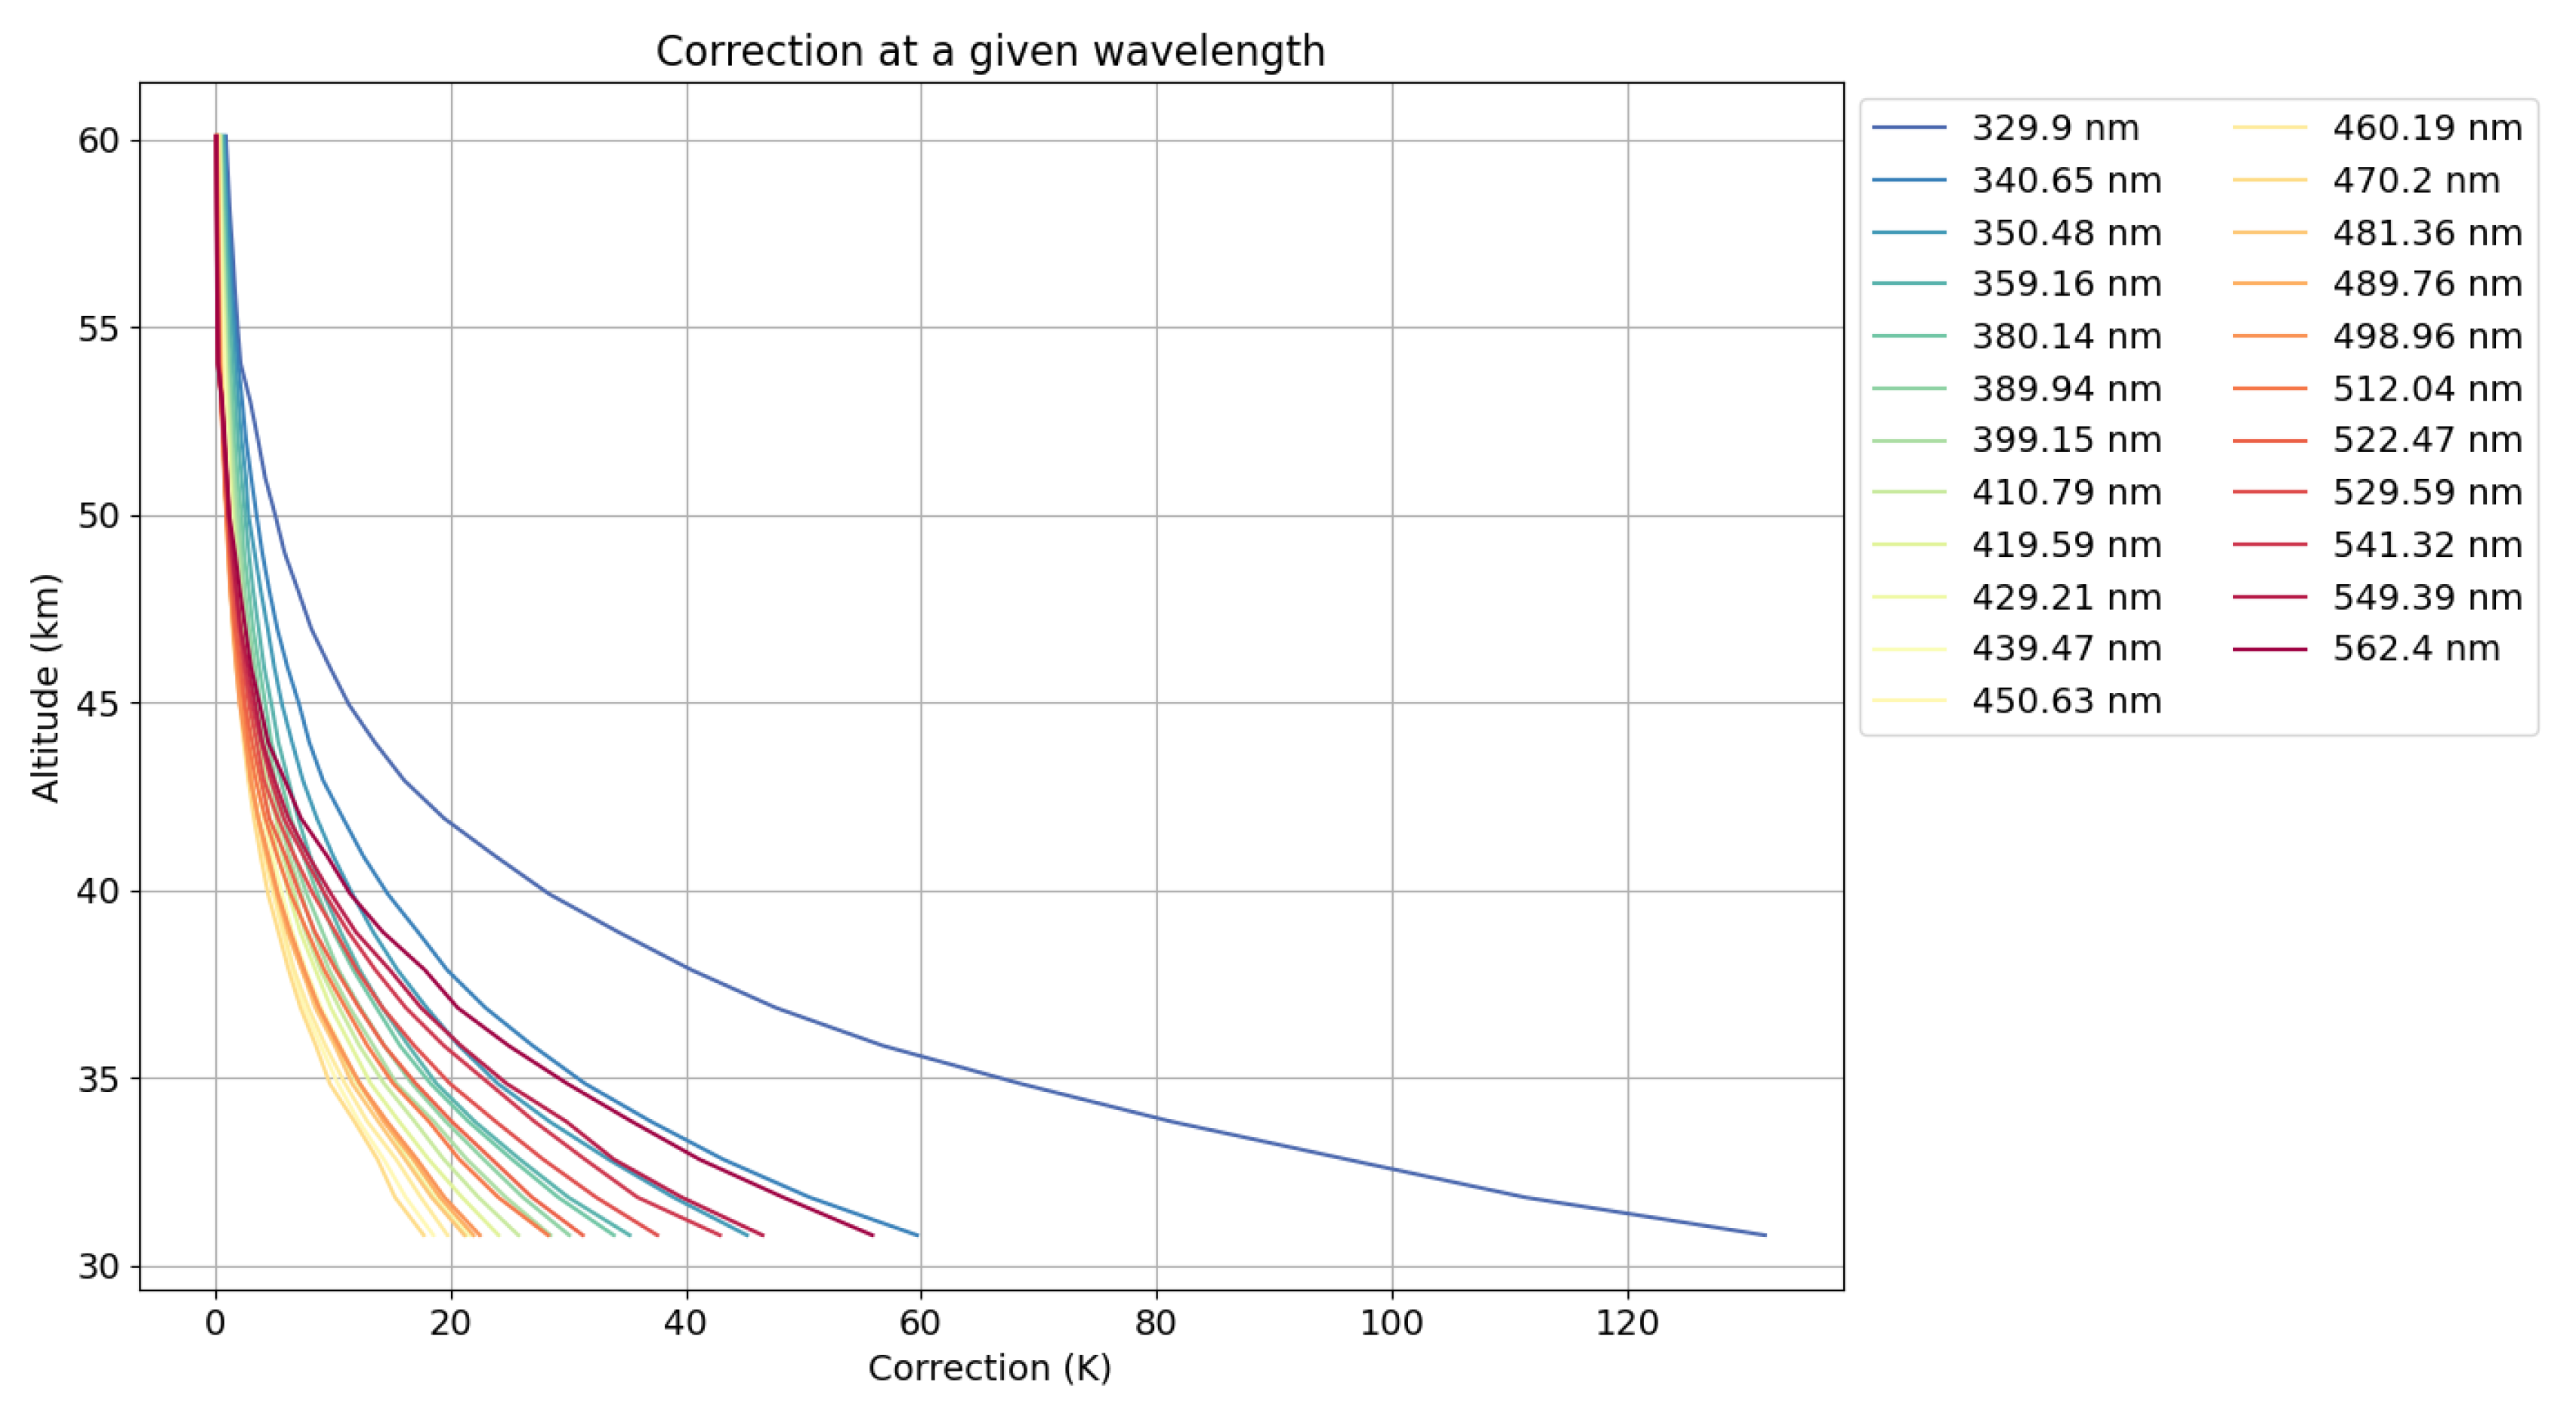
Kelvin correction at different wavelengths (raw profile - corrected profile)
Figure 12.
Kelvin correction at different wavelengths (raw profile - corrected profile)
3.6. Calculating the Temperature Profile
Now that we have the corrected radiance profile, and given that Rayleigh scattering is proportional to atmospheric density in our study space, we can calculate the temperature profile of the radiance profile by applying the law of perfect gases, hydrostatism and an initialization temperature :
Initialization pressure :
Calculating the pressure and temperature profile :
4. Comparisons of Temperature Profiles Obtained with the OMPS Instrument with Lidars from the NDACC Network
4.1. Collocation Information
The lidars chosen for the comparisons are sites with different characteristics and high-performance instruments that have already been extensively involved in numerous instrumental comparisons :
Observatoire de Haute-Provence (OHP) located in the south of France at 43.94° N, 5.71° E,
Mauna Loa Observatory (MLO) located in Hawaii at 19.54° N, 155.58° W,
Observatoire de Physique Atmosphérique de La Réunion (RUN) located in the Indian Ocean on the island of Réunion at the geographical position 21.1° S, 55.4° E.
Hohenpeißenberg Meteorological Observatory (HOH) located in Germany at 47.80° N, 11.02° E.
To ensure coincidence between the lidar sites and the OMPS satellite data, we chose a 10°*10° geographical area centred on the lidar positions. The geographical area chosen is a compromise that allows us to retrieve one satellite data item per day, enabling us to base the comparison on a larger number of cases. It should be noted that in order to obtain quality temperature profiles, the observations must be carried out at night and in cloud-free weather conditions. Similarly, for reasons of cost and operator availability at night, the lidars do not operate continuously and we do not have a reference temperature profile every day. To complete the comparisons between OMPS and Lidar observations, we carried out a systematic comparison with the MSIS 2.0 and ERA5 models. The temperature profiles of the models were extrapolated to the position of the lidars and to the time of passage of OMPS.
4.2. Wavelength Analysis
We analysed the different temperature profile inversions obtained for the different wavelengths available with the OMPS spectrometer with a step of 1 nm over the spectral range from 330 to 562 nm. The signal received is a combination of the scattering efficiency of solar radiation and attenuation. The solar spectrum follows Planck’s law (Meftah et al., 2023) with a maximum around 550 nm. In our study range, which is between 230-1020 nm, the power per square metre received by the atmosphere can vary by up to a factor of 4 depending on the wavelength chosen. Molecular scattering efficiency depends on Rayleigh’s law (Bucholtz, 1995) and gives a maximum scattering efficiency for short wavelengths; in our study range, scattering varies by up to a factor of 100. As described in the previous chapters, total attenuation due to atmospheric composition modulates the signal by a factor of 10 and must also be taken into account. The combination of all these factors is illustrated in
Figure 13. It appears that the wavelength range around 450 nm is ideal, but for wavelengths shorter than 330 nm the conditions for obtaining good temperature profiles are no longer met due to attenuation.
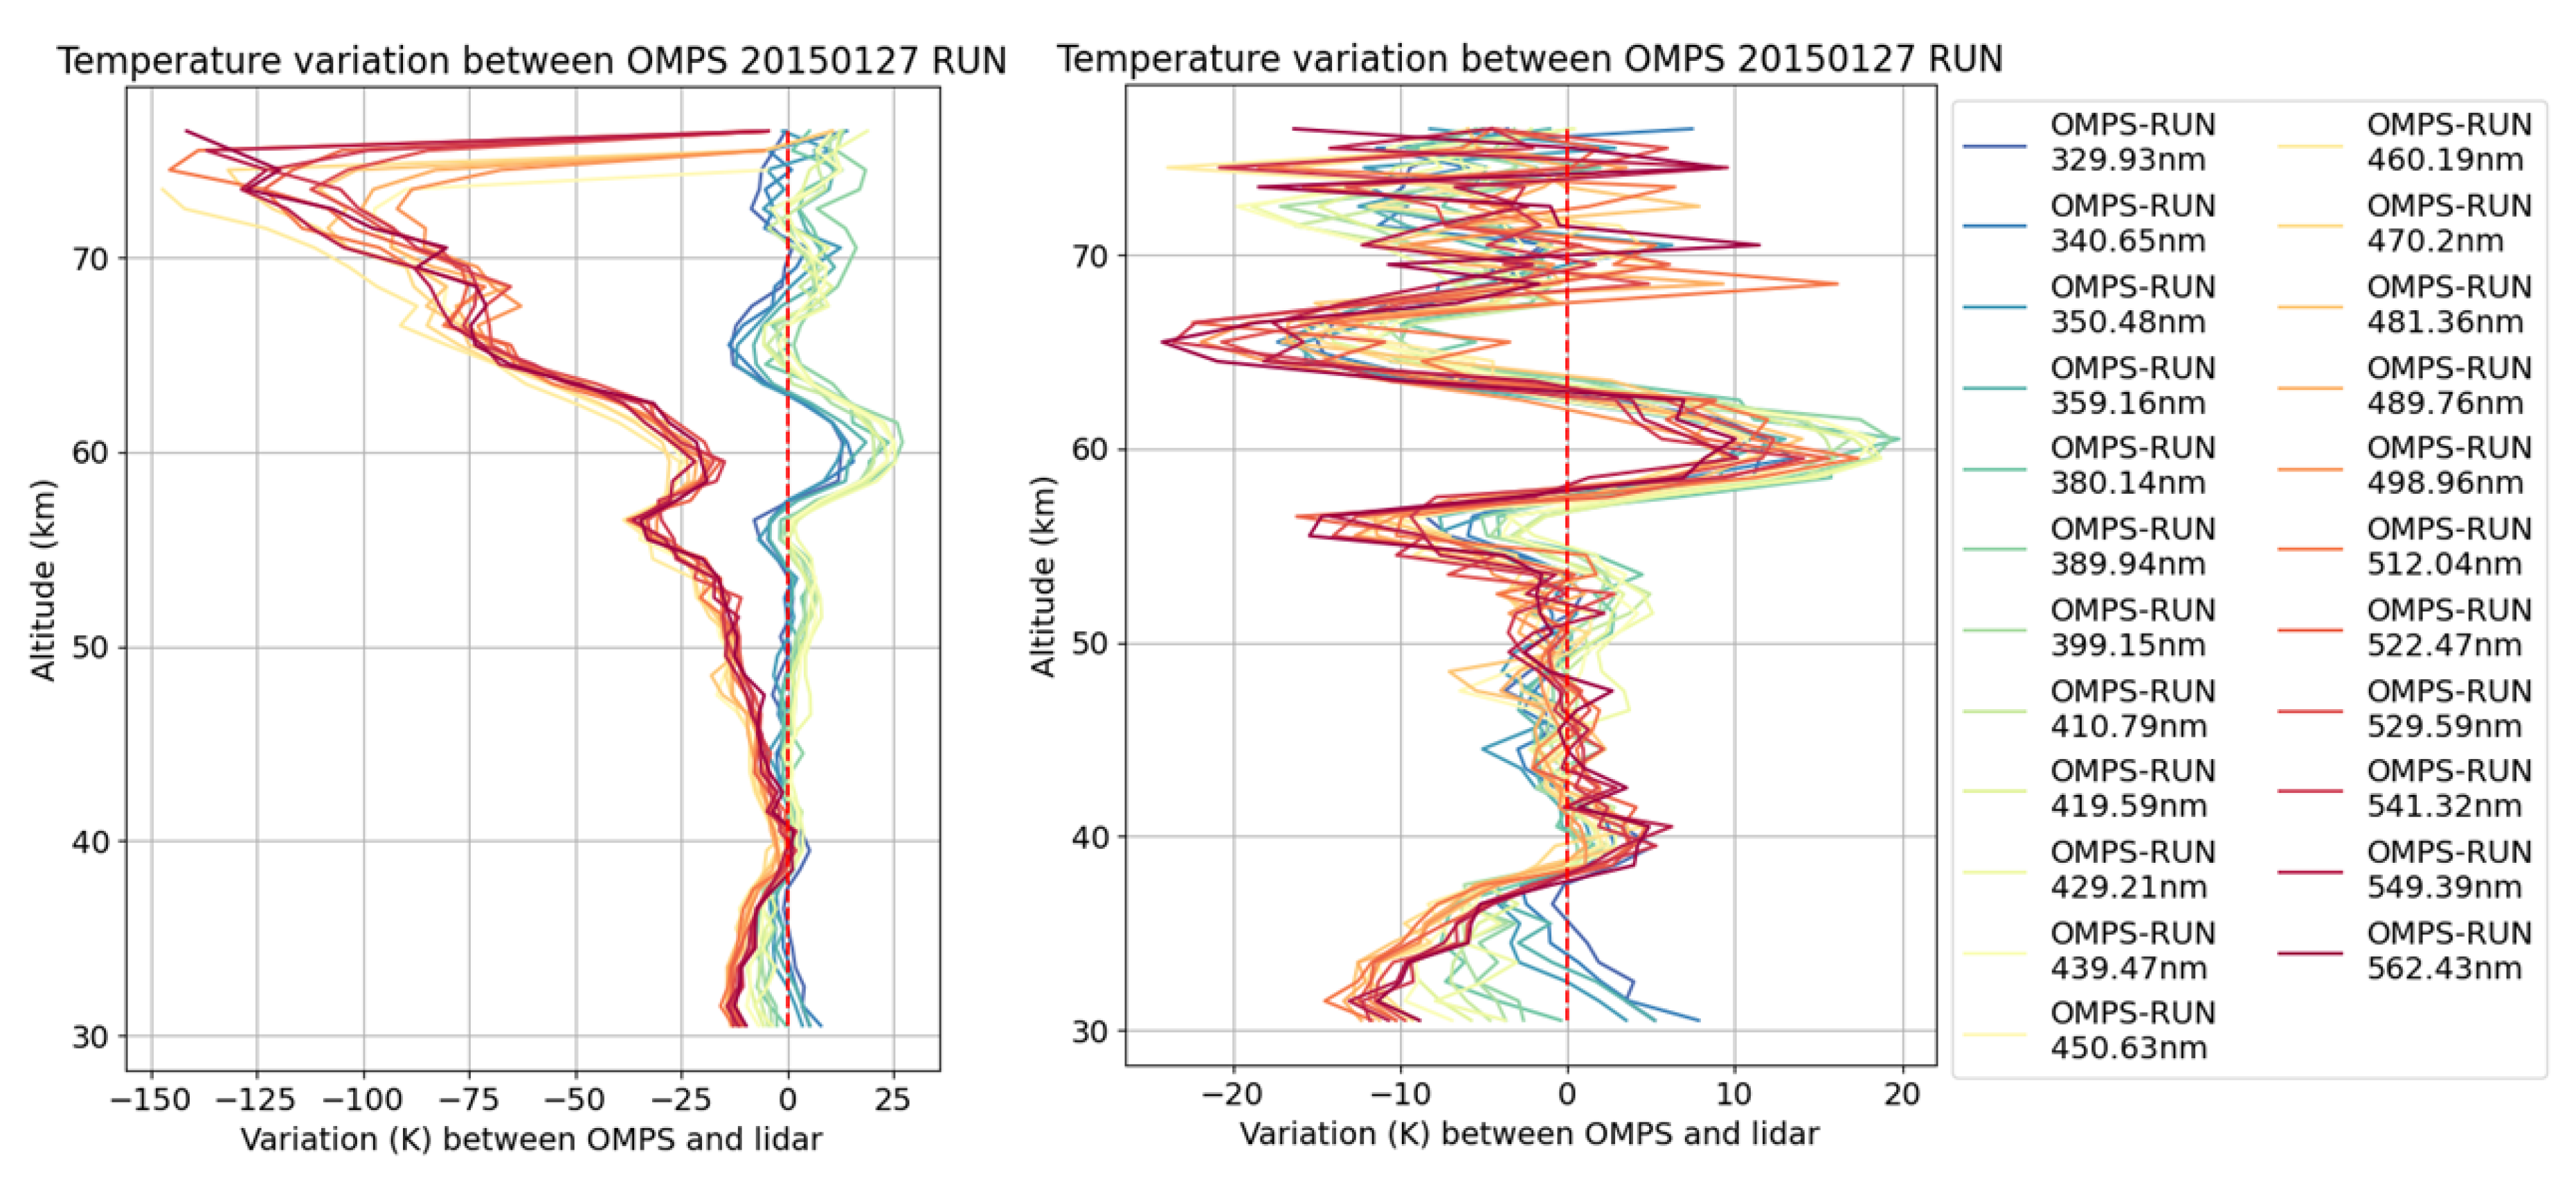
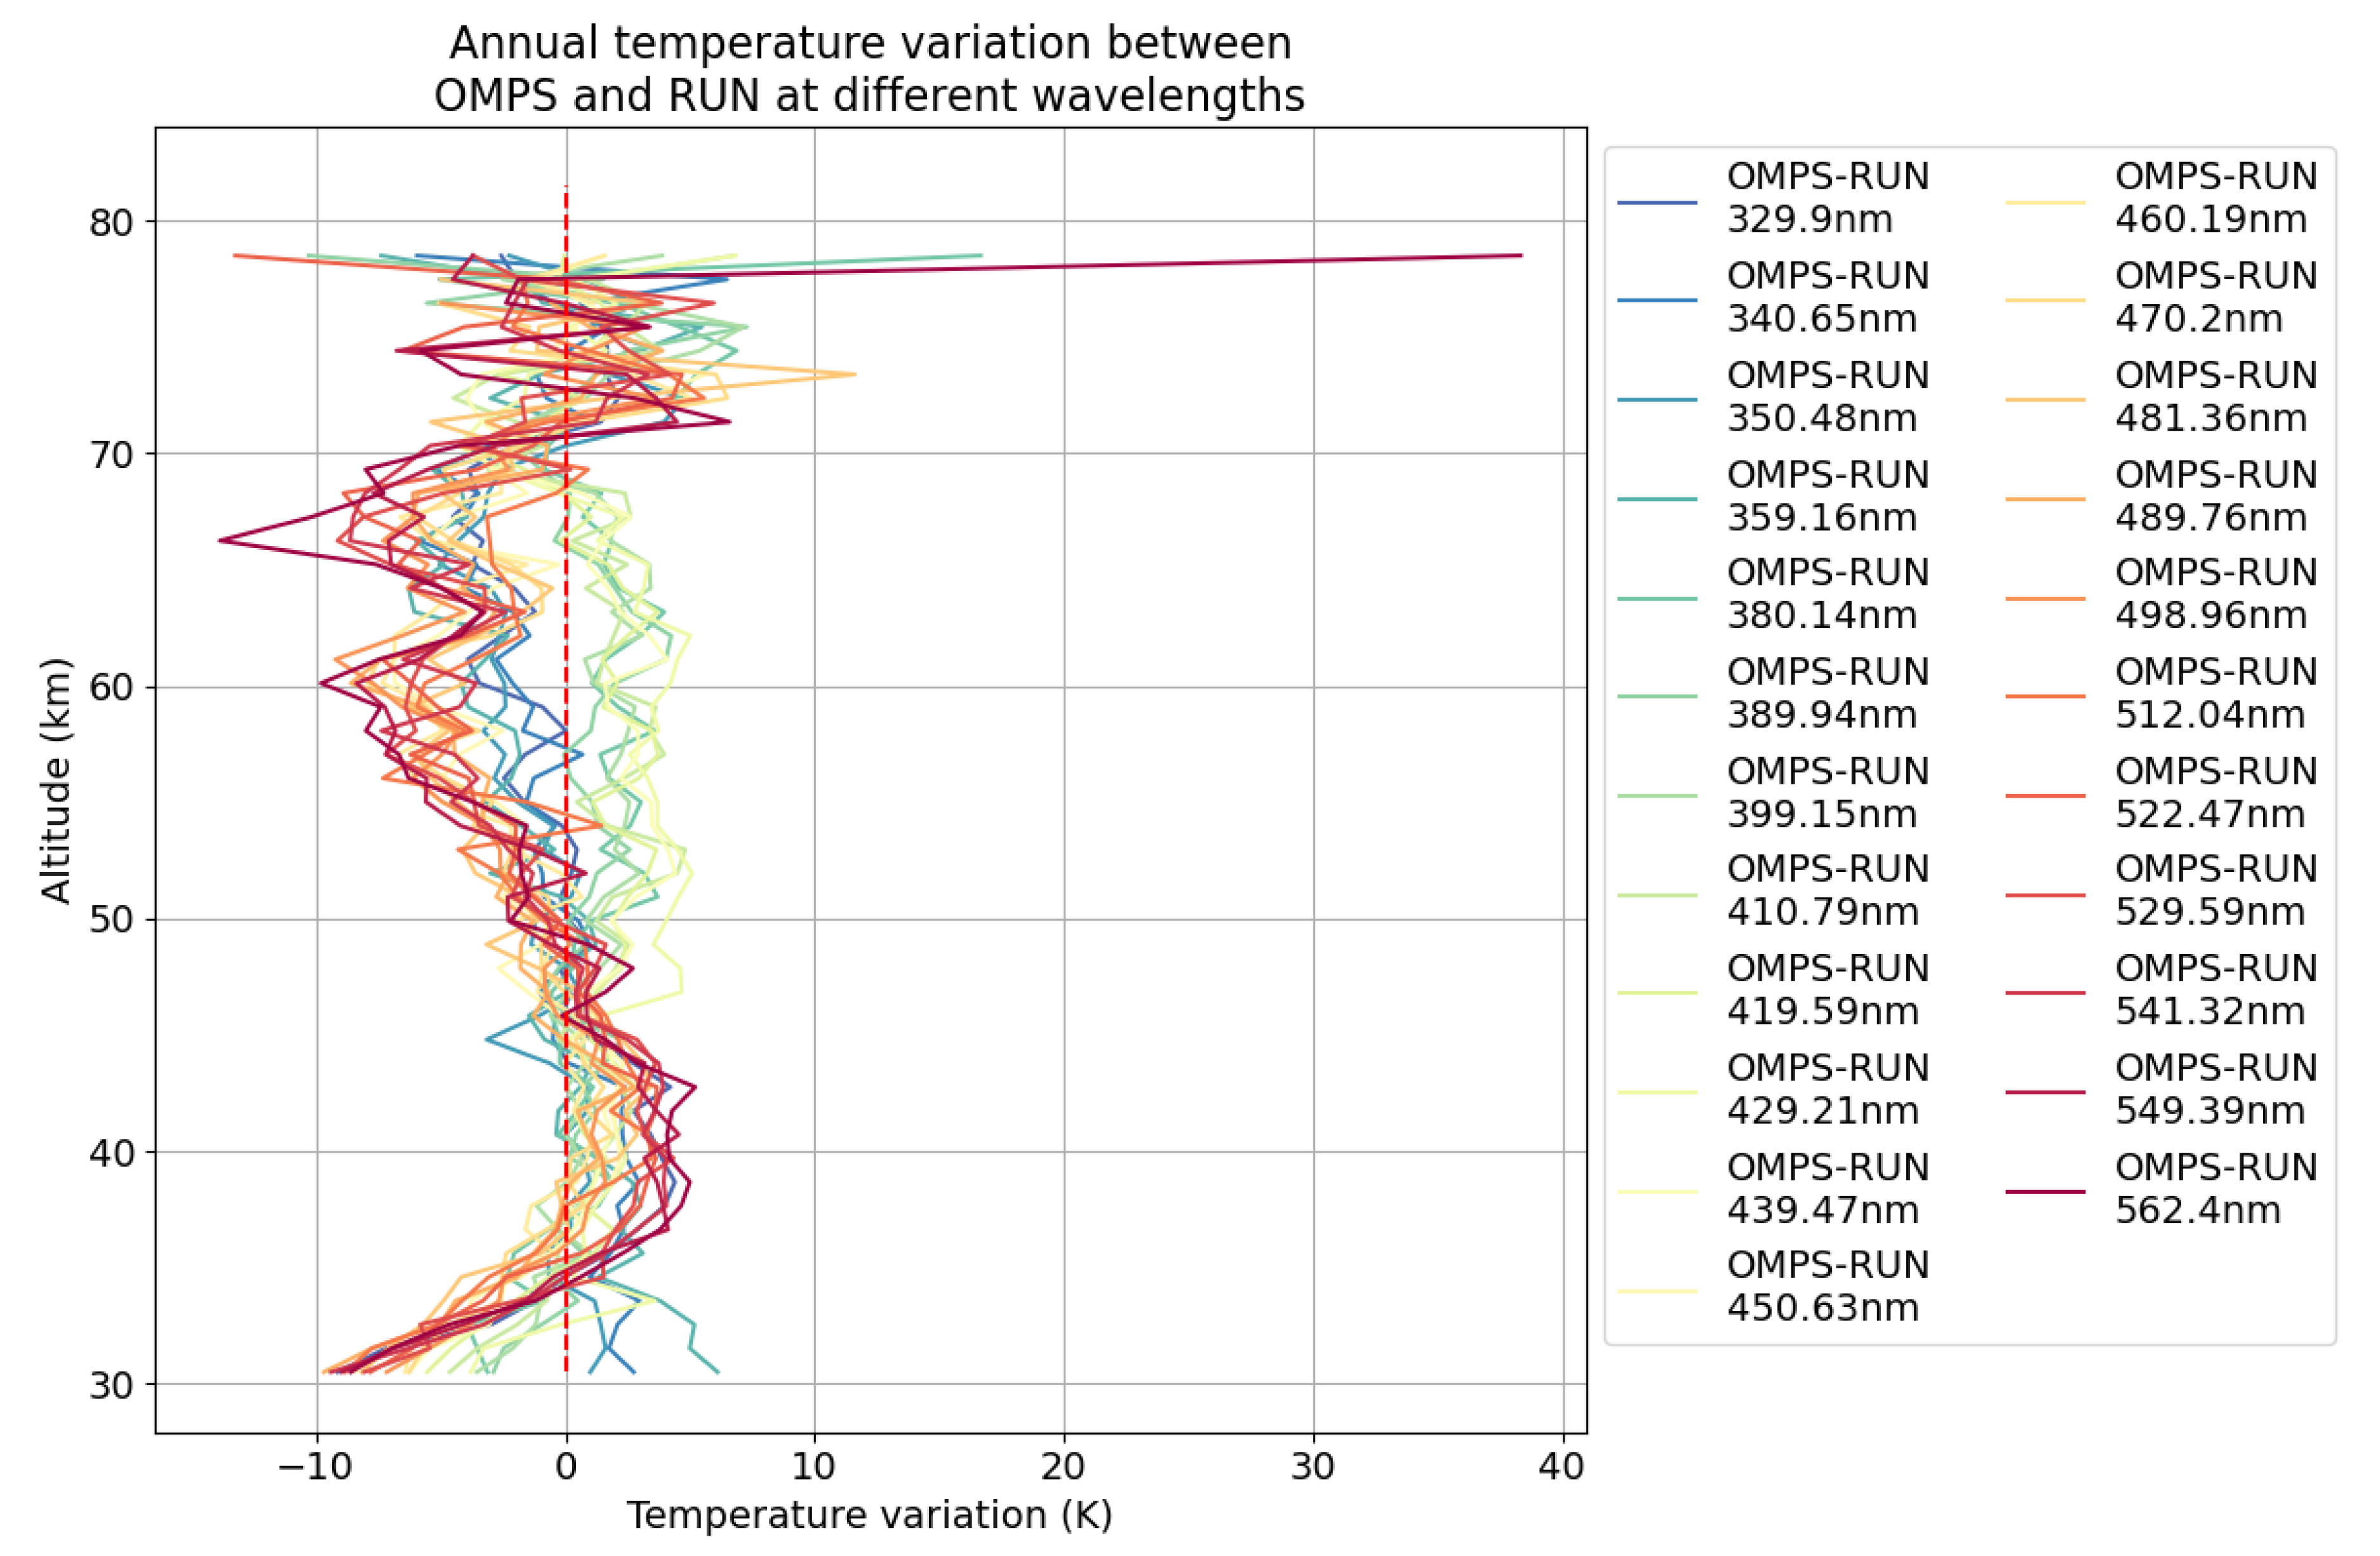
Since scattering is optimal at short wavelengths, we stopped this sensitivity study at 562 nm. On the other hand, due to instrumental problems, the spectral range between 360 and 380 nm is not available. For reference purposes, we carried out this analysis over 4 lidar sites for 2015. In particular, we observed similar behaviour for the comparison with all 4 sites. The differences are radically different for wavelengths between 399.15 and 450.63 in the mesosphere between 50 and 70 km, as can be seen for example for the Réunion site (
Figure 14).
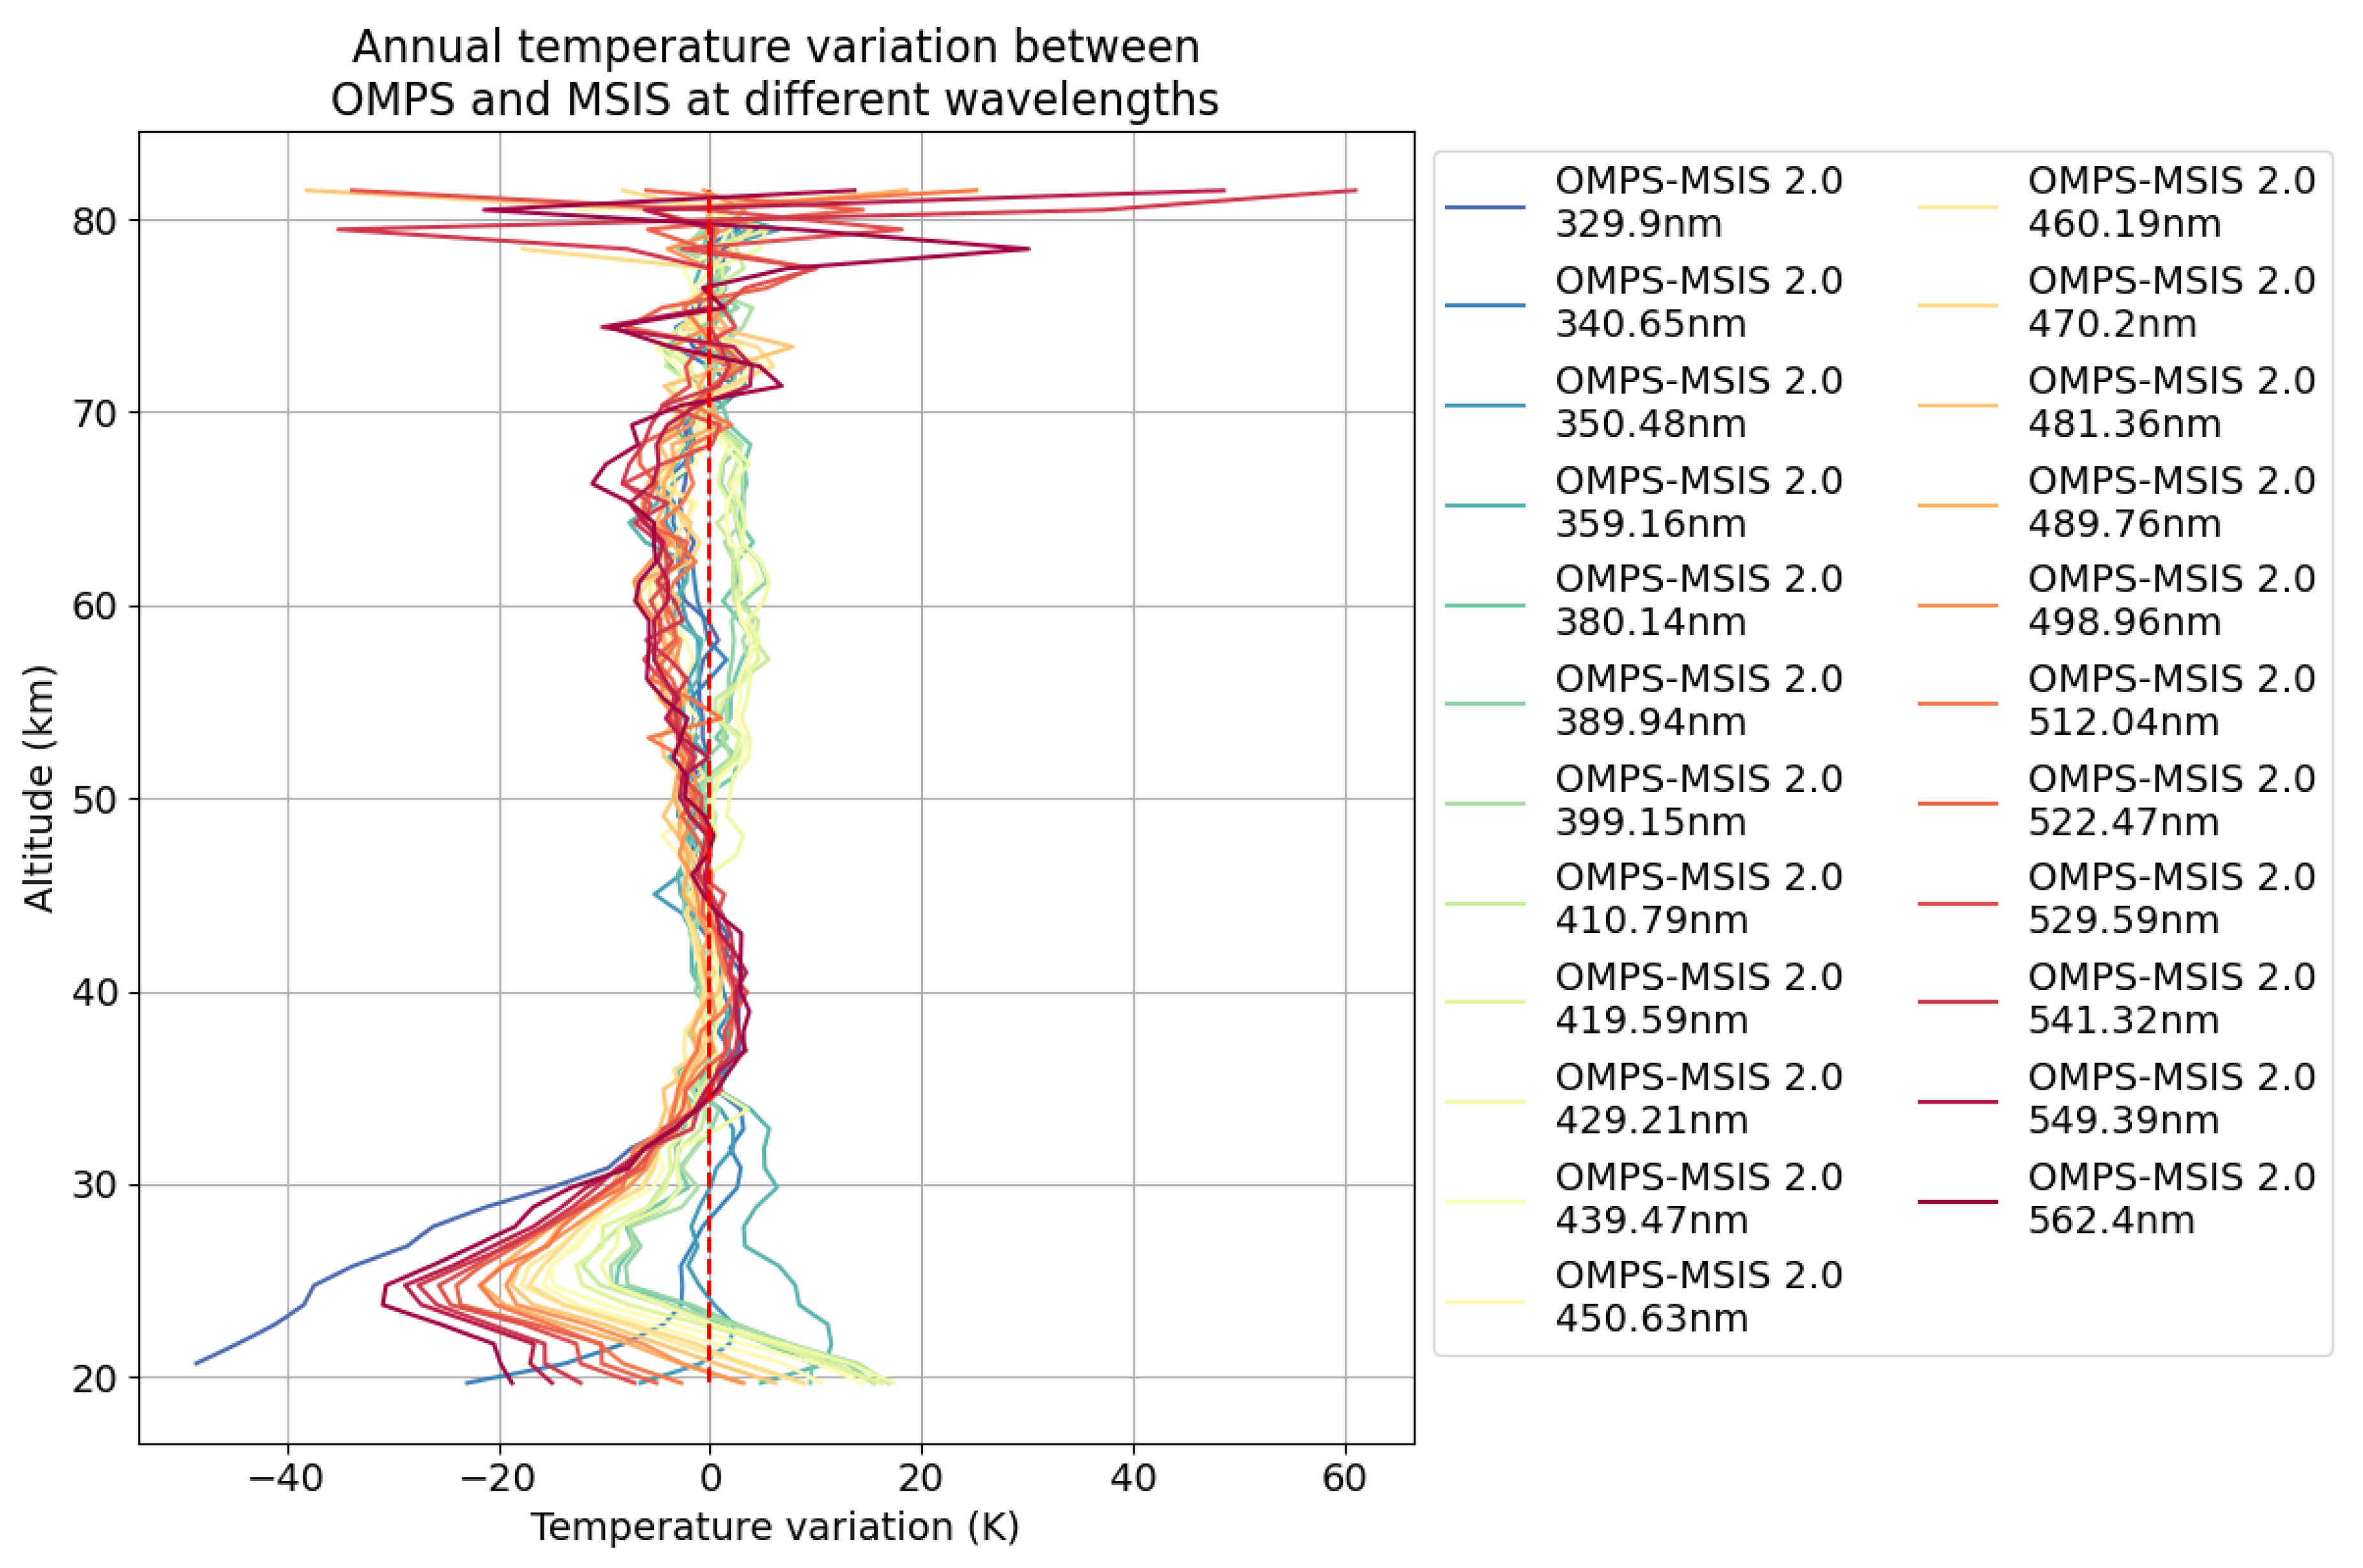
The comparisons show 2 groups of wavelengths, one that will give positive temperature variations (1-3 K) for wavelengths between 380 and 439 nm and another of negative differences for short (<359 nm) and long wavelengths (> 450 nm).
Figure 15.
The effect of aerosols on temperature profiles can be seen between 20 and 30 km. As the wavelength increases, aerosol scattering takes precedence over molecular scattering. Lidars do not provide temperature data below 30 km, so we show this phenomenon using MSIS differences.
Figure 15.
The effect of aerosols on temperature profiles can be seen between 20 and 30 km. As the wavelength increases, aerosol scattering takes precedence over molecular scattering. Lidars do not provide temperature data below 30 km, so we show this phenomenon using MSIS differences.
Analysis at lower altitudes towards the middle stratosphere shows discrepancies that are probably due to the presence of aerosols. The comparison with lidars, which are also sensitive to the presence of aerosols, is not relevant for validating the OMPS inversions in this altitude range. On the other hand, comparison with the MSIS climatological model shows that the differences increase logically with the wavelength, confirming the reason for these differences. As this contribution is difficult to correct, it seems more appropriate to select short wavelengths, thereby minimising this effect. On the other hand, it is also the shortest wavelengths that are least affected by noise in the upper mesosphere, as we showed in part 3.1
Figure 1. For all these reasons, we have chosen to select wavelengths from 335 to 345 nm for this study and to add them together in order to reduce the measurement noise due to the entire acquisition chain, from the optics to the detector.
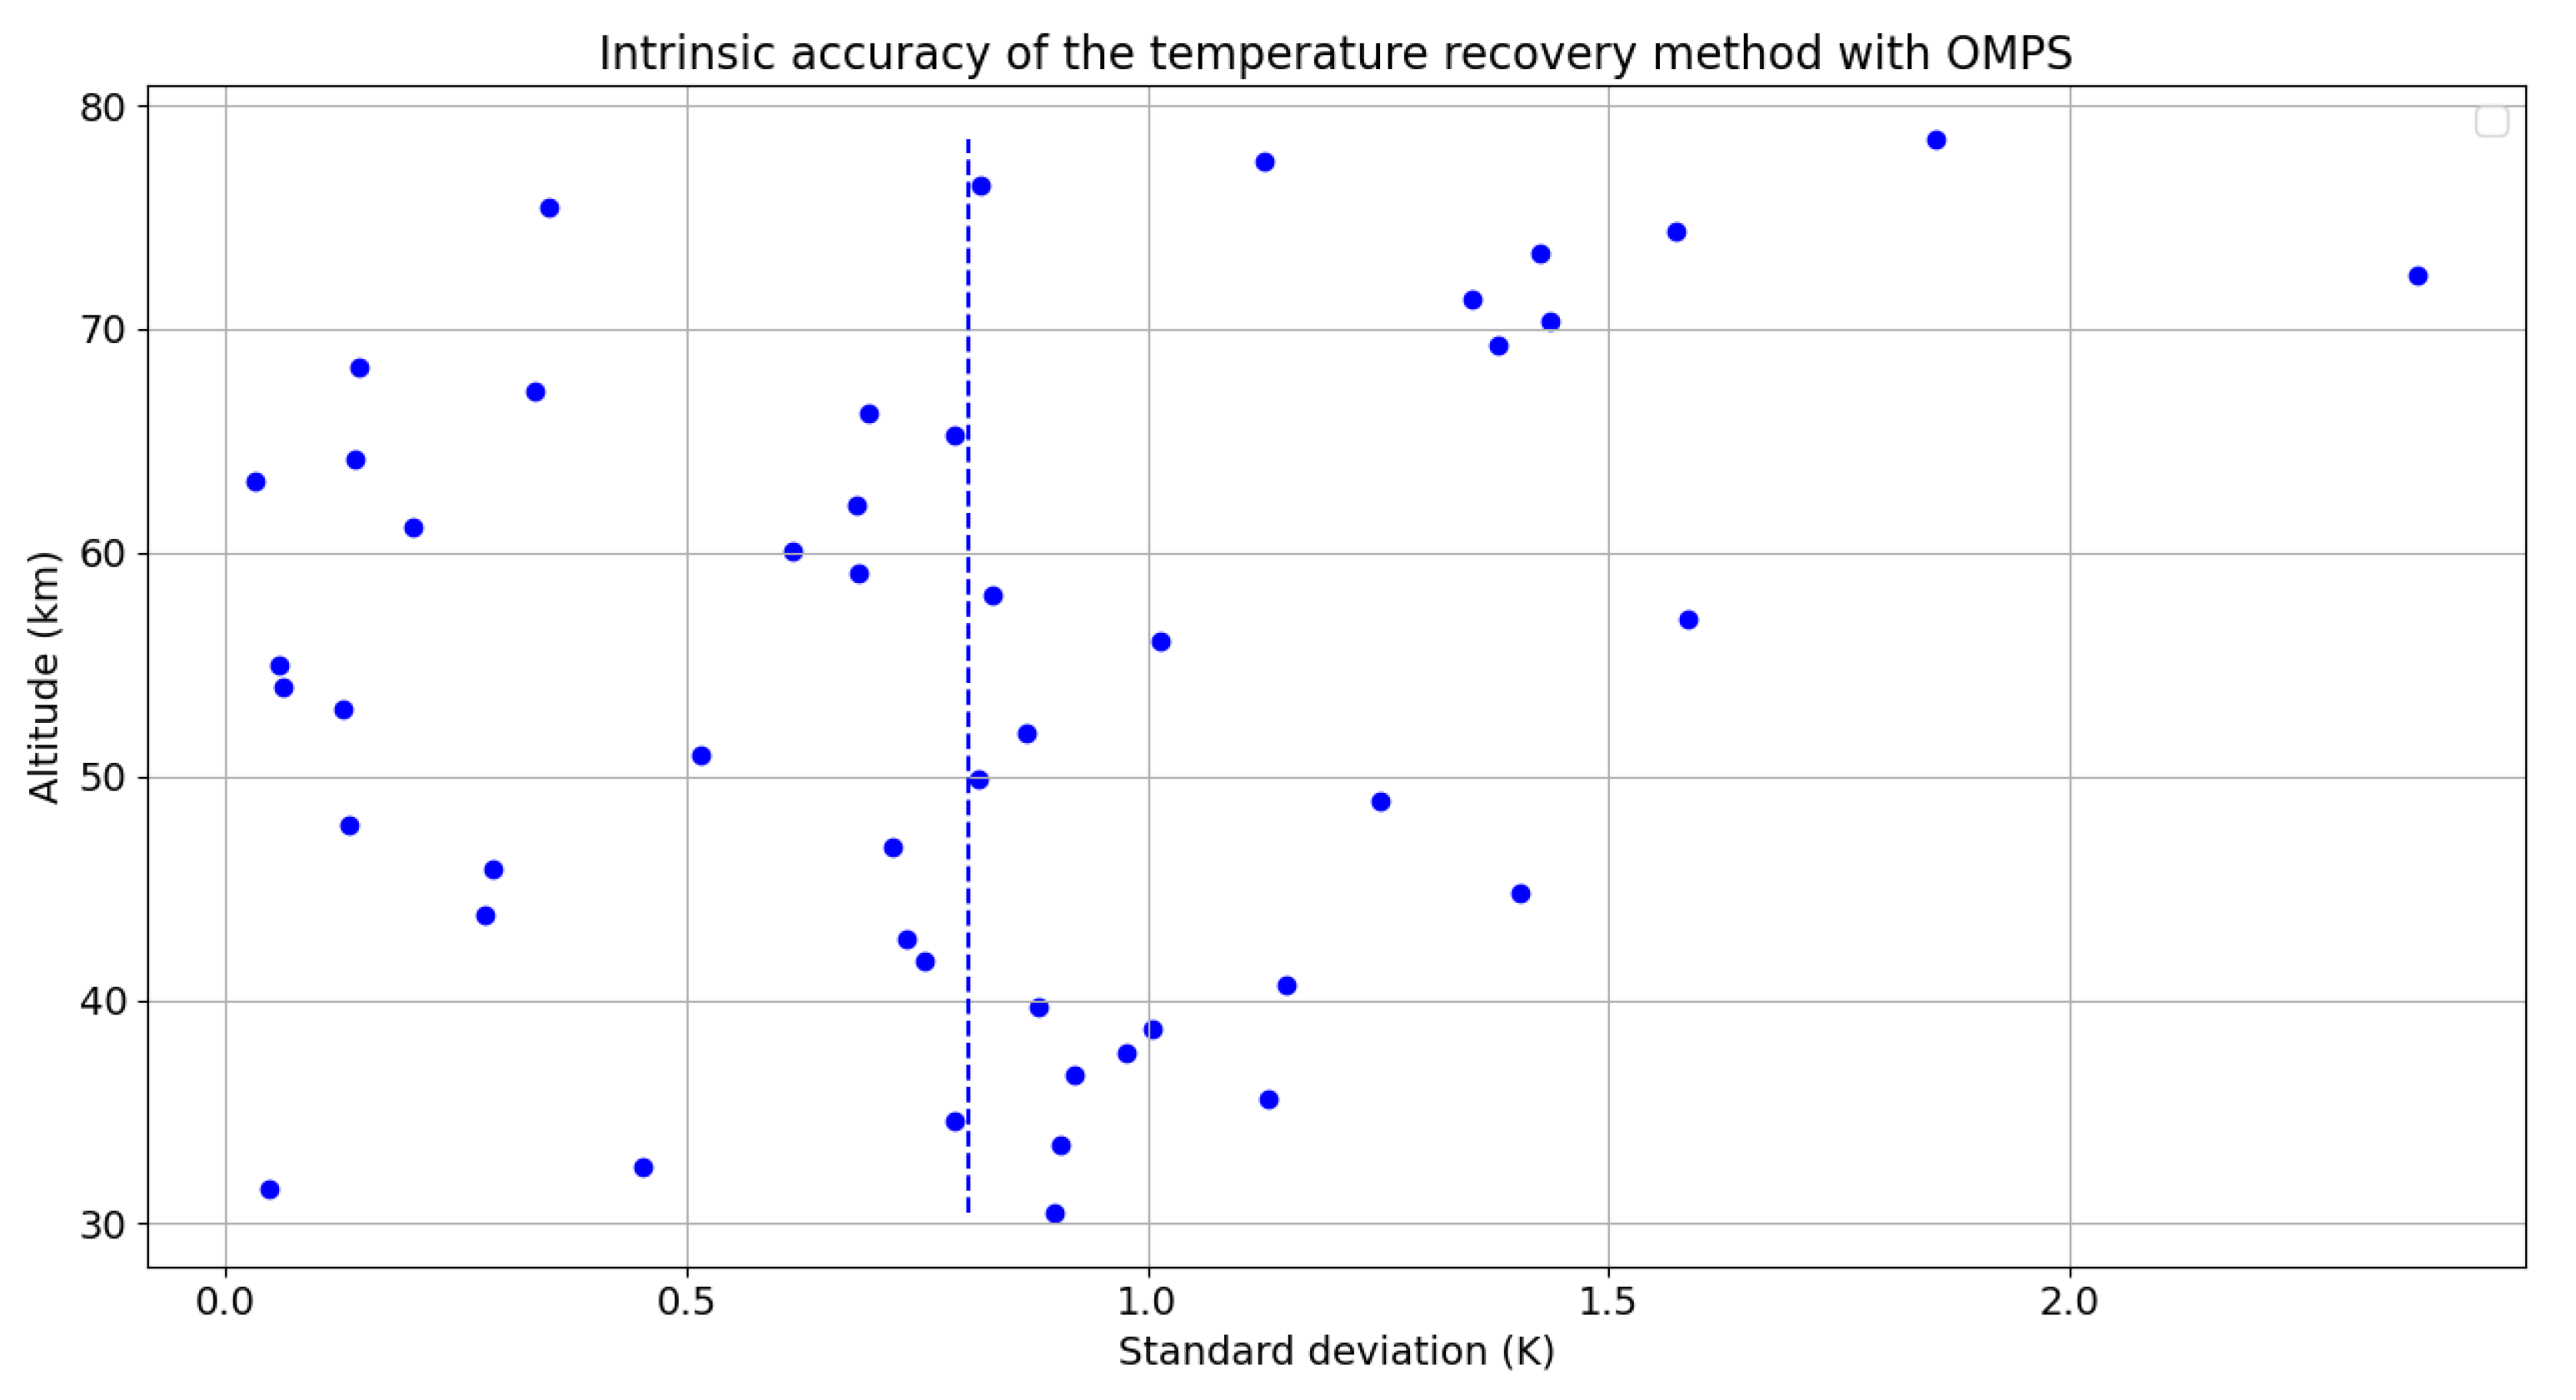
The standard deviation between these different profiles calculated for each wavelength makes it possible to estimate the intrinsic error linked to our inversion method applied to the observations of the OMPS instrument. In a perfect case, all the wavelengths are supposed to give the same results, since they are all looking at the same scene. The temperature variations between the signals from the different wavelengths are therefore due to the uncertainty in the radiance measurement. The corresponding error is less than 1 K.
Figure 16.
Point cloud and its mean standard deviation of temperature inversions obtained with each wavelength as a function of altitude.
Figure 16.
Point cloud and its mean standard deviation of temperature inversions obtained with each wavelength as a function of altitude.
4.3. Results of Temperature Analyses for Each Site
As mentioned in
Section 4.1, we compared the results obtained via OMPS with 4 lidars from the NDACC network, the 2 MSIS and ERA5 models and the MLS satellite instrument. Here is the list of the number of comparisons for each position:
OHP : 1685 comparisons for MLS, MSIS and ERA5 and 777 comparisons against lidar between 2015 and 2020.
MLO : 990 comparisons for MLS, MSIS and ERA5 and 493 comparisons with lidar between 2015 and July 2018.
RUN : 1207 comparisons for MLS, MSIS and ERA5 and 257 comparisons against lidar between 2015 and 2020, there are no comparisons for the year 2016.
HOH : 597 comparisons for MLS, MSIS and ERA5 and 263 comparisons against lidar for the 2 years 2015 and 2016.
Figure 17.
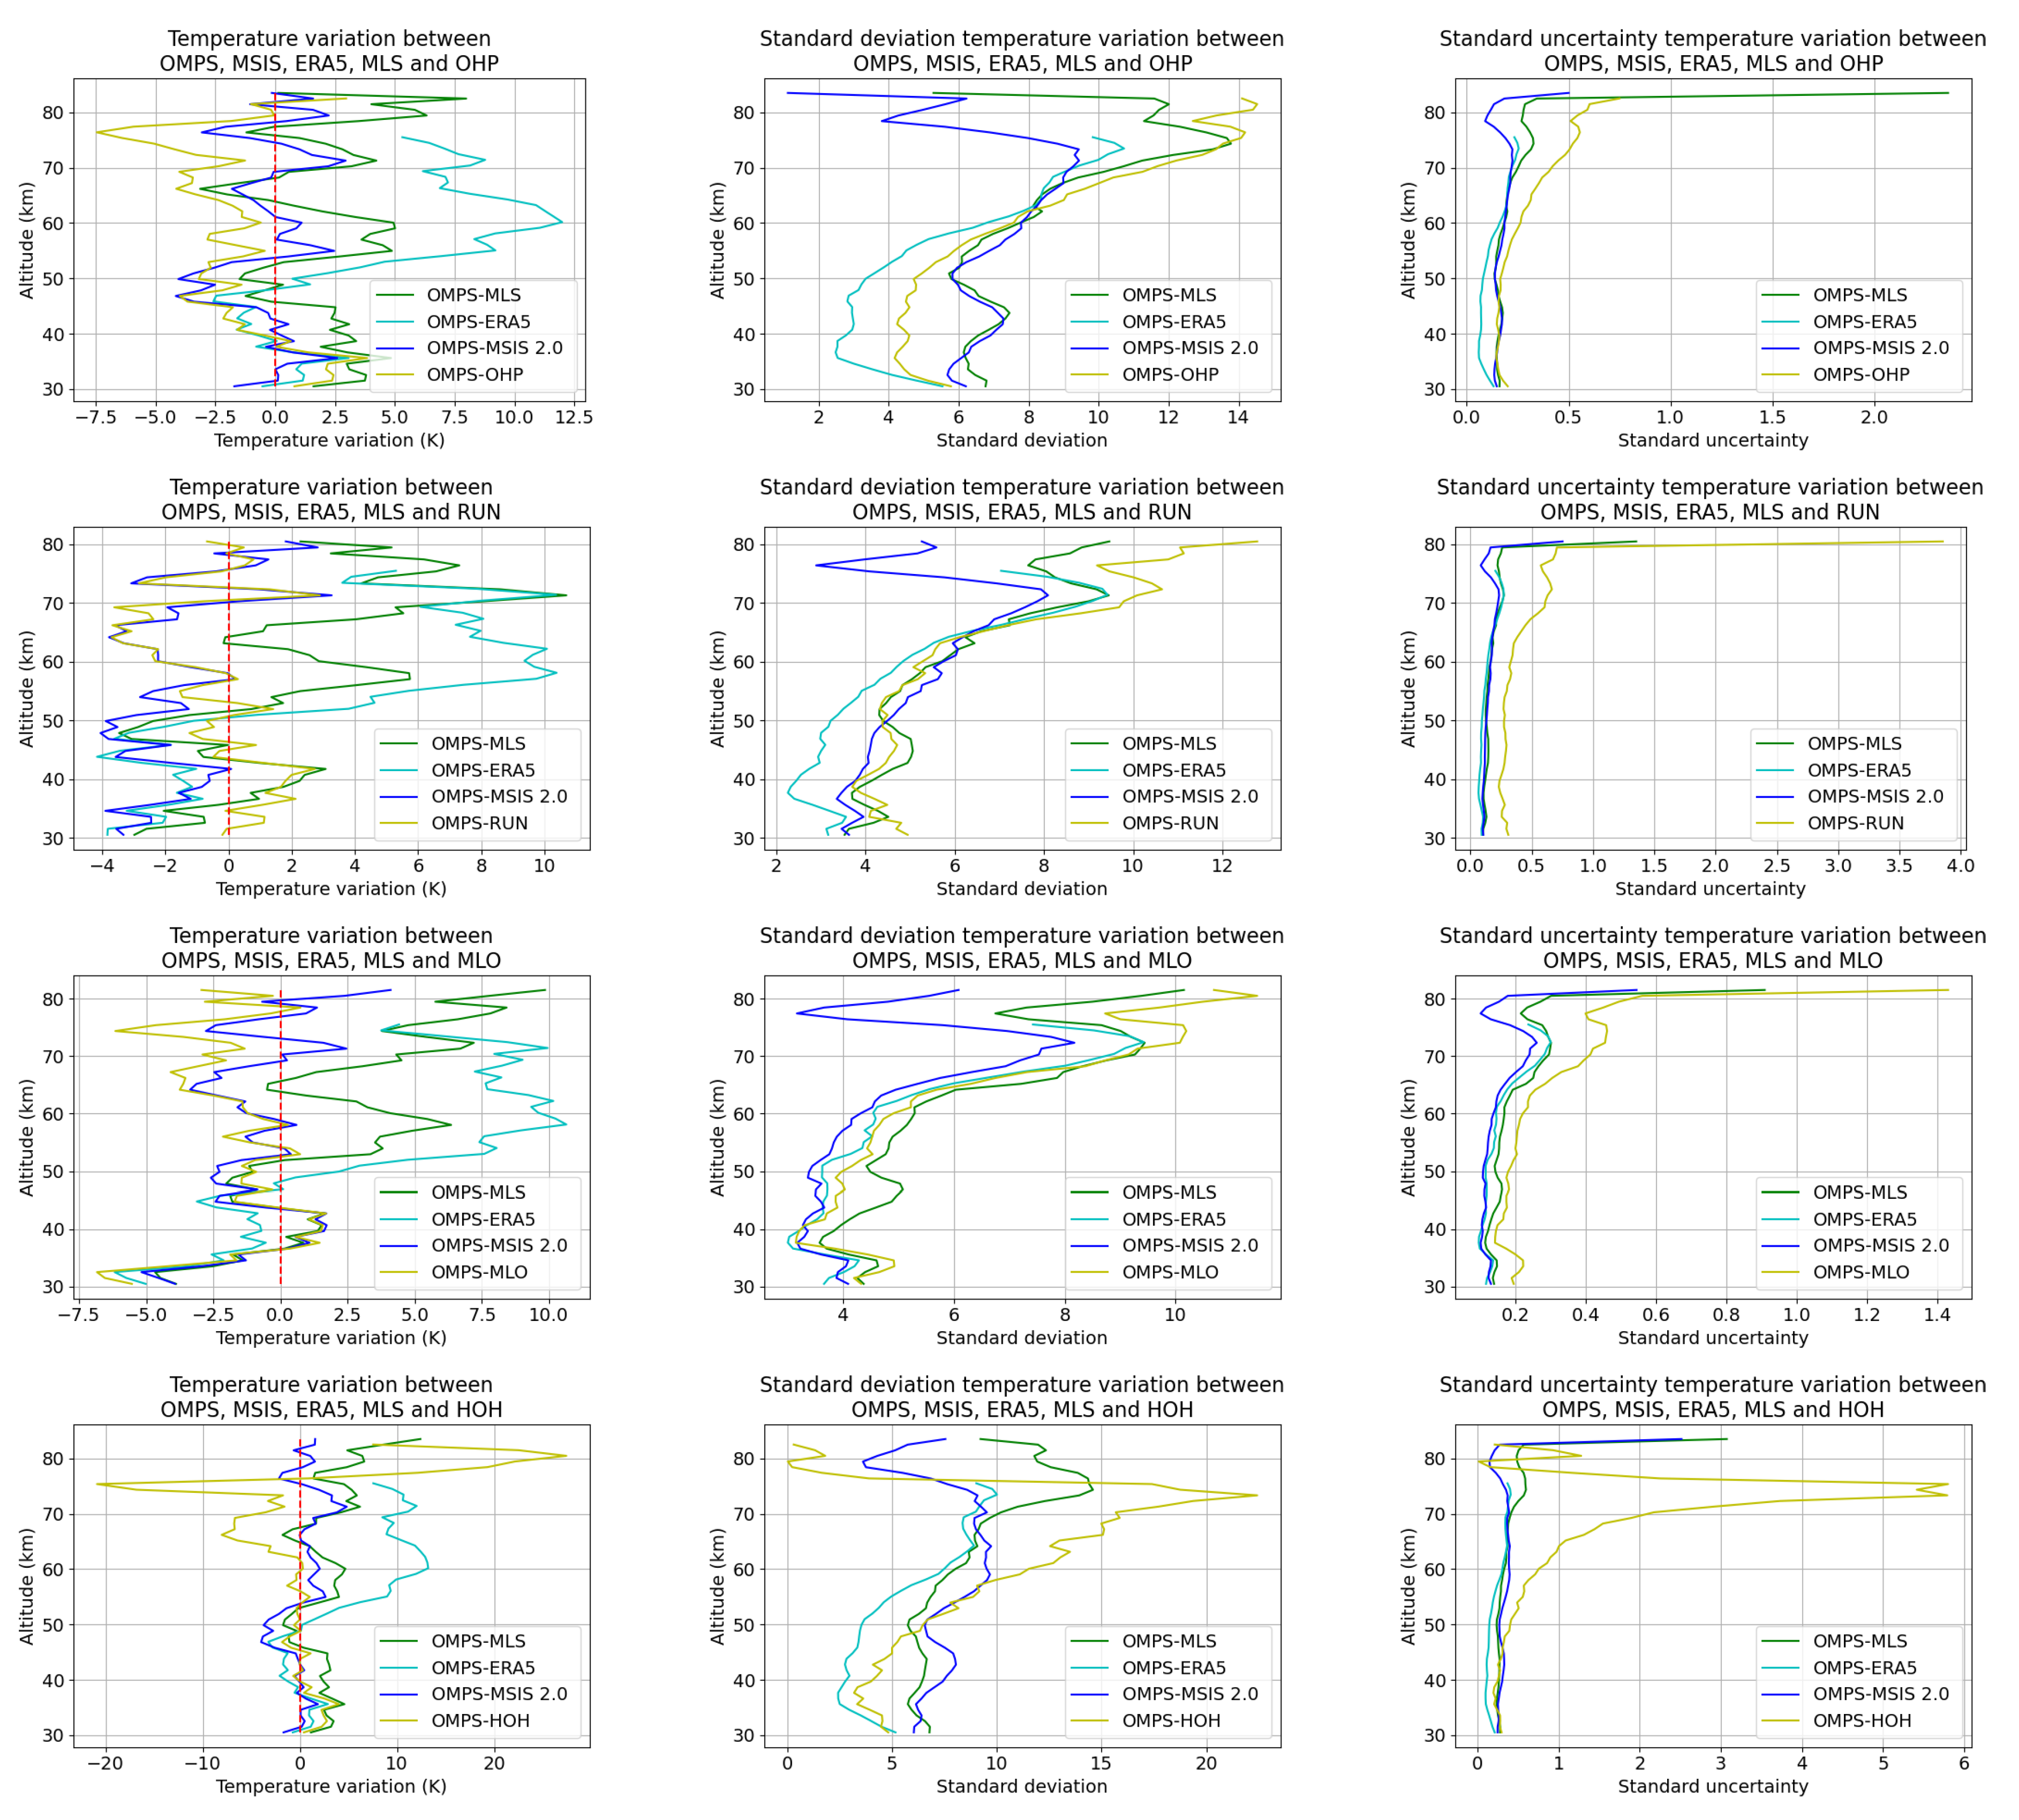
Comparisons of OMPS temperature profiles with MLS, ERA5, MSIS 2.0 and HOH. On the left are the differences between OMPS and the various sources compared, in the centre the standard deviation and on the right the uncertainty on the standard deviation. In order from first to last line, the study sites are : OHP, RUN, MLO and HOH.
The temperature differences between OMPS, MSIS and the lidars show very similar results, never exceeding 5 K except for the HOH lidar at high altitude and the MLO lidar below 35 km. For the HOH lidar, this is probably due to the fact that the statistical error associated with this lidar is smaller than that of other lidars and that its range rarely exceeds 75 km. At this altitude, the lidar’s temperature error exceeds 20 K, so the results for this high-altitude site should be treated with caution. For the MLO lidar, we believe that it is the effect of aerosols, the effects of which we have not taken into account, that is responsible for this variation. In fact, we observe a slight increase in the standard variation compared with all the lidars below 35 km and it is known that stratospheric aerosols begin to be observable at these altitudes (Khaykin et al., 2017). This altitude zone is therefore subject to uncertainties, although in view of the proportions and results available to us, this uncertainty remains more or less low depending on the sites.
The differences with MLS are a little greater, sometimes reaching 10 K as in the case of the OHP site, and finally we have the case of ERA5 where the differences are very small below 50 km but increase sharply after that, sometimes reaching more than 10 K.
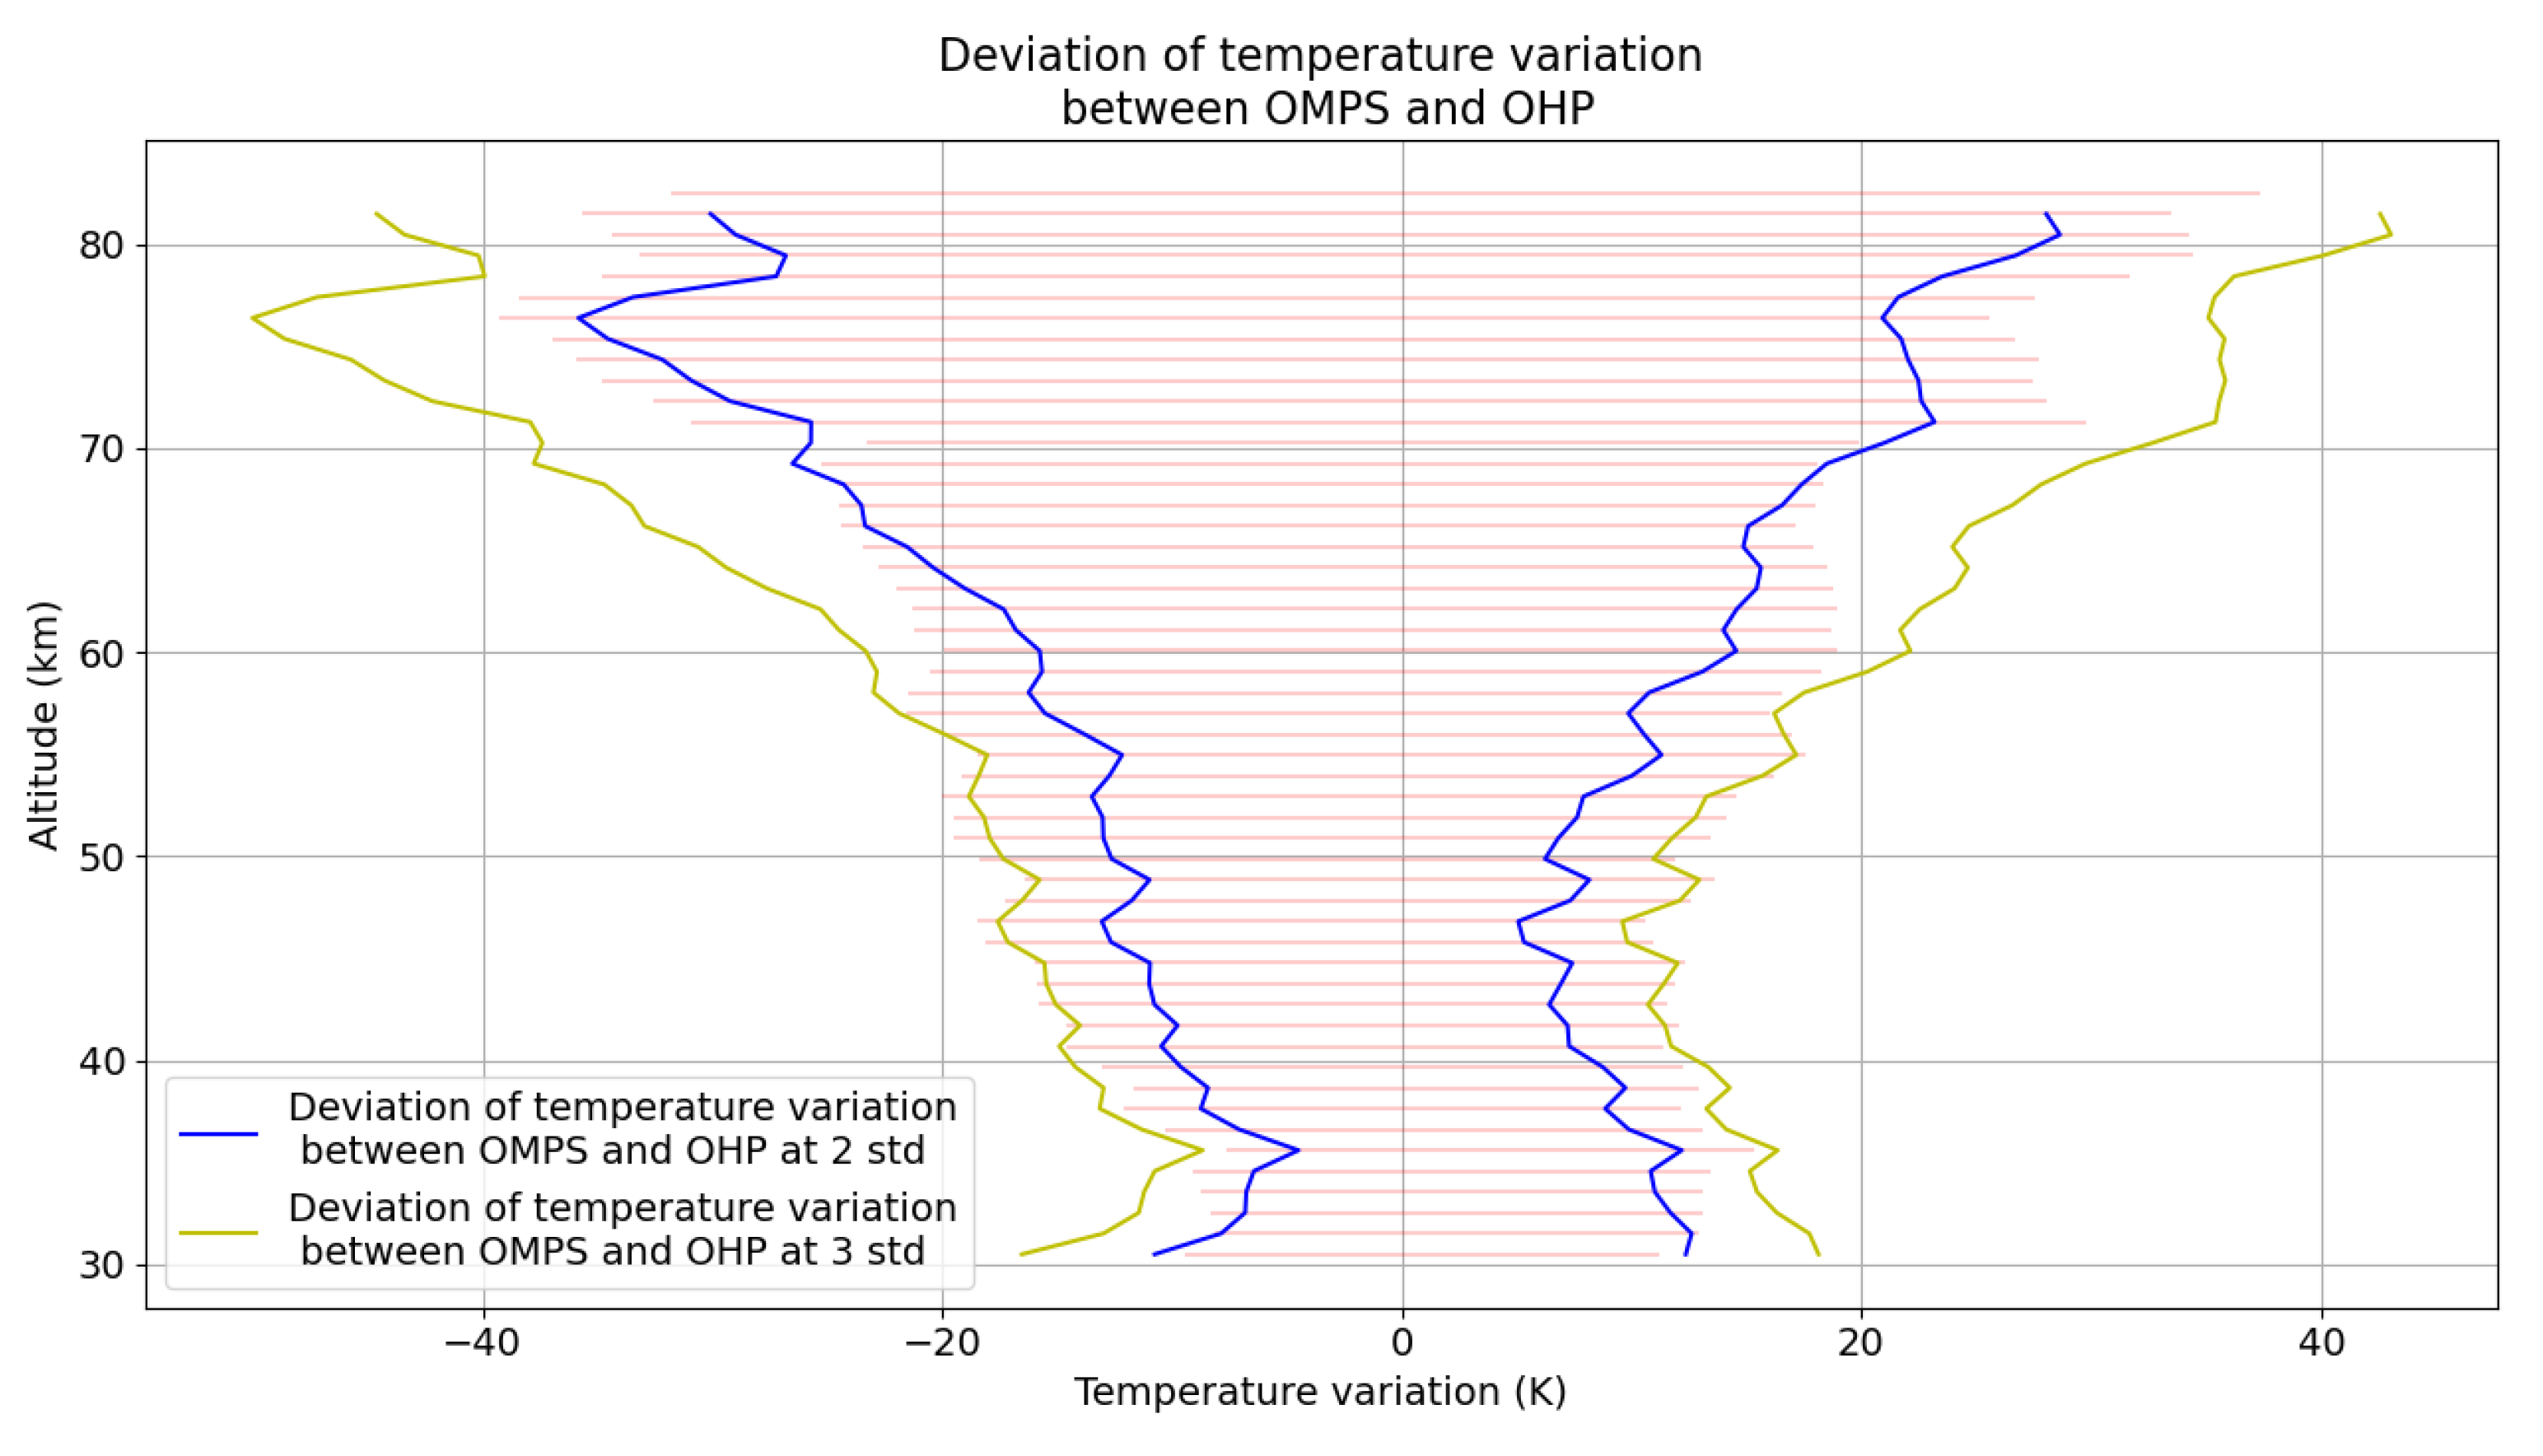
At higher altitudes, the standard deviation increases gradually in the mesosphere, due to gravity waves and instrumental errors in the Lidar and OMPS signals. The systematic deviations observed in the mesosphere may be induced by atmospheric tides, as the measurements are not obtained at the same time. We note that for HOH and OHP the standard deviation drops suddenly at very high altitudes. This is only due to the fact that the temperature profiles of these lidars generally stop earlier than MLO and RUN, so there are very few values to compare at very high altitudes and the standard deviation is therefore not significant. As can be seen, the uncertainty on these standard deviations is very low except for the last kilometre, where there is a sharp increase. The reason for this is that at this altitude there are far fewer comparisons due to the variable initialisation altitude. It is important to understand that these variations are not ‘errors’ but rather expected results, as illustrated in the diagram below :
Figure 18.
The red zone represents the calculated expected differences. The blue and yellow curves represent the temperature differences between OMPS and OHP at 2 and 3 std.
Figure 18.
The red zone represents the calculated expected differences. The blue and yellow curves represent the temperature differences between OMPS and OHP at 2 and 3 std.
Using an internal procedure, we can calculate the variations due to gravity waves, atmospheric tides and errors in the measurements of the expected lidar caused by the temporal spatial differences between OMPS and the OHP lidar. We then compare the average of the variations calculated throughout the study with the variation in the measurements obtained, and we can see that the calculated variations are between 2 and 3 std of the measured variations.
4.4. Discussion and Conclusion of Comparisons
ERA5 is a meteorological analysis combining a sophisticated atmospheric model and global observations. These temperature fields show excellent results in the stratosphere (Mariaccia et al., 2022). They are also in very good agreement with the OMPS data, down to 50 km (~3 K ). In the mesosphere, on the other hand, the differences increase very quickly at all the lidar sites, confirming the previous results (Mariaccia et al., 2021) confirmed with observations from the other lidar sites. The differences between the OMPS data and the MSIS climatological model show a high degree of consistency between the sites and are very similar to the differences with the lidars, MSIS being a climatological model showing excellent results on average.
MLS, which is one of the only sources of temperature measurements in the AM, generally has the largest deviations from OMPS, except in the case of ERA5 in the upper mesosphere. Note that the vertical resolution of MLS is between 3 and 6 km, while that of OMPS, ERA5 and MSIS is 1 km. In addition, the orbit of the AURA satellite on which MLS is located is in a 13:30 sun-synchronous orbit, same as SNPP. There are good coincidences beetween OMPS and MLS approximately every 32 days, so it is difficult to determine how MLS is affected by atmospheric tides and gravity waves.
5. Application to a Miniaturised Instrument
5.1. Application to a Miniaturised Instrument
One of the aims of this study was also to test whether this method would be reliable enough for application on a smaller instrument such as a cubesat. The lack of temperature data in the mesosphere, the biases and drifts observed with the European centre model and the interference with atmospheric tides are driving the development of a nanosat constellation looking at molecular diffusion (Keckhut et al., 2021). Tests carried out using GOMOS limb observations on ENVISAT had already demonstrated the benefits (Hauchecrone et al., 2019). But the complexity of measuring the GOMOS limbus with a tracker that scans the limbus seemed difficult to miniaturise. The method used in the OMPS instrument (Jaross et al., 2014), by projecting the image of the entire limbus onto a single CCD seems more suitable and the use of a dispersive element, is not necessary and would further simplify a small instrument. This study, carried out using the OMPS instrument, showed that it was possible to obtain excellent results from molecular scattering using an OMPS-type instrument, and in a more simplified way than GOMOS. The OMPS instrument can nevertheless be used to test the value of different wavelengths.
5.2. Signal Strength
Section 4.2 showed that attenuation on profiles below 330 nm no longer allows temperature profiles to be obtained up to 30 km, so these wavelengths should be avoided.
We can obtain temperature profiles via radiance profiles over the entire range of solar radiance in the visible and even in the near UV at a minimum starting altitude of 35 km. Below this altitude, molecular scattering is supplemented by a contribution from aerosols suspended at these altitudes. As these effects are more significant at longer wavelengths, it seems preferable to use shorter wavelengths.
5.3. Noise Assessment
The 83 km limit in this study is not due to the method but to the limit of the measurement zone over which the OMPS electronics look at the limb. As shown in
Section 3.1, this configuration does not allow the noise level to be estimated correctly. The method used here shows that it is possible with the model to eliminate bias, but ideally it is important to have a larger field of view. This will correct all the measurement problems associated with noise. It should be noted, however, that the profiles least affected by this correction are the UV profiles, which shows that once again it seems preferable to use these wavelengths.
5.4. NO2 and O3 Corrections
The source of error linked to Rayleigh scattering is easily corrected using ERA5 profiles, which are very good when this starts to have an impact on the results. Ozone absorption can easily be avoided by measuring the radiance between the Huggins and Chappuis absorption bands. The NO2 correction remains stable throughout the usable spectral range and is therefore difficult to avoid. To avoid correcting the profiles as much as possible, it is therefore preferable to use the wavelengths where the total attenuation of the signal is lowest, between the Huggins and Chappuis absorption bands.
6. Conclusions
Comparisons between OMPS, the lidars of the NDACC network, MLS and the MSIS and ERA5 models show that it is possible to obtain temperature profiles from images of the limb between 30 and 83 km. We have seen that the median difference oscillates around 0 K with maximum peaks of 5 K. The variations in the measured deviations correspond to between 2 and 3 e-c of the calculated deviations, showing that the gravity wave and atmospheric tide phenomena that occur between OMPS and the lidars are well observed.
The study also made it possible to establish all the difficulties involved in a project to monitor temperature in the middle atmosphere using CCD measurements of radiance at the limb. Stray light that can to errors of up to 150 K in the upper mesosphere needs to be corrected either by extending the field of view beyond molecular diffusion, like 130 km, or by estimating it using a simulated profile. Aerosol pollution starts between 30 and 35 km altitude and intensifies as altitude decreases or wavelength increases. Finally, simple scattering and absorption by O3 and NO2 are factors to be taken into account when designing such a mission because we’ve seen that they can generate errors of up to 120 K, and to avoid all these effects as much as possible it is preferable to observe the limb between Huggins and Chappuis band of absorption.
In addition to creating a completely new database using OMPS data, which covers the whole planet in an area (the Middle Atmosphere) that is very difficult to study, this method of calculating temperature is very easy to use and can be applied to any instrument that measures the radiance of the Earth’s limb between between 30 and 130 km in all the visible and near-UV wavelengths with better results nearby 340 nm to limit aerosols effect or 385 to limit correction, as has already been proved by the GOMOS instrument, This opens the door to the creation of a limb temperature database using existing instruments and future instruments embedded, for example, in cubesats, thus drastically reducing the number of times we have to observe our beautiful planet.
Acknowledgments
Lidar data used in this publication are publicly available as part of the Network for the Detection of Atmospheric Composition Change (NDACC) and are available through the NDACC international website:
www.ndacc.org and through the French national center for Atmospheric data and services AERIS:
www.aeris-data.fr/projects/ndacc-france. Lidar operation are supported by CNRS, NASA, CNES, La Réunion and Versailles Saint-Quentin en Yvelines universities. This project was performed with the support of the Direction de l’Armement from the French Ministry of Armed Forces under the contract 202395002. The OMPS data used in this publication are freely accessible via the
https://www.earthdata.nasa.gov/ website.
References
- Ardalan, M., Keckhut, P., Hauchecorne, A., Wing, R., Meftah, M., & Farhani, G. (2022). Updated Climatology of Mesospheric Temperature Inversions Detected by Rayleigh Lidar above Observatoire de Haute Provence, France, Using a K-Mean Clustering Technique. Atmosphere, 13(5), 814. [CrossRef]
- Baldwin, M. P., & Dunkerton, T. J. (2001). Stratospheric harbingers of anomalous weather regimes. Science, 294(5542), 581-584. [CrossRef]
- Baldwin, M. P., Stephenson, D. B., Thompson, D. W. J., Dunkerton, T. J., Charlton, A. J., & O’Neill, A. (2003). Stratospheric memory and skill of Extended-Range weather forecasts. Science, 301(5633), 636-640. [CrossRef]
- Beagley, S. R., McLandress, C., Fomichev, V. I., & Ward, W. E. (2000). The extended Canadian Middle Atmosphere model. Geophysical Research Letters, 27(16), 2529-2532. [CrossRef]
- Beig, G., Keckhut, P., Lowe, R. P., Roble, R. G., Mlynczak, M. G., Scheer, J., Fomichev, V. I., Offermann, D., French, J., Shepherd, M. G., Semenov, A. I., Remsberg, E. E., She, C. Y., Lübken, F., Bremer, J., Clemesha, B. R., Stegman, J., Sigernes, F., & Fadnavis, S. (2003). Review of Mesospheric temperature Trends. Reviews Of Geophysics, 41(4). [CrossRef]
- Bell, B., Hersbach, H., Simmons, A., Berrisford, P., Dahlgren, P., Horányi, A., Muñoz-Sabater, J., Nicolas, J., Radu, R., Schepers, D., Soci, C., Villaume, S., Bidlot, J., Haimberger, L., Woollen, J., Buontempo, C., & Thépaut, J. (2021). The ERA5 global reanalysis : Preliminary extension to 1950. Quarterly Journal Of The Royal Meteorological Society, 147(741), 4186-4227. [CrossRef]
- Bogumil, K., Orphal, J., Homann, T., Voigt, S., Spietz, P., Fleischmann, O., Vogel, A., Hartmann, M., Kromminga, H., Bovensmann, H., Frerick, J., & Burrows, J. (2003). Measurements of molecular absorption spectra with the SCIAMACHY pre-flight model : instrument characterization and reference data for atmospheric remote-sensing in the 230–2380 nm region. Journal Of Photochemistry And Photobiology. A, Chemistry, 157(2-3), 167-184. [CrossRef]
- Bucholtz, A. (1995). Rayleigh-scattering calculations for the terrestrial atmosphere. Applied Optics, 34(15), 2765. [CrossRef]
- Chandrasekhar. (1960). Radiative Transfer. New York : Dover Publications.
- Charlton-Perez, A., Ferranti, L., & Lee, R. W. (2018). The influence of the stratospheric state on North Atlantic weather regimes. Quarterly Journal Of The Royal Meteorological Society, 144(713), 1140-1151. [CrossRef]
- Chen, Z., Schwartz, M. J., Bhartia, P. K., Schoeberl, M., Kramarova, N., Jaross, G., & DeLand, M. (2023). Mesospheric and Upper Stratospheric Temperatures From OMPS-LP. Earth And Space Science, 10(5). [CrossRef]
- Clancy, R. T., Rusch, D. W., & Callan, M. (1994). Temperature minima in the average thermal structure of the Middle Mesosphere (70–80 km) from analysis of 40- to 92-km SME global temperature profiles. Journal Of Geophysical Research, 99(D9), 19001-19020. [CrossRef]
- Dou, X., Li, T., Xu, J., Liu, H., Xue, X., Wang, S., Leblanc, T., McDermid, I. S., Hauchecorne, A., Keckhut, P., Bencherif, H., Heinselman, C., Steinbrecht, W., Mlynczak, M. G., & Russell, J. M. (2009). Seasonal oscillations of middle atmosphere temperature observed by Rayleigh lidars and their comparisons with TIMED/SABER observations. Journal Of Geophysical Research, 114(D20). [CrossRef]
- Emmert, J. T., Drob, D. P., Bernath, P. F., Siskind, D. E., Jones, M., Mlynczak, M. G., Bernath, P. F., Chu, X., Doornbos, E., Funke, B., et al. (2021). NRLMSIS 2.0 : A Whole-Atmosphere Empirical Model of Temperature and Neutral Species Densities. Earth And Space Science, 8(3). [CrossRef]
- Fishbein, E., Cofield, R. E., Froidevaux, L., Jarnot, R. F., Lungu, T. A., Read, W. G., Shippony, Z., Waters, J. W., McDermid, I. S., McGee, T. J., Singh, U. N., Gross, M. R., Hauchecorne, A., Keckhut, P., Gelman, M. E., & Nagatani, R. M. (1996). Validation of UARS Microwave Limb Sounder temperature and pressure measurements. Journal Of Geophysical Research, 101(D6), 9983-10016. [CrossRef]
- Funatsu, B. M., Claud, C., Keckhut, P., & Hauchecorne, A. (2008). Cross-validation of Advanced Microwave Sounding Unit and lidar for long-term upper-stratospheric temperature monitoring. Journal Of Geophysical Research, 113(D23). [CrossRef]
- Funatsu, B. M., Claud, C., Keckhut, P., Hauchecorne, A., & Leblanc, T. (2016). Regional and seasonal stratospheric temperature trends in the last decade (2002–2014) from AMSU observations. Journal Of Geophysical Research. Atmospheres, 121(14), 8172-8185. [CrossRef]
- Gille, J. C., Bailey, P. L., Massie, S. T., Lyjak, L. V., Edwards, D. P., Roche, A. E., Kumer, J. B., Mergenthaler, J. L., Gross, M. R., Hauchecorne, A., Keckhut, P., McGee, T. J., McDermid, I. S., Miller, A. J., & Singh, U. N. (1996). Accuracy and precision of cryogenic limb array etalon spectrometer (CLAES) temperature retrievals. Journal Of Geophysical Research, 101(D6), 9583-9601. [CrossRef]
- Gorshelev, V., Serdyuchenko, A., Weber, M., Chehade, W., & Burrows, J. P. (2014). High spectral resolution ozone absorption cross-sections – Part 1 : Measurements, data analysis and comparison with previous measurements around 293 K. Atmospheric Measurement Techniques, 7(2), 609-624. [CrossRef]
- Hauchecorne, A., Blanot, L., Wing, R., Keckhut, P., Khaykin, S., Bertaux, J., Meftah, M., Claud, C., & Sofieva, V. (2019). A new MesosphEO data set of temperature profiles from 35 to 85 km using Rayleigh scattering at limb from GOMOS/ENVISAT daytime observations. Atmospheric Measurement Techniques, 12(1), 749-761. [CrossRef]
- Hauchecorne, A., & Chanin, M. (1980). Density and temperature profiles obtained by LIDAR between 35 and 70 km. Geophysical Research Letters, 7(8), 565-568. [CrossRef]
- Hauchecorne, A., Keckhut, P., & Chanin, M. (2009). Dynamics and transport in the middle atmosphere using remote sensing techniques from ground and space. Dans Springer eBooks (p. 665-683). [CrossRef]
- Hersbach, H., Bell, B., Berrisford, P., Hirahara, S., Horányi, Á., Muñoz-Sabater, J., Nicolas, J. P., Peubey, C., Radu, R., Schepers, D., Simmons, A. J., Soci, C., Abdalla, S., Abellan, X., Balsamo, G., Bechtold, P., Biavati, G., Bidlot, J., Bonavita, M.,... Thépaut, J. (2020). The ERA5 global reanalysis. Quarterly Journal Of The Royal Meteorological Society, 146(730), 1999-2049. [CrossRef]
- Hervig, M. E., Russell, J. M., Gordley, L. L., Park, J. H., Drayson, S. R., & Deshler, T. (1996). Validation of aerosol measurements from the halogen occultation experiment. Journal Of Geophysical Research, 101(D6), 10267-10275. [CrossRef]
- Jaross, G., Bhartia, P. K., Chen, G., Kowitt, M., Haken, M., Chen, Z., Xu, P., Warner, J., & Kelly, T. (2014). OMPS Limb Profiler instrument performance assessment. Journal Of Geophysical Research. Atmospheres, 119(7), 4399-4412. [CrossRef]
- Keckhut, P., Hauchecorne, A., & Chanin, M. (1993). A Critical Review of the Database Acquired for the Long-Term Surveillance of the Middle Atmosphere by the French Rayleigh Lidars. Journal Of Atmospheric And Oceanic Technology, 10(6), 850-867. [CrossRef]
- Keckhut, P., Hauchecorne, A., Meftah, M., Khaykin, S., Claud, C., & Simoneau, P. (2021). Middle-Atmosphere temperature monitoring addressed with a constellation of CubeSats dedicated to climate issues. Journal Of Atmospheric And Oceanic Technology, 38(3), 685-693. [CrossRef]
- Keckhut, P., McDermid, S., Swart, D., McGee, T., Godin-Beekmann, S., Adriani, A., Barnes, J., Baray, J., Bencherif, H., Claude, H., Di Sarra, A. G., Fiocco, G., Hansen, G., Hauchecorne, A., Leblanc, T., Lee, C. H., Pal, S., Megie, G., Nakane, H.,... Thayer, J. (2004). Review of ozone and temperature lidar validations performed within the framework of the Network for the Detection of Stratospheric Change. Journal Of Environmental Monitoring, 6(9), 721. [CrossRef]
- Keckhut, P., McDermid, S., Swart, D., McGee, T. J., Godin-Beekmann, S., Adriani, A., Barnes, J., Baray, J., Benchérif, H., Claude, H., Di Sarra, A., Fiocco, G., Hansen, G., Hauchecorne, A., Leblanc, T., Lee, C. H., Pal, S. R., Mégie, G., Nakane, H.,... Thayer, J. P. (2004). Review of ozone and temperature lidar validations performed within the framework of the Network for the Detection of Stratospheric Change. Journal Of Environmental Monitoring, 6(9), 721. [CrossRef]
- Keckhut, P., Randel, W. J., Claud, C., Leblanc, T., Steinbrecht, W., Funatsu, B. M., Benchérif, H., McDermid, I. S., Hauchecorne, A., Long, C. S., Lin, R., & Baumgarten, G. (2011). An evaluation of uncertainties in monitoring middle atmosphere temperatures with the ground-based LIDAR network in support of space observations. Journal Of Atmospheric And Solar-Terrestrial Physics, 73(5-6), 627-642. [CrossRef]
- Keckhut, P., Schmidlin, F., Hauchecorne, A., & Chanin, M. (1999). Stratospheric and mesospheric cooling trend estimates from u.s. rocketsondes at low latitude stations (8°S–34°N), taking into account instrumental changes and natural variability. Journal Of Atmospheric And Solar-terrestrial Physics, 61(6), 447-459. [CrossRef]
- Khaykin, S. M., Godin-Beekmann, S., Keckhut, P., Hauchecorne, A., Jumelet, J., Vernier, J., Bourassa, A., Degenstein, D. A., Rieger, L. A., Bingen, C., Vanhellemont, F., Robert, C., DeLand, M., & Bhartia, P. K. (2017). Variability and evolution of the midlatitude stratospheric aerosol budget from 22 years of ground-based lidar and satellite observations. Atmospheric Chemistry And Physics, 17(3), 1829-1845. [CrossRef]
- Kramarova, N. A., Bhartia, P. K., Jaross, G., Moy, L., Xu, P., Chen, Z., DeLand, M., Froidevaux, L., Livesey, N., Degenstein, D., Bourassa, A., Walker, K. A., & Sheese, P. (2018). Validation of ozone profile retrievals derived from the OMPS LP version 2.5 algorithm against correlative satellite measurements. Atmospheric Measurement Techniques, 11(5), 2837-2861. [CrossRef]
- Kurylo, M. J., & Solomon, S. (1990). Network for the Detection of Stratospheric Change (NASA Report, Code EEU).
- Kyrölä, E., Andersson, M. E., Verronen, P. T., Laine, M., Tukiainen, S., & Marsh, D. R. (2018). Middle atmospheric ozone, nitrogen dioxide and nitrogen trioxide in 2002–2011 : SD-WACCM simulations compared to GOMOS observations. Atmospheric Chemistry And Physics, 18(7), 5001-5019. [CrossRef]
- Kyrölä, E., Tamminen, J., Leppelmeier, G., Sofieva, V., Hassinen, S., Bertaux, J., Hauchecorne, A., Dalaudier, F., Cot, C., Korablev, O., D’Andon, O. F., Barrot, G., Mangin, A., Théodore, B., Guirlet, M., Etanchaud, F., Snoeij, P., Koopman, R., Saavedra, L.,... Vanhellemont, F. (2004). GOMOS on Envisat : an overview. Advances In Space Research, 33(7), 1020-1028. [CrossRef]
- Ladstädter, F., Steiner, A., Foelsche, U., Haimberger, L., Tavolato, C., & Kirchengast, G. (2011). An assessment of differences in lower stratospheric temperature records from (A)MSU, radiosondes, and GPS radio occultation. Atmospheric Measurement Techniques, 4(9), 1965-1977. [CrossRef]
- Leblanc, T., McDermid, I. S., Hauchecorne, A., & Keckhut, P. (1998). Evaluation of optimization of lidar temperature analysis algorithms using simulated data. Journal Of Geophysical Research, 103(D6), 6177-6187. [CrossRef]
- Mariaccia, A., Keckhut, P., & Hauchecorne, A. (2022). Classification of stratosphere winter evolutions into four different scenarios in the Northern hemisphere. Journal Of Geophysical Research : Atmospheres, 127(13). [CrossRef]
- Mariaccia, A., Keckhut, P., & Hauchecorne, A. (2023). Classification of stratosphere winter evolutions into four different scenarios in the Northern hemisphere : Part B coupling with the surface. Authorea (Authorea). [CrossRef]
- Mariaccia, A., Keckhut, P., Hauchecorne, A., Claud, C., Pichon, A. L., Meftah, M., & Khaykin, S. (2022). Assessment of ERA-5 temperature variability in the middle atmosphere using Rayleigh LIDAR measurements between 2005 and 2020. Atmosphere, 13(2), 242. [CrossRef]
- Marlton, G., Charlton-Perez, A., Harrison, G., Polichtchouk, I., Hauchecorne, A., Keckhut, P., Wing, R., Leblanc, T., & Steinbrecht, W. (2021). Using a network of temperature LIDARs to identify temperature biases in the upper stratosphere in ECMWF reanalyses. Atmospheric Chemistry And Physics, 21(8), 6079-6092. [CrossRef]
- Maury, P., Claud, C., Manzini, E., Hauchecorne, A., & Keckhut, P. (2016). Characteristics of stratospheric warming events during Northern winter. Journal Of Geophysical Research. Atmospheres, 121(10), 5368-5380. [CrossRef]
- Meftah, M., Clavier, C., Sarkissian, A., Hauchecorne, A., Bekki, S., Lefêvre, F., Galopeau, P. H. M., Dahoo, P., Pazmiño, A., Vieau, A., Dufour, C., Maso, P., Caignard, N., Ferreira, F., Gilbert, P., D’Andon, O. H. F., Mathieu, S., Mangin, A., Billard, C., & Keckhut, P. (2023). Uvsq-Sat NG, a New CubeSat Pathfinder for Monitoring Earth Outgoing Energy and Greenhouse Gases. Remote Sensing, 15(19), 4876. [CrossRef]
- Meftah, M., Sarkissian, A., Keckhut, P., & Hauchecorne, A. (2023). The SOLAR-HRS New High-Resolution Solar Spectra for Disk-Integrated, Disk-Center, and Intermediate Cases. Remote Sensing, 15(14), 3560. [CrossRef]
- Mzé, N., Hauchecorne, A., Keckhut, P., & Thétis, M. (2014). Vertical distribution of gravity wave potential energy from long-term Rayleigh lidar data at a northern middle-latitude site. Journal Of Geophysical Research. Atmospheres, 119(21). [CrossRef]
- Osprey, S., Gray, L. J., Hardiman, S. C., Butchart, N., Bushell, A. C., & Hinton, T. (2010). The climatology of the Middle Atmosphere in a vertically extended version of the Met Office’s climate Model. Part I : Mean state. Journal Of The Atmospheric Sciences, 67(5), 1509-1525. [CrossRef]
- Parker, D. E., & Cox, D. I. (1995). Towards a consistent global climatological rawinsonde data-base. International Journal Of Climatology, 15(5), 473-496. [CrossRef]
- Picone, J. M., Hedin, A. E., Drob, D. P., & Aikin, A. C. (2002). NRLMSISE-00 empirical model of the atmosphere : Statistical comparisons and scientific issues. Journal Of Geophysical Research, 107(A12). [CrossRef]
- Remsberg, E. E., Bhatt, P. P., & Deaver, L. E. (2002). Seasonal and longer-term variations in middle atmosphere temperature from HALOE on UARS. Journal Of Geophysical Research, 107(D19). [CrossRef]
- Ridolfi, M., Blum, U., Carli, B., Catoire, V., Ceccherini, S., Claude, H., De Clercq, C., Fricke, K. H., Friedl-Vallon, F., Iarlori, M., Keckhut, P., Kerridge, B., Lambert, J., Meijer, Y. J., Mona, L., Oelhaf, H., Pappalardo, G., Pirre, M., Rizi, V.,... Wetzel, G. (2007). Geophysical validation of temperature retrieved by the ESA processor from MIPAS/ENVISAT atmospheric limb-emission measurements. Atmospheric Chemistry And Physics, 7(16), 4459-4487. [CrossRef]
- Rind, D., Suozzo, R., & Balachandran, N. K. (1988). The GISS Global Climate-Middle Atmosphere Model. Part II. Model variability due to interactions between planetary waves, the mean circulation and gravity wave drag. Journal Of The Atmospheric Sciences, 45(3), 371-386. [CrossRef]
- Rind, D., Suozzo, R., Balachandran, N. K., Lacis, A. A., & Russell, G. L. (1988). The GISS Global Climate-Middle Atmosphere Model. Part I : Model Structure and Climatology. Journal Of The Atmospheric Sciences, 45(3), 329-370. [CrossRef]
- Salby, M. L., Callaghan, P., Keckhut, P., Godin, S., & Guirlet, M. (2002). Interannual changes of temperature and ozone : relationship between the lower and upper stratosphere. Journal Of Geophysical Research, 107(D18). [CrossRef]
- Serdyuchenko, A., Gorshelev, V., Weber, M., Chehade, W., & Burrows, J. P. (2014). High spectral resolution ozone absorption cross-sections – Part 2 : Temperature dependence. Atmospheric Measurement Techniques, 7(2), 625-636. [CrossRef]
- Shaw, T. A., Perlwitz, J., & Weiner, O. M. (2014). Troposphere-Stratosphere coupling : links to North Atlantic weather and climate, including their representation in CMIP5 models. Journal Of Geophysical Research : Atmospheres, 119(10), 5864-5880. [CrossRef]
- Sheese, P. E., Strong, K., Llewellyn, E. J., Gattinger, R. L., Russell, J. M., Boone, C. D., Hervig, M. E., Sica, R. J., & Bandoro, J. (2012). Assessment of the quality of OSIRIS mesospheric temperatures using satellite and ground-based measurements. Atmospheric Measurement Techniques, 5(12), 2993-3006. [CrossRef]
- Shepherd, M. G., Reid, B., Zhang, S., Solheim, B. H., Shepherd, G. G., Wickwar, V. B., & Herron, J. P. (2001). Retrieval and validation of mesospheric temperatures from wind imaging interferometer observations. Journal Of Geophysical Research, 106(A11), 24813-24829. [CrossRef]
- Sica, R. J., Izawa, M. R. M., Walker, K. A., Boone, C., Petelina, S. V., Argall, P. S., Bernath, P., Burns, G. B., Catoire, V., Collins, R. L., Daffer, W. H., De Clercq, C., Fan, Z. Y., Firanski, B. J., French, W. J. R., Gerard, P., Gerding, M., Granville, J., Innis, J. L.,... Thurairajah, B. (2008). Validation of the Atmospheric Chemistry Experiment (ACE) version 2.2 temperature using ground-based and space-borne measurements. Atmospheric Chemistry And Physics, 8(1), 35-62. [CrossRef]
- Singh, U. N., Keckhut, P., McGee, T. J., Gross, M. R., Hauchecorne, A., Fishbein, E. F., Waters, J. W., Gille, J. C., Roche, A. E., & Russell, J. M. (1996a). Stratospheric temperature measurements by two collocated NDSC lidars during UARS validation campaign. Journal Of Geophysical Research, 101(D6), 10287-10297. [CrossRef]
- Singh, U. N., Keckhut, P., McGee, T. J., Gross, M. R., Hauchecorne, A., Fishbein, E., Waters, J. W., Gille, J. C., Roche, A. E., & Russell, J. M. (1996b). Stratospheric temperature measurements by two collocated NDSC lidars during UARS validation campaign. Journal Of Geophysical Research, 101(D6), 10287-10297. [CrossRef]
- Sivakumar, V., Prasanth, V. P., Kishore, P., Bencherif, H., & Keckhut, P. (2011). Rayleigh LIDAR and satellite (HALOE, SABER, CHAMP and COSMIC) measurements of stratosphere-mesosphere temperature over a southern sub-tropical site, Reunion (20.8° S ; 55.5° E) : climatology and comparison study. Annales Geophysicae, 29(4), 649-662. [CrossRef]
- Srivastava, N., Mierla, M., & Zhang, J. (2021). Editorial : Space Weather Prediction : Challenges and Prospects. Frontiers In Astronomy And Space Sciences, 8. [CrossRef]
- Tett, S. F. B., Betts, R., Crowley, T. J., Gregory, J., Johns, T. C., Jones, A., Osborn, T. J., Öström, E., Roberts, D. L., & Woodage, M. J. (2006). The impact of natural and anthropogenic forcings on climate and hydrology since 1550. Climate Dynamics, 28(1), 3-34. [CrossRef]
- Wild, J. D., Gelman, M. E., Miller, A. J., Chanin, M. L., Hauchecorne, A., Keckhut, P., Farley, R., Dao, P. D., Meriwether, J. W., Gobbi, G. P., Congeduti, F., Adriani, A., McDermid, I. S., McGee, T. J., & Fishbein, E. F. (1995). Comparison of stratospheric temperatures from several lidars, using National Meteorological Center and microwave limb sounder data as transfer references. Journal Of Geophysical Research, 100(D6), 11105-11111. [CrossRef]
- Wing, R., Hauchecorne, A., Keckhut, P., Godin-Beekmann, S., Khaykin, S., & McCullough, E. (2018). LIDAR Temperature Series in the Middle Atmosphere as a reference data set – Part 2 : Assessment of temperature observations from MLS/AURA and SABER/TIMED satellites. Atmospheric Measurement Techniques, 11(12), 6703-6717. [CrossRef]
- Wing, R., Hauchecorne, A., Keckhut, P., Godin-Beekmann, S., Khaykin, S., McCullough, E. M., Mariscal, J., & D’Almeida, É. (2018). Lidar temperature series in the middle atmosphere as a reference data set – Part 1 : Improved retrievals and a 20-year cross-validation of two co-located French lidars. Atmospheric Measurement Techniques, 11(10), 5531-5547. [CrossRef]
- Wing, R., Hauchecorne, A., Keckhut, P., Godin-Beekmann, S., Khaykin, S., McCullough, E., Mariscal, J., & D’Almeida, É. (2018). LIDAR Temperature Series in the Middle Atmosphere as a reference data set – Part 1 : Improved retrievals and a 20-year cross-validation of two co-located French LIDARs. Atmospheric Measurement Techniques, 11(10), 5531-5547. [CrossRef]
- Wing, R., Steinbrecht, W., Godin-Beekmann, S., McGee, T. J., Sullivan, J. T., Sumnicht, G., Ancellet, G., Hauchecorne, A., Khaykin, S., & Keckhut, P. (2020). Intercomparison and evaluation of ground- and satellite-based stratospheric ozone and temperature profiles above Observatoire de Haute-Provence during the Lidar Validation NDACC Experiment (LAVANDE). Atmospheric Measurement Techniques, 13(10), 5621-5642. [CrossRef]
- Wu, D. L., Read, W. G., Shippony, Z., Leblanc, T., Duck, T. J., Ortland, D. A., Sica, R. J., Argall, P. S., Oberheide, J., Hauchecorne, A., Keckhut, P., She, C. Y., & Krueger, D. A. (2003). Mesospheric temperature from UARS MLS : retrieval and validation. Journal Of Atmospheric And Solar-Terrestrial Physics, 65(2), 245-267. [CrossRef]
|
Disclaimer/Publisher’s Note: The statements, opinions and data contained in all publications are solely those of the individual author(s) and contributor(s) and not of MDPI and/or the editor(s). MDPI and/or the editor(s) disclaim responsibility for any injury to people or property resulting from any ideas, methods, instructions or products referred to in the content. |
© 2024 by the authors. Licensee MDPI, Basel, Switzerland. This article is an open access article distributed under the terms and conditions of the Creative Commons Attribution (CC BY) license (http://creativecommons.org/licenses/by/4.0/).
