
Submitted:
20 August 2024
Posted:
21 August 2024
You are already at the latest version
Abstract
The continued success of any conventional sweet potato breeding program is limited to knowledge of the inheritance of the traits studied, such as flesh color and tuberous root shape, because it is difficult to fractionate color frequencies by visual separation. The objective was to understand the mode of inheritance of these genetic traits. The crossing blocks were established at the Research Institute of Tropical Roots and Tuber Crops (INIVIT-Cuba). Eight parental genotypes of known compatibility were selected, with contrasting phenotypic characteristics to develop seg-regating populations. To express color objectively, the CIE L*a*b* color space was used (L*: lumi-nosity; a* and b*: chromatic coordinates), in addition, four morphometric variables associated with the shape and dimensions of the tuberous roots were evaluated. From 2419 reciprocal cross-es, 2045 botanical seeds and 1764 seedlings were obtained. Incomplete dominance of the white and purple flesh colors over the orange color was observed, as well as transgressive segregation for purple, orange and white flesh colours, and for the shape of the tuberous roots. The results al-lowed to propose a genetic model of biparental crosses to improve the flesh color of I. batatas, as well as a predictive formula of the progenies to be selected.
Keywords:
breeding
; crosses
; dominance
; flesh color
; inheritance
; segregation
1. Introduction
For the first time in the history of biology, Gregor Mendel subjected biological phenomena to high numerical rigor, with a solid mathematical and statistical basis. Mendel created a predictive theory based on the species Pisum sativum L. (2x), and with it a whole new field of science, “Genetics”. Mendel’s work is considered “one of the triumphs of the human mind” [1,2].
Sweet potato (Ipomoea batatas [L.] Lam.) is a hexaploid species (2n=6x=90), with basic number x=15 [3]. The mode of inheritance (allo or autopolyploid) is of great importance in population genetic studies of I. batatas. The most recent molecular studies consider that sweet potato is an autoallopolyploid, with some preferential pairing during meiosis [4] and autopolyploid [5].
Linkage map studies have shown that sweet potato follows the polysomic inheritance route [4,6]. The following models have been suggested: disomic, tetrasomic, tetradisomic and hexasomic in I. batatas [6,7], so the genetics of simple traits is more complex with up to six alleles per locus. In a 2x species and the simple case of one locus and biallelism, there are three genotypes: AA, Aa and aa and seven possible genotypes for an autohexaploid (A6, A5a, A4a2, A3a3, A2a4, Aa5, a6) [8]. At 6x within the allele frequency range of approximately q = 0.2 to q = 0.8, the frequency of heterozygosity remains > 0.75 [9], which means that heterozygous genotypes occur at much higher frequencies.
Recently, few investigations related to the phenotypic segregation of I. batatas have been developed. The main characters studied have been the shape of the leaf [10,11], color of the stem [12,13], shape of the tuberous roots [14] and color of the skin and flesh of the tuberous roots [11,15]
The most studied trait has been the color of the flesh of tuberous roots, due to its importance for consumers. The color (white, cream, orange, yellow and purple) is generally influenced by the level of metabolites found in tuberous roots [16]. Orange sweet potatoes present β-carotene (carotenoid) as the main compound [17]; on the other hand, purple sweet potatoes have bioactive compounds such as phenolic acids, flavonoids and anthocyanins in their chemical composition [18]. These phytochemicals have antioxidant properties with numerous health benefits and may present antibacterial, antitumor, antiviral, antimutagenic activity, in addition to acting as cardioprotective agents [19]. Furthermore, frequent consumption of foods with significant amounts of these antioxidants can reduce the risk of developing degenerative diseases, such as some types of cancer, and contributes to the delay of cellular aging [20].
Despite multiple studies on the inheritance of the color of the tuberous roots of I. batatas, there is inconsistency about the genetics that govern this trait [9,21], mainly because there are no homozygous genotypes due to their homomorphic multiallelic self-incompatibility of the sporophytic type [22]. In addition, the difficulty of fractionating color frequencies in sweet potato (between cream and yellow tones and between different intensities of red) by visual separation has been reported [11,23]. Currently, to avoid inconsistencies and to express color objectively (numerical terms), different color spaces are used, including the CIE L*a*b* (L*: lightness; a* and b*: chromatic coordinates). [15] studied the segregated color of sweet potato flesh using the CIE L*a*b* color space, took into account only one combination (cream flesh x yellow flesh). None of the previous research on this topic considered the purple-fleshed genotypes of I. batatas in their different possible cross-breeding combinations; this is due to its relatively recent discovery [24]. In addition, tuberous roots shape has not been investigated using professional software for digital image analysis.
Genetic improvement of sweet potato is the main way to maintain its constant genetic gain, focused on obtaining superior genotypes. Hybridization to generate segregating populations and select new genotypes has allowed to increase the average yield, the content of carotenes and anthocyanins, improve stability and adaptability, and tolerance to some pests (Cylas formicarius Fab., Typophorus nigritus F. and nematodes), allowing for greater adoption of new varieties [25]. The continued success of genetics improvement programs has its limits. It is based on the selection of genotypes with as many superior traits as possible with wide genetic distances, to be used as parents in the directed crossing blocks and the subsequent precision in the selection of seedlings. During the last decades, important advances have been made with the breeding scheme used. However, it has been observed that the improvement of some traits (flesh color and tuberous root shape) has reached a limited potential level. If greater success is to be achieved in obtaining more efficient and genetically balanced cultivars, it is of utmost importance to understand the mode of inheritance of genetic traits.
2. Materials and Methods
2.1. Study Area
The crossing blocks were established at the Research Institute of Tropical Roots and Tuber Crops (INIVIT), municipality of Santo Domingo, province of Villa Clara, Cuba, located at 22º35’00´´N and 80º14-18´´W, at 50 meters above sea level. The design was planted under field conditions, from August 2022 to March 2023, in a soft brown carbonated soil [26].
2.2. Crossing Blocks
Eight parental genotypes of known compatibility were selected. At the end of August 2022, 20 plants from each parent were planted at a distance of 1 × 1 m with stakes. The meteorological data were recorded in the automatic meteorological station belonging to the institute (national meteorological network code: 78326, data: http://www.insmet.cu). Controlled cross-pollination of the selected parental genotypes began in early December 2023. The flowers used as female were emasculated in the afternoon of the previous day and covered with sections of large absorbent straws (0.7 cm in diameter) cut in length of approximately 3 cm. The flowers used as a pollen source were covered in the same way, without emasculating. Cross-pollinations were carried out the next day between 0700 and 1000 h. Each pollinated flower was labeled according to the parents and re-covered with the absorbent straw sections, and daily records of the crossings were kept. Irrigation was applied as needed to maintain the plants in a moderately vigorous growing condition.
2.3. Botanical Seeds and Seedlings
Seeds were harvested as the flower pedicel became necrotic, separated according to parentage, cleaned, placed in paper envelopes and stored. The seeds were cleaned and placed in paper envelopes for storage. Each batch of seeds from individual crosses was assigned a family code, ISS 230#: I = INIVIT, S = seed, S = sweet potato, 23 = year 2023 y 0# = family number. The seeds were scarified by a physical method (nail clippers), the day before sowing they were placed in Petri dishes and water was applied up to approximately 2 mm in height. In June 2023, they were sown in CRAS (Center for Accelerated Seed Reproduction) chambers of the INIVIT at a distance of 5 cm between seedlings and 20 cm between rows, where they were grown for up to 50 days. Seedlings of all F1 parental combinations had a 30 cm cutting cut from the apical section of the stem. Planting in the field was carried out in July 2023 at a distance of 0.90 x 0.50 m. In November of the same year, the seedlings were harvested and part of the foliage from each one was placed independently in paper bags and labeled with the code corresponding to the family.
2.4. Characters Investigated
To determine the inheritance pattern of the characters: flesh color and tuberous root shape, parents with contrasting phenotypic characteristics were selected and thus develop segregating populations of I. batatas. The strategy and phenotypic characters of the parents are presented in Table 1.
2.5. Morphometric Variables
The samples were photographed individually with a Canon EOS 600D camera. The tuberous roots of the various families were washed and dried before determining their color. Seven morphometric variables will be used (Table 2), four directed to the shape and dimensions of the tuberous roots (C, AR, R and S), and three to the color of the skin and flesh of the tuberous roots (L*, a*, b*). Three points were measured on the skin and three on the flesh (cross section at the midpoint) in three tuberous roots per genotype, obtaining a total of 18 data per genotype. In addition, a controlled environment of temperature (20±2 oC), relative humidity (75±5%) and lighting (500 lx) was guaranteed during the measurement process. The professional digital image analysis software programmed in Java was used: ImageJ ver. 1.46 from the National Institute of Health, following the instructions of [27].
The color space used was CIE. L*a*b* from 1976 of the International Commission on Illumination [28], where: L*=luminosity, a*= red/green coordinates (+a indicates red, -a indicates green) and b * = yellow/blue coordinates (+b indicates yellow, -b indicates blue).
2.6. Statistical Analysis and Visualization
For the estimation of genetic parameters for each trait, the ‘variability’ package [29] of the RStudio 2023.03.1 software will be used. The following genetic parameters will be estimated:
Where:
: phenotypic variance
: genotypic variance
: environmental variance
Where:
Fi: term of the data set
M: medium
N: number of observations.
In the parents, it is inferred that phenotypic differences correspond to environmental differences: , . To determine the y of the progeny, it is taken as the of the parents.
Heritability in the broad sense:
To determine statistical differences between the observed frequencies, the non-parametric Pearson chi-square test (X2) (goodness of fit) was used. Data manipulation, evaluation and plotting were performed using RStudio 2023.03.1 software. All graphs were visualized using ggplot2 [30]. To display the scatterplots were displayed using the geom_jitter() function with ggMarginal(), the density plots were displayed with the geom_density_2d() function and the colors were selected from ColorBrewer [31] and viridis [32]. In order to establish the degree of association between the phenotypic traits investigated, the segregating populations of full siblings of the families from the cross between ‘INIVIT BS-16’ x ‘CEMSA 74-228’ and ‘INIVIT BM-90’ x ‘ISS-18-004’ were used, taking into account simultaneously several traits, without neglecting the relationship between them, the multivariate method used was interdependence [33], since no variable was defined as independent or dependent. In order to know which variables are or are not associated and which influence in the same or opposite direction, a Principal Component Analysis (PCA) was performed, and its eigenvector matrix (coefficients of the linear combinations of the original variables) was interpreted. In addition, a line graph was prepared using the values of the proportion of absolute and accumulated variance (Y axis), explained by each principal component (X axis). The correlation between the original variables and the selected principal components was calculated using formula [34]:
Where:
r(jk) = l(jk) x (λ(κ))1/2/S(ij)
r(jk) = correlation between the original variable x(j) and the k-th component.
l(jk) = j-th element of the k-th eigenvector.
λ(κ) = k-th eigenvalue.
S(ij) = variances of the correlation matrix.
To determine whether or not there was independent segregation of the traits skin color, flesh color and tuberous root shape, an alluvial trend diagram was developed between these traits. For this purpose, the ‘ggalluvial’ package using RStudio 2023.03.1 software was used. In addition, a model based on a decision tree was developed. Through divisions by decision nodes, different subsets of the data set were created. To predict the outcome at each decision node, the probability obtained in the segregating populations of I. batatas was used. For the tree structure, the software EdrawMax ver. 12.5 for Windows was used.
3. Results
3.1. Pollinations
2419 reciprocal crosses were performed, of which 1361 were positive. The percentage of positive pollinations ranged between 45.06 and 72.47%, with an average of 58.57%. 2045 botanical seeds were obtained, the number of these seeds per capsule ranged between 1.17 and 1.98 with an average of 1.54. The percentage of seed germination per family varied between 79.20 and 92.20%, with an average of 86.34%. Finally, 1764 seedlings were obtained (total population) (Table 3).
3.2. Flesh Color of Tuberous Roots
Segregation of tuberous root flesh color trait from all full-sib families was plotted in scatter diagrams with measurements of two morphometric variables (a* and b* coordinates of the CIE L*a*b* color space).
Family ISS-2305 (n =248) from the cross between a white-fleshed parent (CEMSA 74-228; L* = 72.79) and a purple-fleshed parent (INIVIT BM-90; L* = 22.55) had a segregation ratio of 1:2:1 (cream-white:purple:codominant) (64:118:66) (Figure 1A). Purple and white color were codominantly expressed in 26.61% of the total population and 50.76% of the purple-fleshed population (Figure 1B). The estimated broad-sense heritability for the lightness (L*) trait indicated that 94.60% of the proportion of phenotypic differences are due to genotypic differences, suggesting that the effect of the environment on the variation is small. The contour plot of densities (Figure 1C) reflects greater color intensity in two places, towards the left half (cream-white color) and the lower right corner (purple color), so the existence of incomplete dominance between both colors can be inferred. The observed frequencies (X2 = 105.26) (p value < 0.05) do not fit the Mendelian proportions (expected frequencies) (Figure 1).
The F1 generation obtained by crossing two purple-fleshed parents (INIVIT BM-90 [L* = 22.55] x INIVIT BM-8 [L* = 21.68]) (n=198) showed that it is almost entirely made up of purple-fleshed genotypes. The segregation ratio was 8:1:3.5 (purple:cream-white:codominant) (125:16:57). Flesh color was codominantly expressed in 28.78% of the total population and 31.31% of the purple-fleshed population (Figure 2B). The estimated broad-sense heritability for the lightness (L*) trait was 97.02%. Transgressive segregation was observed for purple flesh color, as some seedlings had darker anthocyanin pigmentation than both parents (Figure 2).
The segregation from the cross between two orange-fleshed parents (INIVIT BS-16 [L* = 62.16] x Español [L* = 63.05]) (n=198), presented a monofactorial phenotypic ratio of 2:1:1 (orange:white:yellow) (122:47:52). The estimated broad-sense heritability was 93.25%. The density contour plot (Figure 3C) reflects greater color intensity towards the upper center (orange color). The observed frequencies (X2 =121.20) (p value < 0.05) do not fit the Mendelian proportions. Transgressive segregation was observed for the orange flesh color (Figure 3).
The ISS-2308 family (n = 251) from the cross between a white-fleshed parent (CEMSA 78-326; L* = 74.63) and an orange-fleshed parent (INIVIT BS-16; L* = 62.16) had a segregation ratio of 3.5:1:1.5 (cream-white:yellow:orange) (142:41:68). The estimated broad-sense heritability for the lightness trait (L*) was 91.14%. The contour plot of densities (Figure 4B) reflects greater color intensity towards the lower left corner (cream-white color), so there was incomplete dominance of white over orange color (Figure 4).
The resulting progeny (n = 268) from the cross between an orange-fleshed parent (INIVIT BS-16; L* = 62.16) and a purple-fleshed parent (INIVIT BM 25-19; L* = 24.57) showed a segregation ratio of 5:5:1:2:2 (purple:codominant:white:yellow:orange) (90:80:17:38:43). Clusters with fractional color frequencies of different shades, from white to orange, and different shades of purple were observed (Figure 5A). Purple with white and purple with orange were codominantly expressed in 29.85% of the total population and 47.05% of the purple-fleshed population (Figure 5B). The estimated broad-sense heritability for the lightness (L*) trait was 91.72%. The density contour plot (Figure 5C) reflects greater color intensity in the lower right corner (purple color), so there was incomplete dominance of purple over orange (Figure 5).
The frequencies observed for all families (X2 = > 100) (p value < 0.05) do not fit the Mendelian proportions (expected frequencies).
3.3. Shape of Tuberous Roots
The diversity of shapes obtained from the tuberous roots of the population (n=332) from the cross between two parents with defects on the surface of the tuberous roots (CEMSA 74-228 [Circularity = 0.83, skin with longitudinal grooves] x INIVIT BS-16 [Circularity = 0.64, skin with horizontal constrictions and longitudinal grooves]) was represented with the combinations of four morphometric descriptors (circularity x aspect ratio, Figure 6A) (roundness x solidity, Figure 6C). Circularity, roundness and solidity are sensitive indices for sweet potatoes with defects on the surface of the skin, while aspect ratio can reach proportional values independently of the defects. The progeny resulted to have an average for the circularity character of 0.69, aspect ratio of 1.95, roundness of 0.57 and solidity of 0.93. 44.7% of the population had circularity values between 0.7-0.94, indicating that about half of the population had sweet potatoes with a shape close to circular, in terms of aspect ratio, the population with values above 2-3 (two to three times longer than wide) was 42.5%.
The contour plot of densities (Figure 6C) reflects greater color intensity towards the lower right corner and center, which confirms the above, and is also corroborated by the dispersion diagram between solidity x roundness (Figure 6D).
Of the 332 progenies, 298 produced tuberous roots and only 35 had smooth skin without surface defects (11.74%), for a ratio of 8.5:1 (skin with defects:smooth skin) (Figure 6B). Of the sweet potatoes with AR of 2-3 (42.5% of the total population), only 29.41% had smooth skin, these are the sweet potatoes preferred by the market.
The estimated broad-sense heritability indicated that 37.94% of the proportion of phenotypic differences is due to genotypic differences, suggesting that the effect of the environment on the variation in the shape of tuberous roots is high, and it was also observed that the variation in shape within the same genotype can be high in some.
Similarly, the diversity of forms obtained from tuberous roots in the full-sib family ISS-2311 (n = 246), resulting from two parents without defects on the surface of the tuberous roots (smooth skin) (INIVIT BM-90 [Circularity = 0.67] x ISS-18-004 [Circularity = 0.81]) was represented with the combinations of four morphometric descriptors (Figure 7). Circularity ranged from 0.41 to 0.92, with 48.75% of the population in the range of 0.6 to 0.75 (Figure 7A). Aspect ratio ranged from 1.09-5.34 with 50.0% in the range of 2-3. Considering that the INIVIT BM-90 parent has an AR = 2.55 and ISS-18-004 an AR = 1.83, the quantitative inheritance of this trait and the cumulative effect of several genes are confirmed.
Of the 246 progenies, 219 produced tuberous roots and 71 had smooth skin without surface defects (32.42%), for a ratio of 3:1 (skin with defects:smooth skin) (Figure 7B). Of the sweet potatoes with AR of 2-3 (50.0% of the total population), 33.33% had smooth skin.
The contour plot of densities (Figure 7C) reflects greater color intensity towards the center, indicating that the tuberous roots were generally two to three times longer than wide (Figure 7).
The estimated broad-sense heritability was 29.26%, similarly to the previous family, indicating a strong environmental effect on this trait, as well as intrinsic variation within the same genotype.
3.4. Association between Traits
The correlation matrix of 11 variables evaluated in the progeny resulting from the cross between two parents with defects on the surface of the tuberous roots (CEMSA 74-228 x INIVIT BS-16) was represented (Figure 8A). The correlation between 11 variables (3 for skin color, 3 for flesh color, 4 for tuberous root shape, and 1 for skin type [with defect or smooth]) showed a markedly low and insignificant correlation between the four groups of variables. The correlation coefficient between tuberous root shape and flesh luminosity was r = 0.09 and between tuberous root shape and skin luminosity was r = 0.30, which indicated that there was no linear relationship between these traits.
It was observed that the variance associated with each dimension is different and decreases in order (Figure 8B). The first dimension explained 29.0% of the total variance and the second 23.8%. The first two dimensions together explained 52.8% of the variance. In this sense, the first dimension was the most important because it explained the largest percentage of the variance in the data.
The projection of the correlation between the original variables and the first two dimensions was represented (Figure 8C). The proximity between variables is interpreted as a similarity in their behavior with respect to the progeny (close values in them), and it also means that they are highly correlated with each other and have low correlations with respect to the other variables. This translates into four well-defined variable-point clouds (groups of variables). Those with the greatest contribution (further from the center) in a negative sense were C and R with a high relationship between both, and in a positive sense AR, the directions of the point clouds and their angular separation showed that the variable AR goes in the opposite direction to C and R, this indicates a strong negative correlation. The colorimetric variables contributed less to the variance. The skin type variable is close to the origin, so it had little relationship with the two dimensions. Despite the lack of correlation between L*skin, L*flesh and skin type, the directions of the three variables and their angular separation showed that there could be some relationship between them (Figure 8C). To elucidate this aspect, alluvial diagrams of trends between L*skin and L*flesh and between L*flesh and skin type were made (Figure 10 A and B; Figure 11 A and B).
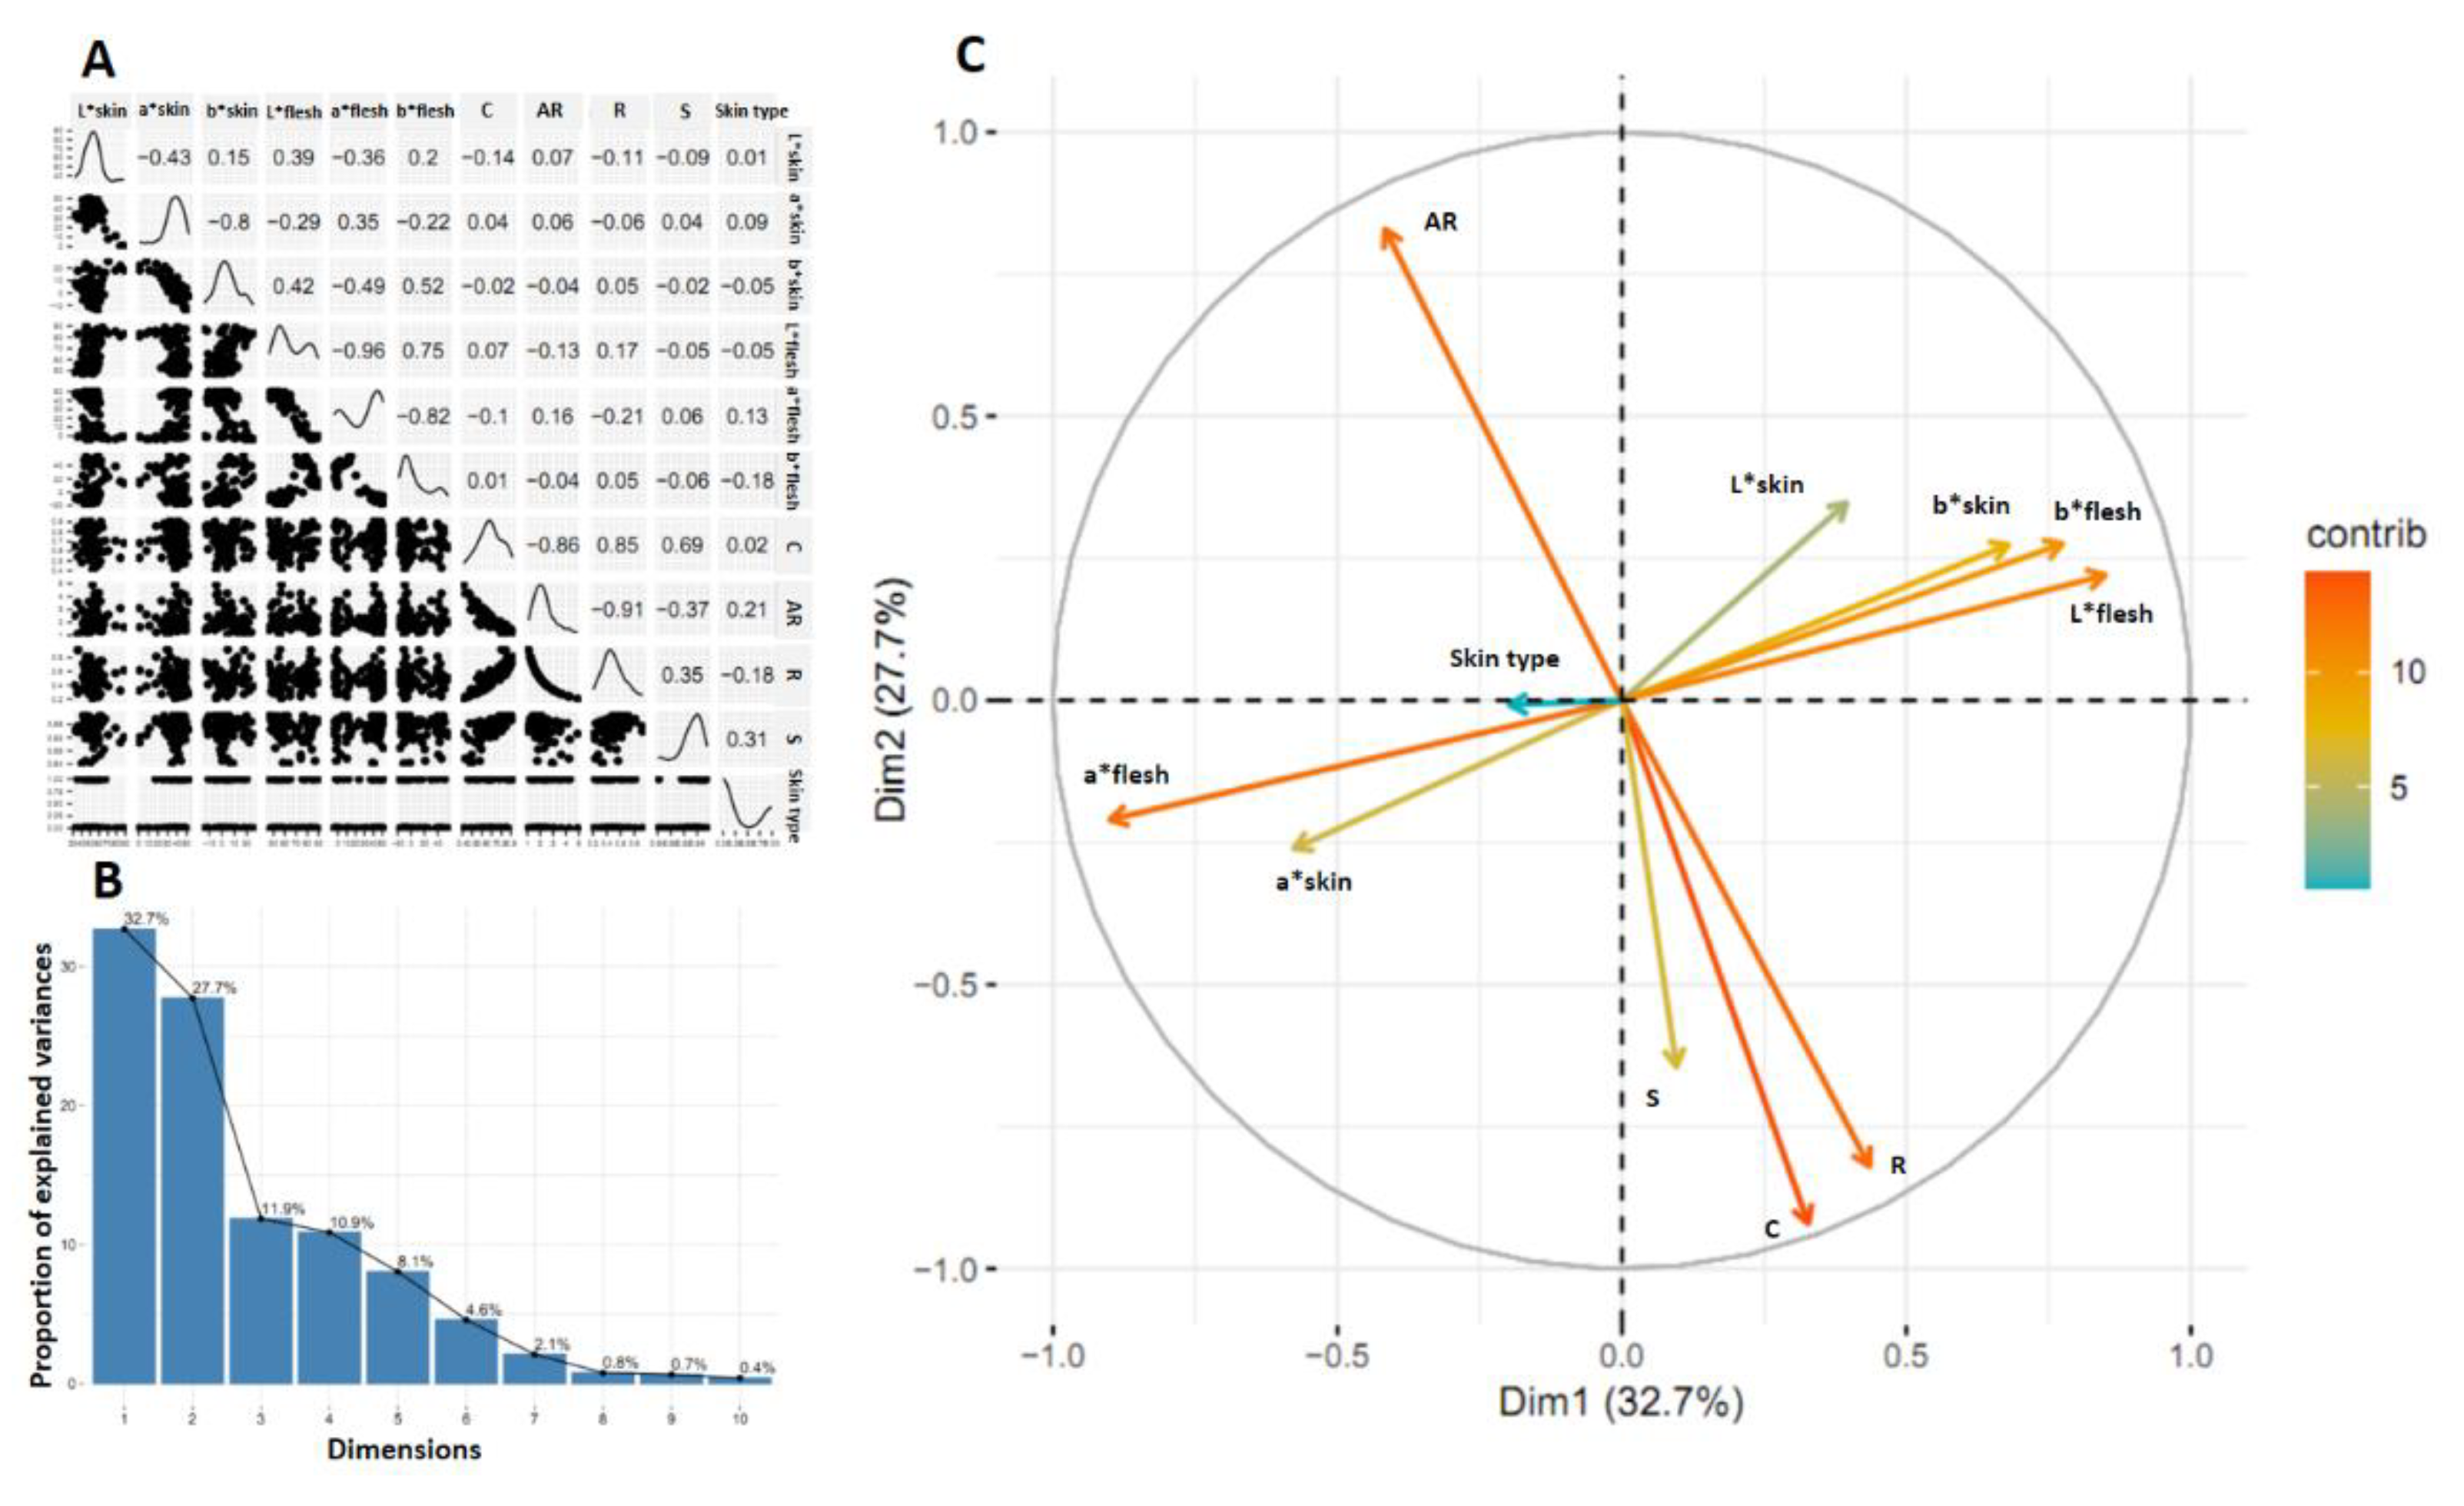
The correlation matrix of 11 variables evaluated in the progeny resulting from the cross between two parents with smooth skin of tuberous roots (INIVIT BM-90 x ISS-18-004) was represented in Figure 9A. The results of the correlation, the variance associated with each dimension (Figure 9B) and the projection of the correlation between the original variables and the first two dimensions (Figure 9C) are similar to the family previously studied, so it is inferred that there is a similarity in the behavior of the variables independently of the families.
Figure 8.
Correlation matrix of 11 variables (A), proportion of variance explained by each dimension (B) and distribution of the correlation values of the variables on the first and second dimensions. Results of the progeny obtained from the cross between two parents with defects on the surface of the tuberous roots (CEMSA 74-228 x INIVIT BS-16).
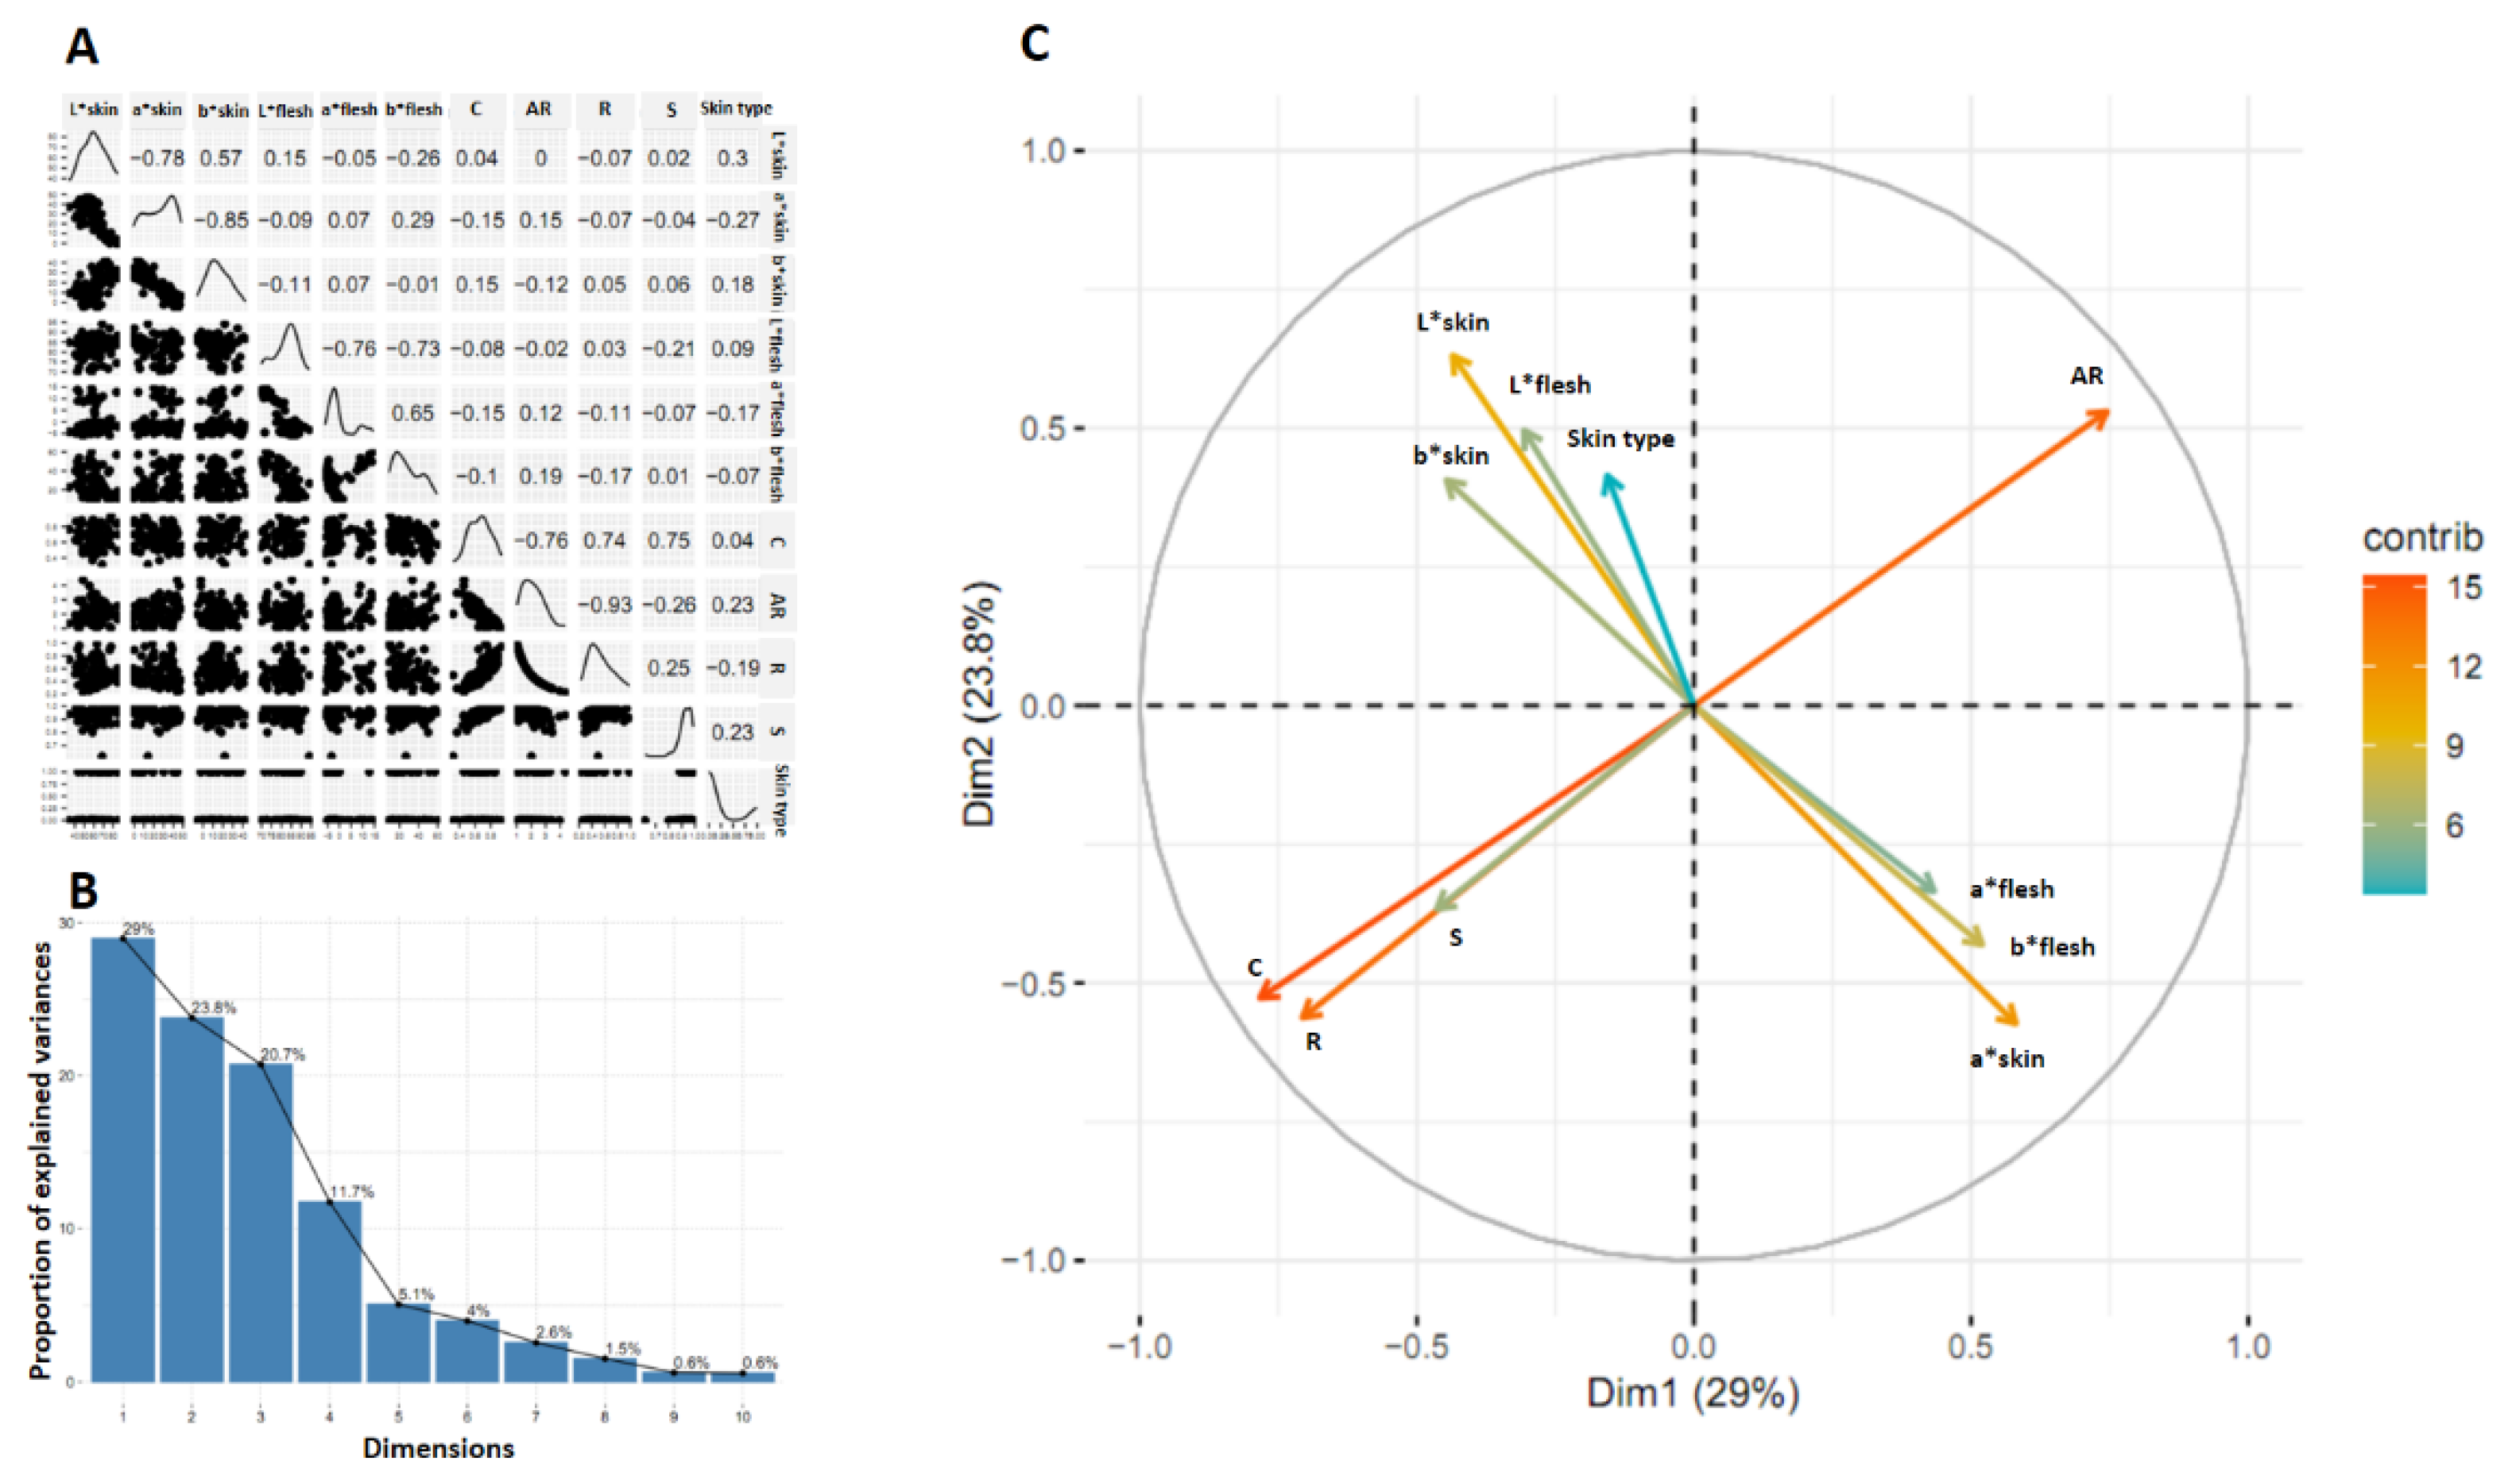
Figure 9.
Correlation matrix of 11 variables (A), proportion of variance explained by each dimension (B) and distribution of the correlation values of the variables on the first and second dimensions. Results of the progeny obtained from the cross between two smooth-skinned parents of tuberous roots (INIVIT BM-90 x ISS-18-004).
To determine whether there was any relationship between different skin colors and any specific flesh color, and between flesh colors and skin type, alluvial diagrams of trends between these traits were made. Figure 10 A and B show the result for the segregating population between two parents with defects on the surface of the tuberous roots, one with red skin and orange flesh (INIVIT BS-16), and another with cream skin and white flesh (CEMSA 74-228).
The yellow-skinned progeny had a greater tendency to have white flesh (1:3), and to a lesser extent yellow (1:11), orange (1:16) and cream (1:23) flesh. Those with orange skin tend to be associated with yellow (1:5) and cream (1:4) flesh, and to a lesser extent orange (1:16). Those with red skin were associated with all flesh colors (yellow, white, orange and cream). There was incomplete dominance of red skin color over cream skin (70% of the population with red skin), and the progenies, regardless of the color of their flesh, mostly had red skin. No genotypes were obtained with the combination of white flesh and orange flesh, however, there were genotypes with cream flesh and orange skin. It can be inferred that these skin and flesh colors have independent segregation, except for orange skin and white flesh (there was no recombination frequency). The low combination of genotypes with orange skin and orange flesh is due to the incomplete dominance of red skin color over other lighter colors (Figure 10A). Progeny with smooth skin were associated with all four flesh colors present in this family, mostly yellow (3:1), white (4:1) and cream (3:1), and to a lesser extent orange (16:1), suggesting that most of the orange-fleshed genotypes had surface skin defects. It is evident that there was no relationship between flesh color and smooth skin, i.e., smooth skin segregates independently of its flesh color (Figure 10B).
Figure 10.
Alluvial diagram of trends between skin color (left vertical axis) and flesh (right vertical axis), flow fields with skin color (A), alluvial diagram between flesh color (left vertical axis) and skin type of tuberous roots (right vertical axis), flow fields with flesh color (B). Results of the progeny obtained from the cross between two parents with defects on the surface of the tuberous roots (CEMSA 74-228 x INIVIT BS-16).
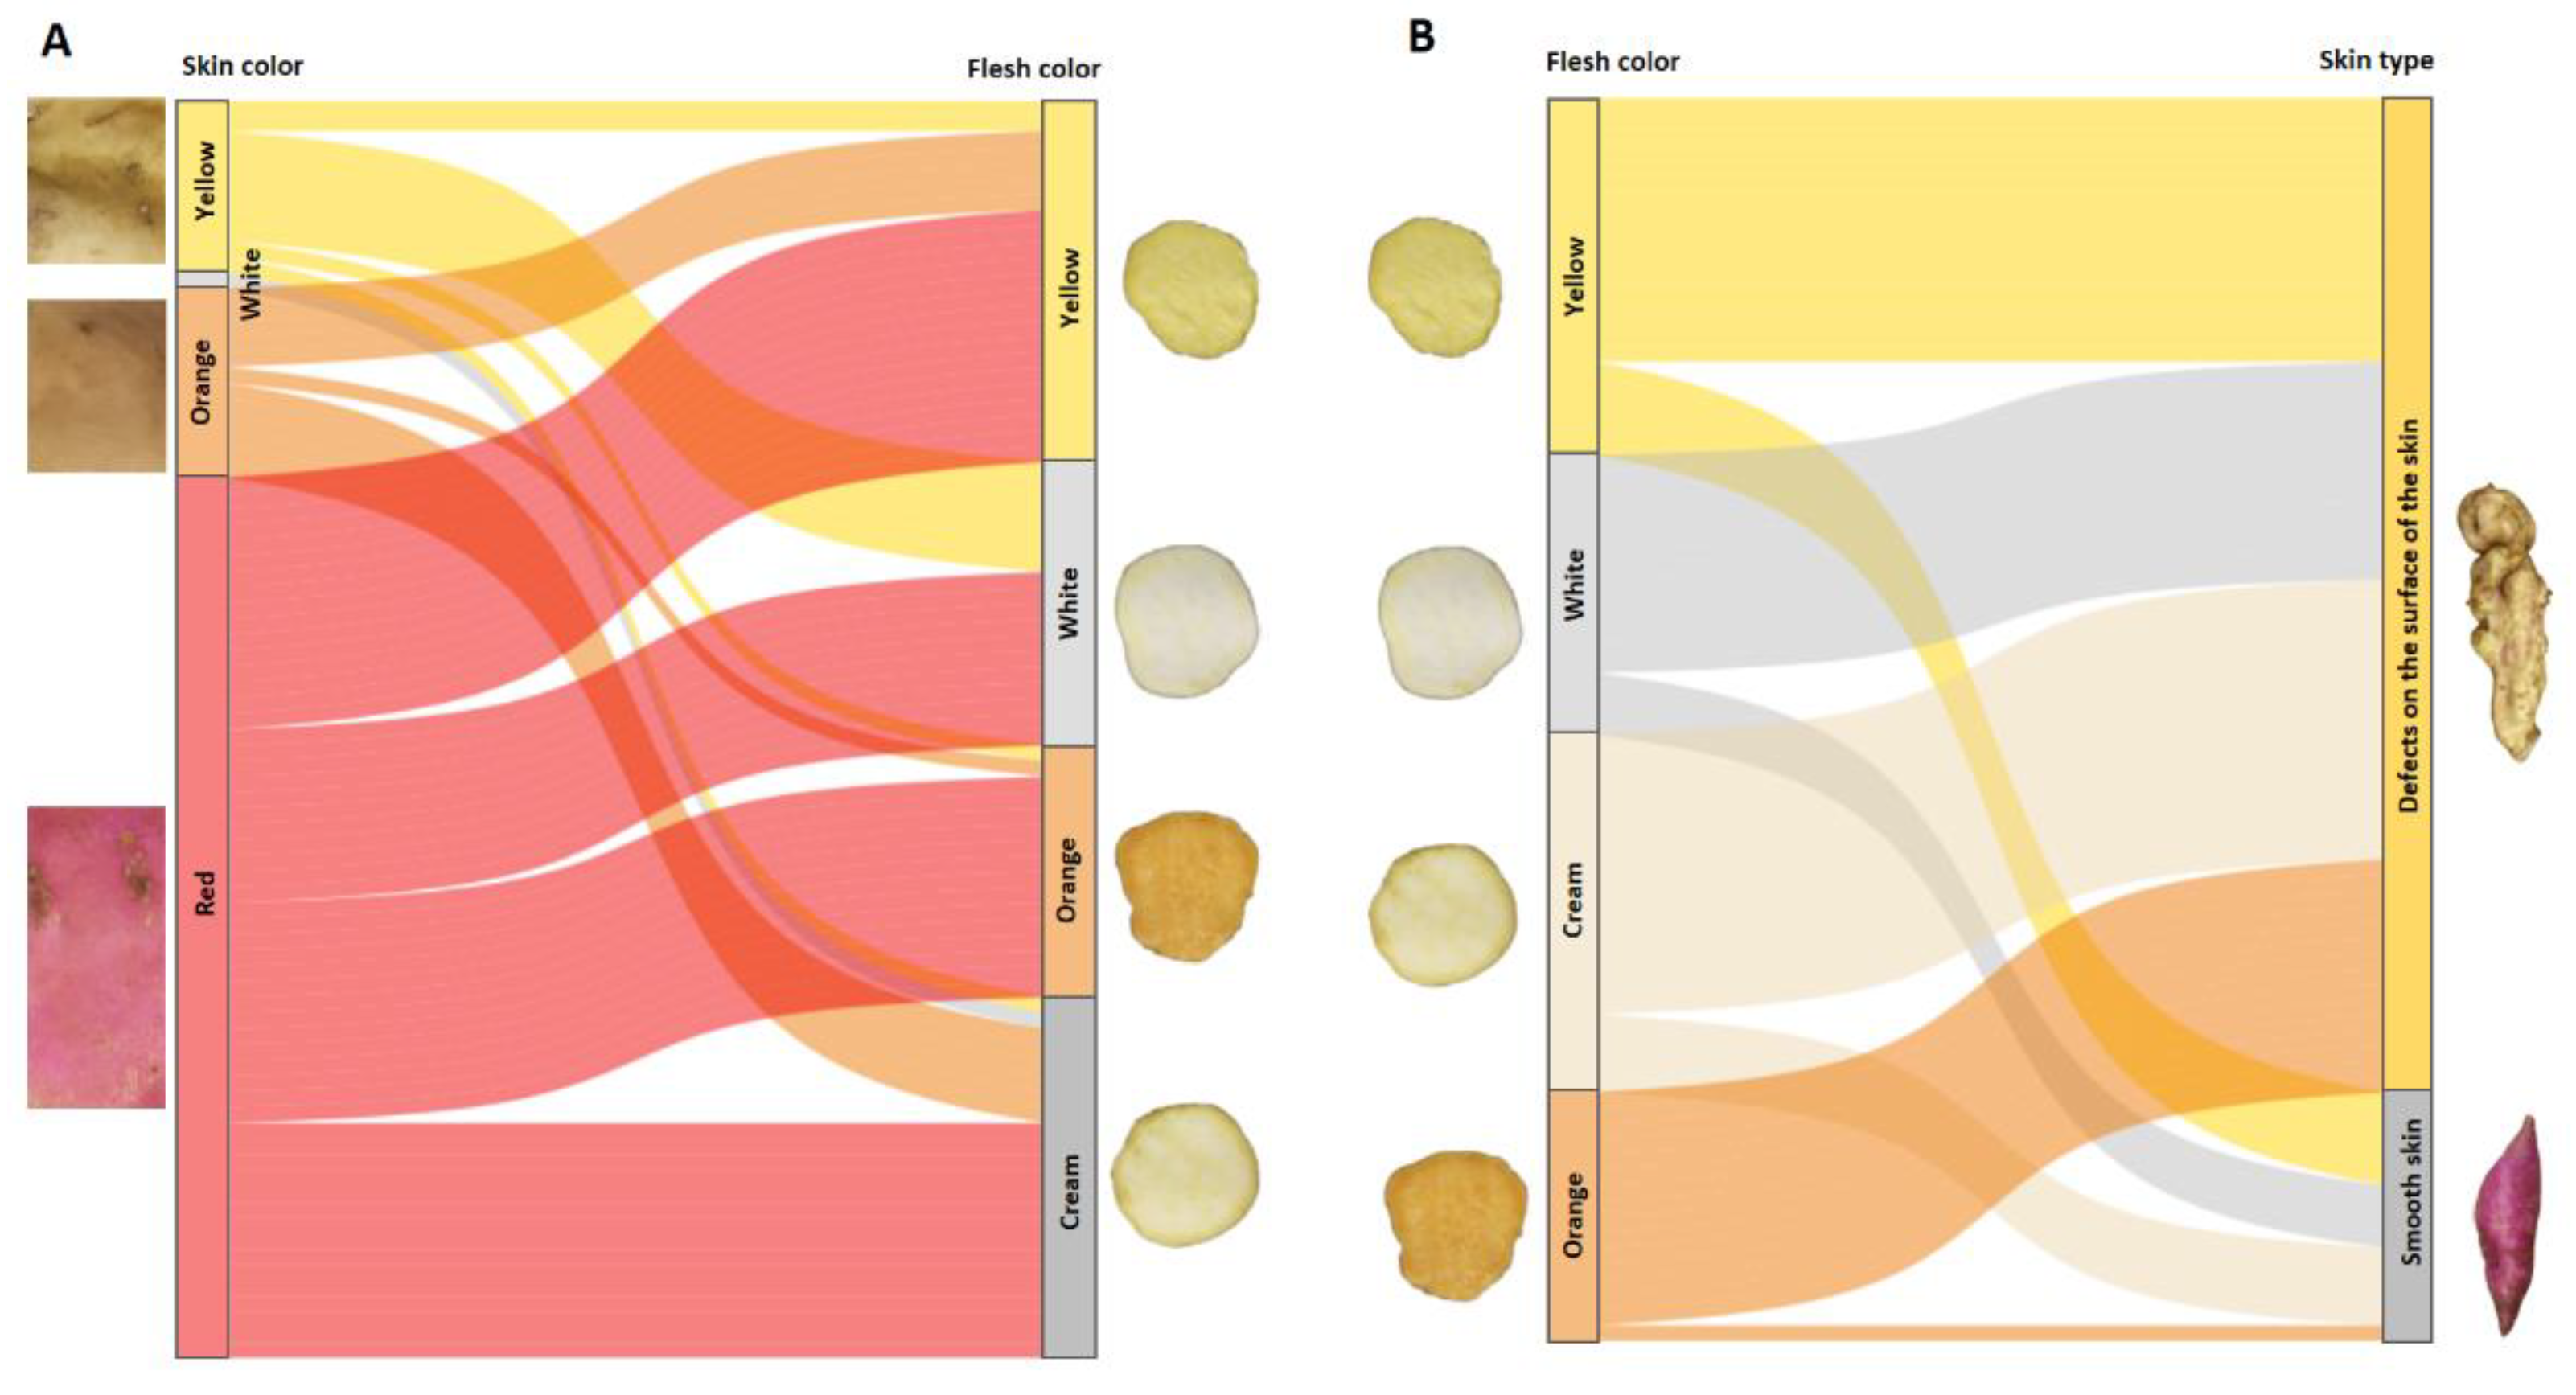
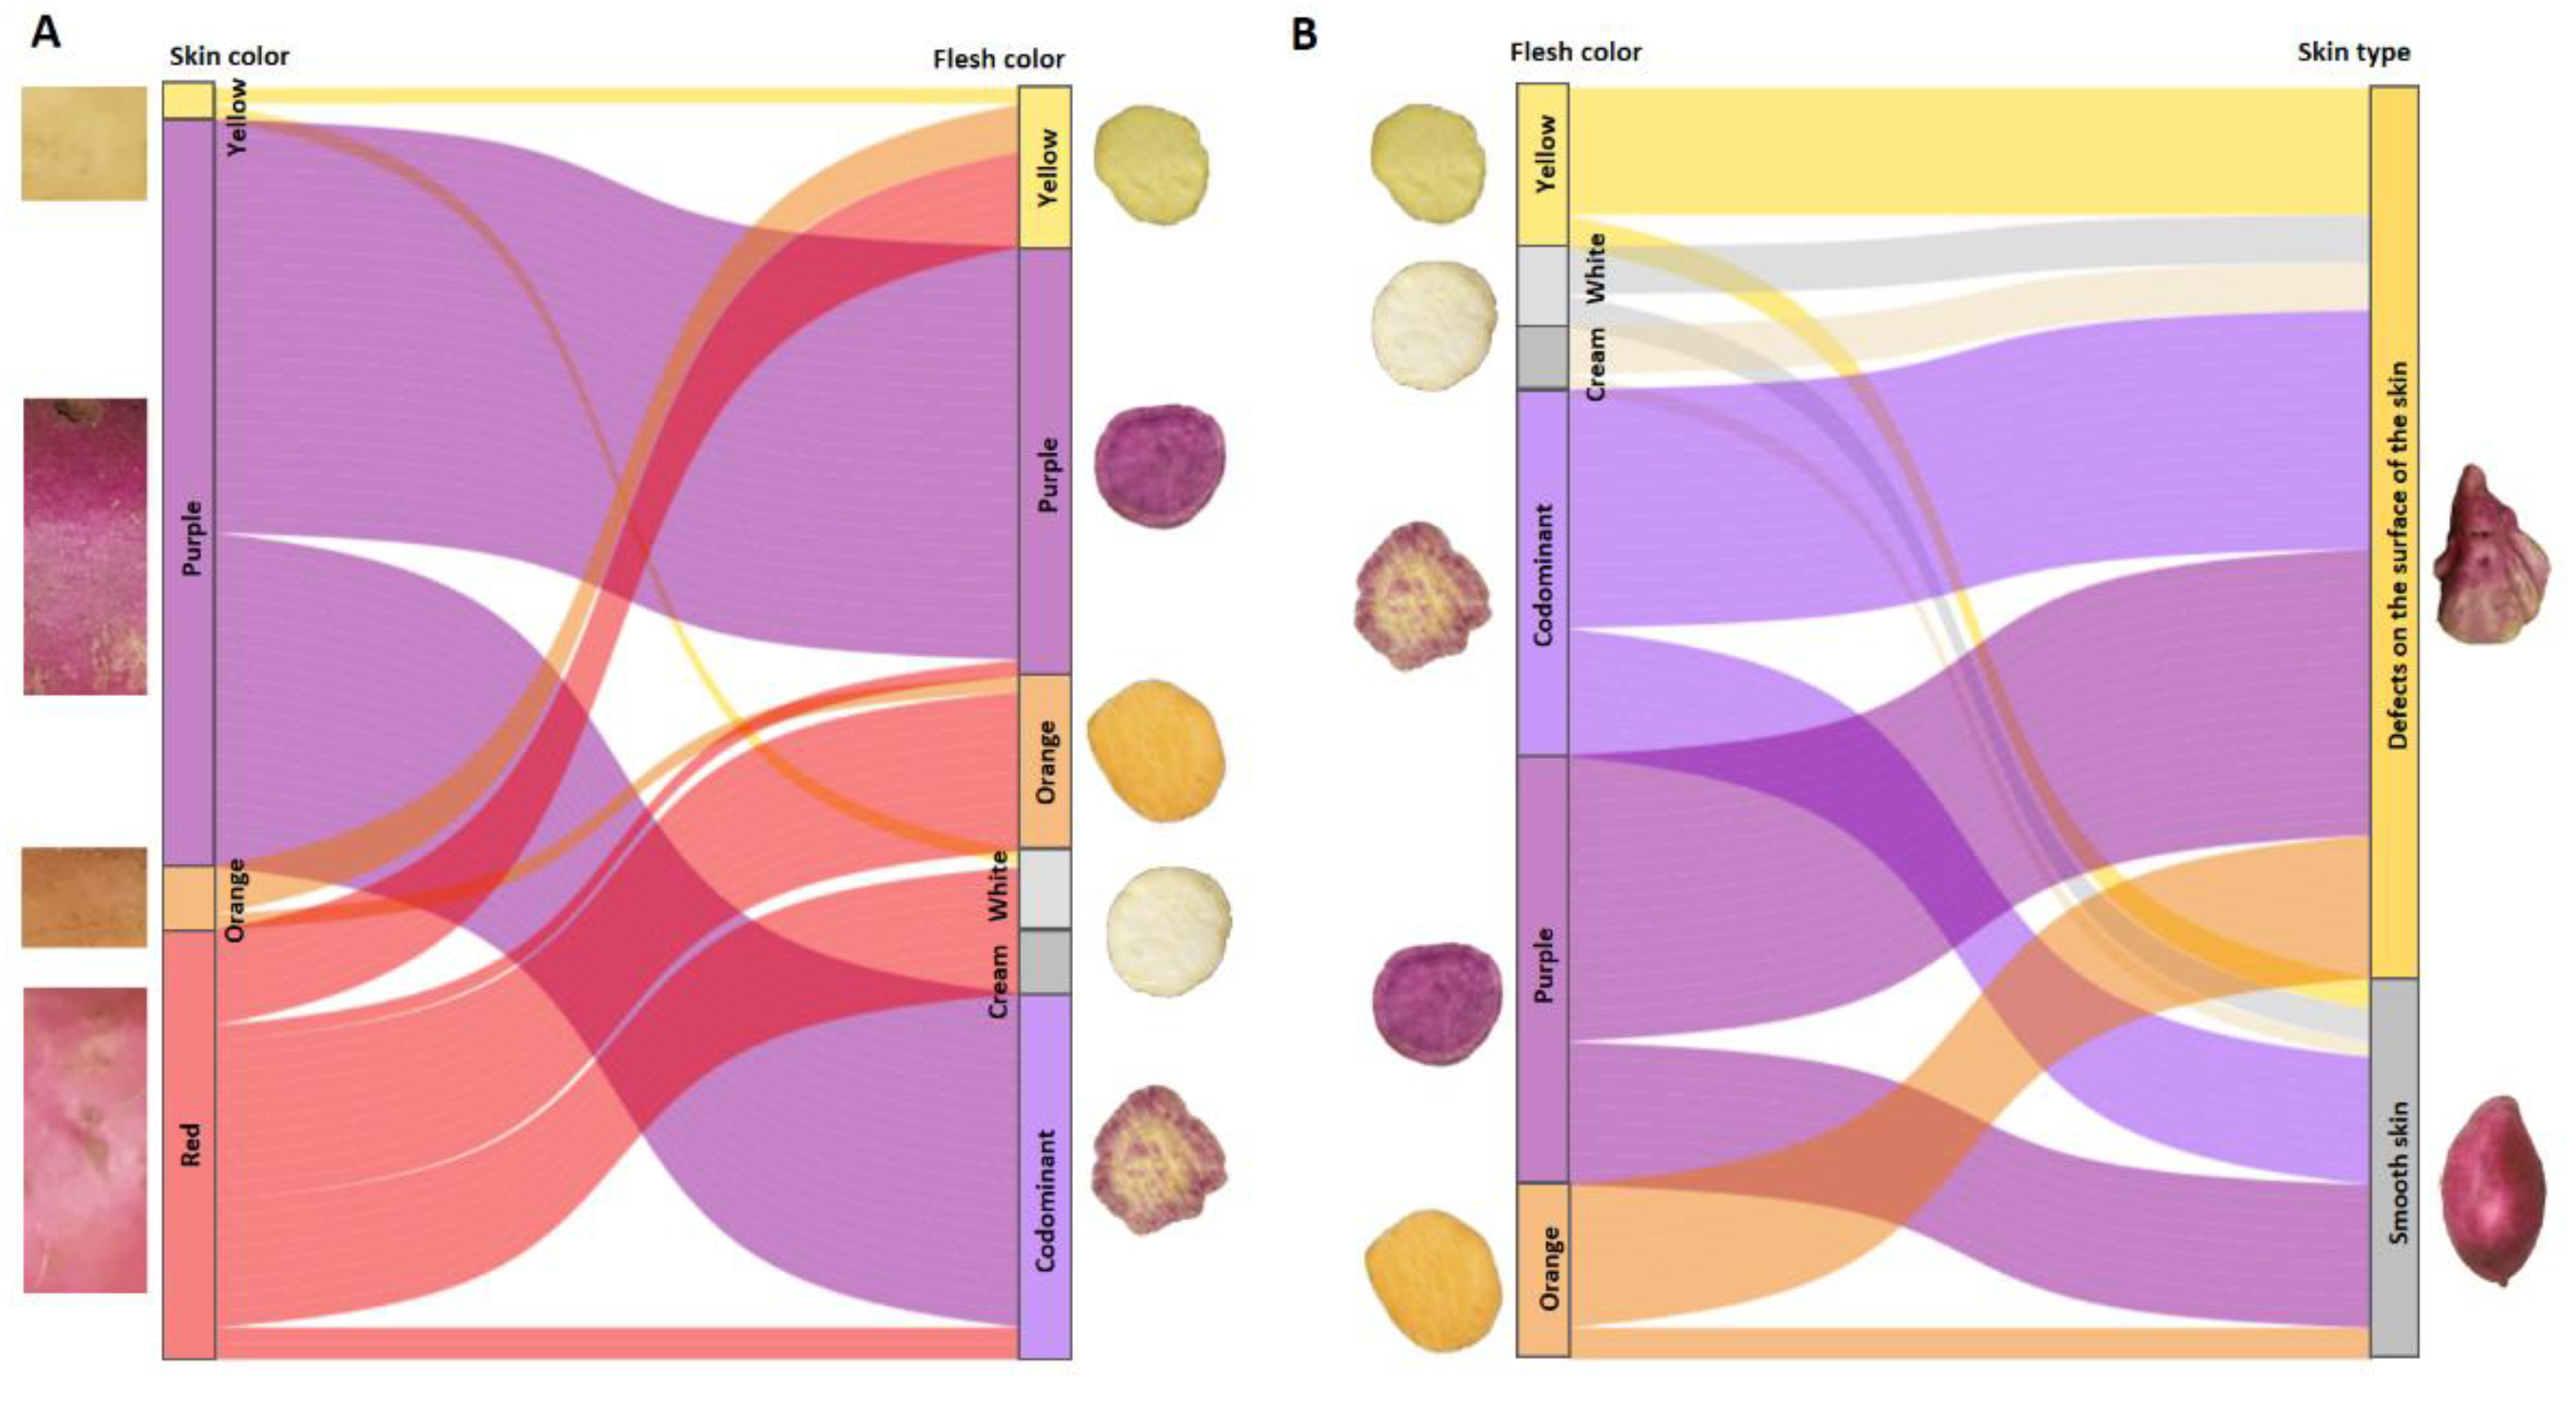
Figure 11 A and B show the results for the segregating population between two smooth-skinned parents of tuberous roots, one with red skin and orange flesh (ISS-18-004), and another with purple skin and purple flesh (INIVIT BM-90).
The yellow-skinned progeny was associated with white flesh (1:5) and yellow flesh (1:10). The purple-skinned progeny was only associated with purple flesh and codominant flesh (purple-orange, purple-white), meaning that there is a linkage between the purple skin and flesh color. There were no purple-skinned genotypes with yellow, orange, or creamy-white flesh, which indicates linkage disequilibrium between this skin color and flesh colors. They did not segregate independently as recombination frequency was not observed. The orange-skinned progeny was associated with yellow and orange flesh. The red-skinned progeny was associated with yellow, orange, cream-white and codominant flesh, confirming the independent segregation of red skin and flesh colors. There was incomplete dominance of purple skin over red skin (61% of the population with purple skin) (Figure 11A).
The smooth-skinned progeny were associated with the six flesh colors present in this family, mostly purple (3:1) and codominant (3:1), confirming that the smooth-skinned trait has independent segregation in relation to flesh color (Figure 11B).
Figure 11.
Alluvial diagram of trends between skin color (left vertical axis) and flesh (right vertical axis), flow fields with skin color (A), alluvial diagram between flesh color (left vertical axis) and skin type of tuberous roots (right vertical axis), flow fields with flesh color (B). Results of the progeny obtained from the cross between two smooth-skinned parents of tuberous roots (INIVIT BM-90 x ISS-18-004).
Taking into account the results of this research, the following genetic model of biparental crosses is proposed for improving the flesh color of I. batatas (Figure 12), as well as a predictive formula for the progenies to be selected (5).
Predictive formula for the progenies to be selected
Where:
PS = [(n * PPDC1) * PPDC2] * SSC
SP: Progenies to be selected
n: Number of seedlings per family
PPDC1: proportion of progeny with the desired color
PPDC2: proportion of progeny with the desired color (if necessary, otherwise it will be = 1)
SSC: Smooth Skin Coefficient
Objective: purple flesh (n=100)
Purple flesh x white flesh:
PS = [(100 * 0.52) * 0.50] * 0.34 = 9 purple smooth-skinned sweet potatoes.
Purple flesh x orange flesh:
PS = [(100 * 0.66) * 0.50] * 0.34 = 11 purple smooth-skinned sweet potatoes.
Purple flesh x purple flesh:
PS = [(100 * 0.92) * 0.69] * 0.34 = 21 purple smooth-skinned sweet potatoes (most efficient route).
Objective: orange flesh (n=100)
Orange flesh x white flesh:
PS = [(100 * 0.28) * 1] * 0.18 = 5 orange smooth-skinned sweet potatoes.
Orange flesh x purple
PS = [(100 * 0.14) * 1] * 0.18 = 3 orange smooth-skinned sweet potatoes.
Orange flesh x orange flesh:
PS = [(100 * 0.55) * 1] * 0.18 = 10 orange smooth-skinned sweet potatoes (most efficient route).
Objective: white flesh (for n=100)
White flesh x purple flesh
PS = [(100 * 0.47) * 1] * 0.22 = 10 white smooth-skinned sweet potatoes.
White flesh x orange flesh
PS = [(100 * 0.56) * 1] * 0.22 = 12 white smooth-skinned sweet potatoes.
White flesh x white
PS = [(100 * 0.92) * 1] * 0.22 = 20 white smooth-skinned sweet potatoes.
The model does not include the skin color, since it is a character with relative importance depending on consumer preference, although the international market prefers sweet potatoes with orange and red skin.
In addition, the genetic model did not take into account the yellow color of the flesh in its different possible combinations, since there are different intensities of yellow that, towards their extremes, can be confused with cream and orange colors. Instead, parents with intense orange flesh were used. However, if the objective is to obtain yellow flesh genotypes, efficient combinations can be made between parents with yellow x yellow or yellow x orange flesh. The formula to be used in theory would be: PS = [(n * 0.70) * 1] * 0.26.
If the objectives of a genetic improvement program include the combination of anthocyanin and carotenoid pigments in the same genotype (codominant flesh), only purple-fleshed x orange-fleshed parents should be crossed; approximately 11 codominant smooth-skinned sweet potatoes should be obtained.
4. Discussion
4.1. Pollinations
In none of the crossings carried out, 100% positive pollinations were observed; this phenomenon is explained by different reasons: pollen fertility, environmental conditions at the time of crossing, among others [25]. This limited gametic fertility is also explained by abnormalities observed during meiosis, associated with the hexaploid nature of the sweet potato genome [35].
In sweet potatoes, the percentage of capsules obtained on pollinated flowers ranges according to the authors between: 30 to 75% [23], 63.21% [36] and 35 and 87% [37]. In the case of seeds per capsule, the following are reported: 1.2 [15], between 1.10 and 1.68 [38] and less than 2 [37]. The results obtained are coincident in both cases.
4.2. Flesh Color of Tuberous Roots
Some progenies between crosses of white and yellow-fleshed parents produce seedlings that segregate both colors, however white flesh color appears to be dominant over yellow flesh color [12]. When crossing a white-fleshed parent with an orange-fleshed parent, 62.0-84.1% of seedlings with white-fleshed roots have been obtained [13,21,39,41]. The present results confirm what was reported previously, the progeny resulting from the cross between a white x orange-fleshed parent, resulted in 28% of seedlings with orange flesh, which reaffirms the incomplete dominance of white flesh color over orange. This may be attributed to the action of two or more genes for white color on the genes for orange flesh or the possible presence of an inhibitory gene [39].
Sweet potato seedlings may have higher concentrations of carotenoids (more intense orange flesh) than either of their parents [13,40]. Crossbreeding between two parents, one with high carotenoid content (18.5 mg) and one with low (1.2 mg), has produced 18.8% of the progeny with roots that had more than 21 mg of carotenoid pigments [39]. The inheritance of the orange flesh colour behaves as a typical quantitative character and it is possible that six genes with additive effect control the carotenoids [21]. In all the investigations carried out, transgressive inheritance was evident, which for some characters has a great practical significance, since individuals can be discovered that have a greater degree of superiority than the original parent, and a greater degree of inferiority than the original parent. Thus, by using superior individuals as parents in breeding programs and discarding inferior individuals, gradual improvement of important quantitative traits can occur [42]. It is evident that in sweet potato, if a high percentage of progenies with high carotene content is desired, parents with high carotene content (intense orange pigmentation) must be used. Therefore, in the proposed genetic model this is the suggested way, since the carotene content is quantitatively inherited with an additive effect of genes.
In the study of a population of 1630 seedlings from biparental crosses that had orange pulp color, it was reported that the orange color was predominant (37.48%), followed by light orange (28.71%) and dark orange (6.38%). In lesser proportion, cream, white and yellow pulp were found [11]. The results coincide with those obtained, the progeny resulting from the cross between orange parents, results in a monofactorial phenotypic proportion of 2:1:1 (orange:white:yellow).
4.3. Tuberous Root Shape
For the trait defects on the surface of the tuberous root, 239 seedlings (91.92%) of 260 presented roots with horizontal constrictions or longitudinal grooves [14]. The present results confirm this, when crossing two parents with defects on the surface of the tuberous roots only 11.74% of seedlings with smooth skin without defects on the surface of the tuberous roots were obtained and 32.42% of progeny with smooth skin were obtained for the cross between two parents without defects on the surface of the tuberous roots (smooth skin). This suggests an additive effect of the genes for this trait and the importance of using parents with smooth skin. It is possible that the proportions of smooth skin in the progeny can be increased in other breeding programs in other parts of the world if parents with a high degree of improvement for this trait are used due to dosage effects. In the present investigation the parents used did not have this degree of improvement.
Sweet potato progenies differ in length to width (L:W) ratios within the same family, ranging in ratios from 1.54 to 3.03 L:W. For different families the seedlings have different percentages (60, 39.4, 42.9, 48.1%) in the ratio of 1.5 to 3.0 L:W. Furthermore, some progenies do not produce a defined pattern. It is likely that there are two sets of genes, one for length and one for width, functioning independently, probably controlling root shape [43].
The aspect ratio between 2-3 was obtained in 42.5% of the total population of one family and 50.0% of the other, indicating a high variation in the shape of tuberous roots within the same family. Furthermore, in both families, progenies with a higher aspect ratio than the longest parent and progenies with a lower value than the parent with the lowest value were observed, indicating a transgressive segregation for this trait. Considering the AR values obtained in the progeny and that the parents used have different AR, it can be inferred that this trait has a quantitative inheritance with a lack of dominance of one form over another, suggesting interaction, several genes involved and perhaps a cumulative effect.
For the shape of tuberous roots, low heritability values (0.04) have been reported [44]. In the present study, low broad-sense heritability values (0.29-0.38) were also found for this trait, which is due to the high variation in shape for the same genotype and the great environmental influence [45].
4.3. Association between Characters
Through open pollination using purple-skinned and white-fleshed parents, the progeny have monofactorial proportions of 1:4 light flesh/purple skin, 1:2 light flesh/brown skin, 1:4 mottled purple flesh/purple skin. In addition, half of the purple-skinned plants have purple spots on the flesh [14]. These observations coincide with the results of the present investigation, reporting that the seedlings from the combination of purple x white flesh and purple x orange flesh presented 50.76 and 47.05% respectively of the segregating population of purple flesh, flesh with a codominantly expressed color, which in our case instead of presenting purple spots on the flesh, was the opposite, the purple flesh presented orange or white spots in a smaller proportion than the predominant purple color. In addition, incomplete dominance of the red skin color over the cream skin was obtained.
It has been suggested that the association between skin and flesh colour of sweet potato is neither independent nor determined by monofactorial segregations. Fractionation for dihybrid segregation indicates a good fit for a ratio of 9:7 purple:cream skin, and 13:3 orange:cream flesh [14]. Of the orange-skinned progeny, the majority (63%) have orange flesh, whereas when the skin is anthocyanin or white/cream, most genotypes have white-cream flesh without orange inclusions [15]. The claims made above are not supported in 100% of the cases by the results obtained, since skin colours (red and yellow) and flesh colours (yellow, orange and cream) have independent segregation. In addition, it is agreed that there was no recombination frequency between orange skin and white flesh, and that between purple skin and yellow, orange or cream-white flesh, these did not segregate independently. This may be because the loci involved are located on the same chromosome, which makes it impossible for them to be transferred to the offspring randomly with the separation of the chromosomes during meiosis. This linkage disequilibrium is influenced by many factors, including selection, the rate of genetic recombination, genetic drift, population structure and linkage. Since the white-fleshed genotypes only had red or yellow skin, it is likely that these colours are dominant over the orange skin colour. In addition, the purple-skinned genotypes were only associated with purple flesh and codominant flesh (purple-orange, purple-white), that is, it can be said that there is linkage between the purple colour of the skin and the flesh. This possible linkage (joint transmission) suggests the proximity between the genes of both traits on the same chromosome. It is possible that different authors obtain dissimilar results in this crop, due to its directed evolution (crossings and artificial selection), ploidy level, crossing over during meiosis, allelic dosage for some traits and a polysomal inheritance route.
Crosses between dark-skinned parents produce a large percentage of F1 seedlings with pink or purple skin [41], as occurred in the present investigation. When a cream-skinned parent is crossed with a copper-skinned parent, most of the seedlings are tan or darker. When a copper-skinned parent is crossed with a purple-skinned parent, none of the offspring produced white-skinned roots. Furthermore, in a cross involving purple-skinned and pink-skinned parents, 90.1% of the population is purple-skinned and only 5.9% was pink-skinned, so the inheritance of skin color may be controlled by the interaction of several genes, probably of complementary action [21,39,43]. The current results support these findings. Since the purple and red trait is incompletely dominant over the light skin colors, it is important to select light-skinned parents if cream- or orange-skinned sweet potatoes are desired, and thus it is possible to obtain seedlings with the desired skin color along with other combined traits.
Heritability values of 0.13 have been found for flesh colour [44]. In the present study, the results differ; for flesh colour, the estimated broad-sense heritability was in all cases greater than 0.90, indicating that variations in flesh colour are of genetic origin and are little influenced by the environment.
By crossing two sweet potato parents, one with yellow skin and cream flesh, and the other parent with purple skin and yellow flesh. The offspring are not affected by the direction of the cross (sex-linked inheritance). For the skin color, offspring with values higher or lower than those of one of the parents were found. 64% of genotypes with anthocyanin skin, 18% with white/cream skin and 18% with orange skin. In the pulp, 62% of the genotypes presented white/cream pulp, while the remaining 38% showed pulp that presented different intensities of orange color. The continuous distribution of the analyzed characters confirms their quantitative nature. Given the hexaploid nature of the sweet potato, a quantitative variation is expected even in those characters of qualitative nature [15].
In sweet potato the segregation proportions in certain crosses are usually complex, but can be simple and Mendelian when a single dominant allele is present. However, as the simple proportions are affected due to the homozygosity of some genes, inheritance studies often show discrepancies regarding the segregation patterns, which are varied and complicated. If dosage effects occur, segregation will be continuous and discrete proportions will not be observed, even when a single locus is responsible for a trait [46].
5. Conclusions
A more precise contribution to the inheritance governing the traits of flesh color, skin color and tuberous root shape, as well as their association, was made by eliminating the difficulty of fractioning segregation frequencies by using morphometric variables. The high estimated values of broad-sense heritability for flesh color indicated that phenotypic differences are due to genotypic differences. There was incomplete dominance of white flesh color and purple color over orange color. There is a possible linkage (joint transmission) between purple skin color and purple and codominant (purple-orange, purple-white) flesh color. In addition, all the studied traits appear to be quantitatively inherited. A genetic model of biparental crosses to improve the flesh color of I. batatas was proposed, as well as a predictive formula for the progenies to be selected. This could lead to more efficient advances (in time and resources) in the genetic improvement of this species to obtain genetically balanced cultivars with the desired characteristics.
Author Contributions
Conceptualization, A.M. and I.J.P..; methodology, D.R.S.; software, V.V.C.; validation, O.P.V and Y.L.V.; formal analysis, A.M.; investigation, A.M. and D.R.S.; resources, V.V.C.; data curation, A.M.; writing—original draft preparation, A.M. and I.J.P.; writing—review and editing, Y.B.G.; visualization, Y.R.G; supervision, A.J.M.; project administration, A.M..; funding acquisition, I.J.P. All authors have read and agreed to the published version of the manuscript.”
Funding
This research received no external funding
Data Availability Statement
The raw data supporting the conclusions of this article will be made available by the authors on request.
Conflicts of Interest
The authors declare no conflicts of interest
References
- BBC News Mundo. Gregor Mendel: cómo un monje con un jardín de arvejas descubrió las leyes de la herencia genética. 2021. Available online: https://www.bbc.com/mundo/noticias-56719582 (accessed on 18/08/2024).
- Sadurní, J. M. EL MONJE BOTÁNICO. Gregor Mendel, el padre de la genética. 2023. Available online: https://historia.nationalgeographic.com.es/a/gregor-mendel-padre-genetica_15509 (accessed on 12/08/2024).
- Isobe, S.; Shirasawa, K.; Hirakawa, H. Current status in whole genome sequencing and analysis of Ipomoea spp. Plant Cell Report 2019, 38, 1365-1371.
- Kriegner, A.; Cervantes, J.C.; Burg, K.; Mwanga, O.M.; Zhang, D. A genetic linkage map of sweetpotato [Ipomoea batatas (L.) Lam.] based on AFLP markers. Mol Breeding 2003, 11, 169-185.
- Mollinari, M.; Olukolu, B.A.; Pereira, D.S.; Khan, A.; Gemenet, D.; Yencho, G.C.; Zeng, Z.B. Unraveling the Hexaploid Sweetpotato Inheritance Using Ultra-Dense Multilocus Mapping. G3 (Bethesda) 2020, 10,281-292.
- Cervantes, J.C.; Yencho, G.C.; Kriegner, A.; Pecota, K.V.; Faulk, M.A.; Mwanga, R.O.; Sosinski, B.R. Development of a genetic linkage map and identification of homologous linkage groups in sweetpotato using multiple-dose AFLP markers. Mol Breeding 2008, 21, 511–532.
- Jones, A. Theoretical Segregation Ratios of Qualitatively Inherited Characters for Hexaploid Sweetpotato (Ipomoea batatas L.). Agricultural Research Service US, Technical Bulletin 1967, 1368.
- Shiotani, I. Sweet potato evolution. Sweet potato research and development for small farmers. Laguna, The Philippines. 1989, 5-15.
- Grüneberg, W.J.; Ma, D.; Mwanga, R.; Carey, E.; Huamani, K.; Diaz, F. et al. Advances in sweet potato breeding from 1992 to 2012. Potato and Sweetpotato in Africa: Transforming the Value Chains for Food and Nutrition Security. Chapter: 1, CAB International, 2015, 68.
- Rangaswami, A.K.; Sampathkumar, R. Inheritance of leaf shape and colour in sweet potato. Indian Journal of Genetics and Plant Breeding 1978, 38, 262-263.
- Vimala, B.; Sreekanth, A.; Hariprakash, B.; Wolfgang, G. Variation in morphological characters and storage root yield among exotic orange-fleshed sweet potato clones and their seedling population. Journal of Root Crops 2012, 38, 32-37.
- Hernandez, T.P. A Study of Some Genetic Characters of the Sweet Potato. PhD, LSU Thesis. 1942, 66.
- Harmon, S.A. Genetic Studies and Compatibilities in the Sweet Potato (Ipomoea batatas). PhD, LSU Theses. 1960, 595.
- Poole, C.F. Sweet potato genetic studies. University of Hawaii, Hawaii, Technical bulletin, 1955, 27.
- Arizio, C.M.; Manifesto, M.M.; Martí, H.R. Análisis de caracteres relacionados con el color de la raíz engrosada en un cruzamiento de dos clones de Ipomoea batatas L. (Lam.). Horticultura Argentina 2009, 28:5-13.
- Wang, A.; Li, R.; Ren, L.; Gao, X.; Zhang, Y.; Ma, Z.; Ma, D.; Luo, Y. A comparative metabolomics study of flavonoids in sweet potato with different flesh colors (Ipomoea batatas (L.) Lam). Food Chemical 2018, 260, 124–134.
- Xiao, Y.; Zhu, M.; Gao, S. Genetic and Genomic Research on Sweet Potato for Sustainable Food and Nutritional Security. Genes 2022, 13, 1833.
- De Albuquerque, M.R.; Sampaio, K.B.; Souza, E.L. Sweet potato roots: Unrevealing an old food as a source of health promoting bioactive compounds. A review. Trends Food Science Technology 2019, 85, 277–286.
- Sagar, N.A.; Pareek, S.; Sharma, S.; Yahia, E.M.; Lobo, M.G. Fruit and Vegetable Waste: Bioactive Compounds, Their Extraction, and Possible Utilization. Comprehensive Reviews in Food Science and Food Safety 2018, 17, 512–531.
- Minatel, I.O.; Borges, C.V.; Alonzo, H.; Hector, G.; Gomez, C.O.; Pace, G.; Lima, P. Phenolic Compounds: Functional Properties, Impact of Processing and Bioavailability, Phenolic Compounds - Biological Activity. London, United Kingdom, 2017, 1–24.
- Hernandez, T.P.; Hernandez, T.; Constantin, R.J.; Kakar, R.S. Improved techniques in breeding and inheritance of some of the characters In the sweet potato, Ipomoea batatas L. Proc. Int. Symp. on Tropical Root Crops, 1967, 1, 31-49.
- Morales, R.A.; Rodríguez, S.D.; Xie, Y.; Guo, X.; Jia, X.; Ma, P.; Bian, X. Self-incompatibility of sweet potato (Ipomoea batatas (L.) Lam.). A review. Revista Agricultura Tropical 2019, 5, 1-8.
- Arizio, C.M. Marcadores funcionales relacionados con la síntesis de pigmentos y su localización en un mapa de ligamiento en Ipomoea batatas L. Lam. Tesis Doctoral. Facultad de Ciencias Exactas y Naturales, Universidad de Buenos Aires, Argentina, 2011, 267.
- Schroeder, T. Okinawa Sweet Potato: Japan’s Amazing Purple Superfood! 2021. Available online: https://sakura.co/blog/okinawa-sweet-potato-japans-amazing-purple-superfood (accessed on 11/05/2024).
- Morales, R.A.; Rodríguez, S.D.; Rodríguez, M.S.; Rodríguez, G.Y.; Trujillo, O.N.; Jiménez, M.A.; Molina, C.O. Floral biology and phenology of sweet potato (Ipomoea batatas [L.] Lam.) in Cuba: Bases for genetic improvement. African Journal of Agricultural Research 2023, 19, 1043-1055.
- Hernández, A.; Pérez, J.; Bosch, D.; Castro, N. Clasificación de los suelos de Cuba. Ediciones INCA, Cuba. 2015, 61.
- Ferreira, T.; Rasband, W. ImageJ User Guide. IJ 1.46 Revised edition. 2012, 198.
- X-Rite. Guía para Entender la Comunicación del Color. L10-001-SL, 2002, 2, 24.
- Popat, R.; Patel, R.; Parmar, D. Variability: Genetic Variability Analysis for Plant Breeding Research. R package version 0.1.0, 2020, 7.
- Wickham, H. ggplot2: Elegant Graphics for Data Analysis. Springer, Berlin, Germany, 2016, 260.
- Harrower, M.; Brewer, C.A. ColorBrewer.org: An Online Tool for Selecting Colour Schemes for Maps. The Cartographic Journal 2003, 40, 27-37.
- Garnier, S. viridis: Default Color Maps from ‘matplotlib’. R package Version 0.4.0. 2017. Available online: https://CRAN.R-project.org/package=viridis. (accessed on 2/08/2024).
- Hair, J.F.; Anderson, R.E.; Tatham, R.L.; Black, W.C. Multivariate data analysis. MacMillan Publ. Co., Nueva York, United States, 1992, 544.
- Pla, L.E. Análisis multivariado: Método de componentes principales. Secretaría General de la Organización de los Estados Americanos (OEA). Washington, D.C., United States, 1986, 95.
- Reynoso, D.; Huaman, Z.; Aguilar, C. Methods to determine the fertility and compatibility of sweetpotato. Training Manual. International Potato Center, Lima, Peru, 1998, 133-140.
- Kambale, H.; Ngugi, K.; Olubayo, F.; Kivuva, B.; Muthomi, J.; Nzuve, F. The Inheritance of Yield Components and Beta Carotene Content in Sweet Potato. Journal of Agricultural Science 2018, 10, 2.
- Lestari, S.U.; Hapsari, R.I.; Basuki, N. Crossing Among Sixteen Sweet Potato Parents for Establishing Base Populations Breeding. AGRIVITA Journal of Agricultural Science 2019, 41, 246-255.
- Rukarwa, R.J.; Mukasa, S.B.; Sefasi, A.; Ssemakula, G.; Mwanga, O.M.; Ghislain, M. Segregation analysis of cry7Aa1 gene in F1 progenies of transgenic and non-transgenic sweetpotato crosses. Journal of Plant Breeding and Crop Science 2013, 5, 209-213.
- Constantin, R.J. A Study of the Inheritance of Several Characters in the Sweet Potato, (Ipomoea batatas). PhD, LSU Theses. 1964, 93.
- Miller, R.M.; Melampy, J.J.; Hernandez, T.P. Effect of storage on the carotene content of fourteen varieties of sweet potatoes. Proceedings of the American Society for Horticultural Science 1949, 54, 399-402.
- Hernandez, T.P. A study of the inheritance of skin color, total carotenoid pigments, dry matter, and techniques in classifying these characters in Ipomoea batatas. PhD, La. State University Thesis. 1963, 67.
- Edmond, J.B. Genetics, breeding behaviour, and development of superior varieties. Sweet Potatoes: Production, Processing, Marketing. AVI Publishing Co., Inc., Westport, Connecticut, United States, 1971, 58-80.
- Hammett, H.L. A Study of the Inheritance of Root Shape, Skin Color, Total Carotenoid Pigments, Dry Matter, Fiber and Baking Quality in the Sweet Potato (Ipomoea batatas). PhD, LSU Historical Dissertations and Theses, 1965, 140.
- Thibodeaux, S.D.; Hernandez, T.P.; Hernandez, T. Breeding techniques, combining aility of parents, heritabilities, insect resistance and other factors affecting sweet potato breeding. Third International Symposium on Tropical Root Crops, IITA, Tfbadan, 1973, 12, 2-9.
- Stokdyk, E.A. Selection of sweet potatoes. Journal of Heredity 1925, 16147–150.
- Franklin, M.; Jones, A. Plant Breeding Reviews. AVI Publishing Co, 1986, 4, 313-345.
Figure 1.
Segregation of flesh color of the progeny resulting from the cross between a white-flesh parent (CEMSA 74-228) and a purple-flesh parent (INIVIT BM-90). Scatter diagram (A), scatter diagram with blue dots representing codominant trait (B) and contour plot of densities (C).
Figure 1.
Segregation of flesh color of the progeny resulting from the cross between a white-flesh parent (CEMSA 74-228) and a purple-flesh parent (INIVIT BM-90). Scatter diagram (A), scatter diagram with blue dots representing codominant trait (B) and contour plot of densities (C).
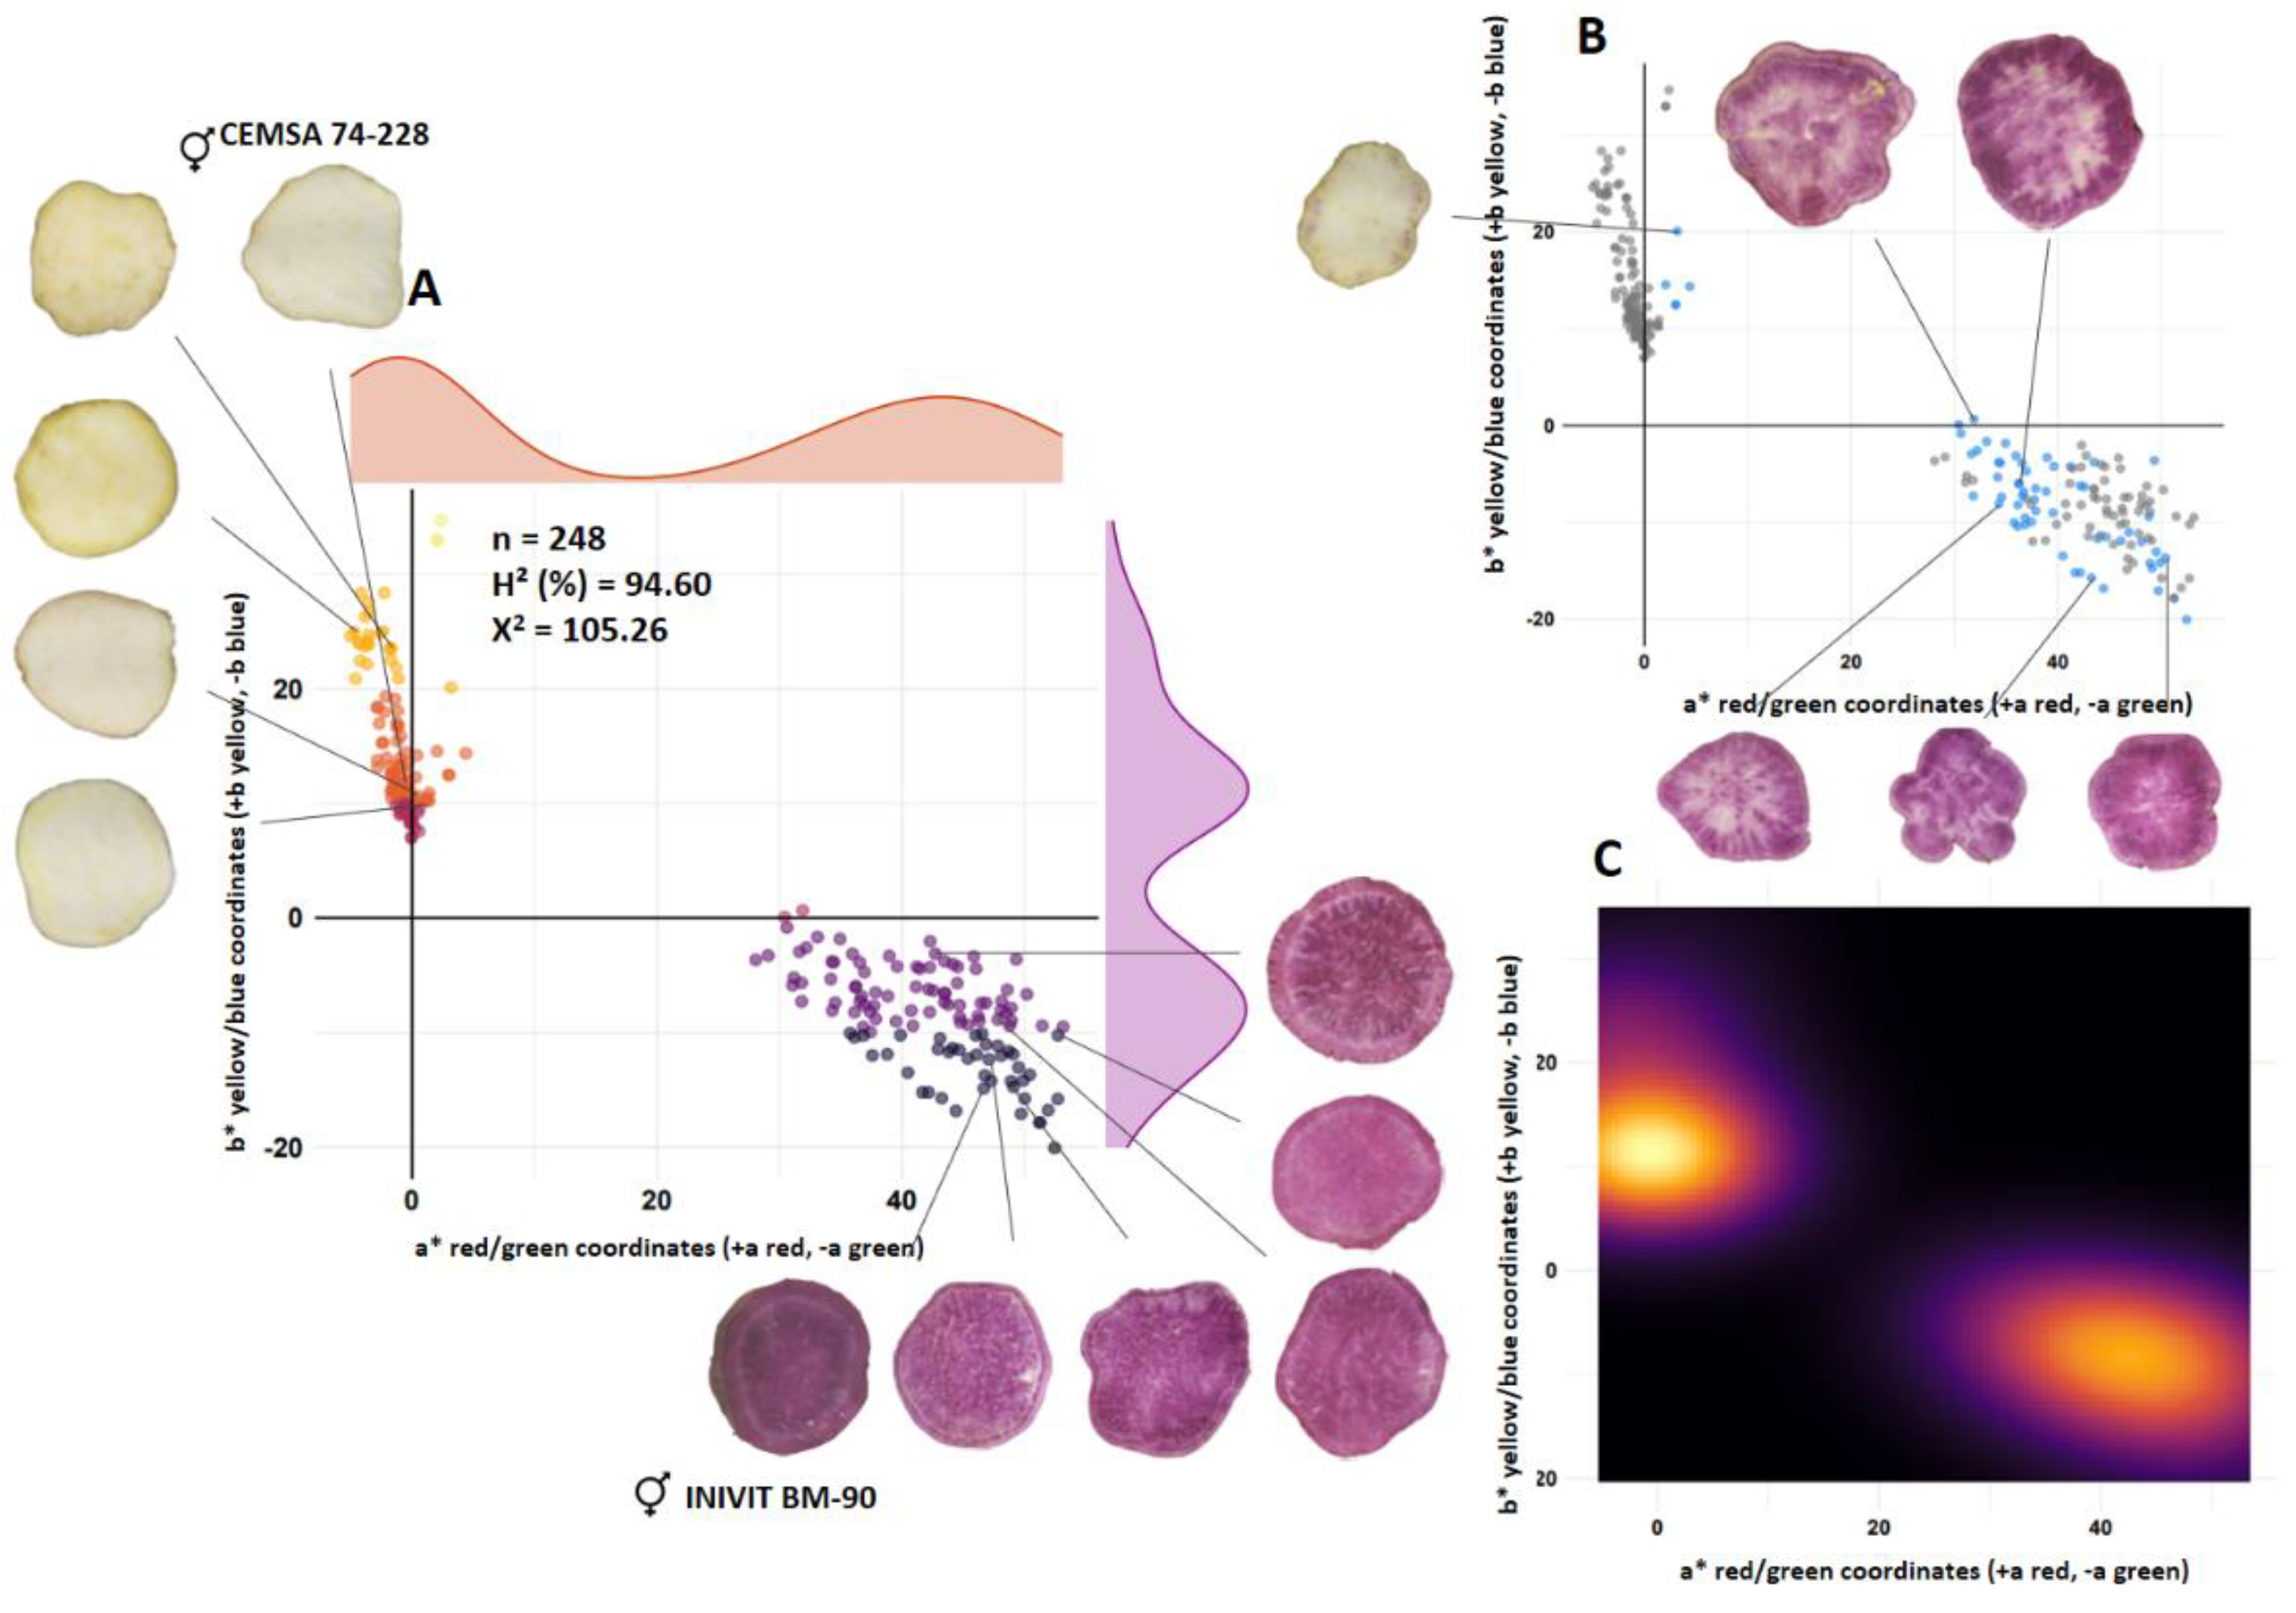
Figure 2.
Segregation of flesh color of the progeny resulting from the cross between two purple-fleshed parents (INIVIT BM-90 x INIVIT BM-8). Scatter plot (A), scatter plot with blue dots representing codominant trait (B) and density contour plot (C).
Figure 2.
Segregation of flesh color of the progeny resulting from the cross between two purple-fleshed parents (INIVIT BM-90 x INIVIT BM-8). Scatter plot (A), scatter plot with blue dots representing codominant trait (B) and density contour plot (C).
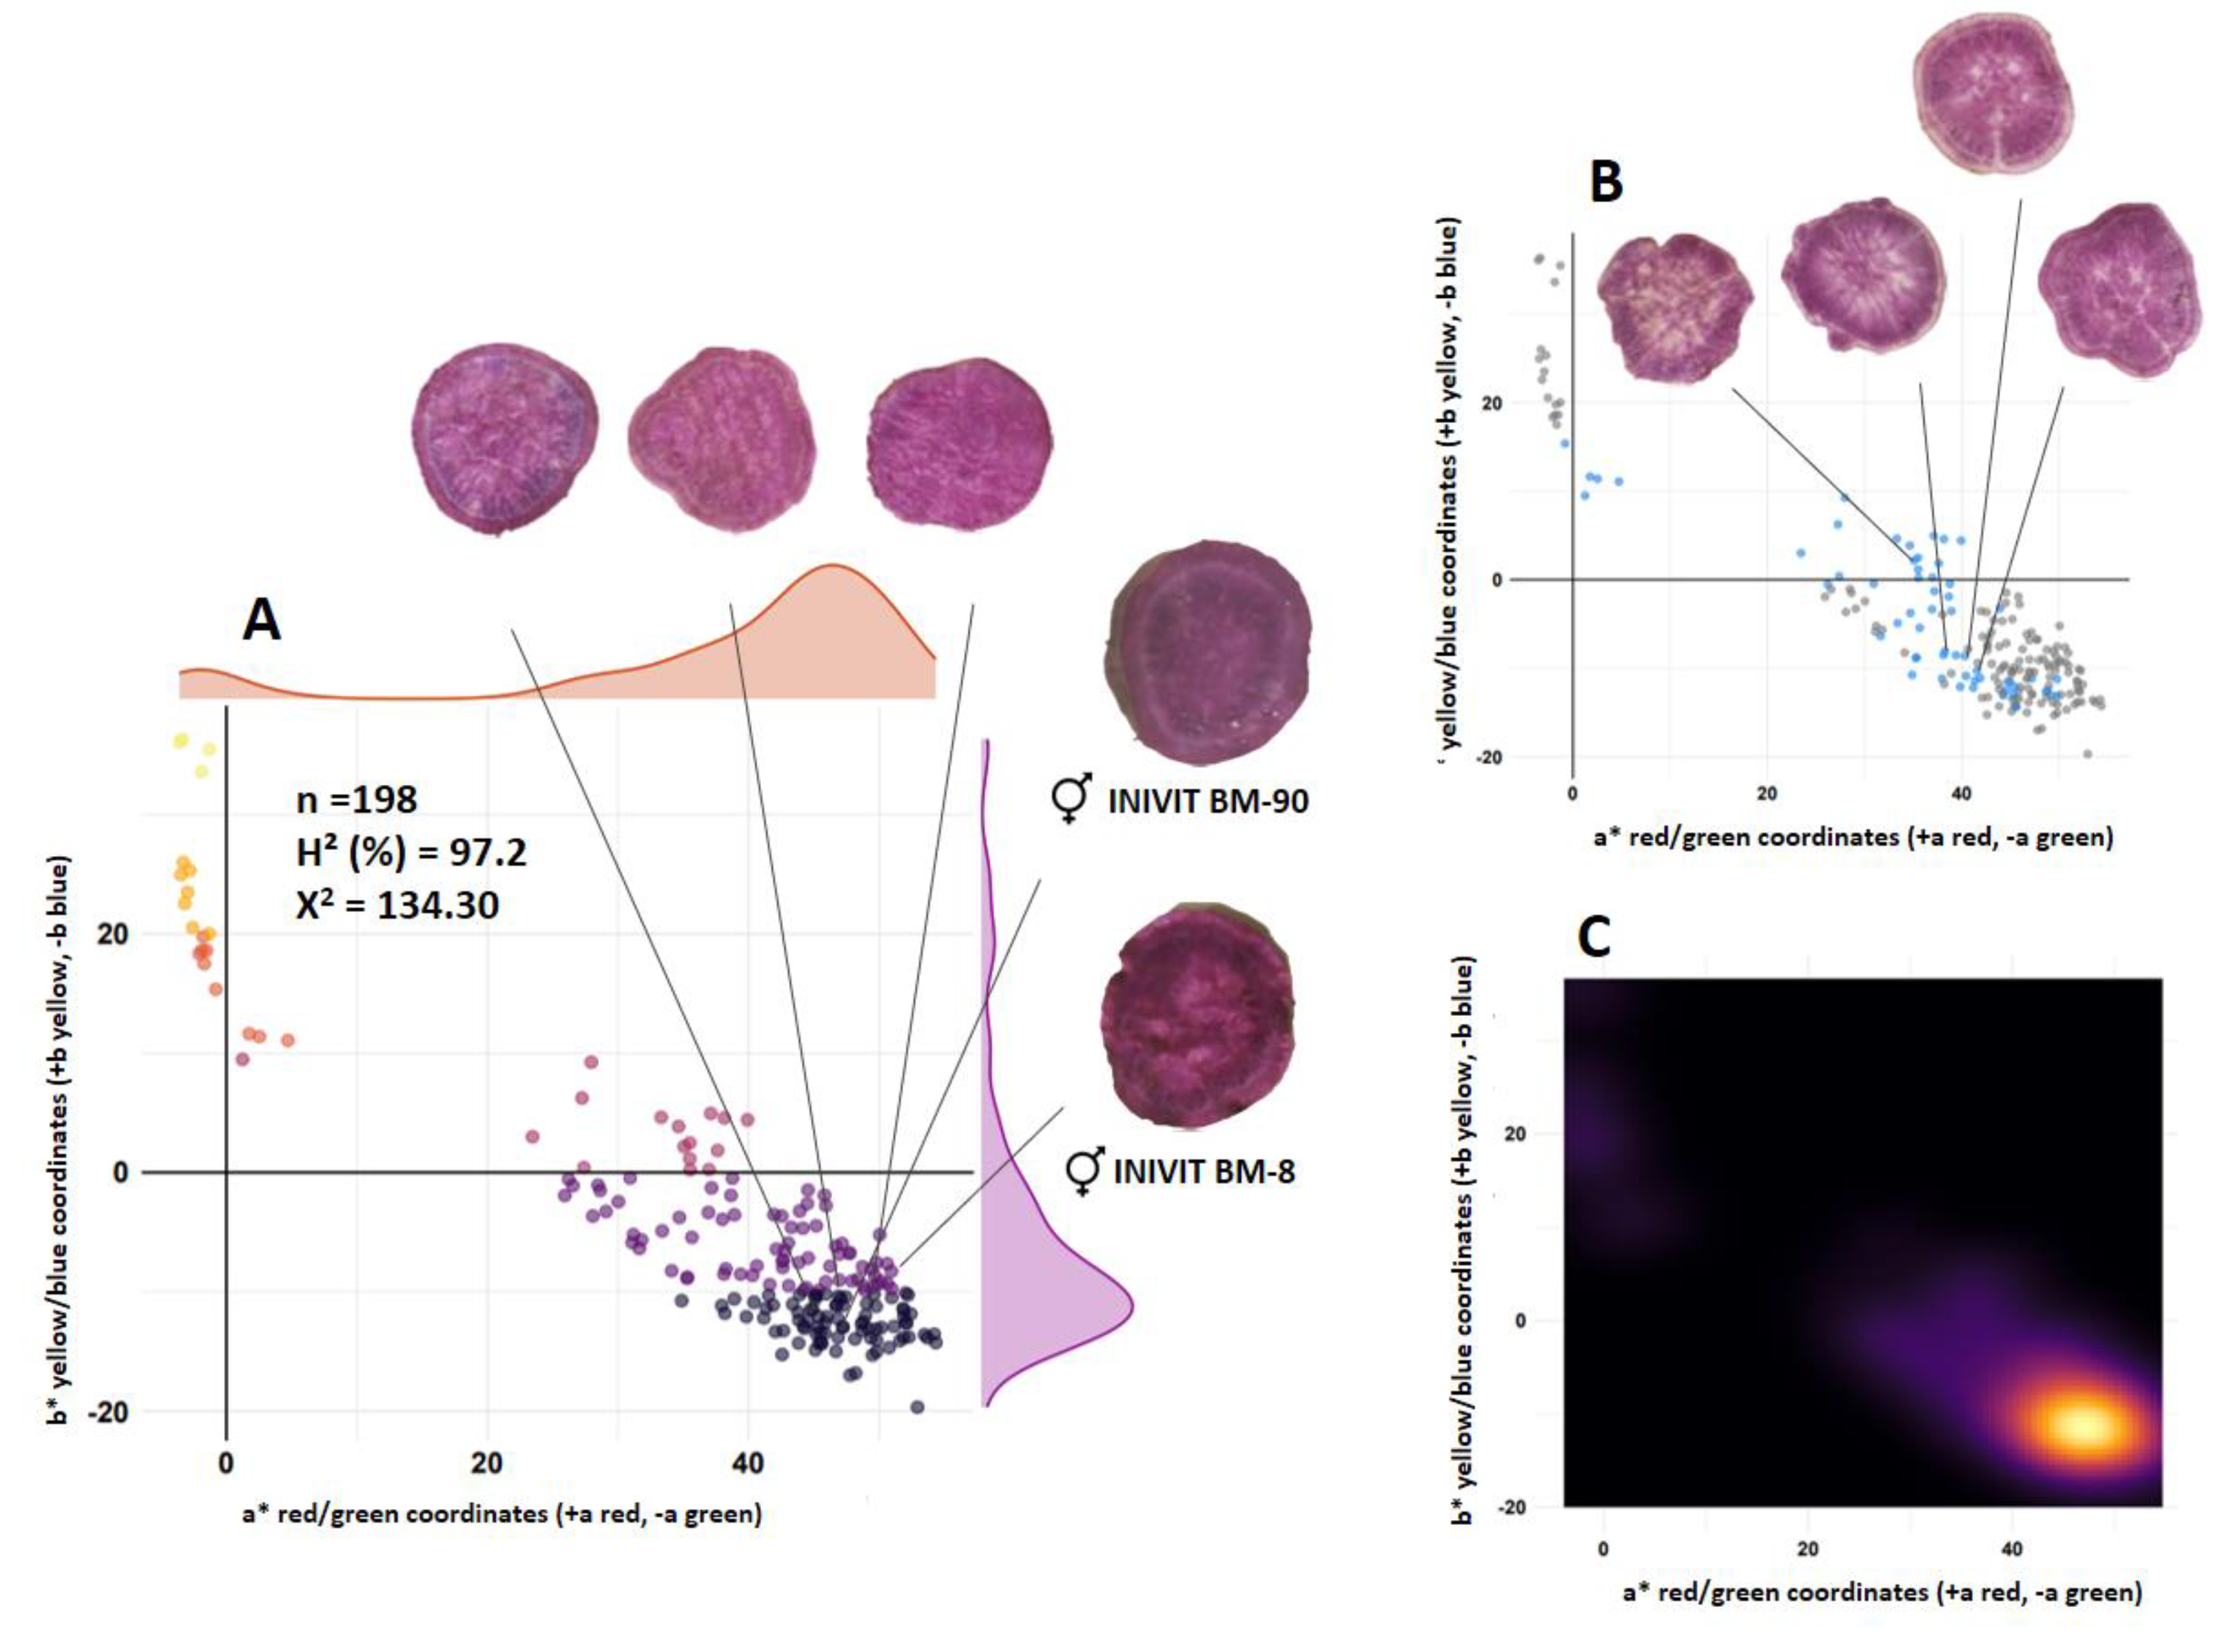
Figure 3.
Segregation of flesh color of progeny resulting from the cross between two orange-fleshed parents (INIVIT BS-16 x Spanish). Scatter plot (A) and density contour plot (B).
Figure 3.
Segregation of flesh color of progeny resulting from the cross between two orange-fleshed parents (INIVIT BS-16 x Spanish). Scatter plot (A) and density contour plot (B).
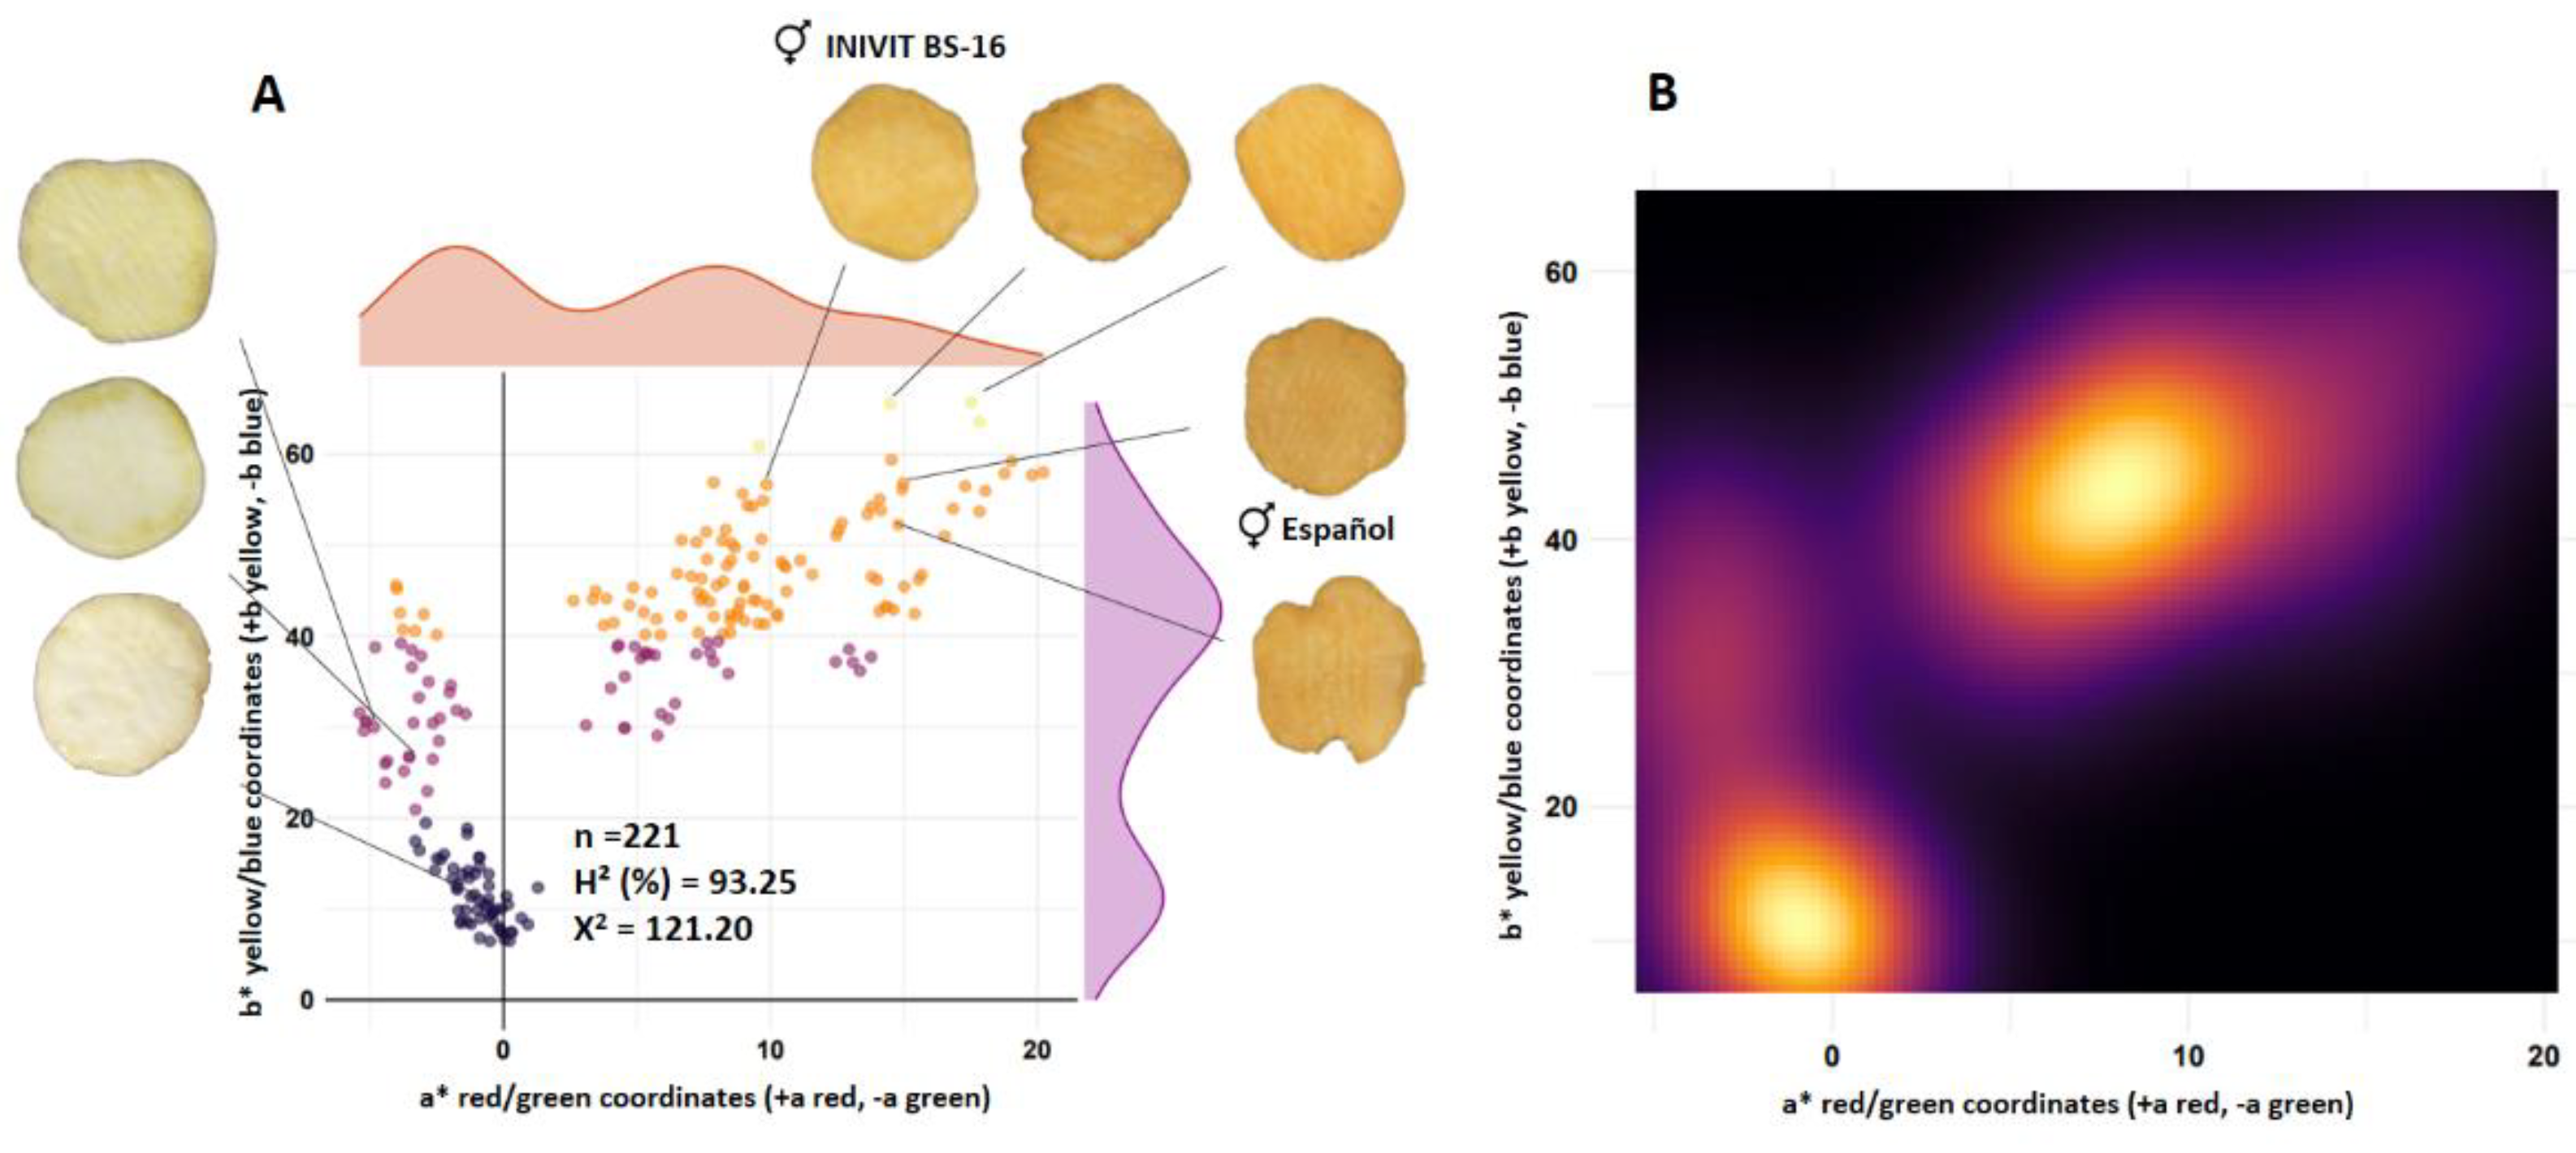
Figure 4.
Segregation of flesh color of the progeny resulting from the cross between a white-fleshed parent (CEMSA 78-326) and an orange-fleshed parent (INIVIT BS-16). Scatter diagram (A) and density contour plot (B).
Figure 4.
Segregation of flesh color of the progeny resulting from the cross between a white-fleshed parent (CEMSA 78-326) and an orange-fleshed parent (INIVIT BS-16). Scatter diagram (A) and density contour plot (B).
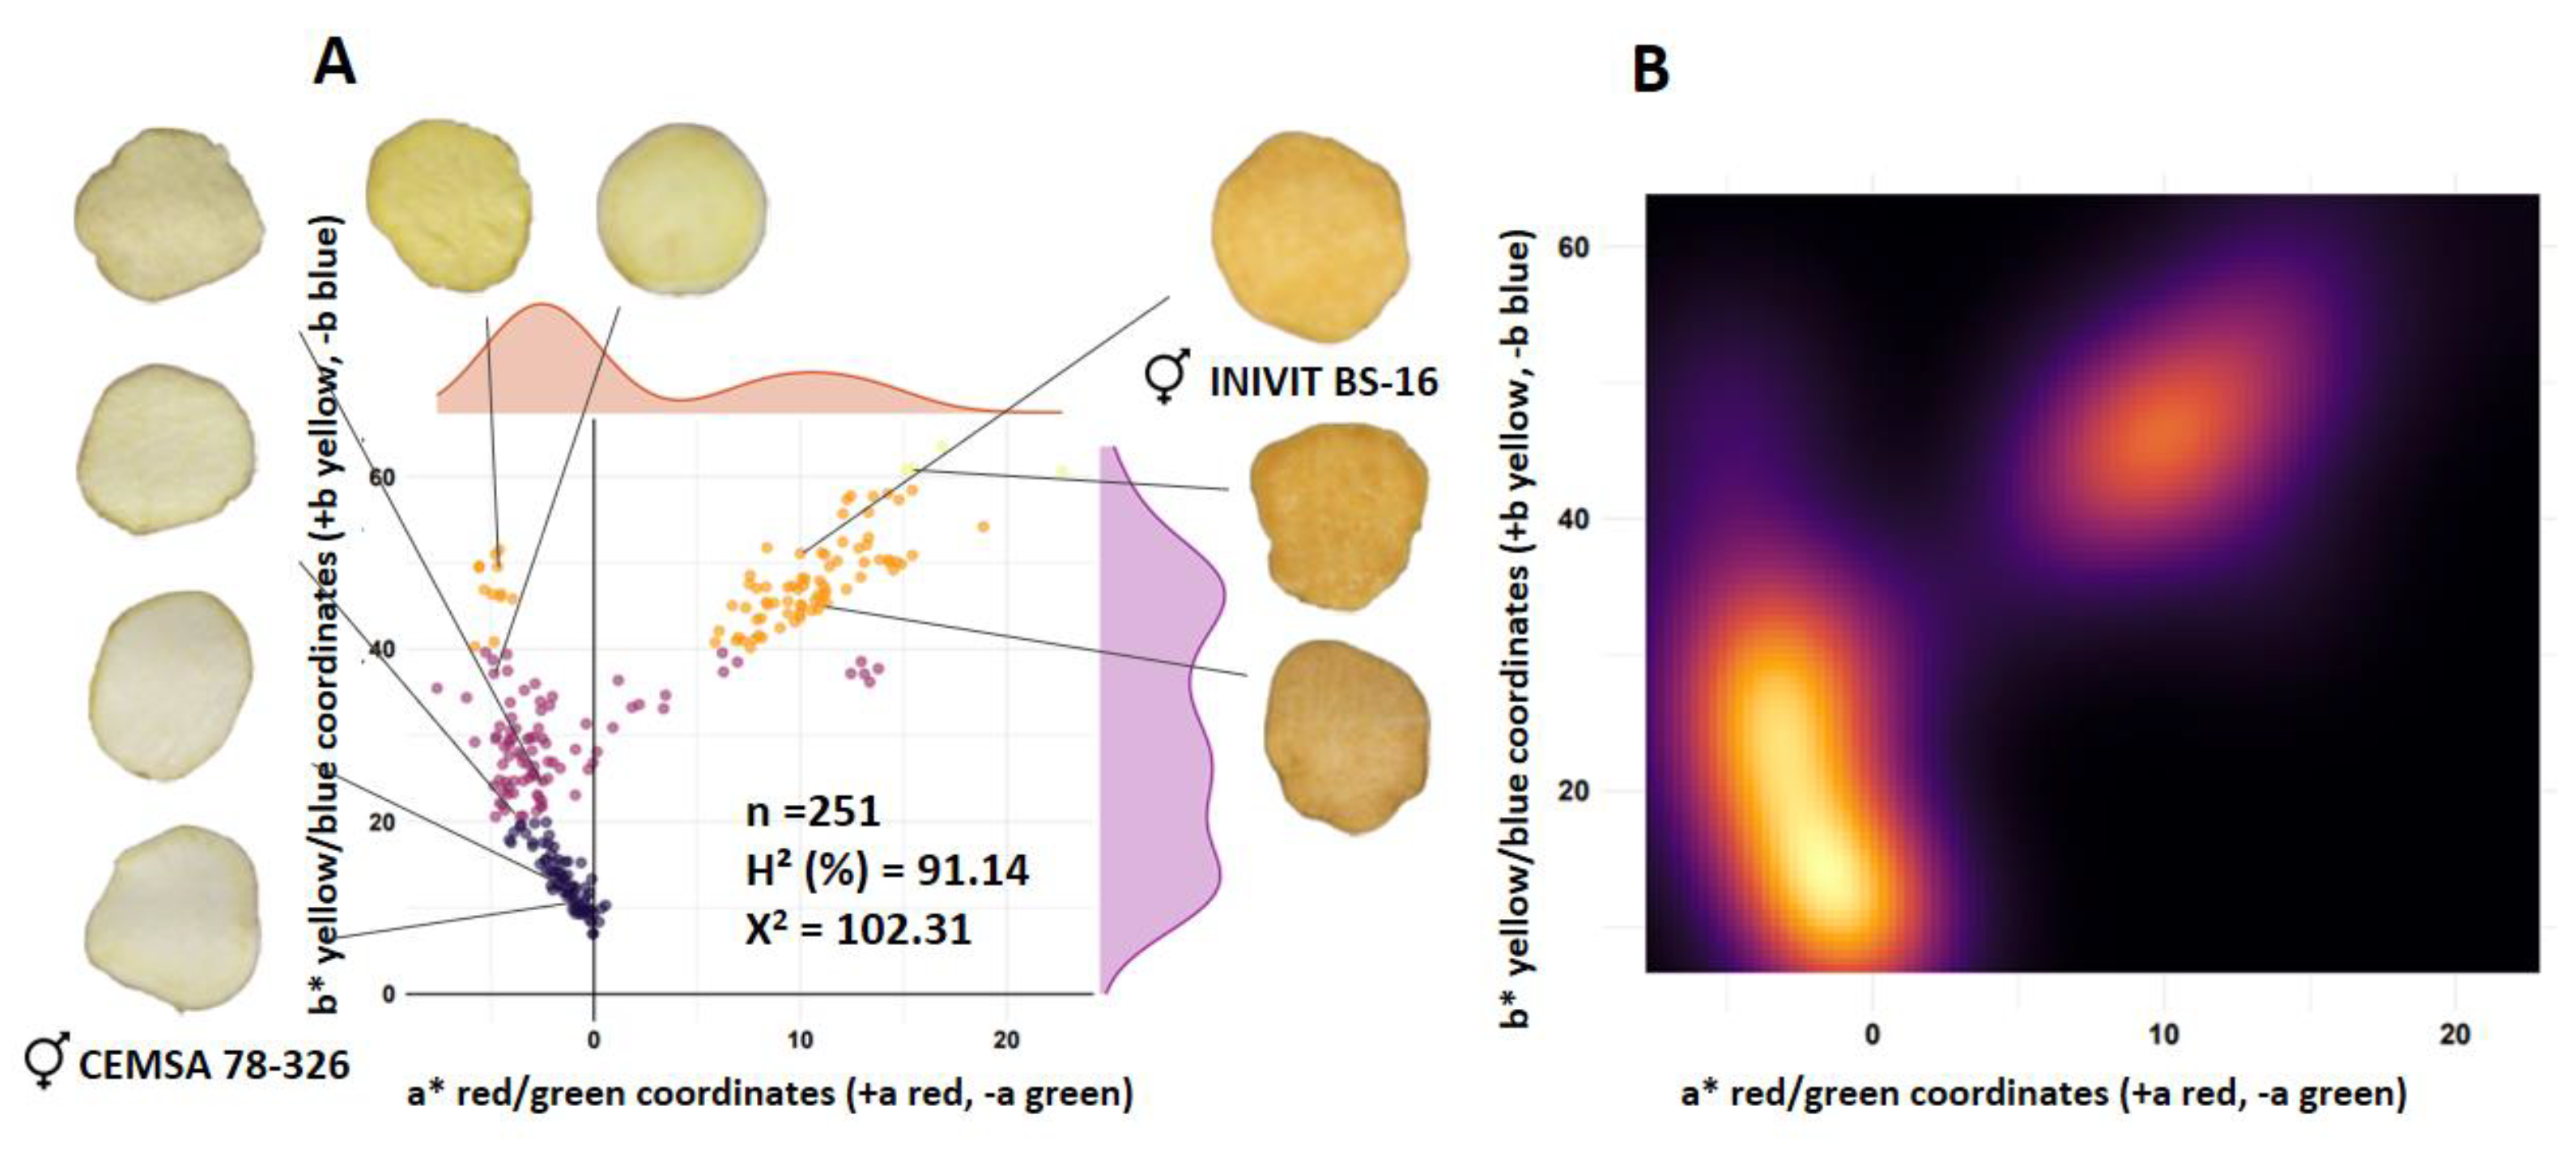
Figure 5.
Segregation of flesh color of the progeny resulting from the cross between an orange-fleshed parent (INIVIT BS-16) and a purple-fleshed parent (INIVIT BM 25-19). Scatter diagram (A), scatter diagram with blue dots representing codominant trait (B) and density contour plot (C).
Figure 5.
Segregation of flesh color of the progeny resulting from the cross between an orange-fleshed parent (INIVIT BS-16) and a purple-fleshed parent (INIVIT BM 25-19). Scatter diagram (A), scatter diagram with blue dots representing codominant trait (B) and density contour plot (C).
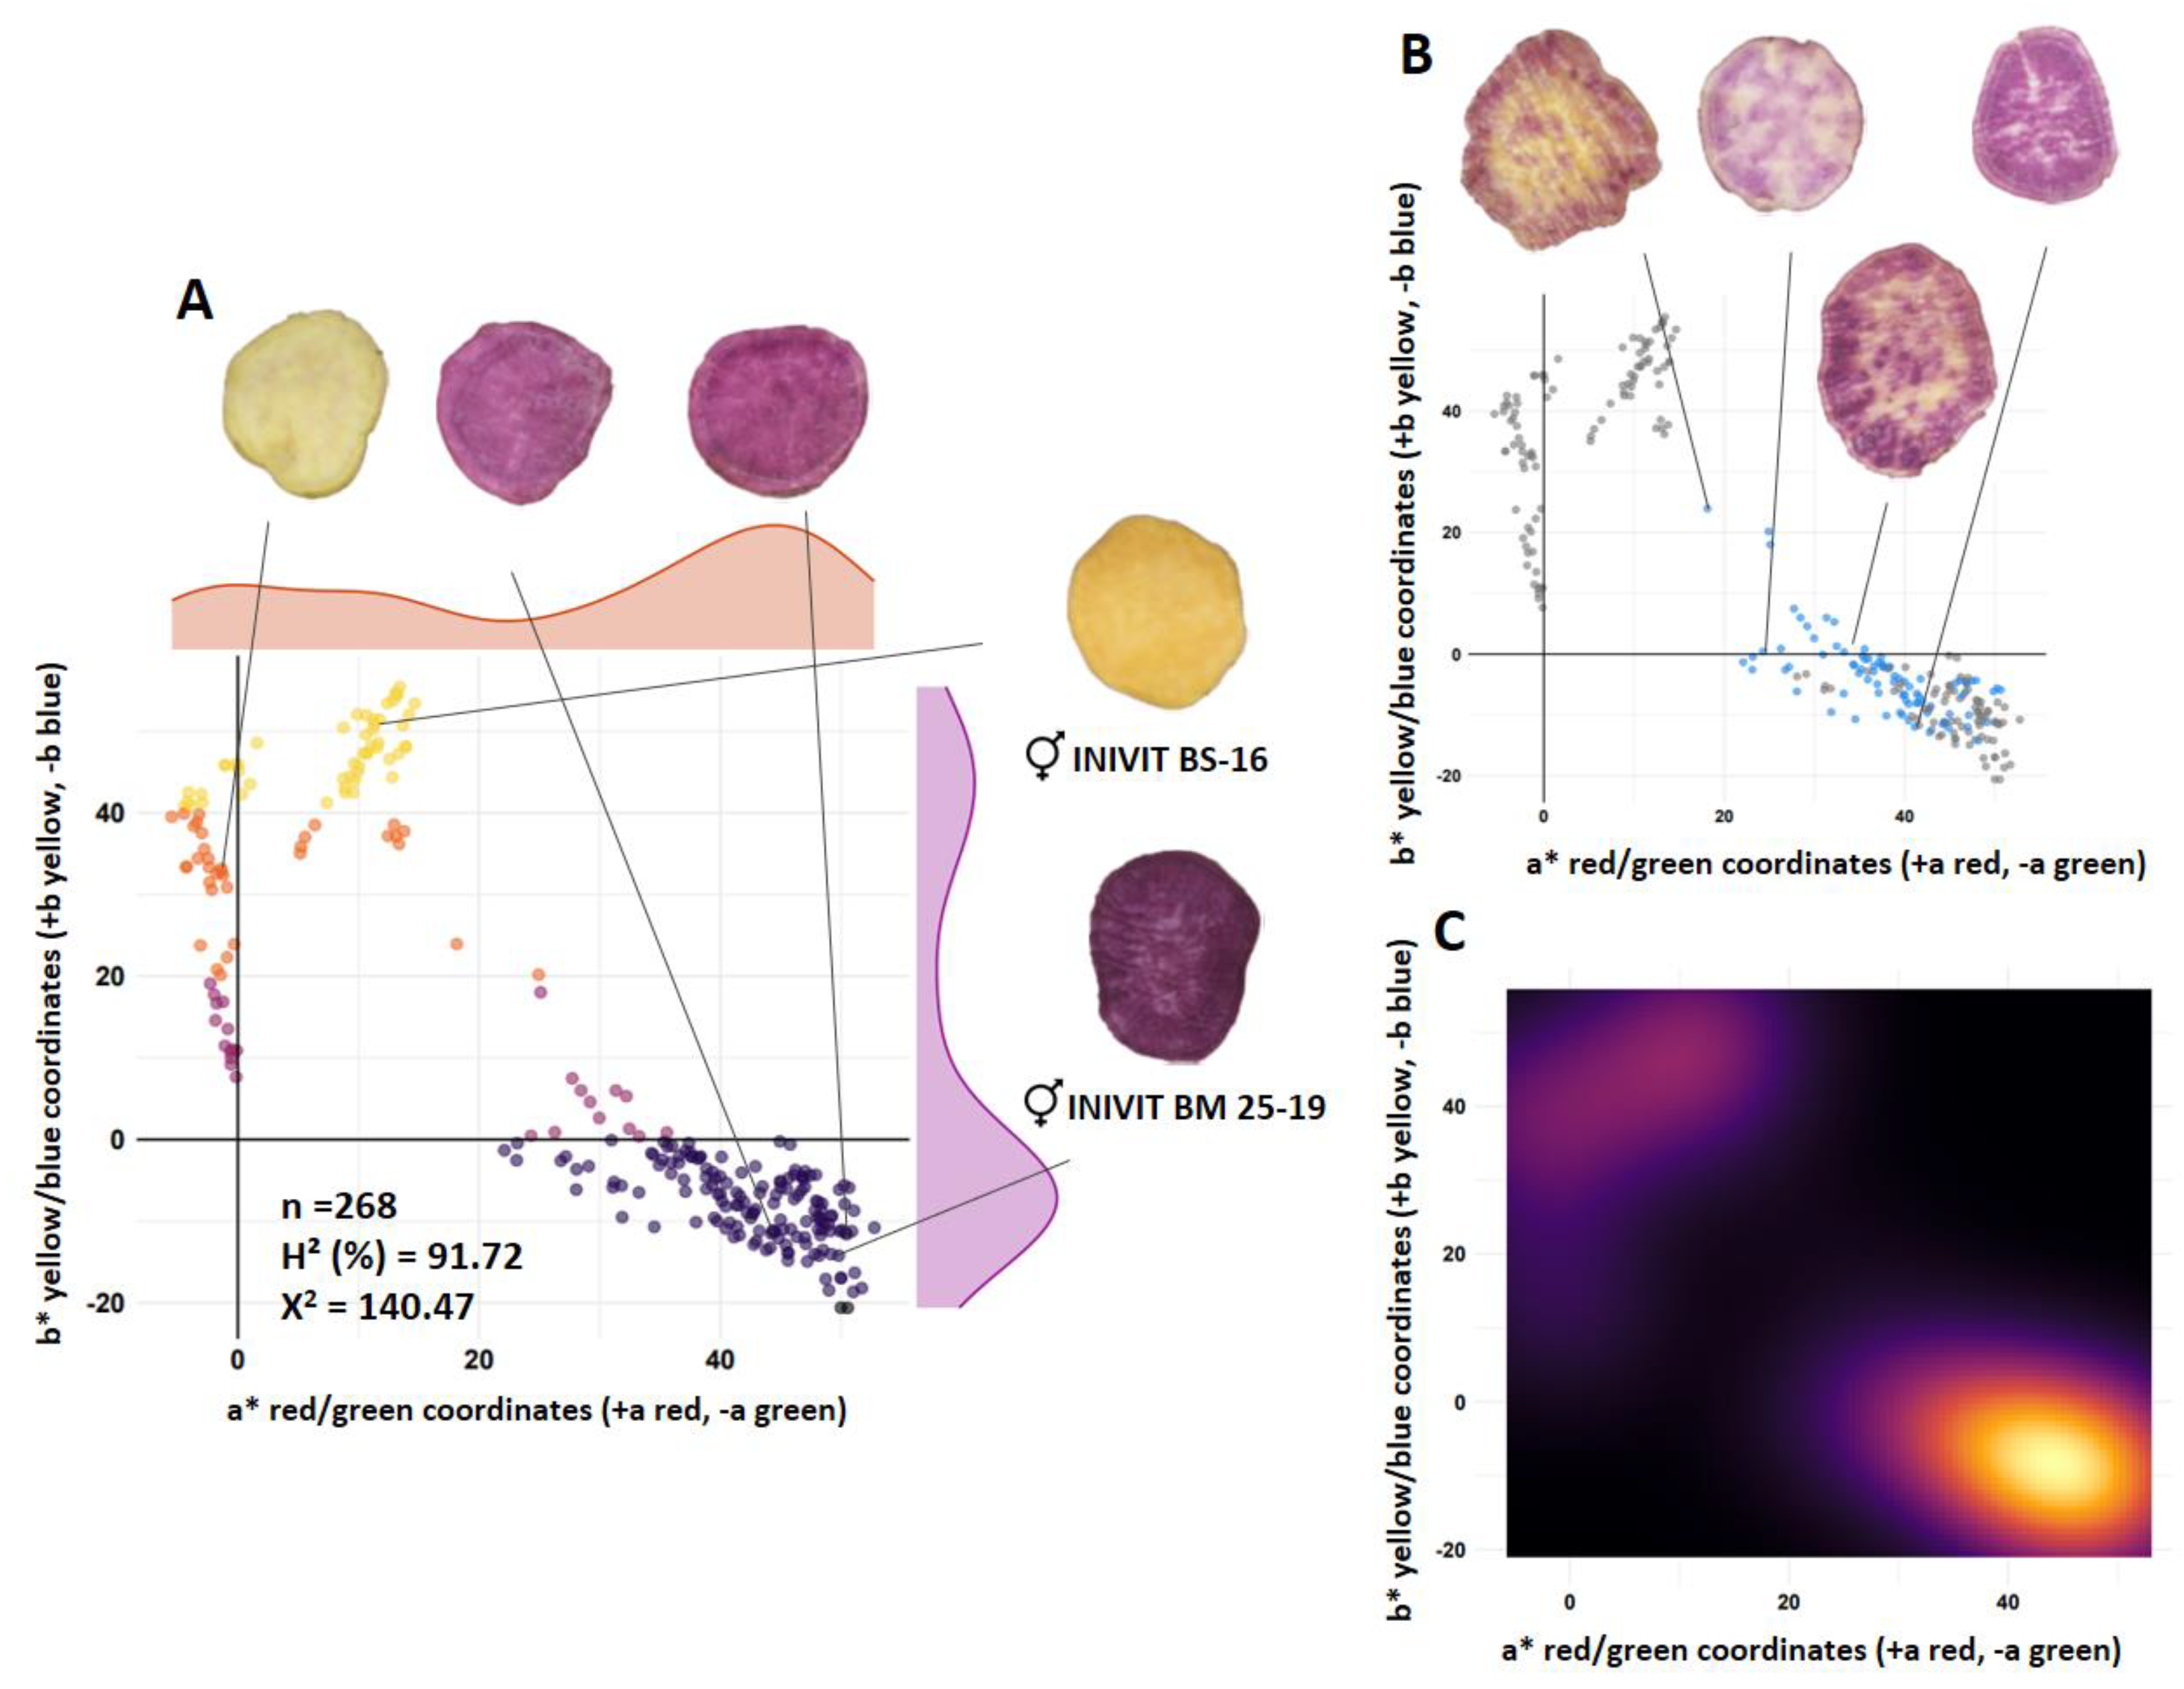
Figure 6.
Segregation for tuberous root shape of progeny resulting from the cross between two parents with defects in the surface of tuberous roots (CEMSA 74-228 x INIVIT BS-16). Scatter plots circularity x aspect ratio (A), scatter plot red dots representing genotypes with smooth skin (B), density contour plot (C) and scatter plots roundness x solidity (D).
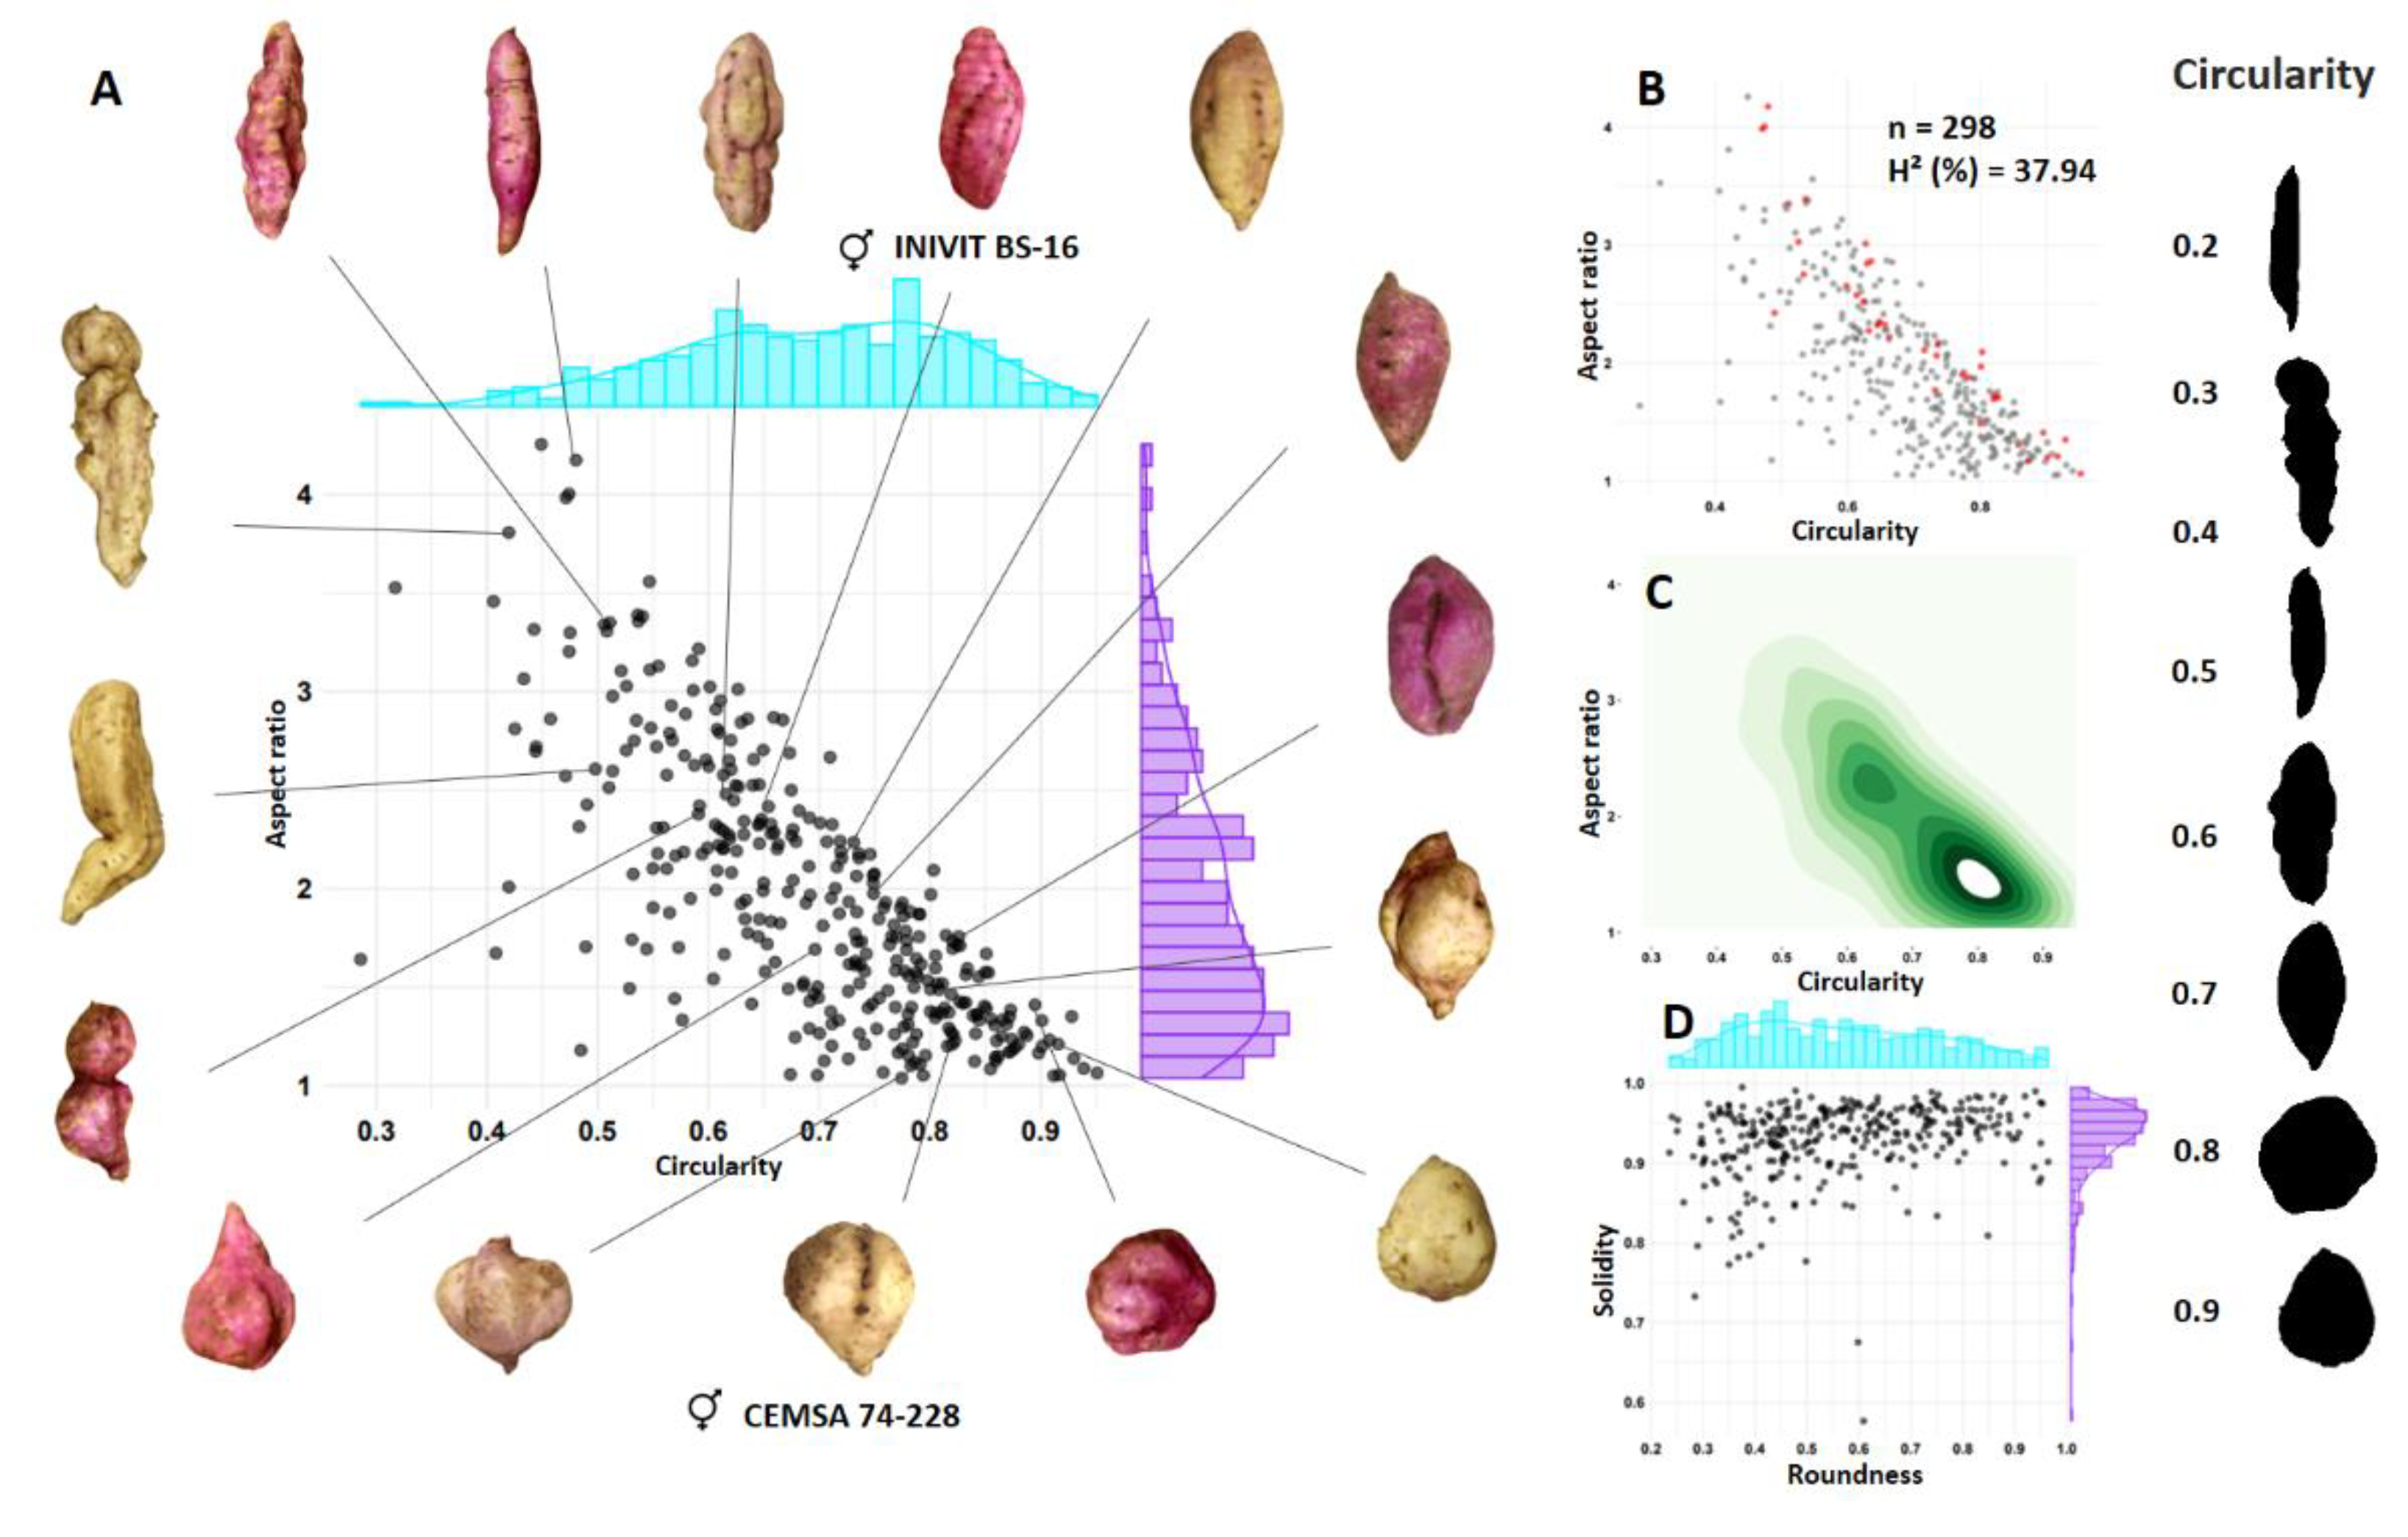
Figure 7.
Segregation for tuberous root shape of progeny resulting from the cross between two smooth-skinned parents (INIVIT BM-90 x ISS-18-004). Circularity x aspect ratio scatterplot (A), red dot scatterplot representing smooth-skinned genotypes (B), density contour plot (C), and roundness x solidity scatterplot (D).
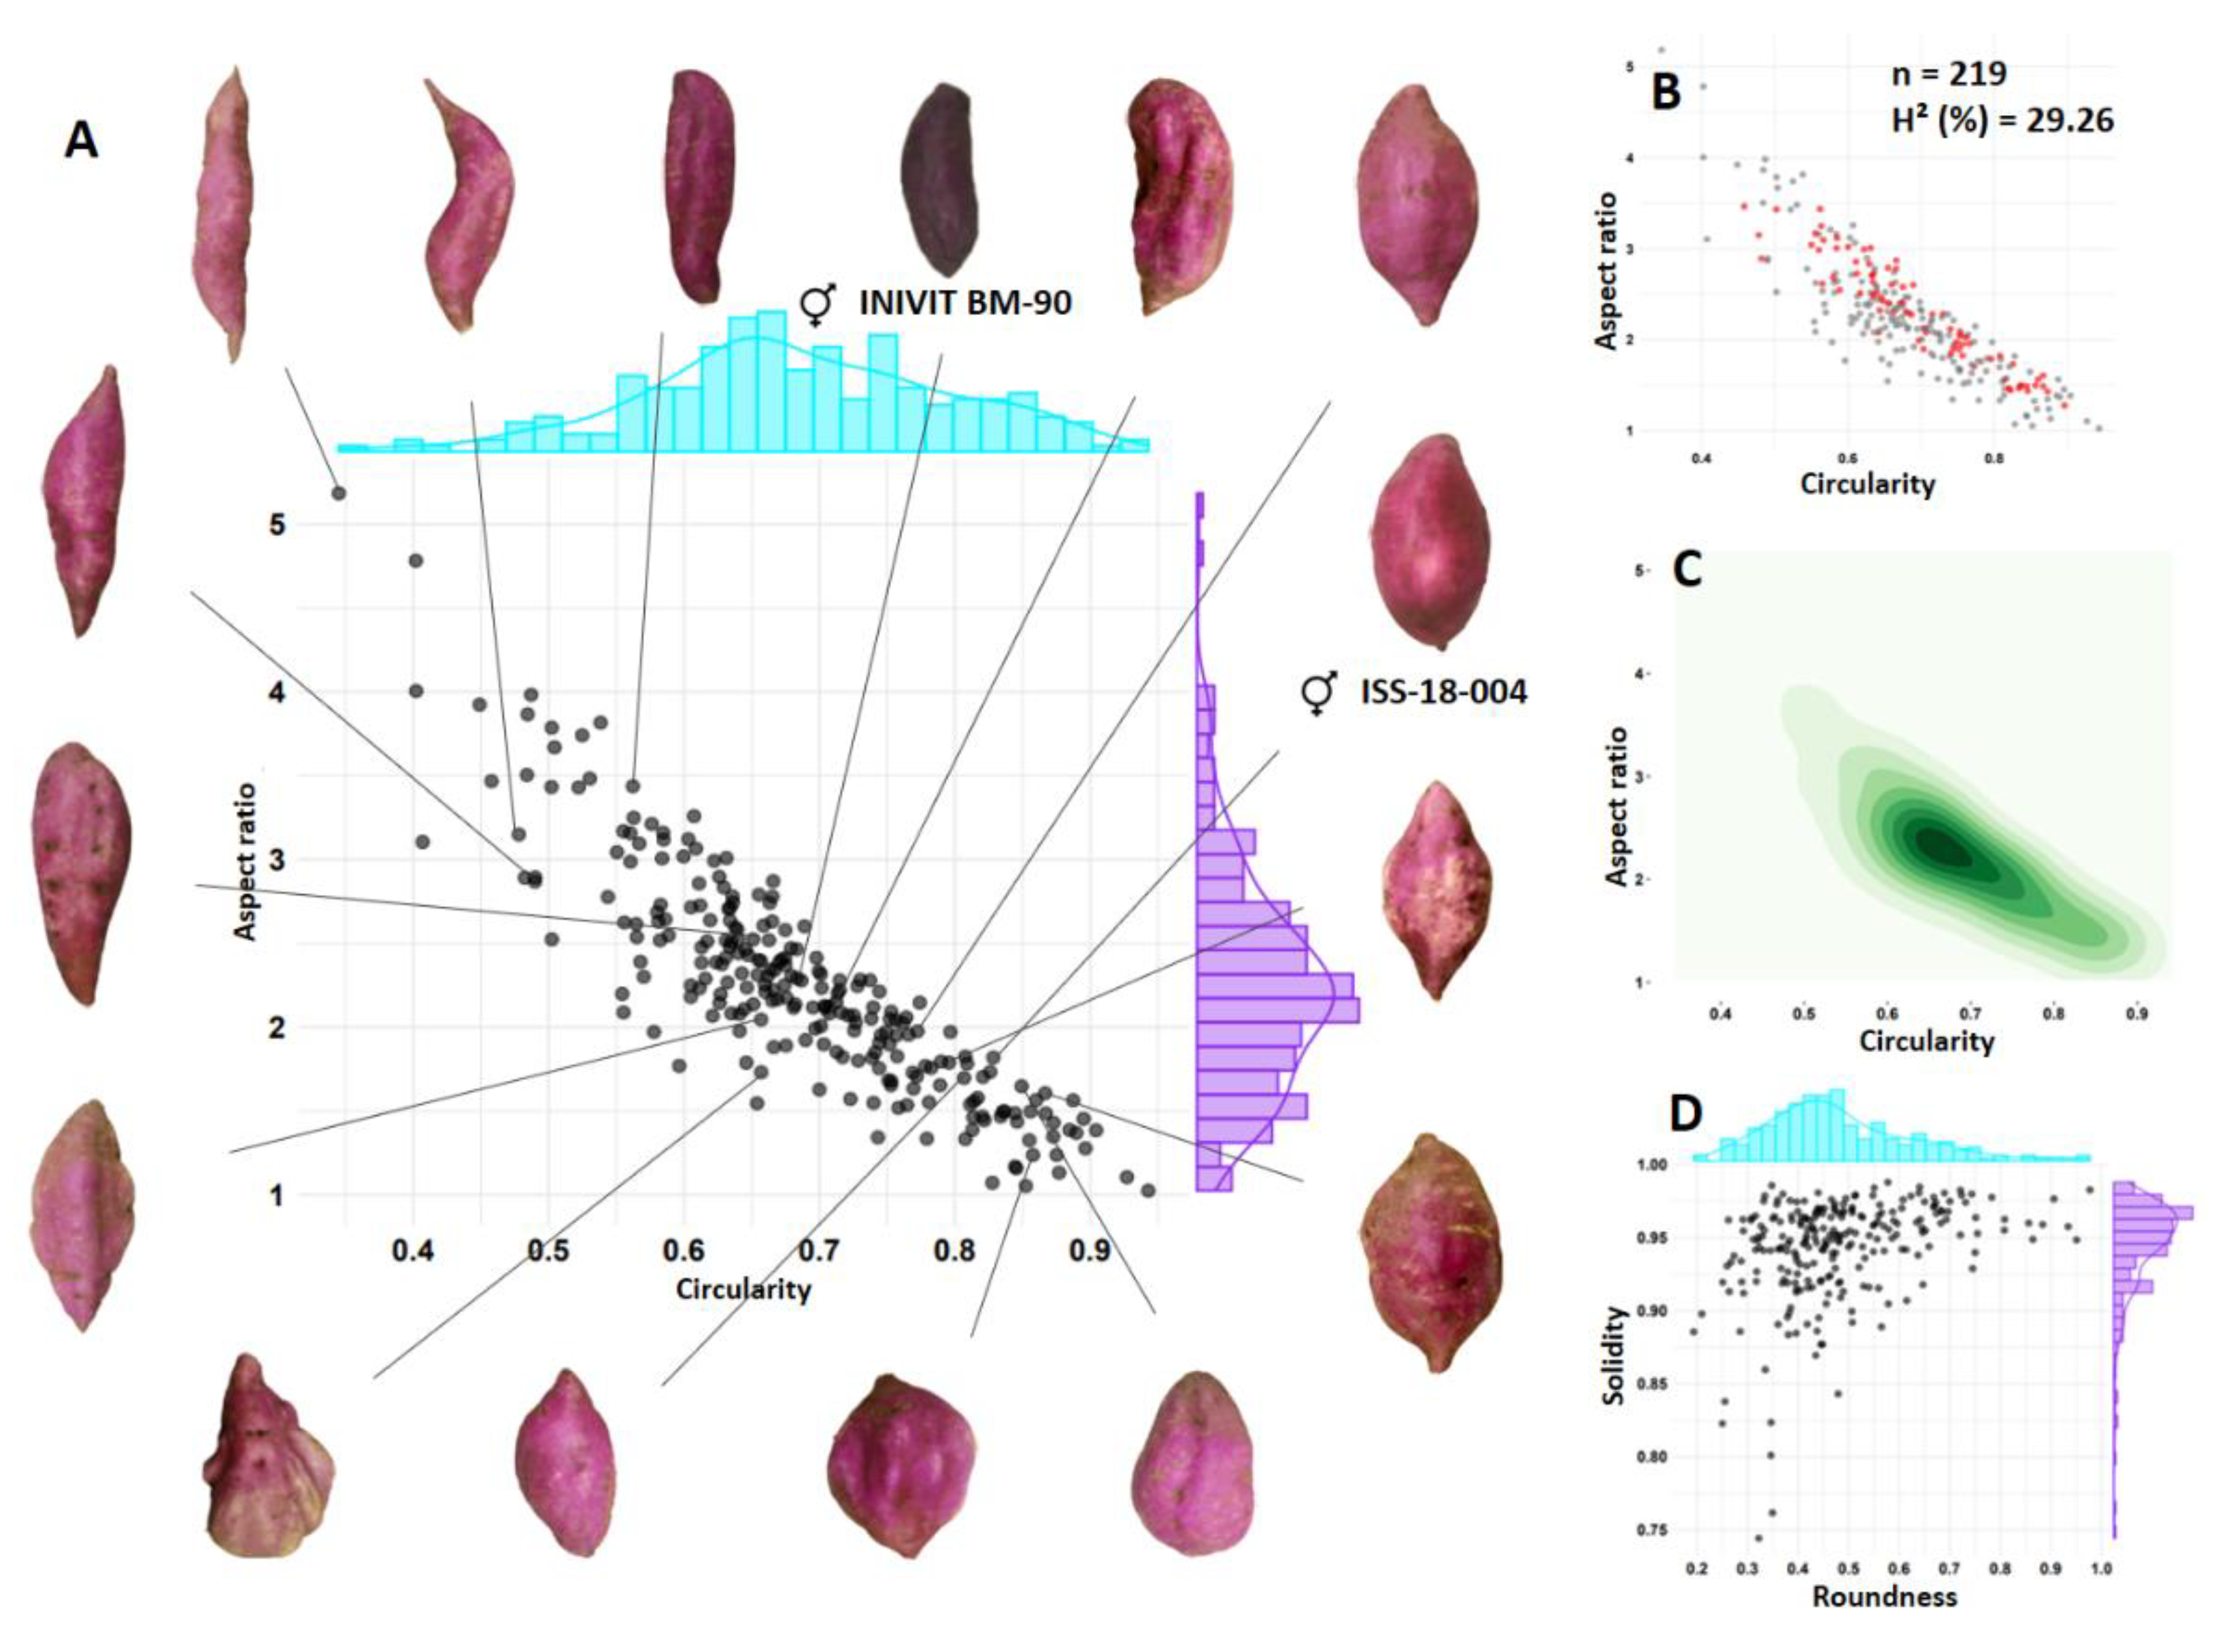
Figure 12.
Genetic model of biparental crosses for improving the flesh color of I. batatas.
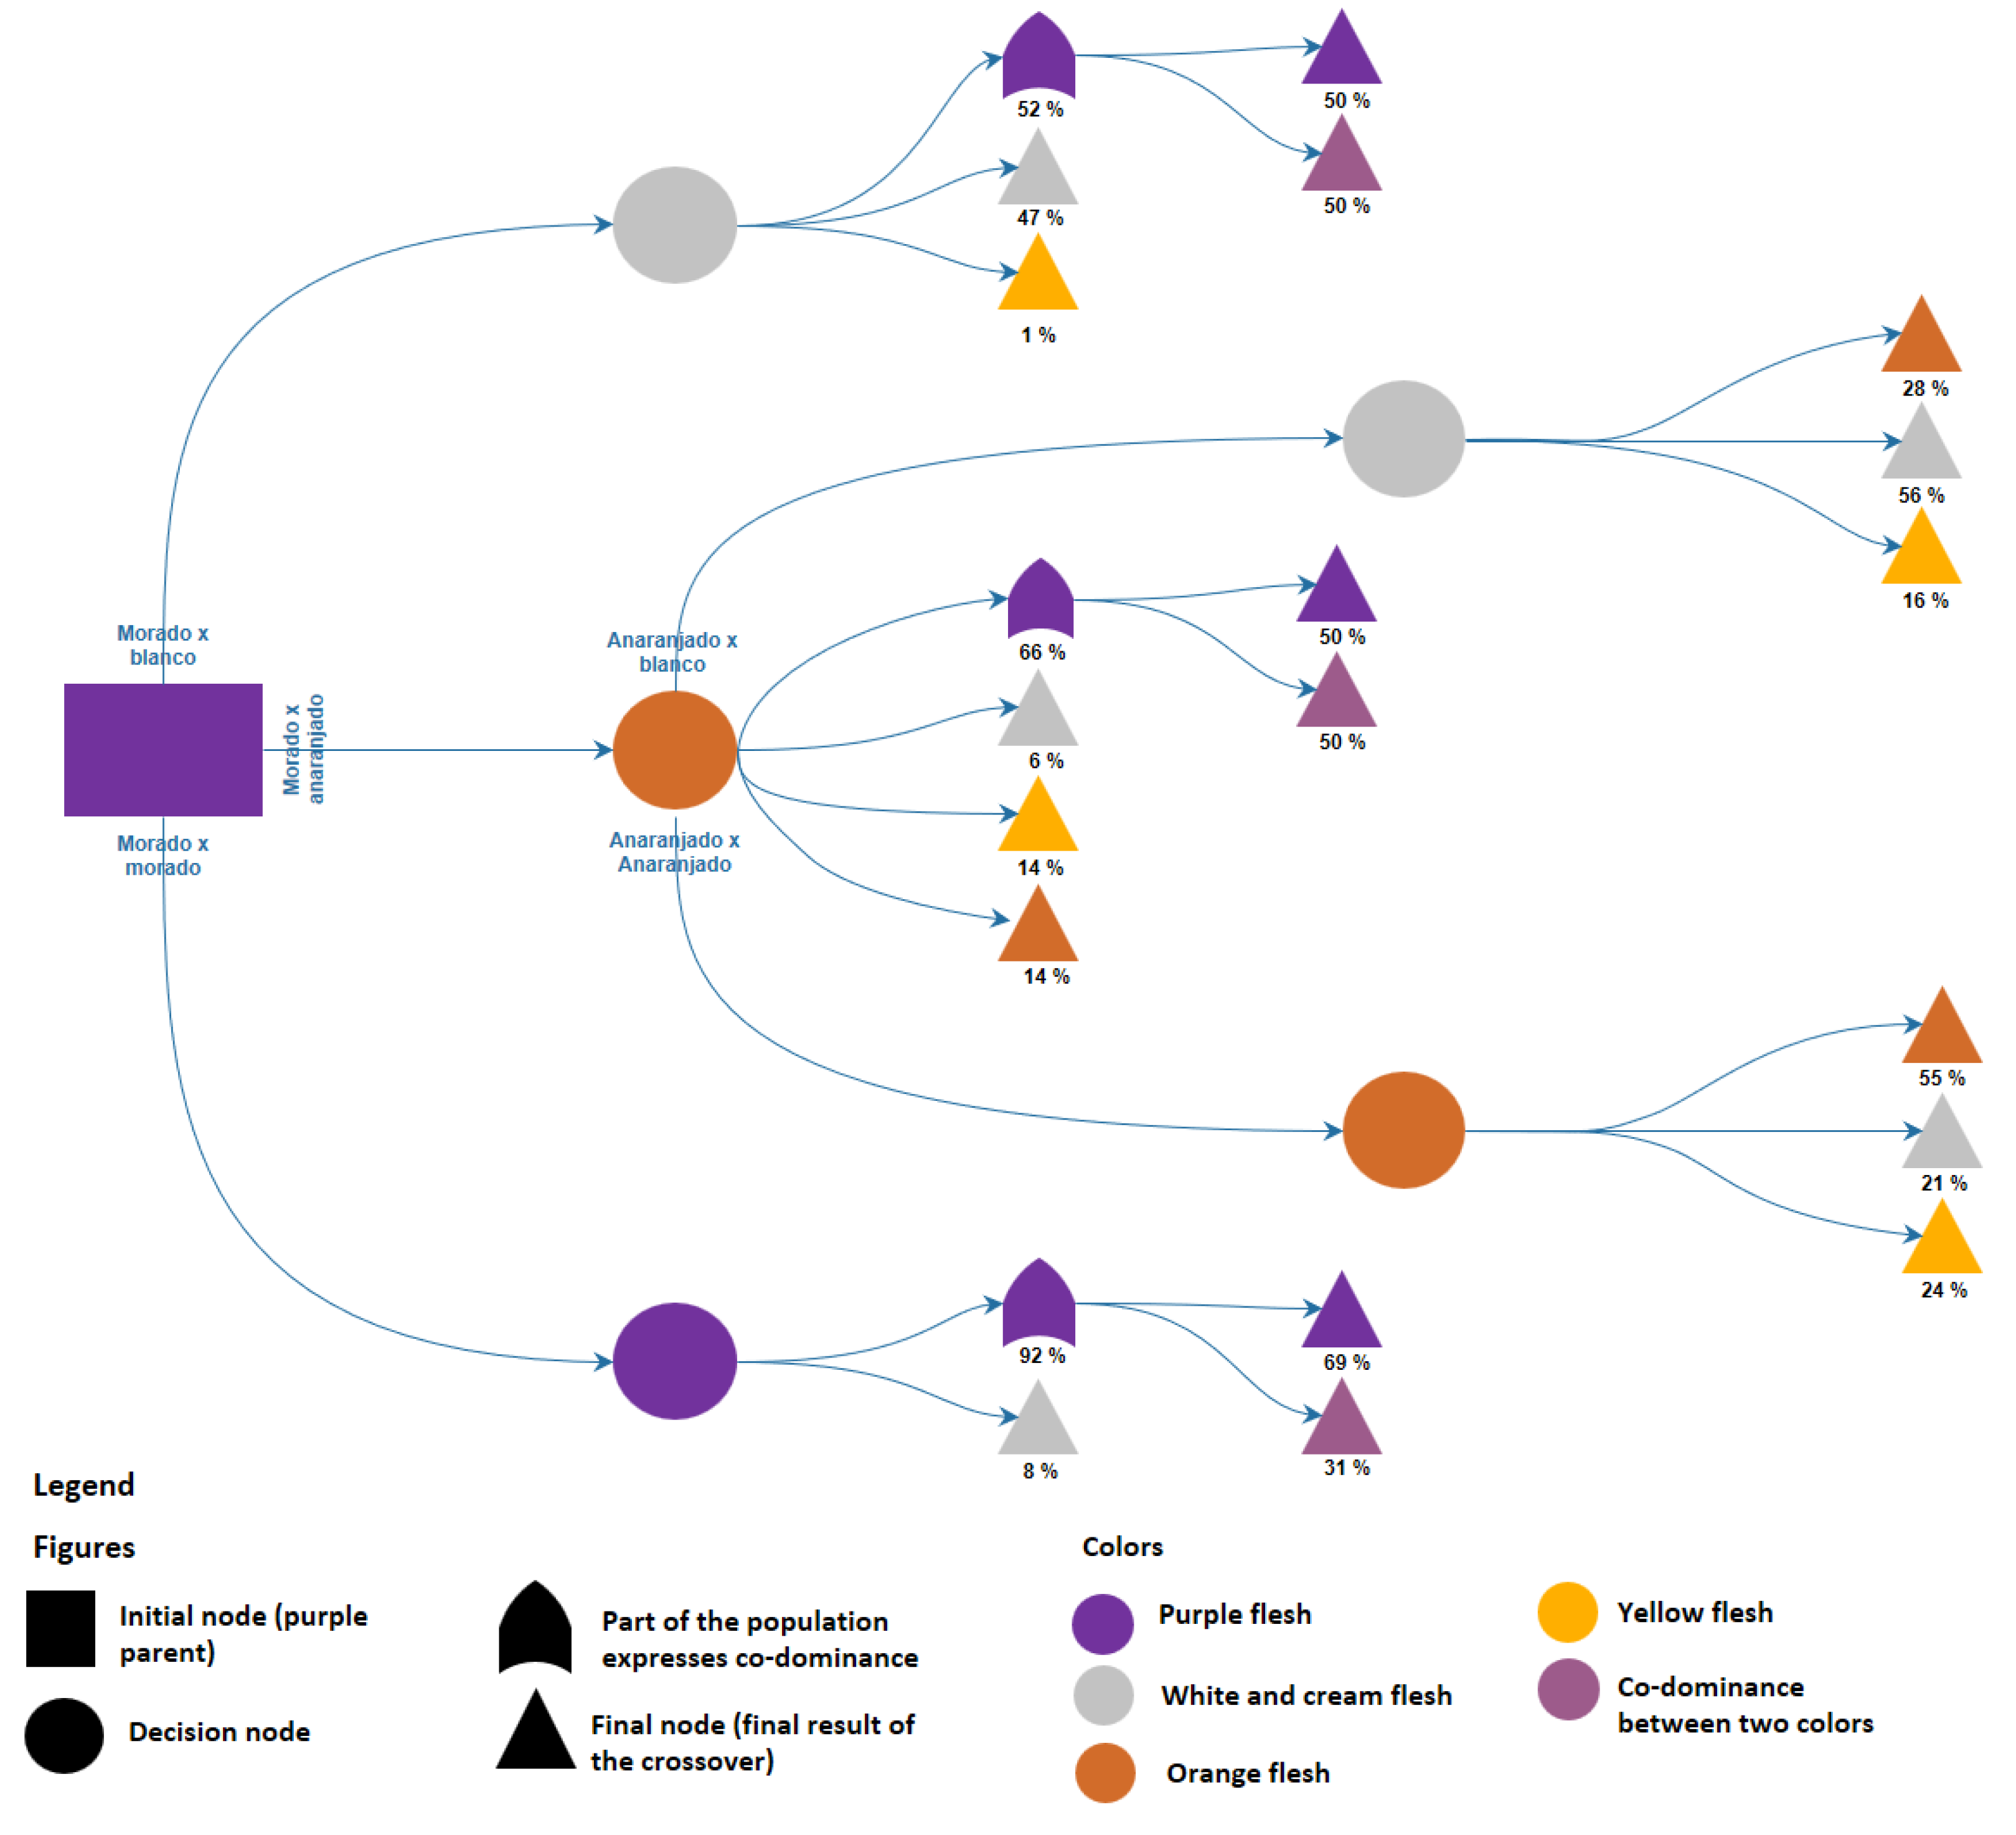

Table 1.
Selected characters and combination between parents.
| Character to be investigated | Parents | Parents | Family | |
|---|---|---|---|---|
| Color of the flesh of the tuberous root | INIVIT BM-90 (purple flesh) |
x | CEMSA 74-228 (white flesh) |
ISS-2305 |
| INIVIT BM-90 (purple flesh) |
x | INIVIT BM-8 (purple flesh) |
ISS-2306 | |
| INIVIT BS-16 (orange flesh) |
x | Español (orange flesh) |
ISS-2307 | |
| INIVIT BS-16 (orange flesh) |
x | CEMSA 78-326 (white flesh) |
ISS-2308 | |
| INIVIT BM-25-19 (purple flesh) | x | INIVIT BS-16 (orange flesh) |
ISS-2309 | |
| Shape of tuberous roots | INIVIT BS-16 (Skin with horizontal constrictions and longitudinal grooves) |
x | CEMSA 74-228 (Skin with longitudinal grooves) |
ISS-2310 |
| INIVIT BM-90 (smooth skin) |
x | ISS-18-004 (smooth skin) |
ISS-2311 |
Table 1.
Morphometric variables used.
| Variables | Code | Formula |
|---|---|---|
| Circularity | C | |
| Aspect ratio | AR | |
| Redondez | R | |
| Solidez | S | |
| Luminosity | L* | - |
| a* coordinate | a* | - |
| b* coordinate | b* | - |
A: area, P: perimeter, md: maximum diameter, Ac: convex area, Ema: major axis, Eme: best axis.
Table 3.
Results of the pollinations carried out among the selected parents.
| Family | No. of pollinations | No. of capsules | % of positive pollinations | No. of sedes | No. of seeds/capsule | % of seed germination | No. seedlings |
|---|---|---|---|---|---|---|---|
| ISS-2305 | 416 | 273 | 65.7 | 320 | 1.17 | 77.5 | 248 |
| ISS-2306 | 191 | 138 | 72.47 | 221 | 1.60 | 89.4 | 198 |
| ISS-2307 | 497 | 226 | 45.53 | 279 | 1.23 | 79.2 | 221 |
| ISS-2308 | 273 | 189 | 69.35 | 269 | 1.42 | 93.2 | 251 |
| ISS-2309 | 343 | 155 | 45.06 | 306 | 1.98 | 87.6 | 268 |
| ISS-2310 | 419 | 199 | 47.48 | 366 | 1.84 | 90.8 | 332 |
| ISS-2311 | 280 | 181 | 64.43 | 284 | 1.57 | 86.7 | 246 |
| Promedio | - | - | 58.57 | - | 1.54 | 86.34 | - |
| Total | 2419 | 1361 | - | 2045 | - | - | 1764 |
Disclaimer/Publisher’s Note: The statements, opinions and data contained in all publications are solely those of the individual author(s) and contributor(s) and not of MDPI and/or the editor(s). MDPI and/or the editor(s) disclaim responsibility for any injury to people or property resulting from any ideas, methods, instructions or products referred to in the content. |
© 2024 by the authors. Licensee MDPI, Basel, Switzerland. This article is an open access article distributed under the terms and conditions of the Creative Commons Attribution (CC BY) license (http://creativecommons.org/licenses/by/4.0/).
Copyright: This open access article is published under a Creative Commons CC BY 4.0 license, which permit the free download, distribution, and reuse, provided that the author and preprint are cited in any reuse.


