Preprint
Article

Online Self-Learning Based Raw Material Proportioning for Rotary Hearth Furnace and Intelligent Batching System Development

Altmetrics

Downloads

167

Views

42

Comments

0

A peer-reviewed article of this preprint also exists.

Submitted:

21 August 2024

Posted:

22 August 2024

You are already at the latest version

Alerts
Abstract
With the increasing awareness of environmental protection, the rotary hearth furnace system has emerged as a key technology that facilitates a win-win situation for both environmental protection and enterprise economic benefits. This is attributed to its high flexibility in raw material utilization, capability of directly supplying blast furnaces, low energy consumption, and high zinc removal rate. However, the complexity of the raw material proportioning process, coupled with its reliance on manual labor, results in a time-consuming and inefficient process. This paper innovatively introduces an intelligent formula method for raw materials based on online clustering algorithms and develops an intelligent batching system for rotary hearth furnaces. Firstly, the ingredients of raw materials undergo data preprocessing, which involves using the Local Outlier Factor (LOF) method to detect any abnormal values, Kalman filtering to smooth the data, and performing one-hot encoding to represent the different kinds of raw materials. Afterwards, the affinity propagation (AP) clustering method is used to evaluate past data on the ingredients of raw materials and their ratios. This analysis aims to extract information based on human experience with ratios and create a library of machine learning formulas. The incremental AP clustering algorithm is utilized to learn new ratio data and continuously update the machine learning formula library. To ensure that the formula meets the actual production performance requirements of the rotary hearth furnace, the machine learning formula is fine-tuned based on expert experience. The integration of machine learning and expert experience has demonstrated good flexibility and satisfactory performance in the practical application of intelligent formulas for rotary hearth furnaces. An intelligent batching system is developed and executed at a steel plant in China. It shows an excellent user interface and has significantly enhanced batching efficiency and product quality.
Keywords: 
Subject: Computer Science and Mathematics  -   Artificial Intelligence and Machine Learning

1. Introduction

The metallurgical dust and sludge generated during the steel smelting process account for approximately 5% -10% of the crude steel production [1]. The Iron content in these dust and mud is generally between 30% and 60%, and they contain valuable metals such as Calcium, Magnesium, and Zinc, which have high recovery value [2]. Rotary hearth furnace technology has the advantages of high output, low energy consumption, stable product quality and no specific requirements for raw materials. It also shows excellent performance in Zinc removal efficiency and environmental protection, and has been widely recognized in the metallurgical industry [3].
In the rotary hearth furnace system, batching is a crucial preliminary process, which is the basis to ensure product quality. As the ratio of raw materials is directly related to the efficiency of resource conversion, affects the type, concentration and quantity of emissions, and has a critical impact on the subsequent production process, it is necessary to accurately consider the ratio of various raw materials in the batching process. Therefore, optimizing the ratio of raw materials is the key to enhance the efficiency of the rotary hearth furnace system and improve the environmental performance.
Raw material batching is the mixing of various dust materials such as Electric Furnace Ash and blast furnace ash in a certain proportion, preparing for a series of subsequent processes such as ball forming and reduction reaction [4]. In many steel plants, the formula plans are manually calculated by engineers based on their long-term experience and professional knowledge accumulated in the frontline work [5,6,7].
The program for preparing production plans is as follows: (1) Experts in the relevant field use Excel files to complete calculations; (2) A group of two or three experts in the relevant field discuss and revise the plan; (3) The expert group produces the final production plan. However, the results have some errors, so they must solve it by using trial and error method, and go through a long process to obtain a feasible solution. In this process, experts need to consider not only the capacity limit of the warehouse and the type of materials, but also the uncertainty factors such as the difference of element content in the same material. Trial and error method cannot comprehensively consider all relevant factors and takes a long time [8,9,10].
As the rotary hearth furnace is a new industry, the raw material proportioning method has not yet found a similar mature and referential case. Experience and methods can be learned from relevant raw material proportioning fields, such as the optimization of copper strip loading process, Zircon brick raw material proportioning, raw coal proportioning, blast furnace production proportioning optimization, ore proportioning and other fields, to try to solve the problem of optimal proportioning of rotary hearth furnace raw materials. For example, Zhang et al. [11] proposed a Hybrid Multi objective Artificial Bee Colony Algorithm for the batching process of copper strip production. By normalizing the sum of target values and selecting the corresponding dominant sorting method based on diversity, the smelting process element proportioning scheme of copper strip was achieved. However, its adaptability was insufficient, convergence speed was slow, and algorithm complexity was high. To achieve greater precision and efficiency in determining the optimal raw material ratio for Zircon bricks, Liang et al. [12] employed machine learning (SVM) to develop a model correlating Zircon brick density with raw material ratio. Subsequently, they utilized an adaptive particle swarm optimization algorithm to refine the model and derive the best possible raw material ratio.
As for the raw coal blending, Lei et al. [13] introduced an optimization method based on interval programming. By utilizing interval numbers to depict the variability ranges of ash and sulfur content across different density levels of raw coal, they developed a prediction model for the quantity and quality of dense medium cyclone separator products and established a Mixed Integer Nonlinear Programming model.
For the blast furnace, the prevailing approach involves modeling blast furnace ironmaking based on the principles of ironmaking and material balance. Cui and Chen [14] enhanced the genetic algorithm and penalty function via leveraging the principles of blast furnace ironmaking and material balance, and developed an intelligent optimization system for the burden structure across the entire sintering and blast furnace ironmaking process.Spengler et al. [15] proposed an inheritance model for optimizing raw material ratios, aimed at solving the production cost problem of raw materials in blast furnaces. Zhai et al. [16] employed the GA-SVR method to identify the five most informative features for fuel ratio adjustment during blast furnace ironmaking, enabling operators to proactively adjust input parameters. Zhang et al. [17] introduced a multi-role decision support system designed to address ingredient economic optimization by establishing databases, model libraries, and knowledge bases. Hua et al. [18] developed an optimization model for blast furnace ironmaking aiming at minimizing production costs and CO2 emissions. The model was subsequently solved using the Non-dominated Sorting Genetic Algorithm II (NSGA-II) to derive the optimal solution.
Wu et al. [19] proposed an intelligent integrated batching optimization system for the field of ore batching. By understanding the chemical and physical properties of batching, the requirements for batching were determined. Firstly, an optimized proportioning scheme was established, and then a cascaded integrated quality prediction model was designed. The model feedbacked the prediction indicators to the optimized proportioning scheme, thereby determining the optimal proportioning scheme. However, these studies still require human involvement and cannot be updated online or have not been truly implemented.
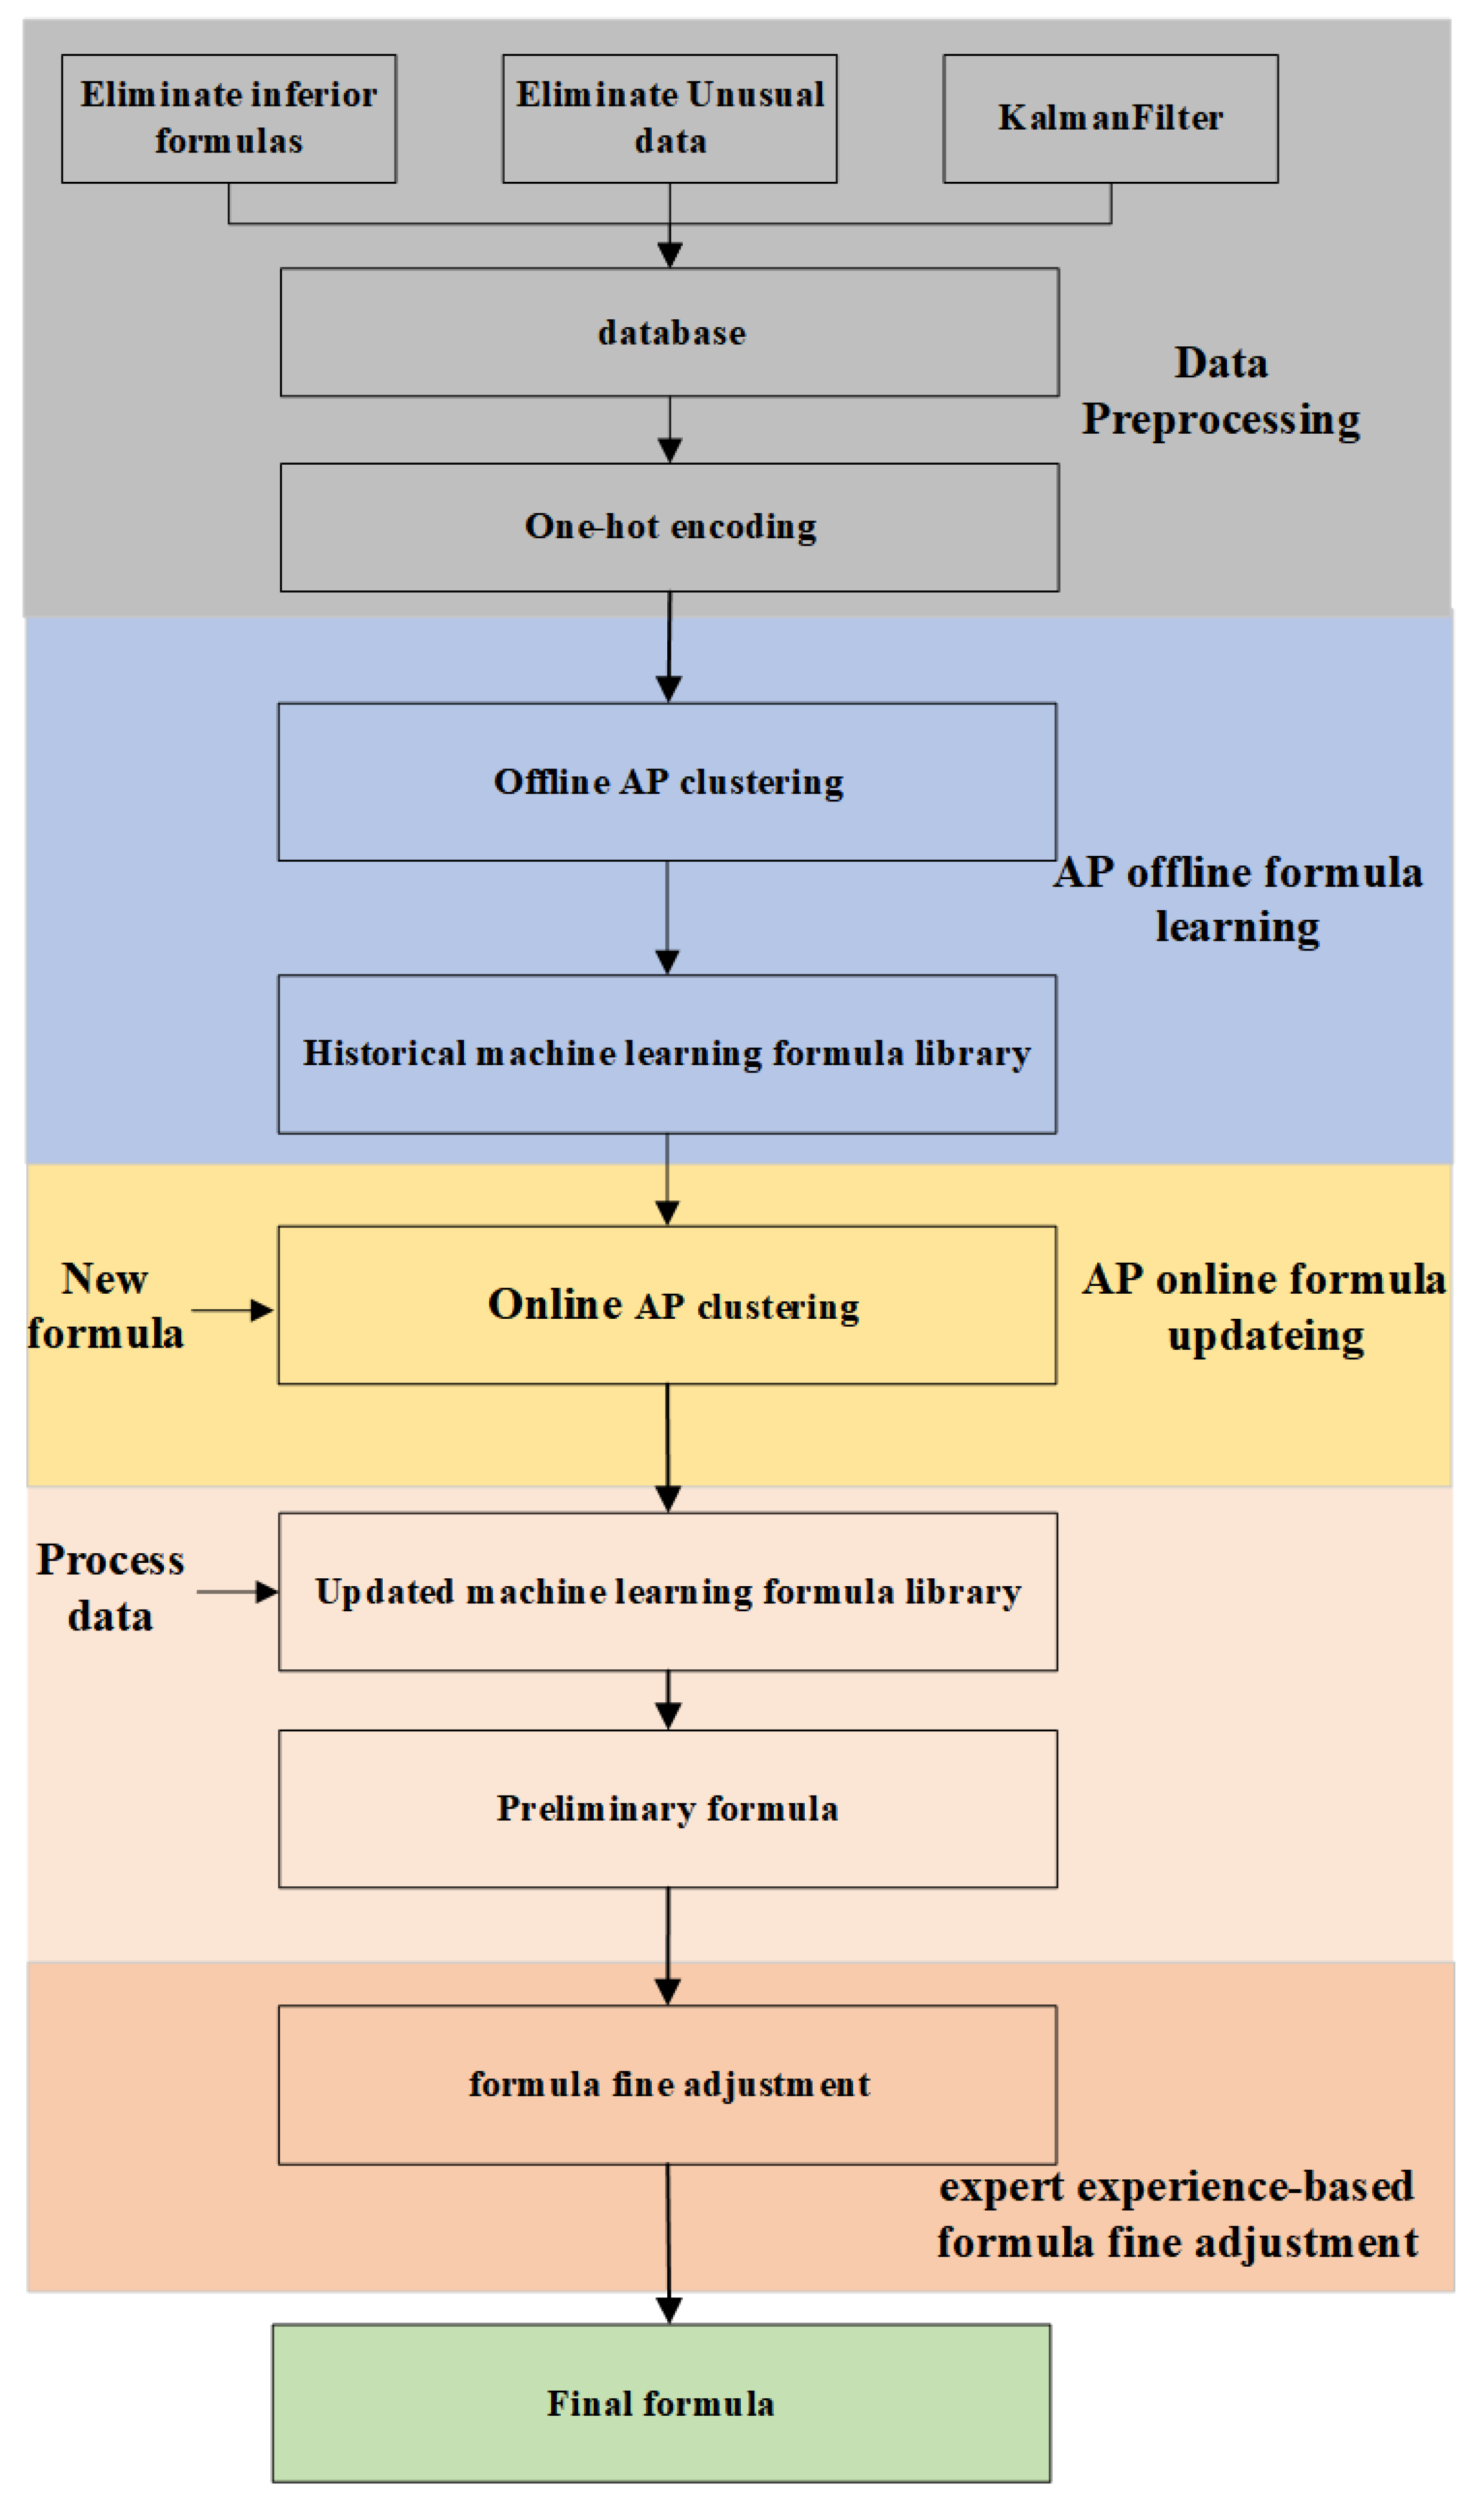
As a new industry, raw material composition for rotary hearth furnace is complex and frequently changes, so the batching process is more complex. As far as we know, rotary hearth furnace intelligent batching system is rarely involved in the world. In this study, an intelligent batching system with self-learning ability for rotary hearth furnaces is proposed, which consists of four parts: data preprocessing, AP offline formula learning, AP online formula updating, and expert experience-based formula fine adiustment.
  • In the first part, outliers of the ingredient composition in historical ratio data are found via the local factor algorithm [20], and measurement noise is filtered by Kalman filtering [21]; the one-hot method [22] encodes the types of raw materials to form a data set with the content of raw material ingredients and ratio of raw materials.
  • In the second part, AP clustering analysis is used to get many clustering groups from the above data sets and generate a machine learning formula library. Each cluster group represents a type of raw material composition characteristics, which corresponds to a type of ratio. Through unsupervised machine learning of historical data, valuable human formula experience is mined.
  • In the third part, the incremental AP clustering algorithm is used to update clustering groups during the continuous operation of the system and consequently update the machine learning formula library. On the basis of the existing cluster grouping, if the new formula data is similar to a cluster, it belongs to this cluster grouping; If the new formula data is not similar to all existing clustering groups, a new clustering group will be created. This method effectively inherits the previous clustering results and realizes the dynamic update of formula data.
  • In the fourth part, learning from experts’ experience, the formula generated by machine learning is finely adjusted to make the mixture of raw materials meet the requirements in C, Z n , C l and C / O performance. The reason is that the machine learning formula learns human experience formula, while the human experience formula does not fully consider the requirements of rotary hearth furnace for C, Z n , C l and C / O performance.
The developed intelligent batching system has good interactivity and a friendly user interface. Users can easily modify configuration parameters to meet different needs and conditions.
The remaining part of this paper is organized as follows. In Section 2, the different types of raw materials and their elements in the rotary hearth furnace batching system are mainly introduced. Section 3 provides a detailed introduction to the intelligent batching approach based on online clustering. Section 4 mainly introduces an application example of a rotary hearth furnace system. The conclusion is given in Section 5.

2. Types of Raw Materials and Its Element Analysis

When designing and optimizing the batching system of the rotary hearth furnace, it is necessary to comprehensively consider the load capacity of the production equipment, and at the same time, it is necessary to conduct a comprehensive analysis based on the actual situation on site and the limiting conditions of element content in the batching. Taking a steel plant in China as an example, the data analysis of its batching process mainly involves two core aspects: the types of raw materials involved and the types of elements contained in these raw materials.
It includes six different types of raw materials, as shown in the Table 1. x 1 is Environmental Ash, mainly derived from raw materials dispersed during system operation. x 2 is Coke Dry Quenching Dust (CDQ). Its main component is "C" element, and its element content is as high as 84.4%. x 3 is the Ash from the Iron casting plant, with C content of about 5% and Z n content of about 0.1%. x 4 is Cold-rolled Mud, with C content of about 3%, C l content of about 0.3%, and Z n content of about 14%. x 5 is Secondary Ash of Blast Furnace, with C content of about 16%, Z n content of about 2.4%, and C l content of about 5%. x 6 is Mixed Ash, which is composed of Electric Furnace Ash, LT ash, OG sludge, etc. The electric furnace ash is produced from the dust removal ash of the electric furnace smelting in the steel plant, while OG sludge and LT ash are both produced from the converter steelmaking process in the steel plant. OG sludge is the sludge produced by the converter gas wet recovery system, and LT ash is the dry dust removal ash of the converter. The C content in Electric Furnace Ash is generally around 1.7%, Z n content is around 7.9%, C l content is around 0.6%. C content in LT ash is generally around 2%, Z n content is generally around 4%; C content in OG mud is generally around 2%, and Z n content is generally around 3%. In addition, during the operation of the rotary hearth furnace, due to the mixing, ball pressing, screening, high temperature treatment and other processes of raw materials, a certain quantity of returned materials may be generated due to ball fracture, equipment performance and other reasons. The return material F M Q is a mixture of various raw materials. The content of each element in the returned material and x 1 are approximately considered as the average of various raw material components.
Considering the production process requirements, special attention needs to be paid to the elemental content of C, Z n , and C l in the mixture, as well as the C / O ratio. The content and proportion of these elements in the formula may have a significant impact on the performance and quality of the final product. Therefore, when constructing a formula optimization model, it is necessary to ensure accurate monitoring and control of the content of these elements to meet process requirements and achieve optimal production results.

3. Online Clustering Based Intelligent Batching Method

In this section, we propose a raw material proportioning method for rotary hearth furnaces based on online clustering algorithms. The structure of the proposed online clustering proportioning method is shown in Figure 1. First, we use the LOF algorithm and Kalman filtering algorithm to process the historical data of raw material components. Next, the principle of AP clustering algorithm is described in detail, and it is used for offline learning of preprocessed data to generate machine learning formula library. Then, the online AP clustering algorithm is used to effectively cluster the current data and historical data, so as to update the machine learning formula library. According to the current raw material composition, a preliminary formula is recommended based on the updated the machine learning formula library. Finally, using expert experience-based formula fine-tuning module, the preliminary formula is adjusted to ensure that the final formula meets the performance requirements of the rotary hearth furnace.

3.1. Data Preprocessing

During the continuous operation of the rotary hearth furnace system, some new data are generated. These data mainly include the ratio and it’s corresponding content of raw materials. The elemental composition of these raw material mainly includes Carbon (C), Zinc ( Z n ), and Iron ( F e ). Iron oxide ( F e O ) is the most concerned material component. The differences in the sources of raw materials may lead to differences in the composition content, for example, Iron ore from different regions or suppliers may contain different impurities or element contents. In addition, seasonal fluctuations, such as weather changes, may also affect the composition of raw materials, as they may affect the humidity and temperature during mining or transportation, thereby affecting the properties of raw materials. Furthermore, laboratory errors may also cause data fluctuations, as different laboratories or testing methods may yield different measurement results. In view of these factors, it is particularly important to process the raw material composition data.
Firstly, the element content data of the raw material components is preprocessed. Local outlier factor (LOF) algorithm is used to identify outliers, and linear interpolation method is used to complete the missing value. Kalman filtering technology is employed to filter out measurement noise. Additionally, it is necessary to remove inferior formulas from historical data.
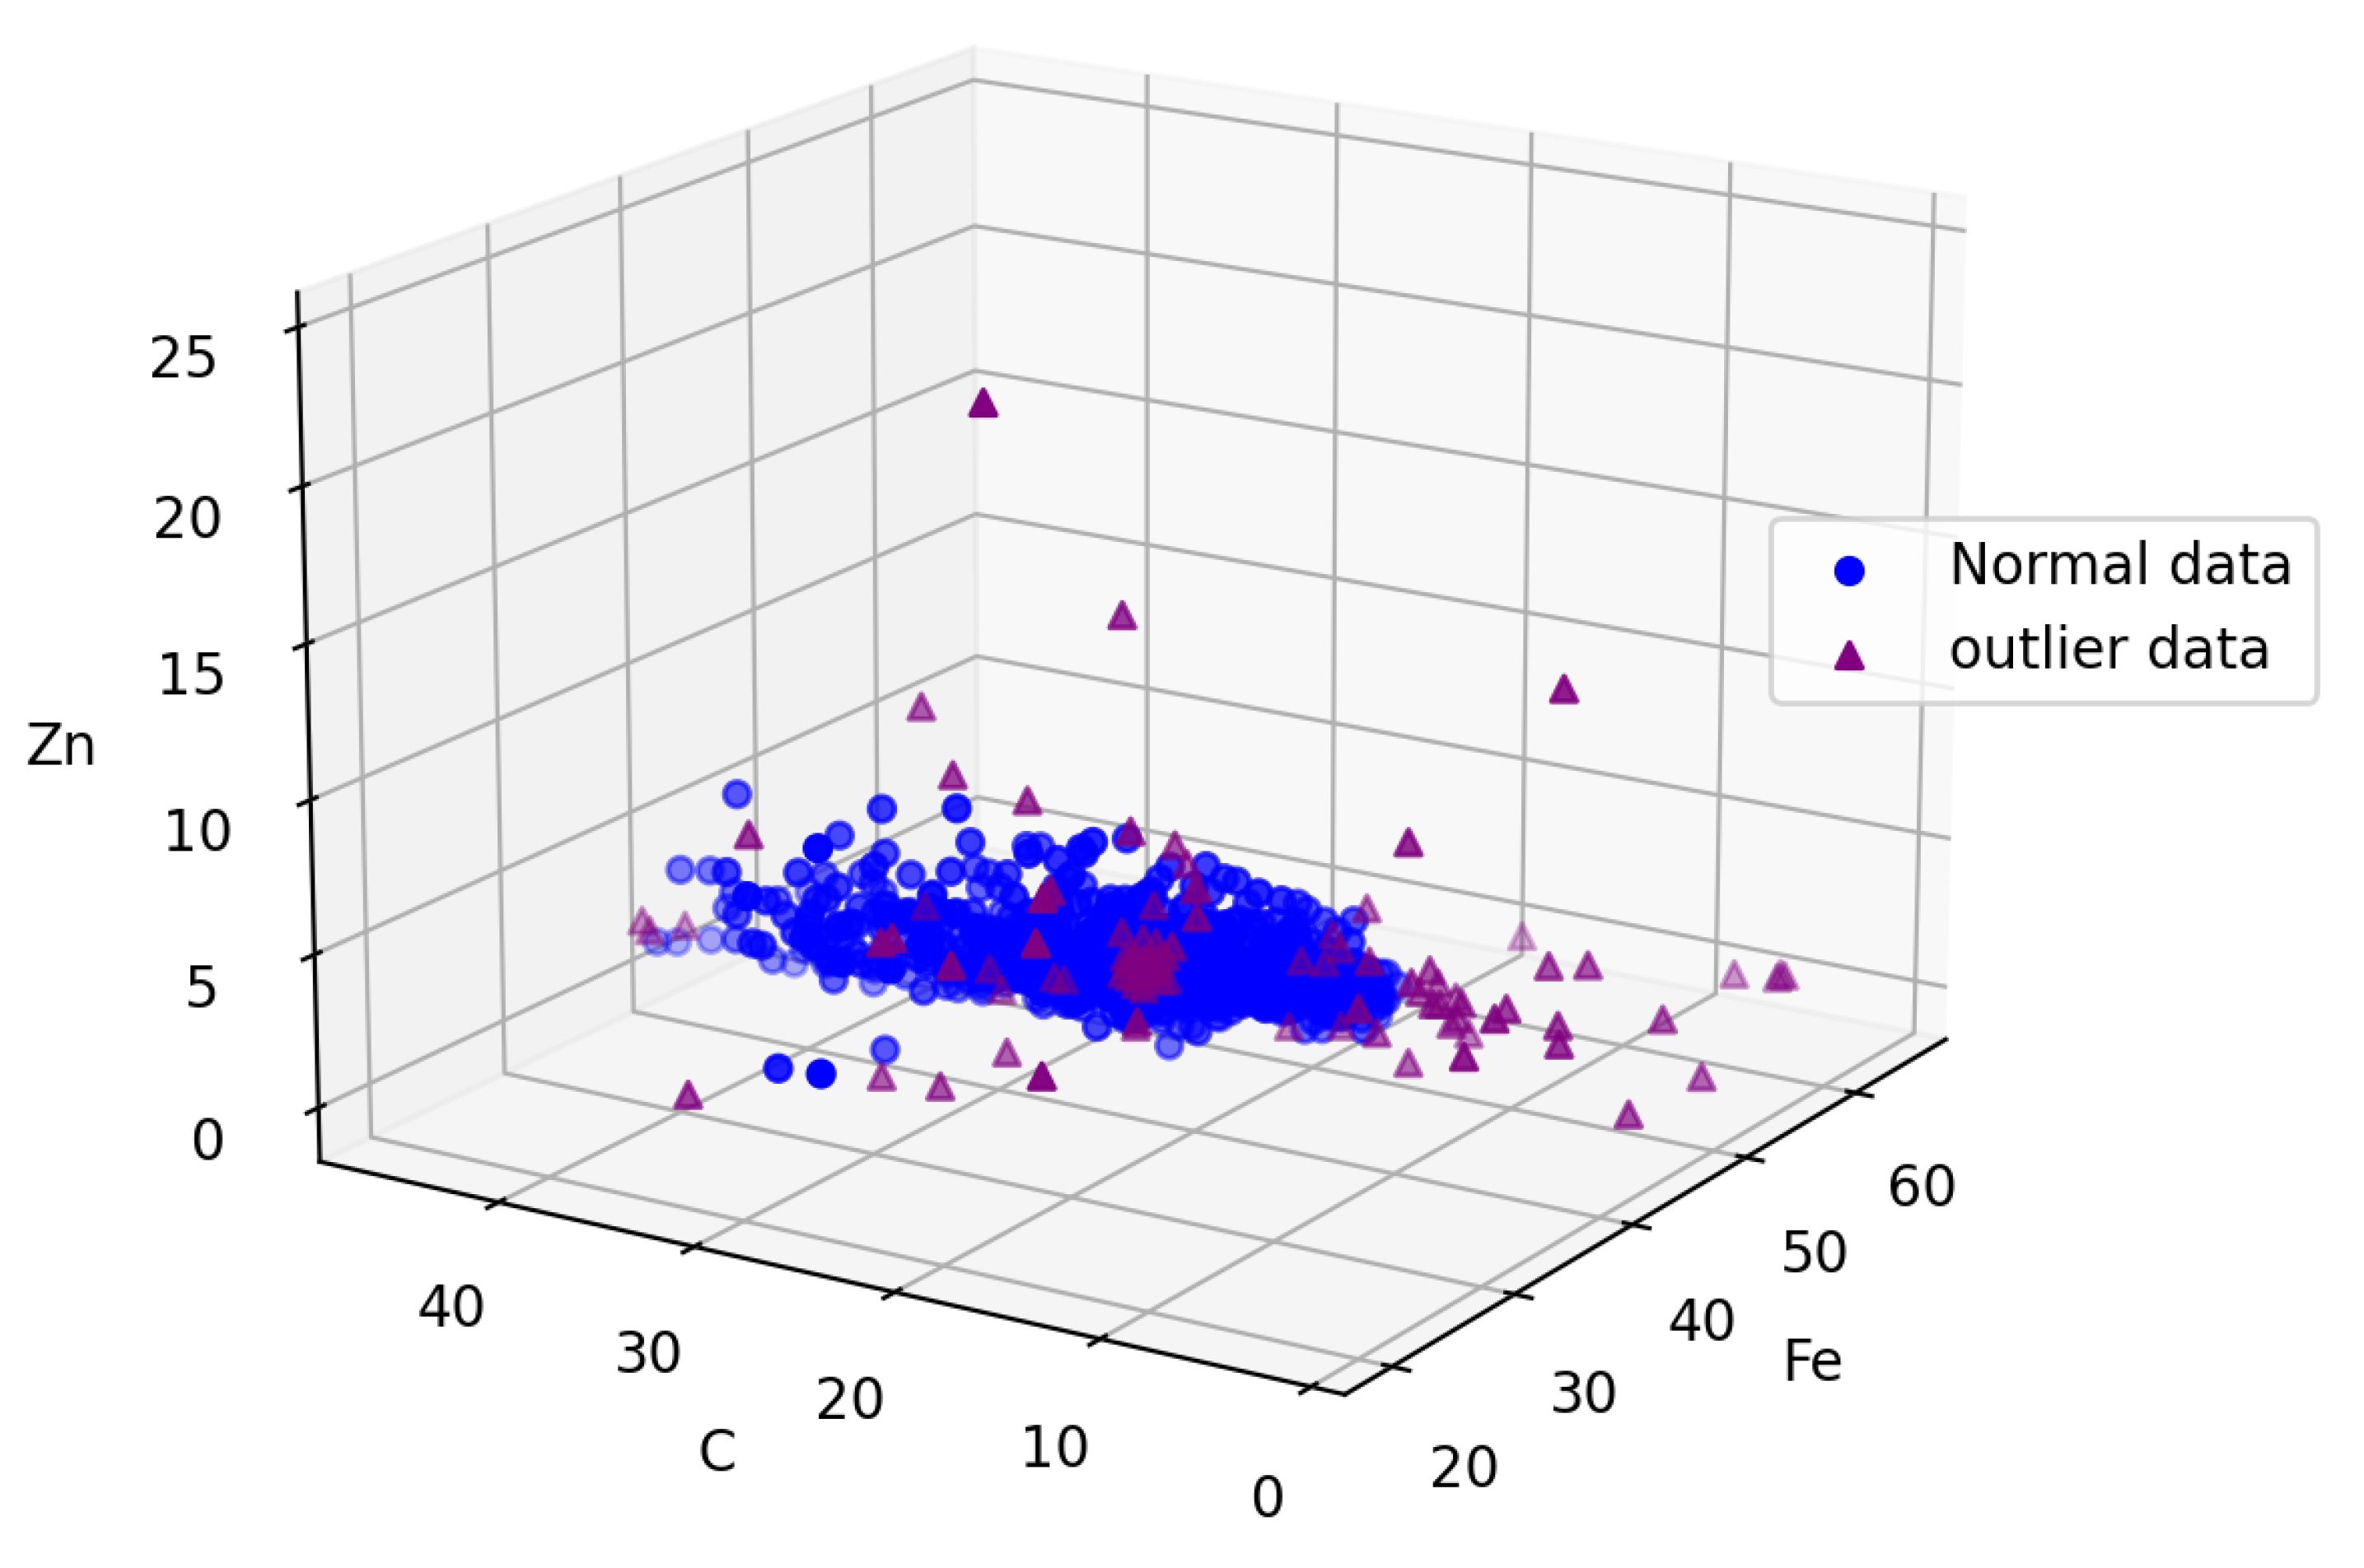
In order to facilitate readers’ understanding of the effectiveness of LOF outlier detection, we take three elements (C, F e , Z n ) in the secondary ash of the blast furnace as an example to visualize the detection results, as shown in Figure 2, where the circular data represents normal data and the pentagonal represents the anomaly values detected by the algorithm.
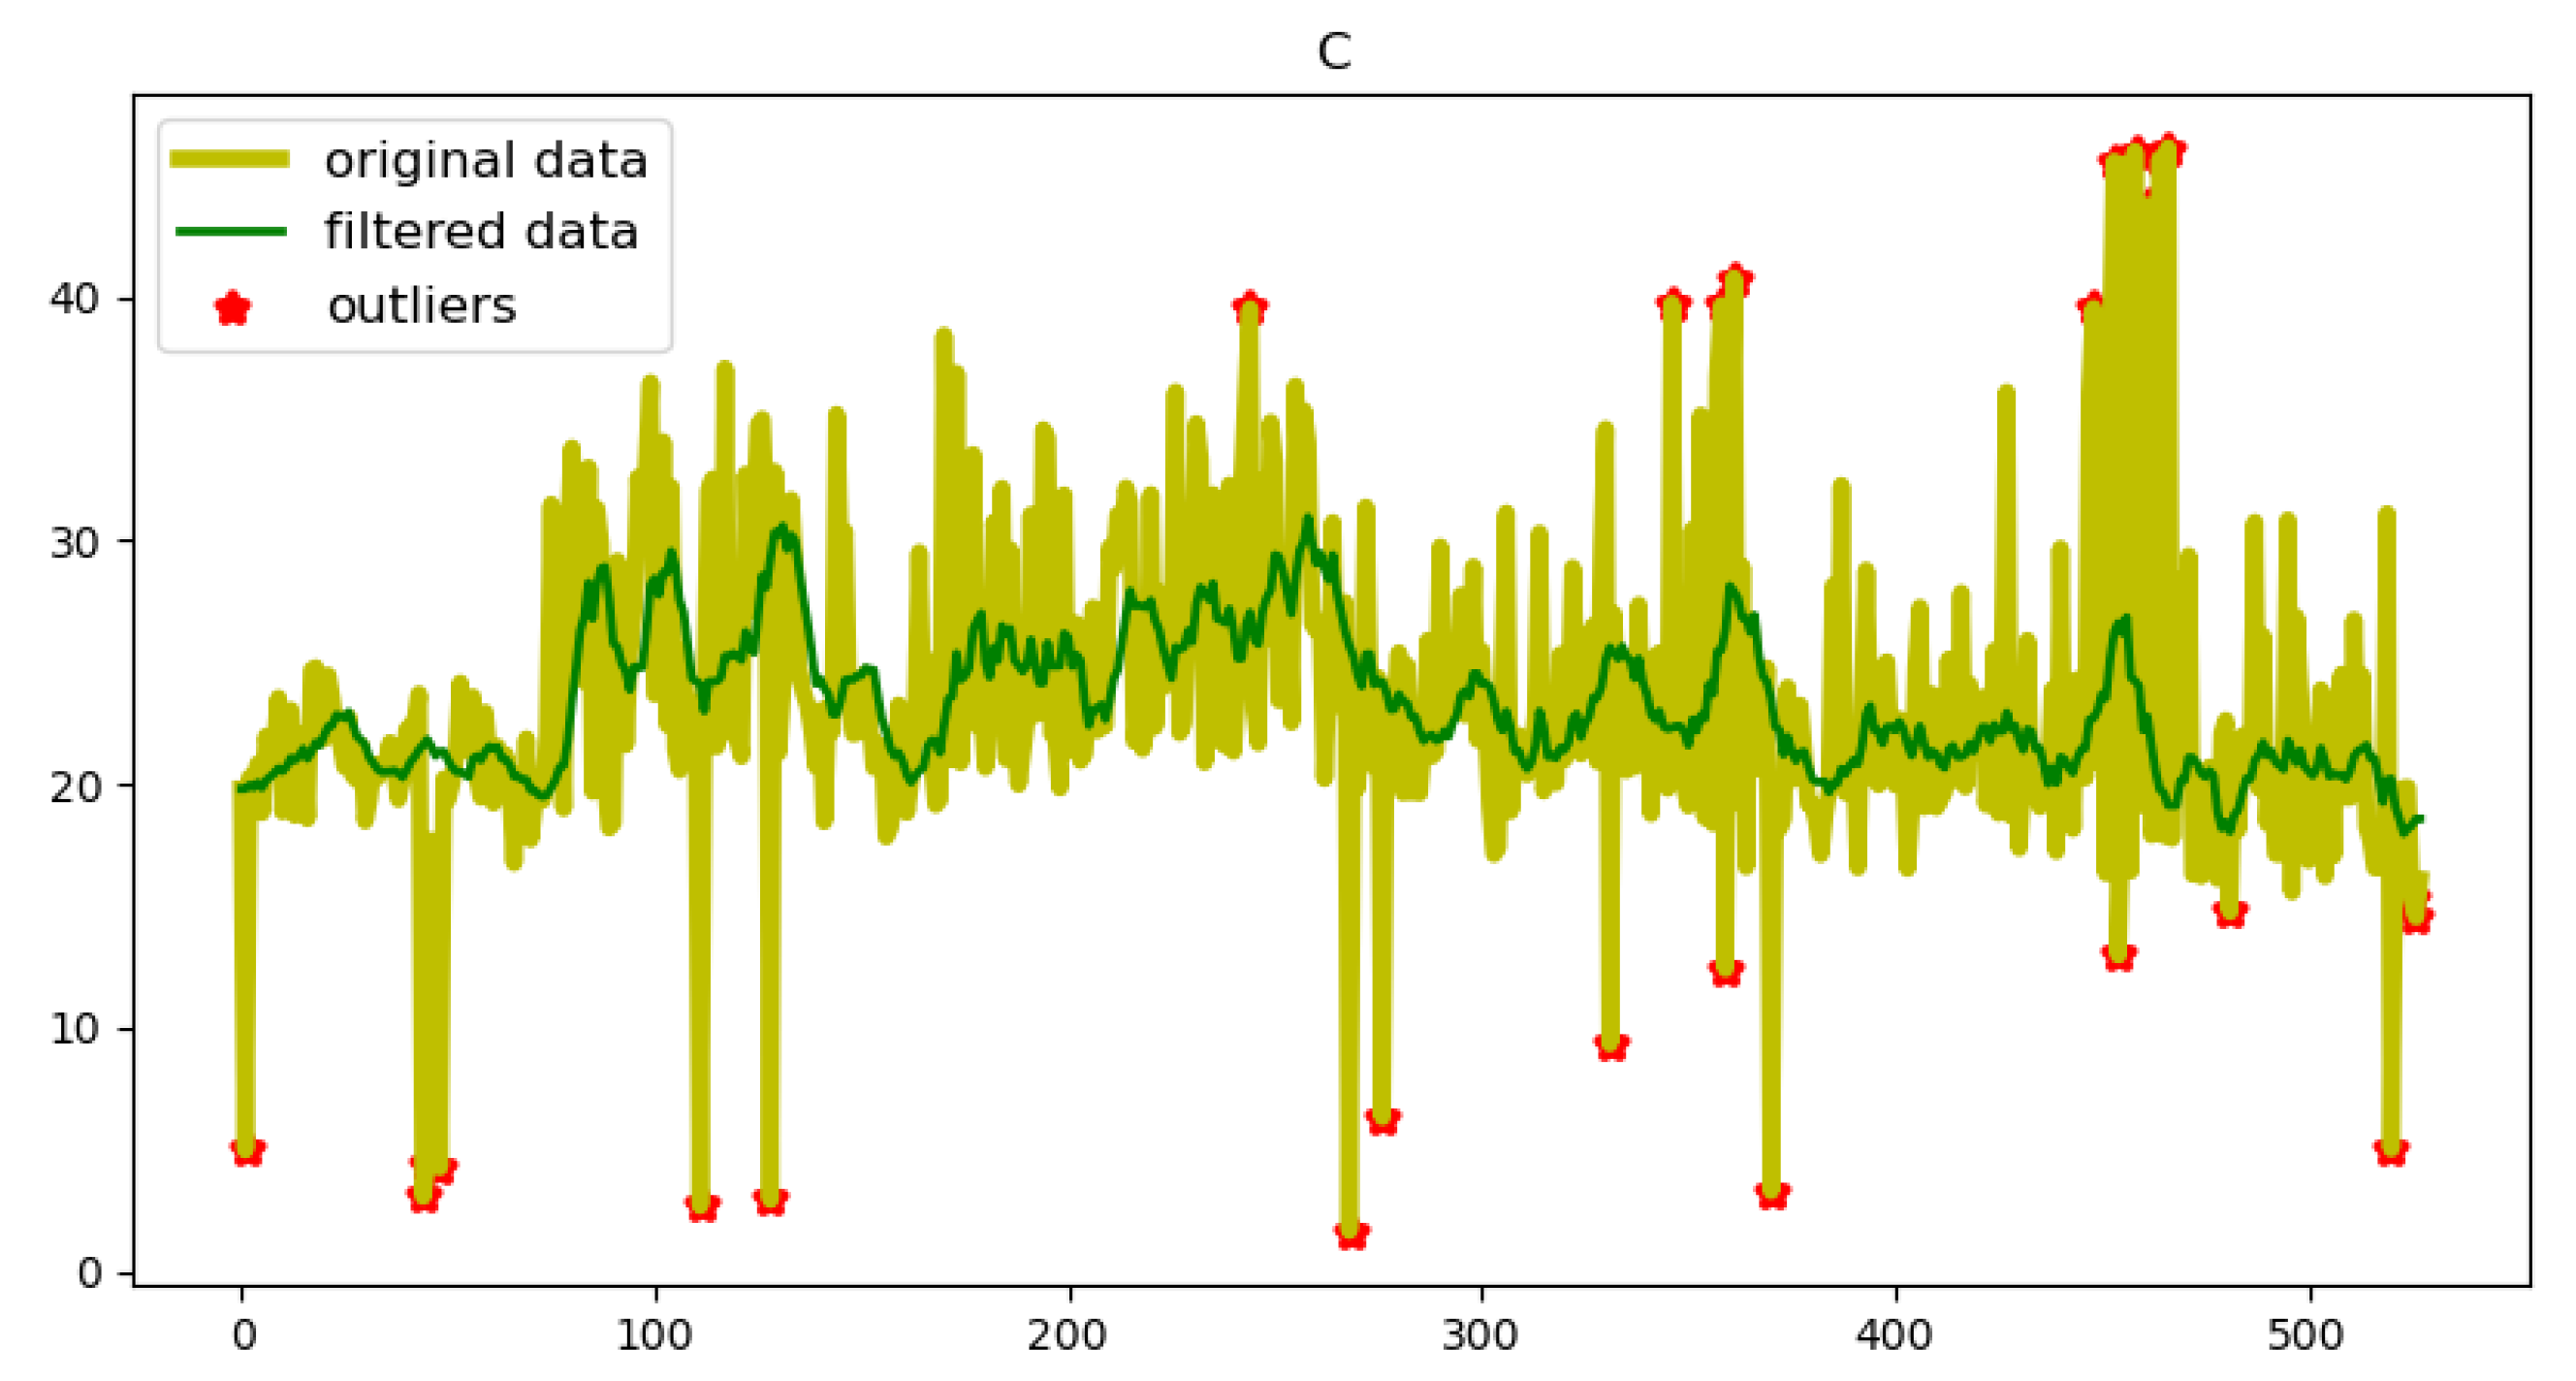
In order to demonstrate the effectiveness of filtering algorithms in data preprocessing, we take the C element in blast furnace secondary ash as an example, as shown in Figure 3. From Figure 3, it can be seen that the filtering algorithm can greatly alleviate the steepness of the data, making it smoother.
In industrial environments, If the raw material proportioning scheme can be used for more than h (h>0) hours, it is considered an excellent scheme, and vice versa. In addition, the sum of the percentage of raw materials (excluding Environmental Ash) must meet the condition in Equation (2), otherwise it is also considered an inferior formula and should be removed.
F M Q + I M Q + O M Q = T M Q
i = 2 6 w i = 100
w F M Q + w I M Q + w O M Q = 100
where F M Q represents the return material quantity; I M Q represents the total quantity of raw materials, exclusive of Environmental Ash; O M Q stands for the Environmental Ash raw material quantity; T M Q indicates the total set material quantity; w i represents the material percentage of x i in I M Q ; w F M Q denotes the material percentage of F M Q in T M Q ; w I M Q indicates the material percentage of I M Q in T M Q , and w O M Q represents the material percentage of O M Q in T M Q .
After data preprocessing, a dataset S e t about [ x 1 , x 2 , x 3 , x 4 , x 5 , x 6 , C , C l , Z n , F e , F e O ] is constructed that includes information on ratio and ingredient content, where, x 1 , x 2 , x 3 , x 4 , x 5 , x 6 are the corresponding proportions of the mixture x i ; C is a row vector, specifically represented as C=[ c 1 , c 2 , c 3 , c 4 , c 5 , c 6 ], c i is the element content of C in the material; C l is a row vector, specifically represented as C l =[ c l 1 , c l 2 , c l 3 , c l 4 , c l 5 , c l 6 ], c l i is the content of C l element in material x i ; Z n is a row vector, specifically represented as Z n = [ z n 1 , z n 2 , z n 3 , z n 4 , z n 5 , z n 6 ], z n i is the element content of Z n in material x i ; i = 1 , 2 , 3 , 4 , 5 , 6 .

3.2. AP Offline Formula Learning

Historical data hides the valuable operational wisdom of engineers. By using the AP clustering algorithm, we can extract empirical knowledge of human formulas from these historical data.
The basic idea of the AP clustering algorithm is to treat the element content corresponding to N historical ratio data as nodes in the network, and then calculate the clustering centers of each sample through the message passing of each edge in the network. During the clustering process, there are two types of messages passing between nodes, namely attractiveness r ( i , k ) and belonging a ( i , k ) . R = [ r ( i , k ) ] N × N is the attractiveness matrix, and A = [ a ( i , k ) ] N × N is the belonging matrix. The AP clustering algorithm continuously updates the attractiveness and membership values of each point through an iterative process until m high-quality cluster centers (Exemplar) are generated, where m N . At the same time, the remaining ratios are assigned to the corresponding clusters, and R and A can be obtained.
The iterative equations for attractiveness and belonging are as follows:
r t + 1 ( i , k ) = s ( i , k ) max j k a t ( i , j ) + r t ( i , j ) , i k s ( i , k ) max j k S ( i , j ) , i = k
a t + 1 ( i , k ) = min 0 , r t + 1 ( k , k ) + j i , k max r t + 1 ( j , k ) , 0 i k j k max r t + 1 ( j , k ) , 0 , j = k
where r ( i , j ) is the degree of attraction, which is used to describe the suitability of the element content of ratio j as the clustering center of the element content of ratio i, a ( i , j ) is is the attribution degree, which is used to describe the appropriate degree of selecting the element content of ratio j as its clustering center of the element content of ratio i, s ( i , k ) is the similarity, which represents the ability of the element content of ratio k to serve as the clustering center for the element content of ratio i.
Generally, negative Euclidean distance is used, so the larger the s ( i , k ) , the closer the two points are. In order to avoid oscillations during the iteration process, a soft update strategy is adopted, and the update equations are as follows:
r t + 1 ( i , k ) = λ * r t ( i , k ) + ( 1 λ ) * r t + 1 ( i , k ) a t + 1 ( i , k ) = λ * a t ( i , k ) + ( 1 λ ) * a t + 1 ( i , k )
where λ is the parameter damping factor, λ ( 0 , 1 ) , and the damping factor is generally taken as 0.5.
After the AP offline formula learning is completed, the formula data can be divided into n clusters based on the mapping of ingredient content to the ratio data. The centers of the clusters are denoted as ( K 1 , K 2 , K 3 , , K n ) , where n [ 1 , N ] . The system will record the key information of these clusters, including cluster centers, similarity matrices, and attraction matrices. These pieces of information form the foundation of the machine learning formula library, providing basis for optimizing and adjusting future formulas.

3.3. AP Online Formula Updating

In practical rotary hearth furnace systems, data is constantly updated. To tackle these issues related to data updates, there are primarily two operations: re-clustering and incremental clustering. During the continuous operation of the rotary hearth furnace system, the data is increasing, so the amount of data is huge. The cost of re-clustering is huge, which will lead to time-consuming and inefficient calculation. On the contrary, incremental clustering can solve the above problems.
In this study, the incremental AP clustering [23] is realized by using the affinity propagation clustering combined with the nearest neighbor technology. The nearest neighbor is to establish a connection between the newly added formula data and the existing clustered data sets.
Nearest neighbor techniques mean that the informational content of newly added formula data is configured based on its closest formulas. The strategy is based on the following consideration: if two formulas have similar compositions, their ratios are similar, implying that the data formulas should belong to the same class with identical information. If the newly added formula data does not resemble any of the known clustered groups, a new clustering group will be created.
Given an N t 1 × N t 1 dimensional dataset, where the similarity matrix is S t 1 , and the corresponding matrices for membership and attractiveness are R t 1 and A t 1 respectively, the membership and attractiveness values for the newly added formula are expanded according to Equation (7).
r t ( i , j ) = r t 1 ( i , j ) , i N t 1 , j N t 1 r t 1 ( i , j ) , i > N t 1 , j N t 1 r t 1 ( i , j ) , i N t 1 , j > N t 1 0 , i > N t 1 , j > N t 1
The above N t 1 represents the initial number of formulas, where i = arg max i , i M n s i , i , and similar memberships are expanded according to Equation (8).
a t ( i , j ) = a t 1 ( i , j ) , i N t 1 , j N t 1 a t 1 ( i , j ) , i > N t 1 , j N t 1 a t 1 ( i , j ) , i N t 1 , j > N t 1 0 , i > N t 1 , j > N t 1
Using the AP online formula learning, the element contents in the current formula data and the historical formula data will be clustered to form n 1 clusters. The centers of the clusters are then re-recorded as ( c 1 , c 2 , c 3 , , c n 1   ) , where n 1 [ 1 , N ] , The system will store information about these clusters, including the cluster center, similarity matrix, and attraction matrix, to construct a machine learning formula library. In machine learning formula library, the recommended formula will be the one corresponding to the cluster center of the current formula data cluster.
To facilitate readers’ better understanding, Figure 4 shows the process of online AP clustering, where each small circle in the figure represents a formula data point; the gray lines identify the formula data belonging to the same cluster, while the solid circles represent the cluster center of the cluster. The leftmost side of Figure 4 shows several clusters formed after offline learning using the AP clustering algorithm. The middle figure shows the latest formula data collected at time t, represented by red circles. If these new data are similar to a certain cluster, they will be classified into this cluster, and the red solid circle represents the newly formed cluster center. If the current formula is not a new cluster center, the formula corresponding to the cluster center of its cluster will be recommended; if the current formula is exactly the cluster center, the formula itself is recommended. The rightmost figure shows the updated results after the online learning process of the AP clustering algorithm at time t + T . It is observed that if the newly introduced data has a large difference from the existing data, a new cluster will be formed. At this time, the formula corresponding to the cluster center of the newly introduced data will be recommended.

3.4. Expert Experience-Based Formula Fine Adjustment

Through cluster analysis, a machine learning formula library can be constructed. The recommended formula is based on the formula represented by the cluster center of the current formula cluster. This formula usually adapts well to the operating habits and actual production conditions of workers. However, it may not fully meet the performance requirements of rotary hearth furnace. To ensure that the formula meets all performance requirements, it is necessary to introduce a formula fine adjustment module based on expert experience. This module meticulously optimizes and adjusts the recommended formula to meet performance requirements. Firstly, as shown in Table 2, we provide the following parameters.
Due to the lack of separate assay values for O M Q and returned materials, we use the average value of the total raw material quantity " I M Q " (excluding Environmental Ash) of its composition for calculation.
The dry basis composition of each element in I M Q is calculated according to the following Equations (9) and (10):
C I M Q = i = 2 6 w C i * w i 100 C l I M Q = i = 2 6 w C l i * w i 100 Z n I M Q = i = 2 6 w Z n i * w i 100 F e I M Q = i = 2 6 w F e i * w i 100
O F e O I M Q = i = 2 6 w ( ( F e O ) i ) * w i * 16 72 100 O F e 2 O 3 I M Q = i = 2 6 w ( F e i ) w ( ( F e O ) i ) * 56 72 ) * w i * 48 112 100 O Z n I M Q = i = 2 6 w ( Z n i ) * w i * 16 65 100 O I M Q = O ( F e O ) I M Q + O F e 2 O 3 I M Q + O Z n I M Q
where E 1 I M Q represents the mass percentage of E 1 in I M Q , E 4 in F M Q , E 1 =(C, C l , Z n , F e , F e O , F e 2 O 3 , O), w i represents the mass percentage of material x i . w ( E 2 i ) represents the mass percentage of E 2 in material x i , where E 2 = ( C , C l , Z n , F e , F e O ) . O F e O I M Q represents the mass percentage of oxygen in F e O I M Q , F e 2 O 3 I M Q denotes F e 2 O 3 in I M Q and O F e 2 O 3 I M Q represents the mass percentage of oxygen in F e 2 O 3 I M Q .
The dry basis composition of each element in O M Q is calculated according to the following Equation (11):
E 3 O M Q = 100 * E 1 I M Q i = 2 6 w i O O M Q = O ( F e O ) O M Q + O F e 2 O 3 O M Q + O Z n O M Q
where E 3 I M Q represents the mass percentage of E 3 in I M Q , E 3 in F M Q , E 3 =(C, C l , Z n , F e , F e O , F e 2 O 3 , O), O F e O O M Q represents the mass percentage of oxygen in F e O O M Q . F e 2 O 3 O M Q represents F e 2 O 3 in O M Q , and O F e 2 O 3 O M Q represents the mass percentage of oxygen in F e 2 O 3 O M Q .
The dry basis components of each element in returned material F M Q are calculated as shown in the following Equation (12):
E 4 F M Q = 100 * E 1 I M Q i = 2 6 w i O F M Q = O F e O F M Q + O F e 2 O 3 F M Q + O Z n F M Q
where E 4 F M Q represents the mass percentage of E 4 in F M Q , E 4 =(C, C l , Z n , F e , F e O , F e 2 O 3 , O), O F e O F M Q represents the mass percentage of oxygen in F e O F M Q . F e 2 O 3 F M Q represents F e 2 O 3 in F M Q , and O F e 2 O 3 F M Q represents the mass percentage of oxygen in F e 2 O 3 F M Q .
Combining Equations (9)–(12), we obtain the contents of C, C l , Z n , and O in the overall mixture:
E 5 s u m = M t = I M Q , I M Q , F M Q ( E 5 M t * W M t 100 * 100 ) C / O s u m = C s u m O s u m
where E 5 s u m denotes the content of elements C, C l , Z n , and O in the overall mixture, represented as E 5 = ( C , C l , Z n , O ) . C s u m is the mass percentage of total dry basis Carbon, O s u m is the mass percentage of total dry basis oxygen, and C / O s u m is the total C / O ratio.
However, due to practical on-site operations and product manufacturing requirements, certain elemental contents need to meet specific upper and lower limits:
C ̲ < = C s u m < = C ¯ Z n s u m < = Z n ¯ C l s u m < = C l ¯ C / O s u m < = C / O ¯
In the equation, C ̲ , C ¯ represent the lower and upper bounds of the mass percentage of Carbon respectively, Z n ¯ is the upper bound of the mass percentage of Zinc, C l ¯ is the upper bound of the mass percentage of Chlorine, and C / O ¯ is the upper bound of the mass percentage of C / O ratio.
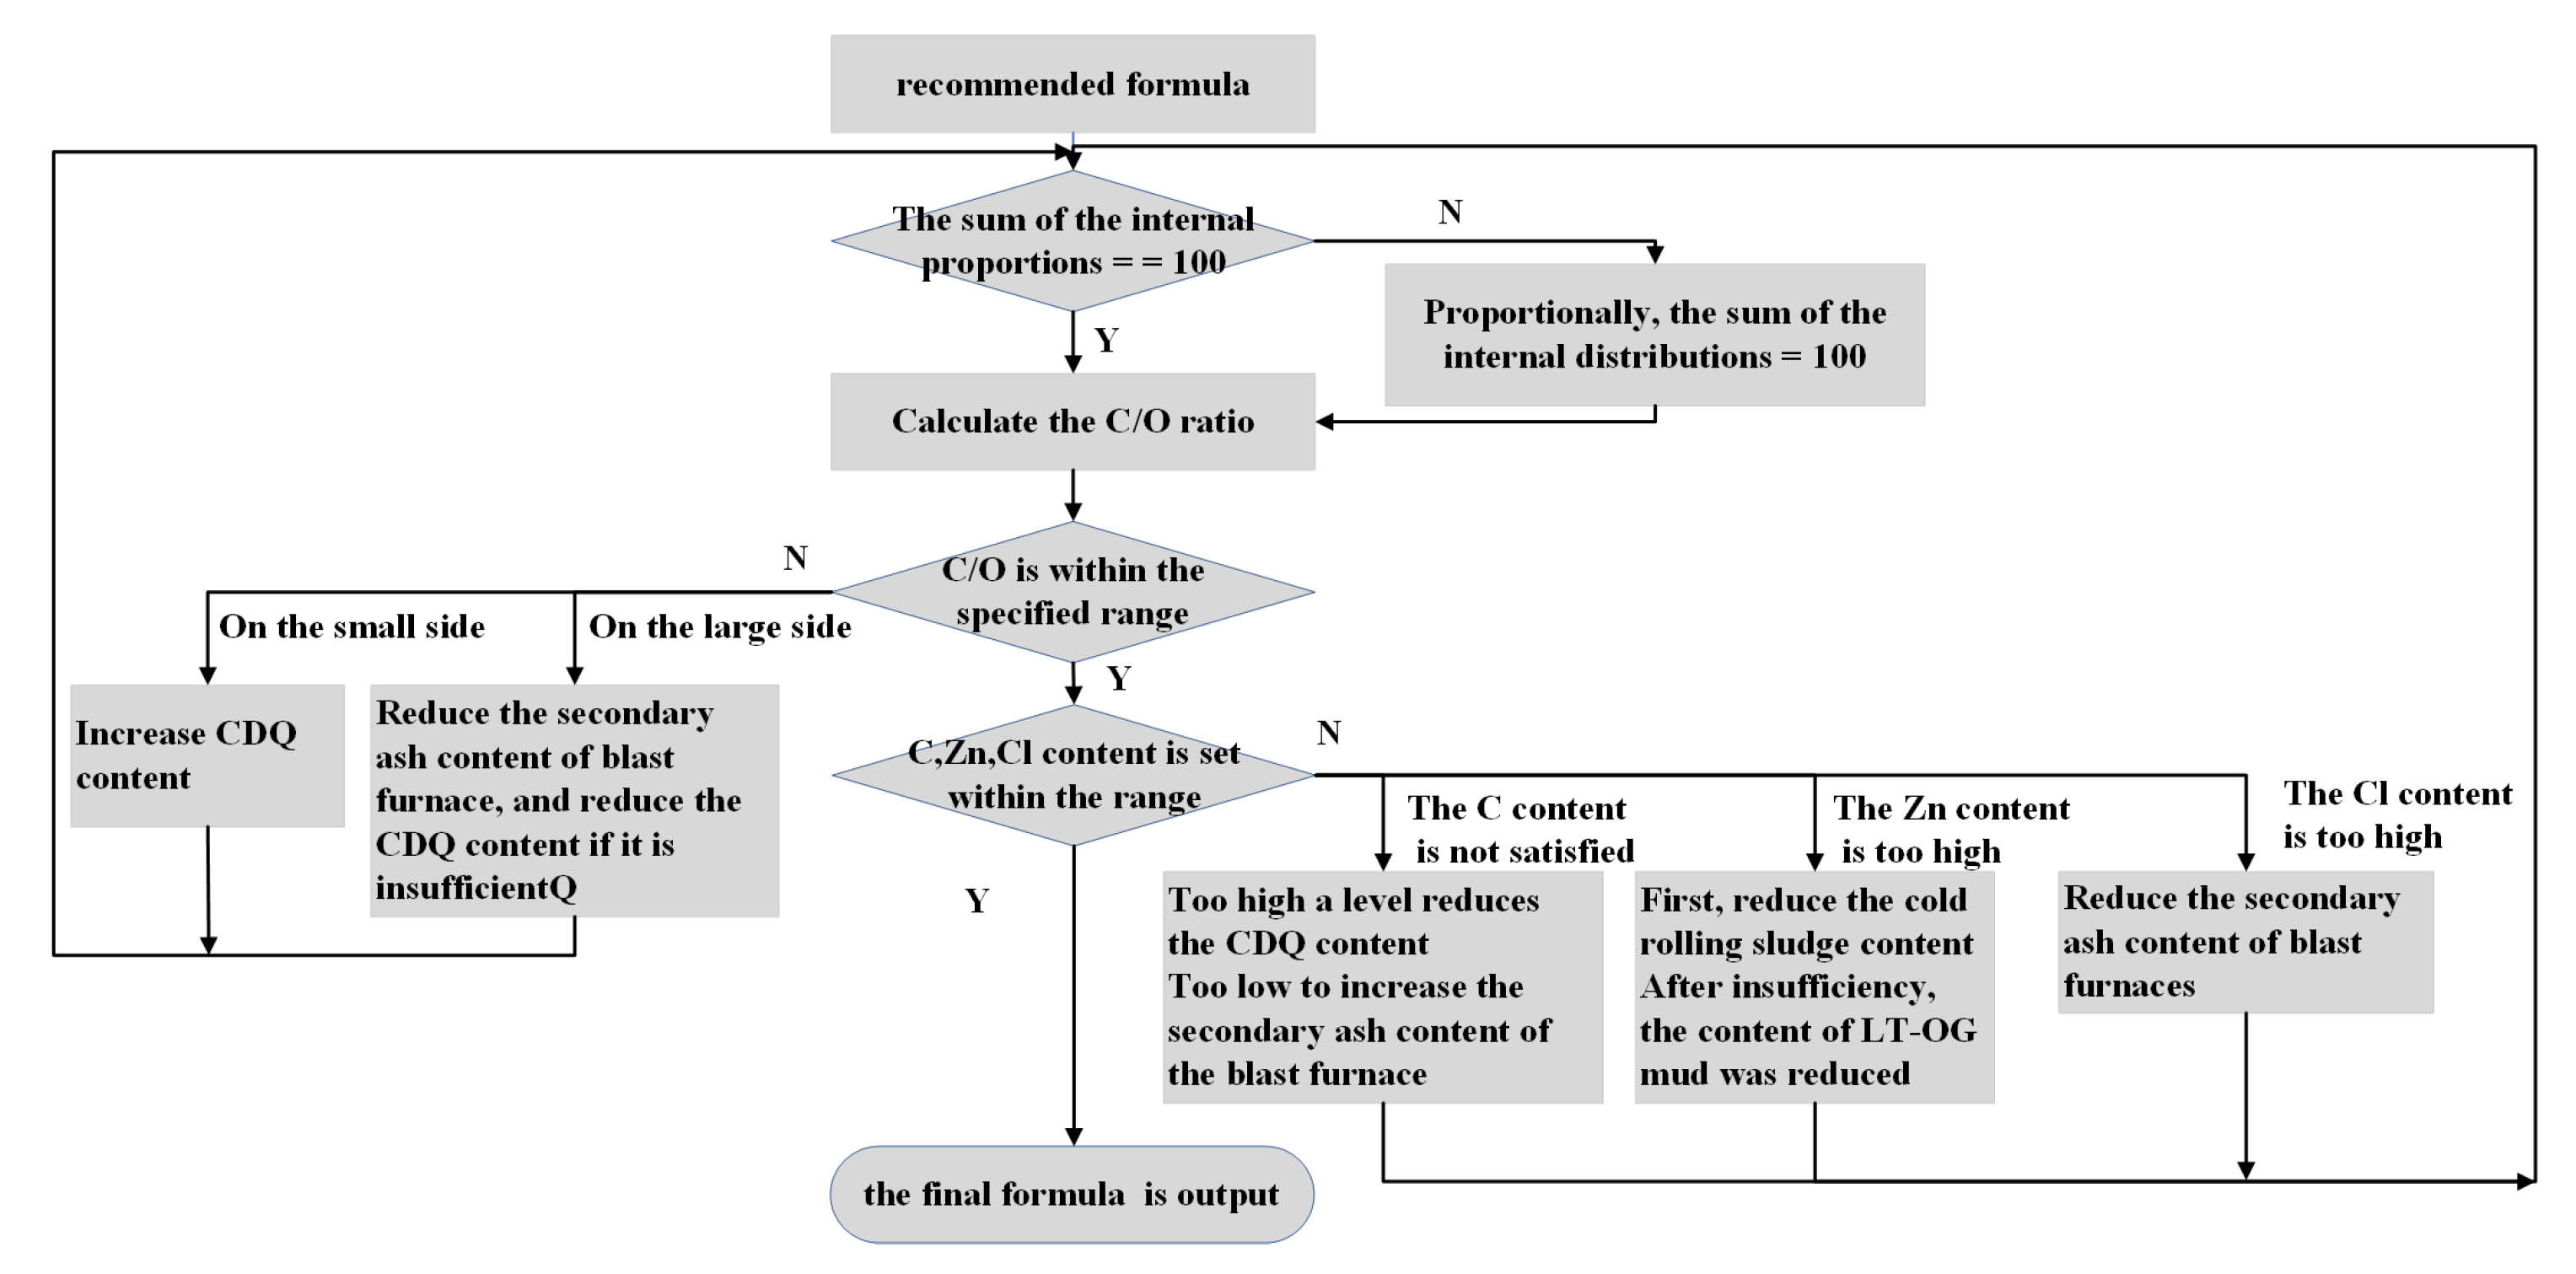
According to the experience of experts, the Carbon content of CDQ is the highest, usually reaching 84.4%, followed by the secondary ash of blast furnace, the content of "C" is generally 20%, and the content of " C l " is 5%. Therefore, in practice, the proportion of these two materials is mainly adjusted to meet the production constraints. In order to meet the requirements of actual production operation, the proportion of materials changed each time is ϵ . In this study, we choose ϵ as 1%. The fine adjustment process is illustrated in Figure 5.
4. Applications

This section mainly introduces the intelligent batching system and its practical application in a steel plant of China. The environmental protection department of the steel plant uses trial and error method to make the production plan of raw material ratio of rotary hearth furnace. There are two problems: the first problem is that different methods need to be formulated for different materials, and the thinking process is complex. The second problem is time-consuming. The intelligent batching system solves these two problems.

4.1. System Development Technology

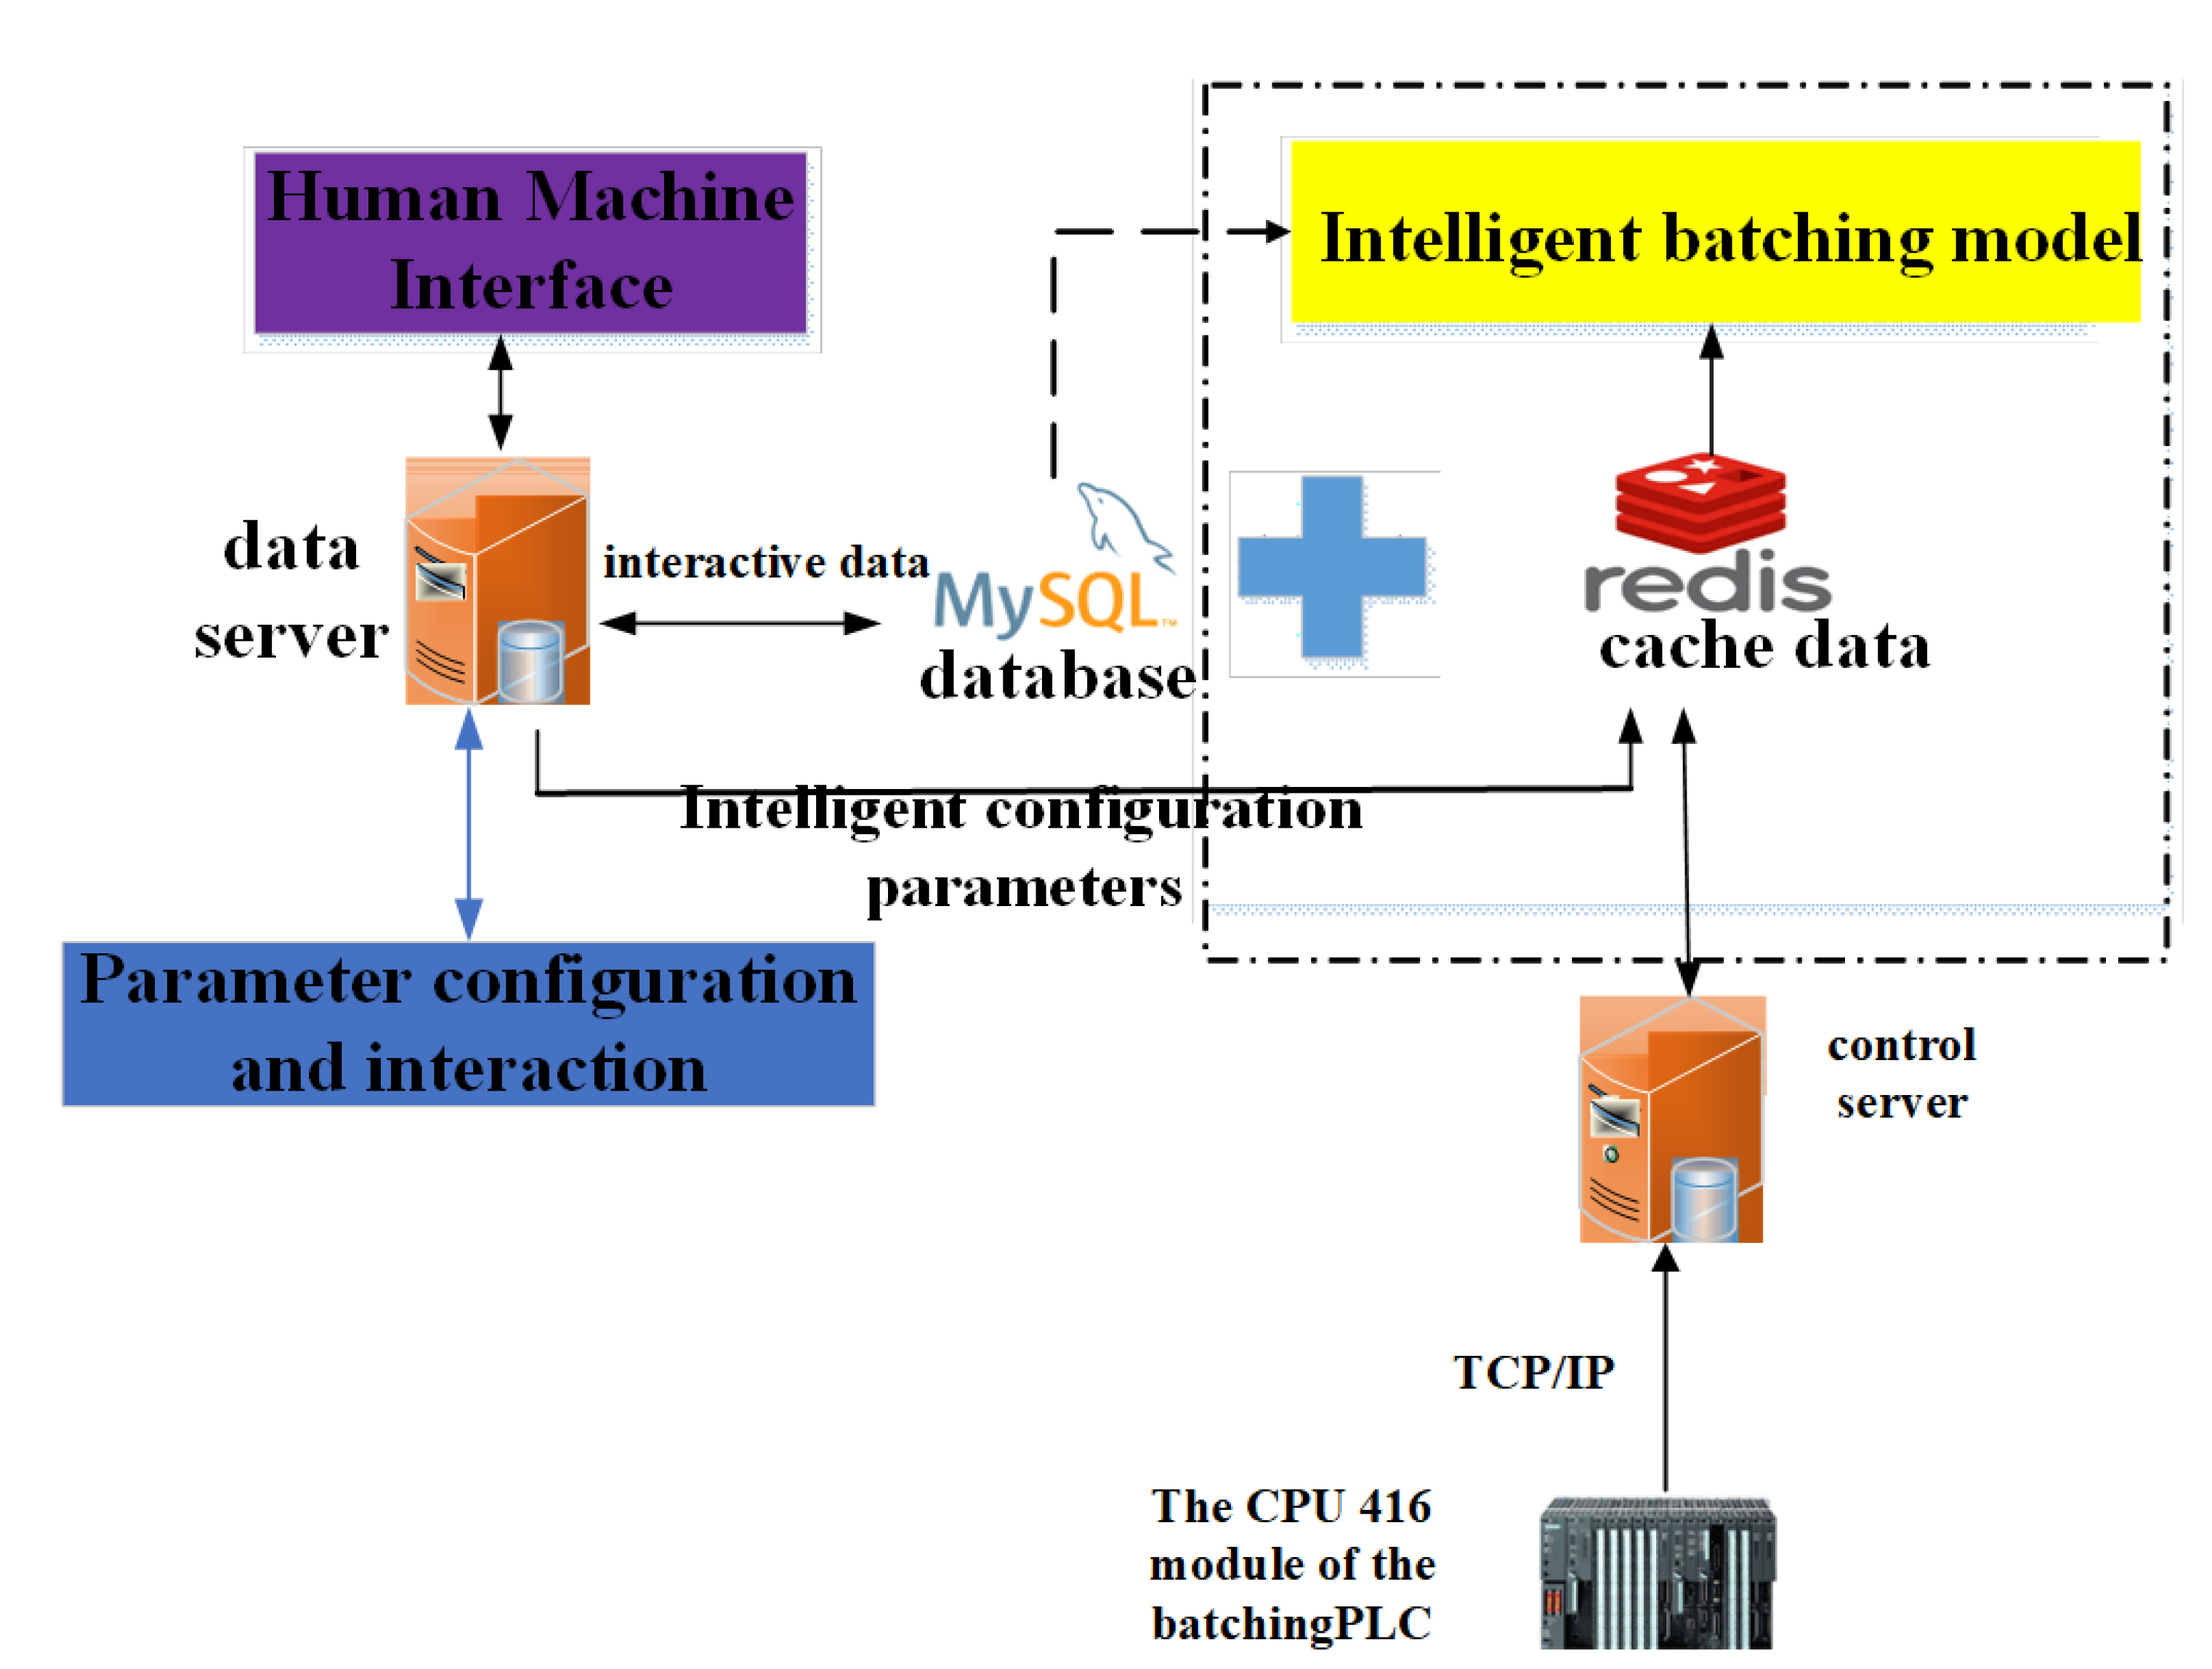
The overall development framework of the intelligent batching system is illustrated in the Figure 6. The intelligent batching system is composed of a data server, control server, Human Machine Interface, intelligent batching model, and database. The system employs C# for web development, MATLAB for the core algorithmic logic and optimization models, and SQL Server for backend database management. It also utilizes PLC for effective on-site communication, as illustrated in Figure 6.

4.2. Implementation Method

First, the intelligent batching system retrieves raw data from the database and preprocesses it to create a new data table. According to different kinds of raw material combinations, the system uses AP offline clustering algorithm for clustering analysis, and determines the corresponding clustering center of this kind of raw material combination. At the same time, the key attraction matrix and similarity matrix are retained to form a machine learning formula library, which provides the basis for the optimization and adjustment of subsequent formulas. Next, the system reads the current formula data and determines which group it belongs to according to the combination of raw material types. Then, according to the content of elements and compounds (C, C l , Z n , F e , F e O ) in the current raw materials, the machine learning formula library recommends the ratio according to the clustering center. This recommended ratio may not fully meet the product production standards, so it is also necessary to make minor adjustments to the recommended ratio through the ratio fine-tuning module based on expert experience, so as to form the final intelligent ratio and output the ratio. The online AP clustering algorithm is implemented to read the newly generated formula data, update the clustering center, attraction matrix and similarity matrix, and then update the machine learning formula library.

4.3. Human Machine Interface

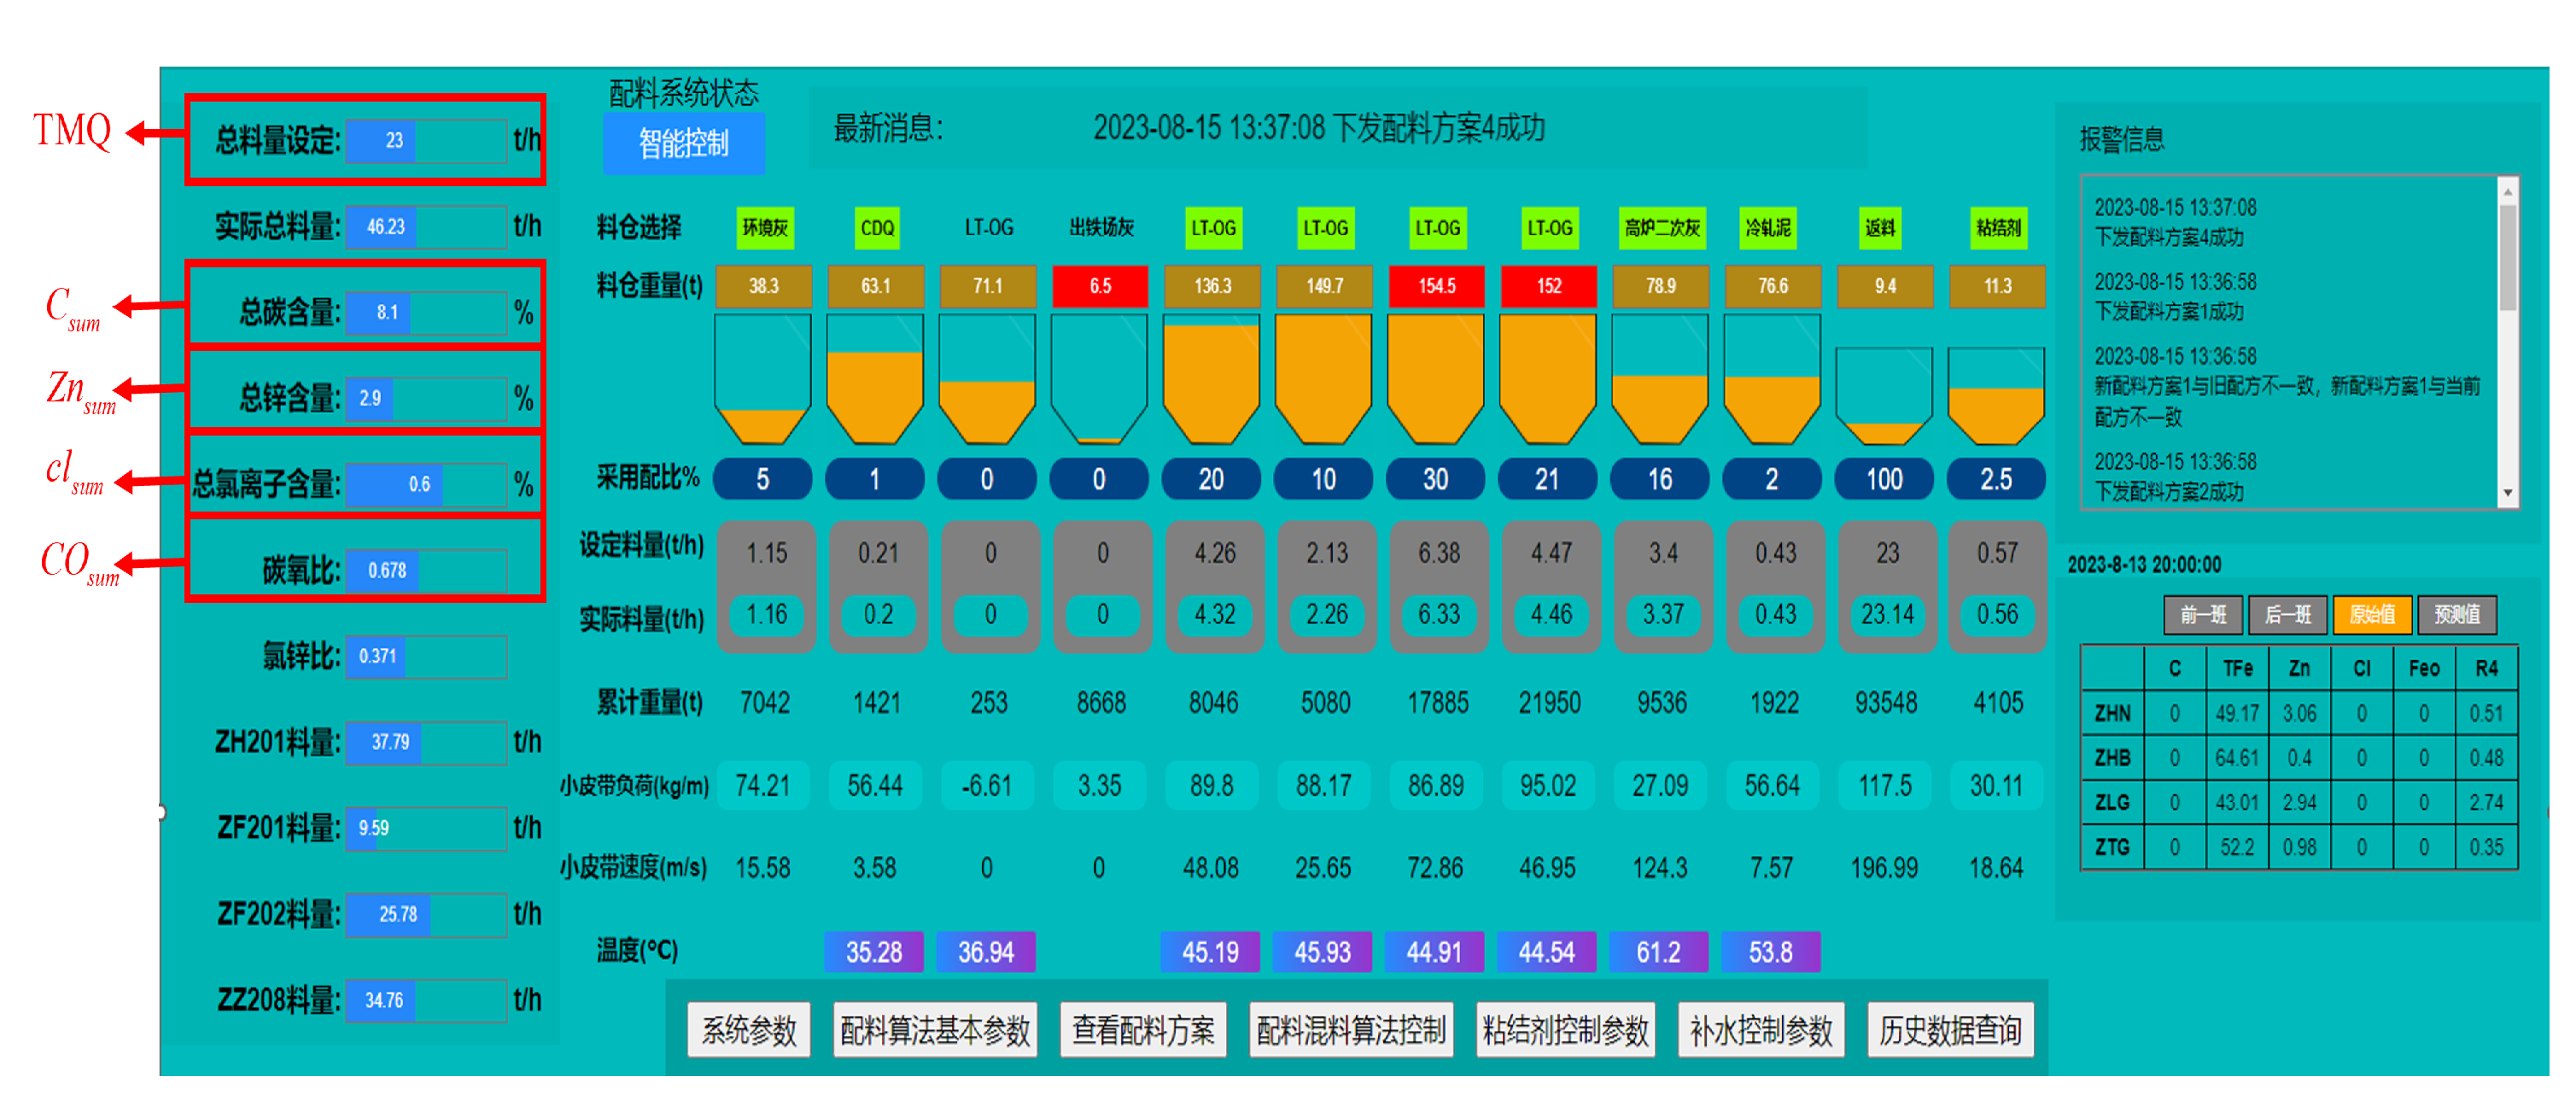
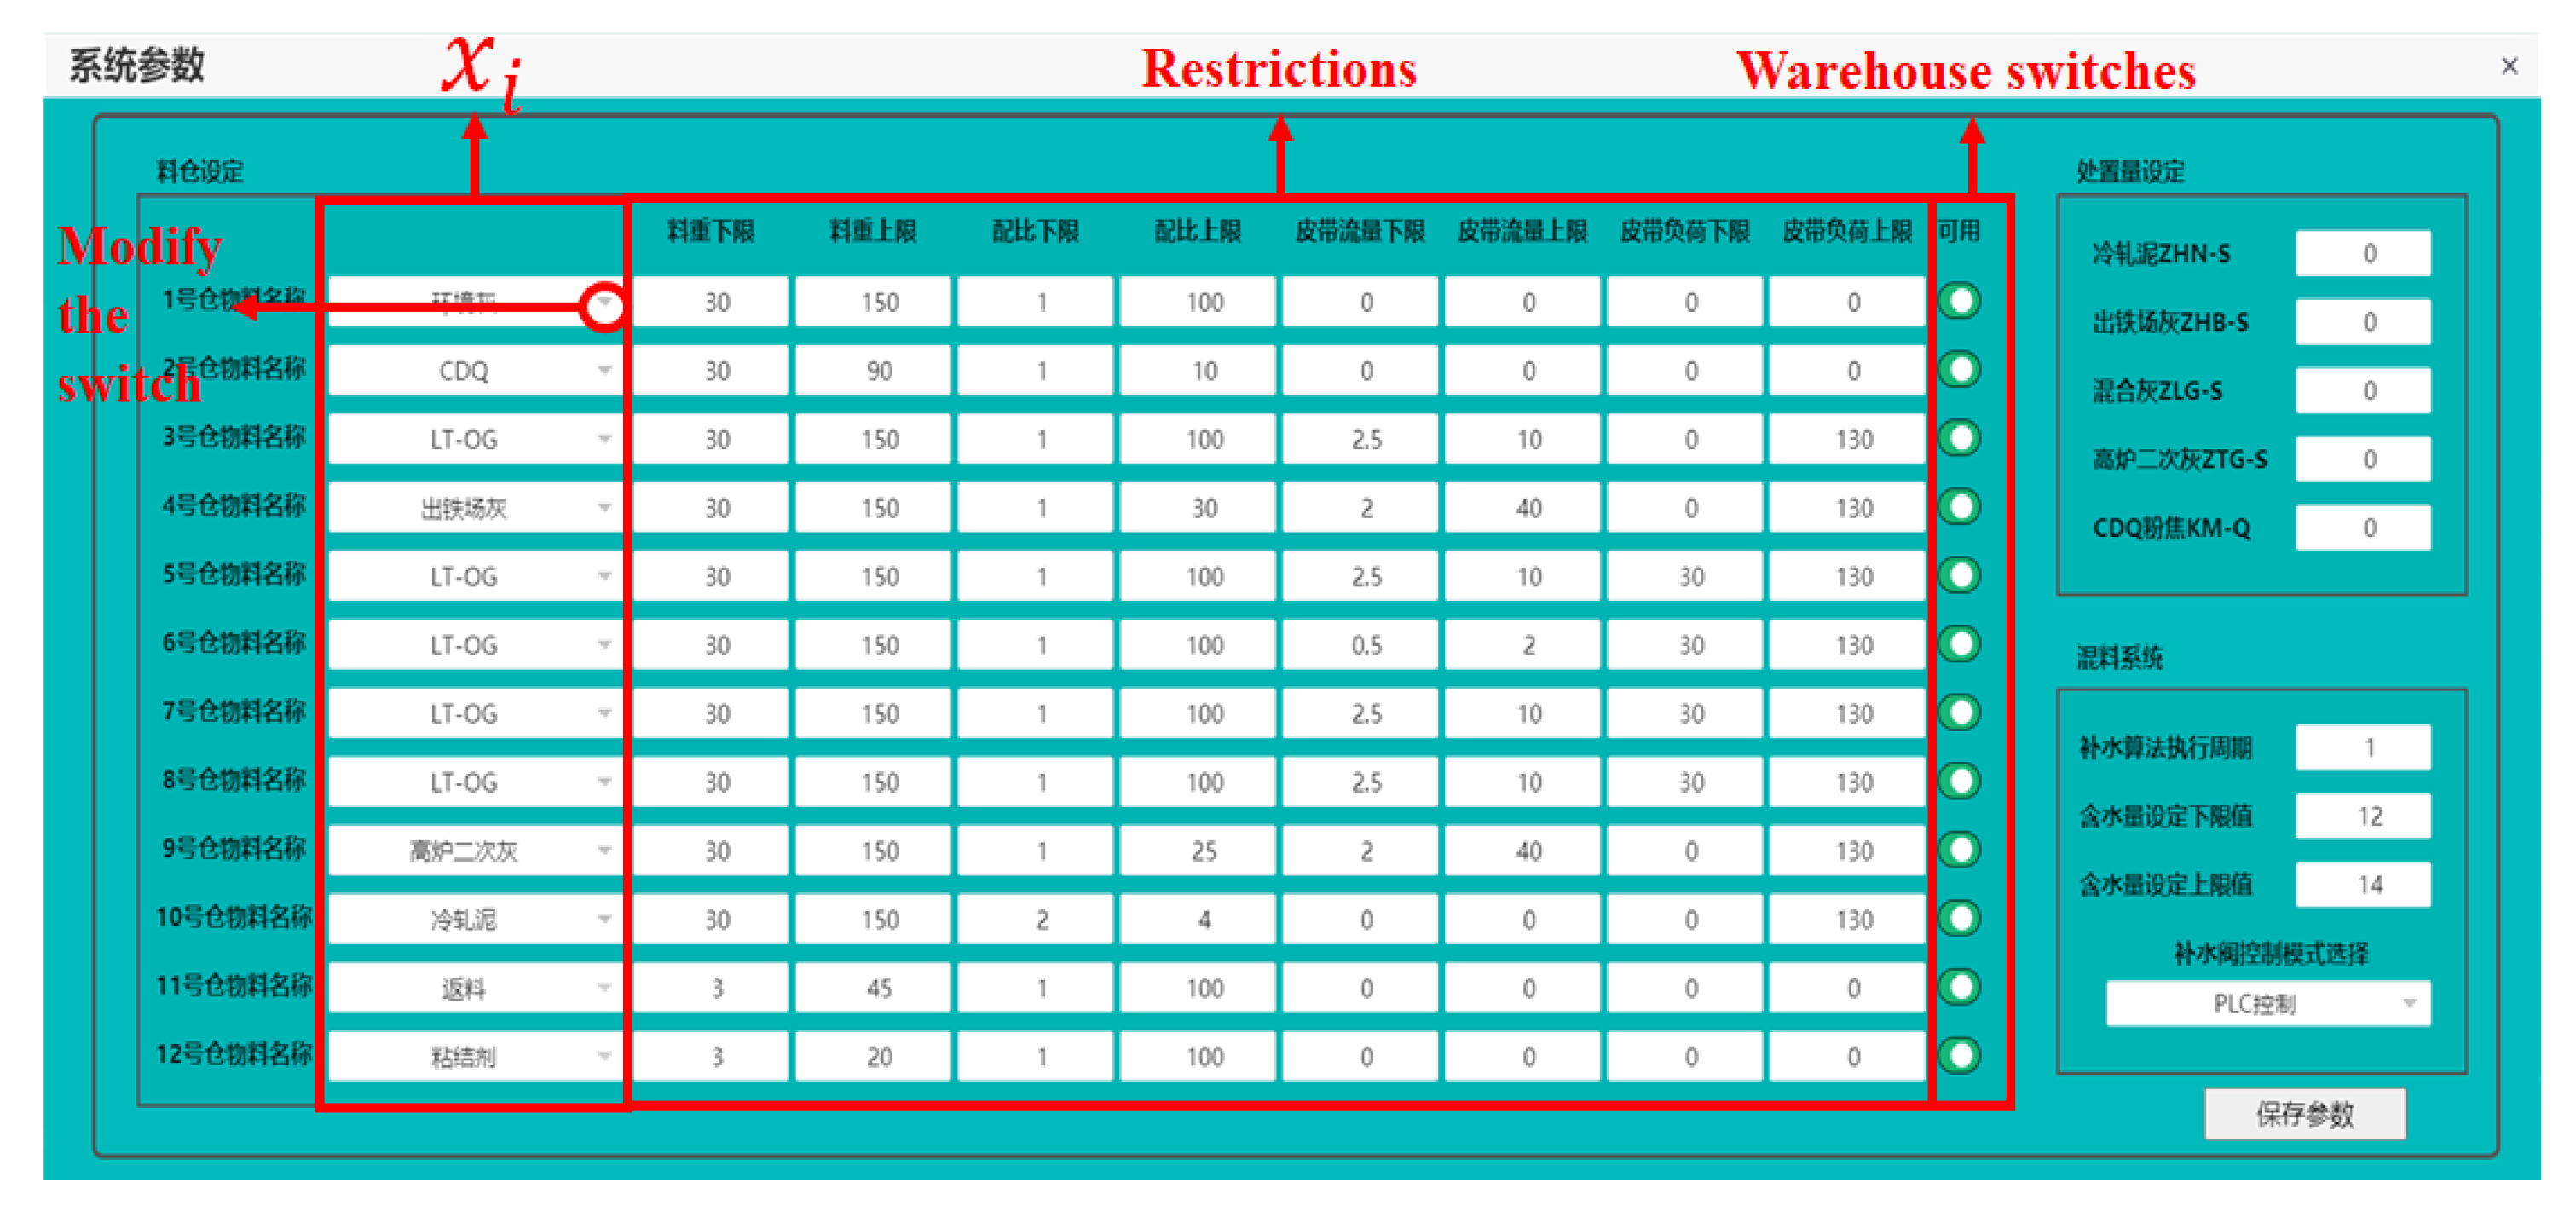
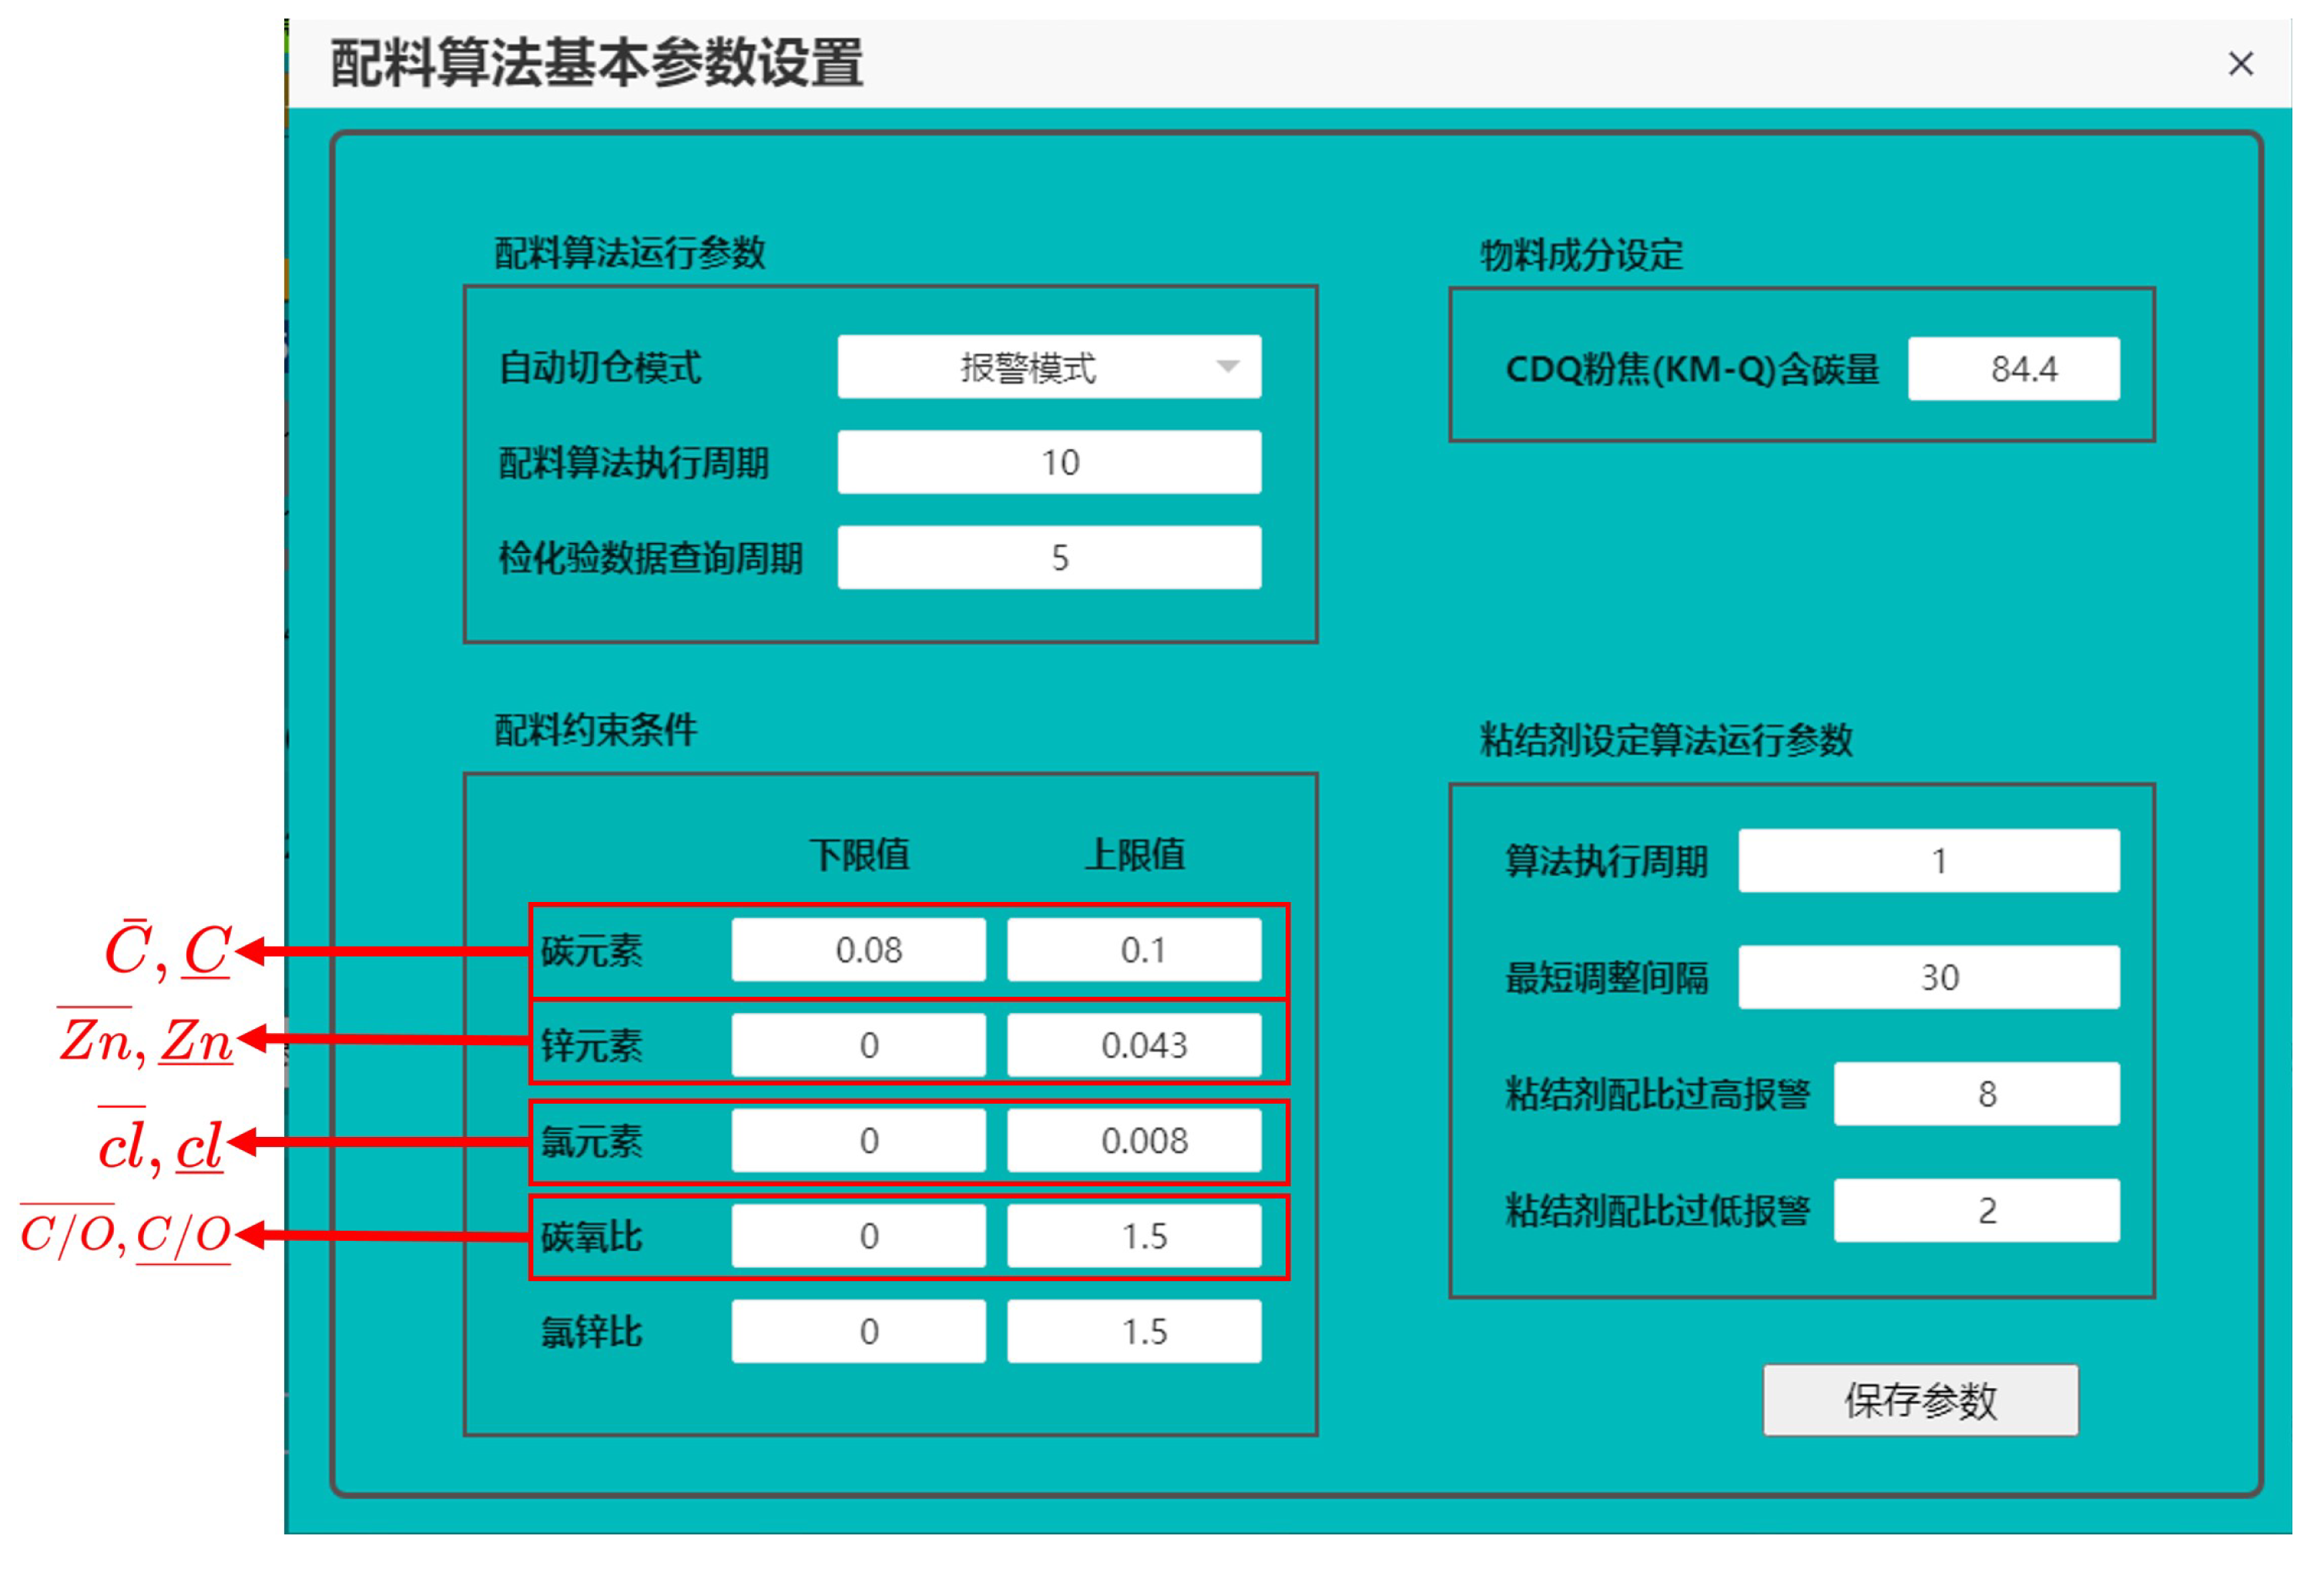
The system provides a friendly Human Machine Interface. After logging in with a password, users can access the interface for the entire batching process directly, and can adjust system parameters, such as the type of ash in the batching warehouse, the weight limits of materials, etc. The upper and lower limits for elements C, Z n , and C l can be configured. The main interface of the intelligent batching system of rotary hearth furnace in a steel plant of China is depicted in Figure 7. Clicking on "System Parameters" takes users to the system’s parameter settings. The system parameter interface is illustrated in Figure 8. The types of raw materials are customizable, and the weight limits for each warehouse, and the ratio limits for each material can be adjusted. The availability of each warehouse can be configured using a button. Within the main interface of the batching system shown in Figure 8, one can also individually view the fundamental parameters of the batching algorithm, as shown in Figure 9. Settings for the batching constraints, the algorithm’s automatic warehouses switching mode, and the periodic retrieval of inspection and testing data are configurable.

4.4. Analysis and Comparison of Batching Results

Taking the rotary hearth furnace in a steel plant of China as an example, it has 12 warehouses: the first warehouse for Environmental Ash, the second warehouse for CDQ, the third, fifth, sixth, seventh, and eighth warehouses for Mixed Ash, the fourth warehouse for Ash from the Iron casting plant, the ninth warehouse for Secondary Ash of Blast Furnace, the tenth warehouse for Cold-rolled Mud, the eleventh warehouse for the FMQ (controlled by workers, no need to consider), the twelfth warehouse for binder, which is not a raw material, so it does not need to be considered. To align with actual production needs, the parameter settings are as follows: h = 1.5 , C ¯ = 10 , C ̲ = 8 , Z n ¯ = 4.3 , Z n ̲ = 0 , C l ¯ = 0.8 , C l ̲ = 0 and C / O ¯ = 1.5 . The O M Q ratio( R a t i o O M Q ) is given based on expert experience from the plant as in (15):
Ratio OMQ = 10 40 < TMQ 100 8 20 < TMQ 30 5 TMQ 20
Later, the on-site experimental data will be analyzed and discussed for two cases. Case 1: when the formula at the present moment meets the production requirements; Case 2: when the formula at the present moment does not meet the production requirements. The intelligent batching system adopts different processing strategies for these two situations.

Case 1: When the formula at the present moment meets the production requirements

  • At the previous moment, the formula became the cluster center.
As shown in Table 3, the table details the formula labeled as "Ratio One" from July 1, 2023 at 13:11:23 with TMQ=18, which lists the elemental content of the current formula and its ingredients. Upon activating the intelligent batching system, users can access recommended formulas, as illustrated in Scenario 1 of Table 6 and Table 7. If the current formula becomes a clustering center after AP online clustering analysis and meets production standards, the intelligent batching system will recommend the use of the current formula.
  • At the previous moment, the formula didn’t become the cluster center.
As shown in Table 4, the formula labeled as "Ratio Two" from 2023-07-02 09:21:42 has a TMQ of 18. The table details the current formula and the elemental content of each ingredient. By activating the intelligent batching system, users can access formulas recommended by the system. The results are presented in Scenario 2 of Table 6 and Table 7. If the current formula meets production standards but does not become the center of the cluster after AP online clustering analysis, the system will recommend the formula corresponding to the cluster center. After adjustments made by the formula fine-tuning module based on expert experience, the intelligent batching system ultimately suggests the finely adjusted formula.

Case 2: When the formula at the present moment does not meet the production requirements.

As shown in Table 5, the table includes a formula labeled as "Ratio Three" from 2023-07-10 18:23:12, where TMQ=18. The table details the current formula and the elemental content of each ingredient. By activating the intelligent batching system, users can access recommended formulas, as shown in Case 2 of Table 6 and Table 7. The analysis shows that if the current formula is online clustered with the machine learning formula library by online AP clustering algorithm, the cluster center of this formula is recommended. Furthermore, with expert experience-based fine-tuning, the recommended formula generated by the intelligent ingredient system ensures that all elemental contents of mixed materials meet production performance.
Table 4. At the previous moment, the formula didn’t become the cluster center. (Case 1: Scenario 2).
Warehouse number Ratio Two C Cl Zn Fe FeO
1 5 8.6761 0.1769 3.2642 39.9253 31.9659
2 5 84.4 0 0 0 0
3 0 0 0 0 0 0
4 0 5.8133 0.016 0.1338 63.9333 11.8774
5 29 3.7800 0.2000 3.6903 45.1367 36.1384
6 0 3.7800 0.2000 3.6903 45.1367 36.1384
7 28 3.7800 0.2000 3.6903 45.1367 36.1384
8 28 3.7800 0.2000 3.6903 45.1367 36.1384
9 12 19.435 5.2200 3.7277 41.5333 3.7069
10 0 3.4295 0.3200 14.1331 38.7285 13.3310
11 100 8.6761 0.1769 3.2642 39.9253 31.9659
12 3.5 0 0 0 0 0
Table 5. When the formula at the present moment does not meet the production requirements. (Case 2).
Warehouse number Ratio Three C Cl Zn Fe FeO
1 5 11.10011508 0.8557 2.7473 41.8985 21.1786
2 3 84.4 0 0 0 0
3 0 0 0 0 0 0
4 25 5.04181 0.016 0.1281 64.2987 12.4034
5 24 8.49444 0.2 4.35355 42.4917 33.2209
6 0 8.49444 0.2 4.35355 42.4917 33.2209
7 0 8.49444 0.2 4.35355 42.4917 33.2209
8 33 8.49444 0.2 4.35355 42.4917 33.2209
9 15 15.9483 5.22 2.30592 44.4709 3.87191
10 0 3.31824 0.32 14.5748 38.7635 14.1481
11 100 11.1001 0.8557 2.7473 41.8985 21.1786
12 3 0 0 0 0 0
Table 6. Formula comparison. WN represents Warehouse number, H represents Human Formula, and I represents Intelligent Formula.
WN Case1 Case2
Scenario 1 Scenario 2
H I H I H I
1 5 5 5 5 5 5
2 6 6 5 5 3 1
3 0 0 0 0 0 0
4 0 0 0 0 25 26
5 32 32 29 27 24 25
6 0 0 0 0 0 0
7 31 31 28 28 0 0
8 31 31 28 28 33 35
9 0 0 10 12 15 13
10 0 0 0 0 0 0
11 100 100 100 100 100 100
12 3.5 3.5 3.5 3.5 3 3
Table 7. Performance Comparison.
Element Case1 Case2
Scenario 1 Scenario 2
H I H I H I
C 8.0277 8.0277 8.6278 8.7710 10.6223 9.8395
Cl 0.1751 0.1751 0.4050 0.4510 0.8423 0.7971
Zn 3.2316 3.2316 3.2377 3.2381 2.6890 2.7284
C/O 0.7528 0.7528 0.8026 0.8148 0.8549 0.7844

5. Conclusions

To meet the challenges of efficiency and precision in the rotary hearth furnace batching process, this study has successfully developed and deployed an innovative intelligent batching system. The system utilizes a robust online clustering algorithm framework, seamlessly integrating data preprocessing techniques with both offline and online AP clustering algorithms. Additionally, incorporating an expert-driven formula fine-tuning module, the system adeptly processes historical formula data and dynamically updates batching plans. The application of these advanced technologies allows the system to accurately identify and handle outliers and missing values in the data, efficiently perform re-clustering based on new data, avoid redundant computations, and significantly enhance processing efficiency and batching precision. The system design also considers user interactivity, featuring a user-friendly interface and flexible parameter configuration, further enhancing its practicality and adaptability. The successful development and implementation of this system have not only optimized the batching process and enhanced product quality and efficiency but also introduced a new intelligent solution to the rotary hearth furnace batching sector, which has important theoretical significance and practical value. Its application at a Chinese steel plant has demonstrated the system’s efficiency and practicality.

Author Contributions

Conceptualization, Xianxia Zhang and Lufeng Wang; Data curation, Shengjie Tang, Chang Zhao and Jun Yao; Formal analysis, Lufeng Wang; Funding acquisition, Xianxia Zhang; Investigation, Shengjie Tang; Methodology, Xianxia Zhang; Project administration, Jun Yao; Software, Chang Zhao and Jun Yao; Supervision, Chang Zhao and Jun Yao; Validation, Lufeng Wang; Visualization, Shengjie Tang; Writing – original draft, Lufeng Wang; Writing – review & editing, Xianxia Zhang and Lufeng Wang.

Funding

This work was supported by the project from the National Natural Science Foundation of China under Grant 62073210.

Conflicts of Interest

The authors declare no conflict of interest.

References

  1. Liangming, P.; Hongchun, J.; Shuming, C.; Chengbo, W. and Haiquan, Y.. An experimental investigation for cold-state flow field of regenerative heating annular furnace. Applied Thermal Engineering 2009, 29, 3426–3430. [Google Scholar]
  2. N’Tsoukpoe, K.E.; Rammelberg, H.U.; Lele, A.F.; Korhammer, K.; Watts, B.A.; Schmidt, T. and Ruck, W.K.L. A review on the use of calcium chloride in applied thermal engineering. Applied Thermal Engineering 2015, 75, 513–531. [Google Scholar] [CrossRef]
  3. Murean,V. Mathematical modelling and numerical simulation of the temperature control system in a furnace with rotary hearth. In: IEEE International Joint Conferences on Computational Cybernetics and Technical Informatics (ICCC-CONTI 2010), Timisoara, Romania, 2010, pp. 203–208.
  4. Liangyu, W.; Zeyi, J.; XinXin, Z.; Qingguo, X.; Miao, Z.; Zongyan, Z. and Yansong, S. Process optimization of metallurgical dust recycling by direct reduction in rotary hearth furnace. Powder Technology 2018, 326, 101–113. [Google Scholar]
  5. Yan, D.; Eaton, R. Breakage properties of ore blends. Minerals Engineering 1994, 7(2–3), 185–199. [Google Scholar] [CrossRef]
  6. Sherali, H.D.; Puri, R. Models for a coal blending and distribution problem. Omega 1993, 21, 235–243. [Google Scholar] [CrossRef]
  7. Papini, R.M.; Guimarães, R.C.; Peres, A.E.C. Technical note study on the flotation selectivity of a problem phosphate ore. Minerals Engineering 2001, 14, 681–684. [Google Scholar] [CrossRef]
  8. Young, H. Peyton. Learning by trial and error. Games and Economic Behavior 2009, 65, 2–626. [Google Scholar] [CrossRef]
  9. Paya, Ali; Shoraka, Hamid-Reza Baradaran. Futures studies in Iran: Learning through trial and error. Futures 2010, 42, 484–495. [Google Scholar] [CrossRef]
  10. Semenov, Yurii S; Shumelchyk, Yevhen I.; Horupakha, Viktor V.; Semion, Igor Y.; Vashchenko, Sergii V.; Khudyakov, Oleksandr Y.; Chychov, Igor V.; Hulina, Iryna H. and Zakharov, Rostyslav H. Development and Implementation of Decision Support Systems for Blast Smelting Control in the Conditions of PrJSC “Kamet-Steel”. Metals 2022, 12, 985. [Google Scholar] [CrossRef]
  11. Ruijun, Z.; Lu, J. and Guangquan Z. A knowledge-based multi-role decision support system for ore blending cost optimization of blast furnaces. European Journal of Operational Research 2011, 215, 194–203. [Google Scholar]
  12. Yufeng, L.; Wenxue, W.; Jiajia, J.; Yuanyuan, Q. Optimization algorithm of raw material ratio of zircon brick based on SVM and APSO. In In Proceedings of the 2021 International Conference on Information Technology and Biomedical Engineering (ICITBE), Nanchang, China, 24-26 December 2021. [Google Scholar]
  13. Jiahui, L.; Hanwen, L.; Jun, Z.; Wei, W. A novel optimization method for raw coal blending in coal preparation plants based on interval programming. In In Proceedings of the 2023 China Automation Congress (CAC), Chongqing, China, 17-19 November 2023. [Google Scholar]
  14. Cui, B.; Chen, W.; Baoxiang, W.; Chen, Y.; Pengfei, W.; Tong, Y. Intelligent optimization system of burden structure in sintering and blast furnace ironmaking process based on improved genetic algorithm. Ironmaking & Steelmaking 2022, 49, 1005–1010. [Google Scholar]
  15. Spengler, T.; Geldermann, J.; Hähre, S.; Sieverdingbeck, A.; Rentz, O. Development of a multiple criteria based decision support system for environmental assessment of recycling measures in the iron and steel making industry. Journal of Cleaner Production 1998, 6, 37–52. [Google Scholar] [CrossRef]
  16. Xiuyun, Z.; Mingtong, C.; Wencong, L. Fuel ratio optimization of blast furnace based on data mining. ISIJ International 2020, 60, 2471–2476. [Google Scholar]
  17. Zhang, Ruijun; Lu, Jie; Zhang, Guangquan. A knowledge-based multi-role decision support system for ore blending cost optimization of blast furnaces. European Journal of Operational Research 2011, 215, 194–203. [Google Scholar] [CrossRef]
  18. Hua, CC; Wang, YJ; Li, JP; Tang, YG; Lu, Z. Multi-objective optimization model for blast furnace production and ingredients based on NSGA-II algorithm. CIESC Journal 2016, 67, 1040–1047. [Google Scholar]
  19. Wu, Min; Chen, Xiaoxia; Cao, Weihua; She, Jinhua; Wang, Chunsheng. An intelligent integrated optimization system for the proportioning of iron ore in a sintering process. Journal of Process Control 2014, 24, 182–202. [Google Scholar] [CrossRef]
  20. Breunig, Markus M; Kriegel, Hans-Peter; Ng, Raymond T; Sander, Jörg. LOF: identifying density-based local outliers. In: Proceedings of the 2000 ACM SIGMOD international conference on Management of data; 2000; pp. 93–104.
  21. Houtekamer, Peter L; Mitchell, Herschel L. Data assimilation using an ensemble Kalman filter technique. Monthly Weather Review 1998, 126, 796–811. [Google Scholar] [CrossRef]
  22. Alipanahi, Babak; Delong, Andrew; Weirauch, Matthew T; Frey, Brendan J. Predicting the sequence specificities of DNA-and RNA-binding proteins by deep learning. Nature Biotechnology 2015, 33, 831–838.
  23. Leilei, S.; Chonghui, G. Incremental affinity propagation clustering based on message passing. IEEE Transactions on Knowledge and Data Engineering 2014, 26, 2731–2744. [Google Scholar]
Figure 1. Overall workflow of intelligent batching system.
Preprints 115848 g001
Figure 2. Schematic diagram for detecting abnormal LOF values in secondary ash of blast furnace.
Preprints 115848 g002
Figure 3. Schematic diagram of C element filtering in secondary ash of blast furnace.
Preprints 115848 g003
Figure 4. The process of online AP clustering.
Preprints 115848 g004
Figure 5. The fine adjustment process.
Preprints 115848 g005
Figure 6. The intelligent batching system executed in a steel plant of China.
Preprints 115848 g006
Figure 7. Batching system interface.
Preprints 115848 g007
Figure 8. System parameter interface, the index x i ranges from 1 to 12.
Preprints 115848 g008
Figure 9. Parameter interface of ingredient system.
Preprints 115848 g009
Table 1. Raw material types.
Number x 1 x 2 x 3
Raw material Environmental Ash CDQ Ash from the Iron casting plant
Number x 4 x 5 x 6
Raw material Cold-rolled Mud Secondary Ash of Blast Furnace Mixed Ash
Table 2. Symbol Table.
Symbol Meaning
T M Q Total set material quantity(t/h)
O M Q Total amount of Environmental Ash raw materials(t/h)
I M Q Total raw material amount, excluding environmental dust(t/h)
F M Q Return Material (t/h)
w O M Q Percentage of O M Q in T M Q composition(%)
w x 1 Percentage of x 1 in T M Q composition(%)
C x 1 Mass percentage of Carbon in x 1 (%)
C l x 1 Mass percentage of Chlorine in x 1 (%)
Z n x 1 Mass percentage of Zinc in x 1 (%)
F e x 1 Mass percentage of Iron in x 1 (%)
F e O x 1 Mass percentage of ferrous oxide in x 1 (%)
O F e O x 1 O F e O x 1 is the mass percentage of oxygen in F e O x 1 (%)
F e 2 O 3 x 1 The mass percentage of ferric oxide in x 1 (%)
O F e 2 O 3 x 1 The mass percentage of oxygen in ferric oxide(%)
O Z n x 1 The mass percentage of oxygen in Zinc oxide within x 1 (%)
O x 1 The mass percentage of oxygen in Zinc oxide within x 1 (%)
w F M Q The percentage composition of F M Q in T M Q (%)
C F M Q The mass percentage of Carbon in F M Q (%)
C l F M Q The mass percentage of Chlorine in F M Q (%)
Z n F M Q The mass percentage of Zinc in F M Q (%)
O F M Q The mass percentage of oxygen in F M Q (%)
F e F M Q The mass percentage of ferrous oxide in F M Q (%)
F e O F M Q The mass percentage of ferrous oxide in F M Q (%)
O F e O F M Q The mass percentage of oxygen in F e O F M Q (%)
F e 2 O 3 F M Q The mass percentage of f e r r i c o x i d e in F M Q (%).
O F e 2 O 3 F M Q The mass percentage of oxygen in f e r r i c o x i d e (%)
O Z n F M Q The mass percentage of oxygen in Zinc oxide within F M Q (%)
w I M Q Percentage composition of I M Q in T M Q (%)
w i Percentage of material x i in I M Q (%)
C I M Q Mass percentage of Carbon in I M Q (%)
w C i Mass percentage of Carbon in x i (%)
C l I M Q Mass percentage of Chlorine in I M Q (%)
w C l i Mass percentage of Chlorine in x i (%)
Z n I M Q Mass percentage of Zinc in I M Q (%)
w Z n i Mass percentage of Zinc in x i (%)
F e I M Q Mass percentage of Iron in I M Q (%)
w F e i Mass percentage of Iron in I M Q (%)
O F e O I M Q Mass percentage of oxygen in F e within I M Q (%)
w F e O I M Q Mass percentage of ferrous oxide in I M Q (%)
O F e 2 O 3 I M Q Percentage mass of oxygen in F e 2 O 3 I M Q within I M Q (%)
w F e 2 O 3 I M Q Mass percentage of F e 2 O 3 I M Q in I M Q (%)
O Z n I M Q The mass percentage of the oxygen in Zinc oxide(%)
O I M Q Total mass percentage of oxygen in I M Q (%)
C s u m Total dry basis mass percentage of Carbon(%)
C l s u m Total dry basis mass percentage of Chlorine(%)
Z n s u m Total dry basis mass percentage of Zinc(%)
C / O s u m Mass percentage ratio of total Carbon to oxygen(%)
C ¯ , C ̲ The upper and lower bounds of Carbon content(%)
C l ¯ , C l ̲ The upper and lower bounds of Chlorine content(%)
Z n ¯ , Z n ̲ The upper and lower bounds of Zinc content(%)
C / O ¯ The upper bound of the Carbon to oxygen ratio(%)
Table 3. At the previous moment, the formula became the cluster center. (Case 1: Scenario 1).
Warehouse number Ratio One C Cl Zn Fe FeO
1 5 8.1707 0.1783 3.2892 40.2301 32.2100
2 6 84.4 0 0 0 0
3 0 0 0 0 0 0
4 0 5.8133 0.016 0.1338 63.9333 11.8774
5 32 3.7800 0.2000 3.6903 45.1367 36.1384
6 0 3.7800 0.2000 3.6903 45.1367 36.1384
7 31 3.7800 0.2000 3.6903 45.1367 36.1384
8 31 3.7800 0.2000 3.6903 45.1367 36.1384
9 0 19.435 5.2200 3.7277 41.5333 3.7069
10 0 3.4295 0.3200 14.1331 38.7285 13.3310
11 100 8.1707 0.1783 3.2892 40.2301 32.2100
12 3.5 0 0 0 0 0
Disclaimer/Publisher’s Note: The statements, opinions and data contained in all publications are solely those of the individual author(s) and contributor(s) and not of MDPI and/or the editor(s). MDPI and/or the editor(s) disclaim responsibility for any injury to people or property resulting from any ideas, methods, instructions or products referred to in the content.
Copyright: This open access article is published under a Creative Commons CC BY 4.0 license, which permit the free download, distribution, and reuse, provided that the author and preprint are cited in any reuse.
Prerpints.org logo

Preprints.org is a free preprint server supported by MDPI in Basel, Switzerland.

Subscribe

© 2024 MDPI (Basel, Switzerland) unless otherwise stated