Submitted:
20 August 2024
Posted:
21 August 2024
You are already at the latest version
Abstract
Study assessed the wind potential of three sites in Chad: Koro Toro, Salal and Nedeley. Analysis of the Weibull distribution curves reveals marked seasonal variability in wind speed, concentrated around the mean. Three models of high-power wind turbines were analyzed. At Koro Toro, the Siemens Gamesa SG 14-222 DD has a capacity factor of between 0.52 and 0.682, allowing a daily flow of pumped water of between 1.4 and 6.1 million m³. The Enercon E-126 EP4 performs slightly less well. At Salal, the Siemens Gamesa has a capacity factor of between 0.4463 and 0.6605, with a water flow rate of between 0.9 and 3.7 million m³/day. The Vestas V164-10.0 MW has a higher capacity factor (0.6327 to 0.8115) but a lower water flow rate (0.5 to 1.9 million m³/day). Enercon's performance is comparable to that of Siemens Gamesa. The Nedeley study reveals favorable conditions, with seasonal variations in wind speed and capacity factor indicating good wind potential, and maximum daily water flows of between 3 and 6 million m³. Analysis of the wind roses shows interesting potential in these towns, with a dominant east-north-easterly wind at maximum frequencies of 40%. The absence of calm winds is promising, although Nedeley and Salal have a residual presence. This study shows that the sites offer good wind potential This, enabling the production of electricity and heat.
Keywords:
Wind power
; Weibull distribution
; capacity factor
; water pumping
; wind efficiency
1. Introduction
Chad, a vast landlocked Saharan country in Central Africa, faces many challenges related to its natural environment and economic development [1,2]. Among these challenges, the issue of access to drinking water and energy is central. The country is characterized by severe aridity, limited water resources and dependence on fossil fuels, which are not only costly to import but also pollute [3]. Climate change is making the situation even worse, with increasingly frequent and intense droughts reducing the availability of water and degrading arable land [4,5]. This has a direct impact on people, particularly in rural areas, whose livelihoods are threatened and who have to travel long distances to access water [6,7]. Against this backdrop, the development of renewable energies appears to be a promising solution for meeting Chad's energy needs and improving people's quality of life. Solar energy and wind power, in particular, have great potential in a country with a lot of sunshine and regular winds [4,5,6]. These renewable energies offer a number of advantages:
- Energy independence: reducing dependence on imported fossil fuels and keeping energy costs under control.
- Environmental protection: they help to reduce greenhouse gas emissions and limit the negative impact on the environment.
- Local development: they can stimulate the local economy by creating jobs and encouraging the emergence of new activities.
The Bodélé triangle, a vast depression in northern Chad [10], is particularly hard hit by water shortages and land degradation. This region, characterized by strong, sustained winds, offers significant wind energy potential [7,8]. Exploiting this resource could help to improve access to drinking water for local populations, encourage the development of agriculture and strengthen the resilience of ecosystems in the face of climate change [12]. Although wind power seems to be a suitable solution to the needs of the Bodélé triangle, the use of high-power wind turbines raises a number of questions. Designed to produce large quantities of electricity [13,14], are these machines suited to the specific needs of small rural communities? Their high cost, technical complexity and potential impact on the environment require in-depth assessment.
We hypothesis that the use of high-power wind turbines to power water pumping systems in the Bodélé triangle has both advantages and limitations. While these machines can meet significant water needs, their deployment needs to be carefully studied in order to optimize their efficiency and sustainability, while considering the specific socio-economic and environmental context of the region.
The aim of this study is to assess the impact of using high-power wind turbines on the efficiency and sustainability of water pumping systems in small towns in the Bodélé triangle. More specifically, we will seek to:
- Assess technological suitability: are high-power wind turbines adapted to the specific conditions of the site and the water needs of the local population?
- Measure energy efficiency: what is the actual energy yield of the pumping systems powered by these wind turbines, and how does this evolve over time?
To answer these questions, our study will focus on the following areas:
- Geographical and climatic context of the Bodélé triangle.
- Wind power technologies and pumping systems.
- Case study: high-power wind turbine projects in the Bodélé triangle.
- Assessment of efficiency and sustainability.
- Discussion and recommendations.
This study will contribute to a better understanding of the issues involved in using wind energy to provide access to water in arid regions, and will enable recommendations to be made for the development of sustainable projects tailored to the needs of local populations.
2. Materials and Methods
2.1. Geographical Location of the Study Area
The study area of the present work concerns three small towns located at the heart of the Bodélé triangle in the Saharan zone of Chad, the geographical coordinates of which are given in the Table 1 below. Figure 1 shows the area of the triangle in which the three towns under study are located, with their geographical coordinates.
2.2. Materials
The meteorological data used in this study were obtained from satellite observations provided by NASA, due to the lack of in situ data at the study sites. Microsoft Excel and Libre Office Calc were used to process and analyze the data. Numerical simulations were carried out using MATLAB software. The meteorological parameters studied included wind speed and direction at 10 meters above ground level. Arcgis software was used to visualize the study areas spatially. Wind roses, illustrating the distribution of wind directions, were generated using WRPLOT software. These tools enabled us to carry out an in-depth analysis of the meteorological data and gain a better understanding of the atmospheric phenomena at work.
2.3. Methods
2.3.1. The Weibull Distribution: An Essential Tool for Wind Energy
The Weibull distribution is a continuous probability distribution that has a particularly interesting application in the field of wind energy. It is used to model the distribution of wind speeds, a crucial parameter for assessing the wind potential of a site and designing wind turbines [10,11]. This distribution is characterized by two key parameters:
The scale parameter c: This represents the most frequent wind speed. The higher c, the higher the average wind speed.
The shape parameter k: This indicates the shape of the distribution. For values of k close to 2, the Weibull distribution tends towards a Rayleigh distribution, often used as a first approximation for wind speeds. A k value below 2 indicates a flatter distribution, while a k value above 2 suggests a sharper distribution.
The Weibull distribution is an indispensable tool for studying and exploiting wind energy. Thanks to the parameters c and k, it provides a precise and concise description of the variability of wind speeds, a key element in the assessment of wind potential and the design of wind energy systems.
2.3.2. The Hybrid Weibull Distribution Function
The hybrid Weibull distribution function is used when the frequency of calm wind recorded at the site is greater than or equal to 15%. This proportion of calm wind becomes very important and cannot be neglected and must be considered when studying a wind project [12,13]. The mathematical expression of this distribution is given by:
where represents the calm wind frequency.
2.3.3. The Rayleigh Speed Distribution Function
The Rayleigh speed distribution function is a statistical distribution used to model the distribution of wind speeds. It is often used in addition to the Weibull distribution to characterize the behavior of the wind at a given site more precisely [19].
The Rayleigh speed distribution is generally used to represent wind speeds in the absence of specific directional phenomena, such as obstacles or significant topographical effects. It assumes that the wind speed follows a Rayleigh distribution, which describes the probability of the wind speed reaching a given value.
This distribution is characterized by a single parameter, called the scale parameter, which determines the shape of the distribution curve. Using wind speed data collected on site, engineers can adjust this parameter to obtain an accurate representation of the wind speed distribution according to the Rayleigh distribution [1,15]. This is a special case of the Weibull distribution.
2.3.4. Vertical Extrapolation of Wind Speed
Vertical extrapolation of wind speed consists of estimating the wind speed at different heights above ground based on measurements of wind speeds taken at a single height. This extrapolation plays a very important role in the study of wind potential, as wind speed varies with altitude and can be significantly different at different heights. By extrapolating the wind speed at different heights, we can obtain a better estimate of the available wind resource and therefore better plan the installation of wind farms to maximize their efficiency and energy production [23].
Given V1, a wind speed extrapolated from an altitude Z1 to another altitude Z2 according to the relationship given by equation (4), the speed V2 can be calculated as follows [24]:
where V1 and V2 represent respectively the wind speed at a height of 10 m and the speed at altitude Z2.
α is the roughness coefficient represented by relation (5) [24]:
The Weibull scale factor and shape parameters determined at a height of 10 m are adjusted to any desired height, as indicated by [20,21]:
kz is the form factor at height z and Cz is the scale factor at height z.
The exponent n of the power law is given by [27]:
2.4. Method for Determining Weibull Parameters
2.4.1. The Moroccan Method
2.5. Power of a Wind Turbine
2.5.1. Average Usable Power
Considering the variability of wind speed and the characteristics of a wind turbine as a function of its starting speed v1, rated speed vn and stopping speed vs, the usable power of a wind turbine is given by the following relationship [12]:
With:
ρ: the volume density ρ=1.225kg/m3; A: the area swept by the blades;
The speed vu is deduced from the curve representing the Weibull distribution between the limits of the machine. The lower limit is represented by the starting speed [30,31]. Only speeds above the starting speed vi are considered in the calculation. In the second case, when the nominal speed vn is reached, the increase in wind speed has no effect on the wheel speed. Finally, when the stopping speed vs is reached, the system is automatically braked and higher speeds are not considered in the calculation of vu.
The mathematical expression of the usable power density is given by the following equation [22,31,32]:
The mean usable cubic velocity is obtained by integrating the cubic velocity weighted by the probability function, taking the integration limits given by the turbine manufacturer as:
Or by integration using the normalized gamma distribution:
With:
2.5.2. Wind Turbine Power Output and Capacity Factor
Any wind energy conversion system is designed to operate at maximum efficiency within the limits of the rated wind speed and power. Therefore, once the Weibull scaling and shape parameters are estimated, the performance of a wind turbine at a given site can be easily calculated using the average power and capacity factor. In this paper, the electrical power of a model wind turbine is simulated using [4,14,27]:
Where:
: rated electrical power
: the speed of startup of the wind turbine;
: rated speed;
: cutting speed
The power produced by a wind turbine depends on the specifications given by the turbine manufacturer.
Each turbine has three essential speed data as its technical parameters. These are [34]:
- The start speed VD: this is the speed from which the wind turbine starts to produce energy. Below this threshold, the wind turbine produces no energy.
-Nominal speed VN: this is the speed at which the wind turbine reaches its maximum energy production threshold. This threshold remains constant until the cut-off speed.
- The cut-off speed VC: this is the speed at which the wind turbine stops producing energy because of automatic stopping of the blades for safety. Speeds beyond VC have no effect on energy calculation.
The total wind power at wind turbine output is:
By replacing the instantaneous power and the velocity distribution function f(V) with their expressions, we have:
After integration, we will have:
With :
With the capacity factor and plays a very important role in the study of a wind site. The capacity factor can be estimated from the Weibull parameters and the different operating speeds that are provided by the turbine manufacturer. The rated power Pn of a wind turbine is given by the manufacturer. Knowing the useful power produced by a wind turbine, we can calculate the energy produced by a wind turbine during a given period. The energy produced by a wind farm E(KWh) is the total annual wind energy available at a given site. This energy can be calculated as a function of the number of hours, such as [36]:
With T the number of hours in a period:
d being the number of days.
2.5.3. Usable Wind Energy
The average usable (produced) wind energy is [37]:
2.6. Definition Description of Giant Wind Turbines
Large-capacity wind turbines, also known as high-power wind turbines, are large-scale wind turbines designed to generate large amounts of electricity [33,34]. They are different from small wind turbines in terms of size, power and production capacity [41].
2.6.1. Characteristics
Size: The height of high-power wind turbines can reach 200 meters, with rotors more than 100 meters in diameter.
Power: The rated power of high-powered wind turbines generally ranges from 2 to 5 megawatts (MW), up to 10 MW for the latest models.
Power generation: A single large-capacity wind turbine can generate enough electricity to power approximately 4,000 homes.
2.6.2. Operation
High-power wind turbines use the electromagnetic induction principle to convert wind kinetic energy into electricity. The wind rotates the rotor blades, which then cause a generator in the windmill nacelle to rotate. Table 2 shows high-power wind turbines with their data sheets. Figure 1 shows the performance curves of different wind turbines for applications at our three sites [42].
3. Results and discussions
3.1. Analysis of the statistical distributions of different cities
Figure 3, Figure 5 and Figure 7 show the different monthly speed diagrams for the three cities. Figure 4, Figure 6 and Figure 8 show the different monthly distributions of Weibull for the following cities: KORO TORO, NEDELEY and SALAL. The observation of the different curves shows us that the values of the shape factors oscillate around 2, showing that the different velocity distributions are very close to the Rayleigh one. The fact that the form factor oscillates around 2 indicates a relatively sharp Weibull distribution. This means that wind speeds are mainly concentrated around an average value, with few very strong or very weak winds. This is favorable for wind energy production because it ensures a relatively constant flow of energy. The scale factor has a marked seasonal variation, with higher average velocities in winter (December) and lower in summer (September). This variation is typical of many regions and is explained by differences in atmospheric pressure and general circulation between seasons.
Figure 3: KORO TORO speed distribution.
3.2. Interpretation of the Results from the KORO TORO Site
Table 3 shows the different values of wind speeds, Weibull parameters and the application to the Vestas V164-10.0 MW wind turbine. The analyzed data shows the monthly wind speeds for a specific location in KORO TORO. Key observations of the monthly speeds show that the average wind speed throughout the year is 4.75 meters per second. There appears to be some seasonal variation in wind speeds. December has the highest wind speed of 5.692 m/s, while September has the lowest at 3.423 m/s. The standard deviation of the wind speeds is 0.81 m/s, indicating that there is some variability in wind speeds throughout the year. Overall, the data suggest that the town of Koro Toro experiences moderate wind speeds with some seasonal variation. December has the strongest winds, while September has the weakest winds. Extrapolating the results to the hub height of the Vestas V164-10.0 MW turbine shows a significant increase in average wind speed. This increase is consistent with the laws of wind turbines, according to which wind speed generally increases with altitude. The scale factor at this height increases exponentially, confirming this trend.
The capacity factor of 0.614 is relatively high, indicating that the site has good wind power potential. This means that the wind turbine produces an average of 61.4% of its maximum possible energy over a year. Variations in the daily flow pumped are directly linked to variations in wind energy production, which in turn depends on wind speed. The highest flows are observed in winter, when wind speeds are highest, and the lowest flows in summer, when wind speeds are lowest.
The results of this study show that the study site has interesting wind energy potential, with relatively high average wind speeds and a good consistency in the distribution of speeds. However, wind energy production is subject to significant seasonal variations, linked to variations in wind speed. The Vestas V164-10.0 MW wind turbine appears to be well suited to the site conditions, given the high wind speeds at hub height. Wind energy production will be highest in winter and lowest in summer. It is important to take these seasonal variations into account when planning the operation of the wind turbine. An energy storage system could be considered to smooth out energy production and better meet water requirements, particularly during periods of low wind production.
The wind study evaluated the performance of two other wind turbine models: Siemens Gamesa SG 14-222 DD and Enercon E-126 EP4 in Table 3 and Table 4. Given that the wind speed at Koro Toro shows marked seasonal variability, with a maximum in March (5.658 m/s) and a minimum in October (3.42 m/s). The vertical profile of the wind is close to that observed at 10 meters, which simplifies the estimation of the speed at different heights. The scaling factor, which characterizes the increase in wind speed with altitude, reaches maximum values in March (18.41 m/s) and minimum in October (11.31 m/s). In terms of application, the Siemens Gamesa SG 14-222 DD wind turbine presents the capacity factor, which represents the ratio between the energy produced and the maximum energy that can be produced, varies between 0.52 and 0.682 depending on the month. The daily flow of water pumped by this turbine fluctuates between 1,398,900 and 6,110,000 m³/day. For the Enercon E-126 EP4 wind turbine, the capacity factor is slightly higher than for the Siemens Gamesa, with values between 0.5258 and 0.7447. The daily flow of water pumped by this turbine is lower than that of the Siemens Gamesa, varying between 755,800 and 3,377,800 m³/day. The results of this study show that the Koro Toro site has an interesting wind energy potential, with sufficient wind speeds to ensure significant electricity production. The two wind turbine models studied show satisfactory performance, with relatively high capacity factors. However, electricity production is strongly influenced by the seasonal variability of the wind.
3.3. Interpretation of SALAL Site Results
The wind power study conducted in Salal allowed to characterize the wind power potential of the site and to evaluate the performance of three wind turbine models: Siemens Gamesa SG 14-222 DD, Vestas V164-10.0 and Enercon E-126 EP4 in Table 6, Table 7 and Table 8. The wind at Salal has marked seasonal variability, with a peak speed in February (4.77 m/s to 10 m) and a trough in October (2.986 m/s). The vertical profile of the wind is relatively stable, with a form factor close to 2-10 m. The scale factor, which expresses the increase in wind speed with altitude, varies between 8,709 m/s and 13,745 m/s, with a maximum in December at the height of the turbine. The application to different Aeolian Turbines give us significant results. For the Siemens Gamesa SG 14-222 DD: The capacity factor, which represents the efficiency of the turbine, varies between 0.4463 and 0.6605, depending on the evolution of wind speed. The water flow at a total manometric height of 50 m of the turbine fluctuates between 928700 m 3/day and 3716800 m 3/day. For Vestas V164-10.0. The capacity factor is relatively stable, with values between 0.6327 and 0.8115. Daily throughput is lower than other models, ranging from 485 640 m 3/day to 1,944 300 m 3/day. For the Enercon E-126 EP4 wind turbine: The capacity factor is comparable to that of the Siemens Gamesa, with values between 0.4534 and 0.6960. The daily flow is the highest of the three models, varying between 501150 m 3/day and 12014400 m 3/day.
The Salal site has an interesting wind potential, with sufficient wind speeds to power wind turbines. The three models studied showed satisfactory performance, although the yield varies according to weather conditions. The choice of a wind turbine will depend on the specific constraints of the project, in particular in terms of cost, available area and desired energy production.
3.4. Interpretation of the NEDELEY results
The wind potential study at Nedeley reveals favorable conditions for the exploitation of this renewable energy resource. The maximum wind speed observed in February reaches 5,575 m/s, classified as "moderate wind" according to the Beaufort scale, while the minimum, recorded in September, is 3,306 m/s, corresponding to a "soft breeze". This seasonal variability is typical of wind regimes and must be considered in the design of the pumping system. The scale factor, which expresses the increase in wind speed with altitude, reaches a maximum of 15,061 m/s in February and a minimum of 8,998 m/s. This seasonal variation is consistent with that of the wind speed at 10 meters. The capacity factor, which is the ratio of the actual energy produced by a wind turbine to the maximum energy it could produce under ideal conditions, varies between 0.4166 and 0.7042 depending on the month. These values indicate an interesting potential for wind energy production, although seasonal variations are expected.
The daily water flow, which is directly related to the available power for pumping, reaches a maximum of 3.0865 x 10⁶ m 3/day for the wind turbine Vestas V164-10.0. The other wind turbines studied, Siemens Gamesa SG 14-222 DD and Enercon E-126 EP4, have maximum daily flows of 5.8551 x 10⁶ m 3/day and 3.1779 x 10⁶ m 3/day respectively. These values are directly related to rotor size and wind speed. These results suggest that the Nedeley site has an interesting potential for pumping water using renewable energy. However, several factors must be considered for a more accurate assessment.

Table 9.
Application of speed values, Weibull parameters, capacity factor and daily flow rates at different heights for Vestas V164-10.0 for the City of Nedeley.
Table 9.
Application of speed values, Weibull parameters, capacity factor and daily flow rates at different heights for Vestas V164-10.0 for the City of Nedeley.
| Month | V0(m/s) | K0 | V0(m/s) | V117(m/s) | K117 | C117 | CF | Q(m3/Day) |
|---|---|---|---|---|---|---|---|---|
| Jan | 5.442 | 2.3 | 6.14 | 11.997 | 2.257 | 13.546 | 0.6571 | 2.2443e+06 |
| Feb. | 5.575 | 2.32 | 6.29 | 13.333 | 2.372 | 15.049 | 0.7039 | 3.0790e+06 |
| Mar. | 5.479 | 2.3 | 6.18 | 13.344 | 2.373 | 15.061 | 0.7042 | 3.0865e+06 |
| Apr. | 5.034 | 2.22 | 5.68 | 13.121 | 2.354 | 14.81 | 0.6978 | 2.9345e+06 |
| May | 4.301 | 2.06 | 4.85 | 12.076 | 2.264 | 13.636 | 0.6605 | 2.2892e+06 |
| Jun. | 3.582 | 1.87 | 4.03 | 10.353 | 2.101 | 11.687 | 0.5735 | 1.4411e+06 |
| July | 4.304 | 2.06 | 4.86 | 8.658 | 1.913 | 9.752 | 0.4632 | 8.3861e+05 |
| Aug. | 3.921 | 1.96 | 4.42 | 10.36 | 2.102 | 11.695 | 0.5739 | 1.4441e+06 |
| Sept. | 3.306 | 1.79 | 3.72 | 9.457 | 2.006 | 10.667 | 0.5176 | 1.0964e+06 |
| Oct. | 4.262 | 2.05 | 4.81 | 8.004 | 1.83 | 8.998 | 0.4166 | 6.5996e+05 |
| Nov. | 4.907 | 2.19 | 5.54 | 10.262 | 2.092 | 11.584 | 0.5681 | 1.4034e+06 |
| Dec. | 5.565 | 2.32 | 6.28 | 11.778 | 2.237 | 13.3 | 0.6476 | 2.1239e+06 |
Table 10.
Application of speed values, Weibull parameters, capacity factor and daily flow rates at different heights for Siemens Gamesa SG 14-222 DD.
Table 10.
Application of speed values, Weibull parameters, capacity factor and daily flow rates at different heights for Siemens Gamesa SG 14-222 DD.
| Month | V0(m/s) | K0 | C0(m/s) | V195 (m/s) | K195 | C195 | CF | Q (m3/Day) |
| Jan | 5.442 | 2.3 | 6.14 | 15.996 | 2.357 | 17.632 | 0.6824 | 5.4527e+06 |
| Feb. | 5.575 | 2.32 | 6.29 | 17.632 | 2.384 | 18.054 | 0.6828 | 5.8551e+06 |
| Mar. | 5.479 | 2.3 | 6.18 | 15.73 | 2.365 | 17.755 | 0.6826 | 5.5681e+06 |
| Apr. | 5.034 | 2.22 | 5.68 | 14.483 | 2.275 | 16.353 | 0.6732 | 4.3484e+06 |
| May | 4.301 | 2.06 | 4.85 | 12.425 | 2.111 | 14.026 | 0.6247 | 2.7430e+06 |
| Jun. | 3.582 | 1.87 | 4.03 | 10.399 | 1.922 | 11.713 | 0.5390 | 1.6000e+06 |
| July | 4.304 | 2.06 | 4.86 | 12.434 | 2.111 | 14.036 | 0.6249 | 2.7488e+06 |
| Aug. | 3.921 | 1.96 | 4.42 | 11.355 | 2.015 | 12.807 | 0.5836 | 2.0895e+06 |
| Sept. | 3.306 | 1.79 | 3.72 | 9.618 | 1.839 | 10.812 | 0.4979 | 1.2604e+06 |
| Oct. | 4.262 | 2.05 | 4.81 | 12.317 | 2.101 | 13.903 | 0.6210 | 2.6716e+06 |
| Nov. | 4.907 | 2.19 | 5.54 | 14.128 | 2.248 | 15.952 | 0.6678 | 4.0358e+06 |
| Dec. | 5.565 | 2.32 | 6.28 | 15.968 | 2.382 | 18.023 | 0.6828 | 5.8246e+06 |
Table 11.
Application of speed values, Weibull parameters, capacity factor and daily flow rates at different heights for Enercon E-126 EP4.
Table 11.
Application of speed values, Weibull parameters, capacity factor and daily flow rates at different heights for Enercon E-126 EP4.
| Month | V0(m/s) | K0 | C0(m/s) | V195 (m/s) | K195 | C195 | CF | Q (m3/Day) |
| Jan | 5.442 | 2.3 | 6.14 | 11.731 | 2.182 | 13.246 | 0.6838 | 1.8549e+06 |
| Feb. | 5.575 | 2.32 | 6.29 | 14.039 | 2.376 | 15.846 | 0.7451 | 3.1779e+06 |
| Mar. | 5.479 | 2.3 | 6.18 | 13.805 | 2.357 | 15.582 | 0.7415 | 3.0216e+06 |
| Apr. | 5.034 | 2.22 | 5.68 | 12.707 | 2.267 | 14.348 | 0.7167 | 2.3579e+06 |
| May | 4.301 | 2.06 | 4.85 | 10.896 | 2.104 | 12.3 | 0.6480 | 1.4852e+06 |
| Jun. | 3.582 | 1.87 | 4.03 | 9.114 | 1.916 | 10.265 | 0.5505 | 8.6484e+05 |
| July | 4.304 | 2.06 | 4.86 | 10.903 | 2.104 | 12.308 | 0.6483 | 1.4883e+06 |
| Aug. | 3.921 | 1.96 | 4.42 | 9.954 | 2.009 | 11.228 | 0.5997 | 1.1303e+06 |
| Sept. | 3.306 | 1.79 | 3.72 | 8.427 | 1.833 | 9.473 | 0.5069 | 6.8079e+05 |
| Oct. | 4.262 | 2.05 | 4.81 | 10.801 | 2.094 | 12.191 | 0.6434 | 1.4464e+06 |
| Nov. | 4.907 | 2.19 | 5.54 | 12.394 | 2.24 | 13.995 | 0.7073 | 2.1879e+06 |
| Dec. | 5.565 | 2.32 | 6.28 | 14.015 | 2.374 | 15.818 | 0.7447 | 3.1613e+06 |
3.4. Wind Rose Diagrams
The interpretation of wind roses from the cities of Koro Toro, Nedeley and Salal is essential to assess the wind potential of these sites. Figure 9, representing Koro Toro, shows a dominant wind from the east-northeast with a maximum frequency of 40%. The absence of calm winds in this region is a promising indicator for wind energy as it eliminates the hybrid distribution of Weibull, often seen in areas where quiet periods are common. The absence of calm wind suggests a consistency in the wind conditions, which is favorable for the installation of wind turbines. Figure 10 shows Nedeley, which has a similar pattern with a dominant wind from the same east-northeast sector and a maximum frequency above 40%. Although the frequency of calm winds is low at 0.13%, it remains significant relative to Koro Toro. This reinforces the idea that Nedeley also has good wind potential, although slightly less optimal than Koro Toro due to the presence of calm winds. Figure 11 shows data for Salal, where the dominant wind also remains from the east-northeast, with a maximum frequency of 40% and a calm wind frequency of 0.27%. These results indicate that Salal, as well as Koro Toro and Nedeley, has viable wind potential. In summary, these analyses demonstrate that the three sites are suitable for wind energy projects, thanks to reliable and constant wind conditions.
3.5. Discussions
The analysis of the efficiency of large-capacity wind turbines for water pumping in the towns of Koro Toro, Nedeley and Salal, located in the center of the Bodélé triangle, revealed promising results. The mean wind speeds were significant for each locality.
The importance of access to safe drinking water in desert areas is highlighted by several international declarations, including those issued by the United Nations [46]. Sustainable Development Goal (SDG) 6 aims to ensure access to water and sanitation for all, while promoting sustainable management of water resources [47]. In regions like the Sahara, where water resources are scarce, pumping water with renewable energy becomes crucial to meet people’s needs.
Statistical analysis of the Weibull distributions, which has been similar to that of Rayleigh, confirms the region’s significant wind potential. The prevailing wind direction is the northeast sector, which helps to ensure optimal wind turbine orientation. The results indicate an average capacity factor of more than 0.50 for all wind turbines, highlighting their efficiency in converting wind energy into mechanical energy for pumping.
Statistical analysis of the Weibull distributions, which has been similar to that of Rayleigh, confirms the region’s significant wind potential. The prevailing wind direction is the northeast sector, which helps to ensure optimal wind turbine orientation. The results indicate an average capacity factor of more than 0.50 for all wind turbines, highlighting their efficiency in converting wind energy into mechanical energy for pumping.
In addition, the integration of renewable energies such as wind energy plays a key role in environmental protection. By reducing dependence on fossil fuels, these technologies help reduce greenhouse gas emissions, which is crucial to combating climate change. Wind turbines also help to preserve local ecosystems by minimizing the environmental impacts associated with traditional water supply methods. Wind rose analysis shows an interesting wind potential in the cities of Koro Toro, Nedeley and Salal. The dominant wind comes from the East-North-East with maximum frequencies of 40%. The absence of calm winds is a promising indicator, although Nedeley and Salal show a residual presence of these periods.
The theoretical water flows pumped by each wind turbine, as shown in the previous tables, show that wind power is a viable and reliable solution for these inhospitable arid areas. These results corroborate previous work on the importance of water pumping in the Saharan zone [37,38,39]. However, to fully assess the feasibility of such a project, an in-depth technical and economic study is required. This will help to better understand the economic and technical implications of integrating wind turbines into local water supply systems and ensure sustainable development in these vulnerable regions.
Conclusion
Wind power studies in the three small towns of the Bodélé triangle have revealed interesting energy potential, particularly for applications such as water pumping. The results show marked seasonal variability of wind speeds, with maxima generally observed in winter and minima in summer. This variability is typical of the Saharan regions and is related to differences in atmospheric pressure and general circulation between seasons. Despite these variations, average speeds are sufficient to ensure significant wind energy production.
The different wind turbines studied (Vestas V164-10.0 MW, Siemens Gamesa SG 14-222 DD and Enercon E-126 EP4) showed satisfactory performance, with capacity factors generally higher than 0.5, indicating good efficiency. The choice of the most suitable wind turbine will depend on site-specific constraints (available area, budget, etc.) and energy requirements.
The main benefits of wind energy in this region are:
• Abundant renewable resource: The wind potential of the Bodélé triangle seems important, offering a clean and sustainable source of energy.
• Application to water pumping: Wind energy can be used to power pumps and thus ensure the supply of water for local populations and the development of agriculture.
• Reduced reliance on fossil fuels: Wind energy development helps reduce greenhouse gas emissions and reduces reliance on fossil fuels.
In short, the exploitation of the wind potential of the Bodélé triangle presents interesting prospects for the sustainable development of this region. However, an integrated approach, considering technical, economic and environmental aspects, is necessary to ensure the success of such projects.
Declaration of competing interest: The authors declare that this study has in no way been funded by any company or institution. It is the personal contribution of the paper authors.
References
- Serban, A., Paraschiv, L. S., & Paraschiv, S. (2020). Assessment of wind energy potential based on Weibull and Rayleigh distribution models. Energy Reports, 6, 250-267. [CrossRef]
- Ouedraogo, I., Bonkoungou, J., & Yanogo, I. P. (2022). Climate-smart agriculture in a context of climate change and variability in sub-Saharan Africa. http://djiboul.org/wp-content/uploads/2022/12/40.-Ibrahim-OUEDRAOGO-Joachim-BONKOUNGOU-Isidore-P.-YANOGO.pdf.
- Abdelhamid, I. H., Hauglustaine, J. M., & Abakar, M. T. (2016). Promoting renewable energy: a sustainable response to the energy problems of rural households in Chad. Revue des énergies renouvelables, 19(1). https://hdl.handle.net/2268/210878.
- Abderrezek, H., & Gasmi, K. (2016). Renewable energies, a pillar for the development of Algerian agriculture - The case of wind energy. Journal of Renewable Energies, 19(3), 497-508. [CrossRef]
- Anzalone, G., & Mazaud, C. (2021). The energiculteur, a figure of diversification in agriculture. La nouvelle revue du travail, (18). [CrossRef]
- Soulouknga, MH, Oyedepo, SO, Doka, SY, & Kofane, TC (2020). Evaluation of the cost of producing wind-generated electricity in Chad. International journal of energy and environmental engineering , 11 , 275-287. [CrossRef]
- Fagbenle, R. O., Katende, J., Ajayi, O. O., & Okeniyi, J. O. (2011). Assessment of wind energy potential of two sites in North-East, Nigeria. Renewable energy, 36(4), 1277-1283. [CrossRef]
- Soulouknga, M. H., Kaoga, D. K., Djongyang, N., & Doka, S. Y. (2016). Comparaison du potentiel énergétique éolien des trois zones climatiques du Tchad. Journal of Renewable Energies, 19(1), 49-58. [CrossRef]
- Abdelhamid, I. H. (2016, November). The promotion of renewable energies: a sustainable response to the energy problem in Chad. In 1ère édition de la semaine de la Science au Tchad. https://hdl.handle.net/2268/210762.
- Washington, R., & Todd, M. C. (2005). Atmospheric controls on mineral dust emission from the Bodélé Depression, Chad: The role of the low level jet. Geophysical Research Letters, 32(17). [CrossRef]
- Abouchami, W., Näthe, K., Kumar, A., Galer, S. J., Jochum, K. P., Williams, E., ... & Andreae, M. O. (2013). Geochemical and isotopic characterization of the Bodélé Depression dust source and implications for transatlantic dust transport to the Amazon Basin. Earth and Planetary Science Letters, 380, 112-123. [CrossRef]
- Al-Addous, M., Al Hmidan, S., Jaradat, M., Alasis, E., & Barbana, N. (2020). Potential and Feasibility Study of Hybrid Wind–Hydroelectric Power System with Water-Pumping Storage: Jordan as a Case Study. Applied Sciences, 10(9), 3332. https://www.mdpi.com/2076-3417/10/9/3332. [CrossRef]
- Tardy, A. (2022). Wind energy storage design for a grid-isolated mining company: feasibility of hydraulic pumped storage (Doctoral dissertation, École de technologie supérieure). https://espace.etsmtl.ca/id/eprint/3112.
- Belghit, M., Araissia, I., & Encadre par Hadjab, A. (2023). Design and production of a transmission system for a water pumping wind turbine (Doctoral dissertation). http://dspace.univtebessa.dz:8080/jspui/handle/123456789/http//localhost:8080/jspui/handle/123456789/10522.
- Khan, ZA, Imran, M., Altamimi, A., Diemuodeke, OE, & Abdelatif, AO (2021). Assessment of hybrid wind and solar energy for agricultural applications in Sudan. Energies, 15 (1), 5. https://www.mdpi.com/1996-1073/15/1/5#. [CrossRef]
- Tonsie Djiela, R. H., Tiam Kapen, P., & Tchuen, G. (2021). Wind energy of Cameroon by determining Weibull parameters: potential of a environmentally friendly energy. International Journal of Environmental Science and Technology, 18, 2251-2270. [CrossRef]
- Olong, G., Eke, S., Boum, A., Manyol, M., Biboum, A., & Mouangue, R. (2023). Assessment of the conventional energy potential in cameroon: the use of wind, small hydro and solar technologies as alternatives solutions. International Journal of Renewable Energy Research (IJRER), doi, 10. [CrossRef]
- Kidmo, D. K., Deli, K., & Bogno, B. (2021). Status of renewable energy in Cameroon. Renewable energy and environmental sustainability, 6, 2. https://www.rees-journal.org/articles/rees/abs/2021/01/rees200017/rees200017.html#:~:text=https%3A//doi.org/10.1051/rees/2021001. [CrossRef]
- Song, H., Marshall, J., McGillicuddy Jr, D. J., & Seo, H. (2020). Impact of current-wind interaction on vertical processes in the Southern Ocean. Journal of Geophysical Research: Oceans, 125(4), e2020JC016046. [CrossRef]
- Teimourian, A., Bahrami, A., Teimourian, H., Vala, M., & Oraj Huseyniklioglu, A. (2020). Assessment of wind energy potential in the southeastern province of Iran. Energy Sources, Part A: Recovery, Utilization, and Environmental Effects, 42(3), 329-343. [CrossRef]
- Patel, M. R., & Beik, O. (2021). Wind and solar power systems: design, analysis, and operation. CRC press. [CrossRef]
- Kapen, PT, Gouajio, MJ, & Yemélé, D. (2020). Analysis and effective comparison of ten numerical methods for estimating Weibull parameters for wind potential: application to the town of Bafoussam, Cameroon. Energies Renouvelables , 159 , 1188-1198. [CrossRef]
- Kaoga, DK, Danwe, R., Yamigno, SD, & Djongyang, N. (2014). Performance analysis of Weibull parameter estimation methods for wind speed distribution in Maroua district. Journal of Fundamental and Applied Sciences, 6 (2), 153-174. https://www.ajol.info/index.php/jfas/article/view/120930#:~:text=DOI%3A-,10.4314/jfas.v6i2.3,-Mots%20cl%C3%A9s%3A.
- Aras, M. (2021). Renewable energy and cross-border cooperation: multi-level governance of the energy planning process. VertigO-la revue électronique en sciences de l'environnement, 21(1). [CrossRef]
- Gormo, VG, Kidmo, DK, Ngoussandou, BP, Bogno, B., Raidandi, D., & Aillerie, M. (2021). Wind energy as an alternative to support energy needs in Garoua and Guider, northern region of Cameroon. Energy reports, 7 , 814-829. [CrossRef]
- Ouedraogo, S., Lolo, K., Attipou, K., Ajavon, ASA, & Tiem, S. (2020). Assessment of wind energy potential for water pumping in the Sahelian zone of Burkina Faso. Int. J. Eng. Res. Technol , 9 , 231-243. https://pdfs.semanticscholar.org/d87a/63df7ec7daf5afdd2dbdb241ed1789ba6c05.pdf.
- McKenna, R., Pfenninger, S., Heinrichs, H., Schmidt, J., Staffell, I., Bauer, C., ... & Wohland, J. (2022). High-resolution large-scale onshore wind energy assessments: A review of potential definitions, methodologies and future research needs. Renewable Energy, 182, 659-684. [CrossRef]
- Chaurasiya, P. K., Kumar, V. K., Warudkar, V., & Ahmed, S. (2021). Evaluation of wind energy potential and estimation of wind turbine characteristics for two different sites. International Journal of Ambient Energy, 42(12), 1409-1419. [CrossRef]
- Todeschini, D., Fagiano, L., Micheli, C., & Cattano, A. (2021). Control of a rigid wing pumping Airborne Wind Energy system in all operational phases. Control Engineering Practice, 111, 104794. [CrossRef]
- Samal, R. K. (2021). Assessment of wind energy potential using reanalysis data: A comparison with mast measurements. Journal of Cleaner Production, 313, 127933. [CrossRef]
- Algieri, A., Zema, D. A., Nicotra, A., & Zimbone, S. M. (2020). Potential energy exploitation in collective irrigation systems using pumps as turbines: A case study in Calabria (Southern Italy). Journal of Cleaner Production, 257, 120538. [CrossRef]
- Safari, M. A. M., Masseran, N., & Majid, M. H. A. (2022). Wind energy potential assessment using Weibull distribution with various numerical estimation methods: a case study in Mersing and Port Dickson, Malaysia. Theoretical and Applied Climatology, 148(3), 1085-1110. [CrossRef]
- Matthew, C. (2024). The multiple benefits of current and potential energy efficiency policies: A Scottish islands case study. Energy Policy, 187, 114032. [CrossRef]
- Madougou, S. (2010). Study of the wind potential of the night jet in the Sahelian zone based on wind profiler radar observations (Doctoral dissertation, Université Paul Sabatier-Toulouse III). https://theses.hal.science/tel-00530163/.
- Nikolaou, T., Stavrakakis, G. S., & Tsamoudalis, K. (2020). Modeling and optimal dimensioning of a pumped hydro energy storage system for the exploitation of the rejected wind energy in the non-interconnected electrical power system of the Crete island, Greece. Energies, 13(11), 2705. [CrossRef]
- Saeed, T. M. (2020). Sustainable energy potential in Sudan. Journal of Engineering and Computer Science (JECS), 20(3), 1-10. https://www.researchgate.net/profile/Eisa-M-Tayeb/publication/362668611_Renewable_Energy_Sustainable_in_Sudan/links/62f7869379550d6d1c78fc8c/Renewable-Energy-Sustainable-in-Sudan.pdf.
- Al-Addous, M., Al Hmidan, S., Jaradat, M., Alasis, E., & Barbana, N. (2020). Potential and Feasibility Study of Hybrid Wind–Hydroelectric Power System with Water-Pumping Storage: Jordan as a Case Study. Applied Sciences, 10(9), 3332. [CrossRef]
- Mahmoodi, K., Ghassemi, H., & Razminia, A. (2020). Wind energy potential assessment in the Persian Gulf: a spatial and temporal analysis. Ocean Engineering, 216, 107674. [CrossRef]
- Mossa, M. A., Gam, O., Bianchi, N., & Quynh, N. V. (2022). Enhanced control and power management for a renewable energy-based water pumping system. IEEE Access, 10, 36028-36056. [CrossRef]
- Abdelshafy, AM, Jurasz, J., Hassan, H., & Mohamed, AM (2020). Optimised energy management strategy for a grid-connected dual storage system (accumulator-pump-battery) powered by renewable energy resources. Energy , 192 , 116615. [CrossRef]
- Fadlallah, S. O., Serradj, D. E. B., & Sedzro, D. M. (2021). Is this the right time for Sudan to replace diesel-powered generator systems with wind turbines?. Renewable Energy, 180, 40-54. [CrossRef]
- Chalal, S., & Slimani, M. (2020). Preliminary Study and Analysis of Wind Potential for Energy Planning in the Tizi Ouzou Region (Doctoral dissertation, Université Mouloud Mammeri Tizi Ouzou). https://www.ummto.dz/dspace/bitstream/ummto/17674/1/Chalal%20Sofiane%2C%20Slimani%20Mohamed.pdf.
- Akbar, M., Khadim, B., & Akbar, D. (2022). Theoretical Cost Analysis of Electrical Energy for an Off-grid Island Community Using a Single 10MW Wind Turbine and Lithium-Ion Batteries. Pakistan Journal of Engineering and Technology, 5(4), 16-20. https://journals.uol.edu.pk/pakjet/article/view/2240. [CrossRef]
- Ohunakin, O. S., Matthew, O. J., Adaramola, M. S., Atiba, O. E., Adelekan, D. S., Aluko, O. O., ... & Ezekiel, V. U. (2023). Techno-economic assessment of offshore wind energy potential at selected sites in the Gulf of Guinea. Energy Conversion and Management, 288, 117110. [CrossRef]
- https://www.siemensgamesa.com/global/en/home/products-and-services.html.
- Loudière, D., & Gourbesville, P. (2020). United Nations World Water Development Report 2020-Water and Climate Change. [CrossRef]
- Paplorey, C. (2020). France's international strategy for water and sanitation 2020-2030, interview with Philippe Lacoste, Director of Sustainable Development at the Ministry of Europe and Foreign Affairs. https://www.shf-lhb.org/articles/lhb/abs/2020/02/lhb200047/lhb200047.html.
- Nediguina, M. K., Abdraman, M. A., Barka, M., & Tahir, A. M. (2022). Electric Water Pumping Powered by a Wind Turbine in North East Chad. World Journal of Applied Physics, 7(2), 21-31. http://wjapplphys.org/article/10.11648.j.wjap.20220702.12.
- Abdraman, M. A., Tahir, A. M., Zaida, J. T., & Mouangue, R. (2022). Technical-economic Analysis of Eolien Potential and Application to Date Palm at the Two Sites of the Republic of Chad. International Journal of Sustainable and Green Energy, 12(2), 58-65. https://www.researchgate.net/profile/Ruben-Mouangue/publication/365342762_Technical-economical_analysis_of_eolien_potential_and_application/links/636fac33431b1f5300925963/Technical-economical-analysis-of-eolien-potential-and-application.pdf.
Figure 1.
Map of the Bodélé triangle.
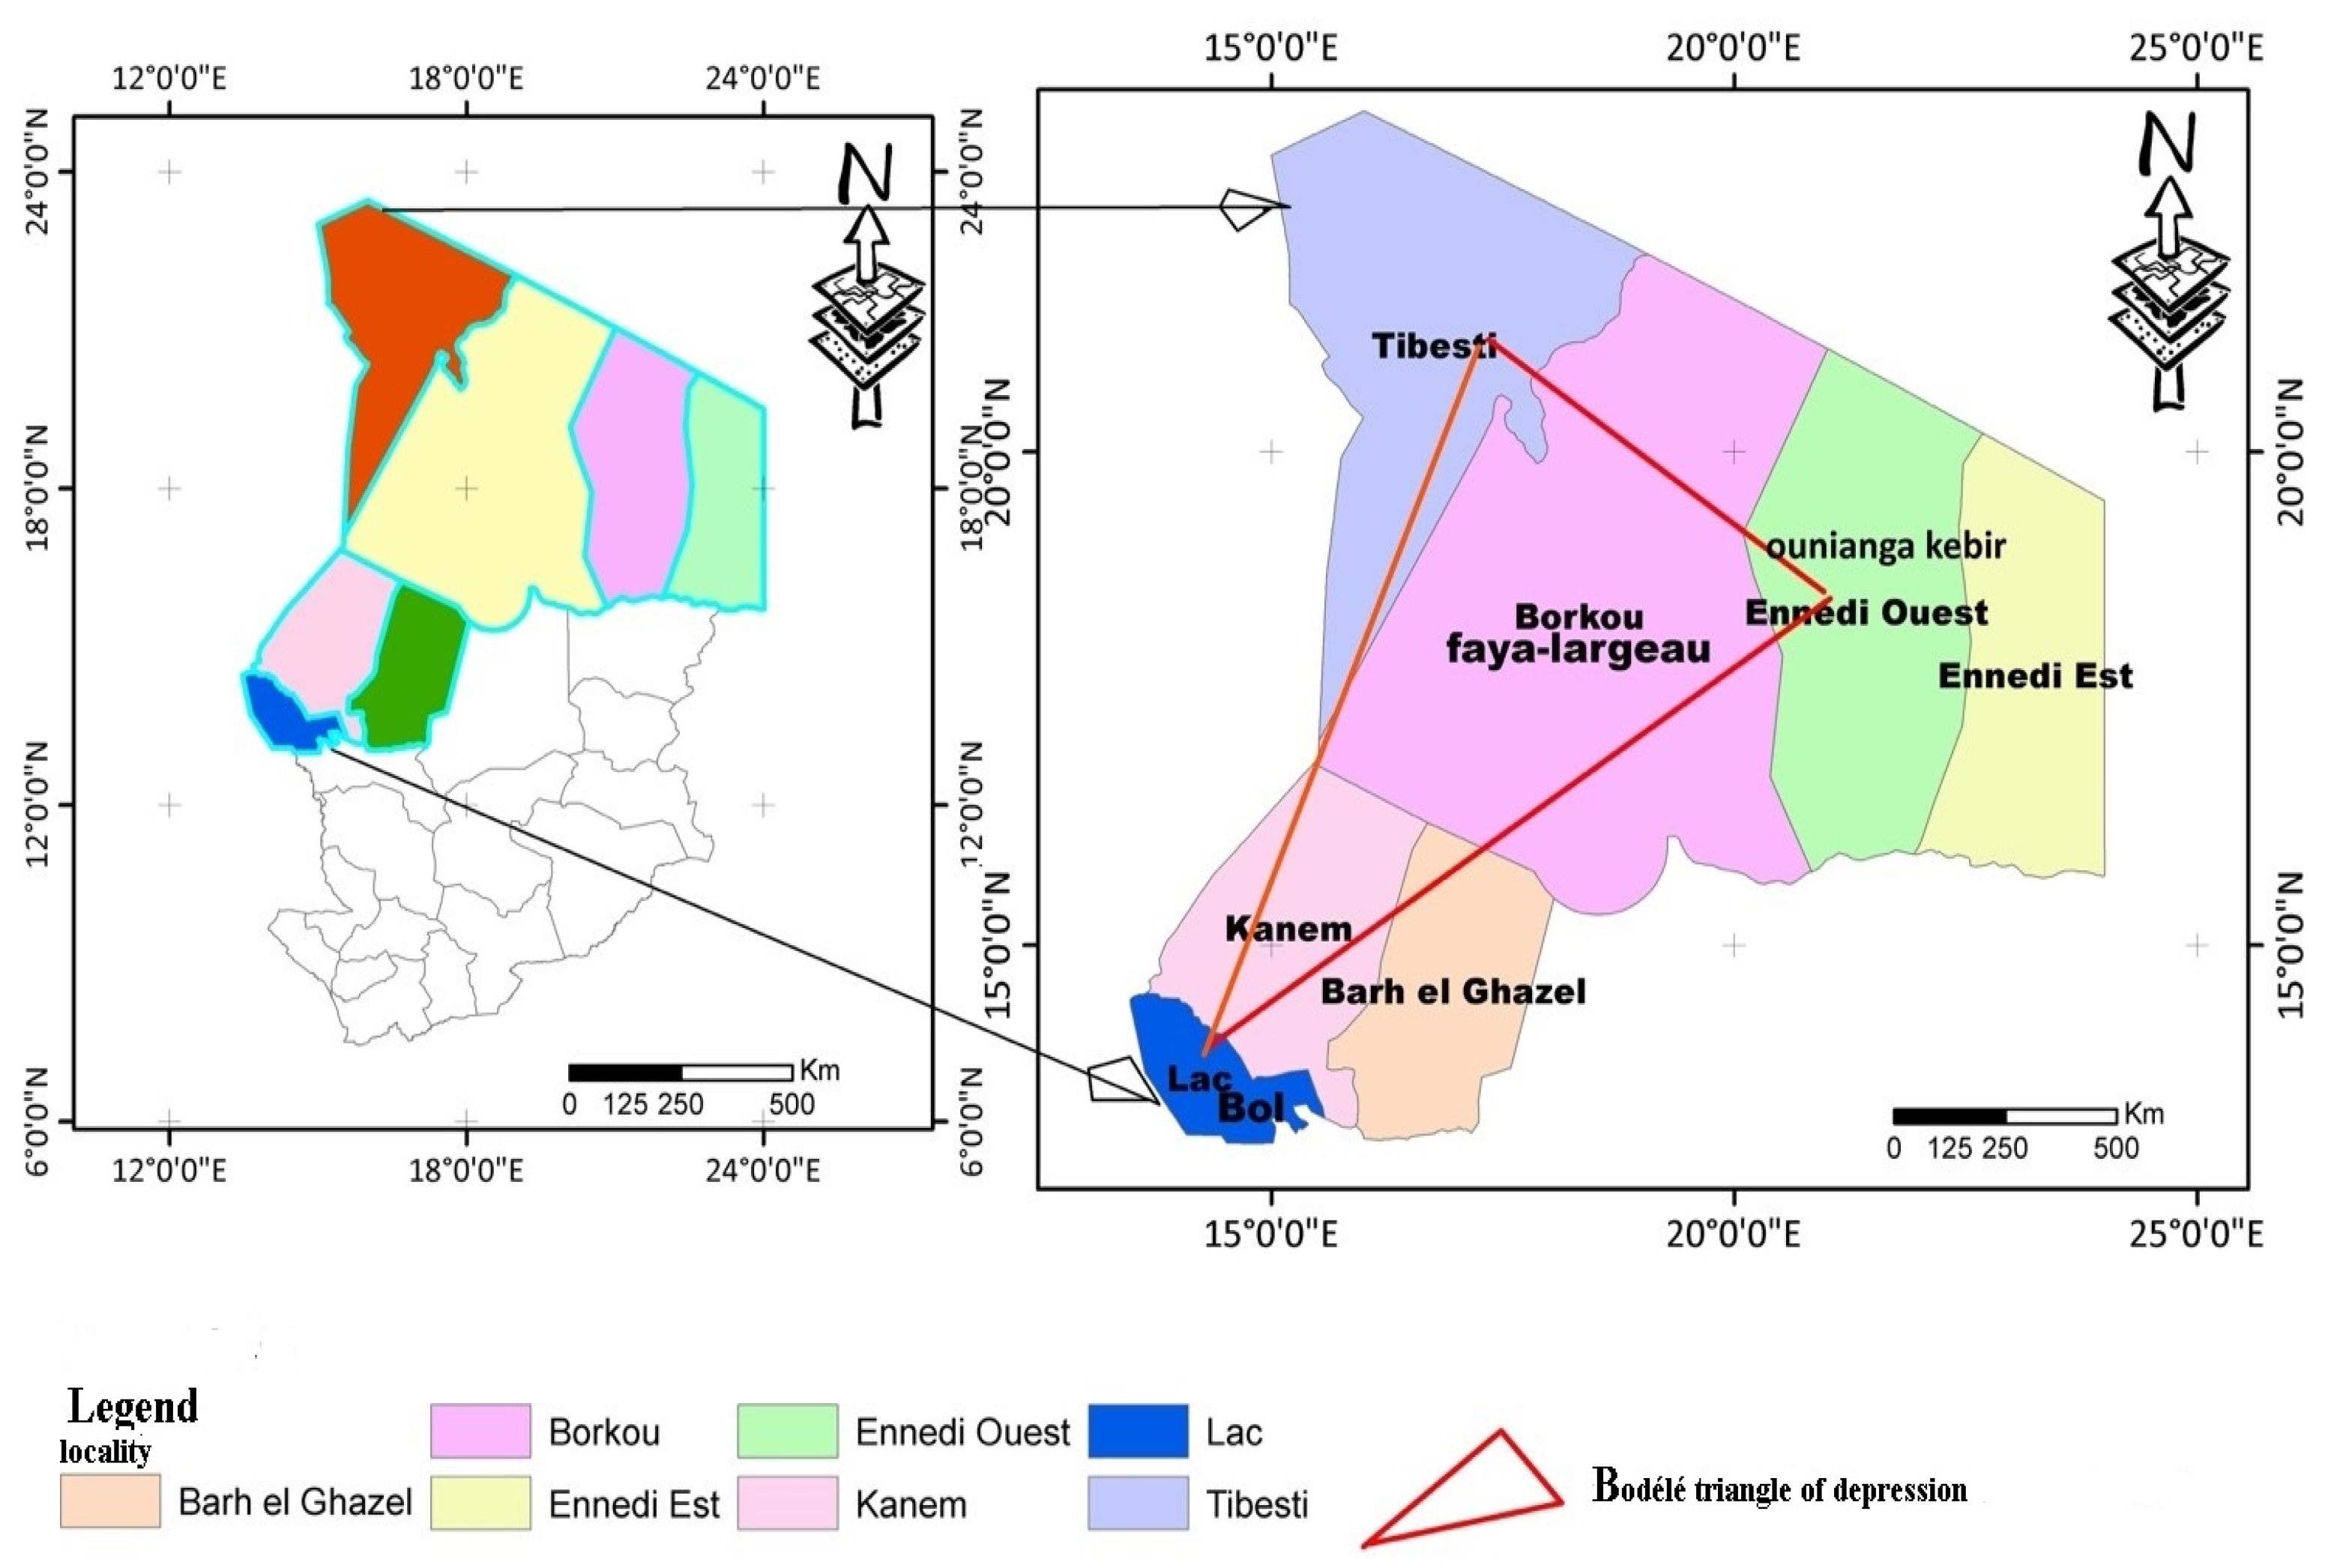
Figure 2.
High-power wind turbine performance curves.
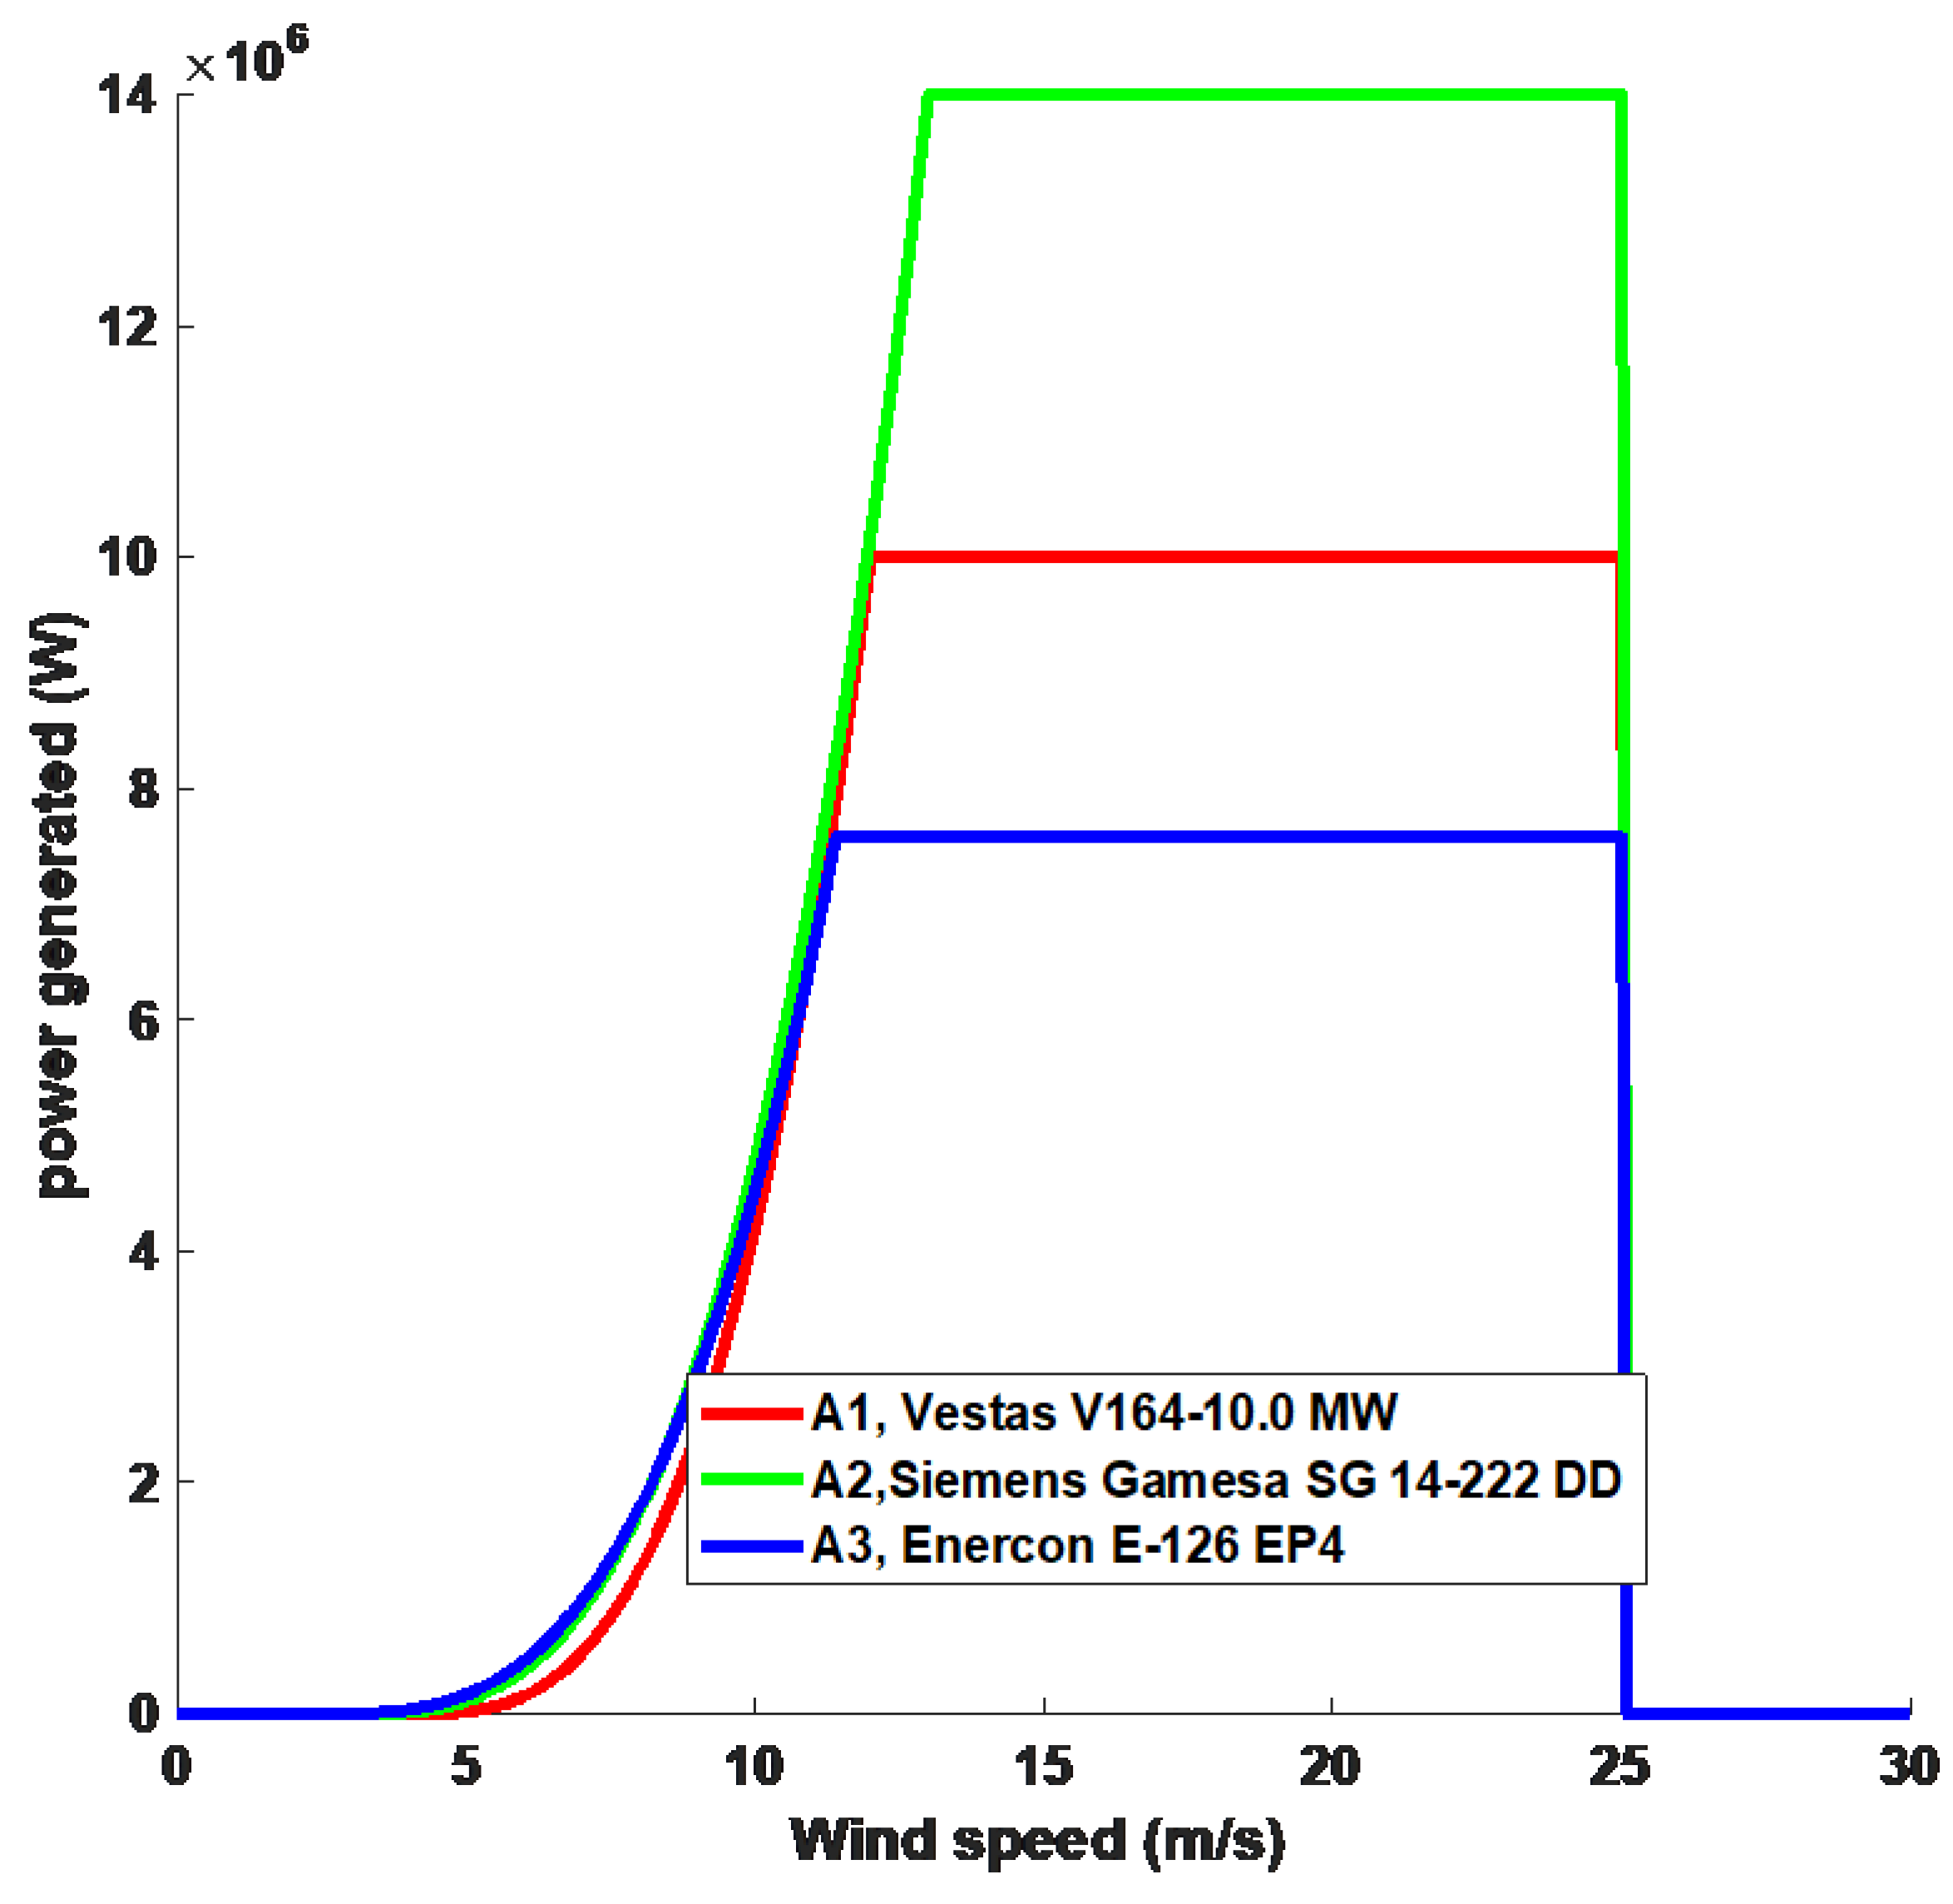
Figure 3.
KORO TORO speed distribution.
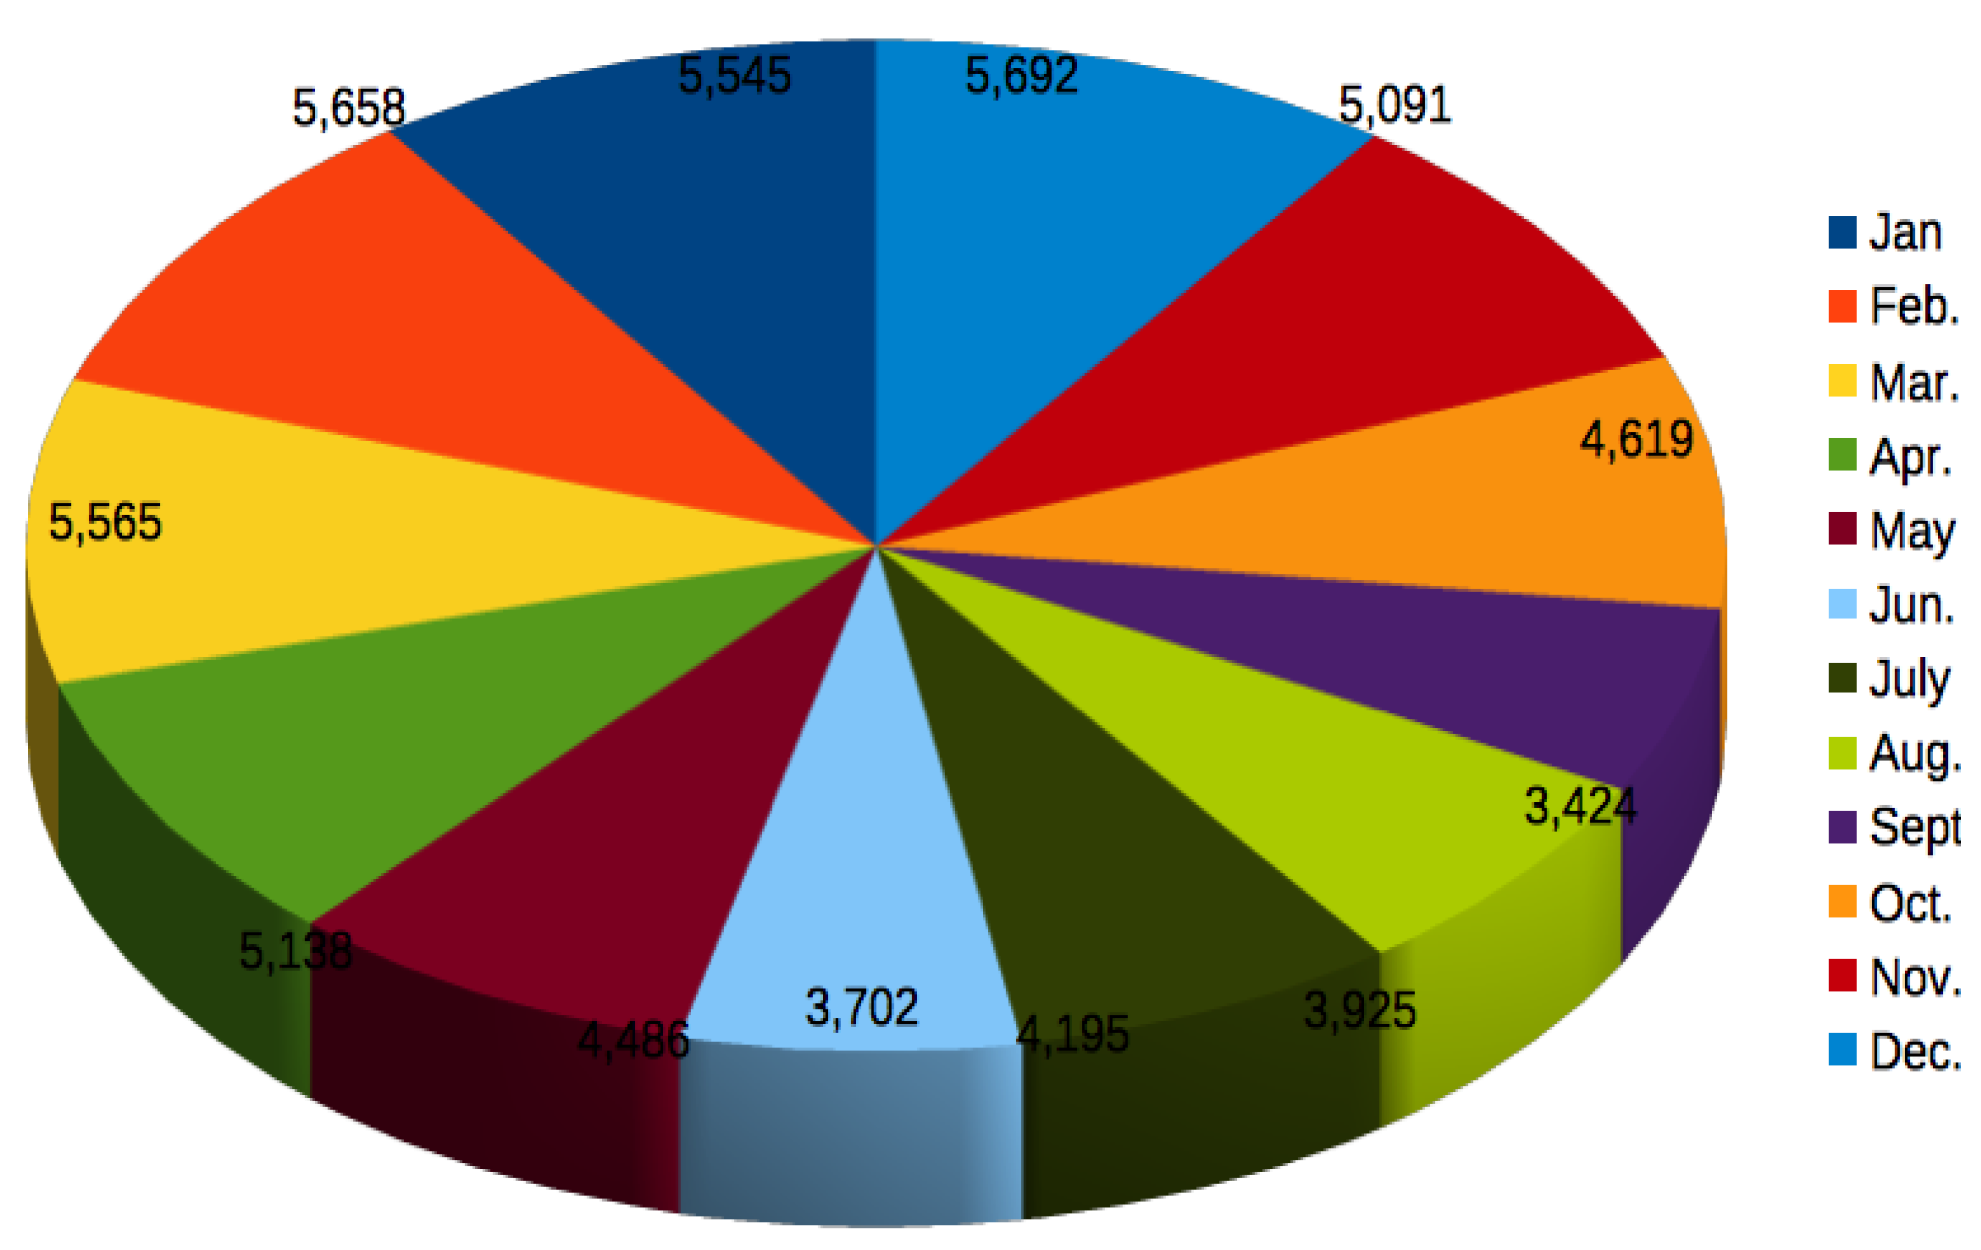
Figure 4.
Koro Toro Weibull probability density.
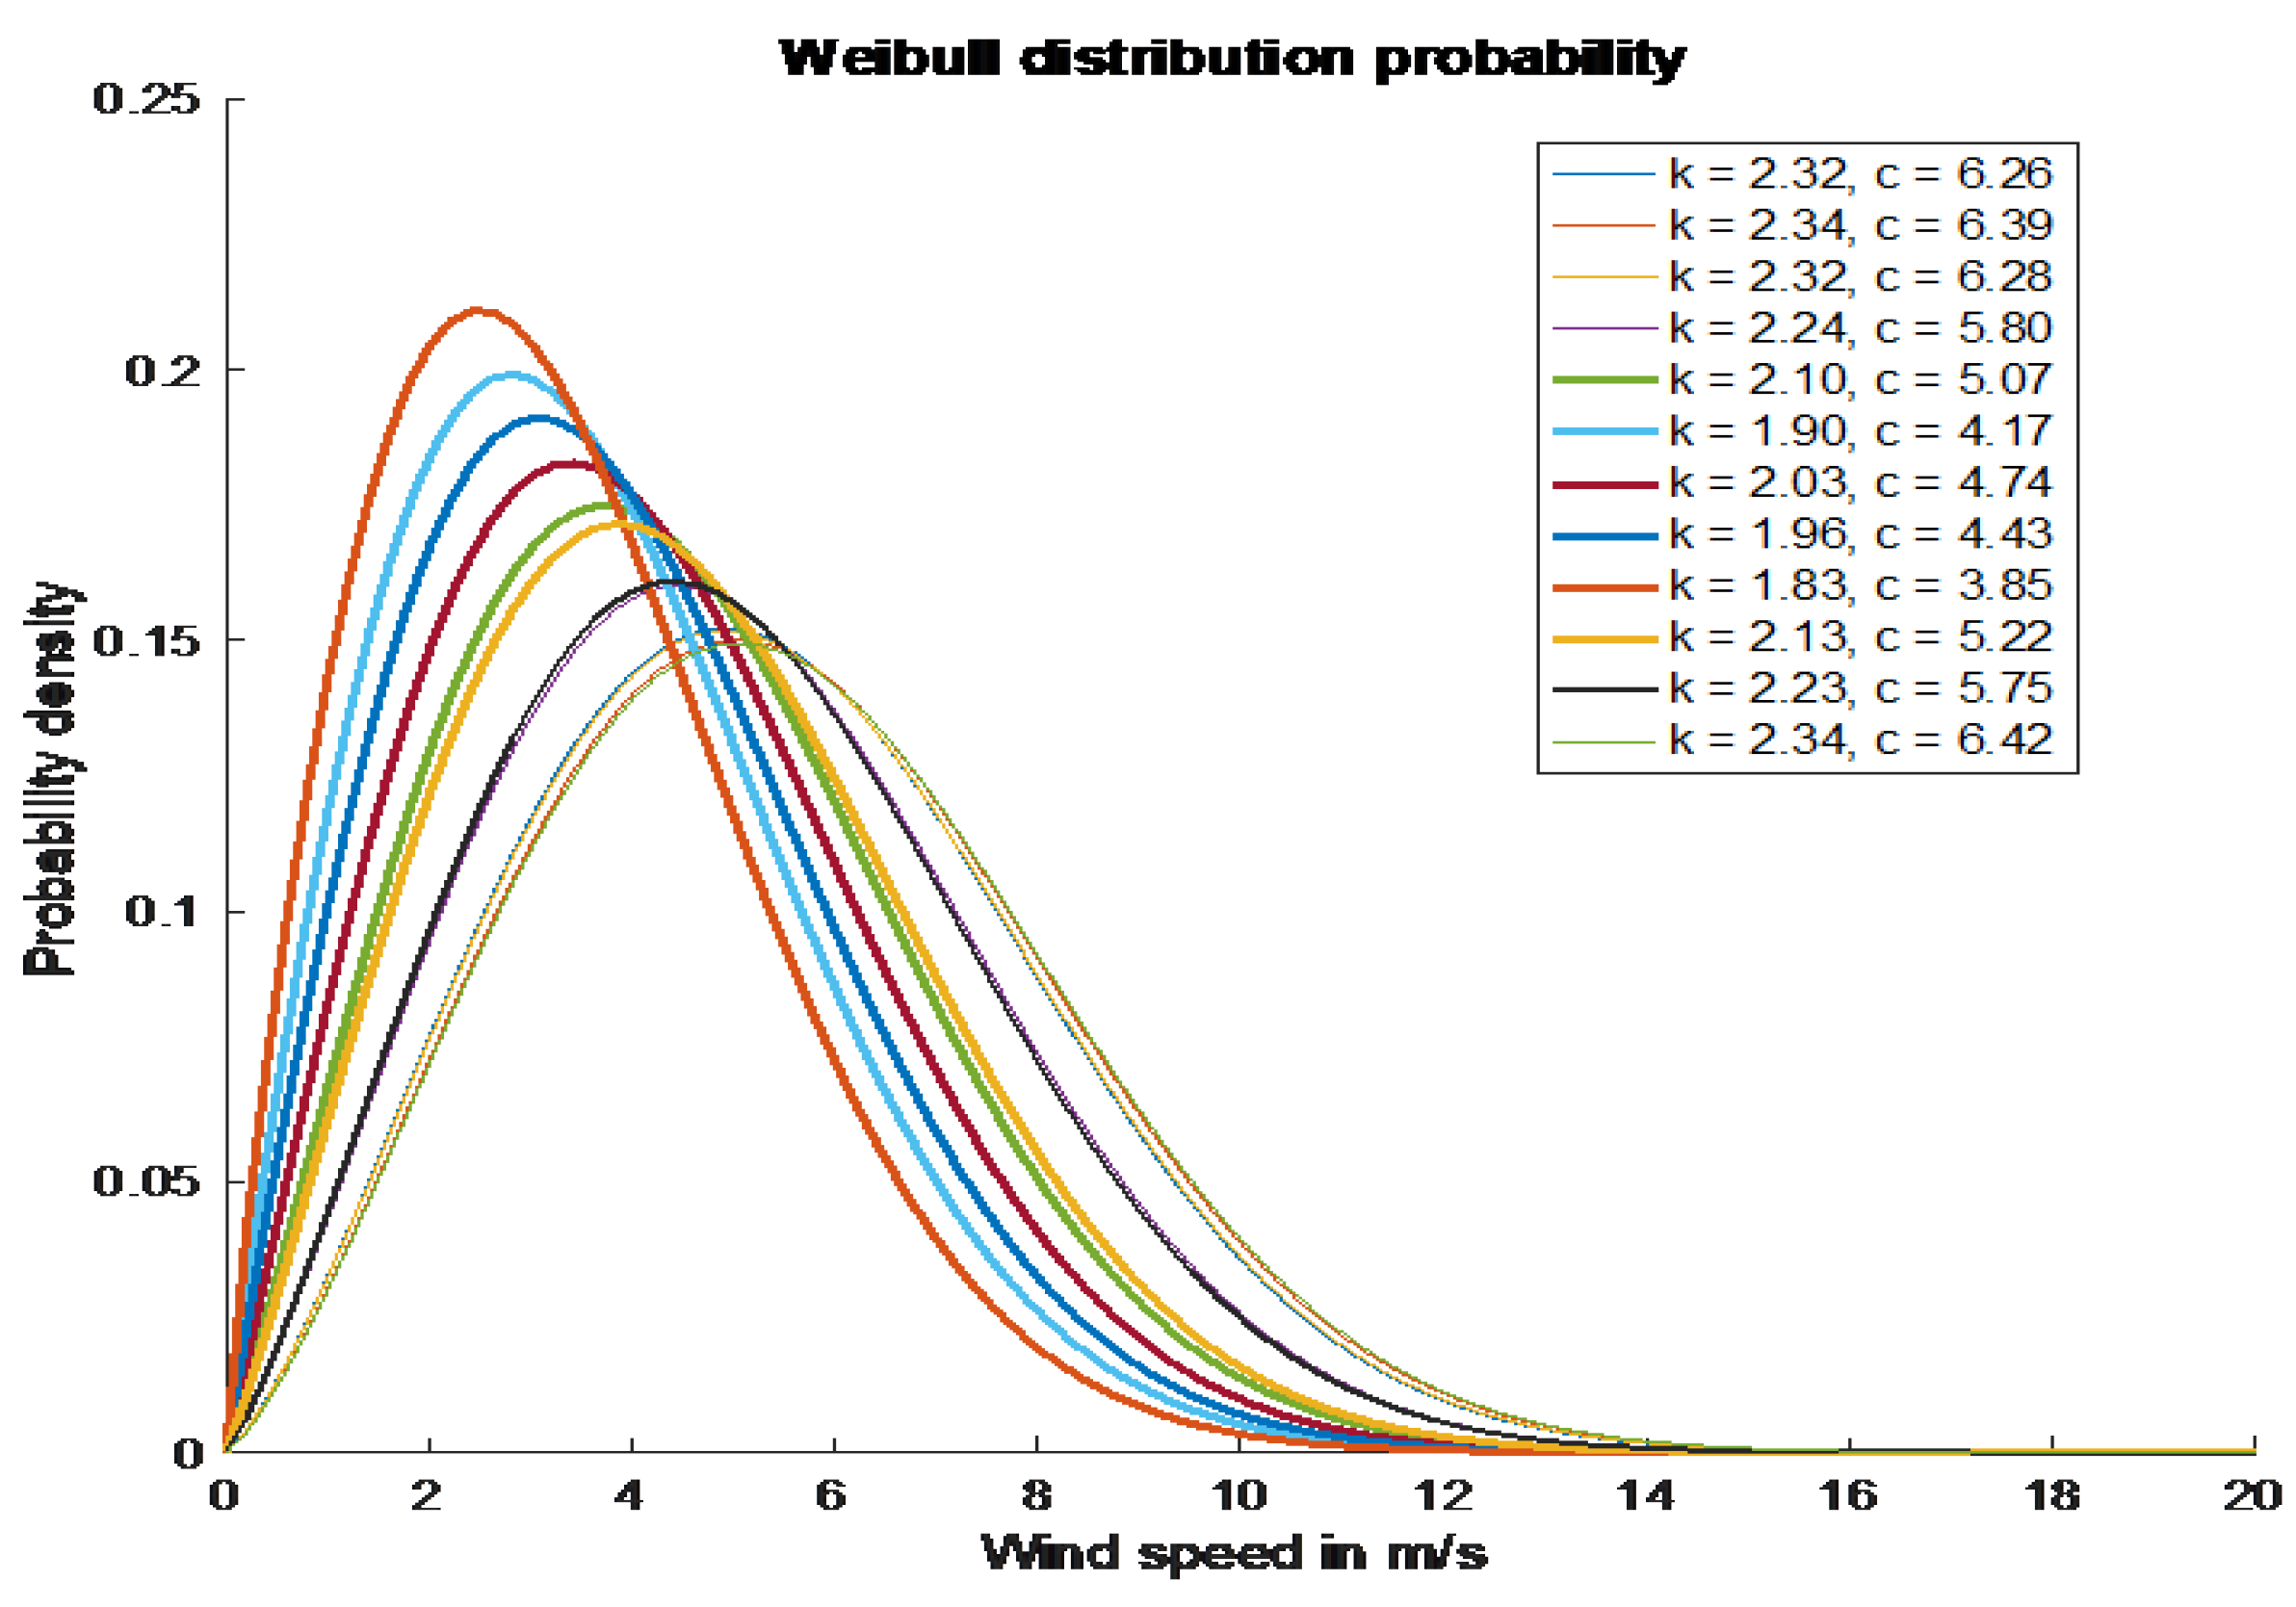
Figure 5.
NEDELEY mean speed diagram.
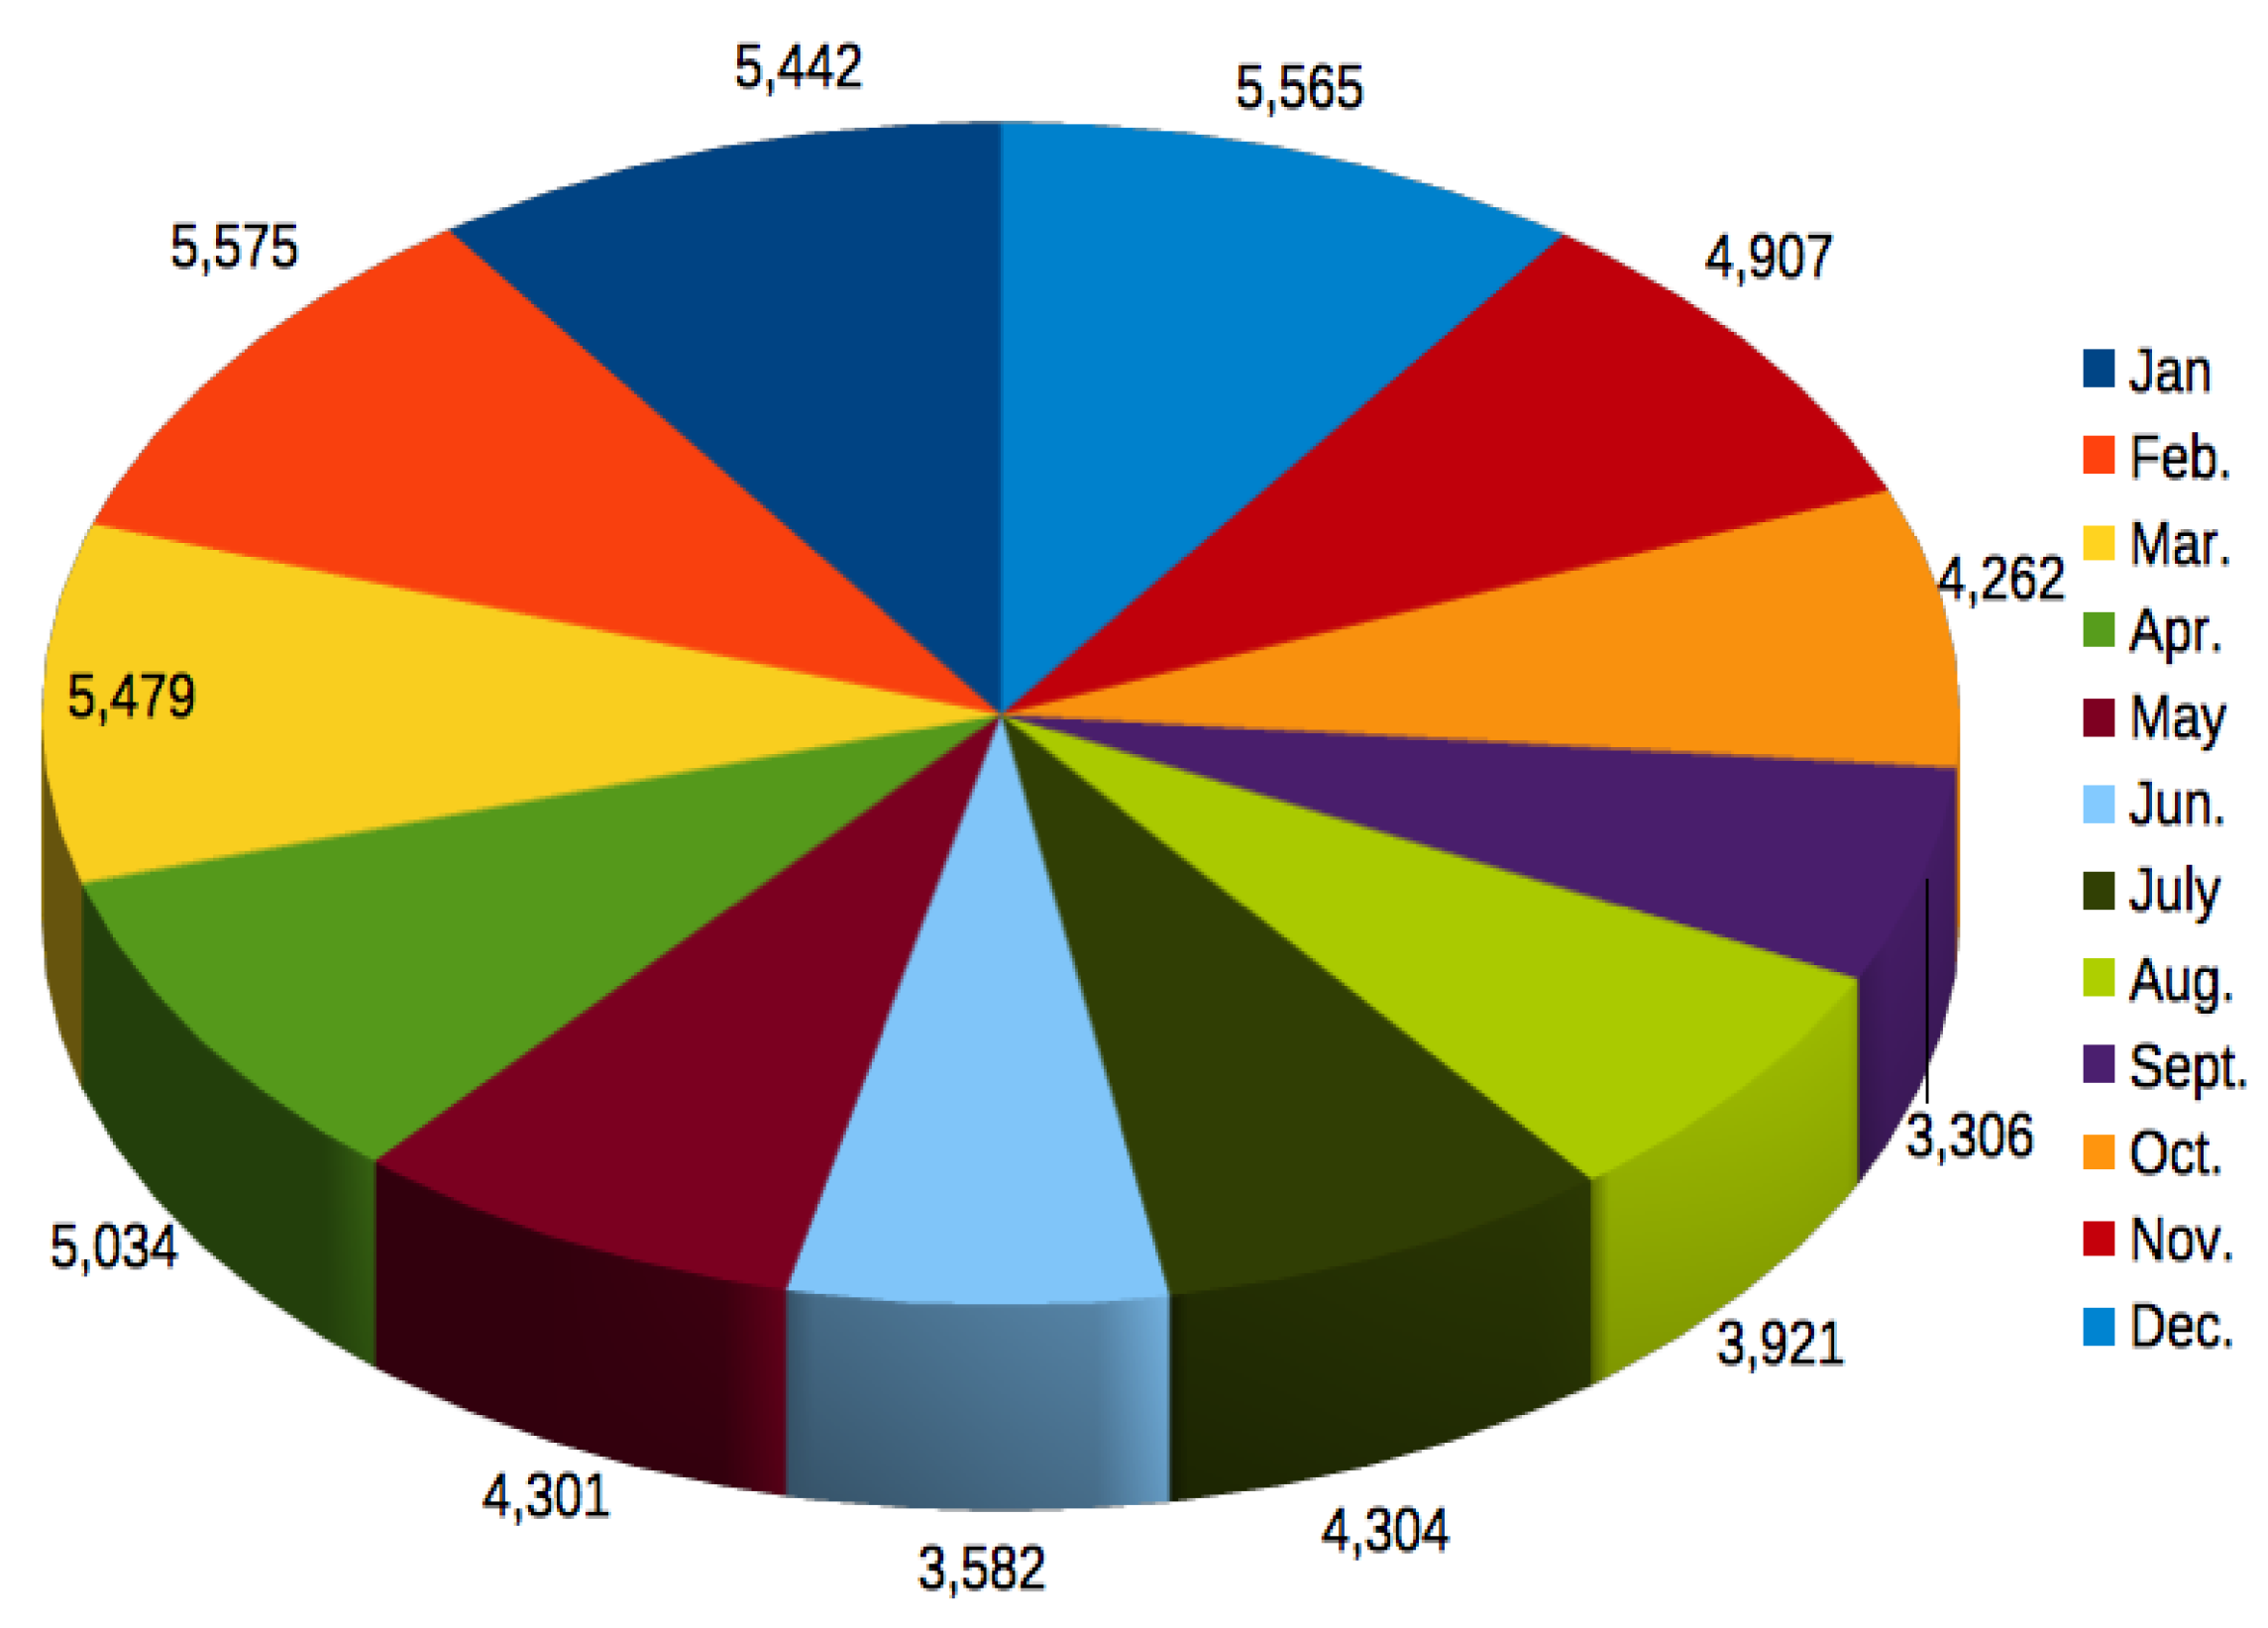
Figure 6.
Weibull probability density for Nedeley.
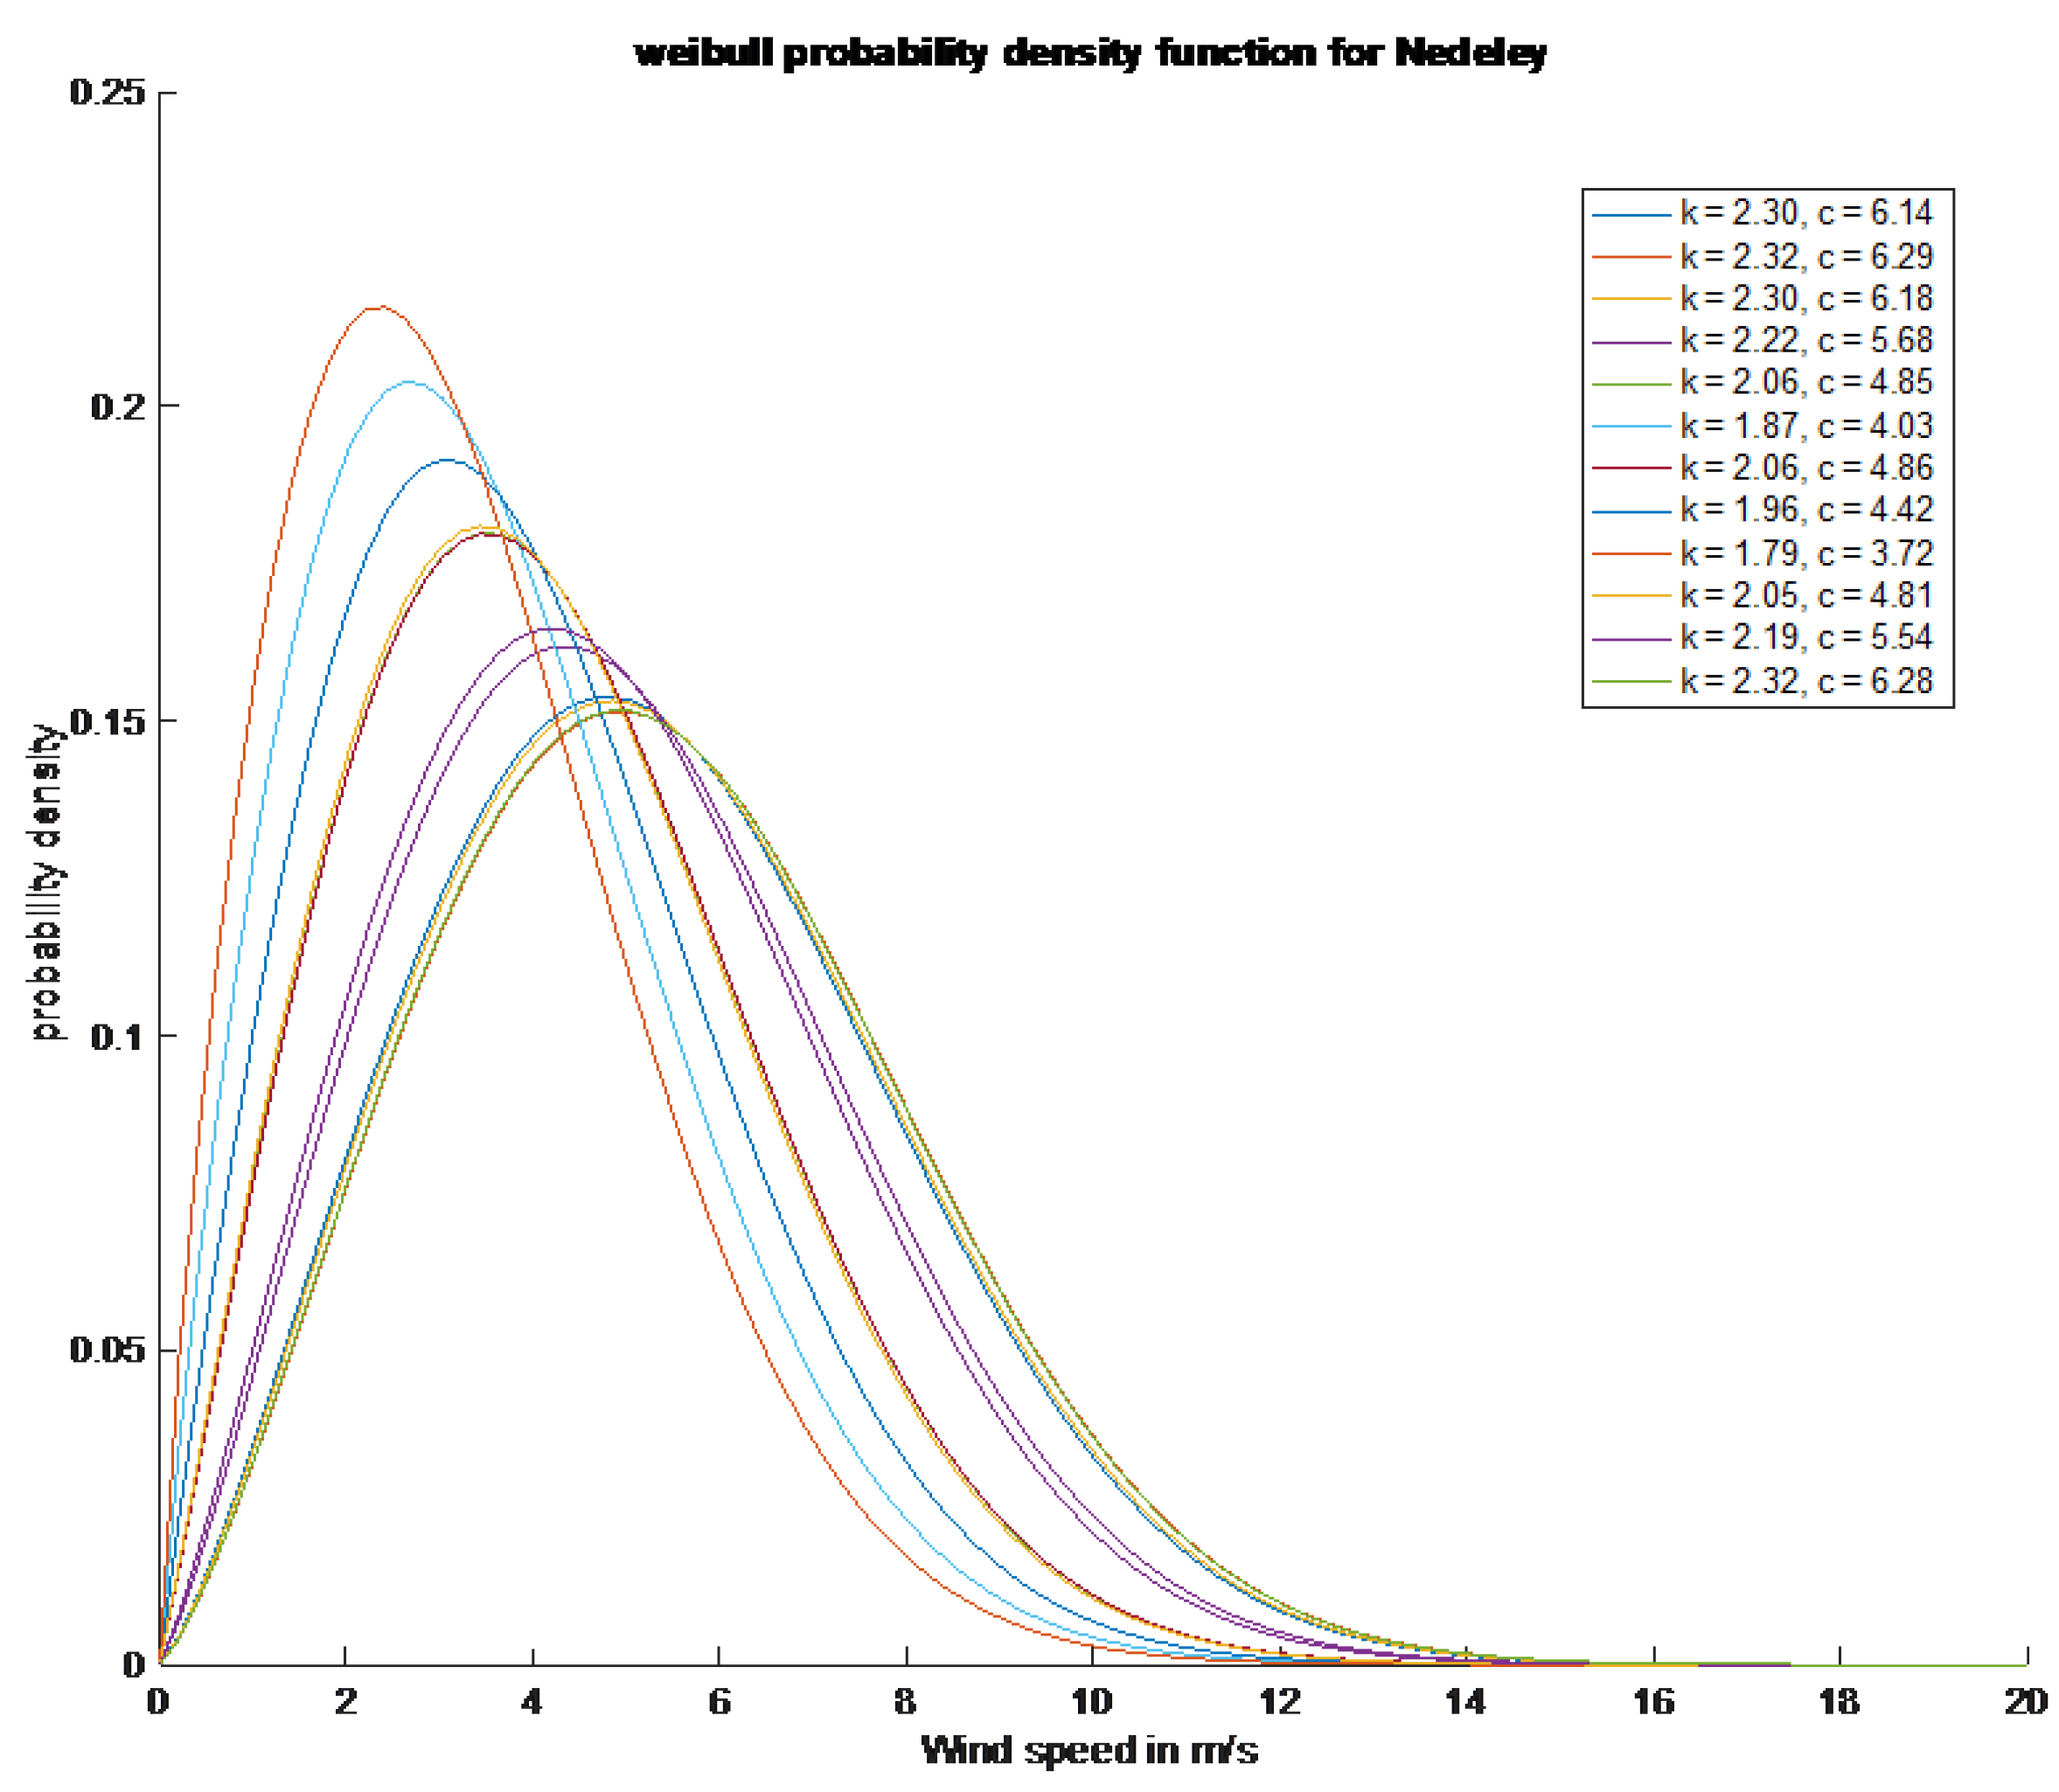
Figure 7.
Average speed of SALAL.
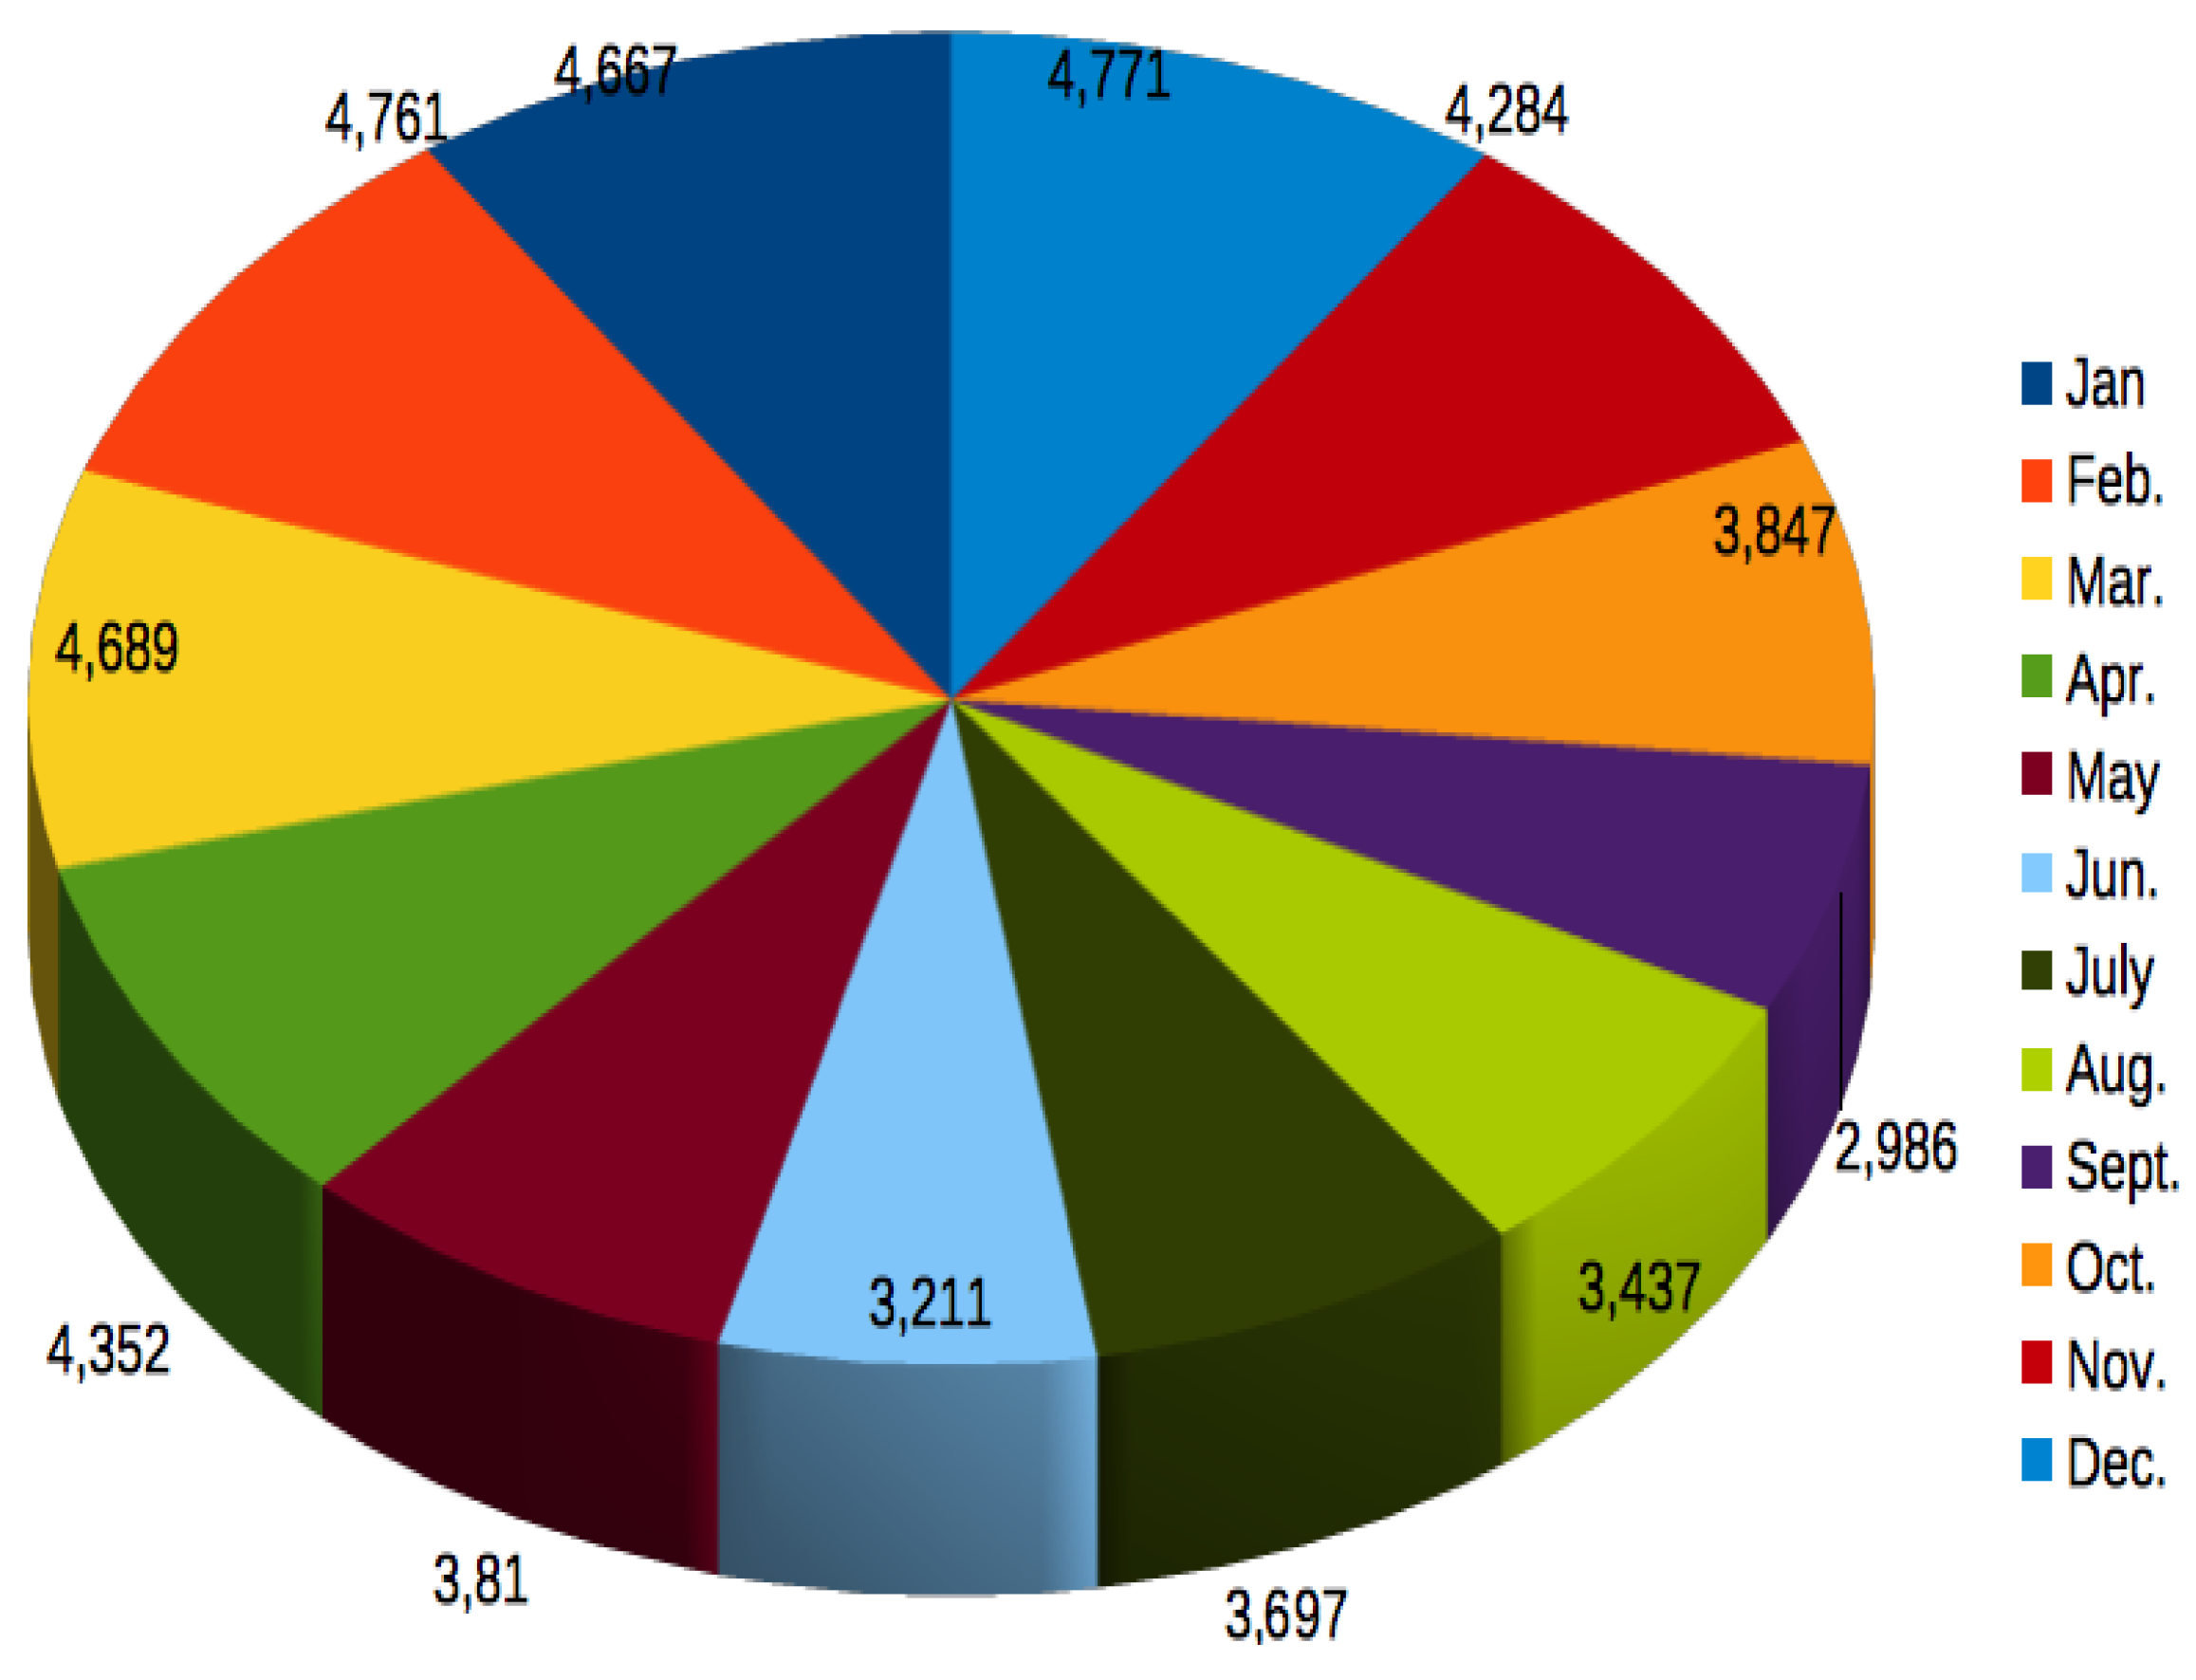
Figure 8.
Weibull probability density for Salal.
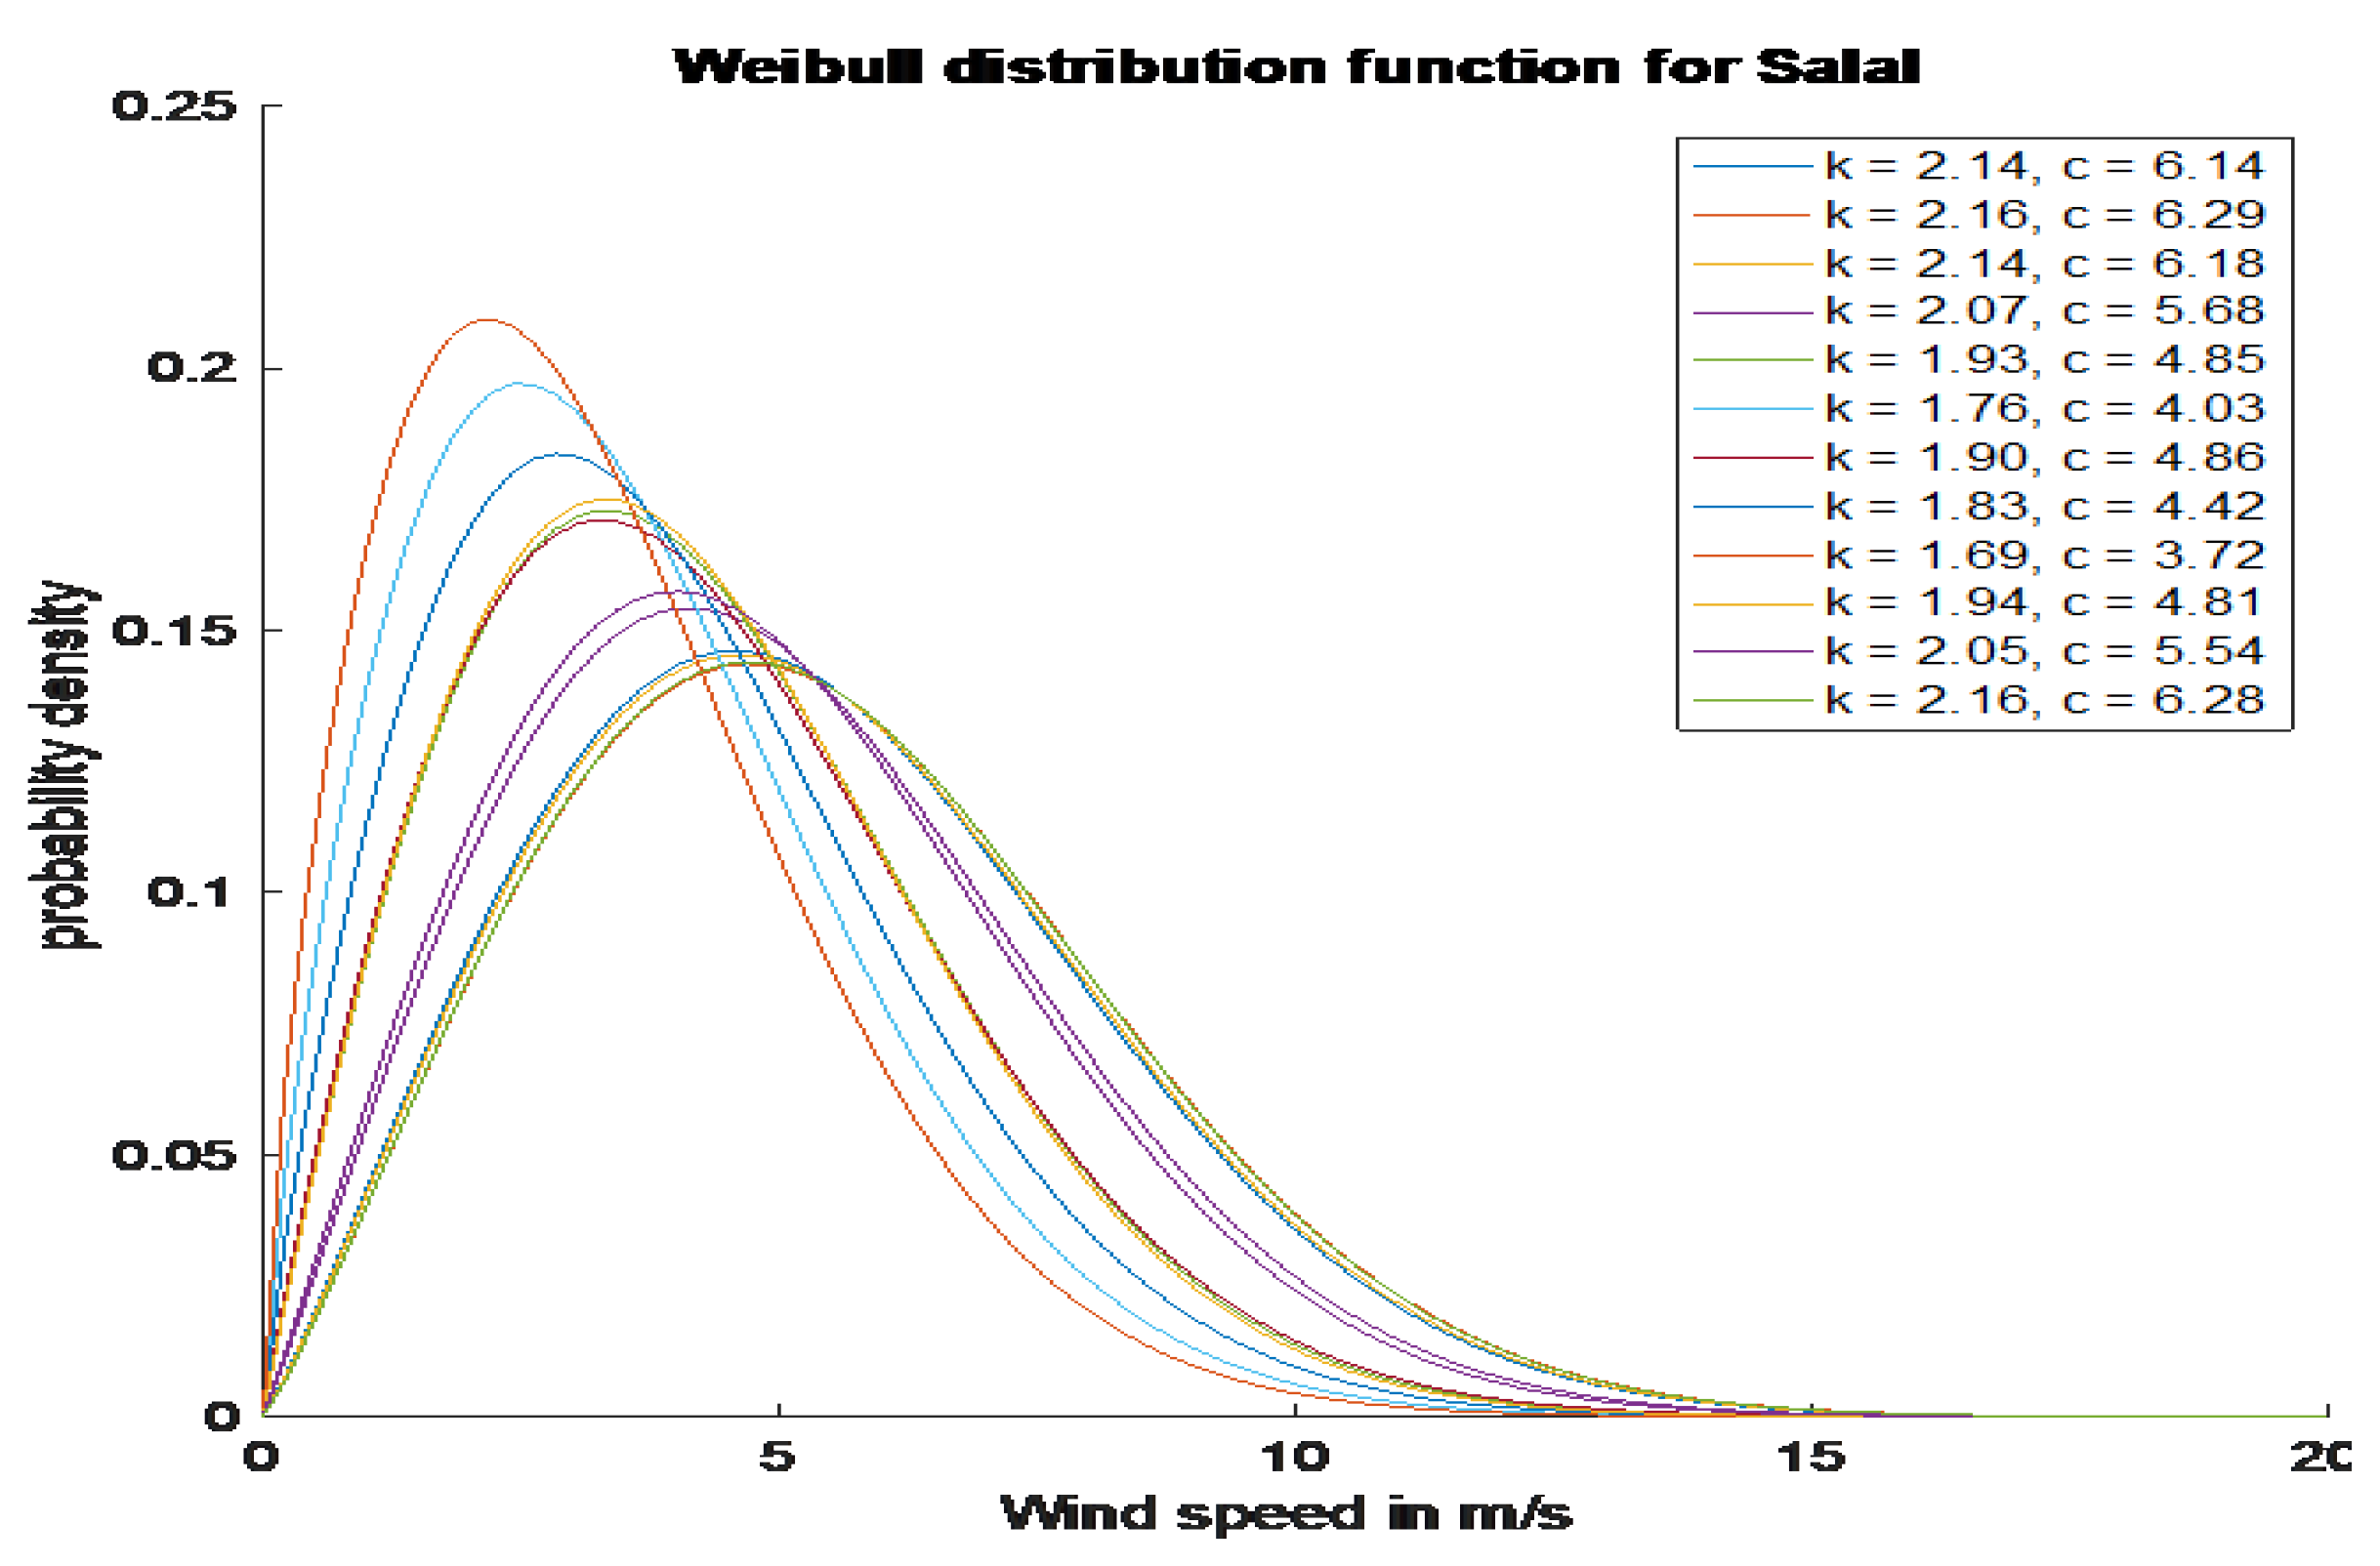
Figure 9.
Wind rose diagram of Koro toro.
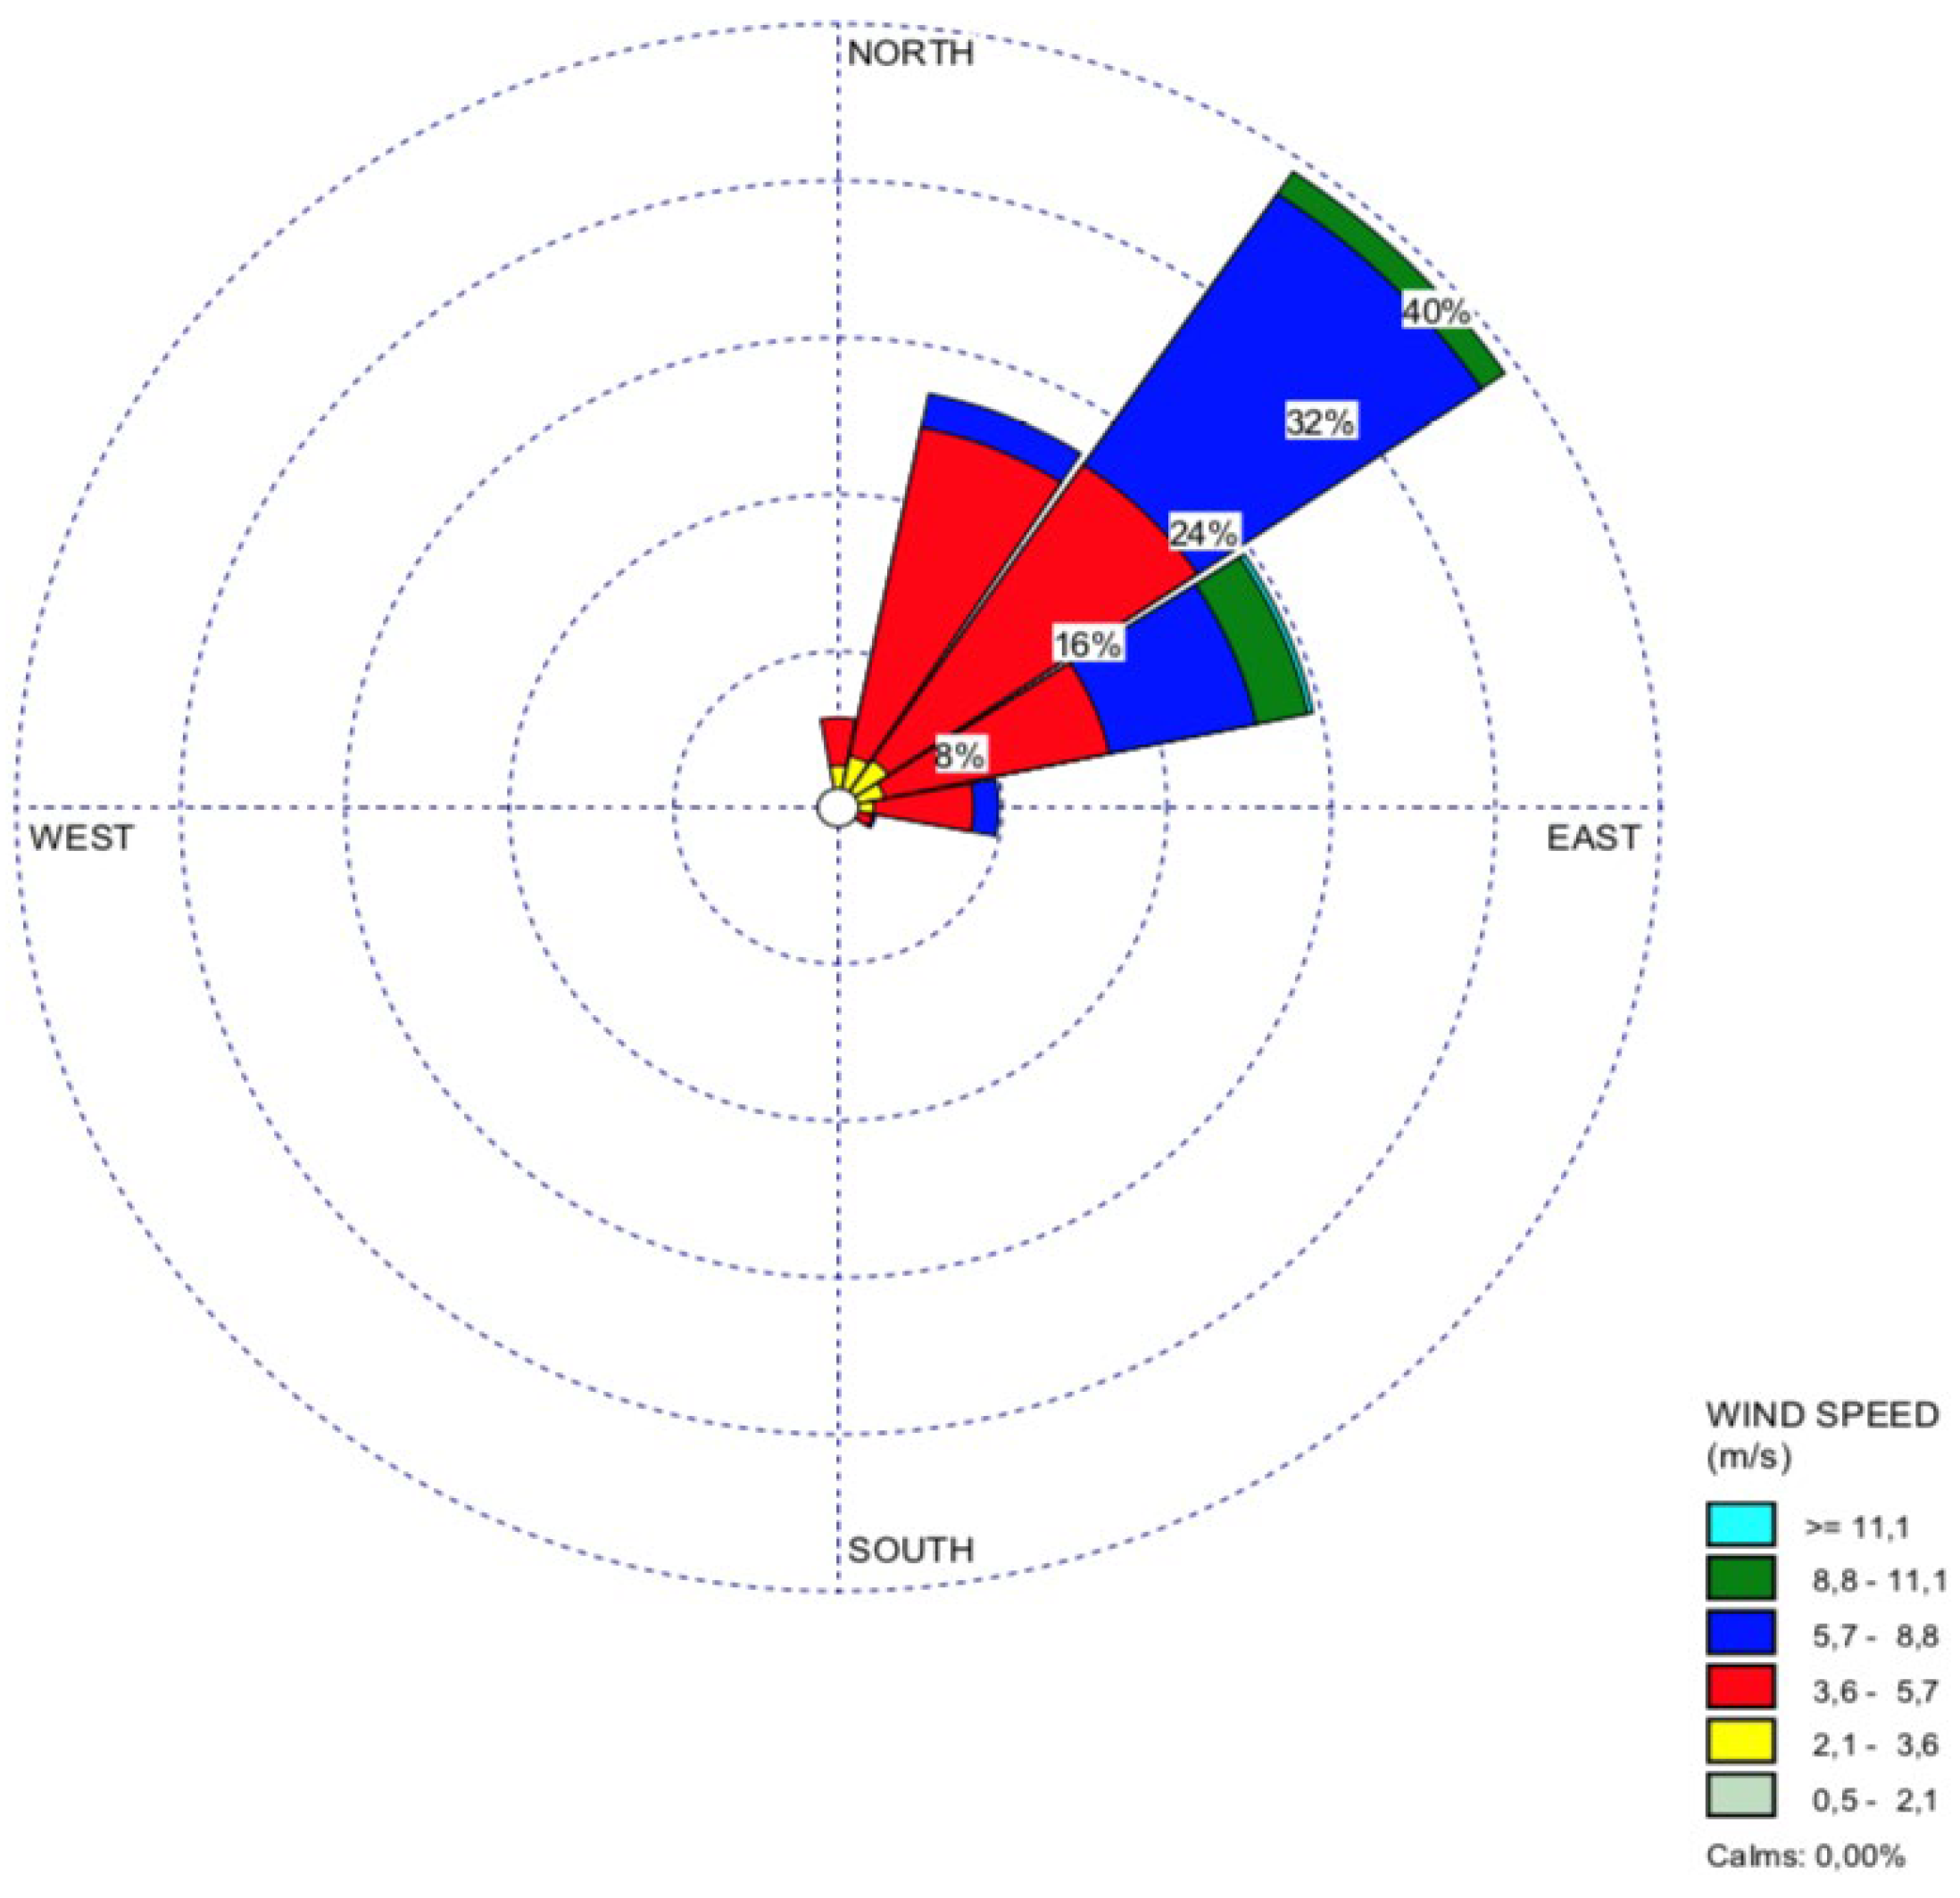
Figure 9.
Wind rose diagram of Nedeley.
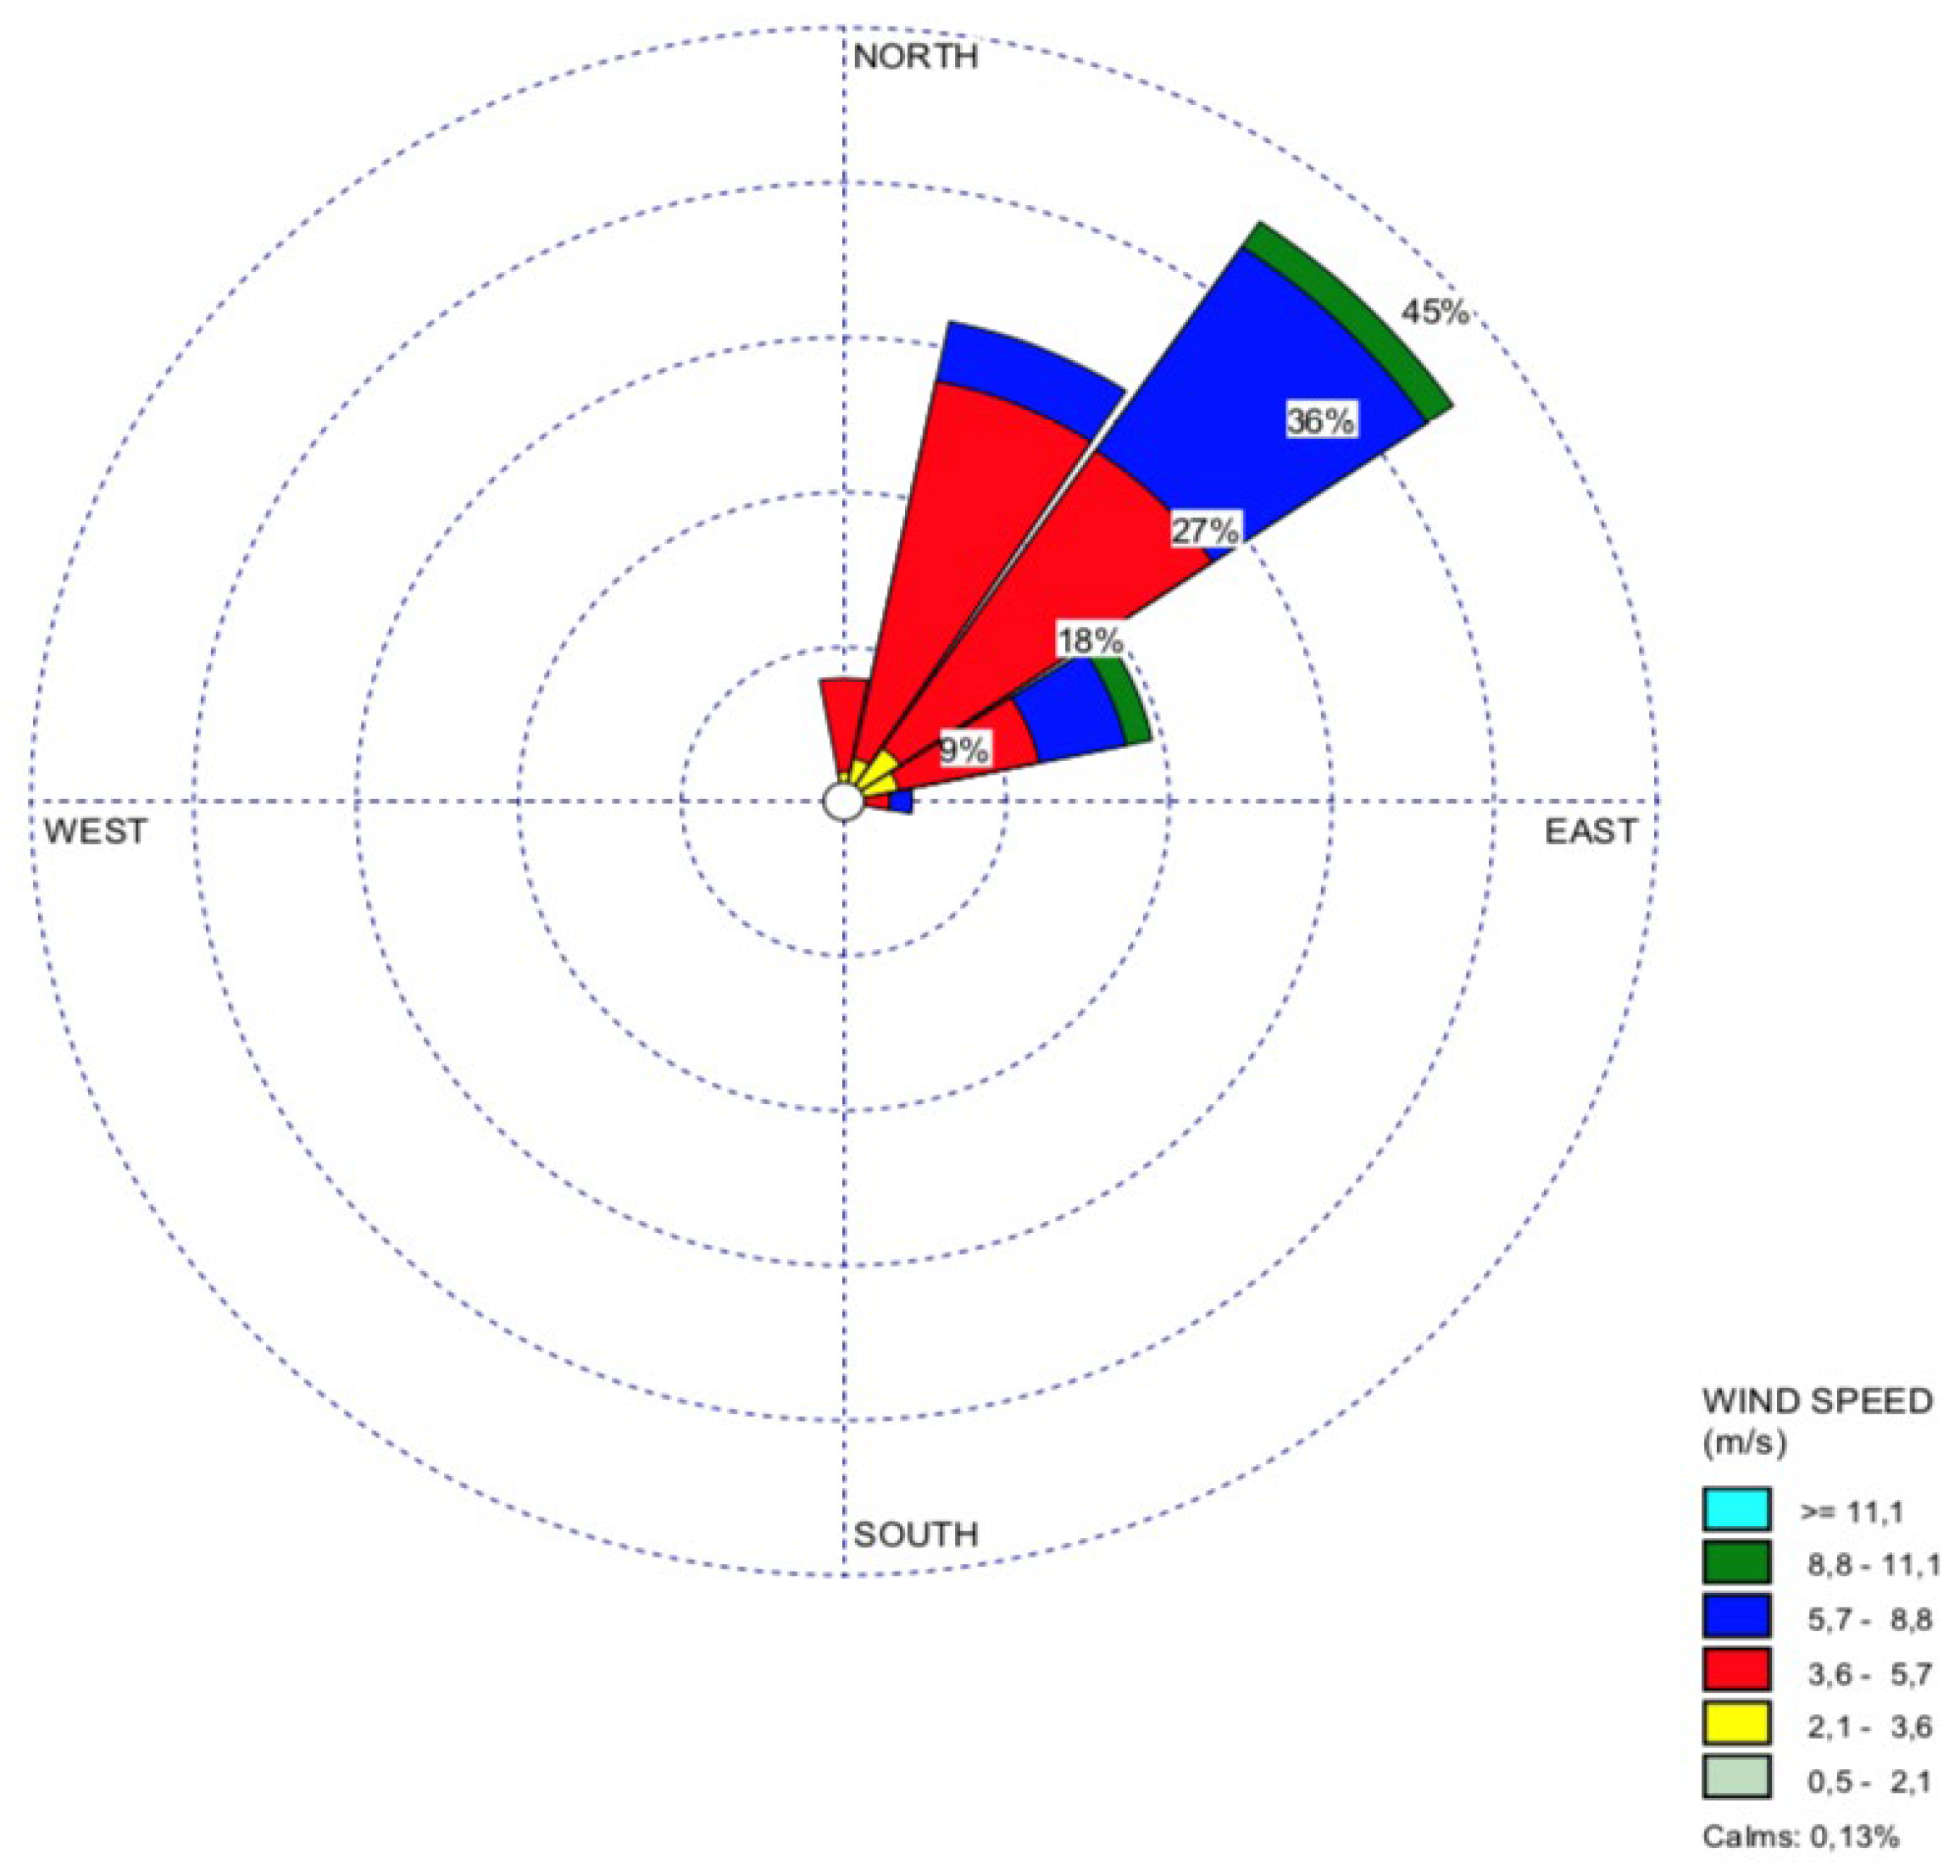
Figure 9.
Wind rose diagram of Salal.
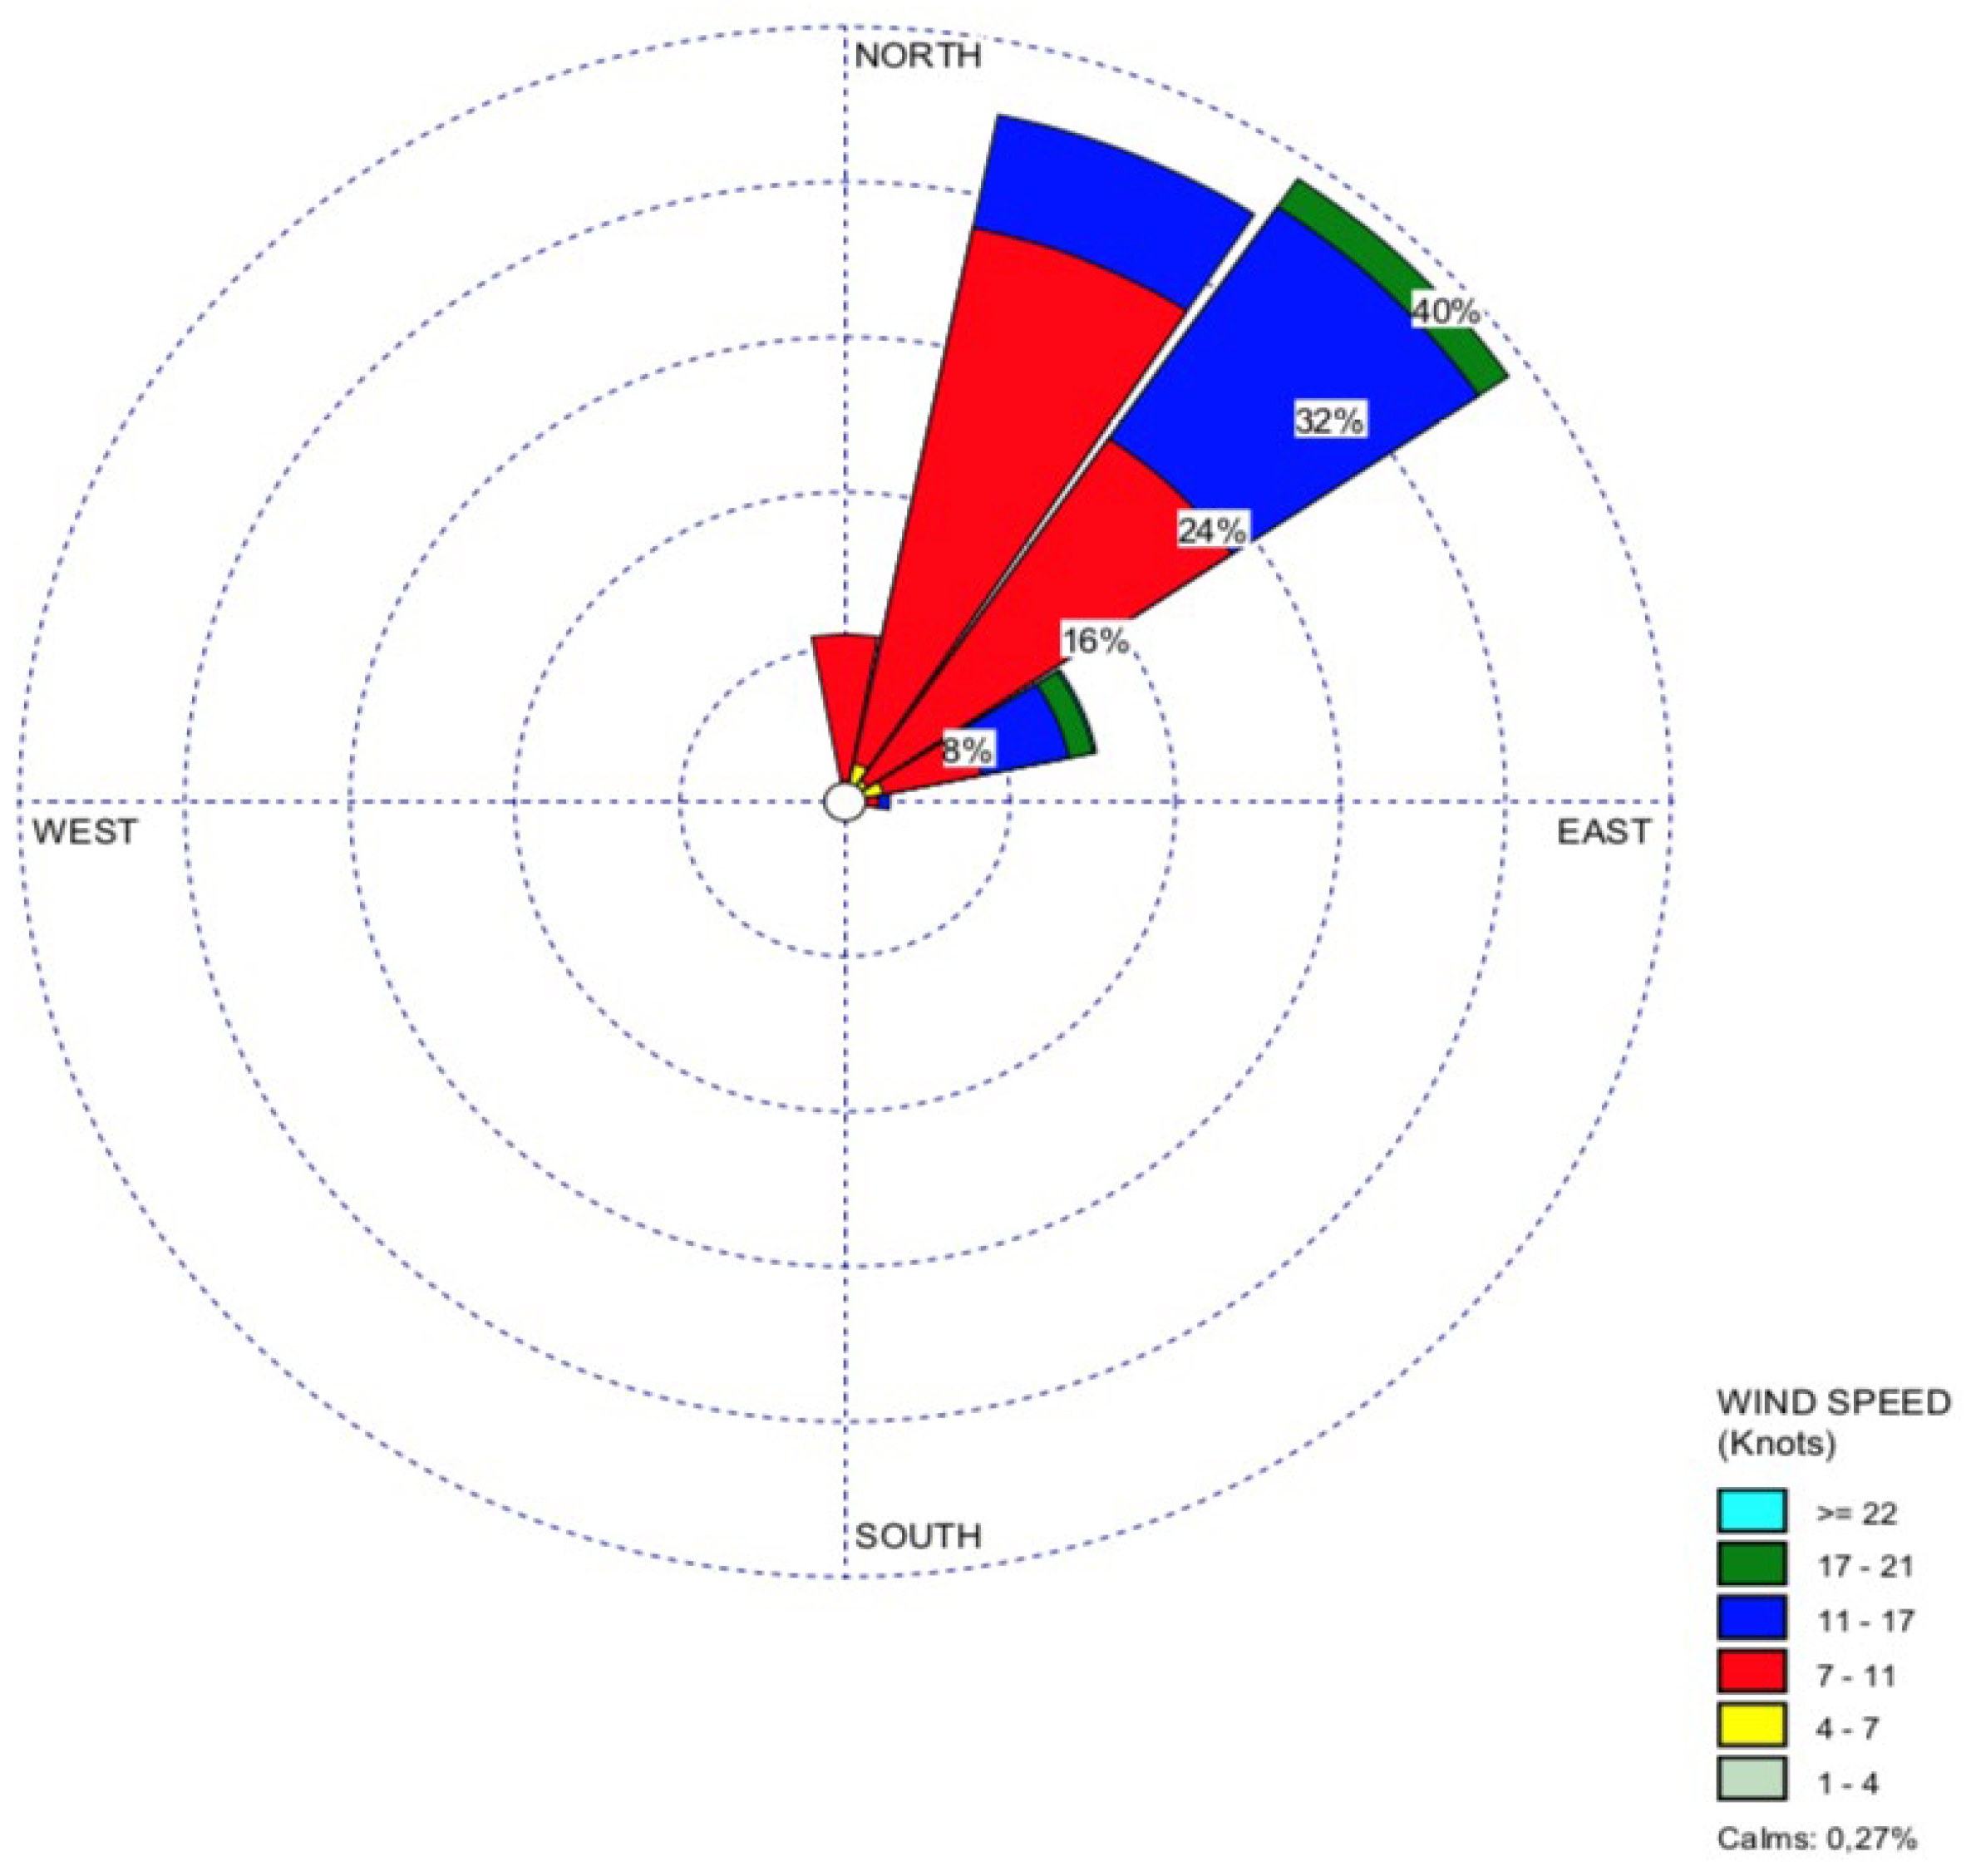
Table 1.
Geographical coordinates for the study area.
| Towns | Latitude | Longitude | Altitude |
|---|---|---|---|
| Salal | 14.845 | 17.2221 | 281.54 |
| Koro Toro | 16.0707 | 18.4958 | 307.16 |
| Nedeley | 15.5659 | 18,171 | 283.19 |
| Wind turbine | Startup speed | Rated speed | Cut-off speed | Rated power | Rotor diameter | Hub height |
| Vestas V164-10.0 MW | 4 m/s | 12 m/s | 25 m/s | 10 MW | 164 m | 117 m |
| Siemens Gamesa SG 14-222 DD | 3 m/s | 13 m/s | 25 m/s | 14 MW | 222 m | 195 m |
| Enercon E-126 EP4 | 2.5 m/s | 11.4 m/s | 25 m/s | 7.58 MW | 126 m | 135 m |
Table 3.
Extrapolation of monthly wind speed data at the height of the Vestas V164-10.0 MW wind turbine for KOROTORO
Table 3.
Extrapolation of monthly wind speed data at the height of the Vestas V164-10.0 MW wind turbine for KOROTORO
| Month | V0 | K0 | C0 | Vz(m/s) | Kz | Cz(m/s) | CF | Q(m3 /Day) |
|---|---|---|---|---|---|---|---|---|
| Jan | 5.545 | 2.3157 | 6.2590 | 13.2757 | 2.3669 | 14.9841 | 0.7023 | 3.0394e+06 |
| Feb. | 5.658 | 2.3369 | 6.3858 | 13.5405 | 2.3886 | 15.2811 | 0.7093 | 3.2242e+06 |
| Mar. | 5.565 | 2.3194 | 6.2814 | 13.3226 | 2.3708 | 15.0367 | 0.7036 | 3.0716e+06 |
| Apr. | 5.138 | 2.2363 | 5.8016 | 12.3219 | 2.2859 | 13.9121 | 0.6703 | 2.4315e+06 |
| May | 4.486 | 2.0978 | 5.0651 | 10.7893 | 2.1443 | 12.1817 | 0.5982 | 1.6319e+06 |
| Jun. | 3.702 | 1.9048 | 4.1717 | 8.9394 | 1.9470 | 10.0749 | 0.4828 | 9.2439e+05 |
| July | 4.195 | 2.0303 | 4.7352 | 10.1046 | 2.0753 | 11.4047 | 0.5586 | 1.3394e+06 |
| Aug. | 3.925 | 1.9636 | 4.4276 | 9.4680 | 2.0071 | 10.6794 | 0.5184 | 1.1003e+06 |
| Sept. | 3.424 | 1.8262 | 3.8527 | 8.2827 | 1.8666 | 9.3201 | 0.4366 | 7.3276e+05 |
| Oct. | 4.619 | 2.1274 | 5.2157 | 11.1023 | 2.1745 | 12.5360 | 0.6149 | 1.7785e+06 |
| Nov. | 5.091 | 2.2267 | 5.7479 | 12.2100 | 2.2760 | 13.7861 | 0.6659 | 2.3659e+06 |
| Dec. | 5.692 | 2.3432 | 6.4238 | 13.6198 | 2.3951 | 15.3699 | 0.7112 | 3.2810e+06 |
Table 4.
Extrapolation of Weibull parameters to Z height and capacity factor values and daily flow rates of Siemens Gamesa SG 14-222 DD for KOROTORO.
Table 4.
Extrapolation of Weibull parameters to Z height and capacity factor values and daily flow rates of Siemens Gamesa SG 14-222 DD for KOROTORO.
| Month | V0 | K0 | C0 | Vz(m/s) | Kz | Cz(m/s) | CF | Q(m3 /Day) |
|---|---|---|---|---|---|---|---|---|
| Jan. | 5.545 | 2.3157 | 6.2590 | 15.9147 | 2.3779 | 17.9627 | 0.6828 | 5.7661e+06 |
| Feb. | 5.658 | 2.3369 | 6.3858 | 16.2306 | 2.3997 | 18.3170 | 0.6824 | 6.1152e+06 |
| Mar. | 5.565 | 2.3194 | 6.2814 | 15.9706 | 2.3818 | 18.0254 | 0.6828 | 5.8269e+06 |
| Apr. | 5.138 | 2.2363 | 5.8016 | 14.3884 | 2.2676 | 16.2464 | 0.6719 | 4.2636e+06 |
| May | 4.486 | 2.0978 | 5.0651 | 12.9463 | 2.1542 | 14.6171 | 0.6408 | 3.1045e+06 |
| Jun. | 3.702 | 1.9048 | 4.1717 | 10.7359 | 1.9560 | 12.0996 | 0.5555 | 1.7629e+06 |
| July | 4.195 | 2.0303 | 4.7352 | 12.1285 | 2.0849 | 13.6889 | 0.6143 | 2.5502e+06 |
| Aug. | 3.925 | 1.9636 | 4.4276 | 11.3677 | 2.0164 | 12.8222 | 0.5842 | 2.0967e+06 |
| Sept. | 3.424 | 1.8262 | 3.8527 | 9.9507 | 1.8753 | 11.1970 | 0.5159 | 1.3989e+06 |
| Oct. | 4.619 | 2.1274 | 5.2157 | 13.3202 | 2.1846 | 15.0403 | 0.6508 | 3.3821e+06 |
| Nov. | 5.091 | 2.2267 | 5.7479 | 14.6427 | 2.2866 | 16.5329 | 0.6752 | 4.4935e+06 |
| Dec. | 5.692 | 2.3432 | 6.4238 | 16.3252 | 2.4061 | 18.4230 | 0.6821 | 6.2222e+06 |
Table 5.
Extrapolation of Weibull parameters to Z height and capacity factor values and daily flow rates of Enercon E-126 EP4 KOROTORO.
Table 5.
Extrapolation of Weibull parameters to Z height and capacity factor values and daily flow rates of Enercon E-126 EP4 KOROTORO.
| Month | V0 | K0 | C0 | Vz(m/s) | Kz | Cz(m/s) | CF | Q(m3/Day) |
|---|---|---|---|---|---|---|---|---|
| Jan | 5.545 | 2.3157 | 6.2590 | 13.9674 | 2.3700 | 15.7648 | 0.7440 | 3.1295e+06 |
| Feb. | 5.658 | 2.3369 | 6.3858 | 14.2457 | 2.3917 | 16.0769 | 0.7477 | 3.3195e+06 |
| Mar. | 5.565 | 2.3194 | 6.2814 | 14.0166 | 2.3739 | 15.8200 | 0.7447 | 3.1626e+06 |
| Apr. | 5.138 | 2.2363 | 5.8016 | 12.9651 | 2.2888 | 14.6384 | 0.7237 | 2.5042e+06 |
| May | 4.486 | 2.0978 | 5.0651 | 11.3545 | 2.1471 | 12.8198 | 0.6685 | 1.6816e+06 |
| Jun. | 3.702 | 1.9048 | 4.1717 | 9.4100 | 1.9495 | 10.6052 | 0.5684 | 9.5318e+05 |
| July | 4.195 | 2.0303 | 4.7352 | 10.6349 | 2.0780 | 12.0031 | 0.6354 | 1.3805e+06 |
| Aug. | 3.925 | 1.9636 | 4.4276 | 9.9656 | 2.0097 | 11.2407 | 0.6003 | 1.1343e+06 |
| Sept. | 3.424 | 1.8262 | 3.8527 | 8.7196 | 1.8690 | 9.8117 | 0.5258 | 7.5580e+05 |
| Oct. | 4.619 | 2.1274 | 5.2157 | 11.6835 | 2.1773 | 13.1922 | 0.6820 | 1.8324e+06 |
| Nov. | 5.091 | 2.2267 | 5.7479 | 12.8475 | 2.2790 | 14.5060 | 0.7206 | 2.4368e+06 |
| Dec. | 5.692 | 2.3432 | 6.4238 | 14.3289 | 2.3982 | 16.1702 | 0.7487 | 3.3778e+06 |
Table 6.
application of speed values, Weibull parameters, capacity factor and daily flow rates at different heights for Vestas V164-10.0 for the city of Salal.
Table 6.
application of speed values, Weibull parameters, capacity factor and daily flow rates at different heights for Vestas V164-10.0 for the city of Salal.
| Month | V0 | K0 | C0 | V117 | K117 | C117 | CF | Q(m3/Day) |
|---|---|---|---|---|---|---|---|---|
| Jan | 4.667 | 2.138 | 5.270 | 11.215 | 2.185 | 12.663 | 0.6207 | 1.8330e+06 |
| Feb. | 4.761 | 2.158 | 5.376 | 11.437 | 2.206 | 12.914 | 0.6317 | 1.9443e+06 |
| Mar. | 4.689 | 2.143 | 5.293 | 11.266 | 2.190 | 12.721 | 0.6233 | 1.8585e+06 |
| Apr. | 4.352 | 2.067 | 4.906 | 10.473 | 2.113 | 11.822 | 0.5804 | 1.4918e+06 |
| May | 3.810 | 1.934 | 4.279 | 9.196 | 1.977 | 10.368 | 0.5002 | 1.0071e+06 |
| Jun. | 3.211 | 1.761 | 3.619 | 7.779 | 1.800 | 8.738 | 0.4002 | 6.0470e+05 |
| July | 3.697 | 1.903 | 4.16 | 8.928 | 1.946 | 10.061 | 0.4820 | 9.2067e+05 |
| Aug. | 3.437 | 1.830 | 3.850 | 8.314 | 1.871 | 9.356 | 0.4389 | 7.4123e+05 |
| Sept. | 2.986 | 1.685 | 3.367 | 7.245 | 1.722 | 8.115 | 0.3612 | 4.8564e+05 |
| Oct. | 3.847 | 1.943 | 4.343 | 9.283 | 1.987 | 10.468 | 0.5061 | 1.0364e+06 |
| Nov. | 4.284 | 2.051 | 4.837 | 10.313 | 2.097 | 11.641 | 0.5711 | 1.4243e+06 |
| Dec. | 4.771 | 2.16 | 5.383 | 11.458 | 2.208 | 12.938 | 0.6327 | 1.9553e+06 |
Table 7.
Application of values for speeds, Weibull parameters, capacity factor and daily flow rates at different heights for Siemens Gamesa SG 14-222 DD.
Table 7.
Application of values for speeds, Weibull parameters, capacity factor and daily flow rates at different heights for Siemens Gamesa SG 14-222 DD.
| Month | V0(m/s) | K0 | C0 (m/s) | V195(m/s) | K195 | C195 | CF | Q(m3/Day) |
|---|---|---|---|---|---|---|---|---|
| Jan | 4.667 | 2.138 | 5.270 | 11.709 | 2.048 | 13.211 | 0.5983 | 2.2930e+06 |
| Feb. | 4.761 | 2.158 | 5.376 | 13.72 | 2.216 | 15.492 | 0.6600 | 3.6960e+06 |
| Mar. | 4.689 | 2.143 | 5.293 | 13.516 | 2.2 | 15.262 | 0.6555 | 3.5335e+06 |
| Apr. | 4.352 | 2.067 | 4.906 | 12.568 | 2.123 | 14.188 | 0.6293 | 2.8392e+06 |
| May | 3.810 | 1.934 | 4.279 | 11.042 | 1.986 | 12.45 | 0.5698 | 1.9200e+06 |
| Jun. | 3.211 | 1.761 | 3.619 | 9.348 | 1.808 | 10.5 | 0.4830 | 1.1553e+06 |
| July | 3.697 | 1.903 | 4.16 | 10.722 | 1.955 | 12.083 | 0.5548 | 1.7559e+06 |
| Aug. | 3.437 | 1.830 | 3.850 | 9.988 | 1.879 | 11.24 | 0.5179 | 1.4150e+06 |
| Sept. | 2.986 | 1.685 | 3.367 | 8.709 | 1.73 | 9.755 | 0.4463 | 9.2870e+05 |
| Oct. | 3.847 | 1.943 | 4.343 | 11.146 | 1.996 | 12.57 | 0.5745 | 1.9756e+06 |
| Nov. | 4.284 | 2.051 | 4.837 | 12.377 | 2.106 | 13.971 | 0.6230 | 2.7111e+06 |
| Dec. | 4.771 | 2.16 | 5.383 | 13.745 | 2.218 | 15.521 | 0.6605 | 3.7168e+06 |
Table 8.
Application of speed values, Weibull parameters, capacity factor and daily flow rates at different heights for Enercon E-126 EP4.
Table 8.
Application of speed values, Weibull parameters, capacity factor and daily flow rates at different heights for Enercon E-126 EP4.
| Month | V0(m/s) | K0 | C0 (m/s) | V135(m/s) | K135 | C135 | CF | Q(m3/Day) |
|---|---|---|---|---|---|---|---|---|
| Jan | 4.667 | 2.138 | 5.270 | 11.8014 | 2.1880 | 13.3255 | 0.6866 | 1.8885e+06 |
| Feb. | 4.761 | 2.158 | 5.376 | 12.0349 | 2.2089 | 13.5894 | 0.6952 | 2.0030e+06 |
| Mar. | 4.689 | 2.143 | 5.293 | 11.8556 | 2.1929 | 13.3868 | 0.6886 | 1.9147e+06 |
| Apr. | 4.352 | 2.067 | 4.906 | 11.0215 | 2.1156 | 12.4422 | 0.6538 | 1.5374e+06 |
| May | 3.810 | 1.934 | 4.279 | 9.6793 | 1.9791 | 10.9136 | 0.5841 | 1.0384e+06 |
| Jun. | 3.211 | 1.761 | 3.619 | 8.1900 | 1.8021 | 9.1991 | 0.4913 | 6.2386e+05 |
| July | 3.697 | 1.903 | 4.16 | 9.3975 | 1.9481 | 10.5909 | 0.5677 | 9.4935e+05 |
| Aug. | 3.437 | 1.830 | 3.850 | 8.7524 | 1.8730 | 9.8496 | 0.5279 | 7.6453e+05 |
| Sept. | 2.986 | 1.685 | 3.367 | 7.6285 | 1.7246 | 8.5445 | 0.4534 | 5.0115e+05 |
| Oct. | 3.847 | 1.943 | 4.343 | 9.7712 | 1.9890 | 11.0186 | 0.5894 | 1.0686e+06 |
| Nov. | 4.284 | 2.051 | 4.837 | 10.8535 | 2.0994 | 12.2515 | 0.6460 | 1.4679e+06 |
| Dec. | 4.771 | 2.16 | 5.383 | 8.5445 | 2.2109 | 13.6150 | 0.6960 | 2.0144e+06 |
Disclaimer/Publisher’s Note: The statements, opinions and data contained in all publications are solely those of the individual author(s) and contributor(s) and not of MDPI and/or the editor(s). MDPI and/or the editor(s) disclaim responsibility for any injury to people or property resulting from any ideas, methods, instructions or products referred to in the content. |
© 2024 by the authors. Licensee MDPI, Basel, Switzerland. This article is an open access article distributed under the terms and conditions of the Creative Commons Attribution (CC BY) license (http://creativecommons.org/licenses/by/4.0/).
Copyright: This open access article is published under a Creative Commons CC BY 4.0 license, which permit the free download, distribution, and reuse, provided that the author and preprint are cited in any reuse.


