Submitted:
21 August 2024
Posted:
22 August 2024
You are already at the latest version
Abstract
Keywords:
1. Introduction
2. Theoretical Foundation and Literature Review
2.1. Digital Empowerment
2.2. Digitalization and Green Innovation
3. Research Hypothesis
3.1. Digital Transformation and Green Innovation
3.1.1. Production Digitalization and Green Innovation
3.1.2. Service Digitalization and Green Innovation
3.2. The Contingent Value of Institutional Logic
3.2.1. The Moderating Role of Environmental Regulation
3.2.2. The Moderating Role of Peer Firms’ Green Innovation
4. Research Design
4.1. Data Sources and Sample Selection
4.2. Variable Definition and Measurement
4.2.1. Dependent Variable
4.2.2. Explanatory Variables
4.2.3. Moderating Variables
4.2.4. Control Variables
5. Empirical Test
5.1. Descriptive Statistics and Correlations Analysis
5.2. Hypothesis Testing
6. Robustness Test and Endogeneity Issue
6.1. Robustness Test
6.2. Endogeneity Test
| Variables | Model 1 | Model 2 | Model 3 | Model 4 | Model 5 | ||||
| Production digitalization | 6.396** | 5.054*** | 4.521*** | 4.644*** | |||||
| (2.913) | (1.340) | (1.300) | (1.271) | ||||||
| Service digitalization | 7.422** | 3.062** | 2.245** | 2.179 | |||||
| (3.314) | (1.413) | (1.455) | (1.461) | ||||||
| Production digitalization * Environmental regulation | 0.248 | 0.322 | |||||||
| (0.922) | (0.931) | ||||||||
| Service digitalization* Environmental regulation | 1.570* | 1.585* | |||||||
| (0.865) | (0.829) | ||||||||
| Production digitalization* Peer firms’ green innovation | 1.236** | 1.119** | |||||||
| (0.514) | (0.514) | ||||||||
| Service digitalization * Peer firms’ green innovation | 1.614*** | 1.466*** | |||||||
| (0.587) | (0.532) | ||||||||
| Environmental regulation | 8.761 | 8.478 | 0.676 | 6.311 | 0.614 | ||||
| (6.737) | (6.294) | (0.998) | (6.409) | (0.988) | |||||
| Peer firms’ green innovation | 1.051*** | 0.902*** | 0.858*** | 2.367** | 2.381** | ||||
| (0.347) | (0.310) | (0.315) | (1.066) | (0.985) | |||||
| Support digitalization | 4.591 | 2.001 | 0.980 | 0.990 | 1.145 | ||||
| (3.228) | (2.636) | (1.009) | (1.090) | (1.026) | |||||
| Production staff scale | 4.132 | 3.223 | 2.971 | 3.295 | 3.099 | ||||
| (3.258) | (2.543) | (2.261) | (2.409) | (2.374) | |||||
| Chairman | -1.394 | -1.439 | -0.624 | -1.415 | -0.766 | ||||
| (5.181) | (5.045) | (4.203) | (4.769) | (4.277) | |||||
| CEO political connections | -4.941 | -5.179 | -5.956* | -6.558** | -7.067** | ||||
| (3.293) | (3.225) | (3.306) | (3.061) | (3.119) | |||||
| Equity concentration | 0.086 | 0.034 | 0.052 | -0.031 | -0.008 | ||||
| (0.181) | (0.149) | (0.143) | (0.144) | (0.148) | |||||
| Firm history | -13.823*** | -14.292*** | -13.481*** | -13.880*** | -13.217*** | ||||
| (5.141) | (4.065) | (4.460) | (4.216) | (2.975) | |||||
| Firm performance | 40.047 | 38.843 | 35.207 | 41.611 | 37.937 | ||||
| (30.217) | (29.223) | (27.313) | (26.041) | (26.548) | |||||
| HHI | 72.281 | 75.642 | 62.652 | 87.701* | 75.142 | ||||
| (57.720) | (48.456) | (47.437) | (45.598) | (50.171) | |||||
| Integration Index | -1.758 | -1.710 | -1.778 | -2.028 | -2.042 | ||||
| (2.952) | (2.299) | (2.549) | (2.363) | (1.694) | |||||
| Financial constraints | 7.843 | 9.866 | 9.575 | 9.446 | 9.074 | ||||
| (11.847) | (10.023) | (8.555) | (9.707) | (9.941) | |||||
| State-owned shares holding ratio | 0.096 | 0.093 | 0.085 | 0.117* | 0.107* | ||||
| (0.068) | (0.065) | (0.057) | (0.069) | (0.064) | |||||
| Directors scale | 1.497 | 1.251 | 1.232 | 1.220 | 1.199 | ||||
| (1.170) | (1.083) | (1.083) | (1.143) | (1.106) | |||||
| CEO’s age | 0.073 | -0.089 | -0.134 | -0.043 | -0.086 | ||||
| (0.301) | (0.272) | (0.230) | (0.265) | (0.239) | |||||
| CEO’s education | 3.481* | 2.969* | 2.618* | 3.163* | 2.822* | ||||
| (1.792) | (1.648) | (1.526) | (1.776) | (1.603) | |||||
| Year | Yes | Yes | Yes | Yes | Yes | ||||
| Industry | Yes | Yes | Yes | Yes | Yes | ||||
| Variables | Model 1 | Model 2 | Model 3 | Model 4 | Model 5 | ||||
| Production digitalization | 0.172* | 0.043 | 0.030 | 0.038 | |||||
| (0.101) | (0.059) | (0.061) | (0.061) | ||||||
| Service digitalization | 0.249* | 0.113* | 0.119* | 0.116* | |||||
| (0.131) | (0.059) | (0.064) | (0.064) | ||||||
| Production digitalization * Environmental regulation | 0.055* | 0.053* | |||||||
| (0.032) | (0.032) | ||||||||
| Service digitalization * Environmental regulation | 0.075** | 0.072** | |||||||
| (0.041) | (0.041) | ||||||||
| Production digitalization * Peer firms’ green innovation | -0.031 | -0.028 | |||||||
| (0.052) | (0.052) | ||||||||
| Service digitalization * Peer firms’ green innovation | 0.082** | 0.080** | |||||||
| (0.038) | (0.038) | ||||||||
| Environmental regulation | 0.144 | 0.169 | 0.017 | 0.177 | 0.023 | ||||
| (0.312) | (0.312) | (0.044) | (0.314) | (0.045) | |||||
| Peer firms’ green innovation | -0.001 | -0.002 | -0.002 | 0.008 | 0.007 | ||||
| (0.018) | (0.018) | (0.018) | (0.076) | (0.076) | |||||
| Support digitalization | 0.028 | 0.042 | 0.024 | 0.016 | 0.016 | ||||
| (0.106) | (0.105) | (0.044) | (0.044) | (0.044) | |||||
| Production staff scale | 0.134 | 0.131 | 0.134 | 0.132 | 0.135 | ||||
| (0.107) | (0.109) | (0.110) | (0.109) | (0.110) | |||||
| Chairman | -0.211 | -0.216 | -0.224 | -0.215 | -0.223 | ||||
| (0.145) | (0.144) | (0.145) | (0.144) | (0.145) | |||||
| CEO political connections | 0.173 | 0.152 | 0.158 | 0.148 | 0.154 | ||||
| (0.174) | (0.175) | (0.174) | (0.175) | (0.175) | |||||
| Equity concentration | -0.006 | -0.005 | -0.005 | -0.005 | -0.005 | ||||
| (0.007) | (0.007) | (0.007) | (0.007) | (0.007) | |||||
| Firm history | -0.923*** | -0.926*** | -0.927*** | -0.922*** | -0.923*** | ||||
| (0.108) | (0.108) | (0.109) | (0.109) | (0.109) | |||||
| Firm performance | 1.710 | 1.743 | 1.677 | 1.726 | 1.662 | ||||
| (1.060) | (1.063) | (1.067) | (1.060) | (1.066) | |||||
| HHI | -3.566 | -3.500 | -3.351 | -3.674 | -3.521 | ||||
| (3.633) | (3.540) | (3.552) | (3.519) | (3.537) | |||||
| Integration Index | 0.036* | 0.035* | 0.035* | 0.034* | 0.034* | ||||
| (0.019) | (0.019) | (0.020) | (0.020) | (0.020) | |||||
| Financial constraints | 0.325 | 0.349 | 0.363 | 0.357 | 0.371 | ||||
| (0.319) | (0.315) | (0.315) | (0.316) | (0.315) | |||||
| State-owned shares holding ratio | 0.003 | 0.003 | 0.003 | 0.003 | 0.003 | ||||
| (0.003) | (0.003) | (0.003) | (0.003) | (0.003) | |||||
| Directors scale | -0.000 | 0.003 | 0.004 | 0.003 | 0.003 | ||||
| (0.036) | (0.036) | (0.036) | (0.036) | (0.036) | |||||
| CEO’s age | -0.000 | -0.000 | -0.000 | -0.001 | -0.001 | ||||
| (0.009) | (0.009) | (0.009) | (0.009) | (0.009) | |||||
| CEO’s education | 0.074 | 0.067 | 0.066 | 0.068 | 0.068 | ||||
| (0.063) | (0.063) | (0.063) | (0.064) | (0.063) | |||||
| Year | Yes | Yes | Yes | Yes | Yes | ||||
| Industry | Yes | Yes | Yes | Yes | Yes | ||||
6.3. Supplementary Analysis
7. Conclusion and Implications
7.1. General Conclusions
7.2. Theoretical Contributions
7.3. Practical Implications
7.4. Limitations and future research directions
Author Contributions
Data Availability Statement
Conflicts of Interest
References
- X. Xie, D. Luo, and Y. Gao, Collaborative mechanism of supply chain enterprises based on green innovation: An empirical study Journal of Industrial Engineering Management 33 (2019) 116-124.
- Xie, X.M.; Huo, J.G.; Zou, H.L. Green process innovation, green product innovation, and corporate financial performance: A content analysis method. J. Bus. Res. 2019, 101, 697–706. [CrossRef]
- W. Li, Y. Zhang, M. Zheng, X. Li, G. Cui, and H. Li, Chinese listed companies’ green governance and its evaluation research. Management World. 35 (2019) 126-133+160.
- X. Xie, and Q. Zhu, How can green innovation solve the dilemmas of” harmonious coexistence”. Management World. 37 (2021) 128-149+129.
- J. Xiao, and P. Zeng, Does digitalization improve the quality and quantity of enterprise green innovation? ——based on resource perspective. Studies in Science of Science. (2022) 1-19.
- Y. Yang, J. Lei, H. Chen, and Y. Wu, The mechanisms of processing and manufacturing firms’ digital transformation: Case studies based on resource orchestration. Journal of Management Case Study. 15 (2022) 198-220.
- X. Xie, and Y. Han, How can local manufacturing enterprises achieve luxuriant transformation in green innovation? A multi-case study based on attention-based view. Management World. 38 (2022) 76-106.
- S. Yi, and W. Liang, How do the traditional commercial enterprises innovate and transform ——the construction of the value co-creation platform network from the perspective of service-dominant logic. Chinese Industrial Economy. (2023) 171-188.
- H. Deng, and J. Zhao, Peer effects in economic decision-making of China’s local governments. Chinese Industrial Economy. (2018) 59-78.
- M. Chi, D. Ye, and J. Wangs, How can Chinese small- and medium-sized manufacturing enterprises improve the new product development (npd) performance? From the perspective of digital empowerment. Nankai Business Review. 23 (2020) 63-75.
- X. Sun, J. Li, and M. Zhang, Data empowerment for the value chain ascension of intelligent manufacturing enterprises: A review and prospects. Financial and Accounting Communication. (2023) 26-31.
- University of New South Wales; Leong, C.; Pan, S.L.; Newell, S.; University of Sussex; Cui, L.; Shanghai University of Finance and Economics The Emergence of Self-Organizing E-Commerce Ecosystems in Remote Villages of China: A Tale of Digital Empowerment for Rural Development. MIS Q. 2016, 40, 475–484. [CrossRef]
- ChenY.-S. The Driver of Green Innovation and Green Image– Green Core Competence. J. Bus. Ethic. 2008, 81, 531–543. [CrossRef]
- García-Granero, E.M.; Piedra-Muñoz, L.; Galdeano-Gómez, E. Measuring eco-innovation dimensions: The role of environmental corporate culture and commercial orientation. Res. Policy 2020, 49, 104028. [CrossRef]
- L. Xi, and H. Zhao, Senior executive dual environmental cognition, green innovation, and enterprise sustainable development performance. Economic Management. 44 (2022) 139-158.
- Cao, H.; Chen, Z. The driving effect of internal and external environment on green innovation strategy-The moderating role of top management’s environmental awareness. Nankai Bus. Rev. Int. 2019, 10, 342–361. [CrossRef]
- J. Liu, and Y. Xiao, China’s environmental protection tax and green innovation: Incentive effect or crowding-out effect? Economic Research. 57 (2022) 72-88.
- Q. Li, and Z. Xiao, Heterogeneous environmental regulation tools and green innovation incentives: Evidences from green patents of listed companies. Economic Research Journal. 55 (2020) 192-208.
- W. Wu, L. Jinjin, Z. Aimei, and Q. Zhen, Green cancer and corporate green innovation: A scenarist study of digital business models in the context of quality development orientation. Science & Technology Progress and Policy. 1-12.
- Delgado-Ceballos, J.; Aragón-Correa, J.A.; Ortiz-De-Mandojana, N.; Rueda-Manzanares, A. The Effect of Internal Barriers on the Connection Between Stakeholder Integration and Proactive Environmental Strategies. J. Bus. Ethic- 2011, 107, 281–293. [CrossRef]
- H. Zhou, H. Li, and L. Zhao, Research on the impact of manufacturing digital transformation on green innovation performance: The moderating effects of digital level. Science-Technology and Management. 23 (2021) 33-43.
- X. Xie, Y. Wu, and L. Yan, Enterprise green development path and policy suggestions under the background of digital age. Ecological Economy. 31 (2015) 88-91.
- W. Jing, and B. Sun, Digital economy promotes high-quality economic development: A theoretical analysis framework. Economist. (2019) 66-73.
- F. Meng, Y. Xu, and G. Zhao, Research on the transformation process of high-end equipment.
- manufacturing enterprises to intelligent manufacturing:Based on.
- digital empowerment perspective. Scientific Decision Making. (2019) 1-24.
- H. Yin, H. Yu, and Q. Xie, Research on intelligent transformation and upgrading of manufacturing enterprises based on value chain optimization. China Science and Technology Forum. (2021) 113-122.
- Z. Wang, Y. Cao, and S. Lin, The characteristics and heterogeneity of environmental regulation’s impact on enterprises’green technology innovation ———based on green patent data of listed firms in China. Studies in Science of Science. 39 (2021) 909-919+929.
- Wang, C.; Yang, Y.; Zhang, J. China's sectoral strategies in energy conservation and carbon mitigation. Clim. Policy 2015, 15, S60–S80. [CrossRef]
- C. R. Carter, and L. M. Ellram, Reverse logistics: A review of the literature and framework for future investigation. Journal of business logistics. 19 (1998) 85.
- J. Xu, J. Guan, and Y. Lin, Institutional pressures,top managers’environmental awareness and environmental innovation practices:An institutional theory and upper echelons theory perspective. Management review. 29 (2017) 72-83.
- B. Zhang, and S. Zhao, Research on the impact of government subsidies on green innovation of enterprises ——the moderating effect of political connection and environmental regulation. Science Research Management. 1-12.
- Berrone, P.; Fosfuri, A.; Gelabert, L.; Gomez-Mejia, L.R. Necessity as the mother of ‘green’ inventions: Institutional pressures and environmental innovations. Strat. Manag. J. 2012, 34, 891–909. [CrossRef]
- Y. Zhu, H. Gao, Q. Ding, and Y. Hu, Impact of local environmental target constraint intensity on the quality of enterprise green innovation: Moderating effects based on the digital economy. China Population,Resources and Environment. 32 (2022) 106-119.
- C. Wang, and X. Li, Research on the relationship between peers’voluntary disclosure and corporate earnings management: Based on the management earnings forecast. Economic Management. 44 (2022) 172-189.
- Chiou, T.-Y.; Chan, H.K.; Lettice, F.; Chung, S.H. The influence of greening the suppliers and green innovation on environmental performance and competitive advantage in Taiwan. Transp. Res. Part E Logist. Transp. Rev. 2011, 47, 822–836. [CrossRef]
- X. Wang, and X. Chu, Research on the peer group effect of green technology innovation in manufacturing enterprises: Reference function based on multi-level situationd. Nankai Business Review. 25 (2022) 68-81.
- Xiong, H.; Wang, P.; Bobashev, G. Multiple peer effects in the diffusion of innovations on social networks: a simulation study. J. Innov. Entrep. 2018, 7, 1–18. [CrossRef]
- C. YuJiao, S. TieBo, and H. JianBin, Digital transformation of enterprises: Is the company following peers in the same industry? Or in the same area?——research on decision process based on institutional theory. Studies in Science of Science. 40 (2022) 1054-1062.
- Y. Qi, B. Du, and W. Xin, Mission embeddedness and pattern selection of digital strategic transformation of soes: A case study based on the typical practice of digitalization in three central enterprises. Management World. 37 (2021) 137-158+110.
- W. Li, and F. Wang, Intelligent transformation,cost stickiness and enterprise performance —an empirical study based on traditional manufacturing enterprises. Studies in Science of Science. 40 (2022) 91-102.
- J. Wu, and B. Guan, The effect of top management team characteristics on international market entry mode: The mediating role of attention. Management Review. 27 (2015) 118-131.
- Wang, S.-Q.; Zhang, S.; Shang, G.-Y. Impact of Subsidiary TMT Network Attention on Innovation: The Moderating Role of Subsidiary Autonomy. Manag. Organ. Rev. 2022, 18, 1077–1115. [CrossRef]
- F. Wu, H. Hu, H. Lin, and X. Ren, Enterprise digital transformation and capital market performance:Empirical evidence from stock liquidity Management World. 37 (2021) 130-144+110.
- Delmas, M.A.; Kohli, A. Can Apps Make Air Pollution Visible? Learning About Health Impacts Through Engagement with Air Quality Information. J. Bus. Ethics 2020, 161, 279–302. [CrossRef]
- Rennings, K.; Ziegler, A.; Ankele, K.; Hoffmann, E. The influence of different characteristics of the EU environmental management and auditing scheme on technical environmental innovations and economic performance. Ecol. Econ. 2005, 57, 45–59. [CrossRef]
- L. Rekik, and F. Bergeron, Green practice motivators and performance in smes: A qualitative comparative anaysis. Journal of Small Business Strategy. 27 (2017) 1-18.
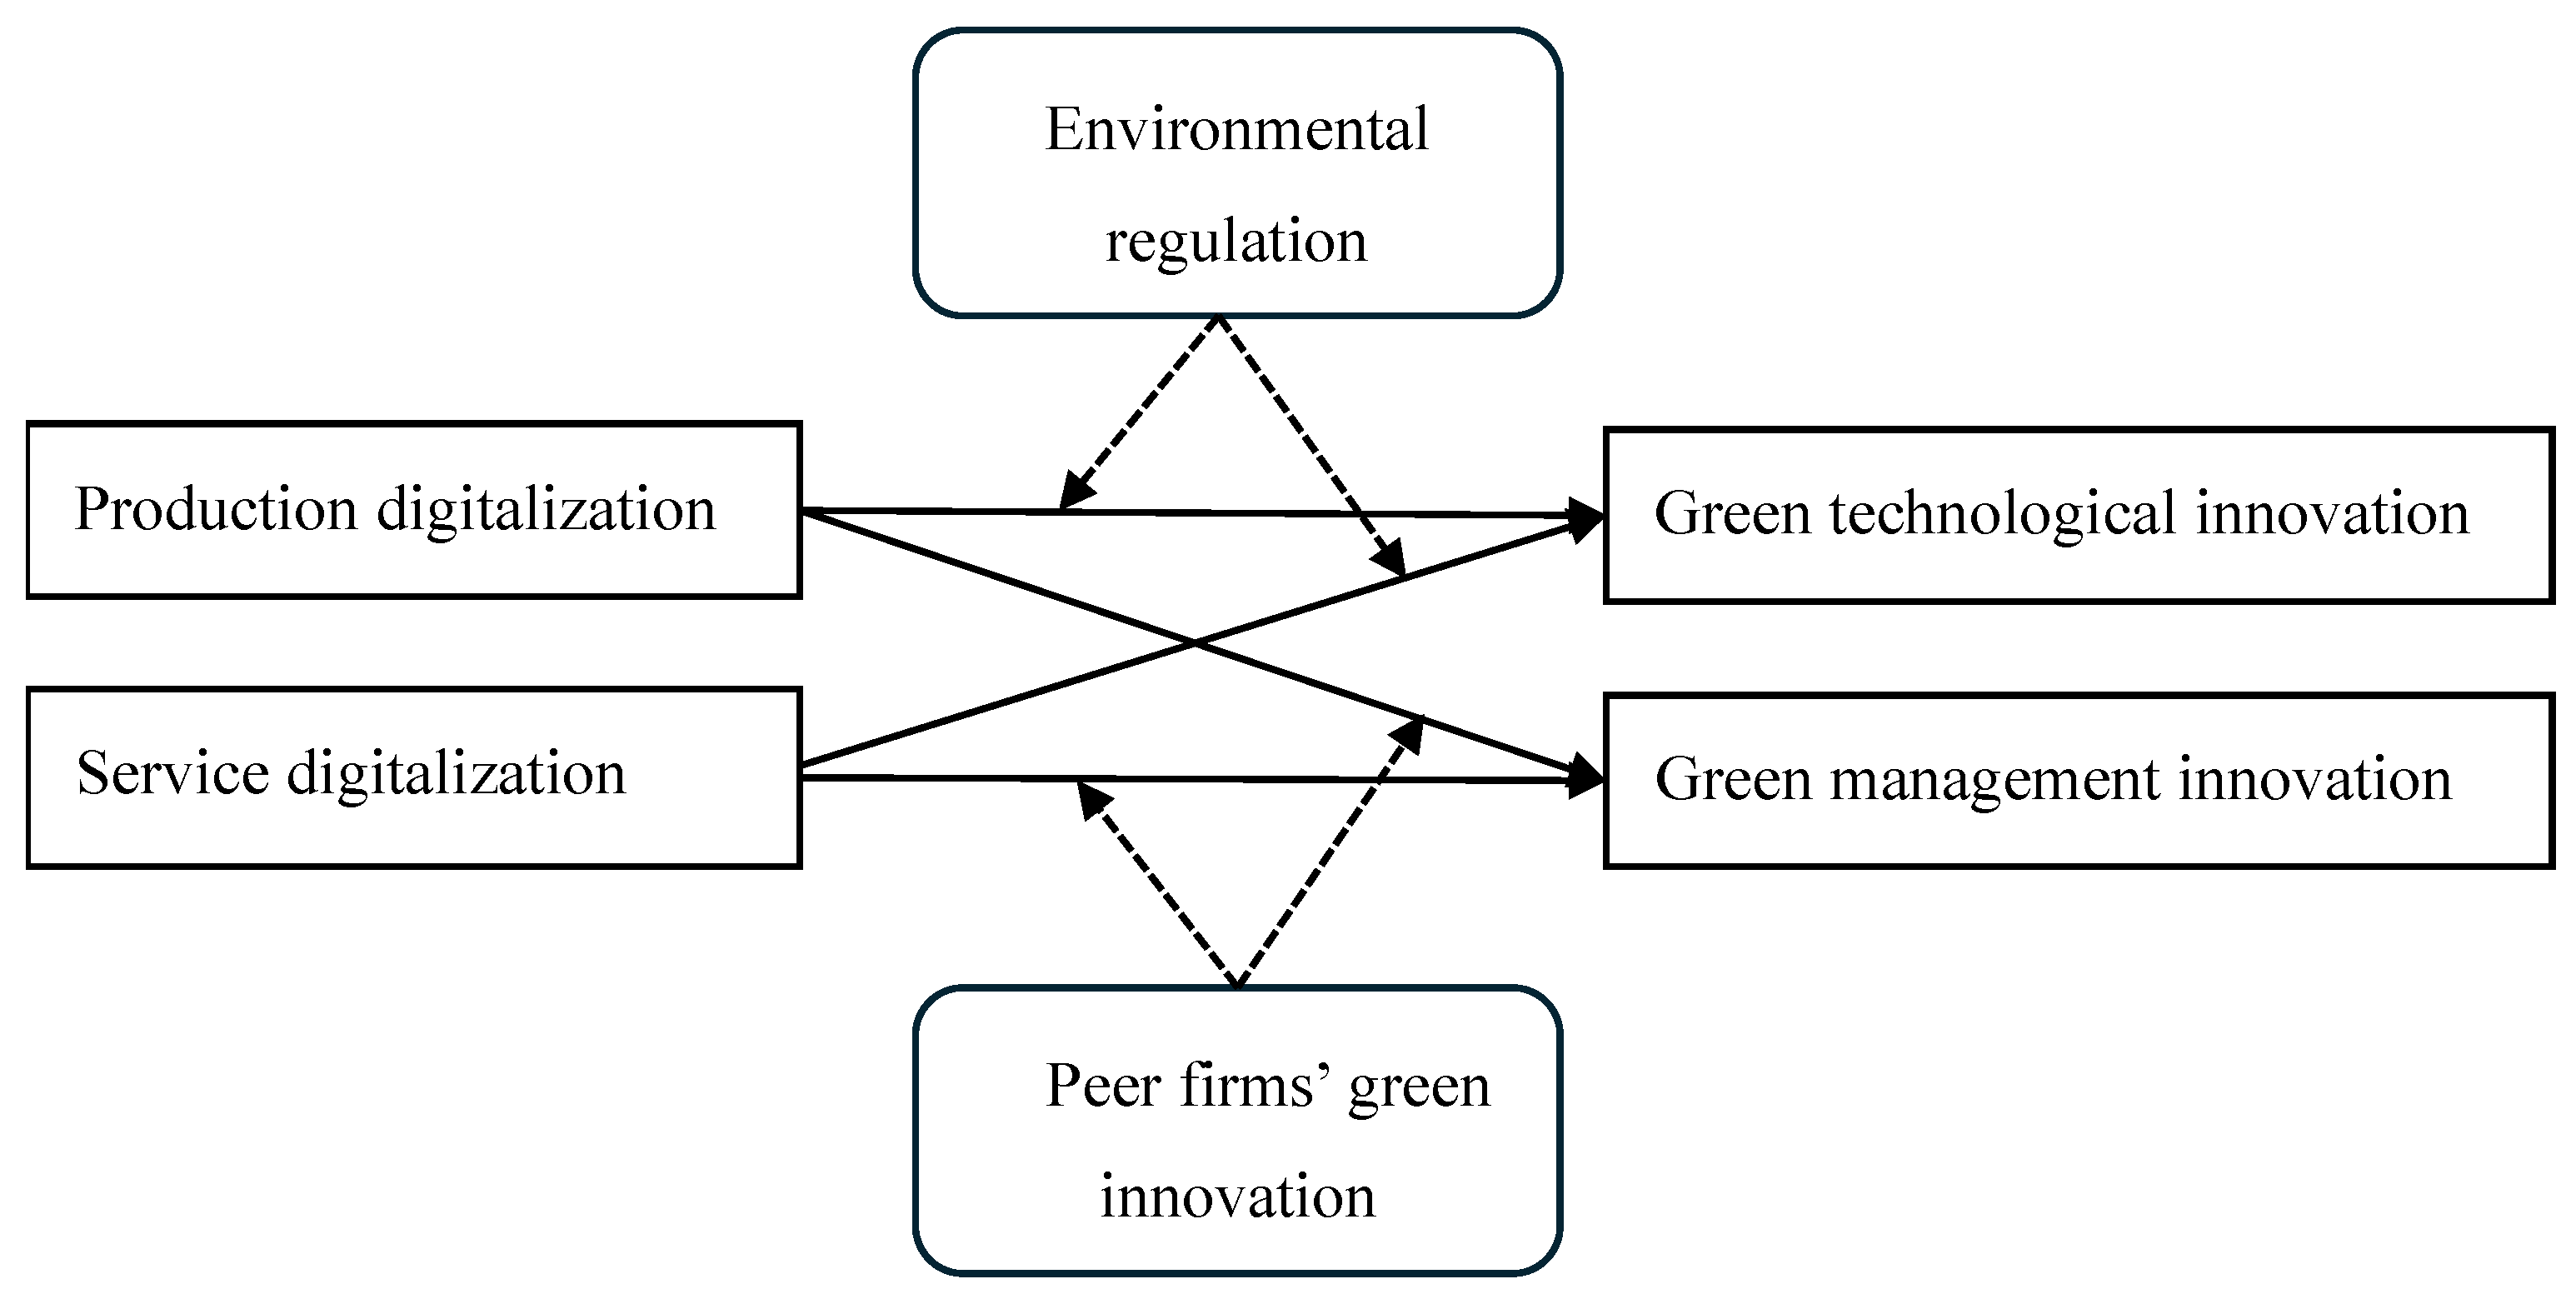
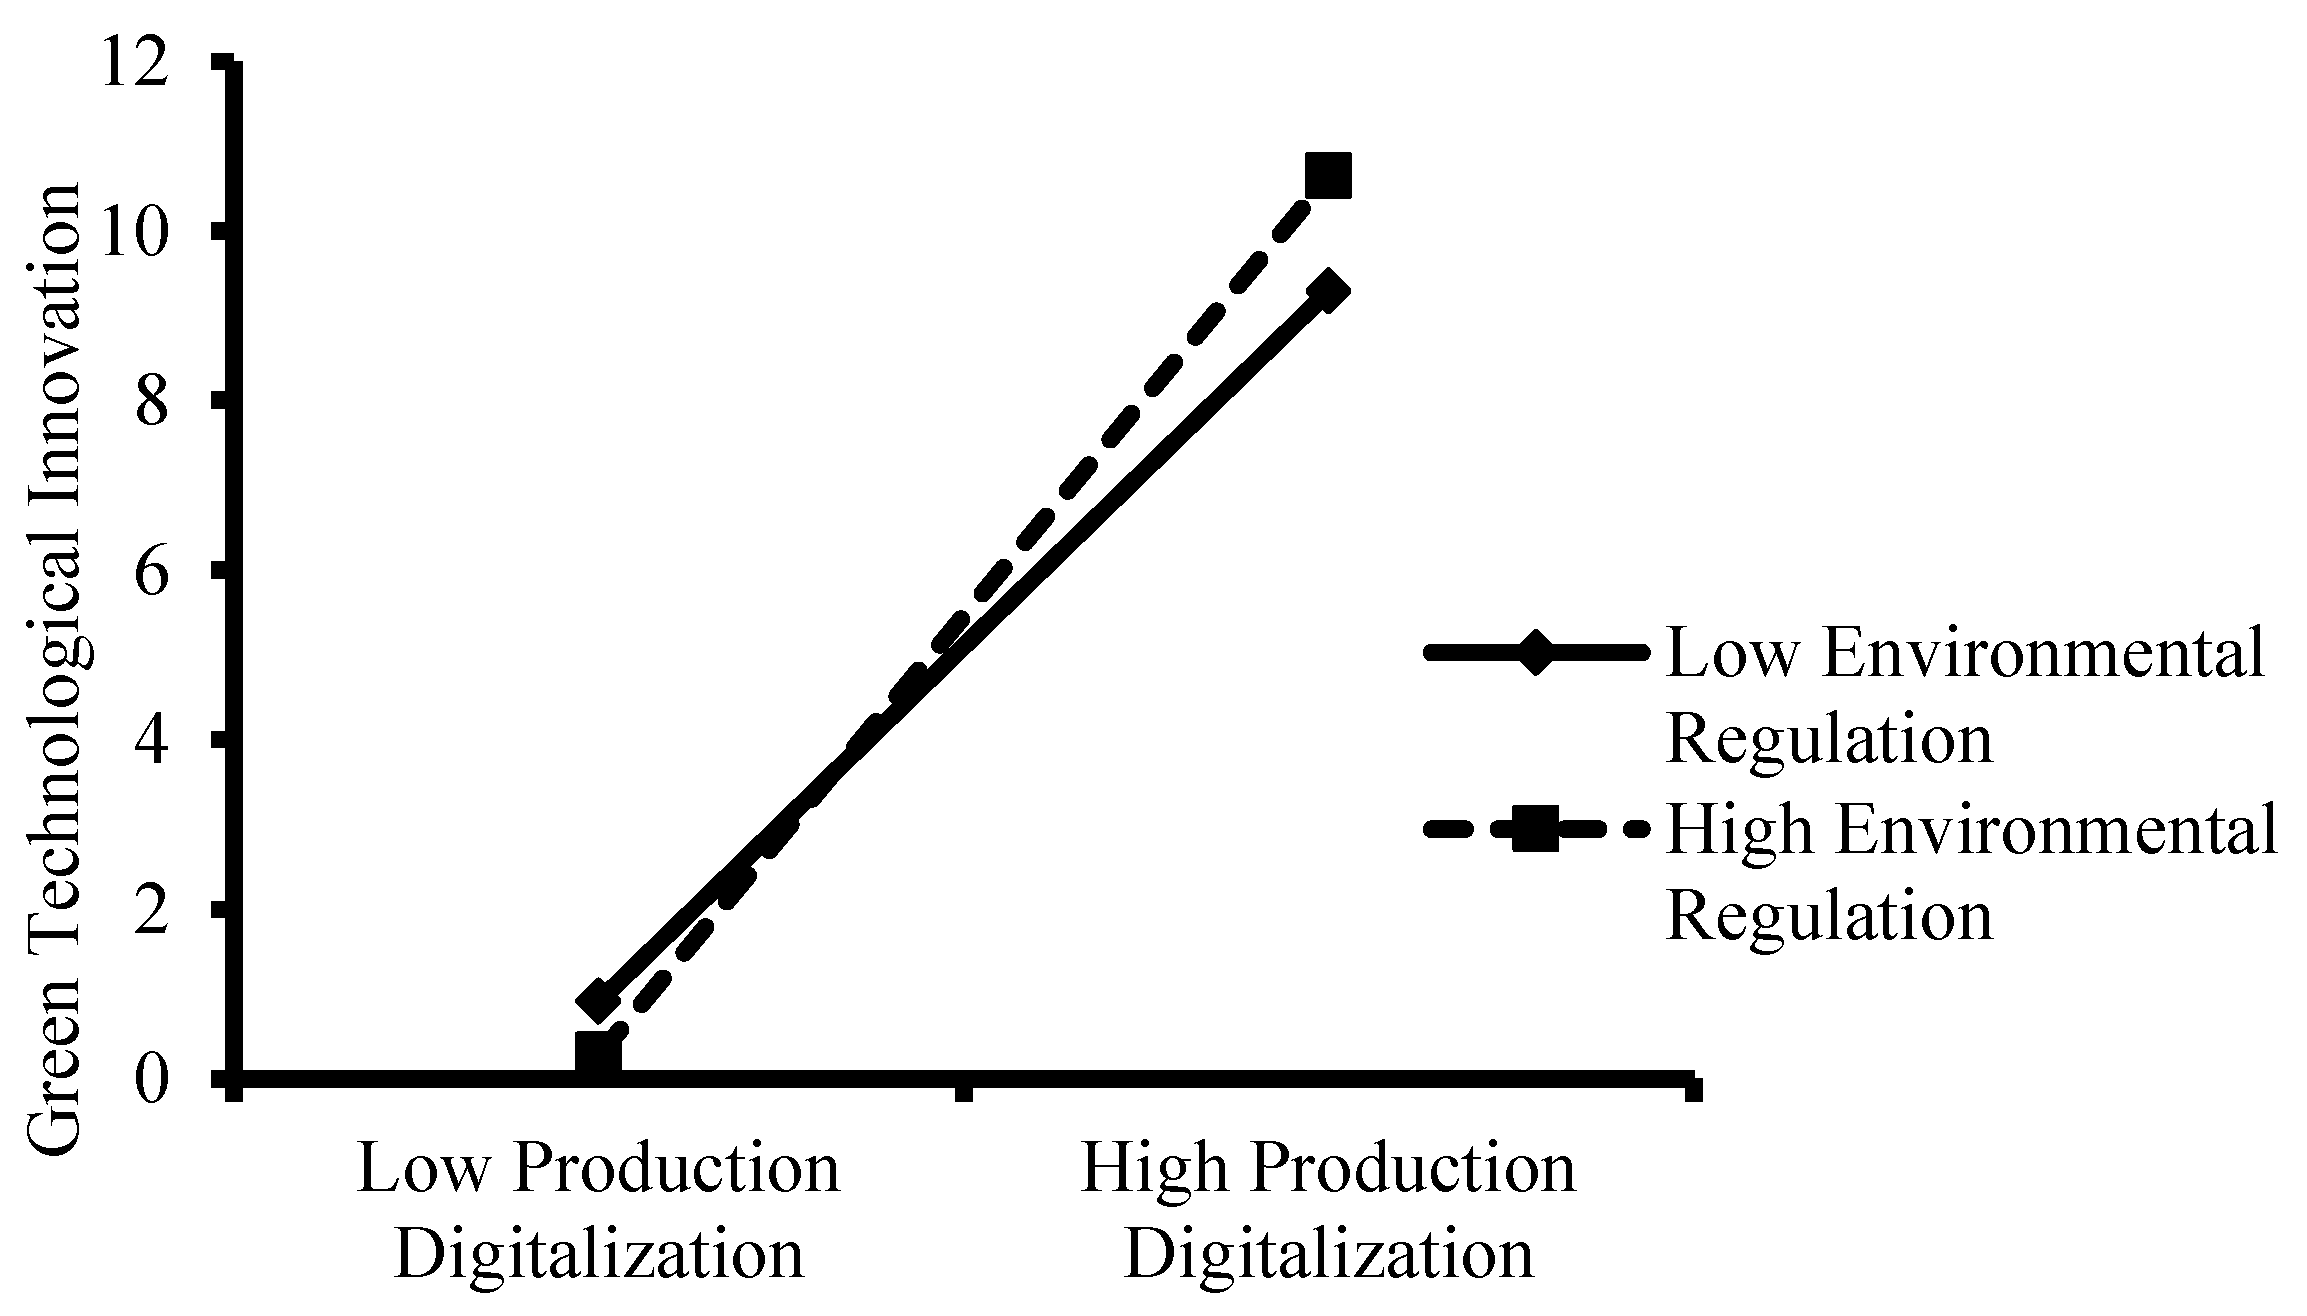
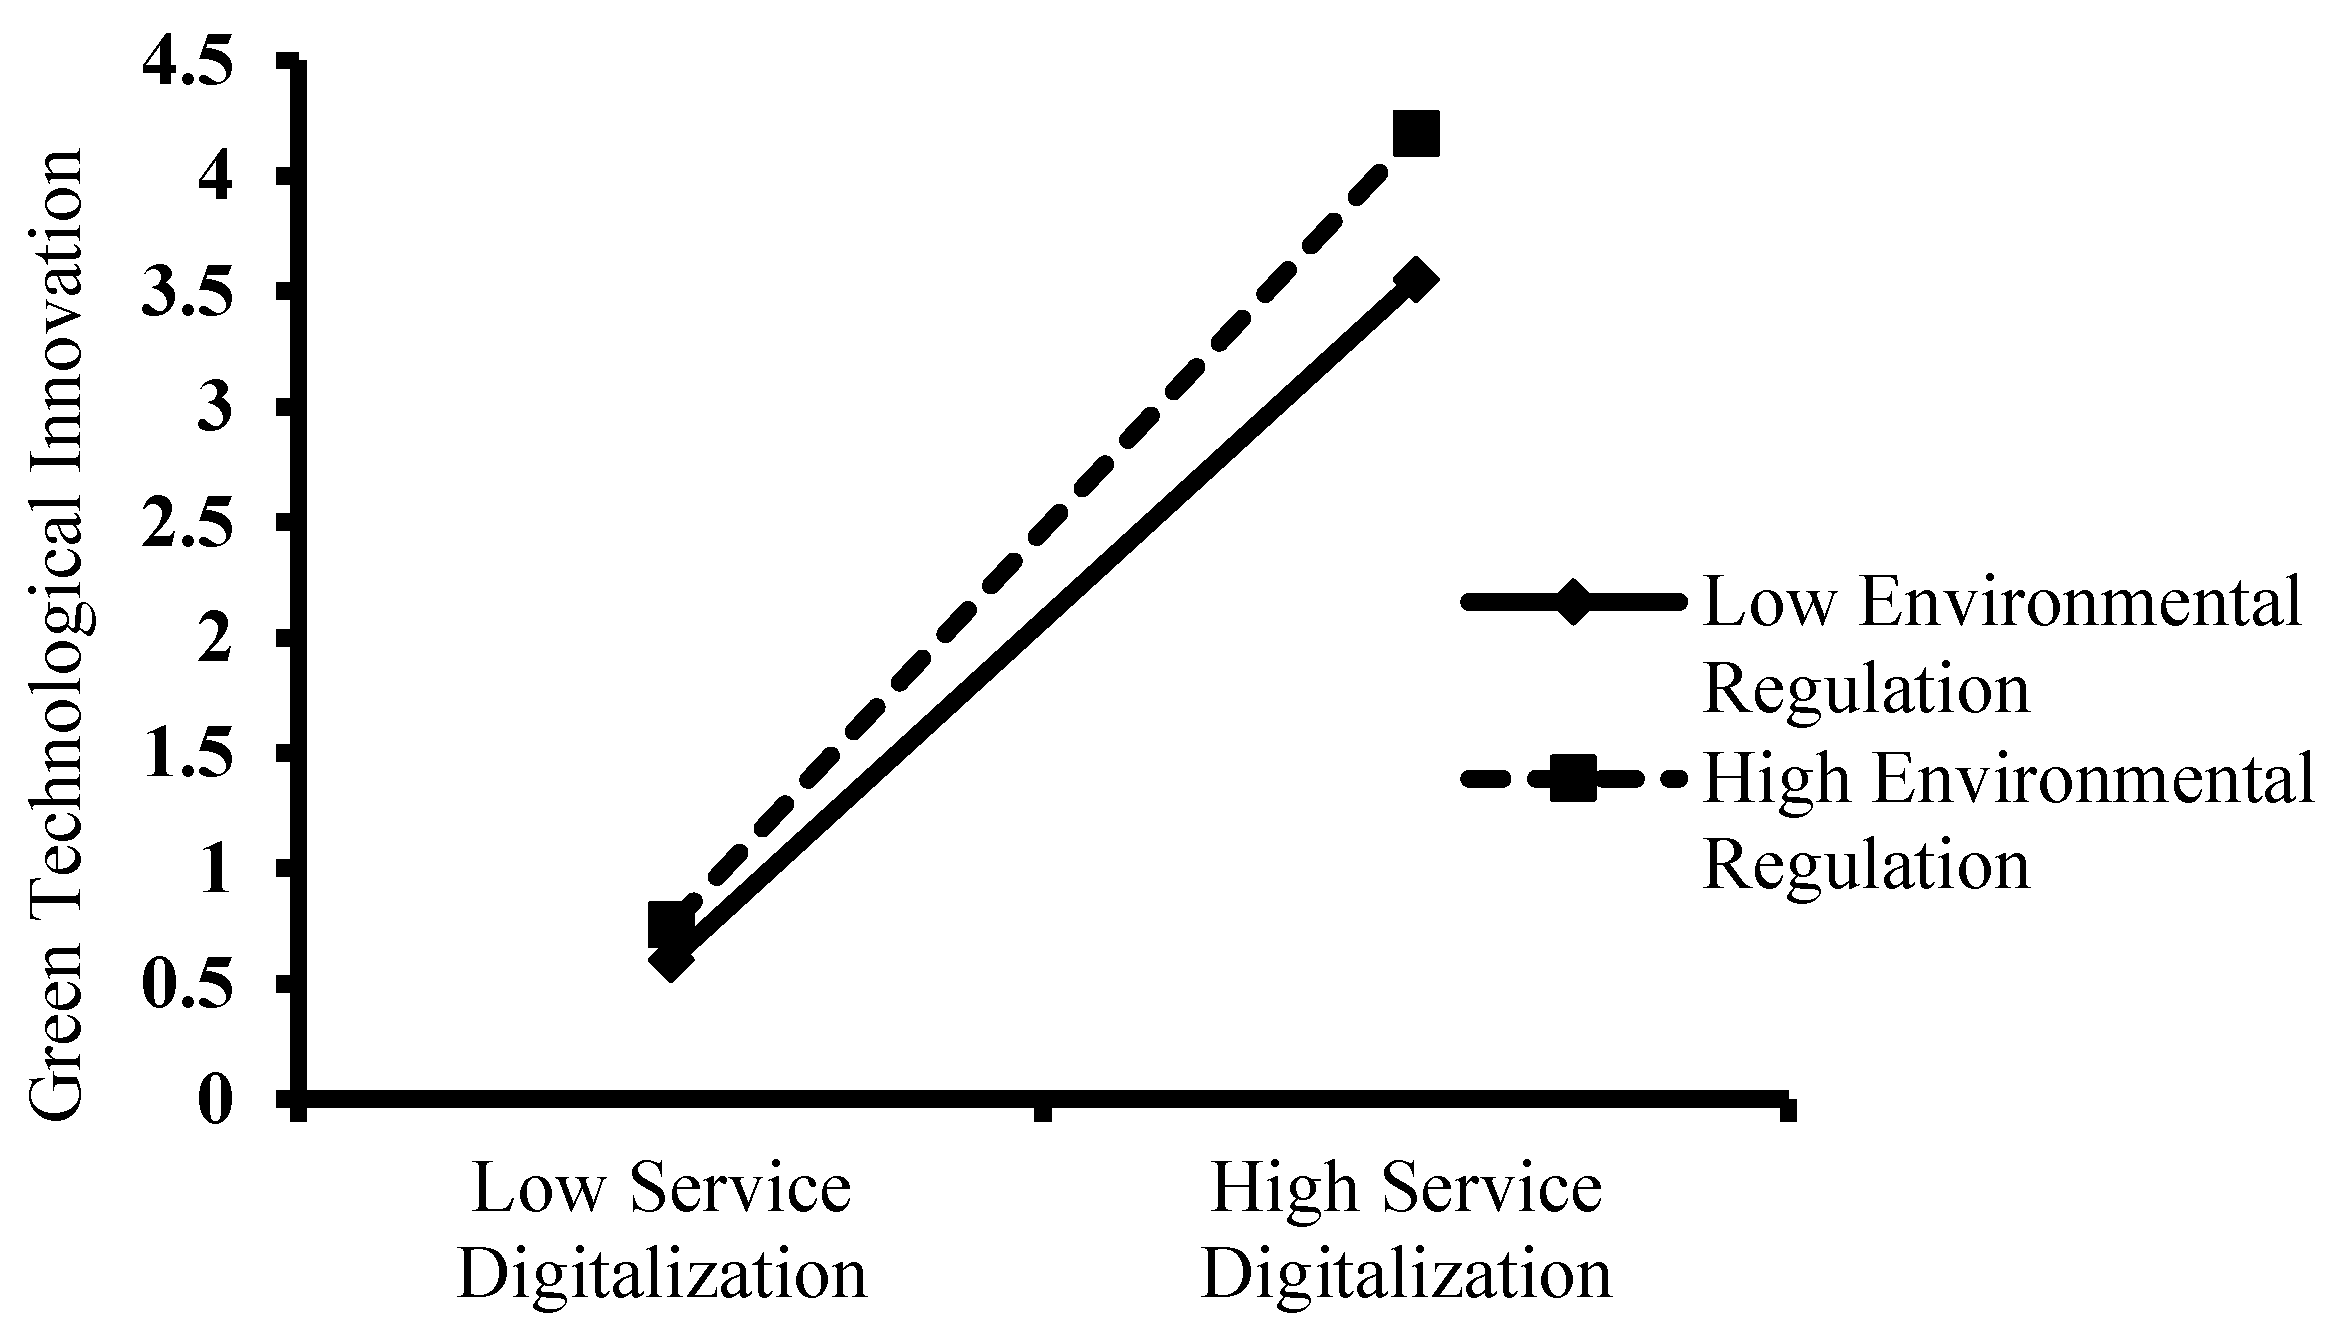
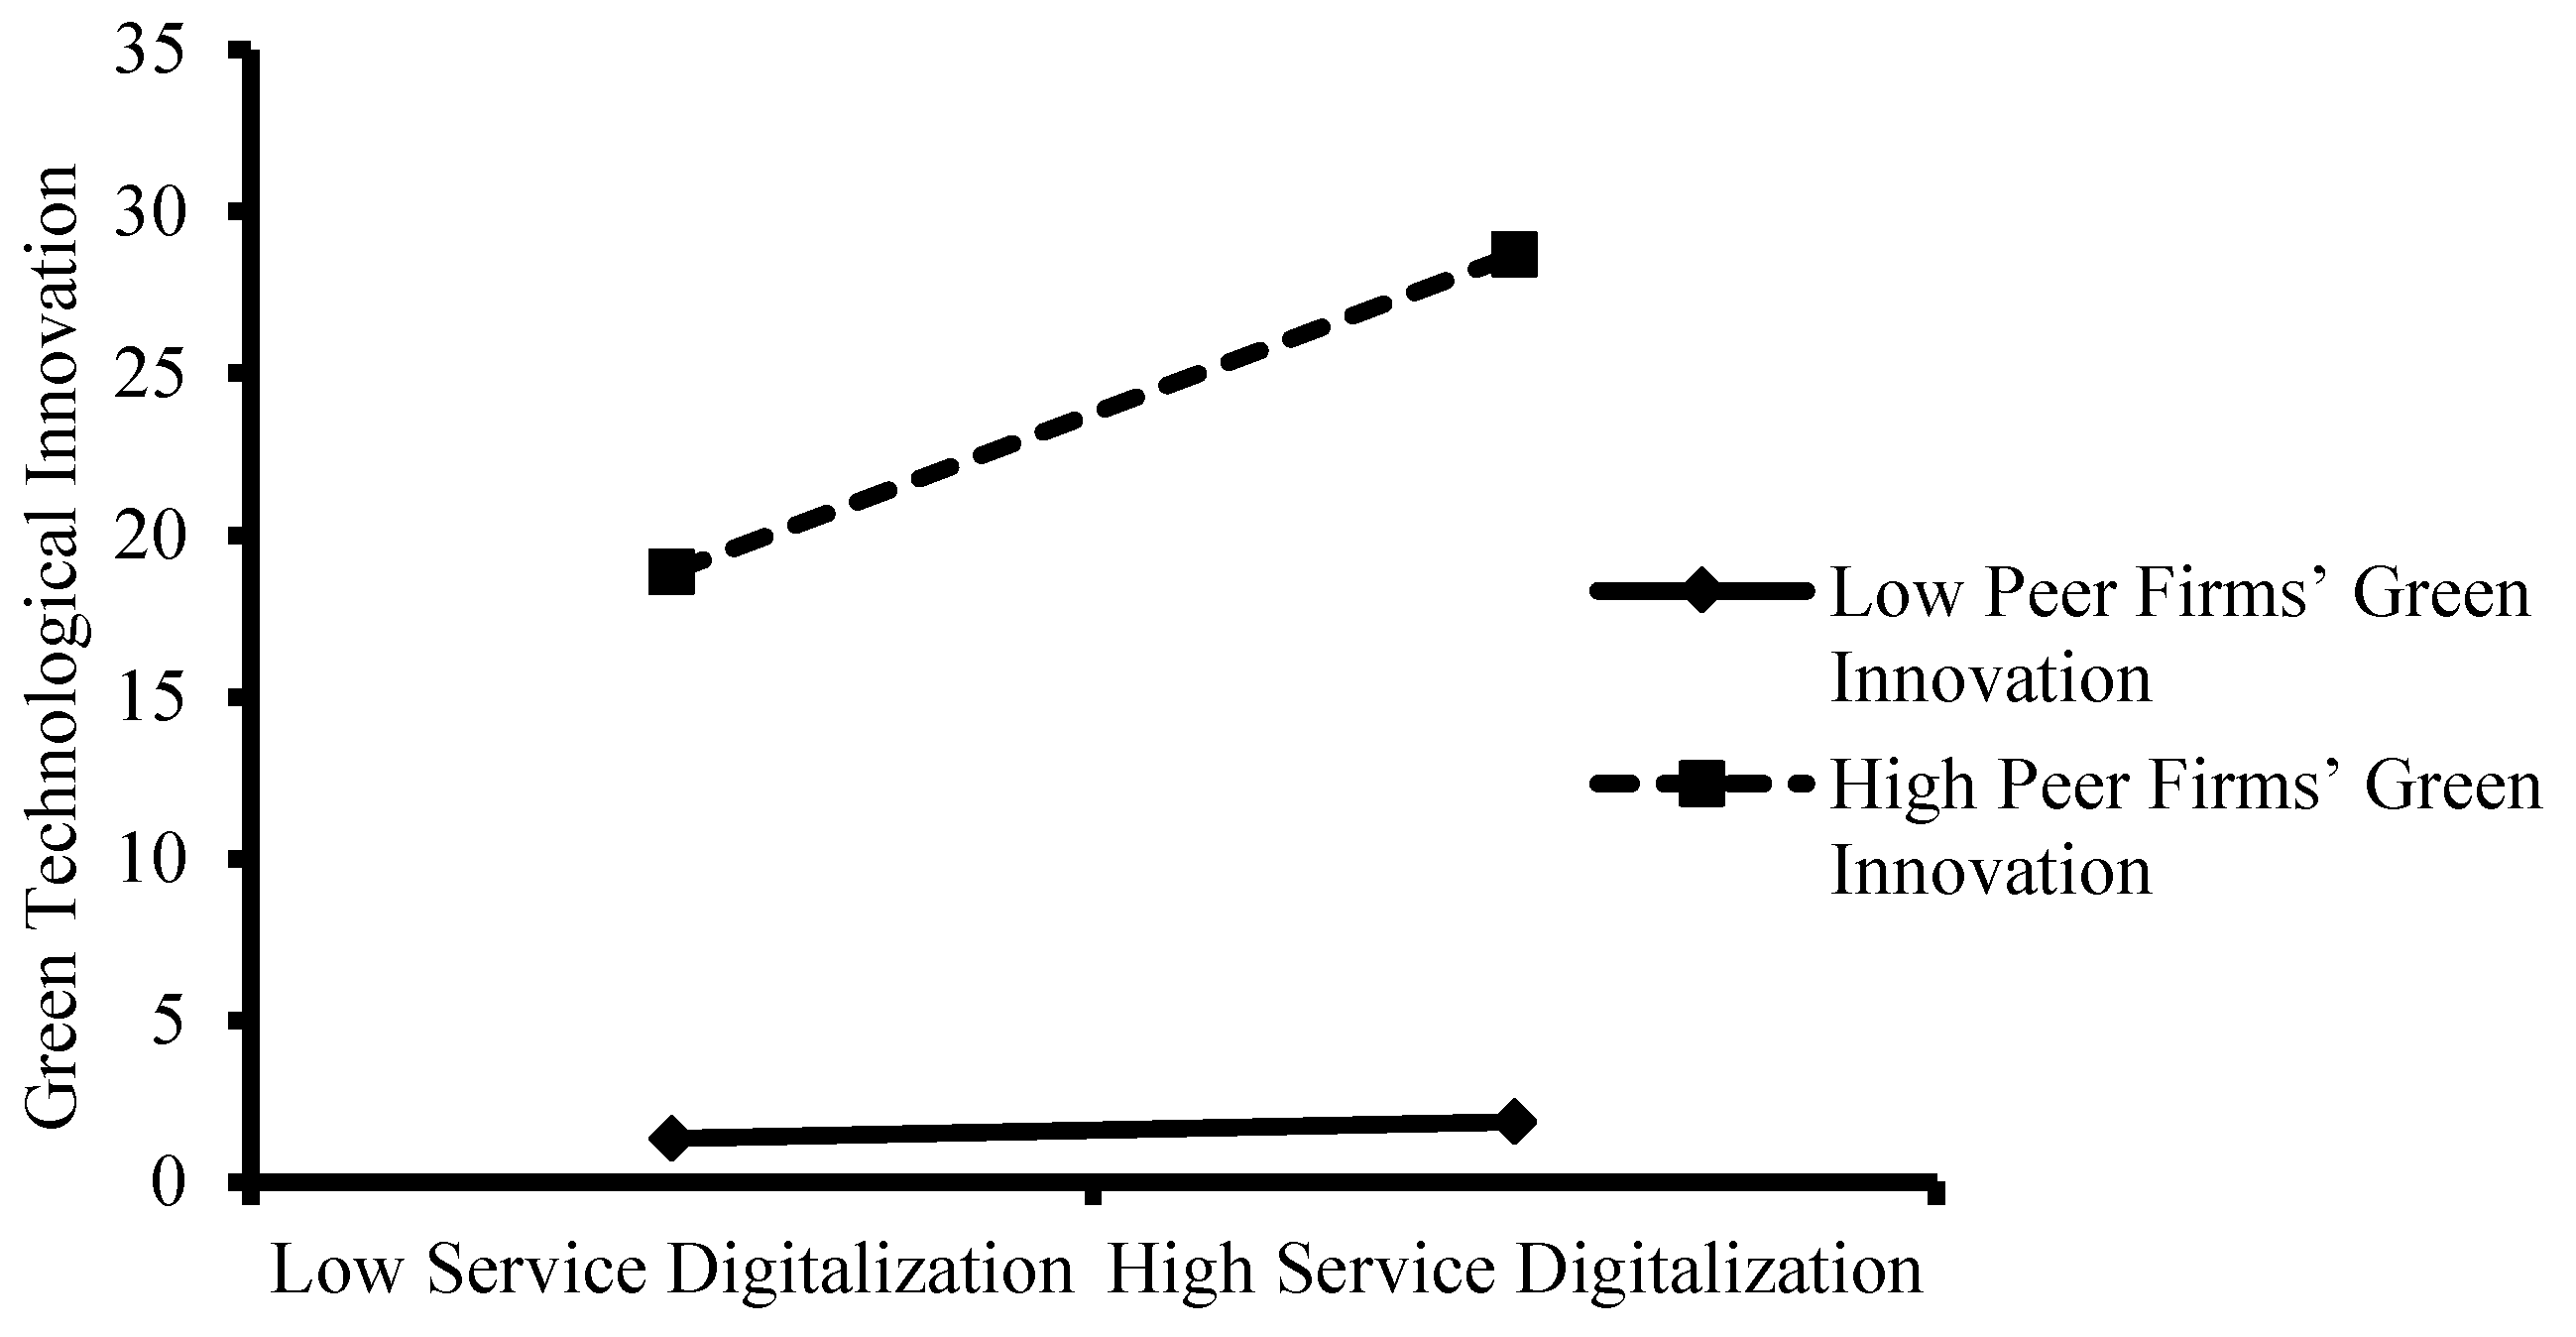
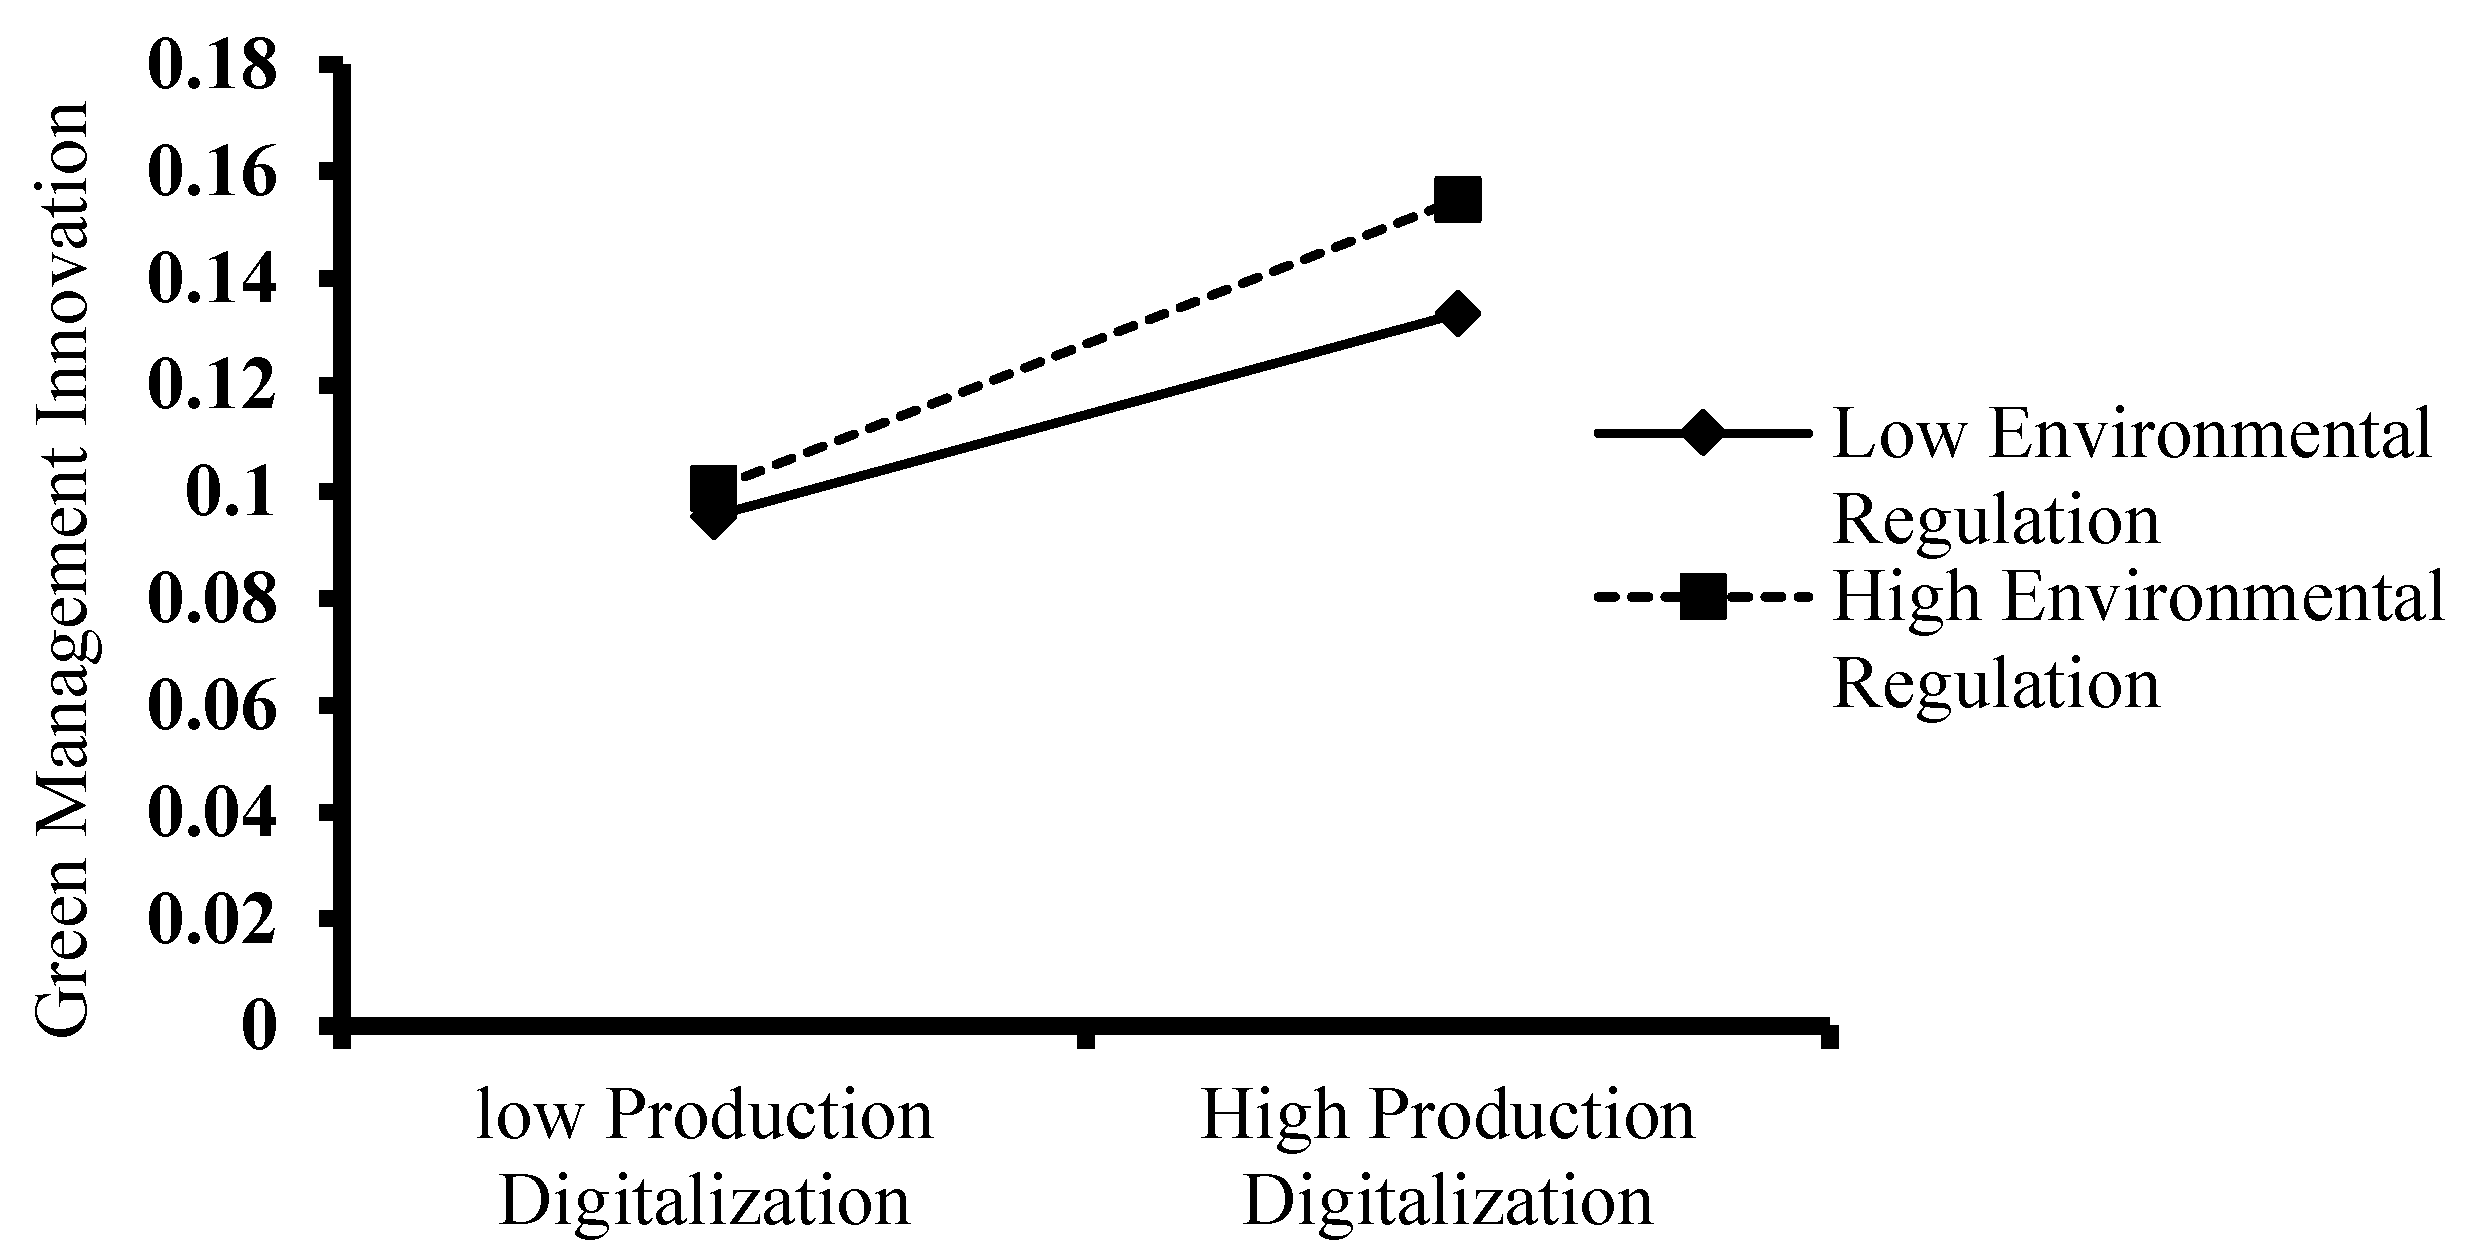
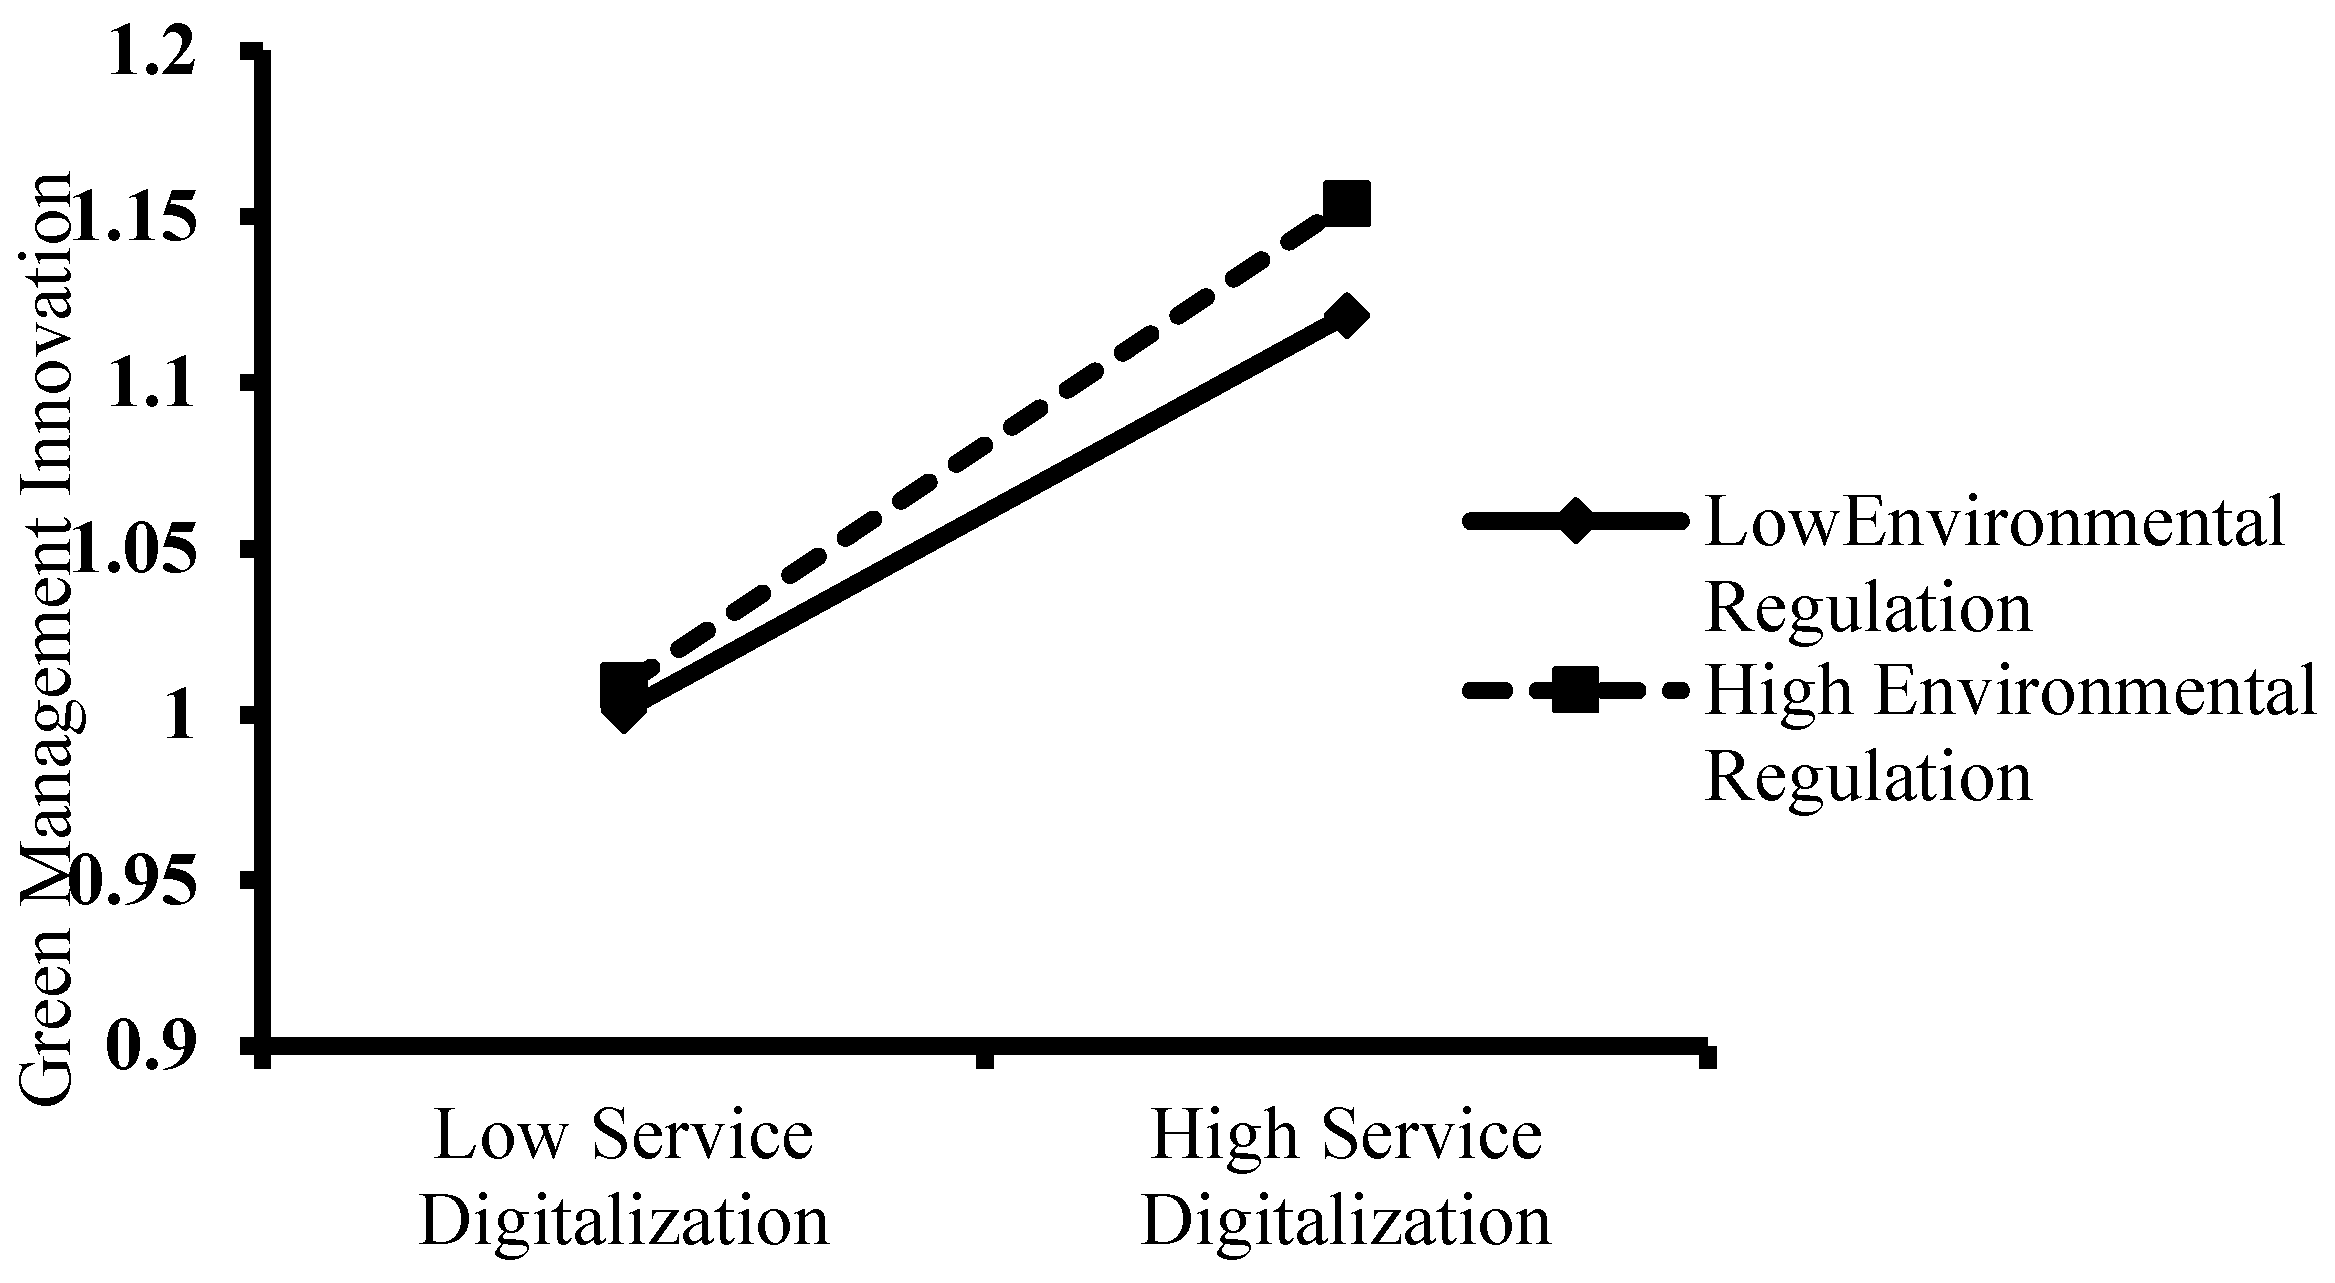
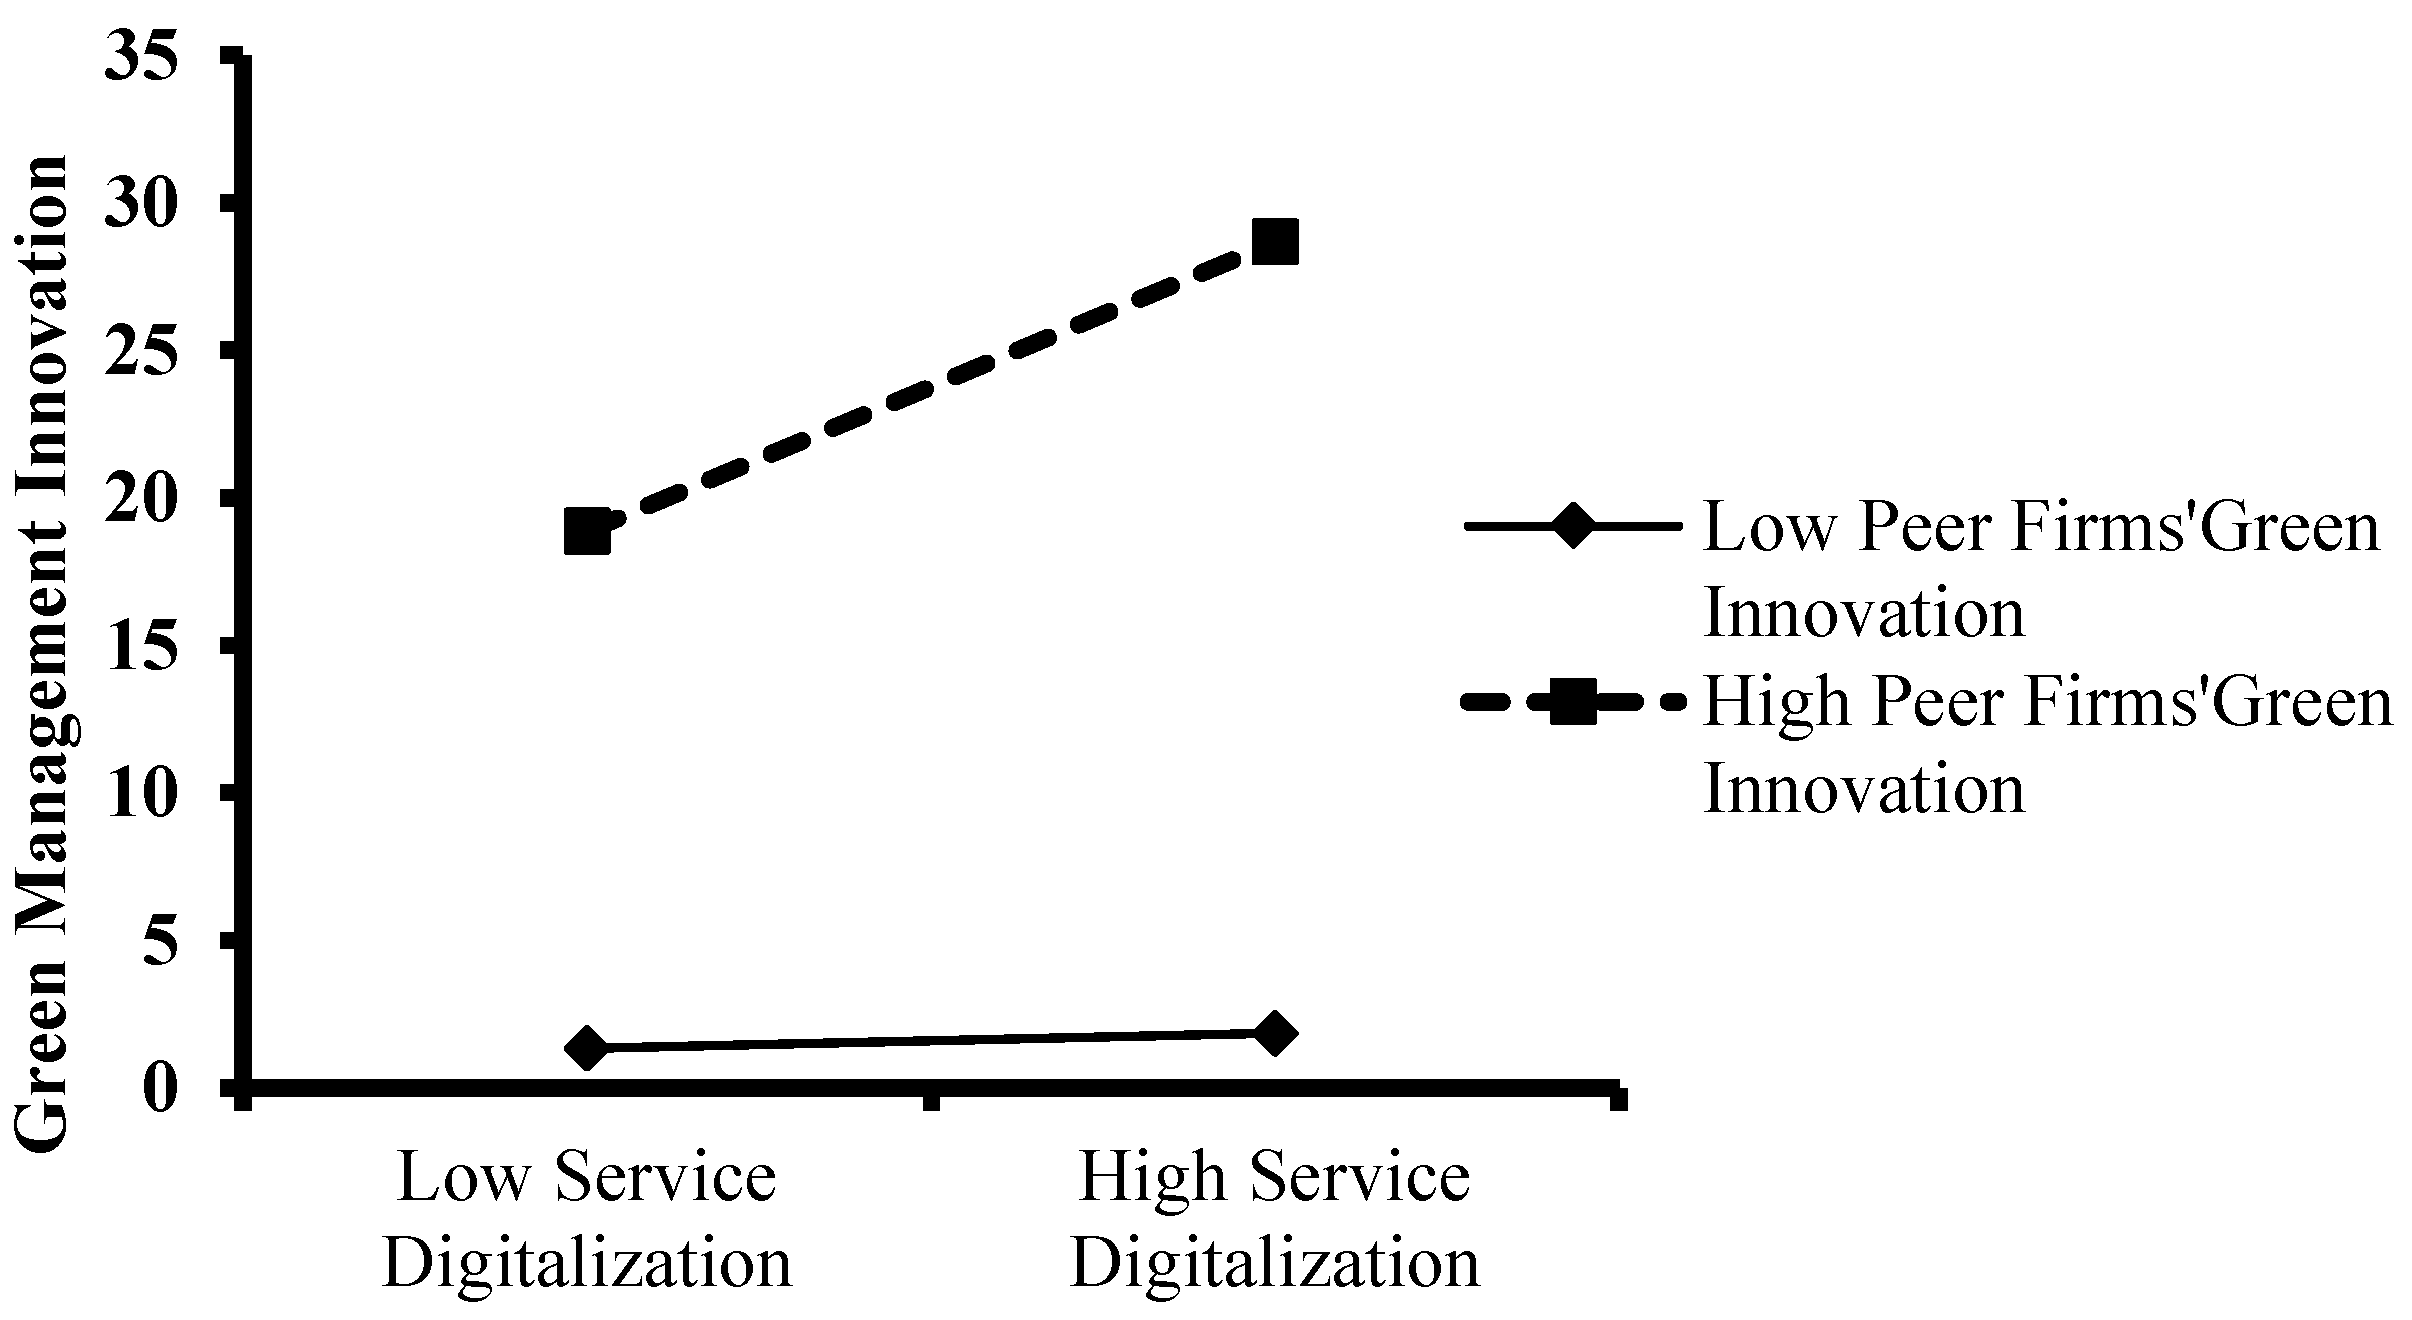
| Variables | Definition |
|---|---|
| Green technological innovation | The number of green invention patent application. |
| Green management innovation | The comprehensive scores obtained by the five indicators. |
| Production digitalization | whether the firm has undergone digital transformation in the production and manufacturing-related processes, Yes =1, No=0. |
| Service digitalization | whether the firm has undergone digital transformation in the marketing and customer service-related processes, Yes =1, No=0. |
| Environmental regulation | the proportion of industrial pollution control completed investment in the added value of the secondary industry. |
| Peer Firms’ Green Innovation | the average green innovation of the same year and industry, excluding the focus firm itself. |
| Chairman | whether the CEO also serves as the chairman, Yes =1, No=0. |
| CEO political connections | Whether the CEO is a representative of the National People’s Congress or the Chinese People’s Political Consultative Conference, Yes =1, No=0. |
| Equity concentration | The sum of the shareholding percentages of the top three shareholders. |
| Firm history | Total number of years since the firm established. |
| Firm performance | Return on assets (ROA) |
| HHI | Herfindahl Index is calculated by the firm’s market share in the industry based on the book value of its owners’ equity。 |
| Integration Index | The index of industry integration of informatization and industrialization. |
| Financial constraints | Asset-liability ratio. |
| State-owned shares holding ratio | The ratio of state-owned shares in the total capital stock. |
| Directors scale | Number of board directors. |
| CEO’s age | Number of years from the CEO’s birth to the sample year. |
| CEO’s education | Below a bachelor’s degree are represented by 0;a bachelor’s degree is represented by 1; a master’s degree is represented by 2; a doctoral degree is represented by 3. |
| Variables | Mean | S.D | Max | Min |
| Green technological innovation | 1.667 | 6.396 | 0 | 49 |
| Green management innovation | 1.360 | 1.402 | 0 | 5 |
| Production digitalization | 0.501 | 0.5 | 0 | 1 |
| Service digitalization | 0.336 | 0.472 | 0 | 1 |
| Support digitalization | 0.577 | 0.494 | 0 | 1 |
| Environmental regulation | 0.202 | 0.162 | 0 | 2.451 |
| Peer firms’ green innovation | 2.396 | 4.031 | 0 | 27.261 |
| Production staff scale | 8.051 | 1.308 | 1.609 | 11.033 |
| Chairman | 0.245 | 0.43 | 0 | 1 |
| CEO political connections | 0.082 | 0.274 | 0 | 1 |
| Equity concentration | 48.611 | 20.144 | 0 | 87.71 |
| Firm history | 12.023 | 6.938 | 1 | 29 |
| Firm performance | 0.067 | 0.053 | -0.054 | 0.229 |
| HHI | 0.058 | 0.049 | 0.011 | 0.243 |
| Integration index | 49.385 | 5.754 | 38.34 | 62.1 |
| Financial constraints | 0.441 | 0.184 | 0.06 | 0.815 |
| State-owned shares holding ratio | 6.412 | 16.428 | 0 | 69.27 |
| Directors scale | 8.874 | 1.808 | 5 | 18 |
| CEO’s age | 49.836 | 6.367 | 30 | 75 |
| CEO’s education | 3.498 | 0.945 | 0 | 6 |
| 1 | 2 | 3 | 4 | 5 | 6 | 7 | 8 | 9 | 10 | |
| 1. Green technological innovation | 1 | |||||||||
| 2. Green management innovation | 0.113*** | 1 | ||||||||
| 3. Production digitalization | 0.042*** | 0.022 | 1 | |||||||
| 4. Service digitalization | 0.141*** | 0.026* | 0.339*** | 1 | ||||||
| 5. Support digitalization | 0.021 | 0.057*** | 0.500*** | 0.286*** | 1 | |||||
| 6.Environmental regulation | 0.049*** | 0.027* | -0.019 | -0.159*** | -0.02 | 1 | ||||
| 7. Peer Firms’ Green Innovation | 0.190*** | 0.021 | 0.135*** | 0.227*** | 0.065*** | 0.039*** | 1 | |||
| 8.Production staff scale | 0.181*** | 0.229*** | 0.198*** | 0.064*** | 0.153*** | 0.046*** | 0.103*** | 1 | ||
| 9. Chairman | 0.045*** | -0.067*** | 0.005 | 0.045*** | -0.004 | -0.065*** | 0.055*** | -0.055*** | 1 | |
| 10. CEO political connections | 0.074*** | 0.027* | -0.001 | -0.036** | 0 | 0.011 | -0.001 | -0.046*** | 0.225*** | 1 |
| 11. Equity concentration | 0.005 | 0.050*** | 0.022 | -0.049*** | -0.007 | -0.012 | 0.01 | 0.112*** | -0.031** | -0.007 |
| 12. Firm history | 0.041*** | 0.097*** | 0.186*** | 0.120*** | 0.256*** | 0.042*** | -0.015 | 0.334*** | -0.213*** | -0.141*** |
| 13. Firm performance | -0.026* | -0.037** | 0.008 | -0.028* | 0.001 | -0.103*** | -0.045*** | -0.222*** | 0.120*** | 0.047*** |
| 14. HHI | 0.008 | 0.013 | -0.037** | -0.119*** | 0.014 | 0.064*** | -0.027* | 0.248*** | -0.103*** | -0.051*** |
| 15. Integration Index | 0.027* | 0.017 | 0.434*** | 0.410*** | 0.411*** | -0.176*** | 0.167*** | 0.110*** | 0.062*** | -0.054*** |
| 16. Financial constraints | 0.132*** | 0.116*** | 0.018 | 0.029** | 0.036** | 0.078*** | 0.095*** | 0.461*** | -0.092*** | -0.036** |
| 17. State-owned shares holding ratio | 0.023 | 0.081*** | -0.035** | -0.011 | -0.029* | 0.028* | 0.029* | 0.123*** | -0.134*** | -0.045*** |
| 18. Directors scale | 0.063*** | 0.141*** | 0.01 | -0.052*** | -0.005 | 0.104*** | -0.040*** | 0.205*** | -0.161*** | -0.015 |
| 19. CEO’s age | 0.02 | 0.016 | 0.085*** | 0.069*** | 0.098*** | -0.028* | -0.035** | 0.097*** | 0.221*** | 0.001 |
| 20. CEO’s education | 0.104*** | 0.065*** | 0.017 | 0.091*** | 0.009 | -0.015 | 0.023 | 0.069*** | 0.02 | 0.034** |
| Variables | Model 1 | Model 2 | Model 3 | Model 4 | Model 5 |
| Production digitalization | 0.891*** | 0.636*** | 0.818*** | 0.777*** | |
| (0.301) | (0.158) | (0.164) | (0.163) | ||
| Service digitalization | 0.794*** | 0.392*** | 0.608*** | 0.547*** | |
| (0.325) | (0.143) | (0.149) | (0.150) | ||
| Production digitalization * Environmental regulation | 0.181* | 0.175* | |||
| (0.101) | (0.100) | ||||
| Service digitalization* Environmental regulation | 0.375*** | 0.394*** | |||
| (0.101) | (0.100) | ||||
| Production digitalization* Peer firms’ green innovation | 0.028 | 0.031 | |||
| (0.115) | (0.115) | ||||
| Service digitalization * Peer firms’ green innovation | 0.252** | 0.245** | |||
| (0.107) | (0.107) | ||||
| Environmental regulation | 2.301** | 2.385** | 0.306** | 2.335** | 0.365** |
| (1.014) | (1.012) | (0.148) | (1.011) | (0.148) | |
| Peer firms’ green innovation | 0.288*** | 0.284*** | 0.279*** | 0.965*** | 0.978*** |
| (0.045) | (0.045) | (0.045) | (0.178) | (0.178) | |
| Support digitalization | 0.507* | 0.208 | 0.075 | 0.071 | 0.060 |
| (0.296) | (0.303) | (0.124) | (0.125) | (0.124) | |
| Production staff scale | 0.185 | 0.092 | 0.087 | 0.113 | 0.108 |
| (0.208) | (0.209) | (0.208) | (0.209) | (0.208) | |
| Chairman | -0.060 | -0.082 | -0.148 | -0.079 | -0.145 |
| (0.359) | (0.358) | (0.357) | (0.358) | (0.357) | |
| CEO political connections | -0.889* | -0.838* | -0.813* | -0.869* | -0.843* |
| (0.463) | (0.461) | (0.460) | (0.461) | (0.460) | |
| Equity concentration | 0.004 | 0.007 | 0.005 | 0.004 | 0.002 |
| (0.014) | (0.014) | (0.014) | (0.014) | (0.014) | |
| Firm history | -0.359*** | -0.441*** | -0.405*** | -0.446*** | -0.411*** |
| (0.127) | (0.128) | (0.128) | (0.128) | (0.128) | |
| Firm performance | 8.305*** | 8.641*** | 8.173*** | 8.666*** | 8.203*** |
| (2.618) | (2.610) | (2.607) | (2.609) | (2.606) | |
| HHI | 8.601 | 8.987 | 9.633 | 9.178 | 9.835 |
| (6.170) | (6.150) | (6.136) | (6.171) | (6.159) | |
| Integration Index | 0.115 | 0.110 | 0.099 | 0.116 | 0.105 |
| (0.071) | (0.071) | (0.071) | (0.071) | (0.071) | |
| Financial constraints | 0.499 | 0.747 | 0.875 | 0.681 | 0.808 |
| (0.999) | (0.997) | (0.995) | (0.998) | (0.995) | |
| State-owned shares holding ratio | 0.001 | 0.001 | -0.000 | 0.001 | -0.000 |
| (0.008) | (0.008) | (0.008) | (0.008) | (0.008) | |
| Directors scale | 0.130 | 0.129 | 0.116 | 0.112 | 0.100 |
| (0.101) | (0.101) | (0.101) | (0.101) | (0.101) | |
| CEO’s age | 0.029 | 0.025 | 0.027 | 0.025 | 0.027 |
| (0.024) | (0.024) | (0.024) | (0.024) | (0.024) | |
| CEO’s education | 0.405** | 0.404** | 0.365** | 0.403** | 0.365** |
| (0.161) | (0.160) | (0.160) | (0.160) | (0.160) | |
| Constant | -9.066*** | -7.920** | -5.471* | -5.991* | -5.598* |
| (3.217) | (3.216) | (3.225) | (3.244) | (3.239) | |
| Year | Yes | Yes | Yes | Yes | Yes |
| Industry | Yes | Yes | Yes | Yes | Yes |
| R-squared | 0.080 | 0.087 | 0.092 | 0.089 | 0.094 |
| Variables | Model 1 | Model 2 | Model 3 | Model 4 | Model 5 |
| Production digitalization | 0.115* | 0.028 | 0.021 | 0.026 | |
| (0.069) | (0.036) | (0.037) | (0.037) | ||
| Service digitalization | 0.162** | 0.073** | 0.075** | 0.073** | |
| (0.074) | (0.034) | (0.035) | (0.035) | ||
| Production digitalization * Environmental regulation | 0.039* | 0.038* | |||
| (0.023) | (0.023) | ||||
| Service digitalization* Environmental regulation | 0.045* | 0.045* | |||
| (0.024) | (0.024) | ||||
| Production digitalization* Peer firms’ green innovation | -0.019 | -0.018 | |||
| (0.027) | (0.027) | ||||
| Service digitalization* Peer firms’ green innovation | 0.045* | 0.045* | |||
| (0.025) | (0.025) | ||||
| Environmental regulation | 0.100 | 0.120 | 0.018 | 0.123 | 0.017 |
| (0.232) | (0.232) | (0.033) | (0.232) | (0.034) | |
| Peer firms’ green innovation | -0.001 | -0.002 | -0.003 | -0.001 | -0.001 |
| (0.010) | (0.010) | (0.010) | (0.042) | (0.042) | |
| Support digitalization | 0.024 | 0.029 | 0.012 | 0.012 | 0.012 |
| (0.068) | (0.069) | (0.029) | (0.029) | (0.029) | |
| Production staff scale | 0.075 | 0.072 | 0.074 | 0.072 | 0.074 |
| (0.048) | (0.048) | (0.048) | (0.048) | (0.048) | |
| Chairman | -0.144* | -0.146* | -0.149* | -0.146* | -0.149* |
| (0.082) | (0.082) | (0.082) | (0.082) | (0.082) | |
| CEO political connections | 0.130 | 0.125 | 0.129 | 0.123 | 0.127 |
| (0.106) | (0.106) | (0.106) | (0.106) | (0.106) | |
| Equity concentration | -0.004 | -0.003 | -0.003 | -0.003 | -0.003 |
| (0.003) | (0.003) | (0.003) | (0.003) | (0.003) | |
| Firm history | -0.045 | -0.042 | -0.040 | -0.043 | -0.041 |
| (0.029) | (0.029) | (0.029) | (0.029) | (0.029) | |
| Firm performance | 1.299** | 1.322** | 1.272** | 1.316** | 1.266** |
| (0.598) | (0.597) | (0.598) | (0.598) | (0.599) | |
| HHI | -2.321 | -2.280 | -2.207 | -2.370* | -2.290 |
| (1.416) | (1.415) | (1.416) | (1.421) | (1.422) | |
| Integration Index | 0.019 | 0.019 | 0.019 | 0.018 | 0.018 |
| (0.016) | (0.016) | (0.016) | (0.016) | (0.016) | |
| Financial constraints | 0.261 | 0.261 | 0.268 | 0.264 | 0.271 |
| (0.228) | (0.228) | (0.228) | (0.229) | (0.229) | |
| State-owned shares holding ratio | 0.002 | 0.002 | 0.002 | 0.002 | 0.002 |
| (0.002) | (0.002) | (0.002) | (0.002) | (0.002) | |
| Directors scale | -0.001 | 0.002 | 0.002 | 0.001 | 0.001 |
| (0.023) | (0.023) | (0.023) | (0.023) | (0.023) | |
| CEO’s age | -0.001 | -0.001 | -0.001 | -0.001 | -0.001 |
| (0.006) | (0.005) | (0.006) | (0.006) | (0.006) | |
| CEO’s education | 0.045 | 0.041 | 0.040 | 0.042 | 0.040 |
| (0.037) | (0.037) | (0.037) | (0.037) | (0.037) | |
| Constant | 0.111 | 0.097 | 0.098 | 0.182 | 0.147 |
| (0.734) | (0.736) | (0.740) | (0.744) | (0.744) | |
| Year | Yes | Yes | Yes | Yes | Yes |
| Industry | Yes | Yes | Yes | Yes | Yes |
| R-squared | 0.051 | 0.053 | 0.054 | 0.053 | 0.054 |
| Variables | Model 1 | Model 2 | Model 3 | Model 4 | Model 5 |
| Tobin’s Q | ROA | Sales | Environmental performance | Environmental honors | |
| green technological innovation | 0.074** | 0.004** | 0.003** | 0.122 | 0.213*** |
| (0.032) | (0.002) | (0.001) | (0.078) | (0.054) | |
| green management innovation | 0.008 | -0.001 | -0.001 | 0.206*** | 0.566*** |
| (0.016) | (0.001) | (0.001) | (0.038) | (0.033) | |
| Production staff scale | 0.078* | -0.004* | -0.004** | 0.114 | 0.262*** |
| (0.042) | (0.002) | (0.002) | (0.102) | (0.049) | |
| Chairman | -0.098 | 0.007** | 0.004 | -0.111 | 0.269** |
| (0.065) | (0.004) | (0.003) | (0.156) | (0.114) | |
| CEO political connections | -0.243*** | -0.004 | 0.001 | -0.065 | -0.203 |
| (0.089) | (0.005) | (0.003) | (0.216) | (0.170) | |
| Equity concentration | -0.011*** | -0.000 | -0.000 | 0.013** | -0.004 |
| (0.003) | (0.000) | (0.000) | (0.006) | (0.003) | |
| Firm history | -0.078*** | 0.005*** | 0.003*** | 0.087 | -0.002 |
| (0.027) | (0.002) | (0.001) | (0.065) | (0.008) | |
| HHI | -0.683 | 0.099 | 0.115** | -0.305 | -2.052* |
| (1.369) | (0.077) | (0.053) | (3.308) | (1.201) | |
| Integration Index | 0.038*** | -0.001** | -0.001*** | 0.071** | 0.047 |
| (0.012) | (0.001) | (0.000) | (0.030) | (0.036) | |
| Financial constraints | -0.083 | -0.019* | -0.041*** | 0.681 | 0.376 |
| (0.188) | (0.011) | (0.007) | (0.454) | (0.320) | |
| R&D Investment Intensity | 0.010 | -0.004*** | -0.003*** | 0.030 | -0.026 |
| (0.010) | (0.001) | (0.000) | (0.025) | (0.019) | |
| Constant | 0.999* | 0.186*** | 0.180*** | -4.761*** | -6.840*** |
| (0.550) | (0.031) | (0.021) | (1.329) | (1.620) | |
| Year | Yes | Yes | Yes | Yes | Yes |
| Industry | Yes | Yes | Yes | Yes | Yes |
| R-squared | 0.091 | 0.050 | 0.074 | 0.060 | 0.085 |
Disclaimer/Publisher’s Note: The statements, opinions and data contained in all publications are solely those of the individual author(s) and contributor(s) and not of MDPI and/or the editor(s). MDPI and/or the editor(s) disclaim responsibility for any injury to people or property resulting from any ideas, methods, instructions or products referred to in the content. |
© 2024 by the authors. Licensee MDPI, Basel, Switzerland. This article is an open access article distributed under the terms and conditions of the Creative Commons Attribution (CC BY) license (http://creativecommons.org/licenses/by/4.0/).


