Preprint
Article

Resolving Contrast and Detail Trade-Offs in Image Processing with Multi-Objective Optimization

Altmetrics

Downloads

76

Views

76

Comments

0

A peer-reviewed article of this preprint also exists.

This version is not peer-reviewed

Submitted:

22 August 2024

Posted:

22 August 2024

You are already at the latest version

Alerts
Abstract
This article addresses the complex challenge of simultaneously enhancing contrast and detail in an image, where improving one property often compromises the other. This trade-off is tackled using a multi-objective optimization approach. Specifically, the proposal's model integrates the sigmoid transformation function and unsharp masking highboost filtering with the NSGA-II algorithm. Additionally, a posterior preference articulation is introduced to select three key solutions from the Pareto front: the maximum contrast solution, the maximum detail solution, and the knee point solution. The proposed technique is evaluated on a range of image types, including medical and natural scenes. The final solutions demonstrated significant superiority in terms of contrast and detail compared to the original images. The three selected solutions, although all are optimal, captured distinct characteristics within the images, offering different solutions according to field preferences. This highlights the method's effectiveness across different types and enhancement requirements and emphasizes the importance of the proposed preferences in different contexts.
Keywords: 
Subject: Computer Science and Mathematics  -   Artificial Intelligence and Machine Learning

1. Introduction

Image enhancement is the process of applying specific techniques to boost an image’s visual quality. These techniques can imply diverse criteria, such as increasing the image contrast, noise reduction, highlighting relevant details, or adjusting brightness and color saturation. The main goal of image enhancements is to make the information within the image more easily interpretable and perceptible to human viewers, as well as to boost the automatic process of applications such as pattern recognition, medical analysis, and computer vision, among others [1,2,3].
Traditional image enhancement methods are divided into two well-defined categories [4,5]. The first one is the spatial domain enhancement that directly modifies pixel values to adjust aspects such as contrast and image detail, using techniques like smoothing and highlighting filters. The second one is the frequency domain enhancement, which transforms the image into a mathematical domain to adjust the frequency components, allowing fine detail enhancement and reduction of undesirable patterns through techniques such as high-pass or low-pass filtering. Both categories have specific applications and are chosen according to the type of improvement desired.
It is remarkable that not all images require the same enhancement process since the enhancement strategy relies upon the image’s specific characteristics. For example, a low-contrast image can significantly benefit from spatial domain enhancement techniques, like the contrast adjustment or the histogram equalization approach, which enhance the image’s sharpness [6,7]. On the other hand, in medical images such as magnetic resonances, the fine details highlighting can be critical; therefore, frequency domain enhancement techniques are more suitable for adjusting the high frequencies and spotlighting the image’s internal structures [8]. Hence, there is no unique ideal operator for all images, and there is no unique quantitative metric that automatically evaluates the image quality. Automatic image enhancement is a process that produces enhanced images without human intervention and is an extremely complicated task in image processing [9].
Image enhancement methods are commonly parametric, implying that their efficacy significantly relies upon fine-tuning various parameters. Within this context, evolutionary algorithms (EAs) stand out as highly effective tools. Pioneer work in this area is that of Bhandarkar, et al. [10], where a genetic algorithm (GA) is employed for an image segmentation problem. The outcomes showed that the GA outperforms traditional image segmentation methods regarding accuracy and robustness against noise. In the following years, numerous studies have proposed different approaches to address image enhancement problems through EAs. In [11], an optimization-based process solved through the particle swarm optimization (PSO) algorithm is employed to enhance the contrast and details of images by adjusting the parameters of the transformation function. This adjustment takes into account the relationship between local and global information. Subsequently, in [12], an accelerated variant of PSO for the aforementioned transformation function is proposed, achieving a more efficient algorithm in terms of convergence.
The use of EAs to solve image enhancement problems remains a common trend in recent years. This is observed in works such as [13], where the differential evolution (DE) algorithm is employed to maximize image contrast through a modified sigmoid transformation function. This function adjusts parameters that control the contrast magnitude and the balance between bright and dark areas, with optimal values determined through the evolutionary process. Similarly, Bhandari and Maurya [14] develop a novel optimized histogram equalization method, preserving average brightness while improving the contrast by means of a cuckoo search algorithm. The proposed method uses plateau boundaries to modify the image histogram, avoiding the extreme brightness changes often caused by traditional histogram equalization. In [15], GA is applied to optimize the histogram equalization through optimal subdivision considering different delimited light exposition regions. In [16] the directed searching optimization is applied in the medical image enhancement process, improving the contrast while preserving the texture in specified zones through a threshold parameter. The popularity of EAs has led to more sophisticated approaches, as in [17], where hybridization between whales optimization and chameleon swarm algorithms is proposed specifically to find the optimal parameters of the incomplete beta function and gamma dual correction. Several other EAs have been applied to image enhancement problems, such as monarch butterfly optimization [18], chimp optimization algorithm [19], sunflower optimization [20], slime mold algorithm [21], among others.
In the last decade, multi-objective optimization in image processing has also been the subject of several investigations. The relevance of the multi-objective approach lies in the need to balance multiple quality criteria simultaneously. In many cases, improving one image characteristic may worsen another. This inherent conflict between particular objectives requires an approach that obtains a set of optimal solutions, known as the Pareto front. For example, in [22], a PSO variant is proposed to address a multi-objective problem aimed to simultaneously maximize the available information quantity (by means of the entropy) and minimize the resulting image distortion (measured by the structural similarity index). In [23], GA is employed to maximize the Poisson log-likelihood function (used to measure the quantitative accuracy) and the generalized scan-statistic model (measures the detection performance). Similarly, in [24], a multi-objective cuckoo search algorithm is employed to tune the parameter of adaptive histogram equalization. The objectives were to enhance contrast by maximizing entropy and to minimize fast noise variance estimation. In [25], the Non-dominated Sorting Genetic Algorithm based on Reference Points (NSGA-III) is used to obtain optimal parameters for anisotropic diffusion, aiming to produce effective filtering results. The proposed methodology seeks to balance two competing objectives: image noise content and contrast.
The Pareto front approach implemented in image enhancement tasks offers a variety of solutions. A decision-maker can select the most suitable solution based on the specific needs of the application. In the context of multi-objective optimization, the incorporation of preferences in the decision-maker is known as preference articulation [26,27,28]. Even though preference articulation is a fundamental aspect of multi-objective optimization, its explicit use in works regarding image enhancement with a multi-objective optimization approach seems scarce.
Therefore, the current work is focused on image enhancement, considering two essential properties of image processing: contrast and details. Improving these properties through transformation functions is generally compromised, meaning that increasing contrast can lead to a significant loss of details in the image. Hence, a multi-objective optimization problem with two objective functions is established: one related to the image contrast and the other to the image details. These functions are measured by means of the entropy and the standard deviation for the image contrast, while the pixels’ quantity and intensity in high-frequency regions measure the image details. The contrast enhancement is performed by the sigmoid transform function, and the detail enhancement is performed by the unsharp masking and highboost filtering. To address the problem, the NSGA-II [29] is used with a posterior preference articulation, meaning that specific solutions are selected once the Pareto front is finally computed. The current work offers the following contributions:
  • The trade-off between the enhancement of image contrast and details is set as a multi-objective problem. Unlike the traditional mono-objective approach, which only provides an optimal solution with a predefined priority, the current proposal offers the best solutions regarding the compromises between both criteria along the Pareto front.
  • A posterior preference operator is articulated, providing three key images from the Pareto front: the image with maximum contrast, the image with maximum detail, and the image at the knee of the front, which represents the image closest to the utopia point. This operator allows the user to select the most suitable solutions to their particular needs.
  • An experiment is conducted with images of two categories: medical and natural scene images. Both categories represent research fields where image processing is an essential endeavor. The results of this experiment demonstrate that the NSGA-II achieves images of superior quality compared to the original instances. Furthermore, a thorough analysis is conducted regarding the suitability of the obtained images according to the established preferences. For medical images, the evaluation focuses on how the selected solutions enhance the clarity and detail of relevant structures, which is crucial for diagnostics and analysis. For natural scene images, the analysis shows how the solutions improve contrast and detail, making the images more visually appealing and impactful.
The remainder of this paper is organized as follows: Section 2 outlines the sigmoid correction and unsharp masking with highboost filtering methods used in this study. In Section 3, we present the proposed multi-objective optimization model and posterior preference articulation method. Section 4 provides the benchmark results, including experimental design, graphical analysis, and quantitative evaluations. Finally, Section 5 offers conclusions and suggestions for future research directions.

2. Materials and Methods

2.1. Sigmoid Correction

Sigmoid correction is a technique used in image processing to adjust the contrast of an image in a nonlinear manner. This method is particularly useful for enhancing the contrasts in both dark and bright regions of an image. The correction is achieved using a sigmoid function, which maps the input intensity values to a new range according to a sigmoid curve [13,30,31]. The sigmoid function used for image correction is defined as:
g ( x ) = 1 1 + e α ( x Δ )
where g ( x ) represents the transformed pixel values; x is the original pixel intensity, scaled in the range of 0 to 1; α is the steepness of the sigmoid curve, which controls the degree of contrast adjustment; Δ is a value that determines the midpoint of the sigmoid curve related to the normalized pixel intensity, allowing control over the balance between the bright and dark regions of the image.
The parameter α affects how rapidly the transition occurs between dark and light regions. A higher value of α results in a steeper curve, increasing contrast by making transitions more abrupt, while lower values of α produce a gentler curve with smoother transitions, as shown in Figure 1a. The Δ parameter enables fine-tuning the balance between bright and dark regions. By adjusting this value, you can control where the midpoint of the contrast adjustment occurs, thus affecting how the dark and light areas of the image are processed. A higher Δ value results in a larger range of intensities being considered dark, leading to a darker overall image, whereas a lower value results in a larger range of intensities being considered bright, making the image brighter, as depicted in Figure 1b.

2.2. Unsharp Masking and Highboost Filtering

Unsharp masking and highboost filtering (UMH) are techniques for enhancing image sharpness and detail by manipulating high-frequency components. The process begins with creating a blurred version of the original image using a smoothing filter, such as an average filter. For a filter size of S, the average filter A f R S × S is defined as an S × S squared matrix, where each a i j i , j { 1 , , S } element within A f is equal to 1 S 2 . With S = 5 , the average filter is represented explicitly as follows:
A f = 1 5 2 1 1 1 1 1 1 1 1 1 1 1 1 1 1 1 1 1 1 1 1 1 1 1 1 1
Applying this low-pass filter to the input image yields a blurred version of the original image, denoted as f b ( x ) . In the unsharp masking process, a mask m ( x ) is created by subtracting the blurred image from the original image:
m ( x ) = x f b ( x )
This mask highlights the high-frequency details that are suppressed by the blur. However, not all high-frequency components contribute meaningfully to the image’s detail. To exclude insignificant details, a threshold d t h is applied, where any values in the mask below this threshold are set to zero:
m ( x ) = 0 , if | m ( x ) | d t h m ( x ) , otherwise
This step ensures that only significant details are enhanced. To enhance the image, this mask is then added back to the original image with a scaling factor k to control the extent of the enhancement. The resulting enhanced image g ( x ) is calculated as:
g ( x ) = x + k · m ( x )

3. The Proposed Algorithm

In this section, we present the novel multi-objective optimization model and a posterior preference articulation method developed specifically for this study. This method is designed to find optimal trade-offs between the objective functions, while also providing preferential solutions capable of capturing different characteristics of the images.

3.1. Multi-Objective Optimization Problem

This work focuses on the enhancement of images considering two fundamental properties of image processing: contrast and details. The enhancement of these properties through transformation functions is often compromised, meaning that an increase in contrast can result in a significant loss of details in the image. Therefore, a multi-objective problem is defined with two objective functions:
  • Contrast Function: Defined as the product of entropy H ( I ) and the normalized standard deviation of the pixel intensities σ n o r m ( I ) of the I image. The contrast function is expressed as:
    f 1 ( α , Δ ) = H ( I ) × σ n o r m ( I ) .
  • Details Function: Defined as the product of the number of pixels in high-frequency regions N H F ( I ) and the intensity of these high-frequency pixels I N H F ( I ) of the I image. The details function is denoted as:
    f 2 ( α , Δ ) = N H F ( I ) × log 10 ( log 10 ( I N H F ( I ) ) ) .
Formally, the multi-objective optimization problem can be expressed as in (8), where F = { f 1 , f 2 } represents the set of objective functions to be minimized. The decision vector ϕ = [ α , Δ ] T controls the behavior of the sigmoid correction function, with ϕ m i n as the lower and ϕ m a x as the upper boundary.
min ϕ R 2 F ϕ subject to : ϕ m i n ϕ ϕ m a x
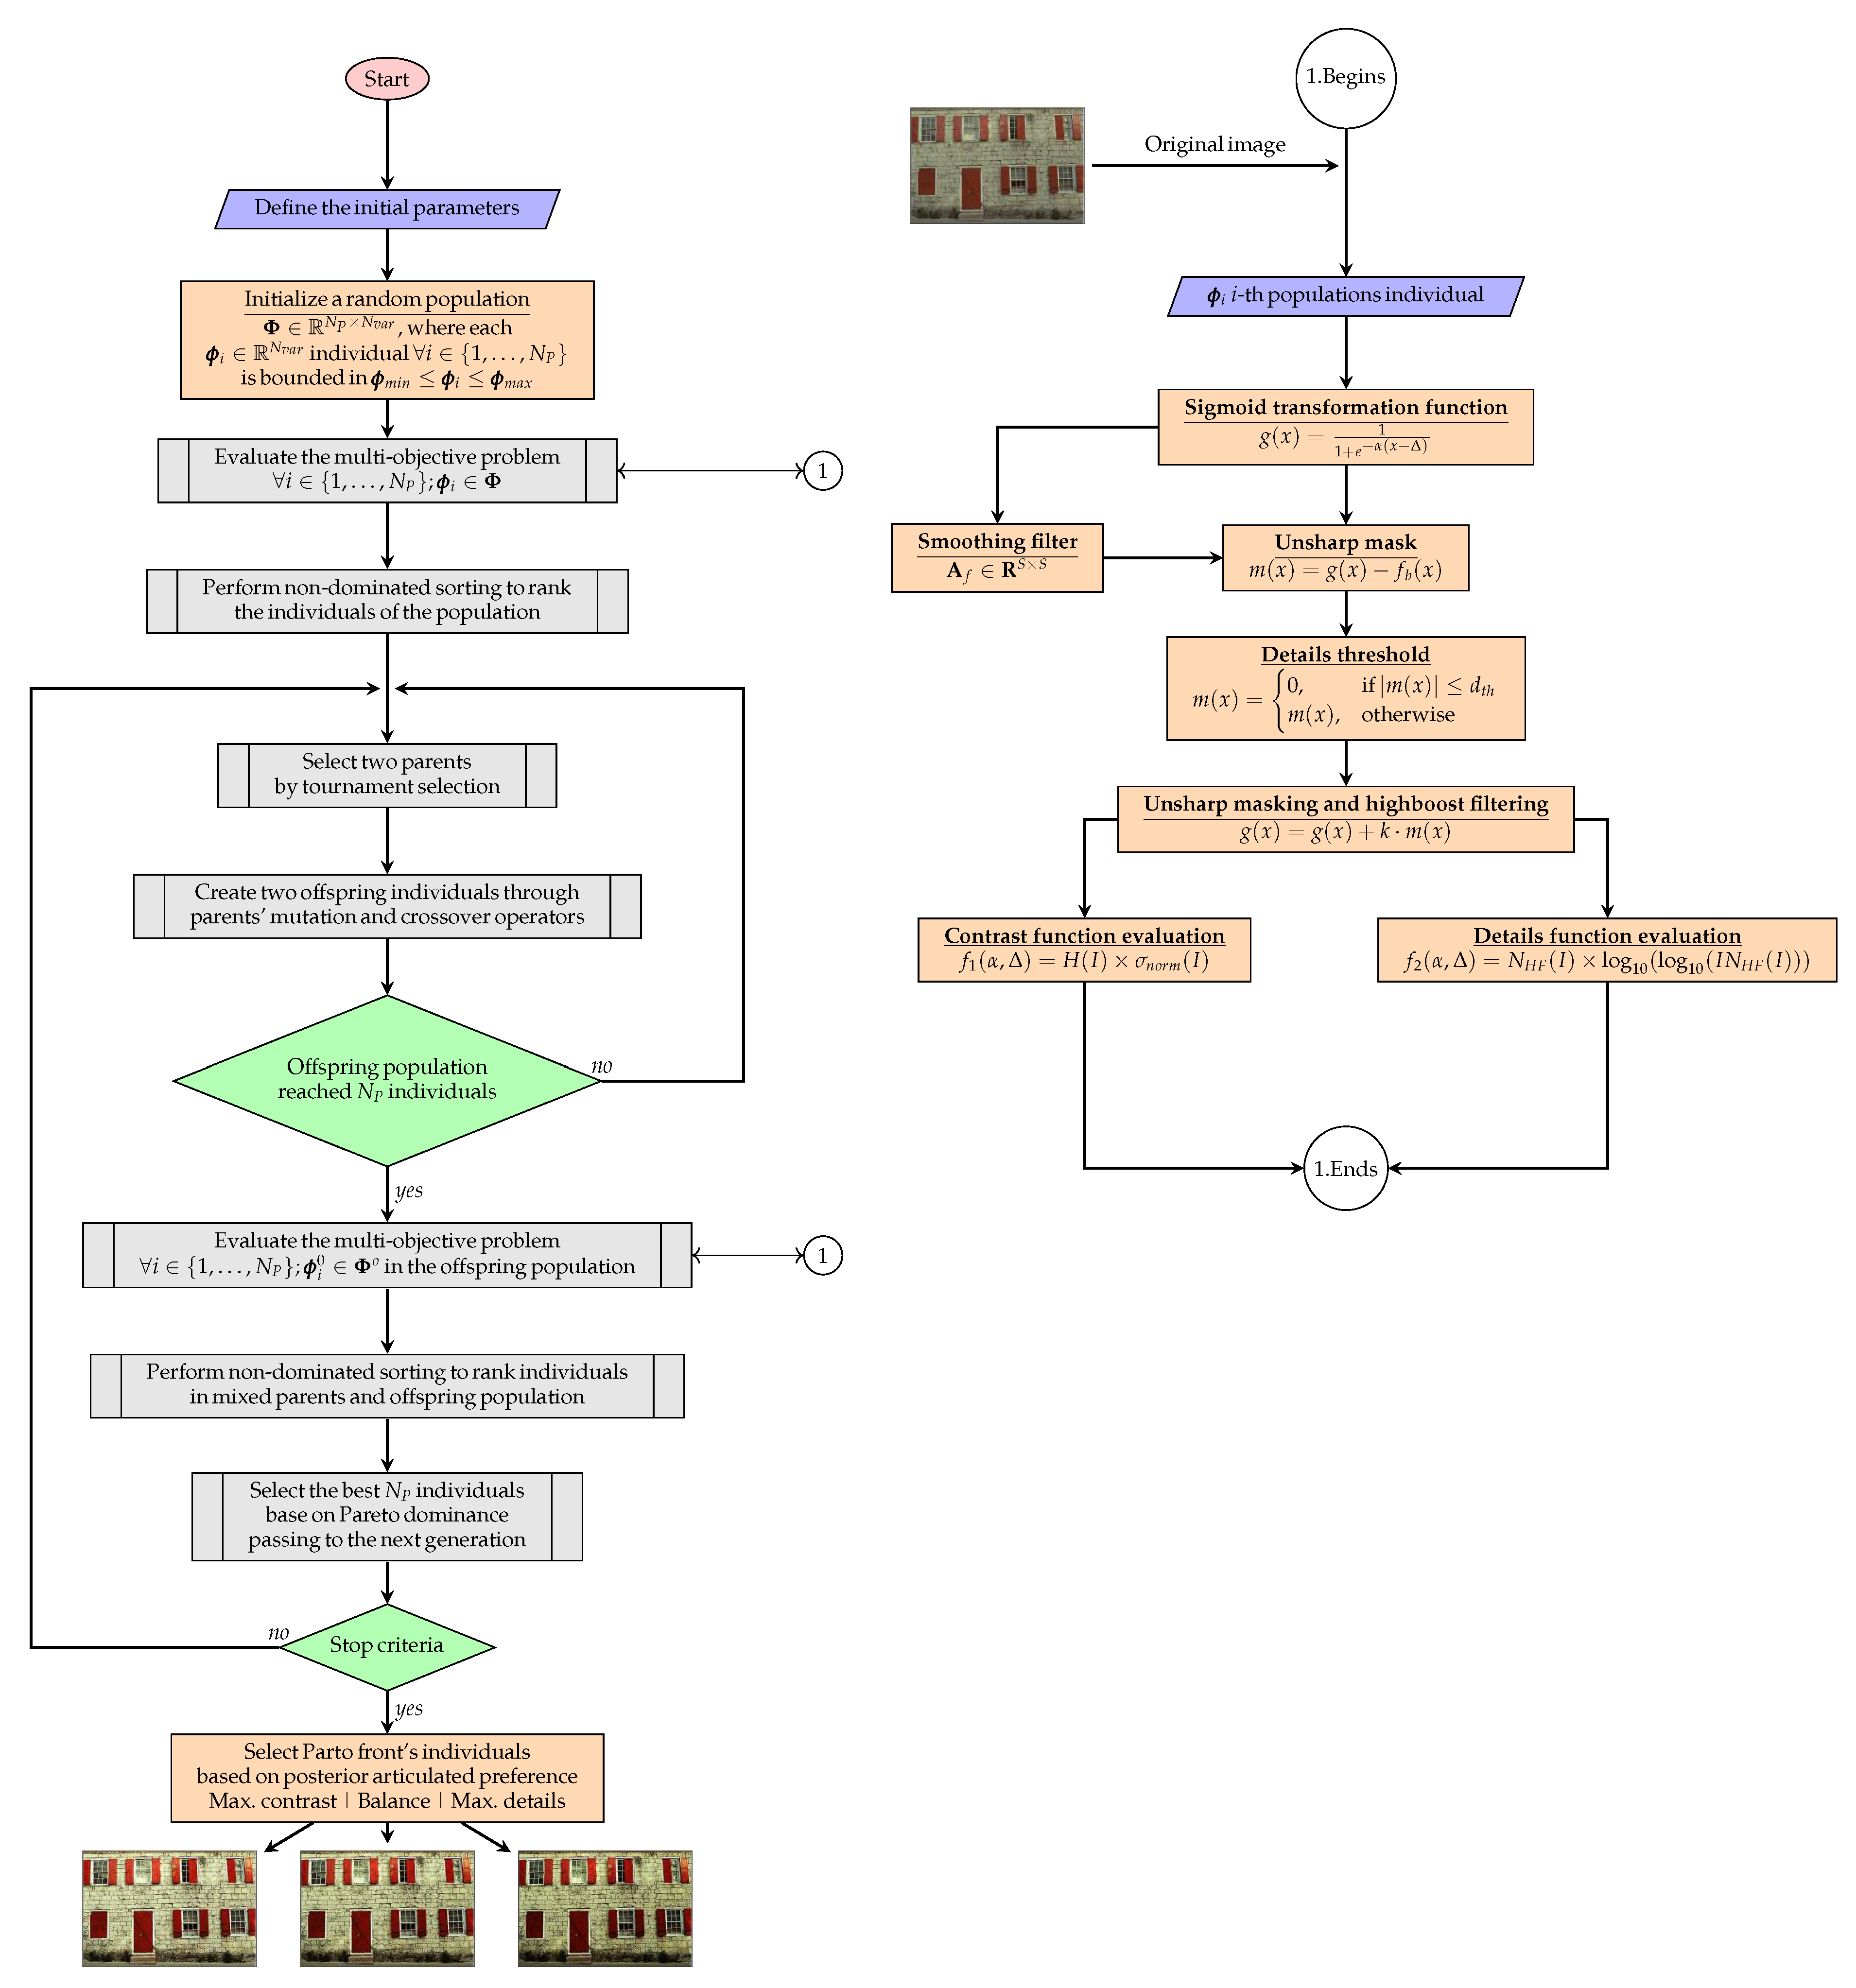
Before evaluating these objective functions, a series of image transformations are performed. Contrast enhancement is achieved using a sigmoid transformation function, where α and Δ are the decision variables that control the degree of contrast adjustment. Additionally, UMH is applied for detail enhancement. These transformations impact the objective functions by modifying the entropy, standard deviation, number of high-frequency pixels, and their intensities. Figure 2 illustrates the overall procedure for solving the multi-objective optimization problem using NSGA-II.

3.2. A Posterior Preference Articulation

A posterior preference articulation involves selecting specific solutions from the Pareto front based on particular criteria. In this work, the focus is on choosing the extreme solutions of the Pareto front and its knee point. The knee point is identified as the solution on the Pareto front that is closest to the utopia point, which typically represents the ideal but unattainable objective values. Within the optimal trade-offs of the Pareto front, these three solutions represent opposing balances of contrast and detail, helping to capture essential image characteristics that may be relevant according to the specific requirements of each application.
To determine the knee point, the Pareto front is first normalized, ensuring that the values of each objective function fall within the range [0, 1]. The utopia point in this normalized space is a vector of zeros, representing the best possible values for each objective. The Euclidean distance of each solution on the normalized Pareto front to the utopia point is calculated as follows:
d i = j = 1 N f ( f i j p j ) 2
where: N f is the number of objective functions; f i j is the normalized value of the j-th objective for the i-th solution; p j is the value of the j-th objective at the utopia point (typically 0 after normalization). The knee point is identified as the solution with the minimum distance to the utopia point.

4. Benchmark Results and Discussion

In this session, the fundamental aspects of the experiment are described. Subsequently, the results are presented and discussed in two parts: first, the visual analysis of the results is conducted, followed by a discussion of the numerical results from the images in relation to the well-established indicators.

4.1. Experimental Design

A set of twenty images is selected to assess the effectiveness of the method developed in this work. This set is divided into two groups: the first includes 10 natural scene images extracted from the Kodak dataset [32], specifically from kodim01 to kodim10 (hereinafter referred to as Natural1 to Natural10, in that order). The second group consists of 10 medical images (referred to as Medical1 to Medical10, respectively) selected from various libraries, including brain images [33,34], blood composition images (white blood cells of the basophil and eosinophil types) [35,36], X-rays [37], ocular nodules [38], dental infections [39], microphotographs of pulmonary blood vessels [40], and traumatic forearm positioning [41].
The NSGA-II algorithm is executed for each image with a maximum of 30,000 function evaluations, aiming to produce a Pareto front containing the best solutions. From this front, solutions are extracted according to the defined articulation preference operator. The objective is to evaluate the quality of these solutions in terms of contrast and details, complemented by a visual analysis to determine the suitability of each image for specific purposes. Finally, the similarity of the enhanced images to the original ones is assessed using the structural similarity index (SSIM), which allows for quantifying the degree of similarity between the processed and original images.
The parameter values used in this experiment are as follows: population size ( N p = 50 ), number of variables ( N v a r = 2 ), number of objective functions ( N f = 2 ), number of evaluations ( N e v a l = 30 , 000 ), mutation probability ( P m = 0 . 5 ), crossover probability ( P c = 0 . 7 ), simulated binary crossover parameter ( N c = 5 ), polynomial mutation parameter ( N m = 5 ), details threshold ( d t h = 0 . 1 ), lower bound ( ϕ m i n = [ 0 , 0 ] T ), and upper bound ( ϕ m a x = [ 10 , 10 ] T ).

4.2. Graphical Results

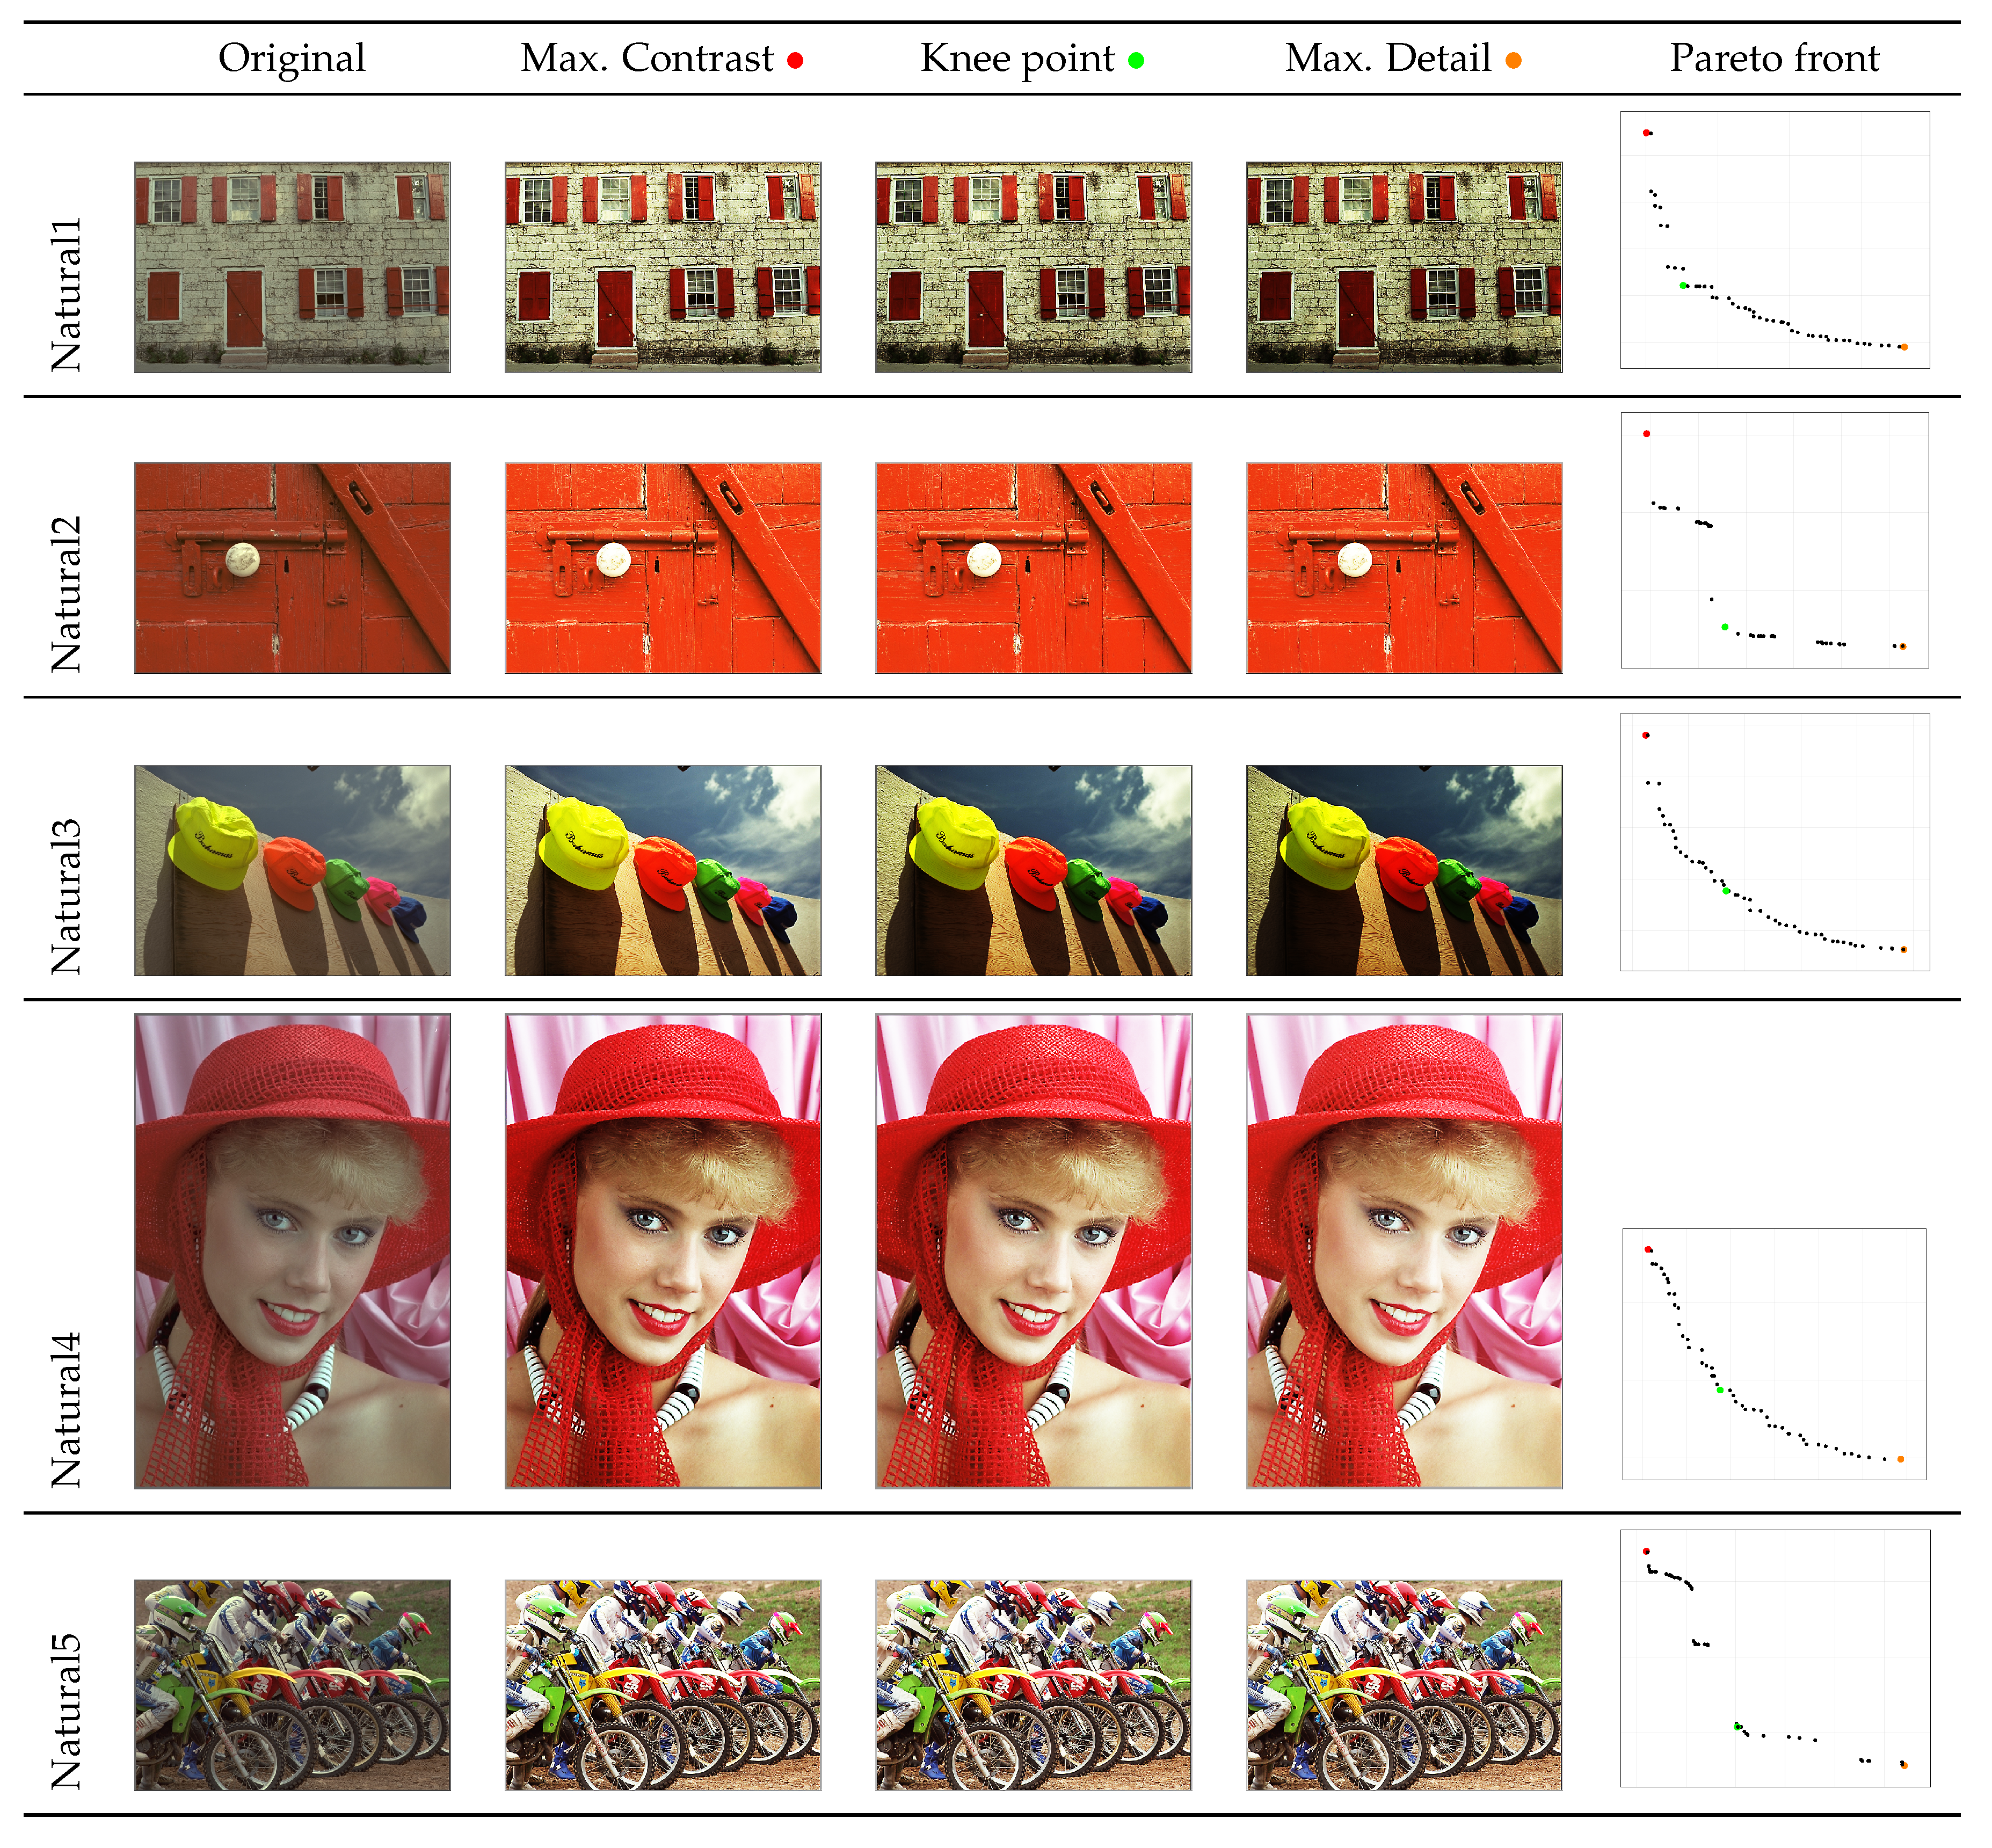
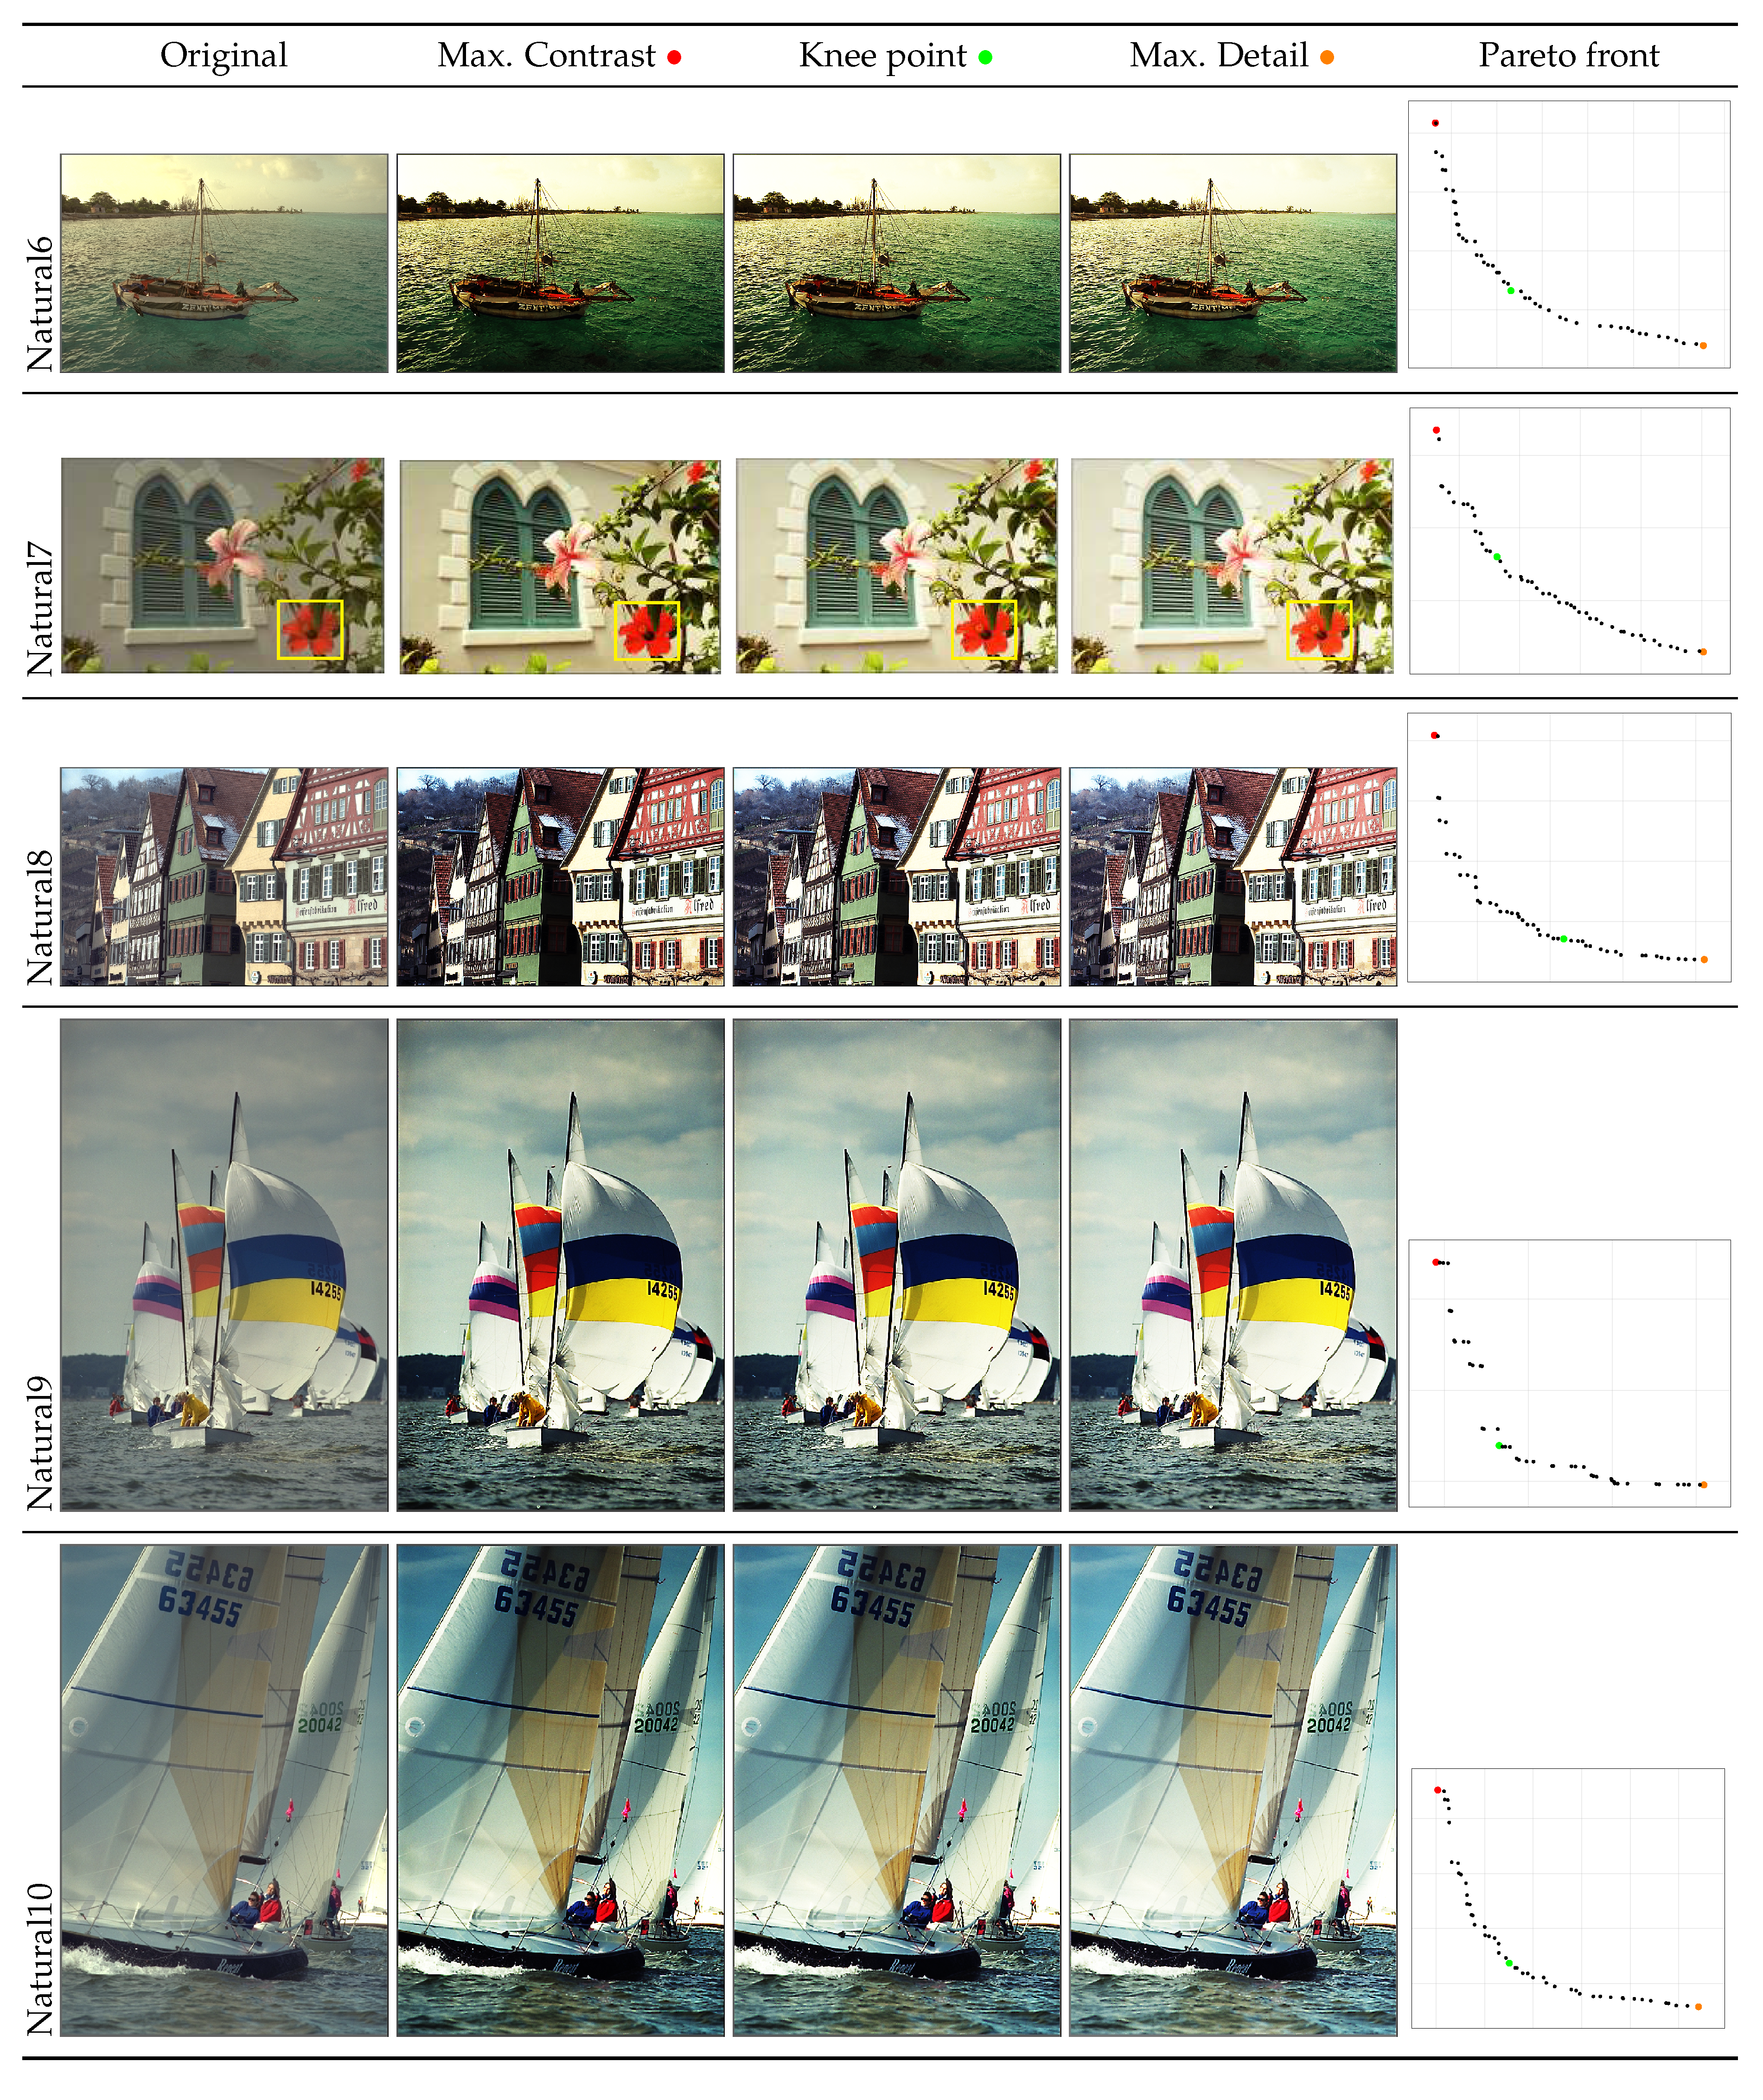
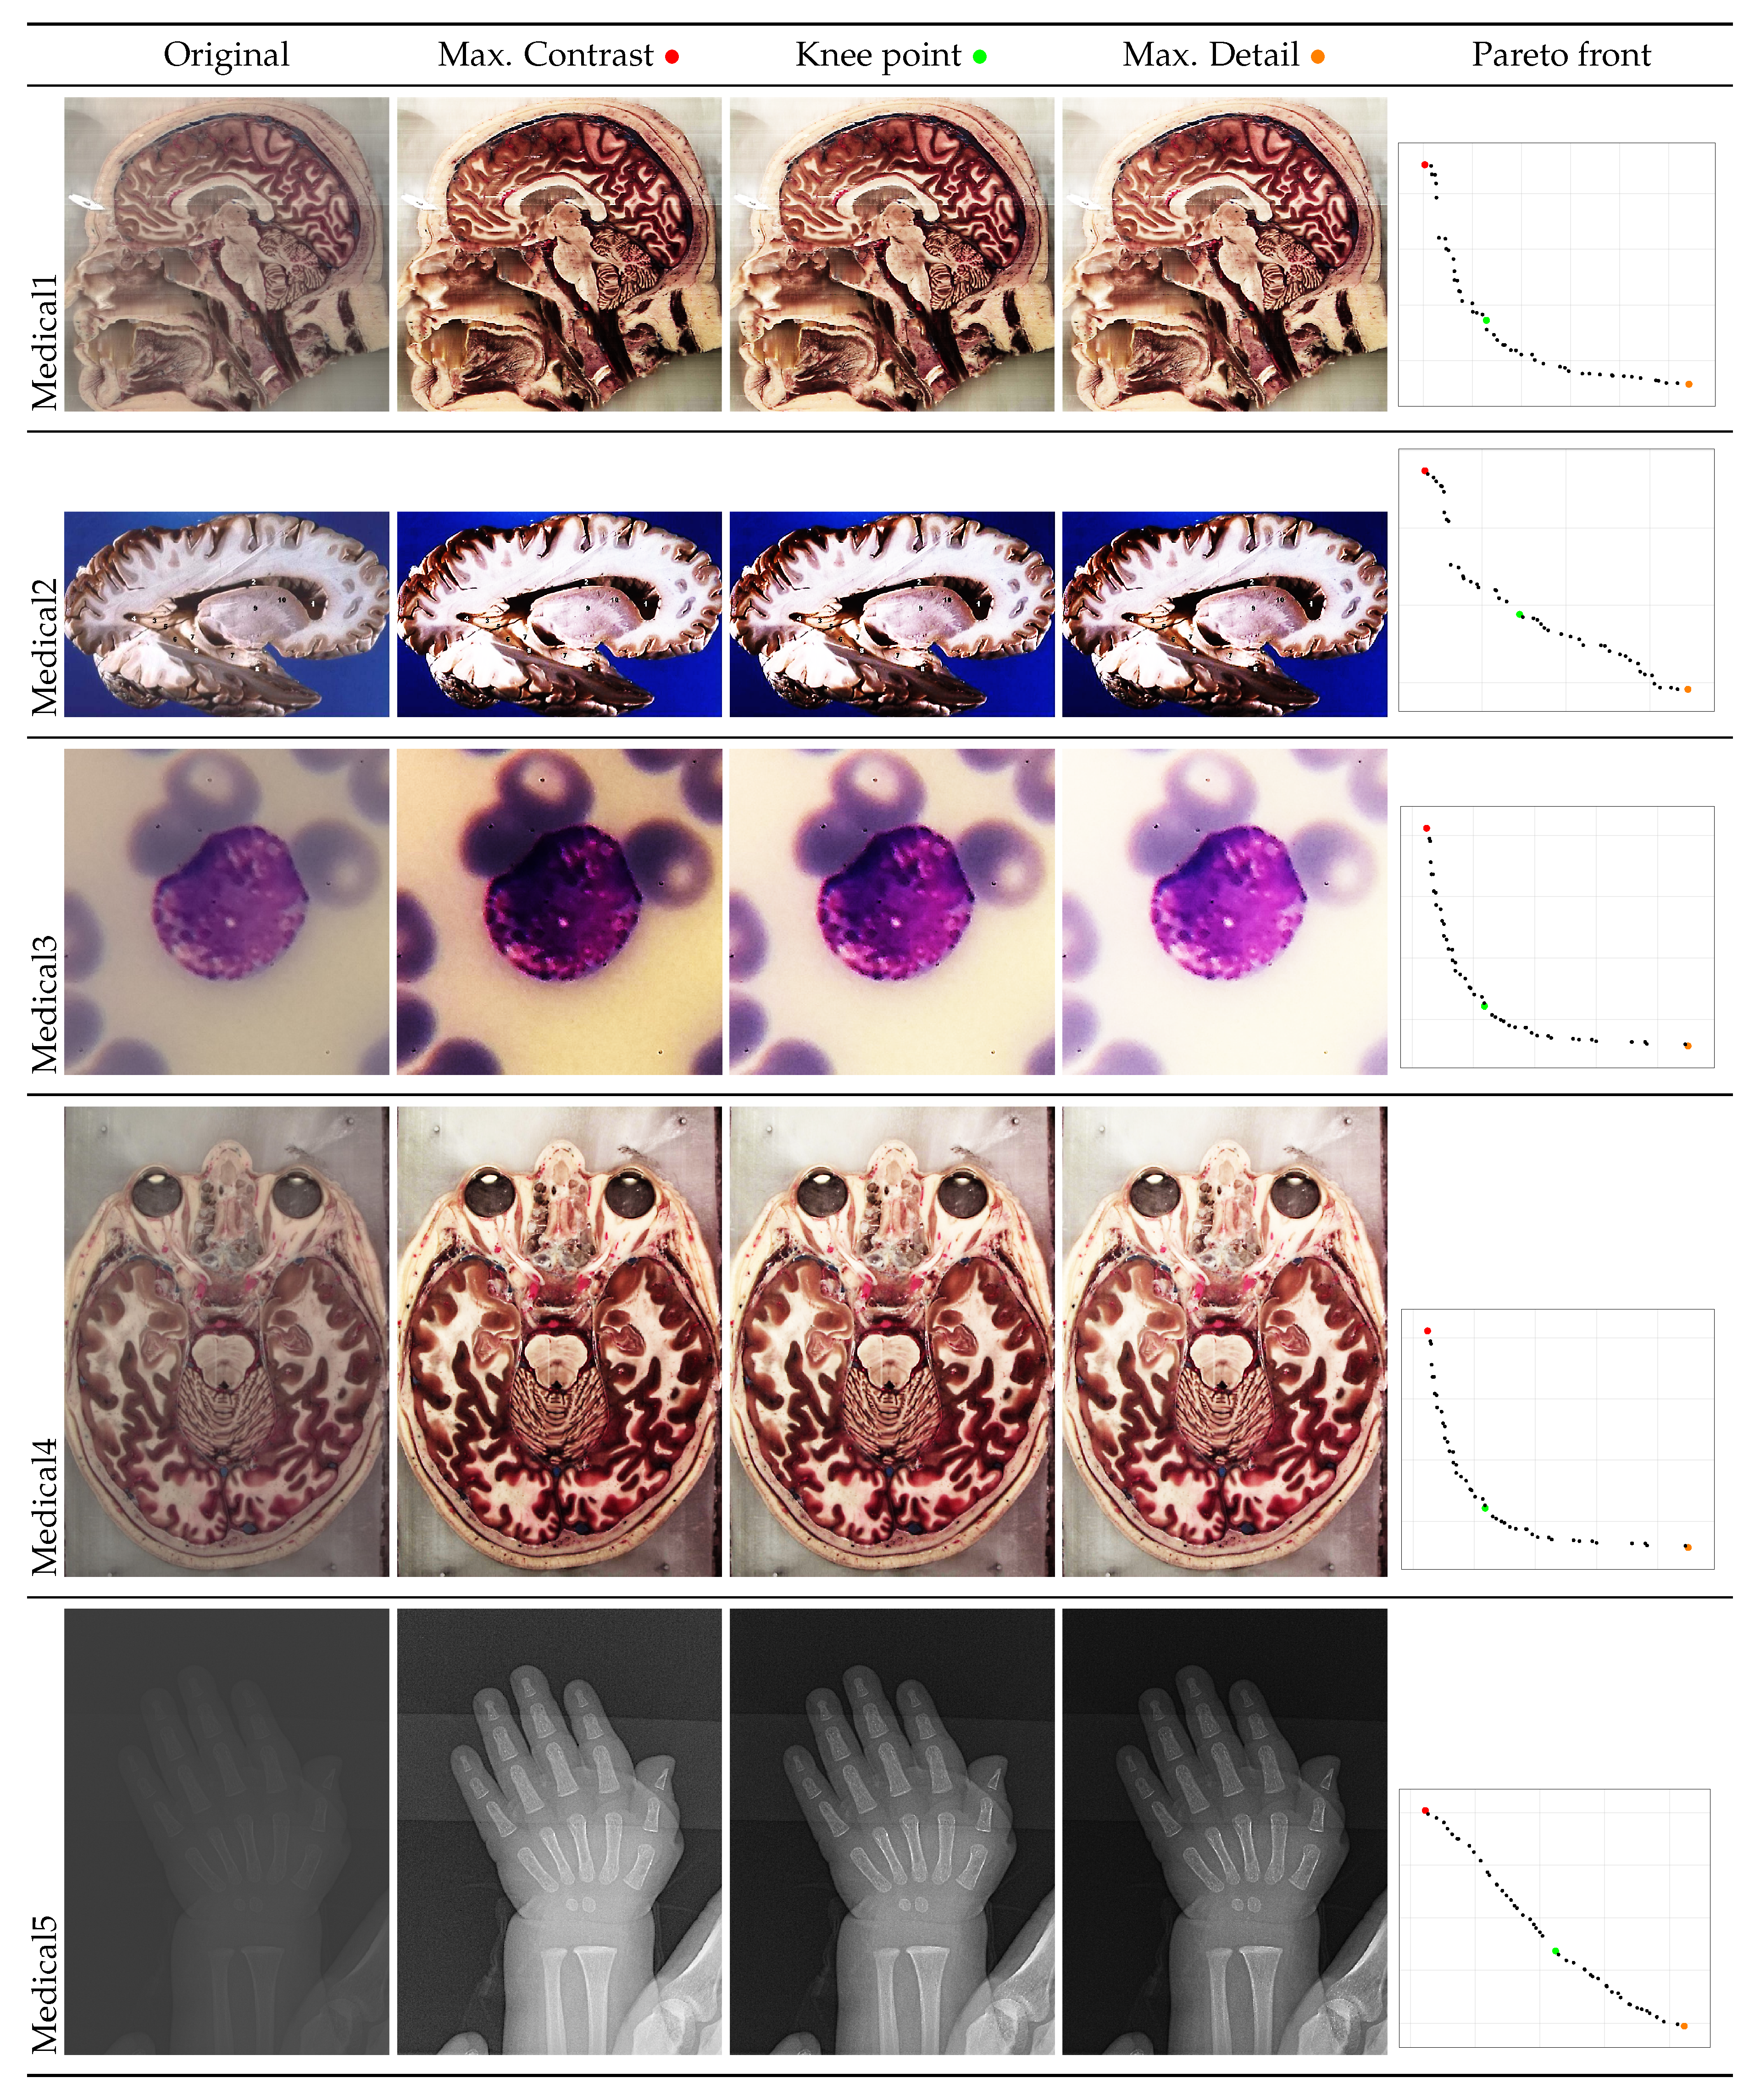
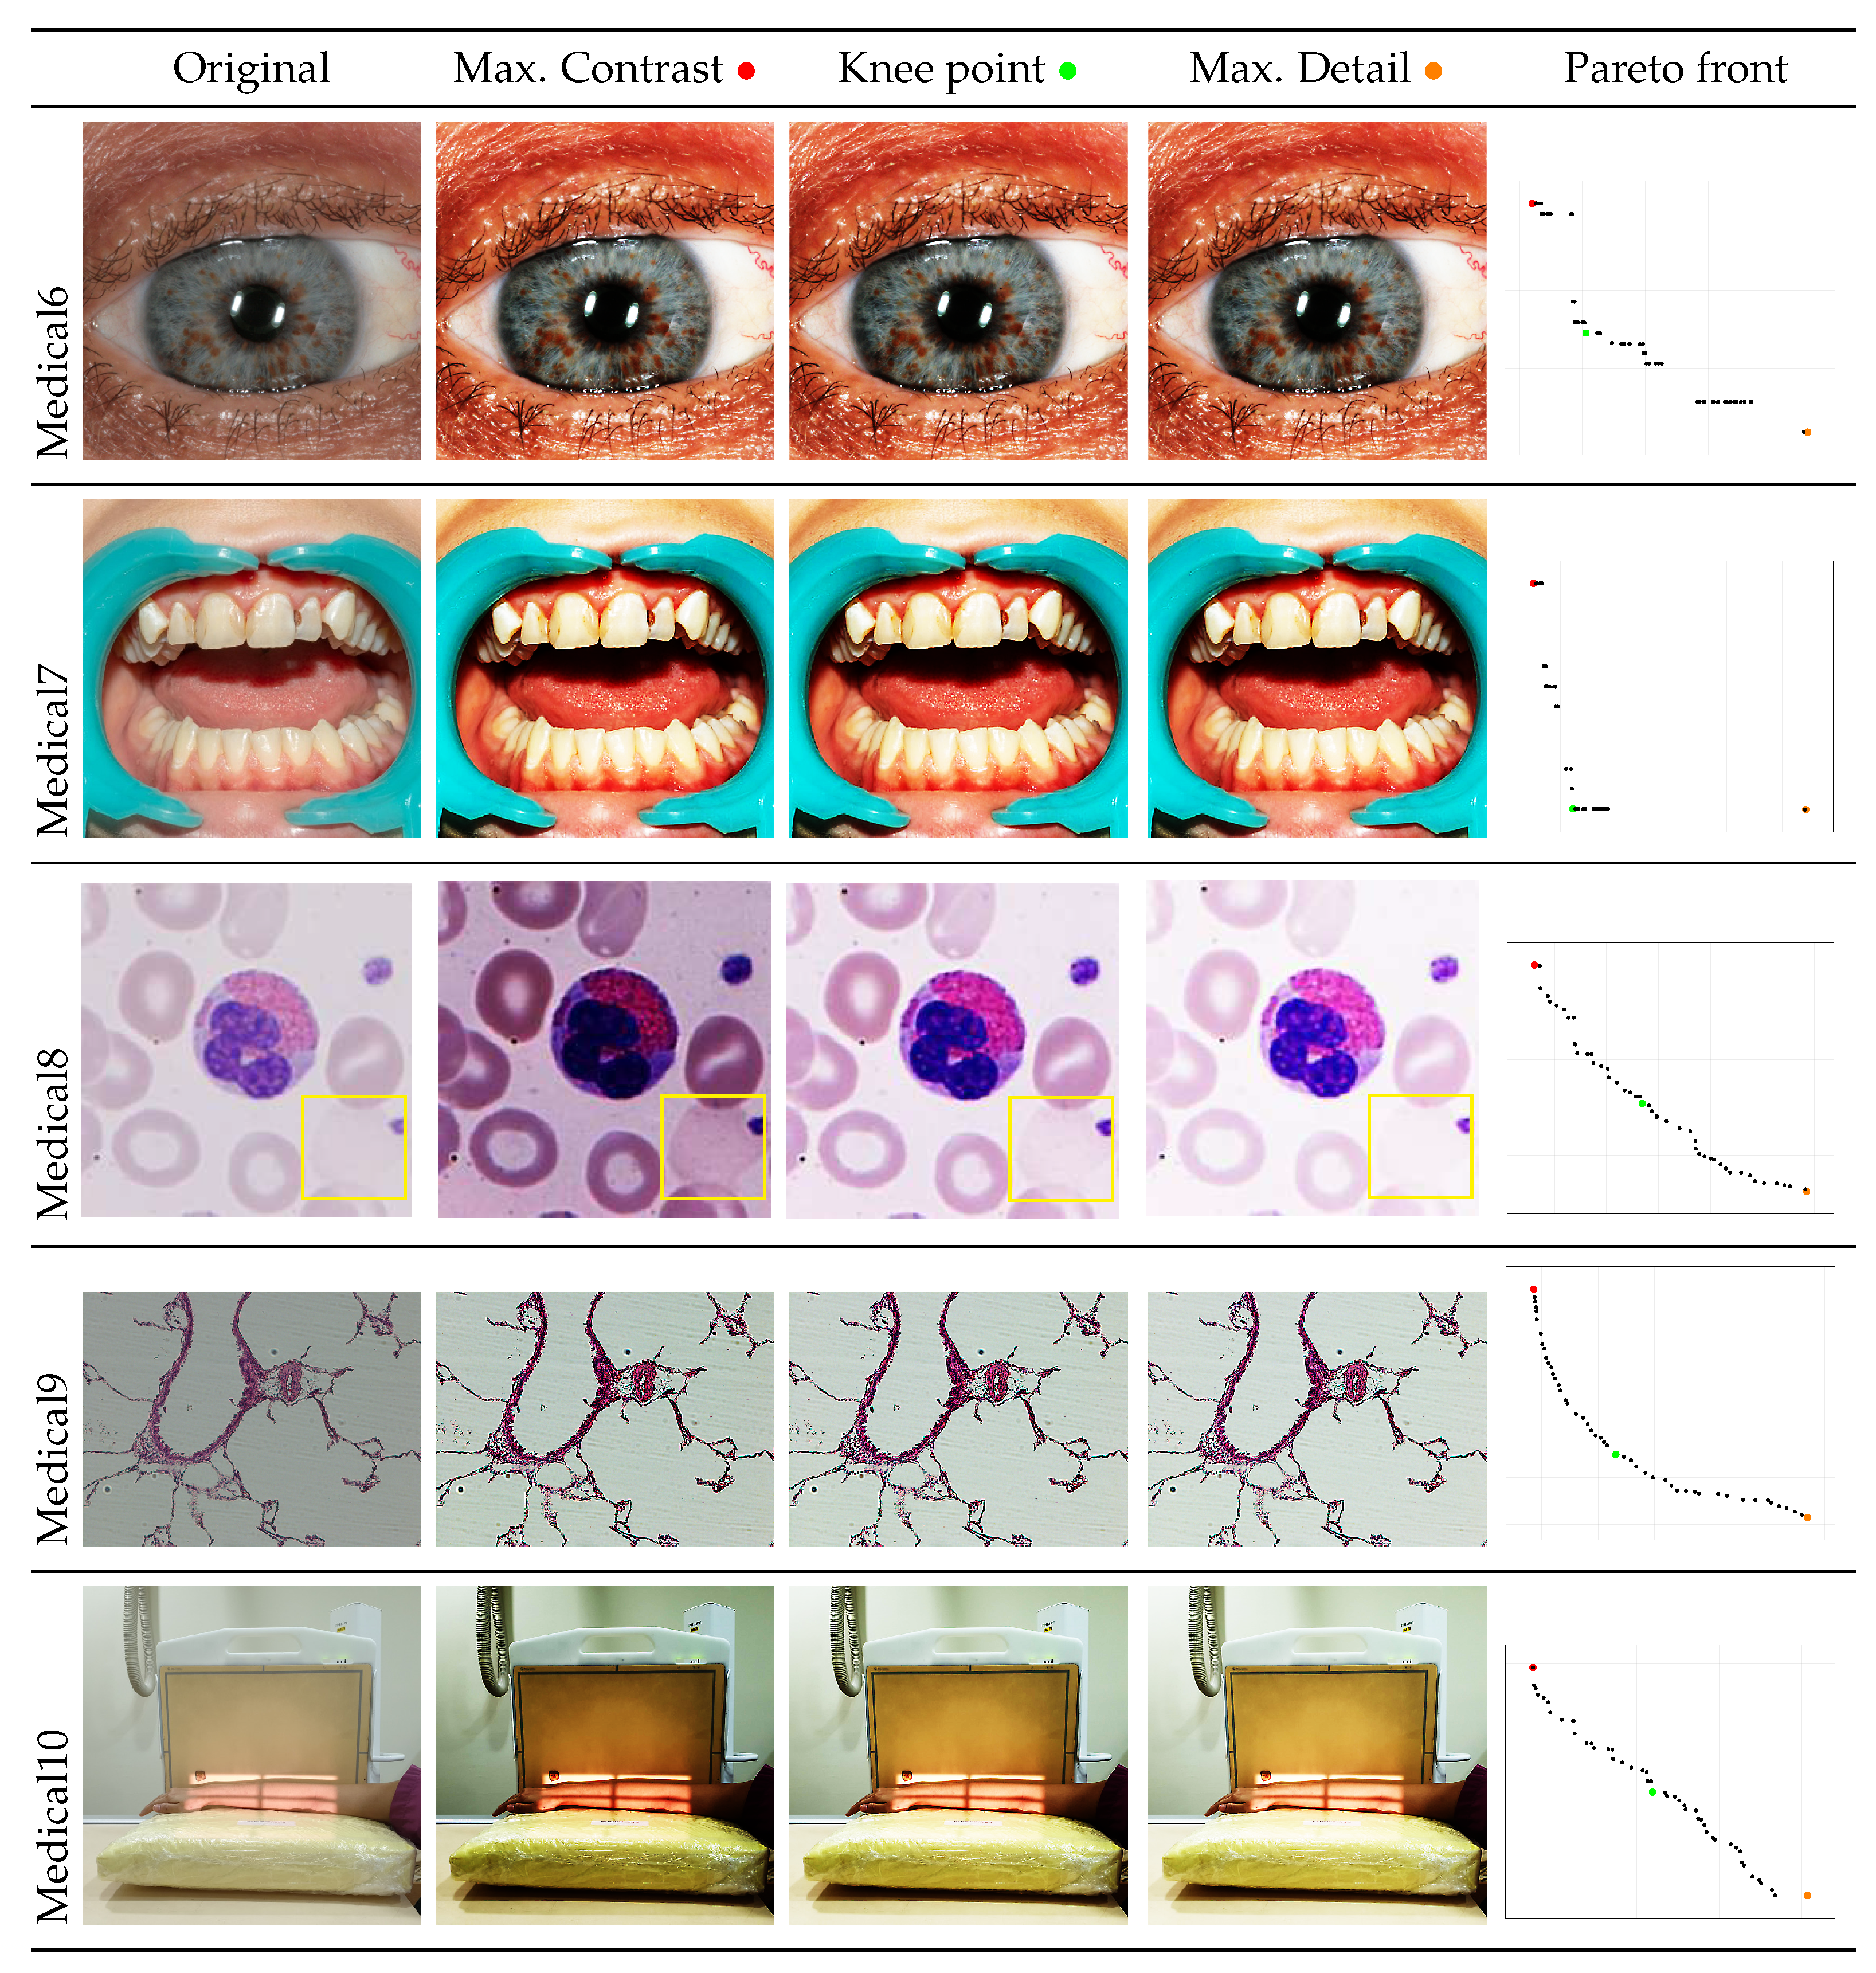
Table 1, Table 2, Table 3 and Table 4 present the results obtained through the multi-objective optimization image enhancement approach. Specifically, Table 1 and Table 2 show the results for natural images, while Table 3 and Table 4 display medical images. The tables are organized as follows: the first and second columns list the image names and their corresponding original, unenhanced versions. The third to fifth columns showcase the selected points from the Pareto front, representing the maximum contrast, knee point, and maximum detail, respectively. The final column illustrates the obtained Pareto front through the optimization process, with red, green, and orange points indicating the images that achieved maximum contrast, knee point, and maximum detail, respectively.
As observed in the results, the images extracted from the Pareto front significantly maximize both contrast and detail compared to the original images. In all study cases, the original image is dominated by the solutions extracted from the fronts, demonstrating the approach’s effectiveness in improving visual quality. However, the differences among the three enhanced images for each problem require a more detailed analysis.
In the natural images, the differences among the three preferred images are more subtle, given that these are high-quality images with inherently low contrast, specifically selected for contrast enhancement exercises. More pronounced differences are observed in the images Natural1, Natural6, and Natural8. For the Natural6 image, there is a general improvement in overall details. However, specific regions, such as the highlighted flower in the yellow box, may lose details compared to the original image, which retains more information. This suggests that for future work, it may be advisable to apply local and/or adaptive image enhancement techniques to preserve details in specific regions while maintaining overall image quality.
For medical images, there are instances where differences are more perceptible. For example, in the Medical3 image, the maximum contrast solution makes it difficult to visualize the internal details of the basophil (white blood cell), which could result in less accurate interpretation. In contrast, the knee solution and maximum detail solution provide a clearer view of the interior of the white blood cell. Similarly, in the Medical5 image, the maximum contrast solution highlights the bone structures of the hand and arm. However, the maximum detail image offers a more precise view of the internal structures within the bones, which is crucial for a more detailed evaluation. Another notable example is the Medical8 image, where the maximum detail solution offers a more detailed view of the internal structure of the eosinophil (another type of white blood cell). However, the maximum contrast image improves the visibility of red blood cells. As shown in the yellow box, this solution reveals a red blood cell that is nearly imperceptible in the other solutions. An interesting case is the Medical6 image, where only a few non-dominated solutions are present on the Pareto front. Despite the similarities among the preferred solutions, the nodules are much more perceptible in the enhanced images than in the original image.
The solutions extracted from the Pareto front represent optimal trade-offs between contrast and detail. For natural images, these three alternatives can be considered useful based on aesthetic criteria or in subsequent automatic processes that require prioritizing one property over another. In the case of medical images, these alternatives allow for a more precise evaluation suited to different diagnostic needs, providing a flexible approach to enhance the visualization of critical details according to the clinical context.

4.3. Quantitative Results

Table 5 and Table 6 present noteworthy information regarding several criteria following the next structure. For each image whose name is presented in the first column, a set of three rows displays the outcomes of the Pareto front’s maximum contrast, knee point, and maximum details solutions. The outcomes per individual regarding their entropy, normalized standard deviation, number of pixels, and pixel intensity are displayed from the third to the sixth column. The seventh and eighth columns display the objective function values of the multi-objective optimization problem. The last column displays the SSIM with respect to the original images, where all those images archived values above 0.7, i.e., SSIM>0.7, are in boldface, implying that these images accomplished the enhancement with an acceptable similarity to the original image.
As can be seen, the maximum contrast solutions generally yield higher entropy and normalized standard deviation, indicating a broader range of pixel intensities and greater variability in the enhanced images. In contrast, maximum detail solutions focus on enhancing the finer details within the images. This often results in lower entropy and normalized standard deviation compared to maximum contrast solutions but may increase the number and the intensity of high-frequency pixels (indicating more detailed textures). These results highlight differences in contrast and detail between the solutions extracted from the Pareto front that may not be perceptible in the previous visual discussion. If we examine some cases, we can find images such as Natural2, Medical1, and Medical4, where the extreme points on the Pareto front do not show a visual difference. However, their associated values for contrast and detail exhibit numerical differences.
Through the reported values of the objective functions, it can be observed that all exposed solutions are non-dominated, indicating that they represent an optimal trade-off between the two evaluated criteria. Regarding the SSIM index, 65% of the solutions exhibit values above 0.7, indicating a generally high level of structural similarity. Furthermore, by only analyzing the medical images, 85% of the solutions reached SSIM outcomes beyond 0.7, indicating that the proposal is a trustworthy tool when dealing with this kind of information. Nonetheless, if only the natural scene images are evaluated, the number of solutions that archived this SSIM outcome decreases to 50%. This may be an influence of the artificially imposed low contrast in this set of images. Consequently, future work should consider incorporating SSIM as an additional objective function could be considered, especially for images where image fidelity can be crucial.

5. Conclusions

The conflict between contrast and detail in image processing is presented as a multi-objective problem. Through this approach, a set of optimal solutions is obtained, forming a Pareto front in all cases, highlighting the trade-off that can exist between these two properties. Therefore, it is demonstrated that a single-objective approach to this problem will only lead to a particular solution among all the optimal solutions obtained through the multi-objective approach.
A proposed model integrates the sigmoid transformation function and UMH into the NSGA-II. Additionally, a posterior preference articulation is added, which selects three key solutions from the Pareto front: the maximum contrast solution, the maximum detail solution, and the knee point solution. These three solutions showed significant superiority in terms of contrast and detail compared to the original images. Furthermore, the outcomes visually and numerically demonstrated how these three image solutions, though all optimal solutions differ in terms of entropy, standard deviation, number of detail pixels, and detail intensity. This influenced the perception of fundamental characteristics within the images, highlighting the relevance of the proposed preferences in different contexts.
Despite an improvement in the overall details of the images, specific regions may lose details compared to the original image. This suggests that for future work, it may be advisable to apply local and/or adaptive image enhancement techniques to preserve details in specific regions while maintaining overall image quality. It is also advisable to incorporate SSIM or a similar performance index as an objective function to improve image fidelity, especially in medical applications where the image’s information trustworthiness is crucial.

Author Contributions

Conceptualization, Daniel Molina-Pérez; methodology, Daniel Molina-Pérez, and Alam Gabriel Rojas-López; validation, Daniel Molina-Pérez, and Alam Gabriel Rojas-López; investigation, Daniel Molina-Pérez; writing, Daniel Molina-Pérez, and Alam Gabriel Rojas-López, visualization, Alam Gabriel Rojas-López

Data Availability Statement

We encourage all authors of articles published in MDPI journals to share their research data. In this section, please provide details regarding where data supporting reported results can be found, including links to publicly archived datasets analyzed or generated during the study. Where no new data were created, or where data is unavailable due to privacy or ethical restrictions, a statement is still required. Suggested Data Availability Statements are available in section “MDPI Research Data Policies” at https://www.mdpi.com/ethics.

Acknowledgments

The authors acknowledge the support from the Consejo Nacional de Humanidades, Ciencia y Tecnología (CONAHCYT) and its support in Mexico through the institutions ESCOM-IPN and CIDETEC-IPN.

References

  1. Rafael, C.G.; Richard, E.W.; Steven, L.E.; Woods, R.; Eddins, S. Digital image processing using MATLAB; Tata McGraw-Hill, 2010.
  2. Russ, J.C.; Russ, J.C. Introduction to image processing and analysis; CRC press, 2017.
  3. Gonzalez, R.C.; Woods, R.E. Digital image processing 4th edition, global edition, 2018.
  4. Aşuroğlu, T.; Sümer, E. Performance analysis of spatial and frequency domain filtering in high resolution images. 2015 23nd Signal Processing and Communications Applications Conference (SIU). IEEE, 2015, pp. 935–938.
  5. Lepcha, D.C.; Goyal, B.; Dogra, A.; Sharma, K.P.; Gupta, D.N. A deep journey into image enhancement: A survey of current and emerging trends. Information Fusion 2023, 93, 36–76.
  6. Guo, X.; Li, Y.; Ling, H. LIME: Low-light image enhancement via illumination map estimation. IEEE Transactions on image processing 2016, 26, 982–993.
  7. Wang, W.; Wu, X.; Yuan, X.; Gao, Z. An experiment-based review of low-light image enhancement methods. Ieee Access 2020, 8, 87884–87917.
  8. Ullah, Z.; Farooq, M.U.; Lee, S.H.; An, D. A hybrid image enhancement based brain MRI images classification technique. Medical hypotheses 2020, 143, 109922.
  9. Dhal, K.G.; Ray, S.; Das, A.; Das, S. A survey on nature-inspired optimization algorithms and their application in image enhancement domain. Archives of Computational Methods in Engineering 2019, 26, 1607–1638.
  10. Bhandarkar, S.M.; Zhang, Y.; Potter, W.D. An edge detection technique using genetic algorithm-based optimization. Pattern Recognition 1994, 27, 1159–1180.
  11. Braik, M.; Sheta, A.F.; Ayesh, A. Image Enhancement Using Particle Swarm Optimization. World congress on engineering, 2007, Vol. 1, pp. 978–988.
  12. Behera, S.K.; Mishra, S.; Rana, D. Image enhancement using accelerated particle swarm optimization. Int J Eng Res Technol 2015, 4, 1049–1054.
  13. Nguyen-Thi, K.N.; Che-Ngoc, H.; Pham-Chau, A.T. An efficient image contrast enhancement method using sigmoid function and differential evolution. Journal of Advanced Engineering and Computation 2020, 4, 162–172.
  14. Bhandari, A.K.; Maurya, S. Cuckoo search algorithm-based brightness preserving histogram scheme for low-contrast image enhancement. Soft Computing 2020, 24, 1619–1645.
  15. Acharya, U.K.; Kumar, S. Genetic algorithm based adaptive histogram equalization (GAAHE) technique for medical image enhancement. Optik 2021, 230, 166273.
  16. Acharya, U.K.; Kumar, S. Directed searching optimized texture based adaptive gamma correction (DSOTAGC) technique for medical image enhancement. Multimedia Tools and Applications 2024, 83, 6943–6962.
  17. Braik, M. Hybrid enhanced whale optimization algorithm for contrast and detail enhancement of color images. Cluster Computing 2024, 27, 231–267.
  18. Rani, S.S. Colour image enhancement using weighted histogram equalization with improved monarch butterfly optimization. International Journal of Image and Data Fusion 2024, pp. 1–27.
  19. Du, N.; Luo, Q.; Du, Y.; Zhou, Y. Color image enhancement: a metaheuristic chimp optimization algorithm. Neural Processing Letters 2022, 54, 4769–4808.
  20. Krishnan, S.N.; Yuvaraj, D.; Banerjee, K.; Josephson, P.J.; Kumar, T.C.A.; Ayoobkhan, M.U.A. Medical image enhancement in health care applications using modified sun flower optimization. Optik 2022, 271, 170051.
  21. Ma, G.; Yue, X.; Zhu, J.; Liu, Z.; Zhang, Z.; Zhou, Y.; Li, C. A novel slime mold algorithm for grayscale and color image contrast enhancement. Computer Vision and Image Understanding 2024, 240, 103933.
  22. More, L.G.; Brizuela, M.A.; Ayala, H.L.; Pinto-Roa, D.P.; Noguera, J.L.V. Parameter tuning of CLAHE based on multi-objective optimization to achieve different contrast levels in medical images. 2015 IEEE International Conference on Image Processing (ICIP). IEEE, 2015, pp. 4644–4648.
  23. Abouhawwash, M.; Alessio, A.M. Multi-objective evolutionary algorithm for PET image reconstruction: Concept. IEEE transactions on medical imaging 2021, 40, 2142–2151.
  24. Kuran, U.; Kuran, E.C. Parameter selection for CLAHE using multi-objective cuckoo search algorithm for image contrast enhancement. Intelligent Systems with Applications 2021, 12, 200051.
  25. Cuevas, E.; Zaldívar, D.; Pérez-Cisneros, M. Multi-objective Optimization of Anisotropic Diffusion Parameters for Enhanced Image Denoising. In New Metaheuristic Schemes: Mechanisms and Applications; Springer, 2023; pp. 241–268.
  26. Jaimes, A.L.; Martınez, S.Z.; Coello, C.A.C.; others. An introduction to multiobjective optimization techniques. Optimization in Polymer Processing 2009, 1, 29.
  27. Lee, D.H.; Kim, K.J.; Köksalan, M. A posterior preference articulation approach to multiresponse surface optimization. European Journal of Operational Research 2011, 210, 301–309.
  28. Wang, H.; Olhofer, M.; Jin, Y. A mini-review on preference modeling and articulation in multi-objective optimization: current status and challenges. Complex & Intelligent Systems 2017, 3, 233–245.
  29. Deb, K.; Pratap, A.; Agarwal, S.; Meyarivan, T. A fast and elitist multiobjective genetic algorithm: NSGA-II. IEEE transactions on evolutionary computation 2002, 6, 182–197.
  30. Imtiaz, M.S.; Wahid, K.A. Image enhancement and space-variant color reproduction method for endoscopic images using adaptive sigmoid function. 2014 36th Annual International Conference of the IEEE Engineering in Medicine and Biology Society. IEEE, 2014, pp. 3905–3908.
  31. Srinivas, K.; Bhandari, A.K. Low light image enhancement with adaptive sigmoid transfer function. IET Image Processing 2020, 14, 668–678.
  32. Eastman Kodak Company. Kodak Lossless True Color Image Suite. https://r0k.us/graphics/kodak/, 2013. Accessed: 2024-08-18.
  33. Hartung, M. Visible Human Project - Brain Images. Case study. https://doi.org/10.53347/rID-93598, 2024. Accessed on 10 Aug 2024.
  34. Al Kabbani, A. Human brain - lateral view. Case study. https://doi.org/10.53347/rID-72871, 2024. Accessed on 10 Aug 2024.
  35. Nickparvar, M. White Blood Cells Dataset: A Large Dataset of Five White Blood Cells Types. https://www.kaggle.com/datasets/masoudnickparvar/white-blood-cells-dataset/data, 2022. Accessed on 10 Aug 2024.
  36. Mooney, P. Blood Cell Image Dataset. https://www.kaggle.com/datasets/paultimothymooney/blood-cells/discussion/437393, note = Accessed on 10 Aug 2024,, 2018.
  37. Radiological Society of North America. Pediatric Bone Age Machine Learning Challenge Dataset. https://www.kaggle.com/code/plarmuseau/image-contrast-enhancement-techniques/input, 2017. Accessed on 10 Aug 2024.
  38. Thurston, M. Lisch nodules (photo). https://doi.org/10.53347/rID-59408, 2024. Accessed on 10 Aug 2024.
  39. Dhairya, S. Dental Condition Dataset. https://www.kaggle.com/datasets/sizlingdhairya1/oral-infection, 2024. Accessed on 10 Aug 2024.
  40. Sinitca, A.M.; Lyanova, A.I.; Kaplun, D.I.; Hassan, H.; Krasichkov, A.S.; Sanarova, K.E.; Shilenko, L.A.; Sidorova, E.E.; Akhmetova, A.A.; Vaulina, D.D.; others. Microscopy Image Dataset for Deep Learning-Based Quantitative Assessment of Pulmonary Vascular Changes. Scientific Data 2024, 11, 635.
  41. A, E. Trauma forearm positioning (photo). https://doi.org/10.53347/rID-76100, 2020. Accessed on 10 Aug 2024.
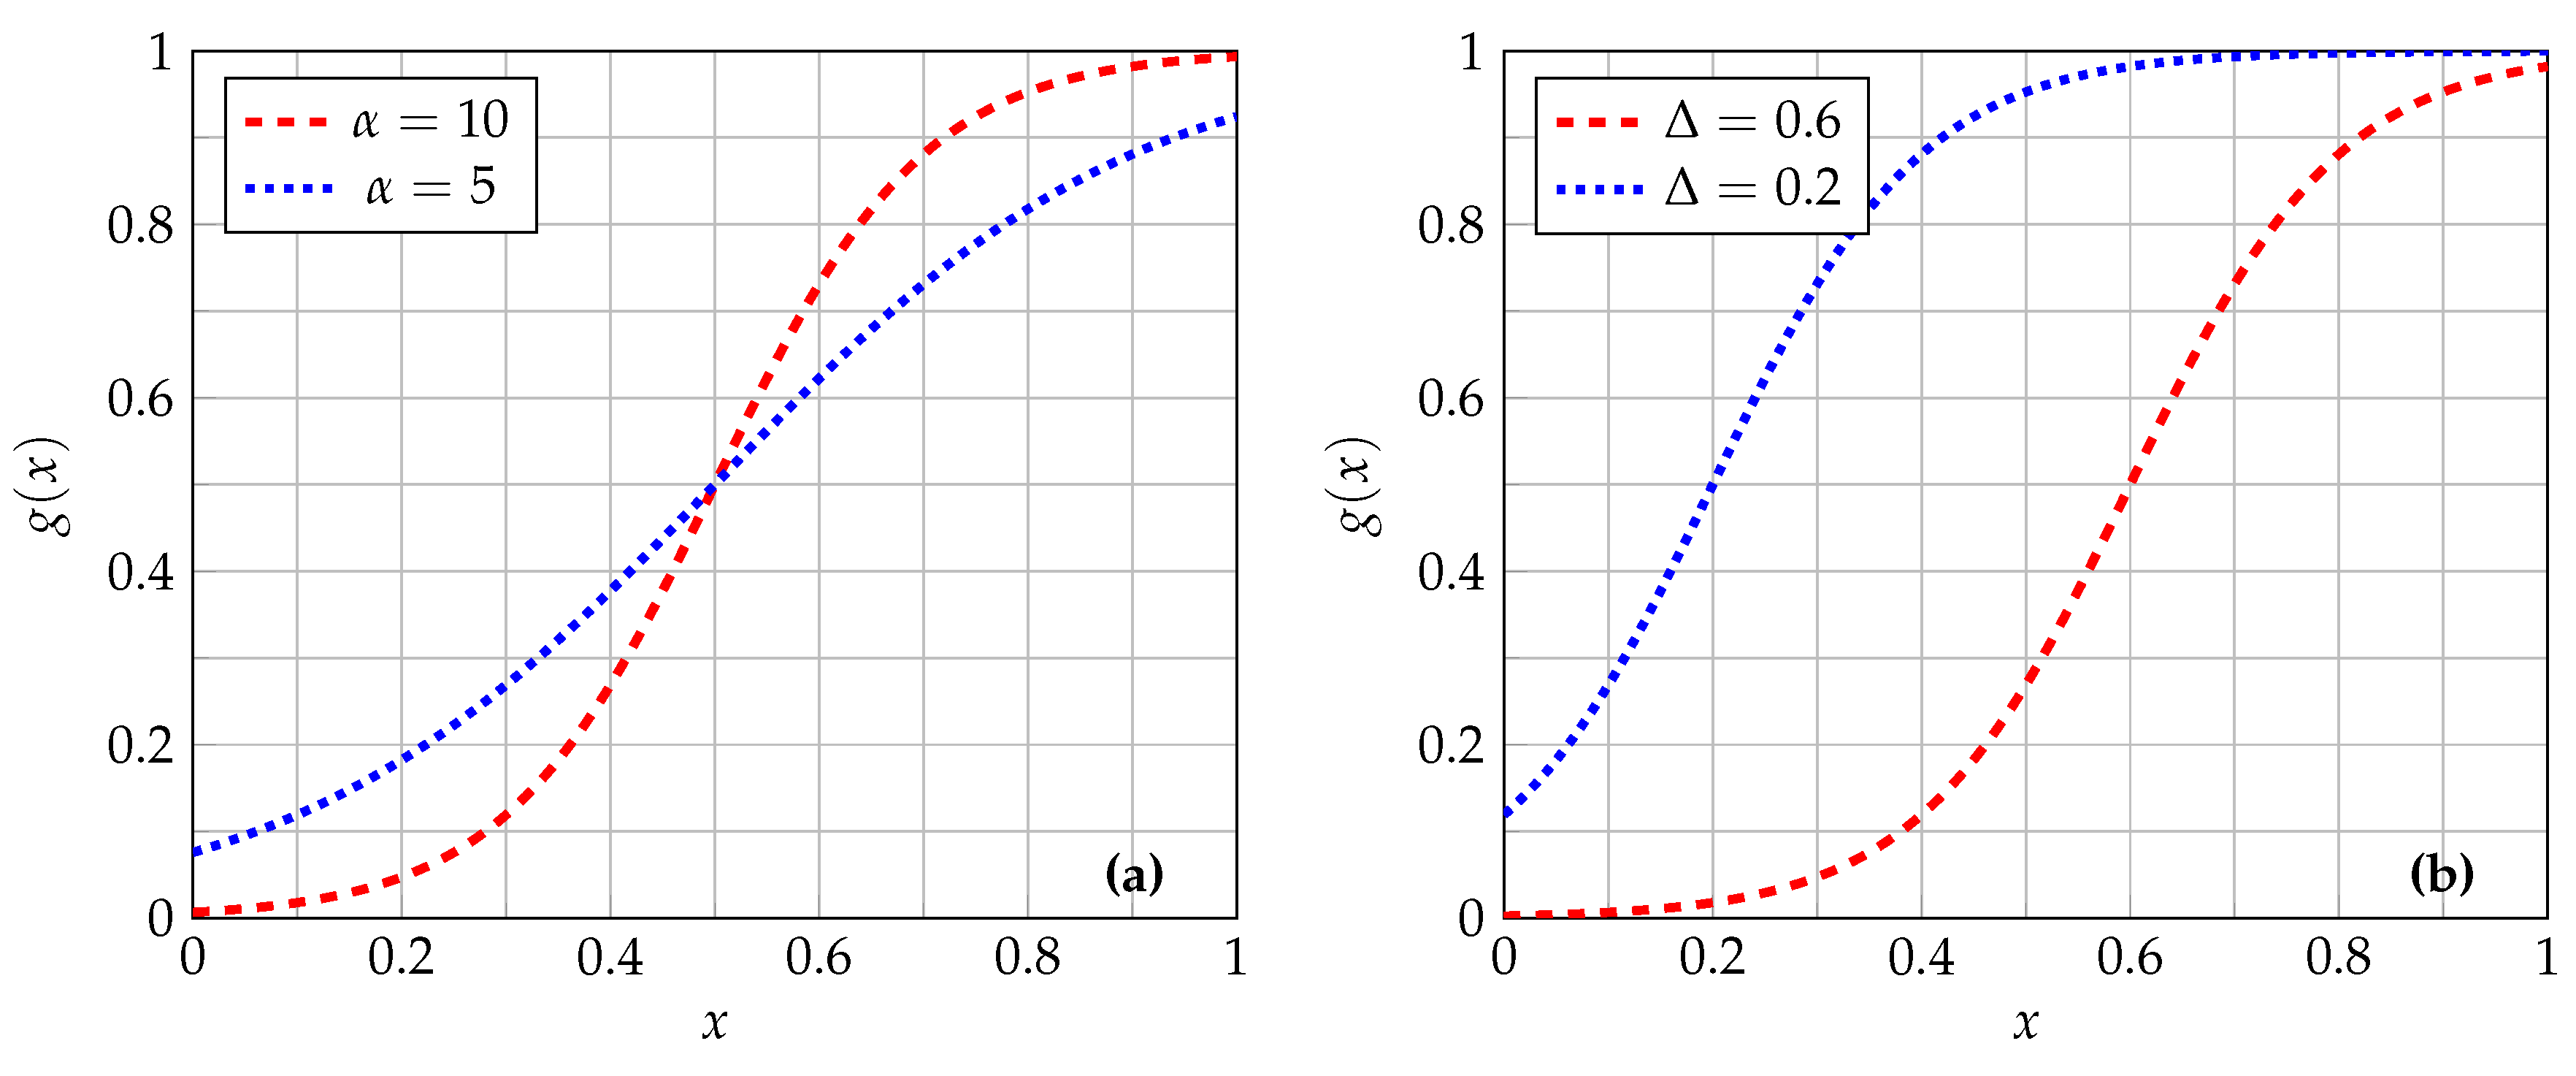
Figure 1. Comparison of sigmoid correction curves demonstrating the impact of varying parameters on image enhancement. (a) Effect of different α values on the steepness of the sigmoid curve, influencing the contrast adjustment. (b) Impact of different ( Δ ) values on the midpoint of the sigmoid curve, affecting the balance between light and dark regions.
Preprints 115957 g001
Figure 2. Multiobjective image enhancement proposal scheme.
Preprints 115957 g002
Table 1. Natural image results - 1.
Preprints 115957 i001
Table 2. Natural image results - 2.
Preprints 115957 i002
Table 3. Medical image results - 1.
Preprints 115957 i003
Table 4. Medical image results - 2.
Preprints 115957 i004
Table 5. Optimization results for natural images.
Image Solution H ( I ) σ n o r m ( I ) N H F ( I ) intensity H F ( I ) f 1 f 2 SSIM
Natural1 Max. Contrast 7.5531 0.5957 136328 28907.9607 4.4997 100511.1934 0.6658
Knee 7.5593 0.5919 140554 29866.6697 4.4741 103785.0868 0.6434
Max. Detail 7.4855 0.5771 142301 30043.5271 4.3198 105104.0062 0.6153
Natural2 Max. Contrast 6.3958 0.2890 42665 7256.3766 1.8482 29298.3087 0.6388
Knee 6.3867 0.2889 43005 7323.3415 1.8449 29547.1093 0.6484
Max. Detail 6.3633 0.2888 43039 7331.7722 1.8374 29572.3889 0.6509
Natural3 Max. Contrast 7.5080 0.5562 27263 4478.1528 4.1760 18199.8145 0.8264
Knee 7.4174 0.5437 31497 5253.1676 4.0331 21228.6115 0.7635
Max. Detail 7.2310 0.5140 33082 5554.9158 3.7168 22370.5067 0.6750
Natural4 Max. Contrast 7.6028 0.5582 38563 6506.9944 4.2437 26317.5588 0.7603
Knee 7.5705 0.5498 41095 6840.4895 4.1620 28125.8294 0.7430
Max. Detail 7.4589 0.5305 42358 6941.6262 3.9571 29014.4705 0.7154
Natural5 Max. Contrast 7.6397 0.6084 123121 25158.0587 4.6481 90179.9275 0.6053
Knee 7.6277 0.6070 123275 25177.7133 4.6297 90296.0866 0.5938
Max. Detail 7.5816 0.6062 123311 25173.0702 4.5959 90321.6616 0.5894
Natural6 Max. Contrast 7.2965 0.7151 92537 18795.8519 5.2174 66825.3294 0.6586
Knee 7.3302 0.7005 96356 19321.6818 5.1345 69678.1741 0.6931
Max. Detail 7.2851 0.6758 97675 19209.1750 4.9234 70611.6297 0.7175
Natural7 Max. Contrast 7.4601 0.5546 45798 8129.0078 4.1374 31650.5187 0.7839
Knee 7.3807 0.5442 48599 8487.5329 4.0163 33666.6691 0.7652
Max. Detail 7.1648 0.5160 50088 8529.1422 3.6970 34707.5355 0.7388
Natural8 Max. Contrast 7.2975 0.7166 135043 30609.3702 5.2293 99829.9165 0.6525
Knee 7.3574 0.7065 142322 31648.0378 5.1979 105373.9500 0.6738
Max. Detail 7.3067 0.6903 144811 31899.5143 5.0441 107256.0717 0.6770
Natural9 Max. Contrast 7.4927 0.5278 41161 7399.7872 3.9550 28296.7289 0.7953
Knee 7.4455 0.5261 42537 7682.5907 3.9174 29304.3657 0.8037
Max. Detail 7.3050 0.5196 42823 7772.1429 3.7954 29520.5423 0.8067
Natural10 Max. Contrast 7.5721 0.5280 32834 5719.8726 3.9983 22240.9423 0.7855
Knee 7.5501 0.5198 35058 6002.2180 3.9246 23814.2353 0.7937
Max. Detail 7.4591 0.5000 35621 6062.6948 3.7295 24210.7577 0.7868
Table 6. Optimization results for medical images.
Image Solution H ( I ) σ n o r m ( I ) N H F ( I ) intensity H F ( I ) f 1 f 2 SSIM
Medical1 Max. Contrast 7.8448 0.5823 28921 4292.0292 4.5682 19256.7633 0.7469
Knee 7.8279 0.5820 29564 4414.5851 4.5558 19718.7333 0.7608
Max. Detail 7.7870 0.5767 29861 4481.5297 4.4908 19935.0599 0.7732
Medical2 Max. Contrast 7.1626 0.7809 20764 3818.1387 5.5935 13726.0797 0.6879
Knee 7.1339 0.7809 21025 3876.9084 5.5710 13911.8213 0.6584
Max. Detail 7.1054 0.7784 21162 3905.2624 5.5309 14008.8062 0.6366
Medical3 Max. Contrast 7.4796 0.6403 501 68.4979 4.7890 227.2635 0.7746
Knee 7.1434 0.5984 875 118.2316 4.2747 427.0364 0.8652
Max. Detail 6.4043 0.4811 1058 145.9017 3.0808 529.6895 0.8658
Medical4 Max. Contrast 7.8136 0.5744 15156 1923.4562 4.4882 9576.7837 0.7955
Knee 7.7803 0.5708 16008 2042.4497 4.4411 10157.2992 0.8073
Max. Detail 7.6851 0.5563 16190 2081.7596 4.2751 10286.2666 0.8092
Medical5 Max. Contrast 4.1156 0.4317 1017 117.5567 1.7767 495.9842 0.5690
Knee 4.1156 0.3829 1486 182.3434 1.5757 763.2875 0.6173
Max. Detail 4.1156 0.3346 1729 217.4919 1.3772 905.4307 0.6017
Medical6 Max. Contrast 7.6461 0.4482 16721 2343.1399 3.4268 10709.4627 0.7703
Knee 7.6442 0.4482 16732 2347.1401 3.4259 10717.7392 0.7703
Max. Detail 7.6363 0.4482 16742 2346.8756 3.4224 10724.0633 0.7702
Medical7 Max. Contrast 7.7687 0.6045 6378 970.3478 4.6965 3831.1820 0.7633
Knee 7.7658 0.6047 6389 972.1292 4.6958 3838.3433 0.7612
Max. Detail 7.7591 0.6047 6389 972.2033 4.6916 3838.3663 0.7607
Medical8 Max. Contrast 6.7448 0.4860 354 45.3329 3.2779 150.7481 0.7133
Knee 6.1648 0.4642 496 64.1421 2.8618 222.8542 0.8958
Max. Detail 5.3591 0.4163 585 74.7138 2.2309 268.6718 0.9375
Medical9 Max. Contrast 5.6986 0.4041 29117 7292.7190 2.3027 20000.4591 0.8336
Knee 5.5245 0.4116 29587 7479.4364 2.2737 20352.2764 0.8403
Max. Detail 5.3411 0.4130 29762 7561.0648 2.2061 20485.1491 0.8429
Medical10 Max. Contrast 7.7175 0.5087 16293 2996.5663 3.9260 10606.1673 0.8023
Knee 7.5585 0.5002 16562 3094.9172 3.7810 10803.7683 0.8674
Max. Detail 7.3872 0.4864 16812 3100.2399 3.5931 10968.0618 0.8806
Disclaimer/Publisher’s Note: The statements, opinions and data contained in all publications are solely those of the individual author(s) and contributor(s) and not of MDPI and/or the editor(s). MDPI and/or the editor(s) disclaim responsibility for any injury to people or property resulting from any ideas, methods, instructions or products referred to in the content.
Copyright: This open access article is published under a Creative Commons CC BY 4.0 license, which permit the free download, distribution, and reuse, provided that the author and preprint are cited in any reuse.
Prerpints.org logo

Preprints.org is a free preprint server supported by MDPI in Basel, Switzerland.

Subscribe

© 2024 MDPI (Basel, Switzerland) unless otherwise stated