1. Introduction:
Particulate Organic Carbon (POC) is one of the most significant reservoirs of organic carbon in the ocean. It comprises living organisms, such as phytoplankton, zooplankton, bacteria, and organic debris. POC serves as a vital pathway for transferring organic carbon, generated through photosynthesis, from the surface to the ocean’s deeper layers, where it can be stored. POC is also commonly used as a measure of biological productivity in the sunlit zone of the ocean (Fingas, 2019). Due to its significant importance in the marine food chain and productivity, research on POC has increased in a prominent within the field of marine ecosystems.POC concentrations in the ocean is influenced by phytoplankton (Fernandes et al., 2009) along with several characteristics including salinity, temperature, light, nutrients, and chlorophyll-a (Chlor_a) (Stramska, 2014). The main contributor to changing POC concentrations in the open ocean among these factors is SST. The reason for low nutrient and phytoplankton, including POC, is due to weakened vertical mixing, as per (Yu et al., 2019a). In contrast, Chlor_a has a positive correlation with POC and is a major source of POC particles (Fernandes er al.,2009).
Particulate Organic Carbon exhibits spatial and temporal variations due to variety of factors, including primary production, water exchange, sediment resuspension, terrestrial inputs, ocean currents, large-scale climate patterns and fluctuations (Fan et al., 2018), as well as fluvial inputs and chemical and microbiological changes occurring as POC descends through the water column (Panagiotopoulos et al., 2012).
The concentration of Particulate Organic Carbon varies vertically, seasonally, spatially, temporally, and annually. Multiple studies were carried out that demonstrate the fluctuation of POC concentrations in various oceanic regions, including the Atlantic (Stramska, 2014), Pacific (Fan et al., 2018), Indian (Bhosle et al., 1988), and a specific study on the Bay of Bengal (Fernandes et al., 2009).
Global POC concentrations were found to be varied between 60-75 mgm-3 in the global ocean over the time period of 1998 to 2007 by (Stramska, 2009). These variations in POC concentration on a global or small-scale basis are observed using in-Situ data and mostly with satellite-derived data. Various satellite systems capture POC concentration imagery, which is used for further research. In coastal regions, where the water is highly turbid, satellite-derived data often require greater accuracy. The Moderate Resolution Imaging Spectroradiometer (MODIS) on NASA’s Aqua satellite, is a key tool for estimating POC concentrations across the global ocean.
This study investigates the variability of POC concentrations in the Bay of Bengal region over the time span of ten years (2003-2012), in different scenario. This study mainly demonstrates the seasonal and annual variability of POC, and it has been found that POC concentrations fluctuates with chlorophyll-a and sea surface temperature over the entire Bay of Bengal. 10-years of POC data, derived from MODIS Aqua satellite have been used in this study to understand the spatial and temporal variability of POC concentrations in the Bay of Bengal region.
2. Materials and Method
2.1. Study Area
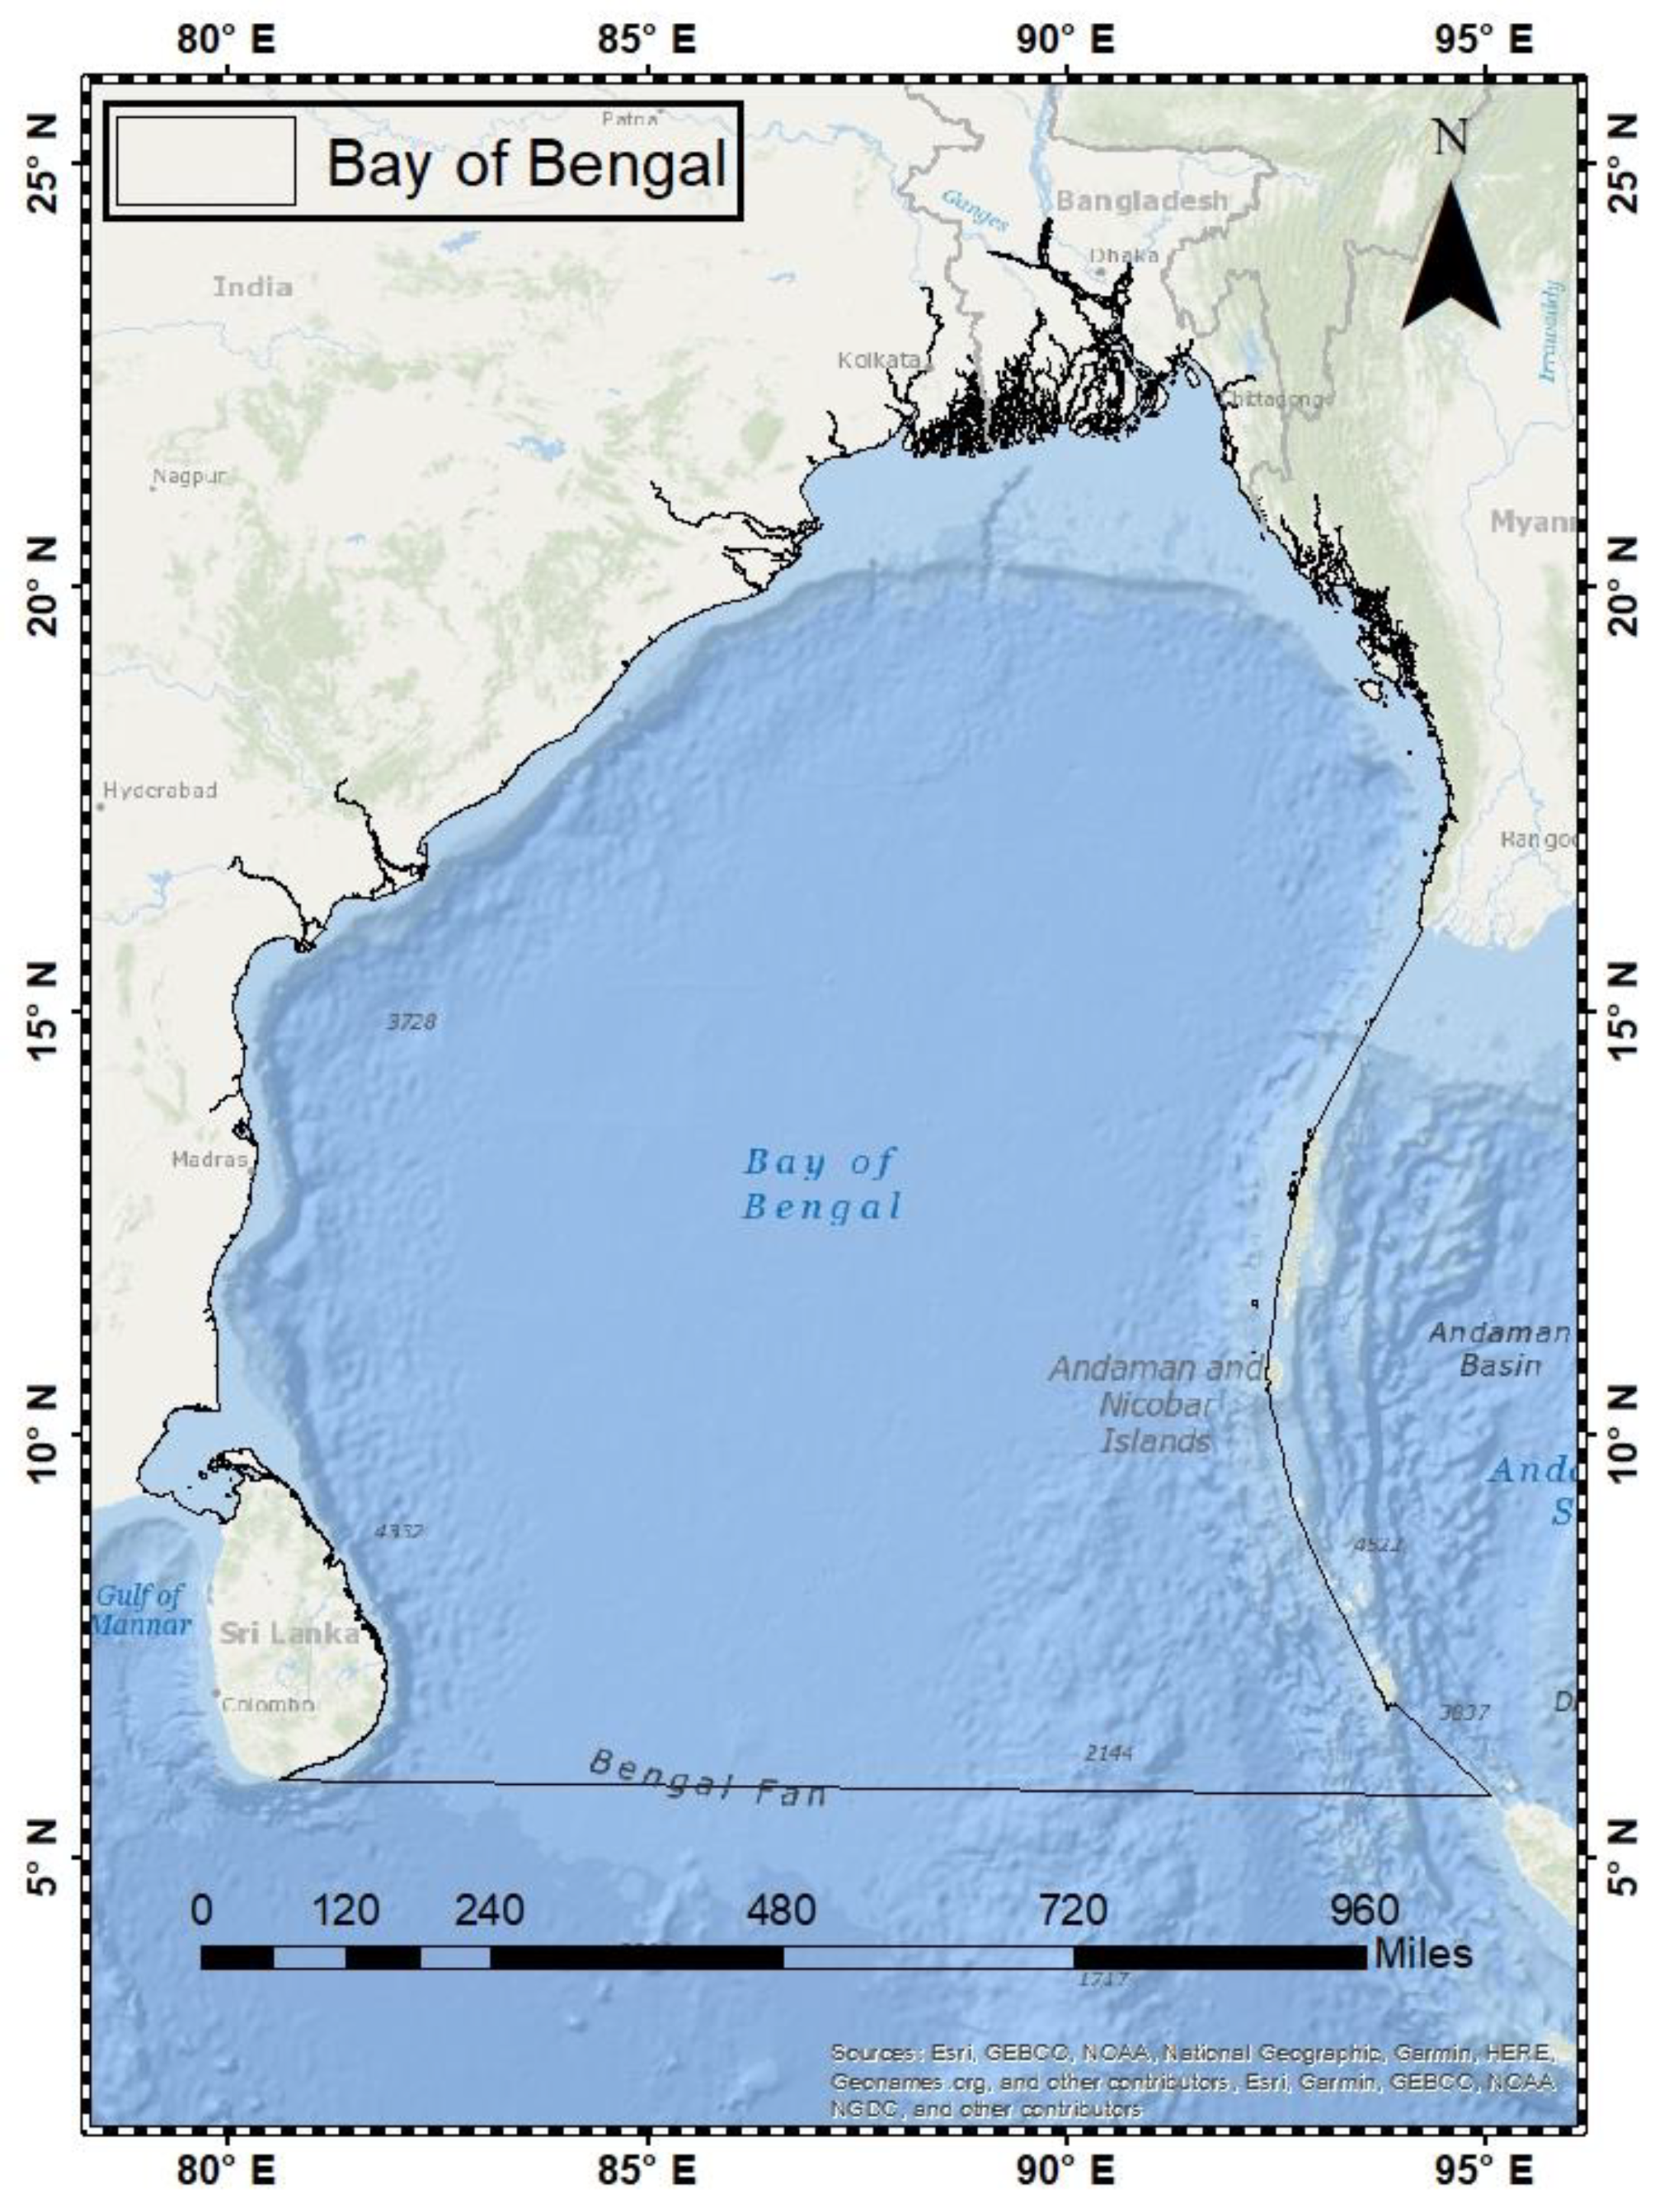
As the world’s largest freshwater input side, the Bay of Bengal is a northern extended arm of the Indian Ocean covering approximately 2.2 million square kilometers situated roughly between 6ºN-22ºN and 80ºE to 95ºE (
Figure 1). The Bay’s western boundaries are the eastern and southeast coasts of Sri Lanka and India, the deltaic region of the Ganges-Brahmaputra-Meghna system to the north, and the Myanmar peninsula extending up to the Andaman-Nicober ridges to the east (Abdul Kader,2013). Freshwater discharge into the Bay of Bengal annually exceeds 1.625×10¹² m
-3yr
-1. Because of the freshwater, the mean salinity of the BoB in the northernmost portion drops about 7 PSU. The main freshwater supplies for the Bay of Bengal are the Ganga and Brahmaputra, the Mahanadi in the north, the Godavari and Krishna in the central region, and the Irrawady, Penner, and Cavery in the south – are the major sources of freshwater for the Bay of Bengal (Kumar et al., 2004). According to (Sarangi and Devi, 2017), this study used a recognized seasonal categorization to address the seasonal variability of POC. The categories included pre-monsoon (March-May), southwest monsoon (June-September), post-monsoon (October-November), and northeast monsoon (December-February).
2.2. Data Set and Properties
This study has been done on the datasets of POC, Chlorophyll-a and SST. From the year of 2003 to 2012, monthly data of POC, Chlorophyll-a (Chlor_a), SST (11 µ daytime) were derived from MODIS Aqua Satellite, NASA Ocean Color website (
https://oceancolor.gsfc.nasa.gov). MODIS (Level-3) Particulate Organic Carbon concentration (POC) was calculated using an algorithm that was based on research by (Stramski et al.,2008). The method developed by (Stramski et al.,2008) determines the concentration of POC by means of an empirical relationship between the availability of bands centered at 443 nm in the blue region and between 547 and 565 nm in the green region, as determined by in-Situ measurement of POC and blue to green band ratios of spectral remotely sensed reflectance’s (R
rs).
The equation for the algorithm is given below:
Here, a = 203.2 and b = -0.1034.
The MODIS Chlorophyll-a concentration algorithm is based on an empirical relationship established from in-Situ measurements of chlorophyll-a and the blue-to-green band rations of in-Situ remote sensing reflectance’s (Rrs). The MODISA Chlorophyll-a dataset utilizes the Ocean Chlorophyll 2 (OC2) algorithm and the Enhanced Ocean Chlorophyll 4 (OC4) algorithm, which is a maximum band ratio formulation using four bands (443, 490, 510, and 55 nm) as described by (O’Reilly et al., 1998).
The SST data is obtained using the long-wave infrared bands of 11 µm and 12 µm. The present Sea Surface Temperature (SST) method is derived from a modified version of (Walton et al.,’s 1998) nonlinear SST algorithm and can be applied to both daytime ad nighttime data collected by the MODISA sensor (NASA 2014, n.d).
2.3. Data Processing and Analysis
The MODISA satellite-derived POC, Chlor_a and SST data were all processed and analyzed using the Sentinel Application Platform (SNAP) 10.0.0 software. This software is generally employed to extract spatial data and visualize and analyze ocean color data. POC:Chlor_a ratios were determined using SNAP’s collocation tool by dividing MODISA derived POC and chlorophyll-a data. All the data were compiled in Microsoft Excel and visualized using RStudio Desktop. Statistical analysis, such as regression, correlation, and ANOVA were performed using RStudio Desktop.
3. Result and Discussion
3.1. Annual Variability of POC
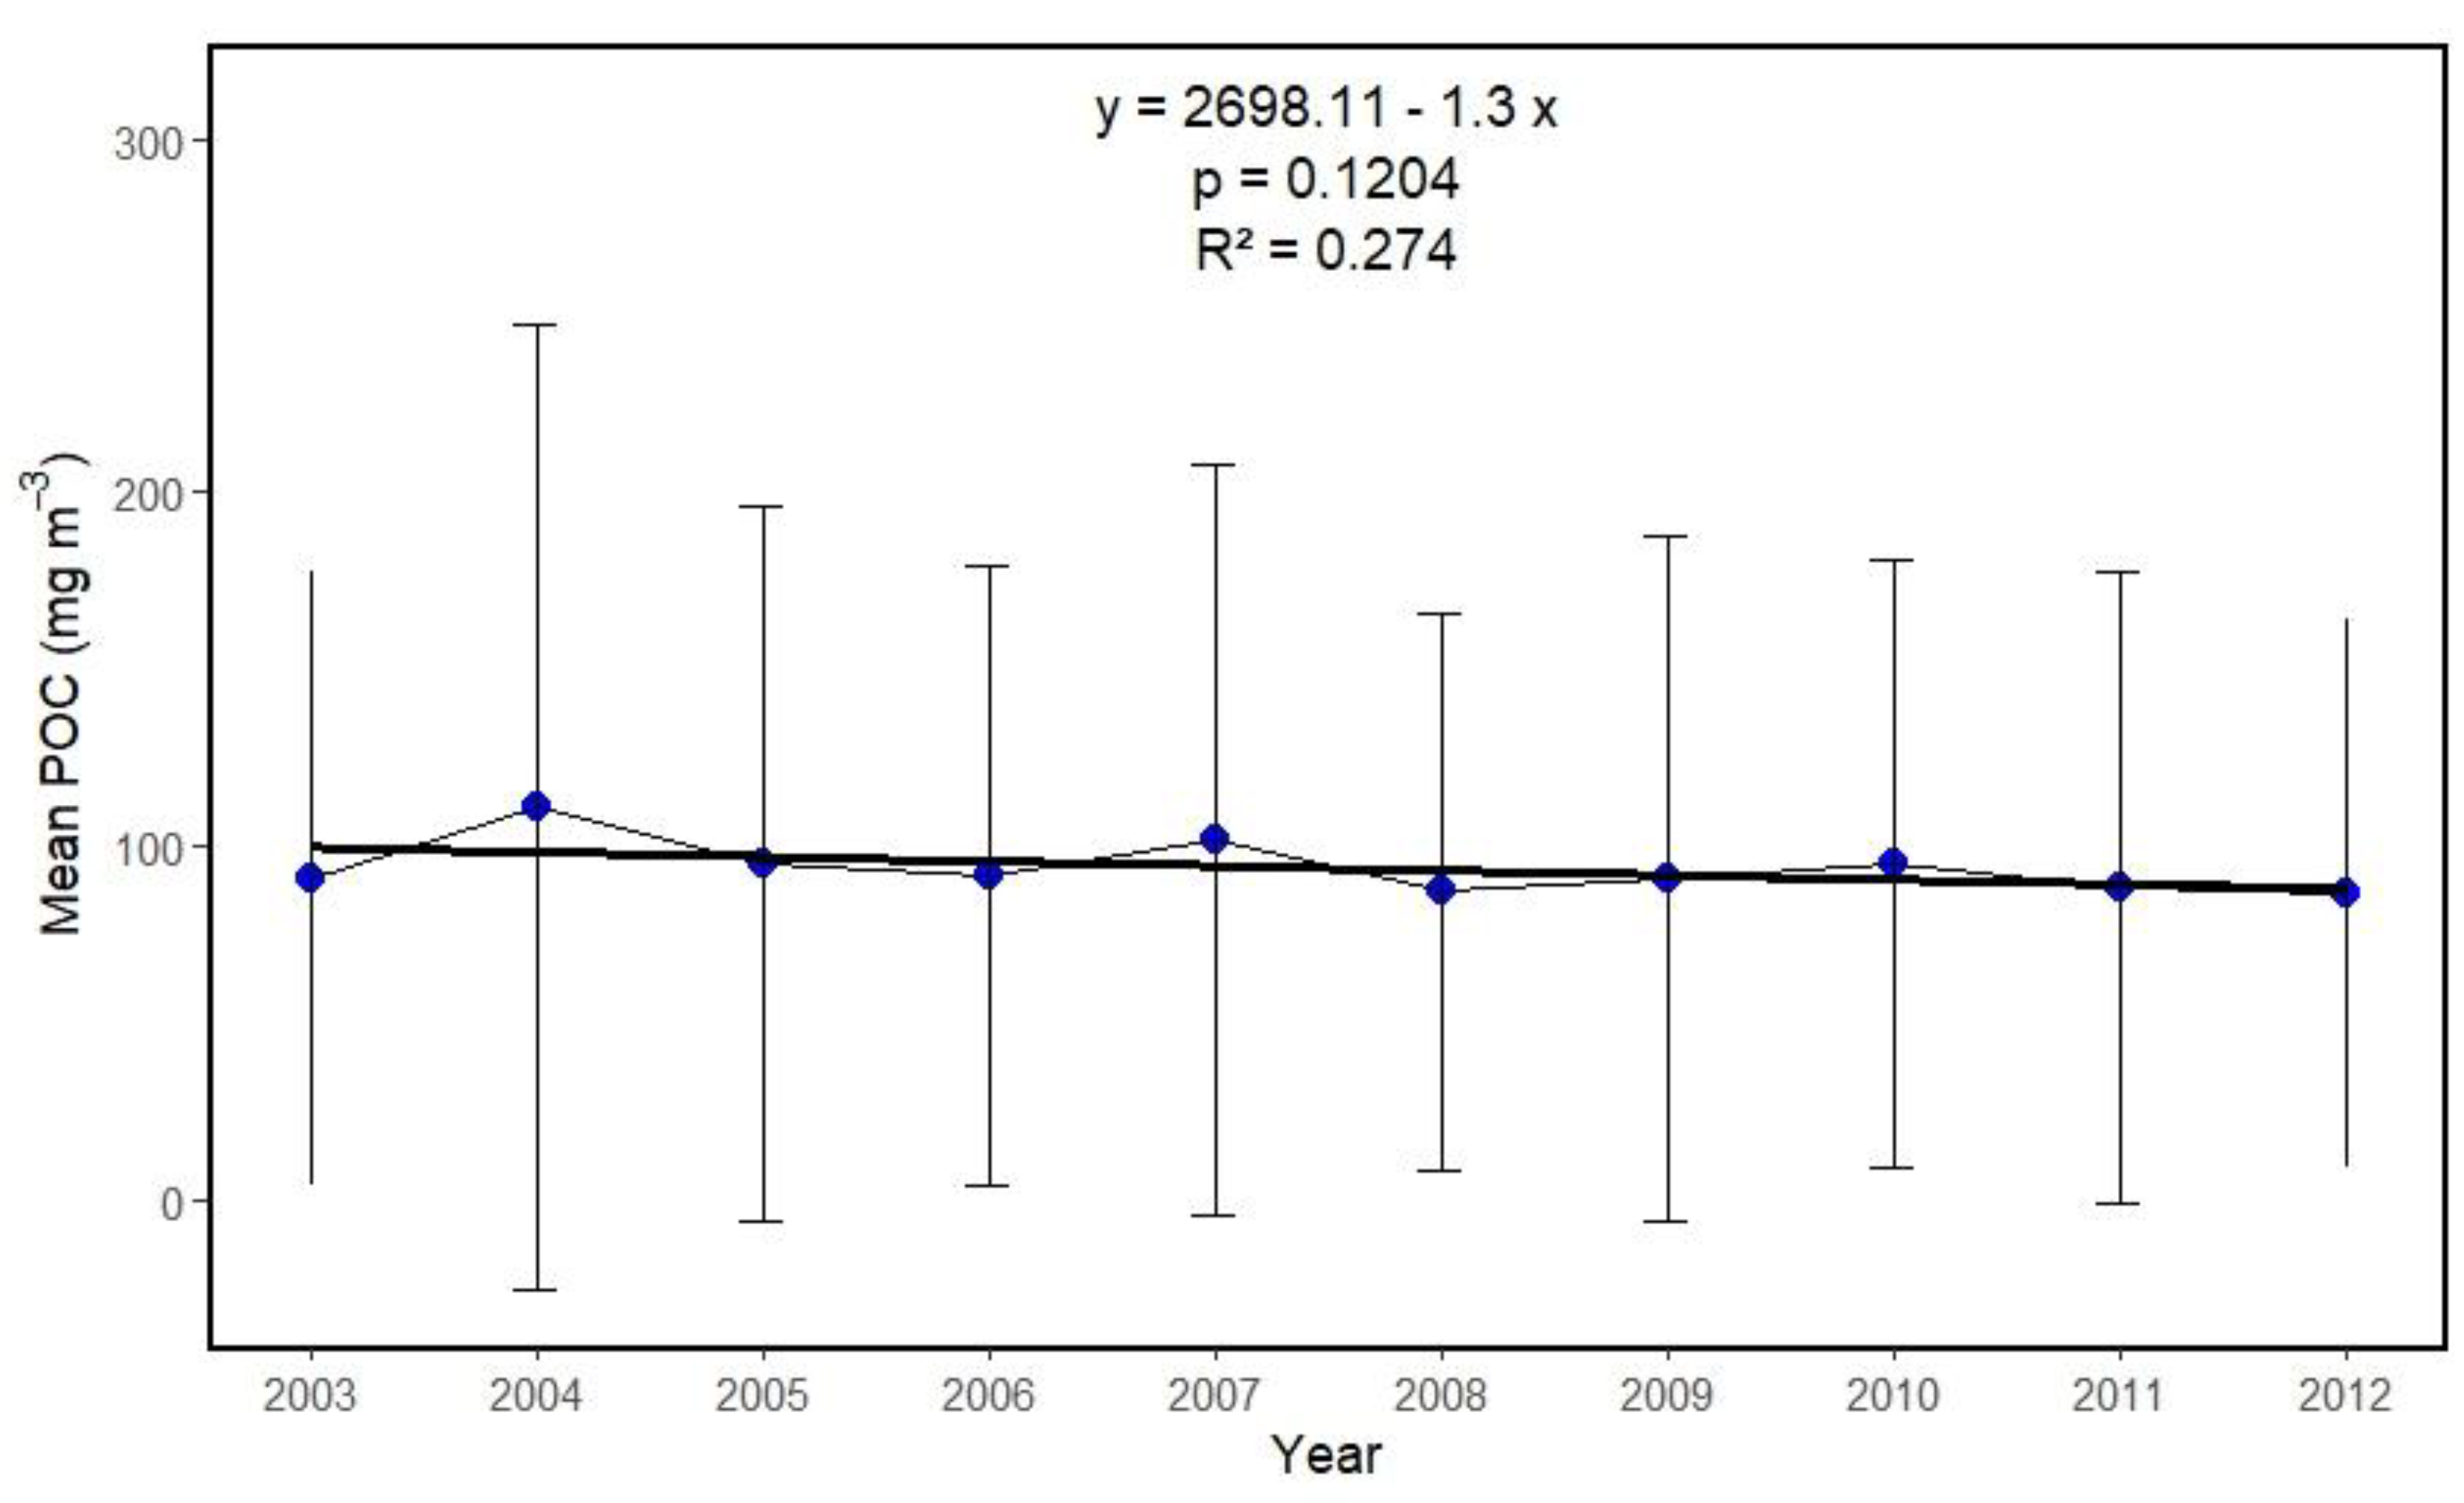
The yearly trend typically shows the inter-annual variability of the POC, which is a major, long-term change in POC. In order to show the annual trend in POC concentration throughout the ten-year period from 2003 to 2012, annual composites of POC were derived from the MODIS Aqua satellite. These 10-year surface POC concentrations showed the dynamic fluctuation of POC in the BoB, with POC levels ranging from 86.48 mgm-3 to 110.93 mgm-3 (average of 93.74 ± 7.50) mgm-3 and declining at a rate of -1.30 mgm-3 per year.
The annual average POC concentration was documented as 70-120 mgm-3 in the North Atlantic, 58-82 mgm-3 in the South Atlantic, 50-85 mgm-3 in the North Pacific, 45-50 mgm-3 in the South Pacific, with a global ocean average ranging from 60-75 mgm-3 (Stramska, 2009). (Stramska, 2009) also reported that the annual average POC concentration in the Indian Ocean was approximately 50-75 mgm-3, which closely aligns with our derived yearly mean POC concentration, as the Bay of Bengal is a part of the Indian Ocean. In the northern Bay of Bengal, POC concentrations ranged from 126.83 mgm-3 to 180.58 mgm-3 (Rouf et al., 2021). However, in the southwest Bay of Bengal, POC values ranged from 62.60 mgm-3 to 108.72 mgm-3 (Kandasamy et., 2019).
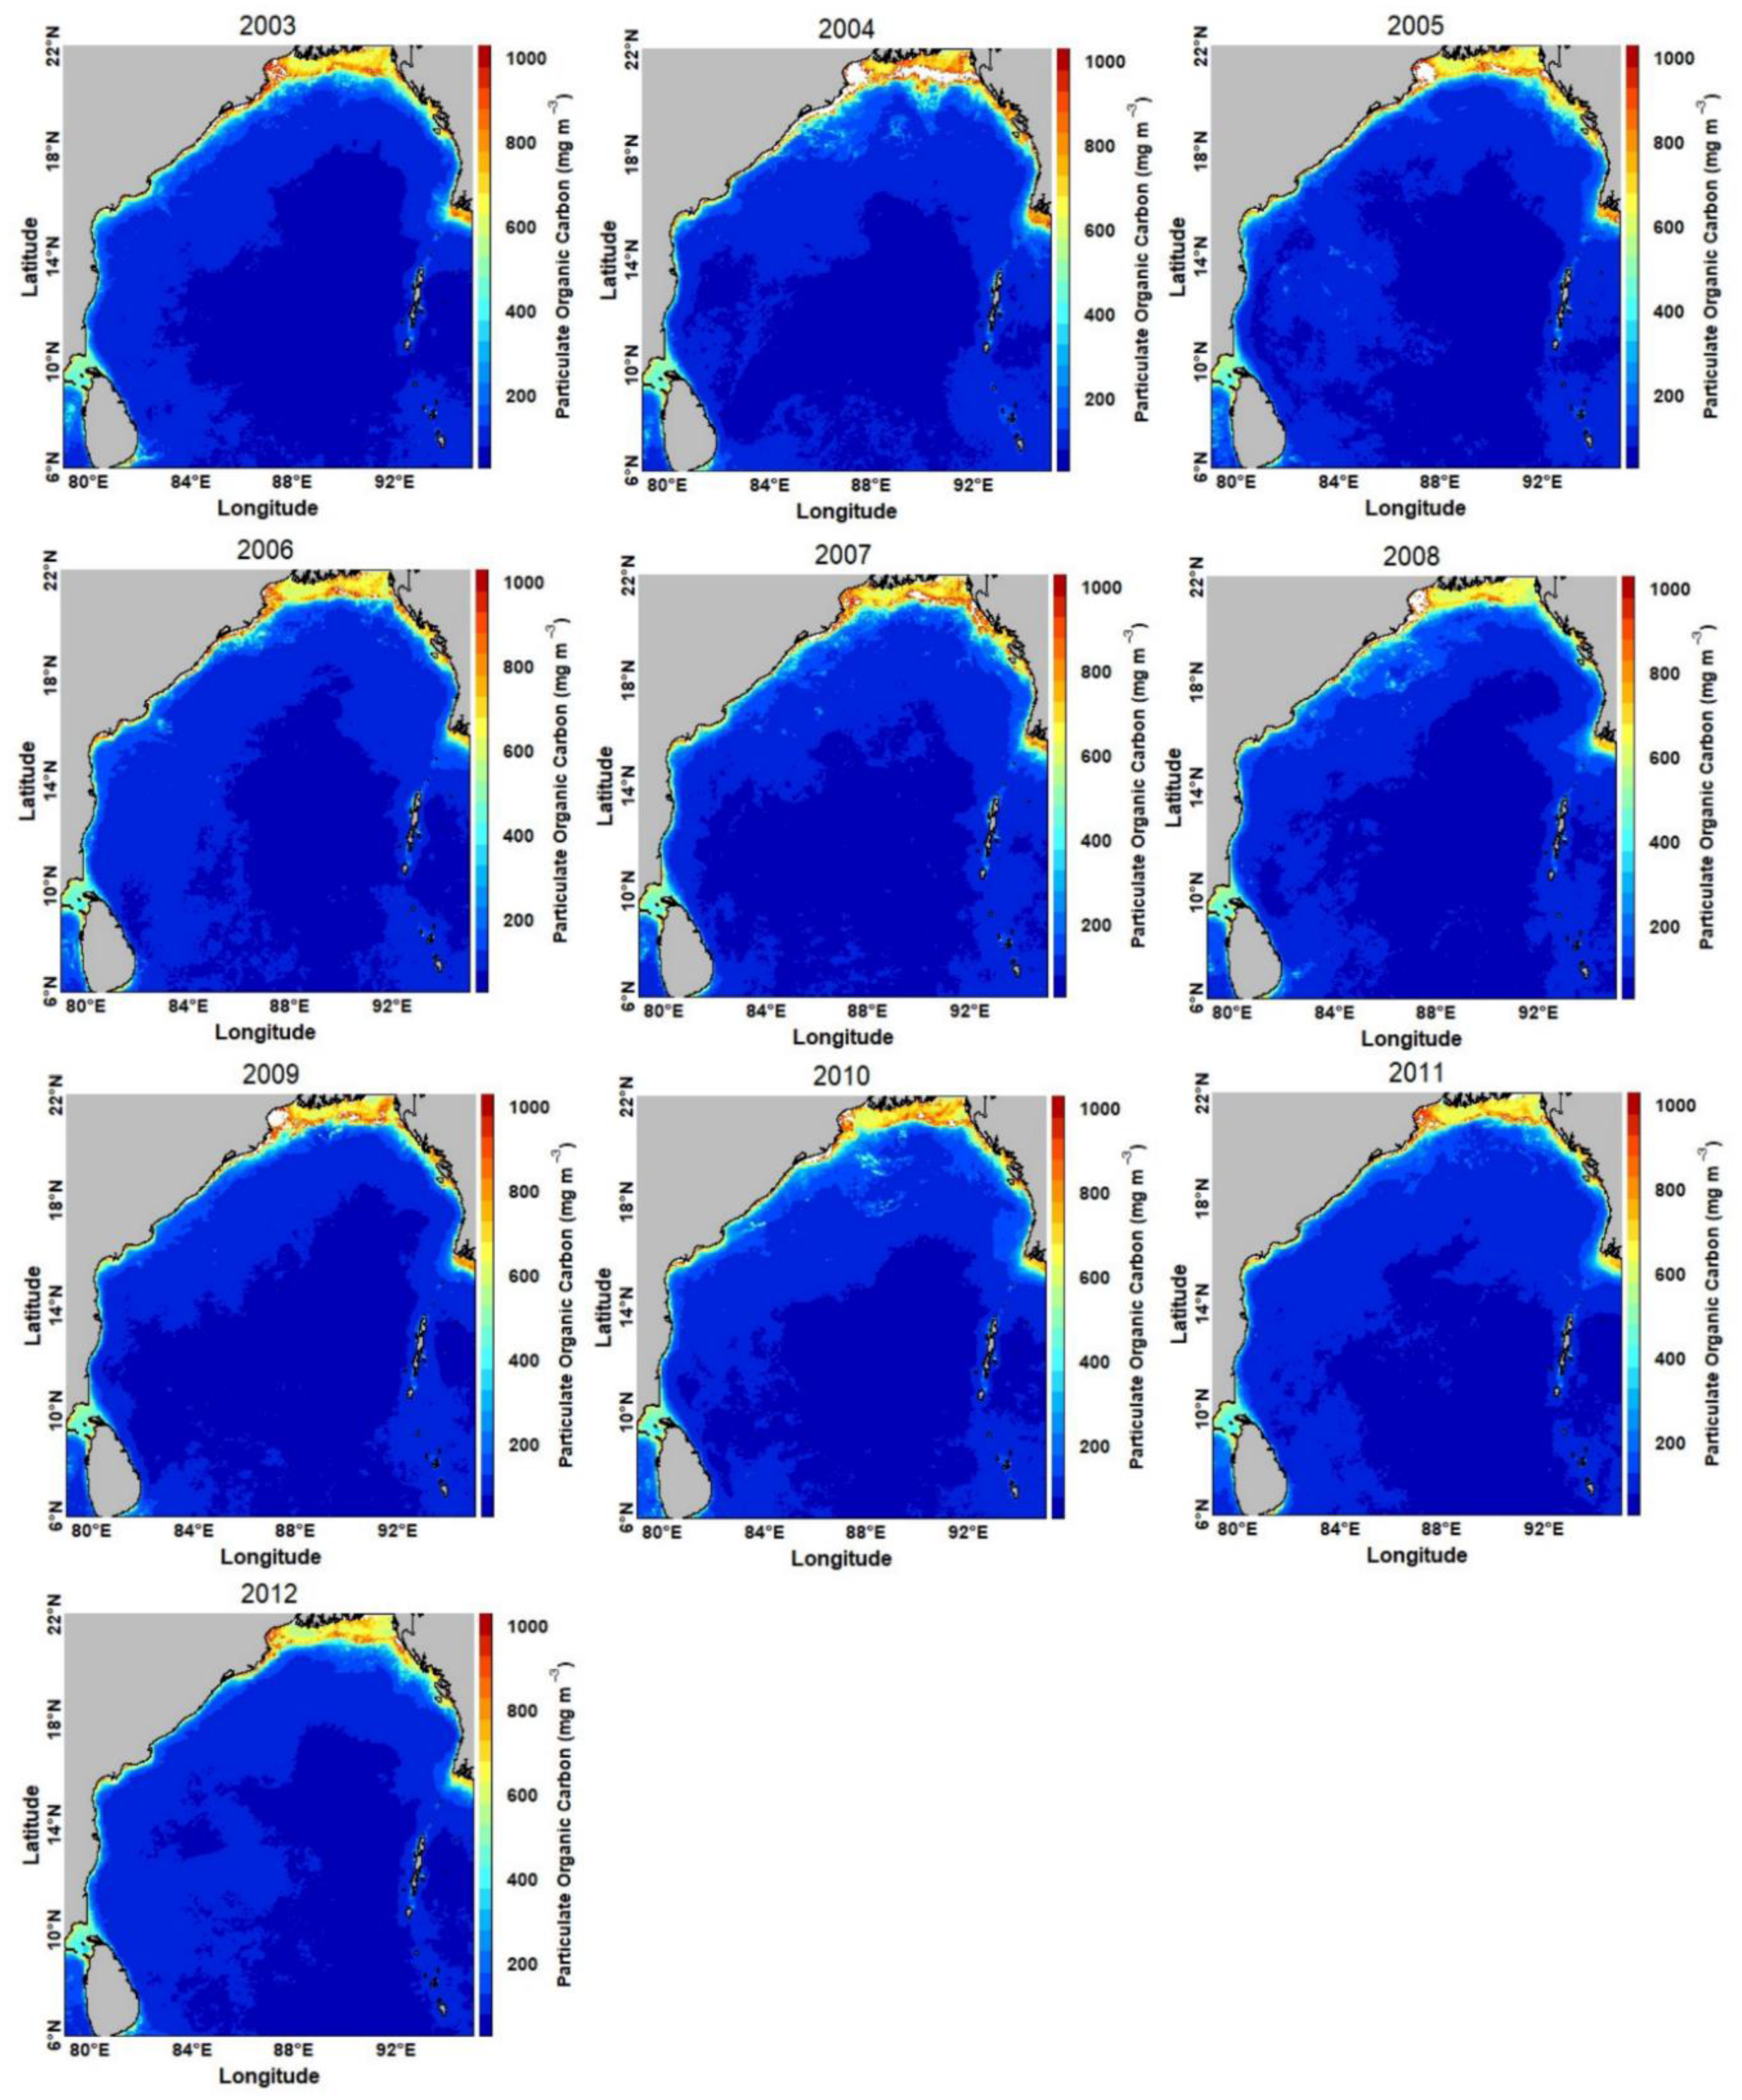
The POC distribution in the Bay of Bengal from 2003 to 2012 is depicted (
Figure 3) in yearly composites derived from MODISA satellite. This study has found that POC concentration decreases as we move from north to south and the rate of decrease in POC concentration as we move southward is 14.89 mgm
-3 per degree of latitude. According to other relevant studies (Fernandes et al.,2009; Stramska, 2009), the northern Bay of Bengal has a comparatively higher POC concentration due to terrestrial inputs and coastal dynamics, which is consistent with the findings of this investigation. (Stramska & Bialogrodzka, 2016) identified a decreasing trend in POC over a decade, corresponding with a decline in phytoplankton, in addition, in the northern Bay of Bengal, annual average POC concentration has shown a declining trend, as observed by (Rouf et al.,2021), both of which is similar to our findings in this study. Phytoplankton biomass, indicated by Chlor_a, remains the primary driver of long-term POC trends in the ocean. (Arrigo et al.,2008).
The classified image from satellite-derived data depicts the annual variations in POC in the Bay of Bengal. The open portion of the Bay of Bengal has POC concentrations ranging from 40 mgm
-3 to approximately 200 mgm
-3, while the coastal region of the Bay of Bengal has a relatively higher POC concentrations, generally between 200 and 1000 mgm
-3.
3.2. Seasonal Variability of POC
The BoB has a distinct feature known as the monsoon, which defines the seasons and affects the main phenomena in Bangladesh’s coastal and territory regions. Consequently, by studying this variability of POC, we may uncover the ways in which the monsoon influences POC variability.
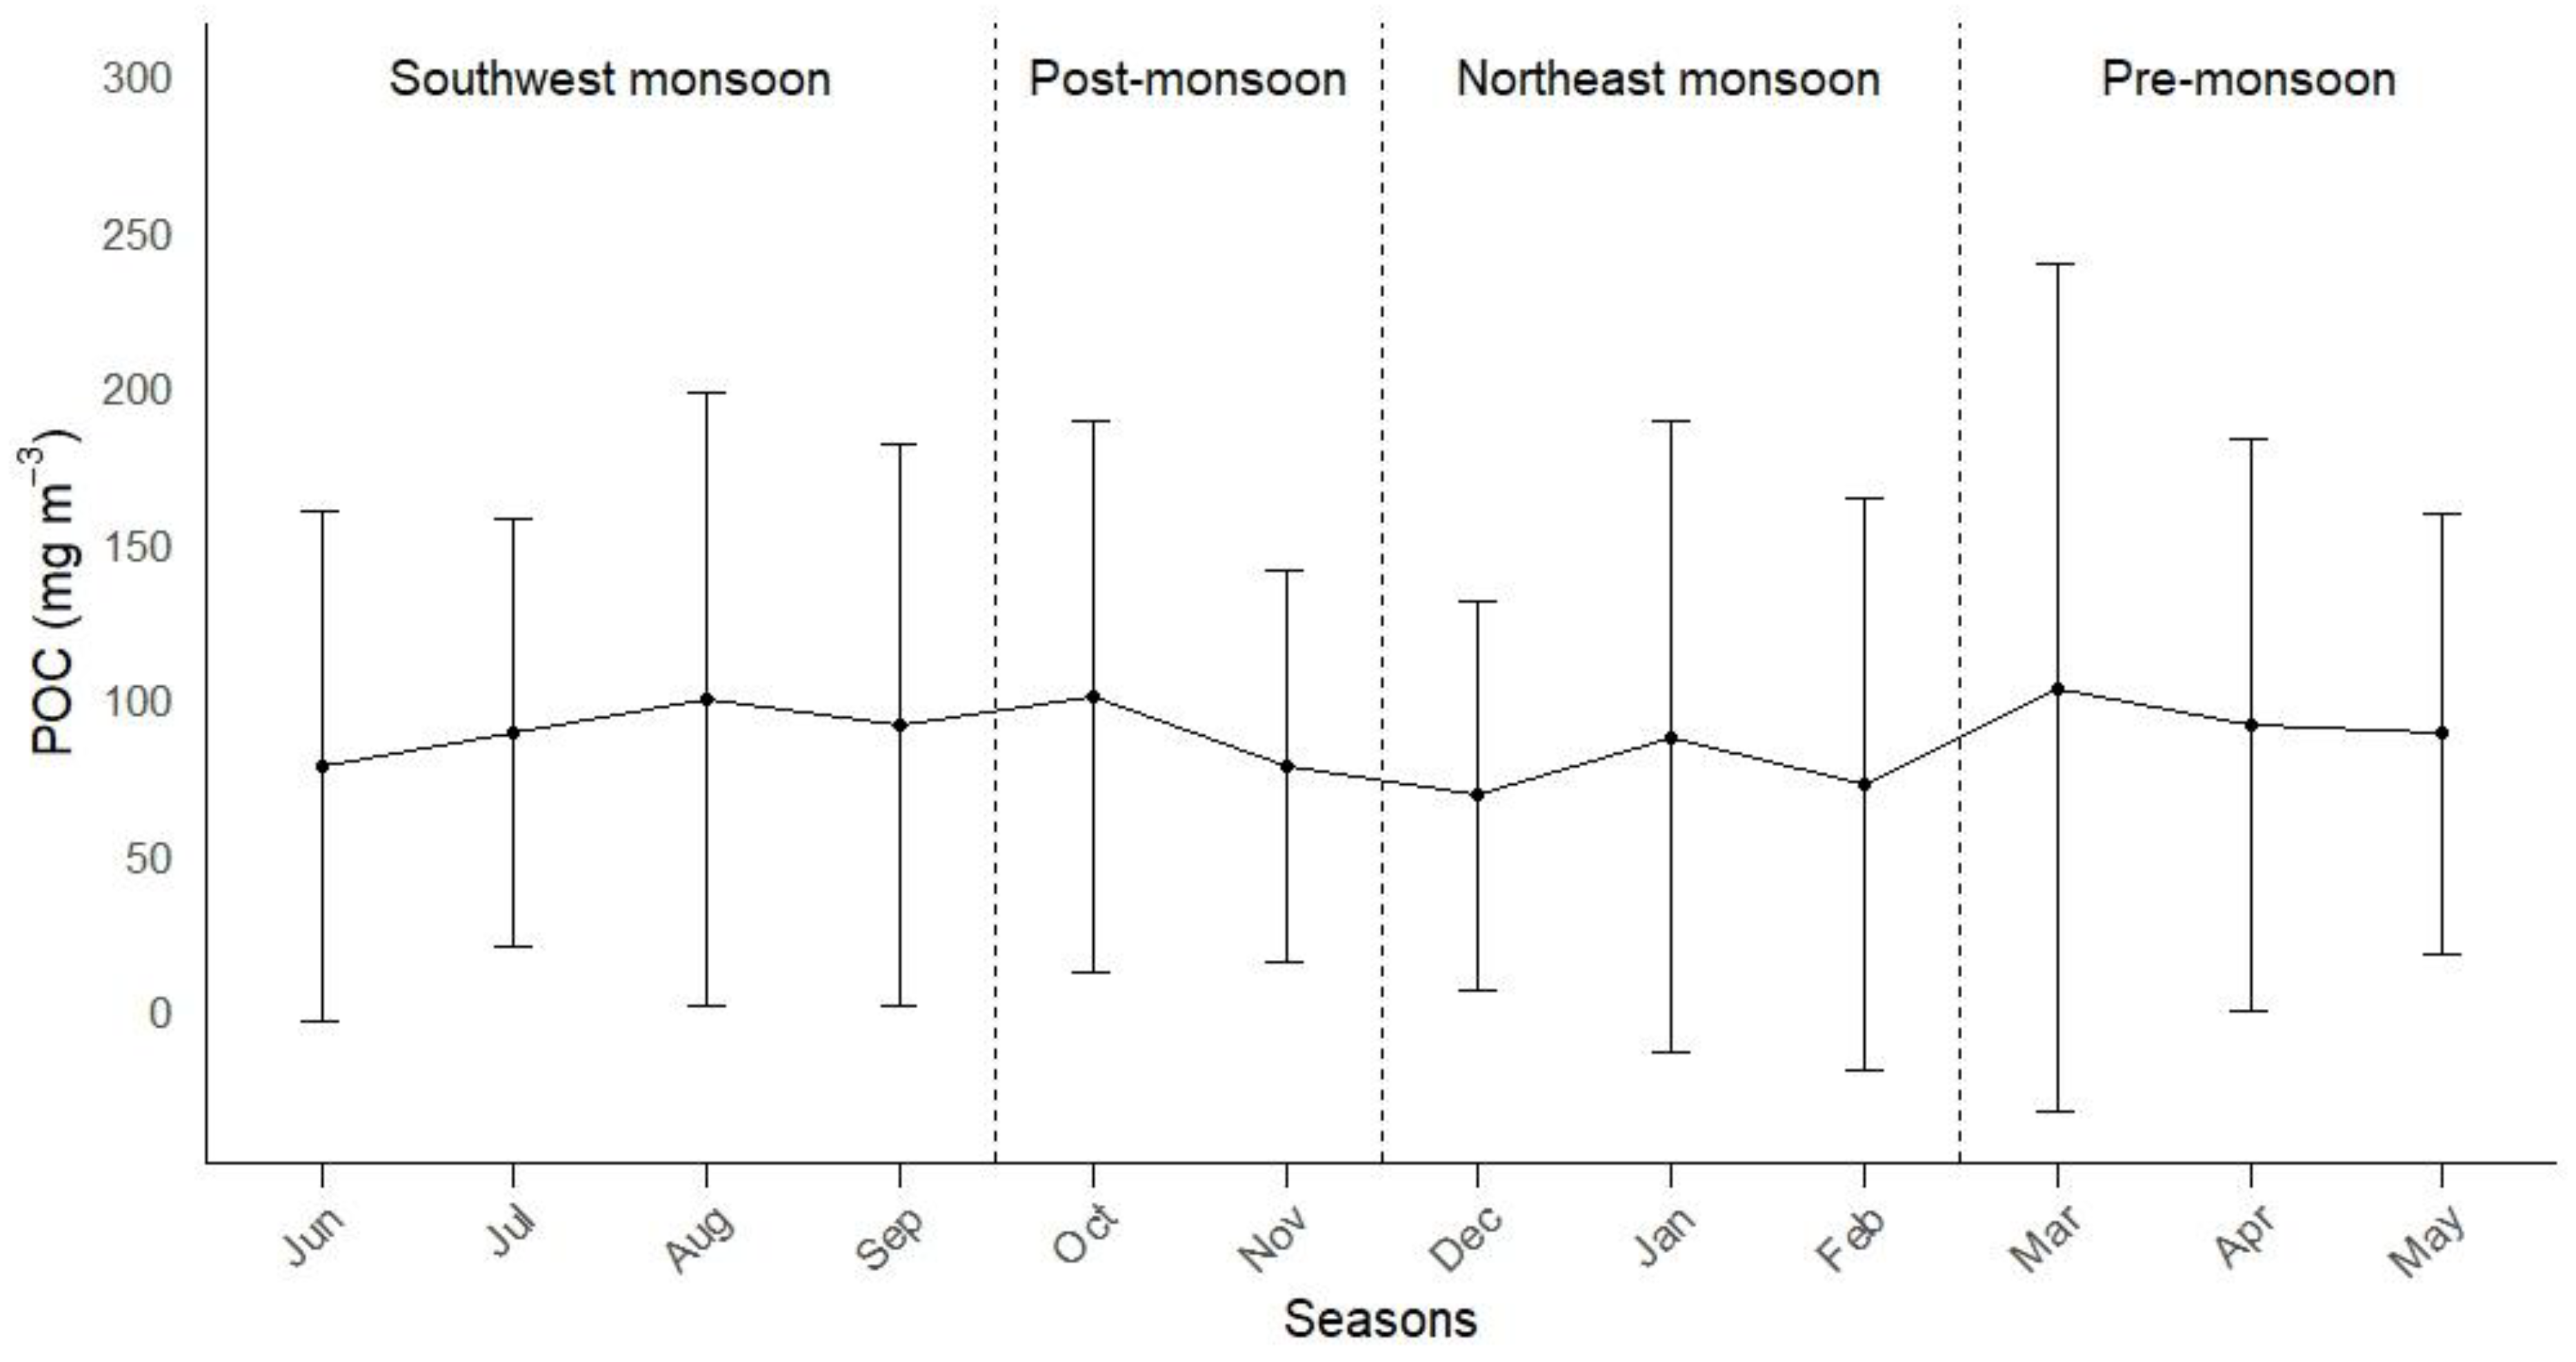
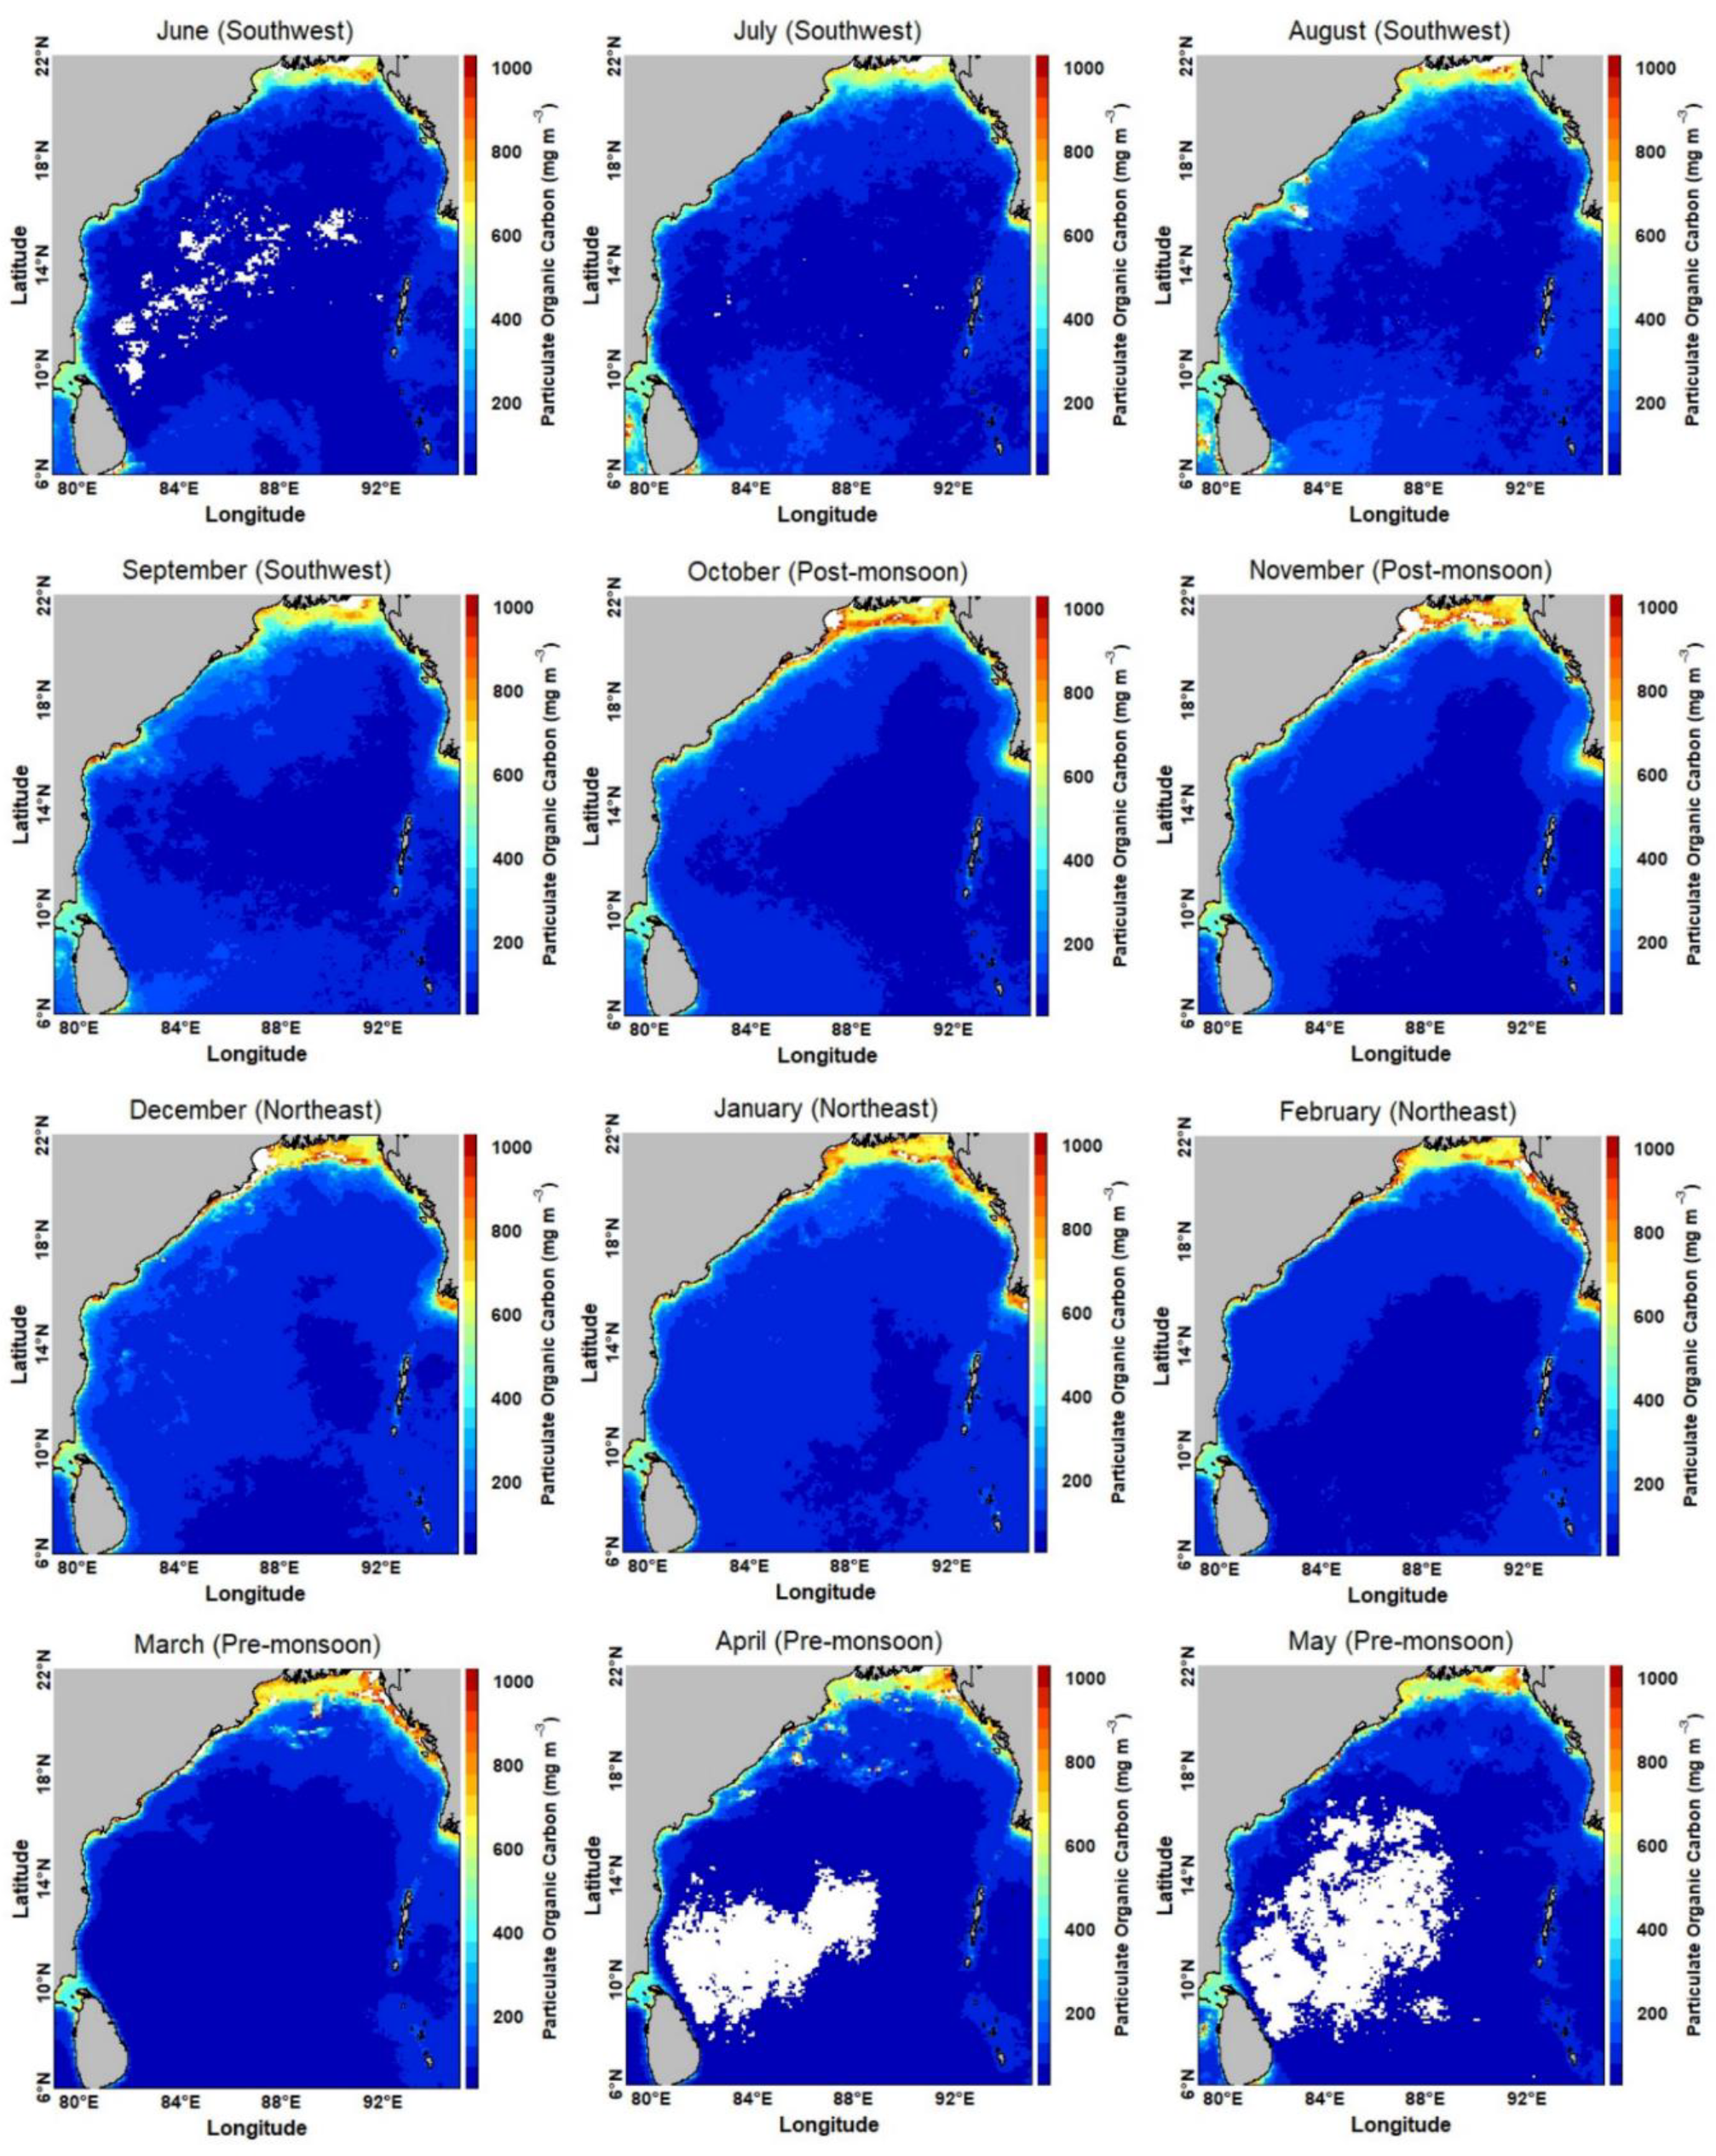
The seasonal distribution of POC concentration was studied in this work by binning and averaging monthly MODISA satellite-derived POC data collected over 10-year period (2003-2012). This 10-years monthly mean POC varies from 68.80 mgm-3 to 103.12 mgm-3. POC concentrations were found to be highest during the post-monsoon (October-November) (97.40 mgm-3) and northeast-monsoon (December-February) (97.14 mgm-3). A relatively reduced POC concentration (81.13 mgm-3) was observed during the southwest-monsoon (June-September). The lowest POC concentration (79.36 mgm-3) was observed during the pre-monsoon (March-May). This finding closely aligns with the findings of (Rouf et al., 2021).
POC concentrations in the study area were found to be statistically significant among seasons, as indicated by a two-way ANOVA (F
(3,2155) = 6.298, p = 0.000298). Moreover, a substantial variation in the mean POC between seasons was found using the
post hoc analysis (Tukey). All seasons were significantly different from one another, with the exception between post-monsoon and northeast monsoon (0.999) and southwest and pre-monsoon (0.985).
The fluctuations in POC across seasons are predominantly shaped by factors such as primary productivity (with a detailed on the POC and Chlor_a relationship discussed later), in addition to river run-off or terrestrial inputs, eddy dynamics, water currents, upwelling, changing monsoon winds, stratification, light penetration, and sediment resuspension (Rouf et al.,2021). Monthly climatological image of POC over the period of ten-years from 2003-2012 was binned to obtain a mean monthly POC concentrations for the designated time period.
The highest mean POC concentration were observed during the post-monsoon (97.40 mgm
-3, Oct-Nov) and northeast-monsoon (97.14 mgm
-3, Dec-Feb) periods. (Rouf et al.,2021) also found that POC was highest during the northeast-monsoon. This increase is attributed to elevated chlorophyll-a levels (ranging from 0.38 mgm
-3 to 0.47 mgm
-3), moderate sea surface temperature (27.05 t0 29.07°C), substantial nutrient input, and phytoplankton blooms driven by Ekman pumping. A moderate mean POC concentration (81.13 mgm
-3) was observed in the southwest monsoon. Similar moderate POC was also reported in this season by (Kandasamy et al.,2019). Pre-monsoon (March-May) had the lowest mean POC (79.36 mgm
-3) concentration, which closely aligns with the findings of (Rouf et al.,2021). According to (Gomes et al., 2000; Nagamani et al., 2011; Sarangi et al., 2008), the observed POC may be caused by a number of factors, including rising sea surface temperatures (average of 29.23±0.97ºC), insufficient fresh water input, upward movement of deeper waters by the EICC (mostly in March), and eddy-like structures along the coast. Some more relevant investigation has been done on seasonal POC variation in several regions of the world ocean. (
Table 3)
3.3. Relationship between POC Concentration and Chlorophyll-a (Chlor_a)
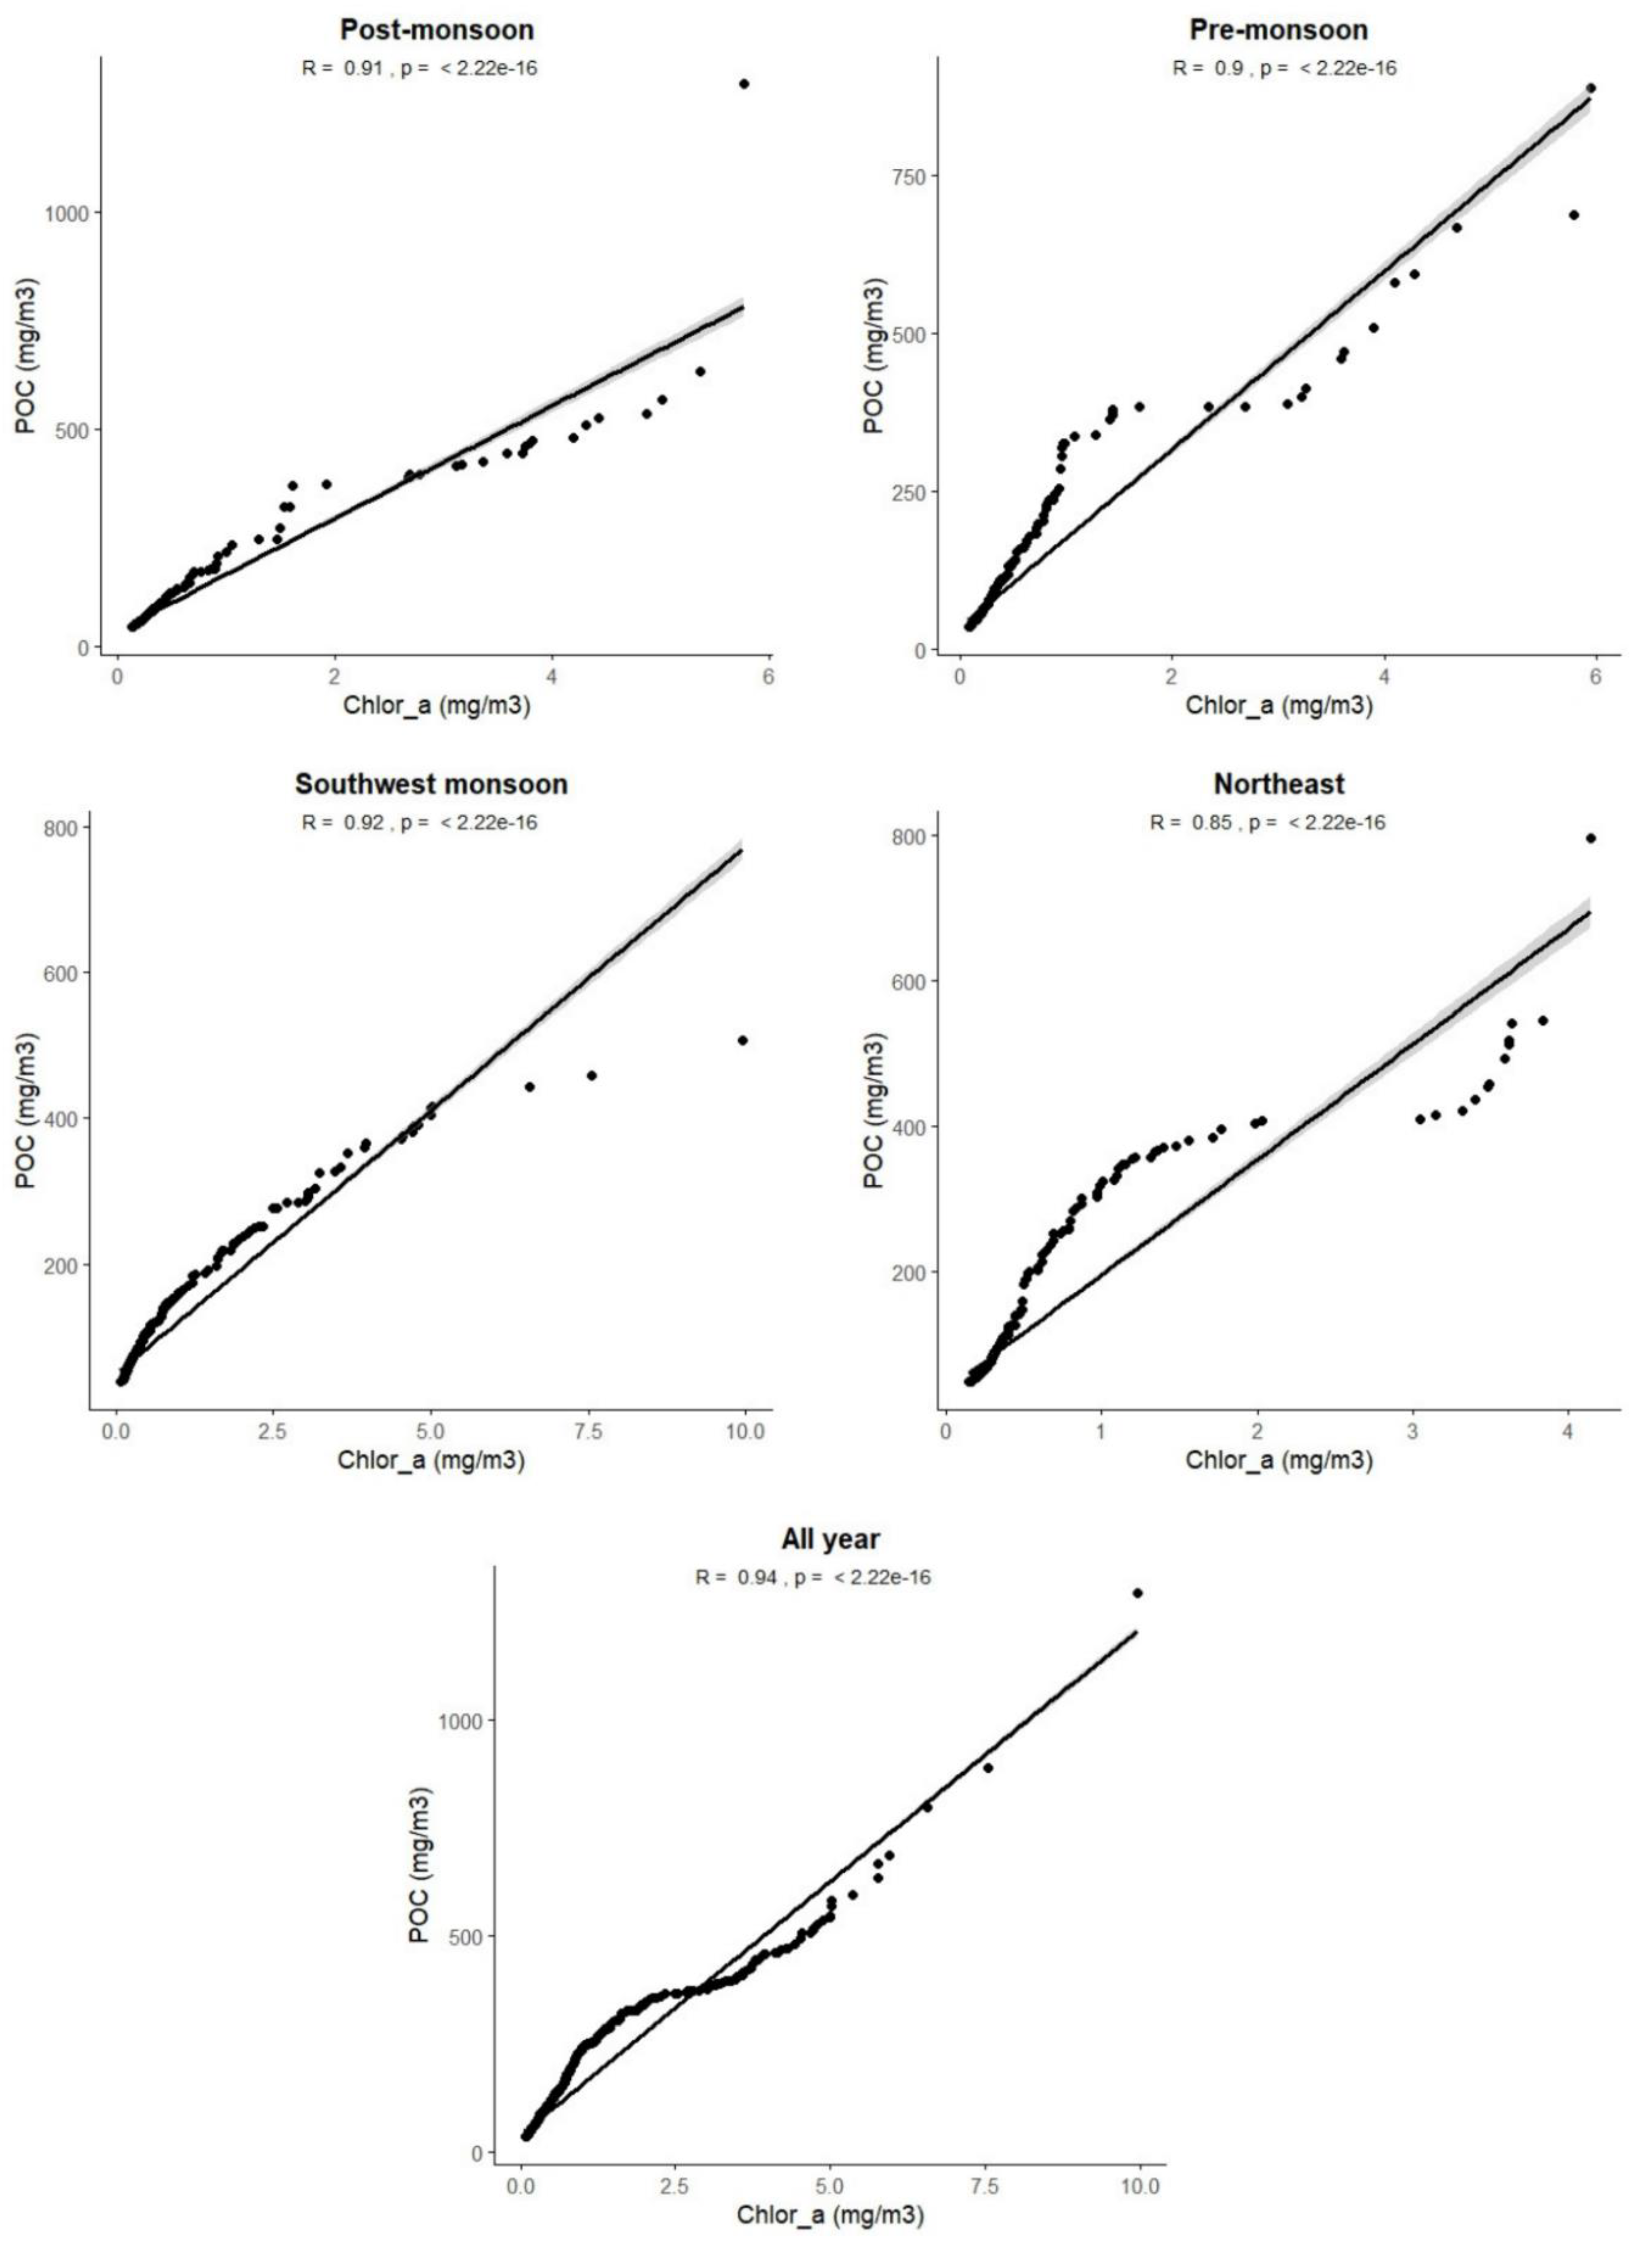
A strong positive correlation between POC and Chlor_a was observed across both seasonal and annual datasets in the Bay of Bengal. The liner regression model demonstrated a high R
2 value for the relationships within seasons and throughout the year. The coefficient of determine (R
2) ranged from 0.92 during the southwest-monsoon to 0.85 in the northeast-monsoon season. The linear regression model revealed a significant (p<0.05) and a positive relationship (b = 116.96) between POC and Chlor_a in the Bay of Bengal. The correlation coefficient between POC and Chlor_a concentration varied from 0.85 to 0.94 across all seasons and years (
Table 4). Among all the seasons, the strongest correlation (R
2 = 0.92) was observed in the southwest-monsoon and post-monsoon (R
2 = 0.91) and also in the pre-monsoon (R
2 = 0.90). A similar pattern was noted in the western Bay of Bengal by (Fernandes et al.,2009), where a highly significant positive relationship between POC and Chlor_a was identified during southwest-monsoon (r = 0.3656, p < 0.02), post-monsoon (r = 0.4951, p < 0.001) and pre-monsoon (r = 0.4965, p < 0.001)
3.3.1. Temporal Variations of POC Concentration and Chlor-a in the Bay of Bengal
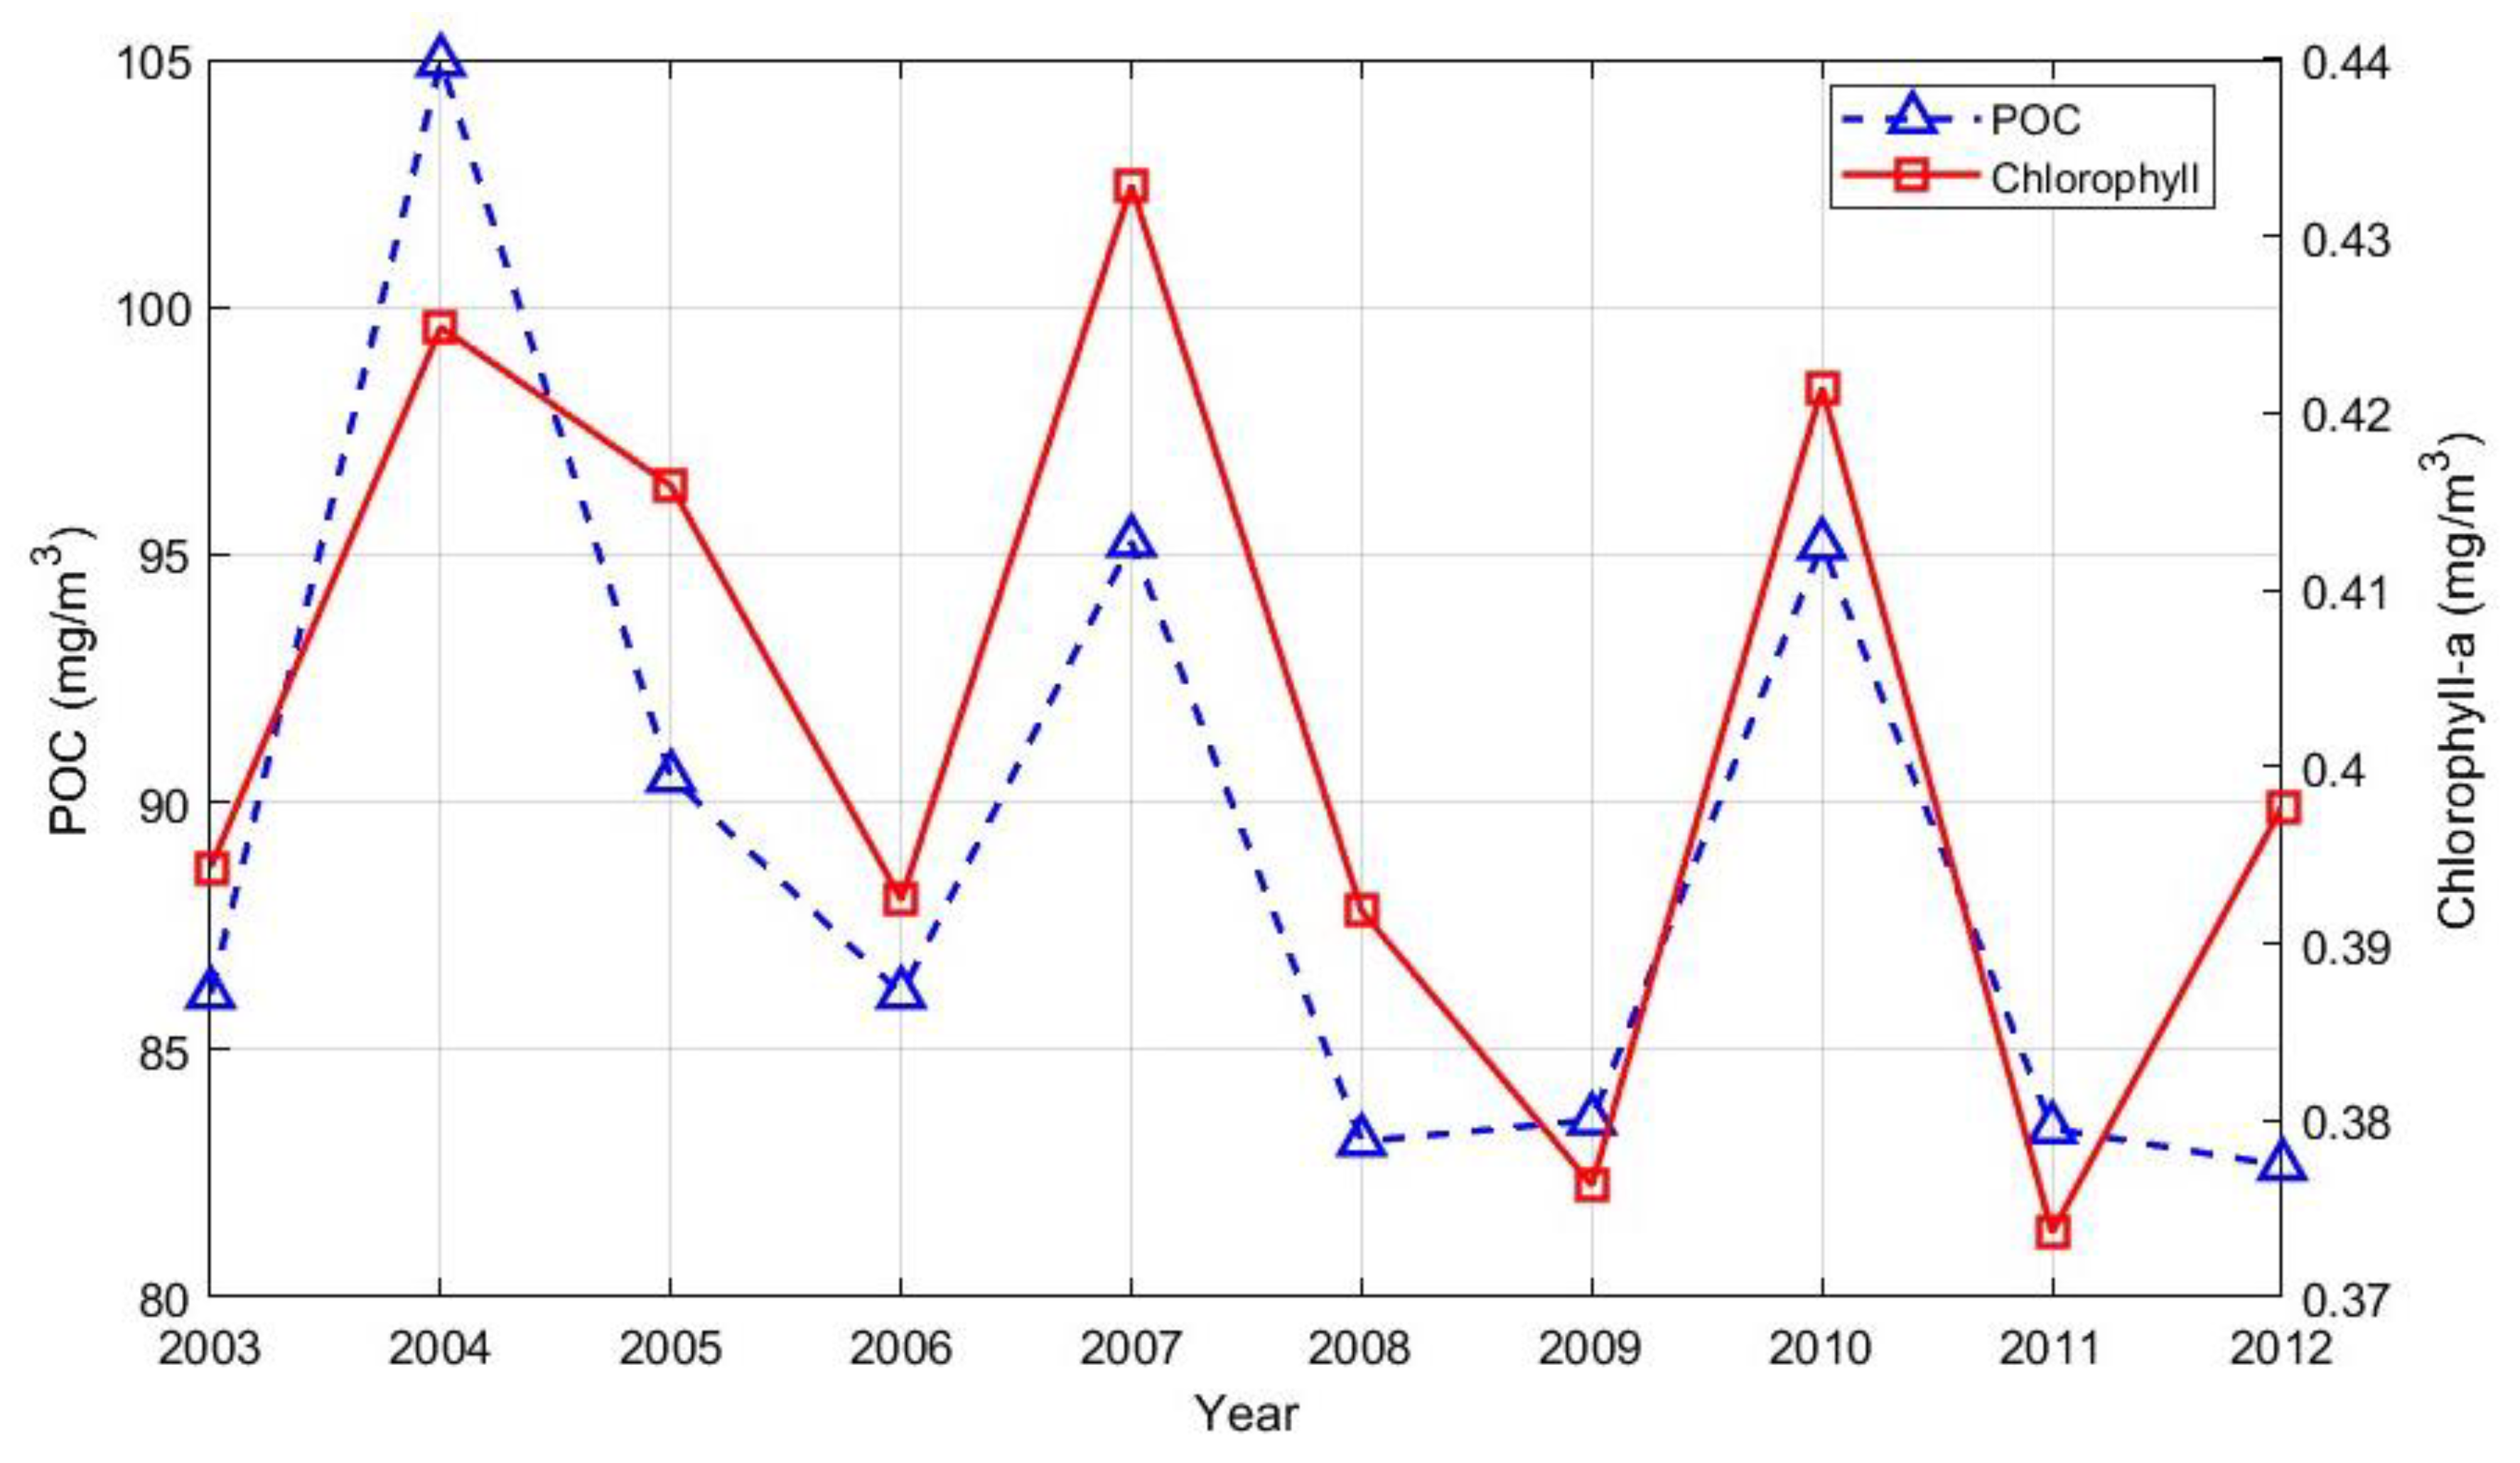
(
Figure 7) represents the temporal variations of POC (mgm
-3) and chlorophyll-a (mgm
-3) concentrations from 2003 to 2012. The trends observed indicate a generally strong positive correlation between POC and Chlorophyll-a, as evidenced by the synchronous peaks and troughs across the years. Notably, both POC and Chlorophyll-a concentrations peaked in 2004 and 2010, suggesting the factors influencing phytoplankton productivity might simultaneously affect POC levels. Conversely, lower values were observed around 2007 and 2012, indicating potential periods of reduced productivity. These trends align with the findings discussed later in section (3.4), regarding the relationship between SST and POC, further supporting the concept that changes in SST influence vertical mixing and nutrient availability in the water column, thereby impacting both POC and Chlorophyll-a concentrations. The synchrony in fluctuations emphasizes the interconnectedness of these two parameters, suggesting that Chlorophyll-a can serve as a proxy for POC concentration in the Bay of Bengal. Warmer SST conditions, as reflected in section (3.4) section, influencing nutrient availability and, consequently, the productivity of phytoplankton and POC concentrations (Yu et al.,2019a)
3.3.2. POC:Chlor_a Ratio
POC fluctuation in the Bay of Bengal is closely linked to primary production, in line with the findings of (Yu et al., 2019a). The POC:Chlor_a ratio is a crucial indicator for determining the ecological and physiological state of phytoplankton and indicates the source of organic matter (Sherin et.,2018). The annual mean POC:Chlor_a ratio found to be varied from (279.58±48.04) mgm-3 to (317.78±70.27) mgm-3 in the Bay of Bengal. (Lee et al.,2020) also found a quite similar annual POC:Chlor_a ratio ranged from 169.6 to 528.4 for the Japan sea, South Korea. The climatological monthly mean POC:Chlor_a ratio demonstrated the lowest value during the post-monsoon (279.58±48.04) mgm-3 and a highest during the pre-monsoon (317.78±70.27) mgm-3 in the Bay of Bengal. The POC ratios vary seasonally, influenced by phytoplankton physiology and size classes (Lee et al.,2020; Roy et al.,2017). Smaller phytoplankton typically show higher POC ratios due to slower POC sinking (Lee et al.,2020; Yu et al.,2019a).
3.4. Relationship between POC Concentration and SST
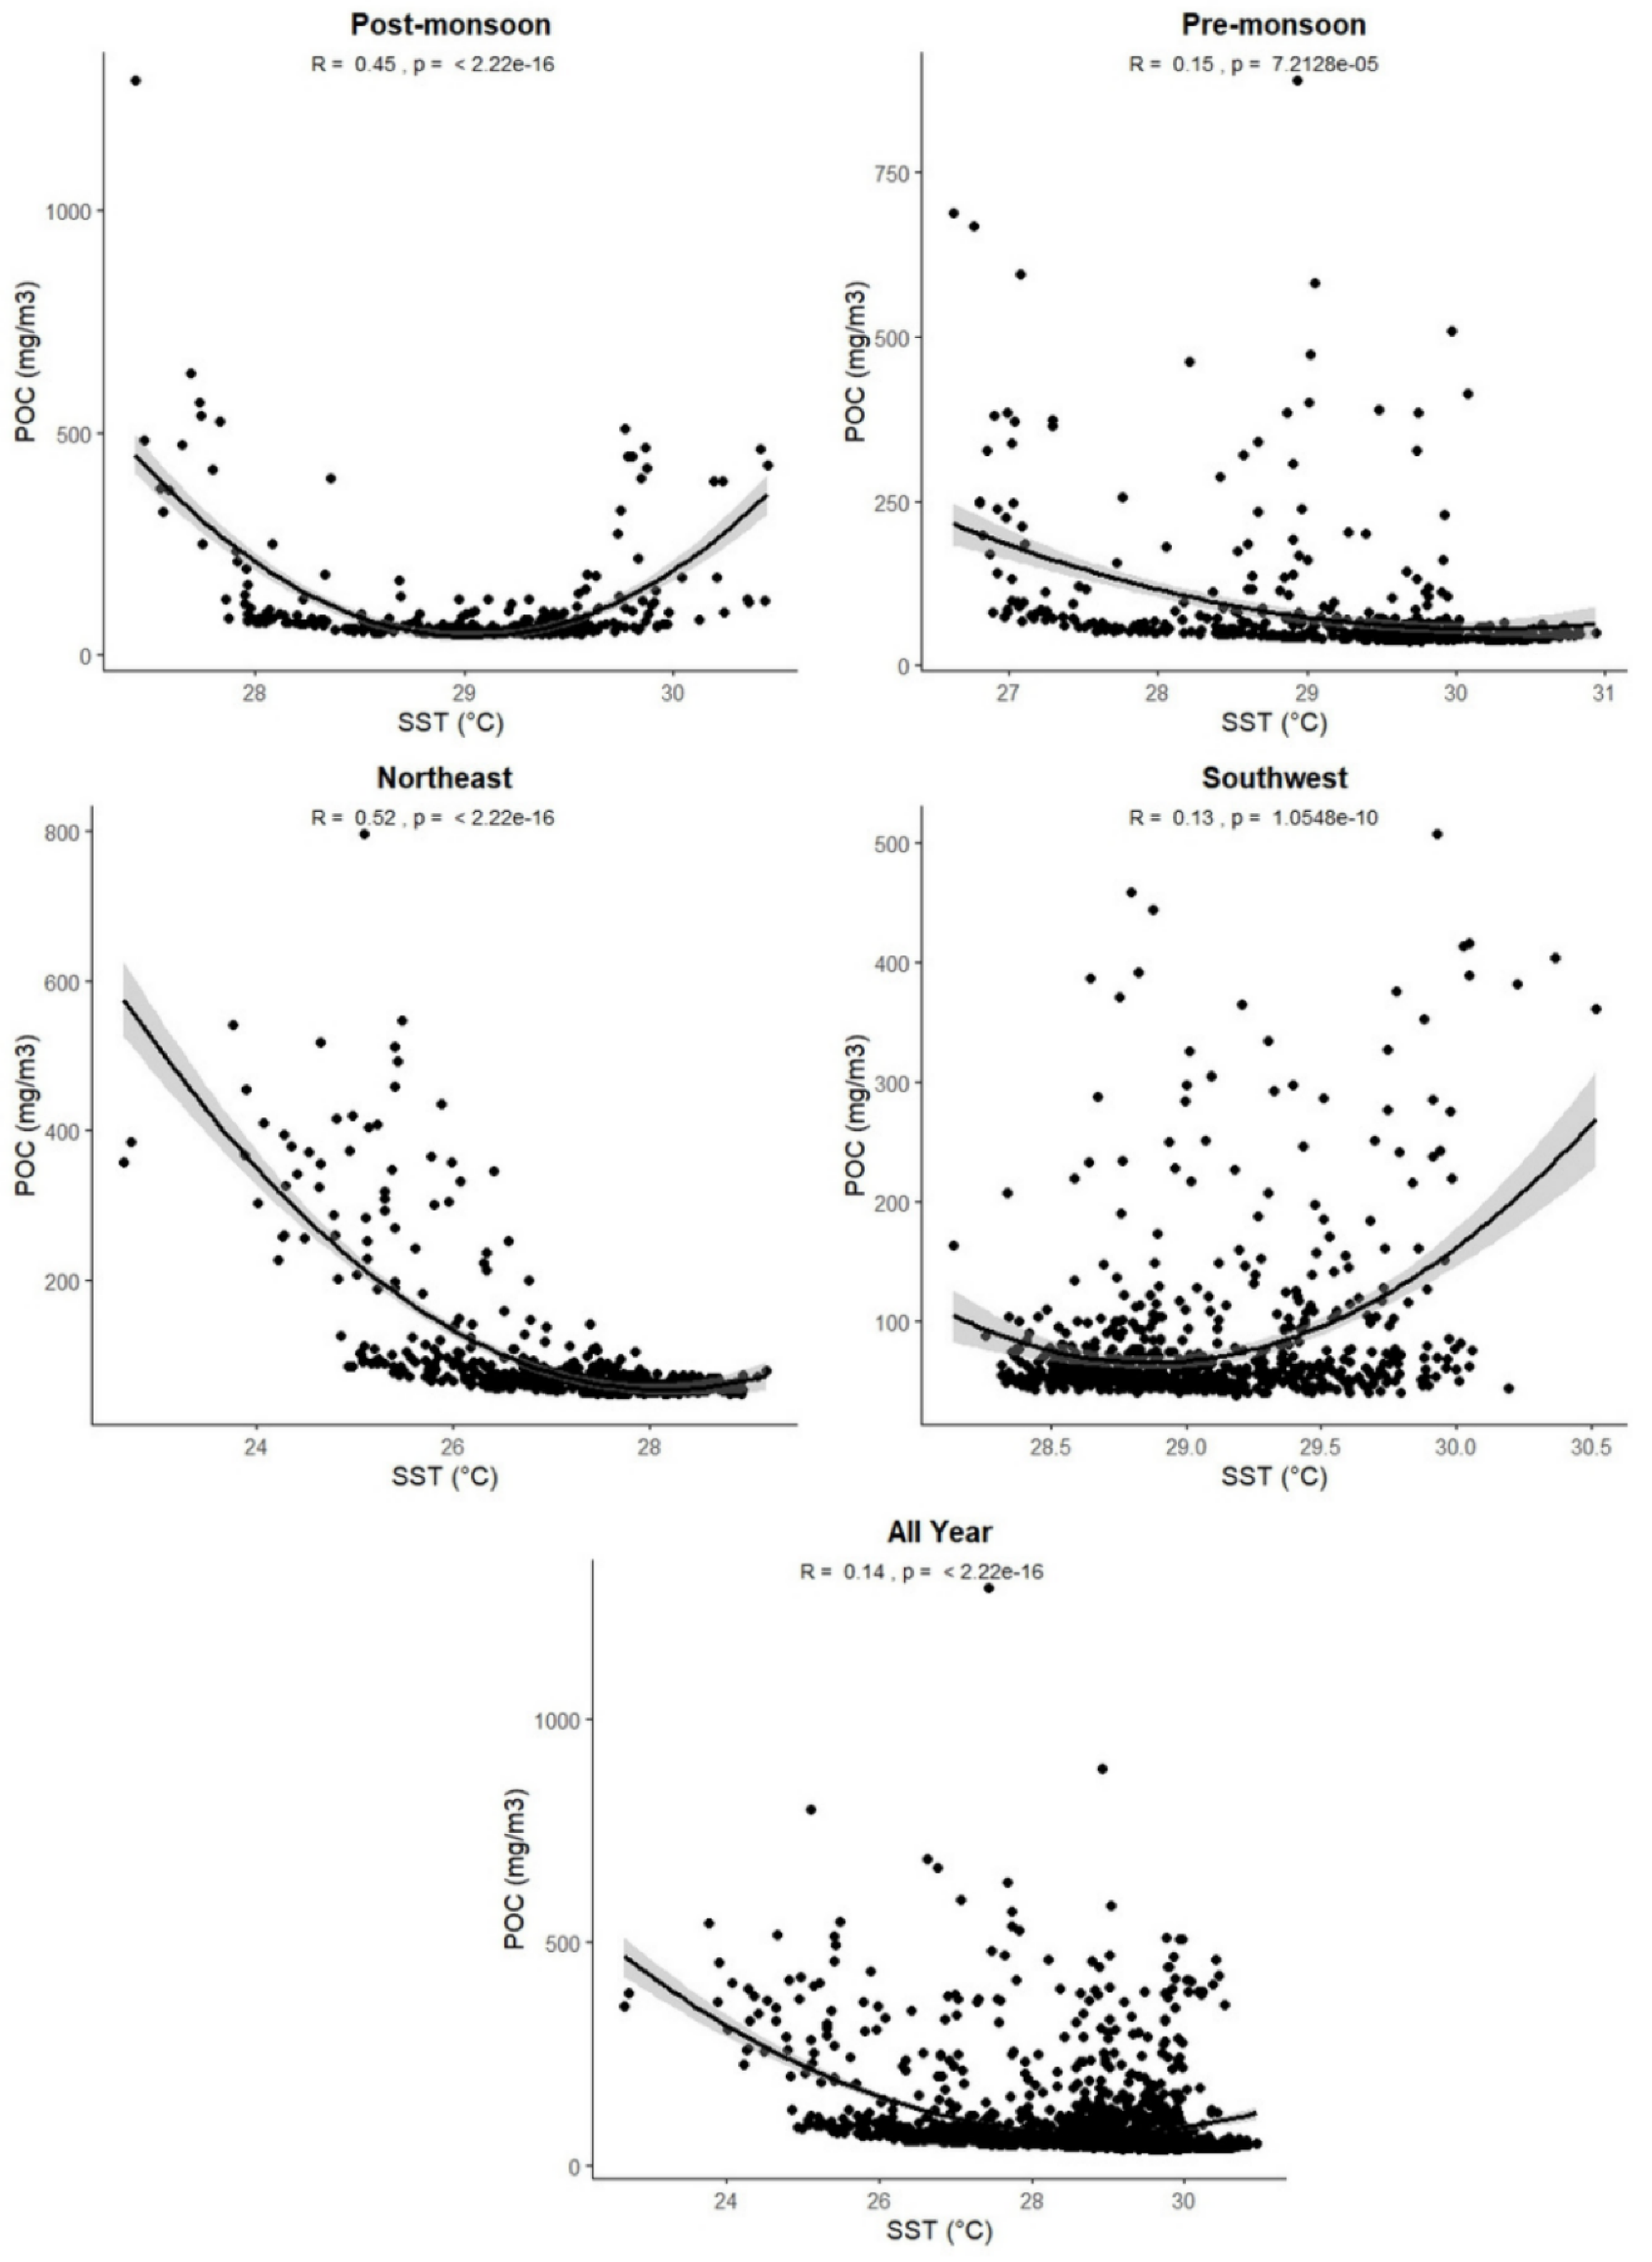
The statistical analysis between POC and SST using a non-linear regression model for different seasons and the overall year data in the Bay of Bengal is shown in (
Table 5). The chosen non-linear regression model is more suitable for capturing the complexities and variations observed in the data, which may not be adequately represented by a linear model. The analysis reveals a significant (p<0.05) but generally weak to moderate relationship between POC and SST across the seasons. The strength of the correlation varies, with the highest R
2 value observed during the Northeast-monsoon (R
2 = 0.52), indicating a moderate relationship, while the lowest was in the Southwest-monsoon (R
2 = 0.13), pointing to weak correlation. The inverse relationship observed suggests that as SST increases, POC concentration tends to decrease, particularly evident in the Northeast-monsoon. This inverse relationship may be attributed to warmer SST, which indicates less vertical mixing, resulting in poor nutritional conditions, reduced phytoplankton productivity, and consequently lower POC concentrations (Yu et al.,2019a). The non-linear approach better reflects the actual dynamics between POC and SST, capturing the non-linear patterns that would be oversimplified by a linear model. This approach aligns with findings by (Yu et al.,2019a) in the North Pacific Ocean, where a similar inverse relationship between POC and SST was identified.
3.4.1. Temporal Variations of POC Concentration and SST in the Bay of Bengal
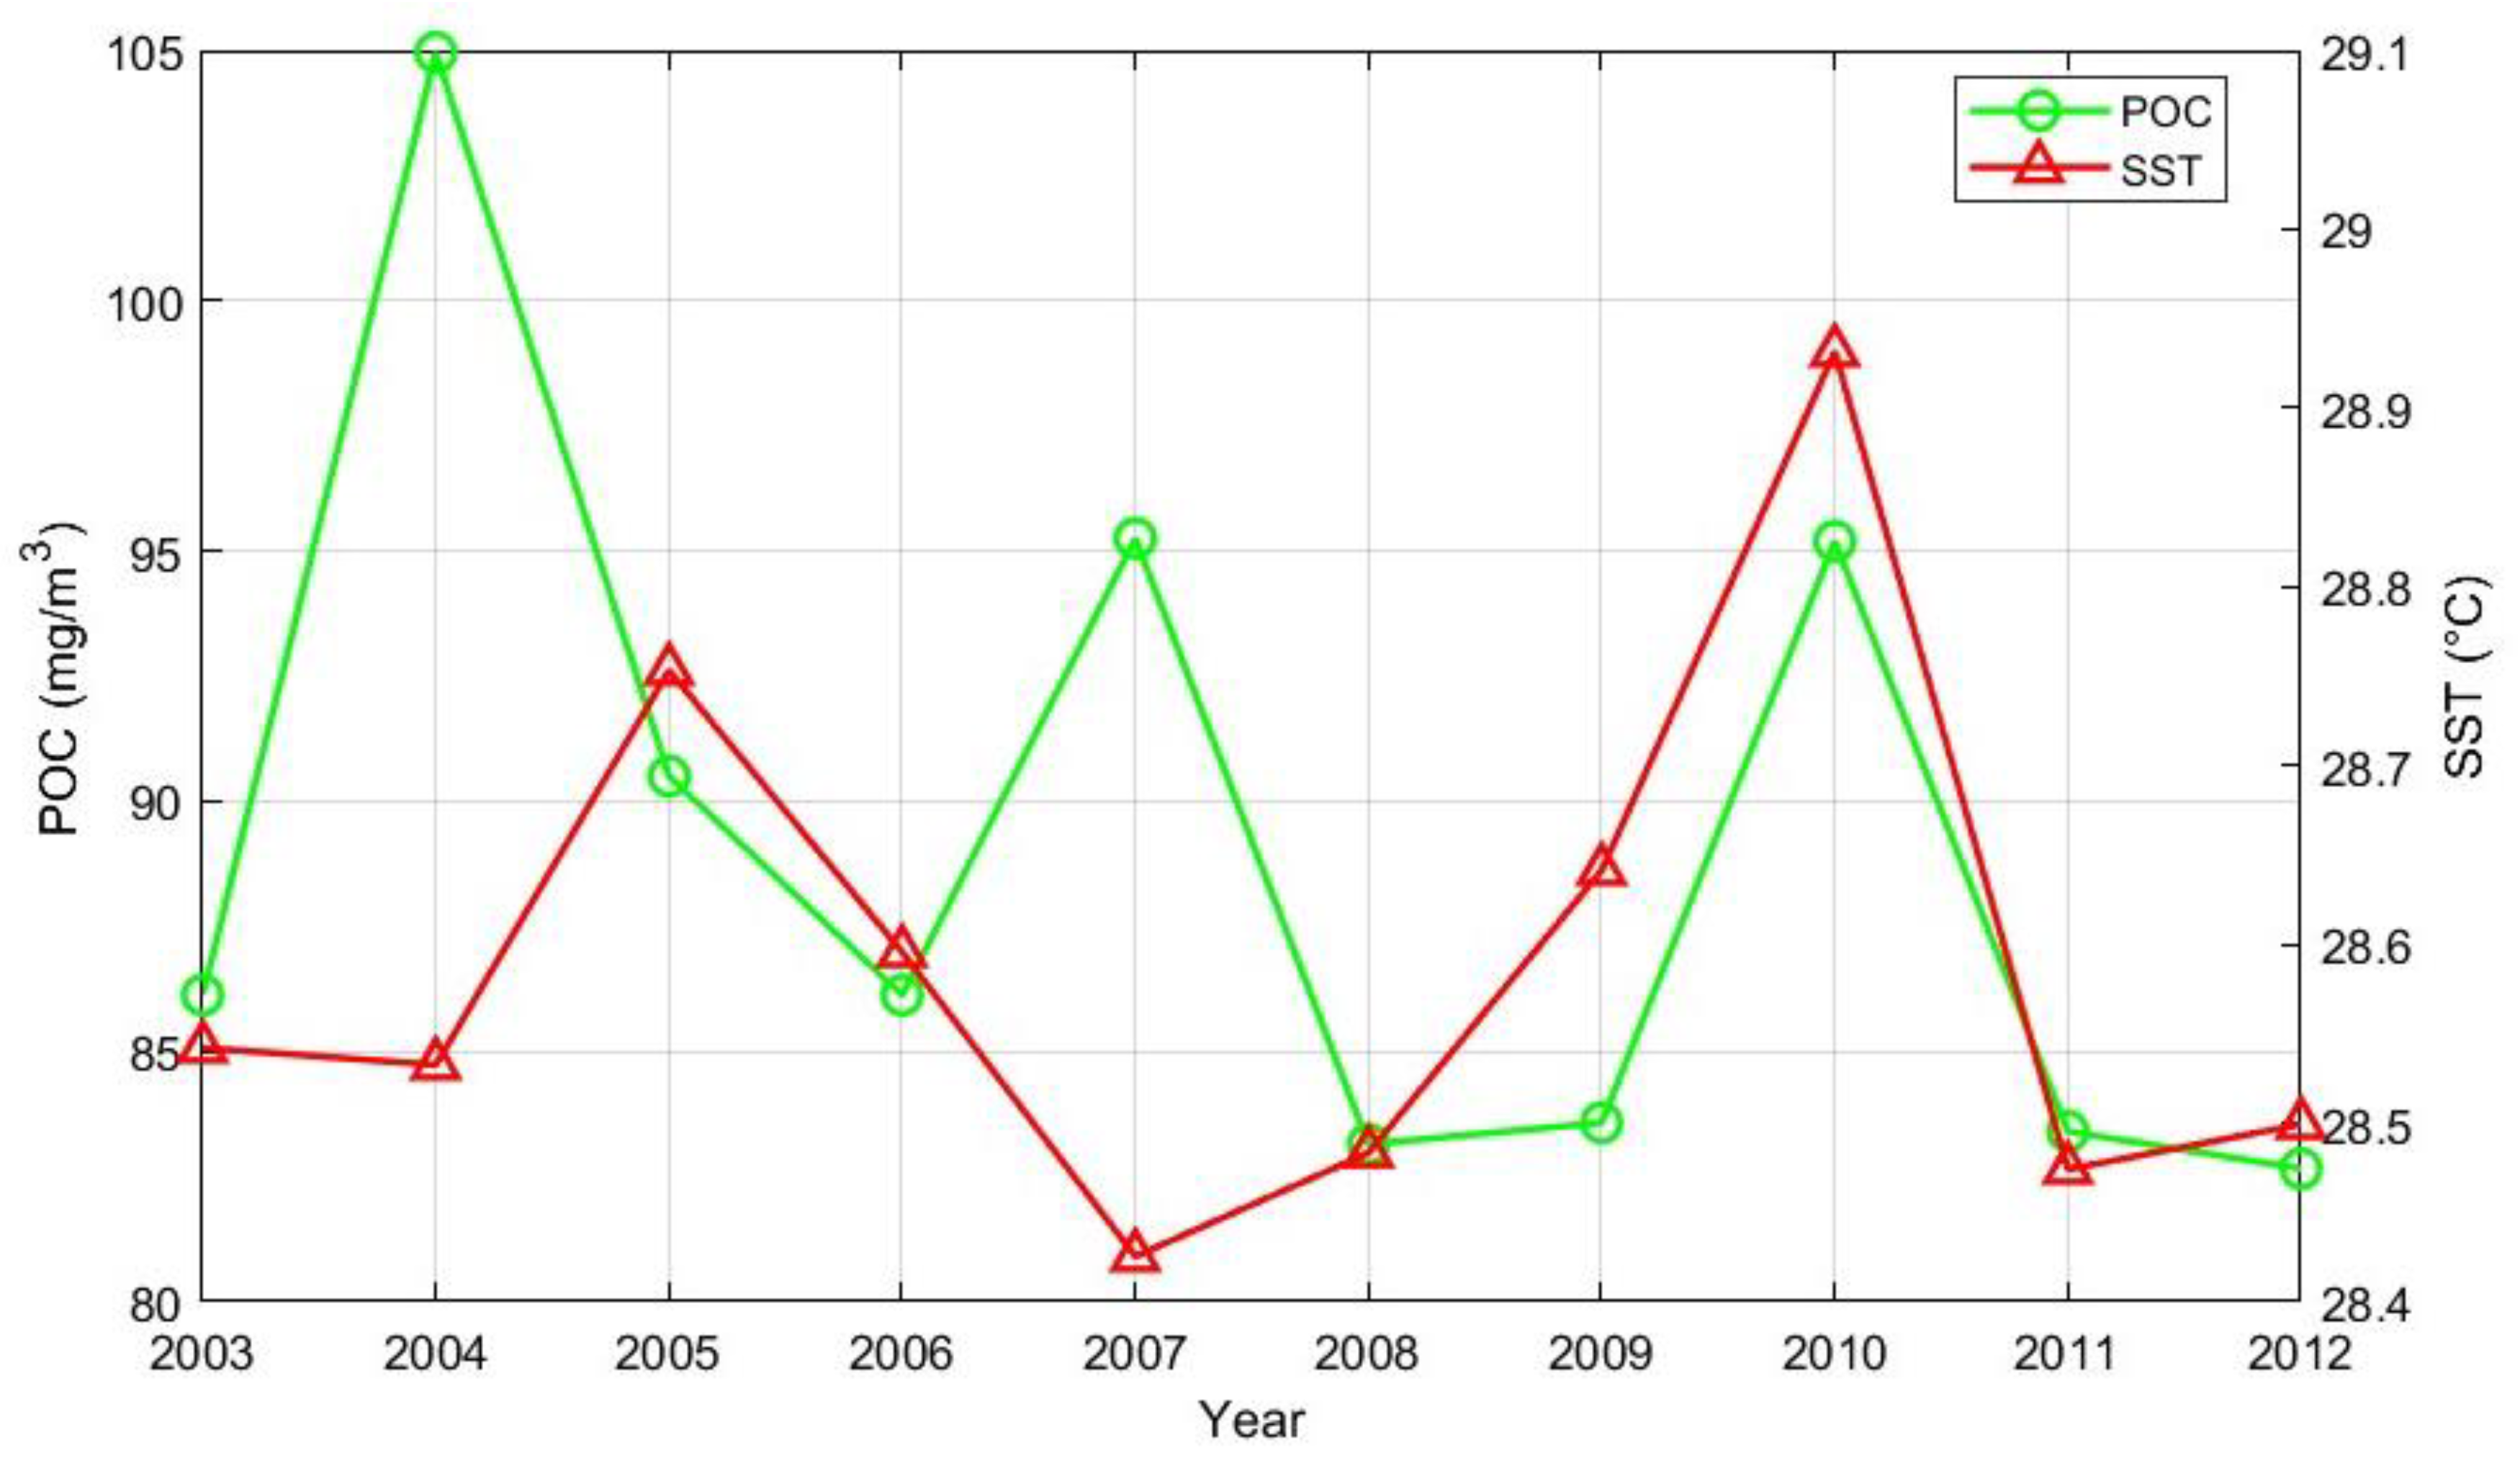
The temporal analysis of POC concentrations and SST in the Bay of Bengal from 2003 to 2012 demonstrates a clear inverse relationship as depicted in the (
Figure 9), where peaks in SST correspond with troughs in POC concentrations, for instance, in 2004 and 2010, SST reached its highest values, while POC concentrations showed significant decreases, forming troughs. This suggests that as SST increases, reduced vertical mixing and nutrient availability limit phytoplankton productivity, leading to lower POC levels (Yu et al.,2019a), Conversely, when SST decreases, as seen in 2007 and 2011, POC concentrations rise, reflecting improved conditions for nutrient mixing and phytoplankton growth. This pattern is most evident during the northeast-monsoon, where the correlation between SST is moderate (R
2=0.52), while it is weaker (R
2=0.13) during the southwest-monsoon, indicating addition influencing factors.
4. Discussion
This study elucidates the seasonal and inter-annual variability of Particulate Organic Carbon (POC) and its intricate relationship with Chlorophyll-a (Chlor_a) and Sea Surface Temperature (SST) in the Bay of Bengal, utilizing remote sensing data. The findings indicate that the ten-year (2003-2012) annual average surface POC concentration fluctuated between 86.48 mgm-3 and 110.93 mgm-3, with an overall mean of (93.74±7.50) mgm-3, and a declining trend of –1.30 mgm-3 year-1. A statistically significant variation in POC was observed across different seasons, with the highest mean concentrations occurring during the post-monsoon (97.40 mgm-3) and northeast-monsoon (97.14 mgm-3) periods, and the lowest during the pre-monsoon (79.36 mgm-3). The study identified an inverse correlation between POC and SST, while a positive correlated was noted between POC and Chlor_a, suggesting that POC is predominantly influenced by biological processes, particularly Chlor_a, followed by SST. The seasonal variability in POC is further attributed to a range of mechanisms, including enhanced light conditions, Ekman pumping, river discharge, cyclonic activity, upwelling, and salinity stratification.
This research provides a foundational baseline for further investigations into the ecological health and dynamics of the Bay of Bengal. It underscores the need for more extensive in-situ data collection to validate and enhance the accuracy of MODISA-derived data. Moreover, exploring the vertical distribution of POC, alongside surface POC concentrations, is imperative for a comprehensive understanding of primary productivity and ocean ecosystem dynamics across the Bay of Bengal, Future studies should prioritize the verification of MODISA data reliability through rigorous in-situ assessments to ensure the robustness of POC concentration measurement in this critical region.
References
- Fingas, M. (2019). Remote Sensing for Marine Management. In Elsevier eBooks (pp. 103–119). [CrossRef]
- Fernandes, L.; Bhosle, N.B.; Matondkar, S.P.; Bhushan, R. Seasonal and spatial distribution of particulate organic matter in the Bay of Bengal. J. Mar. Syst. 2009, 77, 137–147. [Google Scholar] [CrossRef]
- Stramska, M. Particulate organic carbon in the surface waters of the North Atlantic: spatial and temporal variability based on satellite ocean colour. Int. J. Remote. Sens. 2014, 35, 4717–4738. [Google Scholar] [CrossRef]
- Yu, J.; Wang, X.; Fan, H.; Zhang, R.-H. Impacts of Physical and Biological Processes on Spatial and Temporal Variability of Particulate Organic Carbon in the North Pacific Ocean during 2003–2017. Sci. Rep. 2019, 9, 1–15. [Google Scholar] [CrossRef]
- Fan, H.; Wang, X.; Zhang, H.; Yu, Z. Spatial and temporal variations of particulate organic carbon in the Yellow-Bohai Sea over 2002–2016. Sci. Rep. 2018, 8, 7971. [Google Scholar] [CrossRef] [PubMed]
- Panagiotopoulos, C.; Sempéré, R.; Para, J.; Raimbault, P.; Rabouille, C.; Charrière, B. The composition and flux of particulate and dissolved carbohydrates from the Rhone River into the Mediterranean Sea. Biogeosciences 2011, 9, 1827–1844. [Google Scholar] [CrossRef]
- Bhosle, N.B.; Dhople, V.M.; Wagh, A.B. Distribution of particulate organic carbon in the central Arabian Sea.
- Stramska, M. Particulate organic carbon in the global ocean derived from SeaWiFS ocean color. Deep. Sea Res. Part I: Oceanogr. Res. Pap. 2009, 56, 1459–1470. [Google Scholar] [CrossRef]
- Kader, A. , Chowdhury, Z. R., Uddin, M. M., Hoque, E., & Basak, S. C. (2013). Bathymetric study of the Bay of Bengal based on open source satellite and sounding data. International Journal of Geomatics and Geosciences, 4(1), 116–124. https://www.ipublishing.co.in/jggsarticles/volfour/EIJGGS4011.pdf.
- Kumar, S.; Ramesh, R.; Sardesai, S.; Sheshshayee, M.S. High new production in the Bay of Bengal: Possible causes and implications. Geophys. Res. Lett. 2004, 31. [Google Scholar] [CrossRef]
- Sarangi, R.; Devi, K.N. Space-based observation of chlorophyll, sea surface temperature, nitrate, and sea surface height anomaly over the Bay of Bengal and Arabian Sea. Adv. Space Res. 2017, 59, 33–44. [Google Scholar] [CrossRef]
- Stramski, D.; Reynolds, R.A.; Babin, M.; Kaczmarek, S.; Lewis, M.R.; Röttgers, R.; Sciandra, A.; Stramska, M.; Twardowski, M.S.; Franz, B.A.; et al. Relationships between the surface concentration of particulate organic carbon and optical properties in the eastern South Pacific and eastern Atlantic Oceans. Biogeosciences 2008, 5, 171–201. [Google Scholar] [CrossRef]
- O'Reilly, J.E.; Maritorena, S.; Mitchell, B.G.; Siegel, D.A.; Carder, K.L.; Garver, S.A.; Kahru, M.; McClain, C. Ocean color chlorophyll algorithms for SeaWiFS. J. Geophys. Res. Earth Surf. 1998, 103, 24937–24953. [Google Scholar] [CrossRef]
- Walton, C.C.; Pichel, W.G.; Sapper, J.F.; May, D.A. The development and operational application of nonlinear algorithms for the measurement of sea surface temperatures with the NOAA polar-orbiting environmental satellites. J. Geophys. Res. Oceans 1998, 103, 27999–28012. [Google Scholar] [CrossRef]
- Rouf, M.A.; Golder, R.; Sumana, Z.A. Satellite-based observation of particulate organic carbon in the northern Bay of Bengal. Environ. Adv. 2021, 6. [Google Scholar] [CrossRef]
- Kandasamy, P. , Sarangi, R. K., Ayyappan, S., Allimuthu, D., Ramalingam, S., & Durairaj, P. (2019). Influence of sea surface temperature and chlorophyll-a on the distribution of particulate organic carbon in the southwest Bay of Bengal. Journal of Geomatics, 13, 14.
- Stramska, M.; Bialogrodzka, J. Satellite observations of seasonal and regional variability of particulate organic carbon concentration in the Barents Sea. Oceanologia 2016, 58, 249–263. [Google Scholar] [CrossRef]
- Arrigo, K.R.; van Dijken, G.L.; Bushinsky, S. Primary production in the Southern Ocean, 1997–2006. J. Geophys. Res. Oceans 2008, 113. [Google Scholar] [CrossRef]
- Stramska, M.; Cieszyńska, A. Ocean colour estimates of particulate organic carbon reservoirs in the global ocean – revisited. Int. J. Remote. Sens. 2015, 36, 3675–3700. [Google Scholar] [CrossRef]
- Gomes, H.R.; I Goes, J.; Saino, T. Influence of physical processes and freshwater discharge on the seasonality of phytoplankton regime in the Bay of Bengal. Cont. Shelf Res. 2000, 20, 313–330. [Google Scholar] [CrossRef]
- Nagamani, P.V.; Shikhakolli, R.; Chauhan, P. Phytoplankton Variability in the Bay of Bengal During Winter Monsoon Using Oceansat-1 Ocean Colour Monitor Data. J. Indian Soc. Remote. Sens. 2011, 39, 117–126. [Google Scholar] [CrossRef]
- Winogradow, A.; Mackiewicz, A.; Pempkowiak, J. Seasonal changes in particulate organic matter (POM) concentrations and properties measured from deep areas of the Baltic Sea. Oceanologia 2019, 61, 505–521. [Google Scholar] [CrossRef]
- Sherin, C.; Sarma, V.; Rao, G.; Viswanadham, R.; Omand, M.; Murty, V. New to total primary production ratio (f-ratio) in the Bay of Bengal using isotopic composition of suspended particulate organic carbon and nitrogen. Deep. Sea Res. Part I: Oceanogr. Res. Pap. 2018, 139, 43–54. [Google Scholar] [CrossRef]
- Lee, D.; Son, S.; Joo, H.; Kim, K.; Kim, M.J.; Jang, H.K.; Yun, M.S.; Kang, C.-K.; Lee, S.H. Estimation of the Particulate Organic Carbon to Chlorophyll-a Ratio Using MODIS-Aqua in the East/Japan Sea, South Korea. Remote. Sens. 2020, 12, 840. [Google Scholar] [CrossRef]
- Roy, S.; Sathyendranath, S.; Platt, T. Size-partitioned phytoplankton carbon and carbon-to-chlorophyll ratio from ocean colour by an absorption-based bio-optical algorithm. Remote. Sens. Environ. 2017, 194, 177–189. [Google Scholar] [CrossRef]
- Sarangi, R. , Nayak, & Panigraphy, R. (2008). Monthly variability of chlorophyll and associated physical parameters in the southwest Bay of Bengal water using remote sensing data. http://moeseprints.incois.gov.in/226/1/Monthly%20variability%20of%20chlorophyll-2008.pdf.
|
Disclaimer/Publisher’s Note: The statements, opinions and data contained in all publications are solely those of the individual author(s) and contributor(s) and not of MDPI and/or the editor(s). MDPI and/or the editor(s) disclaim responsibility for any injury to people or property resulting from any ideas, methods, instructions or products referred to in the content. |
© 2024 by the authors. Licensee MDPI, Basel, Switzerland. This article is an open access article distributed under the terms and conditions of the Creative Commons Attribution (CC BY) license (http://creativecommons.org/licenses/by/4.0/).
