1. Introduction
Coupling faults exist widely in mechanical equipment. which are formed by coupling of multiple types of base faults. Coupling faults are not linear superposition of base faults, and complex fault characteristics show emergence in the coupling process [
1]. Therefore, simple linear decoupling cannot achieve accurate diagnosis of coupling faults, and a more accurate nonlinear model needs to be established to describe the fault coupling process [
2]. In this paper, two kinds of data-driven methods are used to obtain the fault characteristics of multi-fault coupling, reveal the fault coupling process, and classify the coupling faults based on the obtained coupling fault characteristics.
The fault characteristics of rotating machinery can be obtained by spectral analysis [
3]. Scholars mostly used traditional frequency domain feature extraction methods [
4]. Ma et al. [
5] proposed adaptive demodulation analysis to extract bearing early fault features. Jiang et al. [
6] used short-time Fourier transform to obtain bearing amplitude, and used adaptive weights to extract characteristic frequency weighted. Zhu et al. [
7] determined the hyperparameters of the SAM model by taking the maximum harmonic significance as an index, and divided the frequency band and reconstructed the signal to suppress the noise component in the fault characteristics. Frequency domain features analyze all frequency bands in the spectrum, and the energy of fault features is not concentrated. A large number of scholars use time-frequency domain feature extraction methods to extract fault features of energy-concentrated frequency bands [
8]. Tang et al. [
9] use time-frequency domain convolutional neural network to extract fault features of multiple energy concentrations, and introduce attention module to extract representative features weighted. Jia et al. [
10] proposed Gramian based noise reduction strategy for noise suppression and feature extraction. The above method extracts the features of a single fault from the spectrum, but there is no effective solution to extract the features of the coupled fault. Based on the prior feature information of the fault, the method of extracting feature is used to estimate the fault classification, which belongs to the category of Bayesian school.
The data-driven fault feature generation method can avoid the difficulty of spectrum extraction caused by the lack of working condition information [
11]. Zhang et al. [
12] generated fault features adaptively through convolutional neural networks and used SVM classifiers to classify fault types. Yang et al. [
13] reconstructed fault features through IMFs extracted from VMD and used SVM for fault classification in view of the unbalanced and strong noise characteristics of bearing signals. Huo et al. [
14] carry out adaptive extraction of time-frequency domain features, and combine harmonic detection with noise signals to continue to reconstruct the features. Zhao et al. [
15] reduce the dimensionality of features by means of depth-separable convolutional blocks, and use the global feature awareness module to perform adaptive weighting processing similar to attention mechanism for the feature signal channels to obtain fault features. Yang et al. [
16] reconstructed the coupling fault features through the autoencoder to achieve feature dimension reduction and non-equilibrium data strengthening. Most of the above generative methods reconstruct the original data, but the reconstructed data lacks interpretability. The generative feature acquisition method reconstructs the critical fault information from the existing fault information and estimates the overall probability by observing a large number of samples, which belongs to the frequency school.
Both extraction and generative methods obtain the fault characteristics of bearing independent faults [
17]. For complex coupling faults widely existing in bearings, non-Euclidean data-oriented fault diagnosis methods should be used [
18,
19]. The graph neural network constructs the topological structure of the data through the nodes and the edges connecting the nodes, which can realize the correlation description of non-Euclidean data. Traditional graph neural network describes the relationship between pairs of nodes [
20]. Some scholars use graph neural network to extract fault features and perform fault diagnosis. Li et al. [
21] established GCN with multiple receptive fields to conduct adaptive correlation analysis on vibration data after FFT, and took data with different receptive fields as fault characteristics. Wang et al. [
22] added dynamic vertices to the graph neural network, and realized coupling fault diagnosis by establishing a pair relationship topology between faults and dynamic vertices.
It is difficult for graph neural networks to achieve high-level expression of relationships between objects [
23]. To solve this problem, Feng et al. [
24] proposed a hypergraph neural network method. Bai et al. [
25] introduced convolution and attention mechanisms into hypergraph neural networks, further improving the ability of representation learning in hypergraph networks. At present, hypergraph neural network is mainly used in recommendation system and multi-modal data feature extraction, and has been widely used in image processing. Shi et al. [
26] built unlabeled data into hypergraphs, mined higher-order information of the data, and combined the autoencoder to realize representation learning and fault classification. In this method, the hypergraph structure is taken as a layer of autoencoder, and the fault features are generated from the data-driven perspective, which is lack of interpretability. Su et al. [
27] extracted the higher-order relationship between the same type of faults and different types of faults through the hypergraph structure. The above methods are applied to independent fault diagnosis. In the field of coupled fault diagnosis, the high order relation representation ability of hypergraph neural network meets the requirement of complex coupled fault feature acquisition. In this paper, two fault diagnosis architectures based on hypergraph neural network are proposed, the coupled fault diagnosis architecture based on feature generation and the coupled fault diagnosis architecture based on feature extraction, and the method is verified by coupling fault injection experimental data.
The main insights and contributions of this study are summarized as follows:
- (a)
The rotary mechanical coupling fault injection test is designed. The fault injection and data acquisition of 8 kinds of independent faults and coupled faults are realized.
- (b)
A coupled fault diagnosis architecture based on feature extraction is proposed. By applying hypergraph theory to GAN model, the hypergraph generative adversarial network (HGGAN) is established, vibration data generation and coupling fault diagnosis are realized.
- (c)
A coupled fault diagnosis architecture based on feature generation is proposed. The coupling fault characteristics are extracted by multi-head inner product hypergraph attention network (IPHGAT), and the coupling fault diagnosis and analysis are realized.
The rest of this paper is organized as follows.
Section 2 introduces the preliminary knowledge including the graph attention network, the hypergraph attention network and the generative adversarial network.
Section 3 introduces two fault diagnosis frameworks based on hypergraph attention network. The coupled fault injection experiment and data preprocessing methods are introduced in
Section 4. In
Section 5, two frameworks of coupled fault diagnosis are conducted. Finally, conclusions are drawn in
Section 6.
3. Algorithm Flow
Coupling faults are formed by coupling of multiple types of base faults [
31], and the base faults interact with each other. Therefore, the fault characteristics of coupling faults are not simple linear superposition of base faults, but nonlinear complex coupling. In this paper, the vibration characteristics of coupled faults are not decomposed from the complex physical mechanism, but the advantages of hypergraph neural network in processing higher-order relationships are used to model the coupling faults.
3.1. Coupling Fault Diagnosis Based on Feature Generation
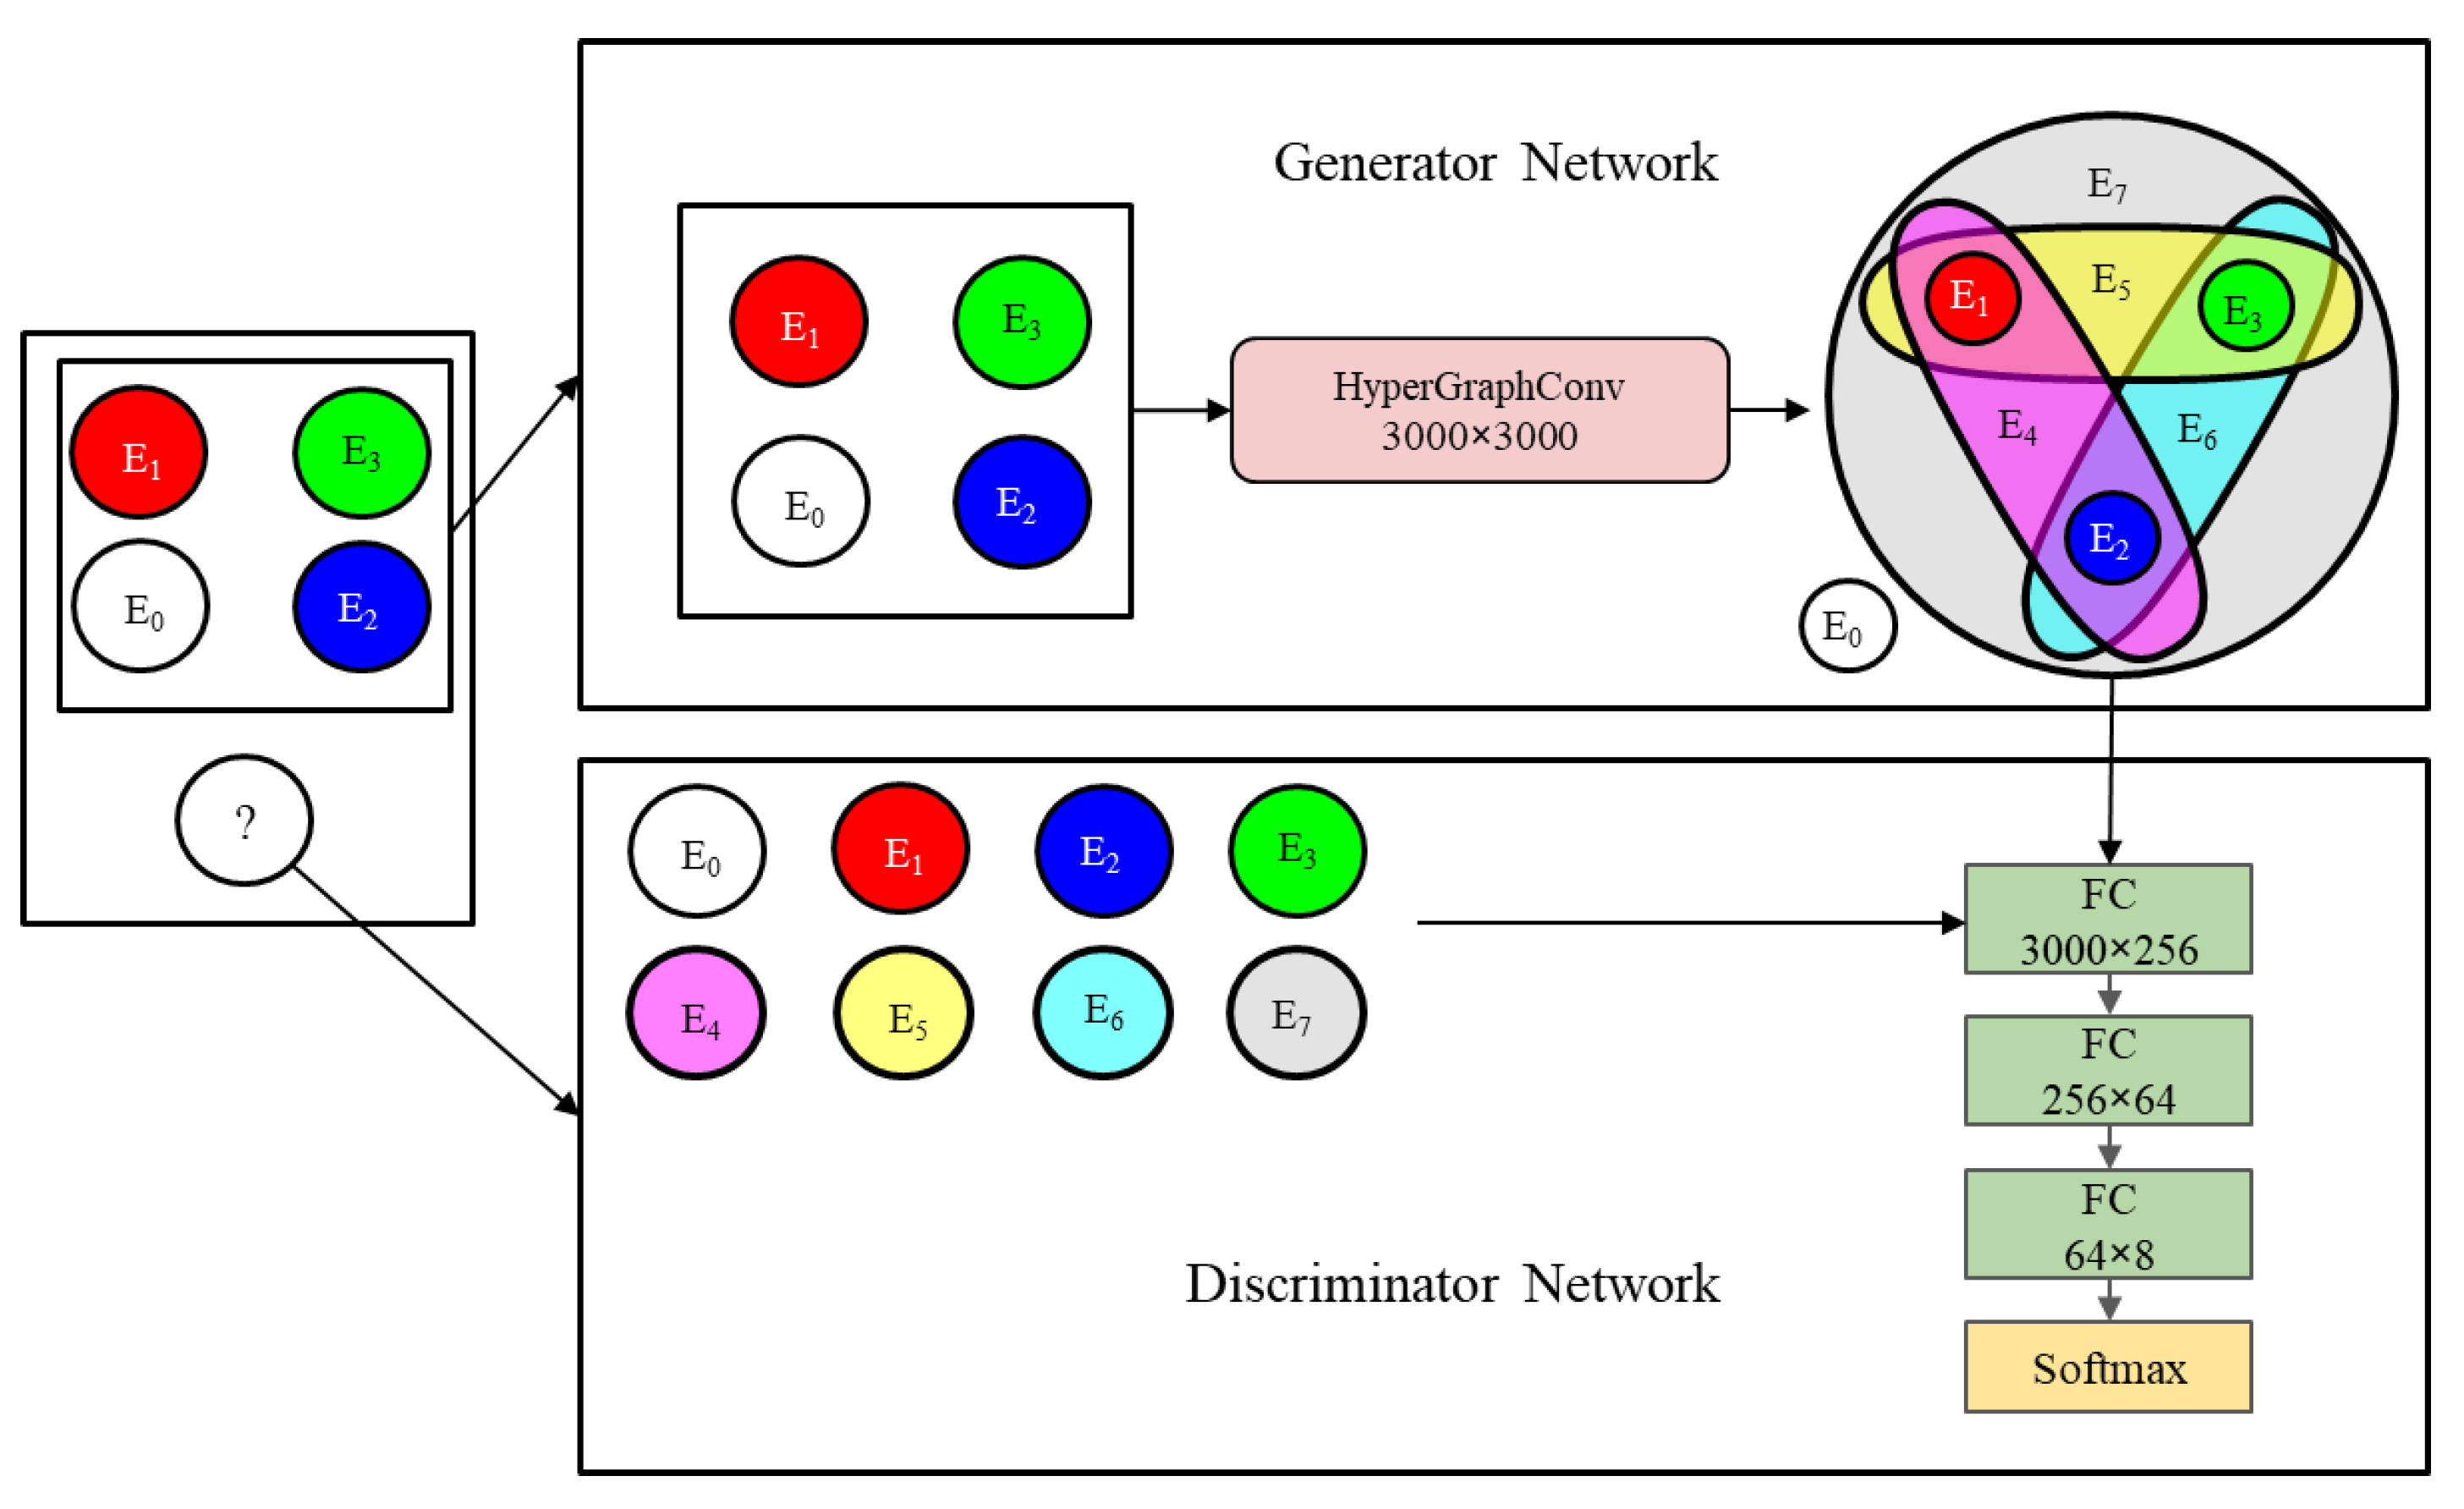
From the perspective of holism, the coupling faults of mechanical equipment are composed of many kinds of faults, which show unified fault characteristics. Assuming that the fault signals of coupled faults are generated by implicit nonlinear coupling between the fault signals of the base faults, this paper uses hypergraph neural network to model the nonlinear generation process and form the HGGAN coupled fault diagnosis architecture.
In this model, the graph nodes are composed of base faults, i.e., . Each fault including base faults and coupling faults constitute the hyperedge , and , which is reduced to equality if and only if all nodes are base faults.
Based on the ability of generative adversarial network to generate probability distribution of data, a coupled fault diagnosis architecture based on feature generation is designed in this paper. The generator uses hypergraph neural network and the discriminator uses multi-layer perceptron network. The algorithm flow is shown in
Figure 1:
In the HGGAN model proposed in this paper, the generator’s loss function is rewritten:
where
is the total number of samples. Compared with traditional GAN, the input of the generator changes from random vector
to the fault feature
of the base fault in the graph data. Both true samples and false samples come from the same graph data sample, so the number of true samples and false samples is the same.
Where is the total number of samples. Compared with traditional GAN, the input of the generator changes from random vector to the fault feature of the base fault in graph data . Both true samples and false samples come from the same graph data sample, so the number of true samples and false samples is the same.
The loss function of the discriminator is rewritten as follows:
The rewritten discriminator loss function is still composed of two parts. In the first part, the input
of the discriminator is the dynamic vertex in the graph data, that is, the fault feature of the coupling fault to be diagnosed, and its label
is the fault type corresponding to the coupling fault
. In the second part, the input of the discriminator is the fault characteristics of all the faults involved in this paper generated by the generator based on the base faults, which improves the stability of the model compared with random data
[
32].
The HGGAN network established in this paper generates coupling fault features from the perspective of data generation. Hypergraph convolution network is used to select the generator, which avoids the uncertainty caused by random vectors in traditional GAN, provides interpretability for the network structure, and uses a data-driven approach to model the coupling fault mechanism.
3.2. Coupling Fault Diagnosis Based on Feature Extraction
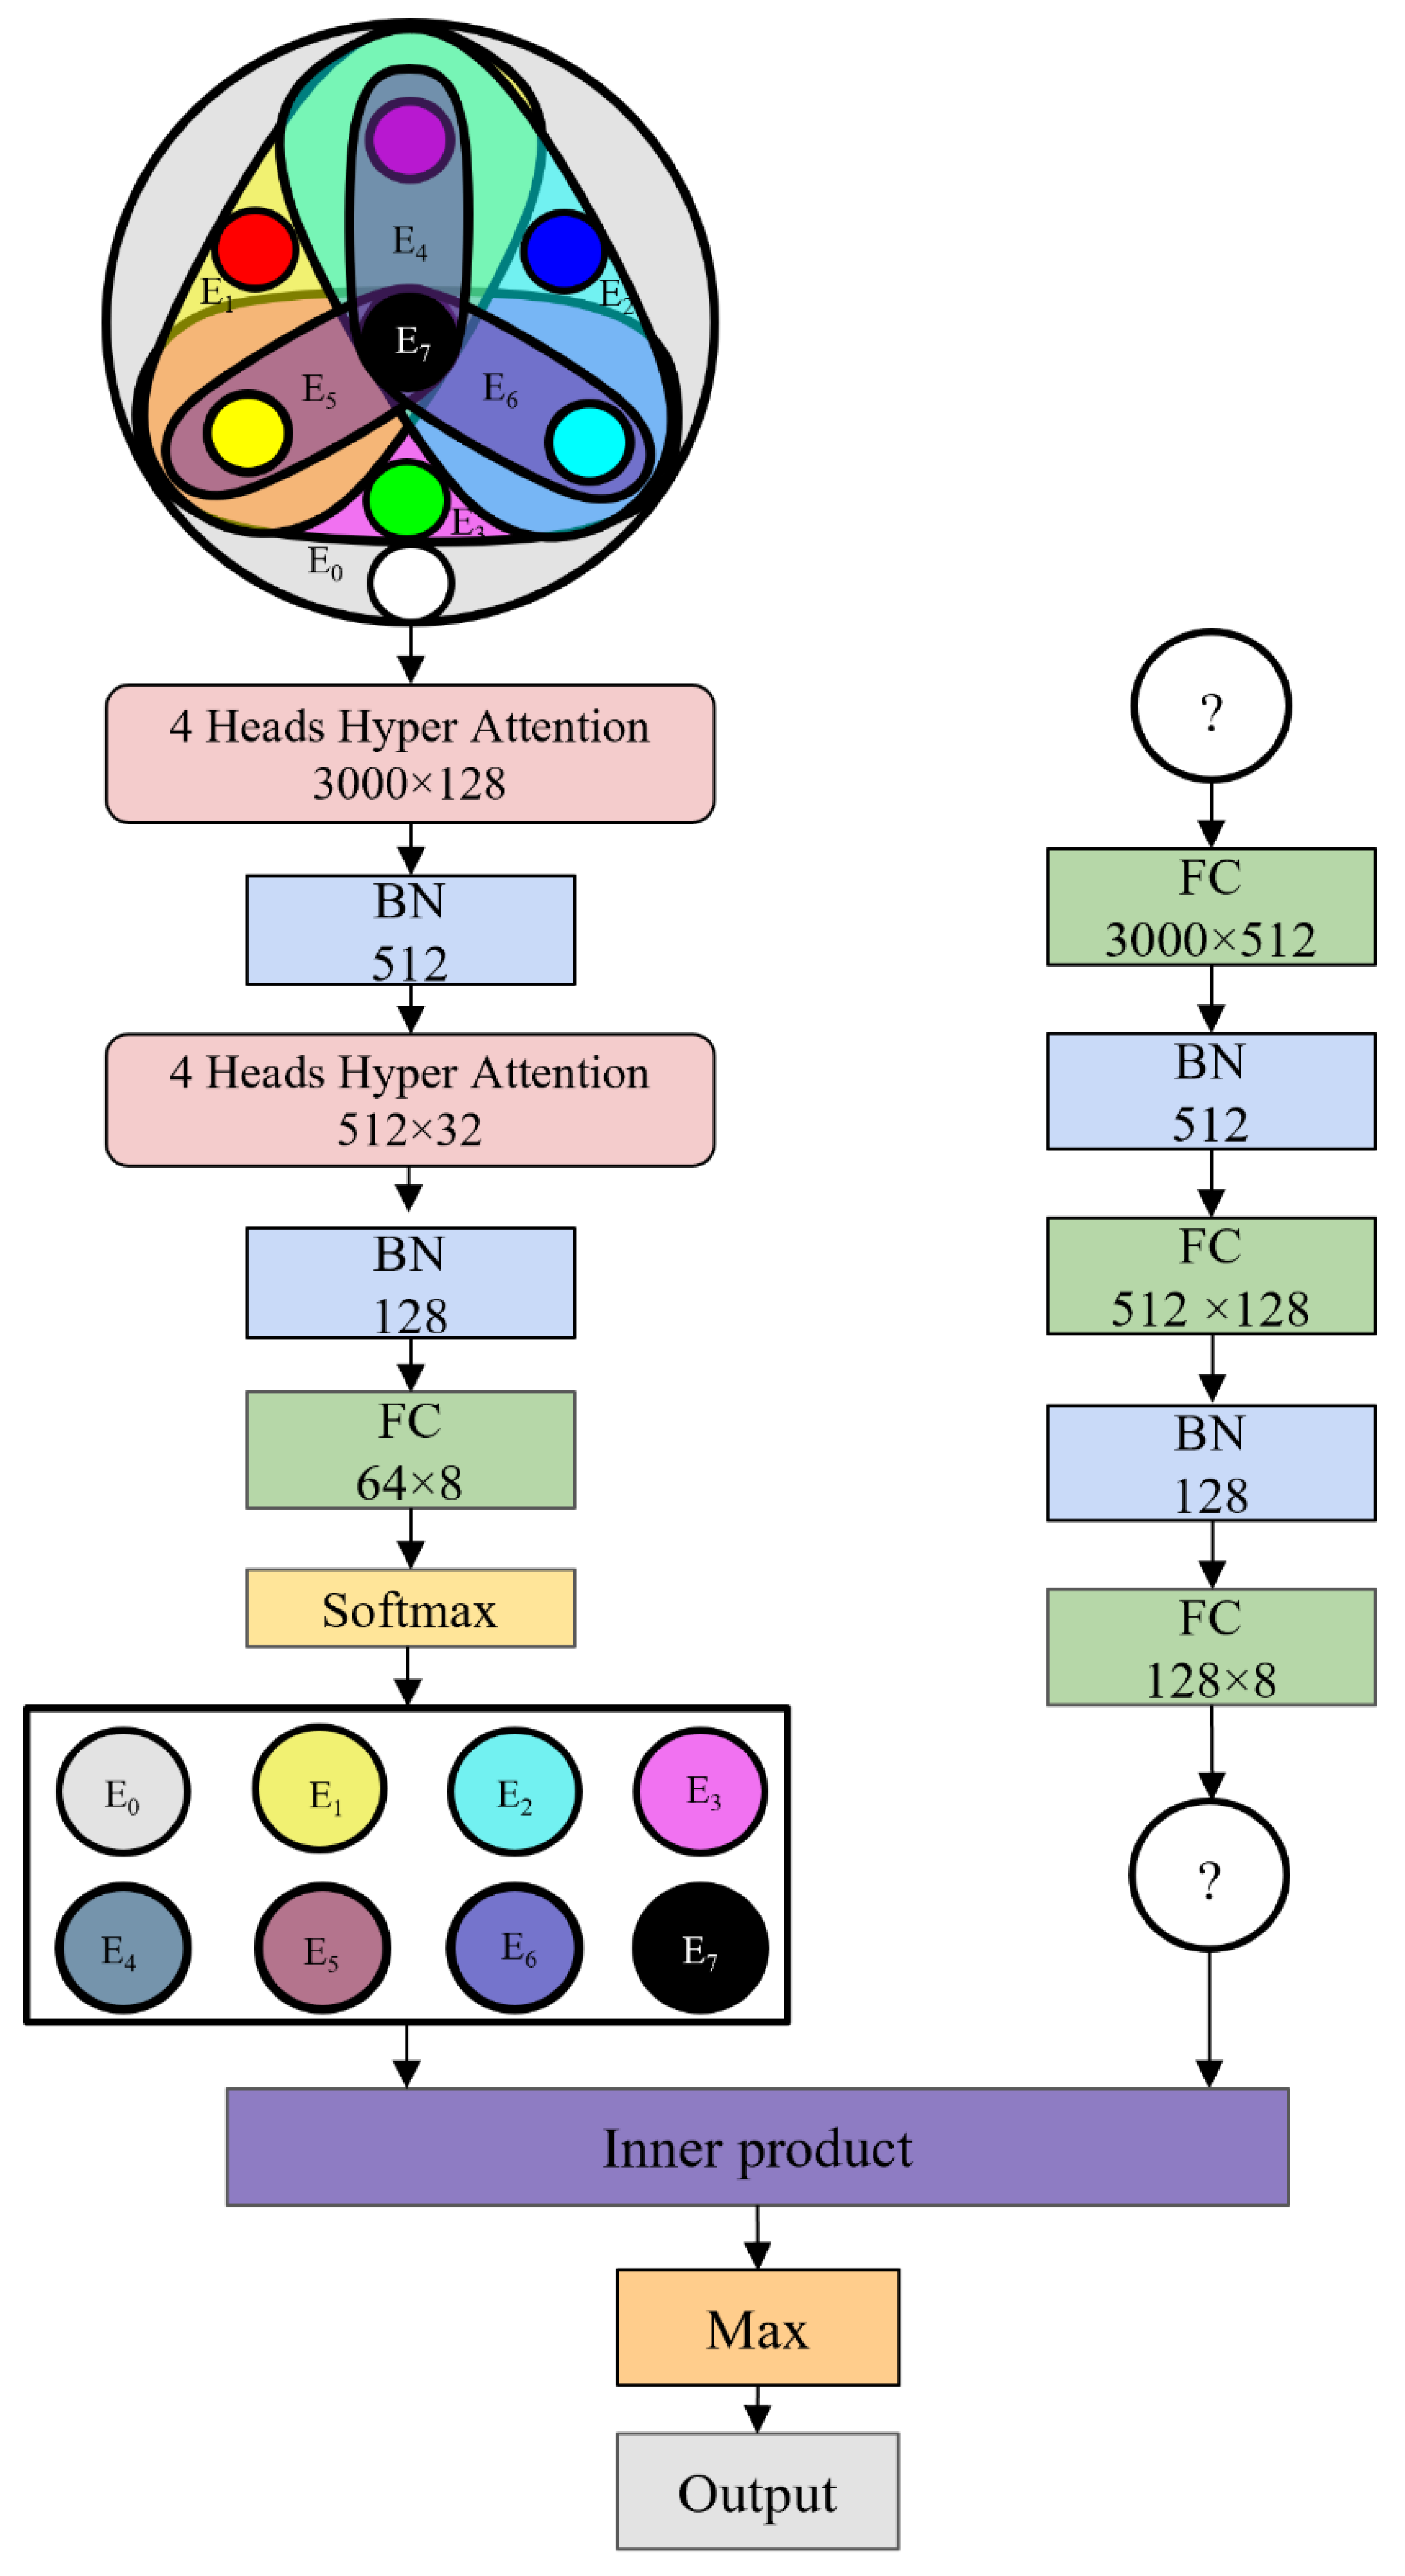
From the perspective of reductionism, coupling faults of mechanical equipment are composed of multiple base faults, and the signals of coupling faults can be decomposed into those belonging to the base faults. In this framework, a coupling fault diagnosis model based on IPHGAT is established. All the fault modes, including base fault and coupling fault, are taken as graph node , hyperedge is the fault characteristics of all fault modes after aggregation, and . Therefore, this paper applies the attention mechanism to further analyze and process the fault information.
The correlation between each base fault and each type of fault is obtained through the attention mechanism by feeding it into the network as node data and hyperedge values. In the multi-head attention mechanism, the number of heads is defined as the number of independent failures, and the network structure is shown in
Figure 2.
Step1: Input the constructed hypergraph data and label into the network, where is the data feature dimension, and includes base fault node data and the fault to be predicted located at a dynamic vertex. The corresponding labels are , . The passes through the first layer of attention hypergraph neural network, generates features for each hyperedge, splice features of each hyperedge into a whole as the features of the hypergraph and perform feature standardization to obtain .
Step2: Input into the second layer of attention hypergraph neural network and standardize it to obtain , then input into the fully connected network and Softmax layer to obtain the fault feature corresponding to each hyperedge. Calculate the cross entropy of and as the loss function .
Step3: Input into the three-layer MLP to obtain the fault feature of the node to be predicted. Calculate the cross entropy of and as a loss function .
Step4: Calculate the inner product between the vector and corresponding to each hyperedge as , take the label of the hyperedge corresponding to the vector with the largest inner product value, and obtain the accuracy rate of the model by judging whether and are equal.
The loss function of the model consists of two parts, where and . Through the process of model training, the value of and corresponding to the corresponding fault mode’s hyperedge vector tends to increase, thus driving the inner product of the corresponding fault mode to increase.
4. Data Acquisition and Preprocessing
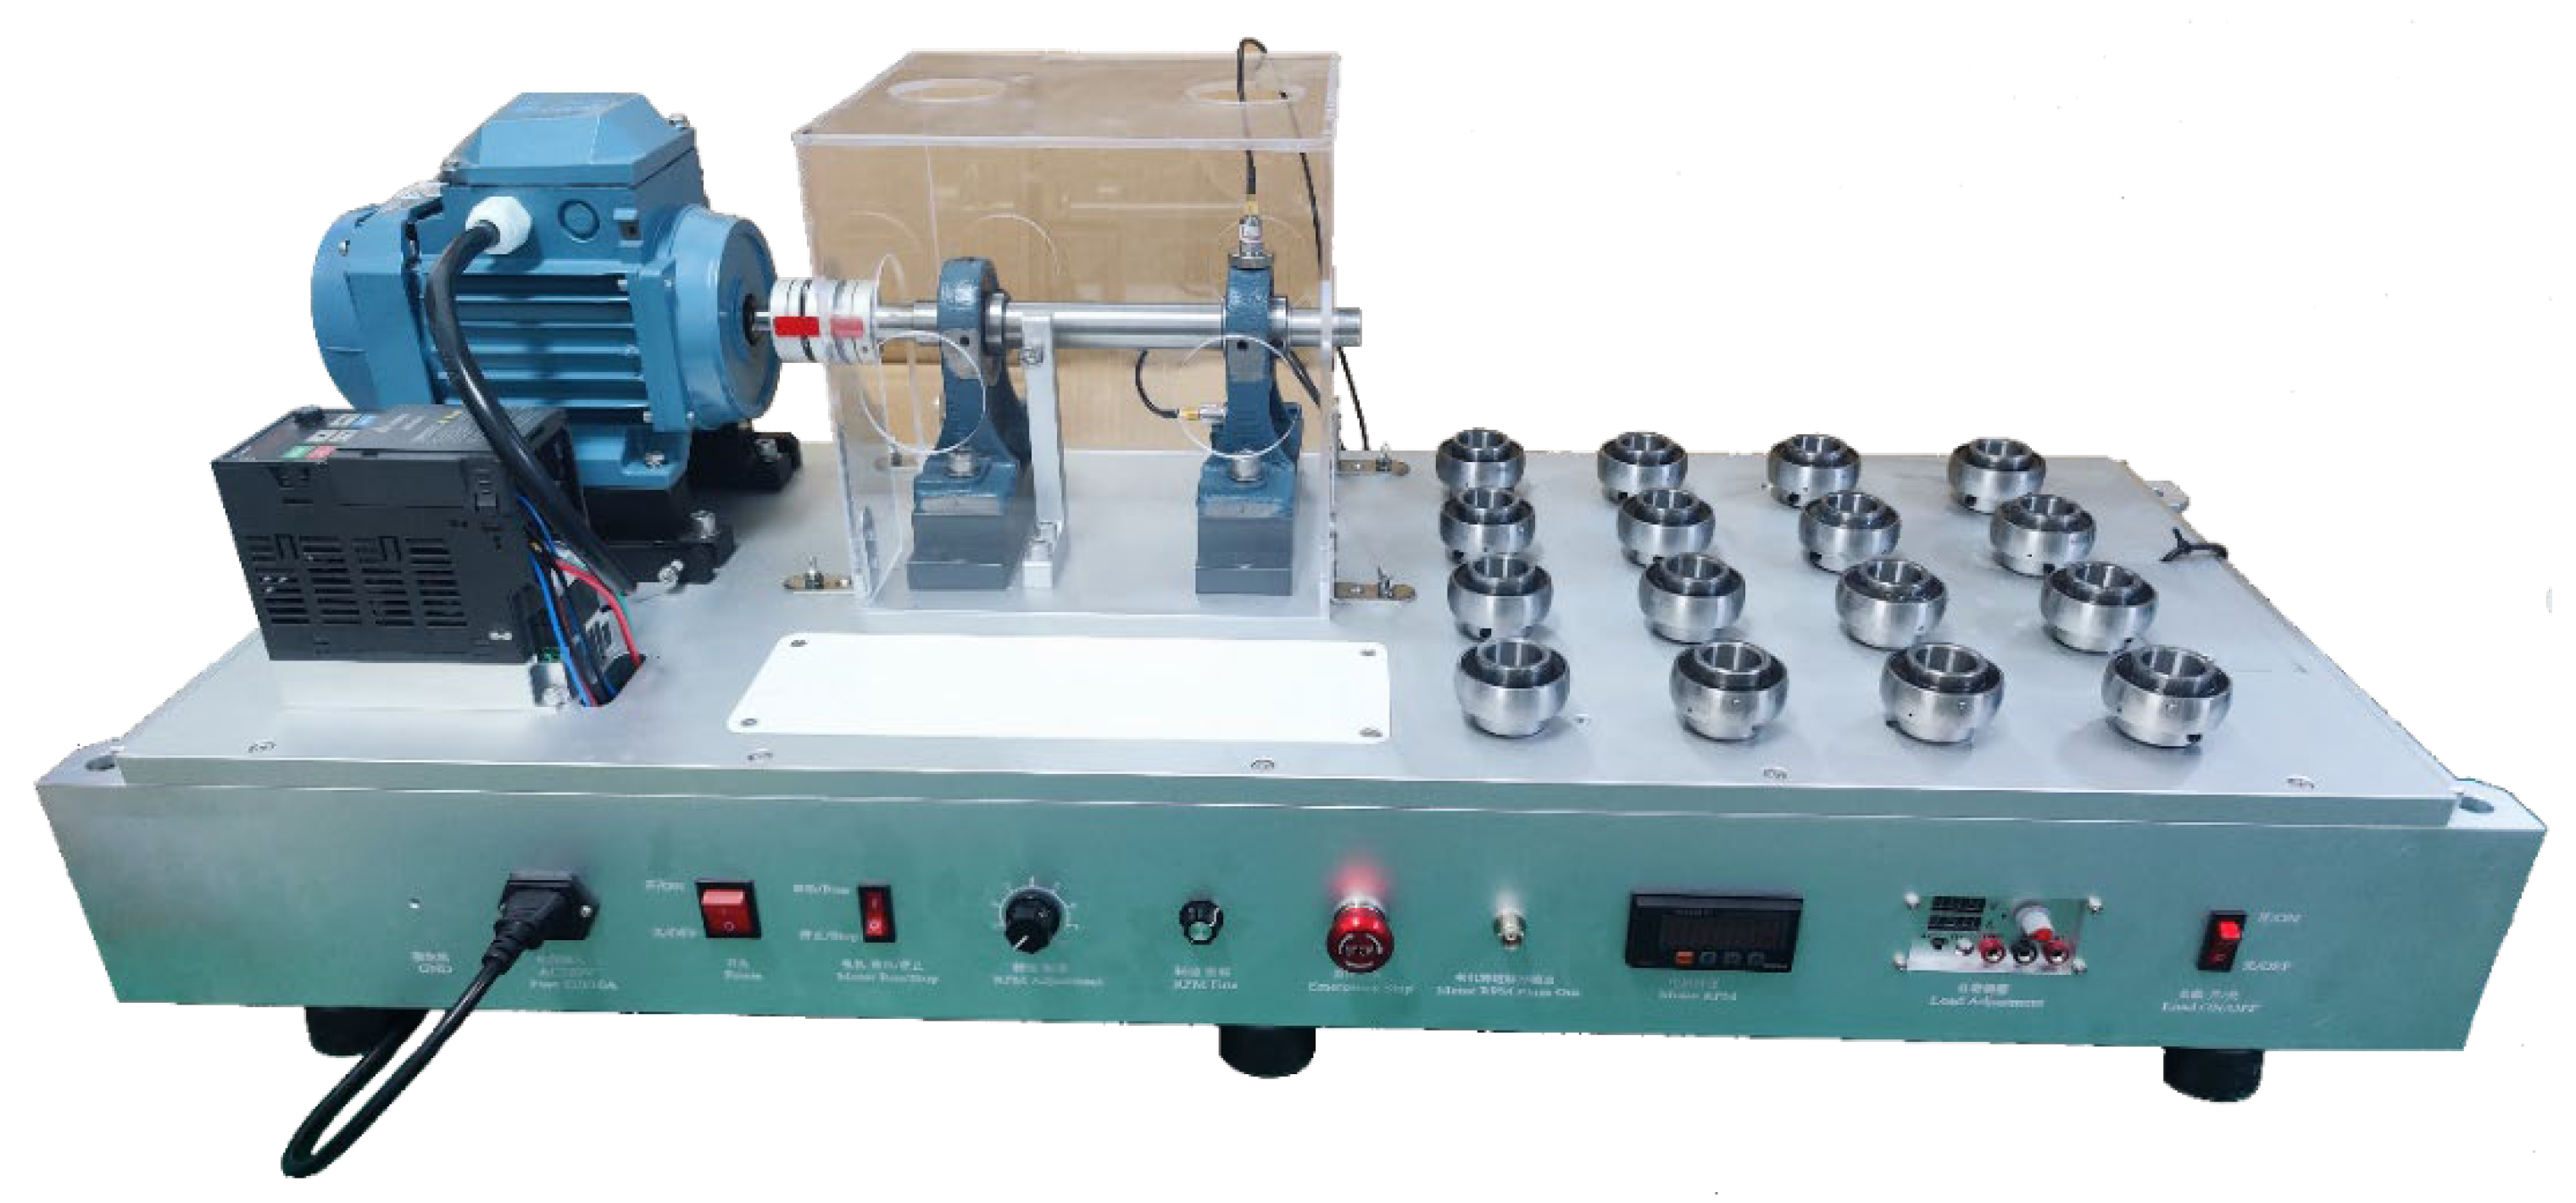
In this paper, the UCPH205 bearing is selected for fault injection experiment. The test bench is shown in
Figure 3. The test bench supports real-time monitoring of three-axis vibration signals and can realize stepless adjustment of speed. Fault injection was carried out for 8 types of faults. The test included 1 normal bearing, 4 outer race fault bearings, 4 inner race fault bearings, 4 ball faulty bearings, 1 outer race + inner race fault bearing, 1 outer race + ball faulty bearing, 1 inner race + ball fault bearing, 1 outer race + inner race + ball fault bearing, and 1 outer race + inner race + ball fault bearing. The fault injection experiment was carried out at 2400rpm for each bearing. In this paper, the sample rate of 20kHz was used to collect the experimental data, and the fault size of the outer race, the inner race and the ball was 0.3mm.
Each bearing runs for 60 seconds at different speeds, and the data for each second is taken as a sample, containing a total of 1020 samples. In this paper, the X-axis vibration signal is selected for fault diagnosis and analysis. Firstly, Fourier transform is performed on the data to obtain the spectrum of the vibration data. Because the rotation speed of the outer race, inner race and ball is different, different faults produce different spectrum characteristics in the bearing rotation process. The fault spectrum of the base fault is shown in
Figure 5.
Among them, the red dashed line is the fundamental frequency and its frequency double of the fault characteristic frequency value calculated theoretically based on the bearing size, in which the fundamental frequency of the outer race fault is 142.93Hz, the fundamental frequency of the inner race fault is 217.07Hz, and the fundamental frequency of the ball fault is 186.27Hz. It can be seen from the figure that the fault frequency of the bearing injected fault has a high consistency with its theoretical value.
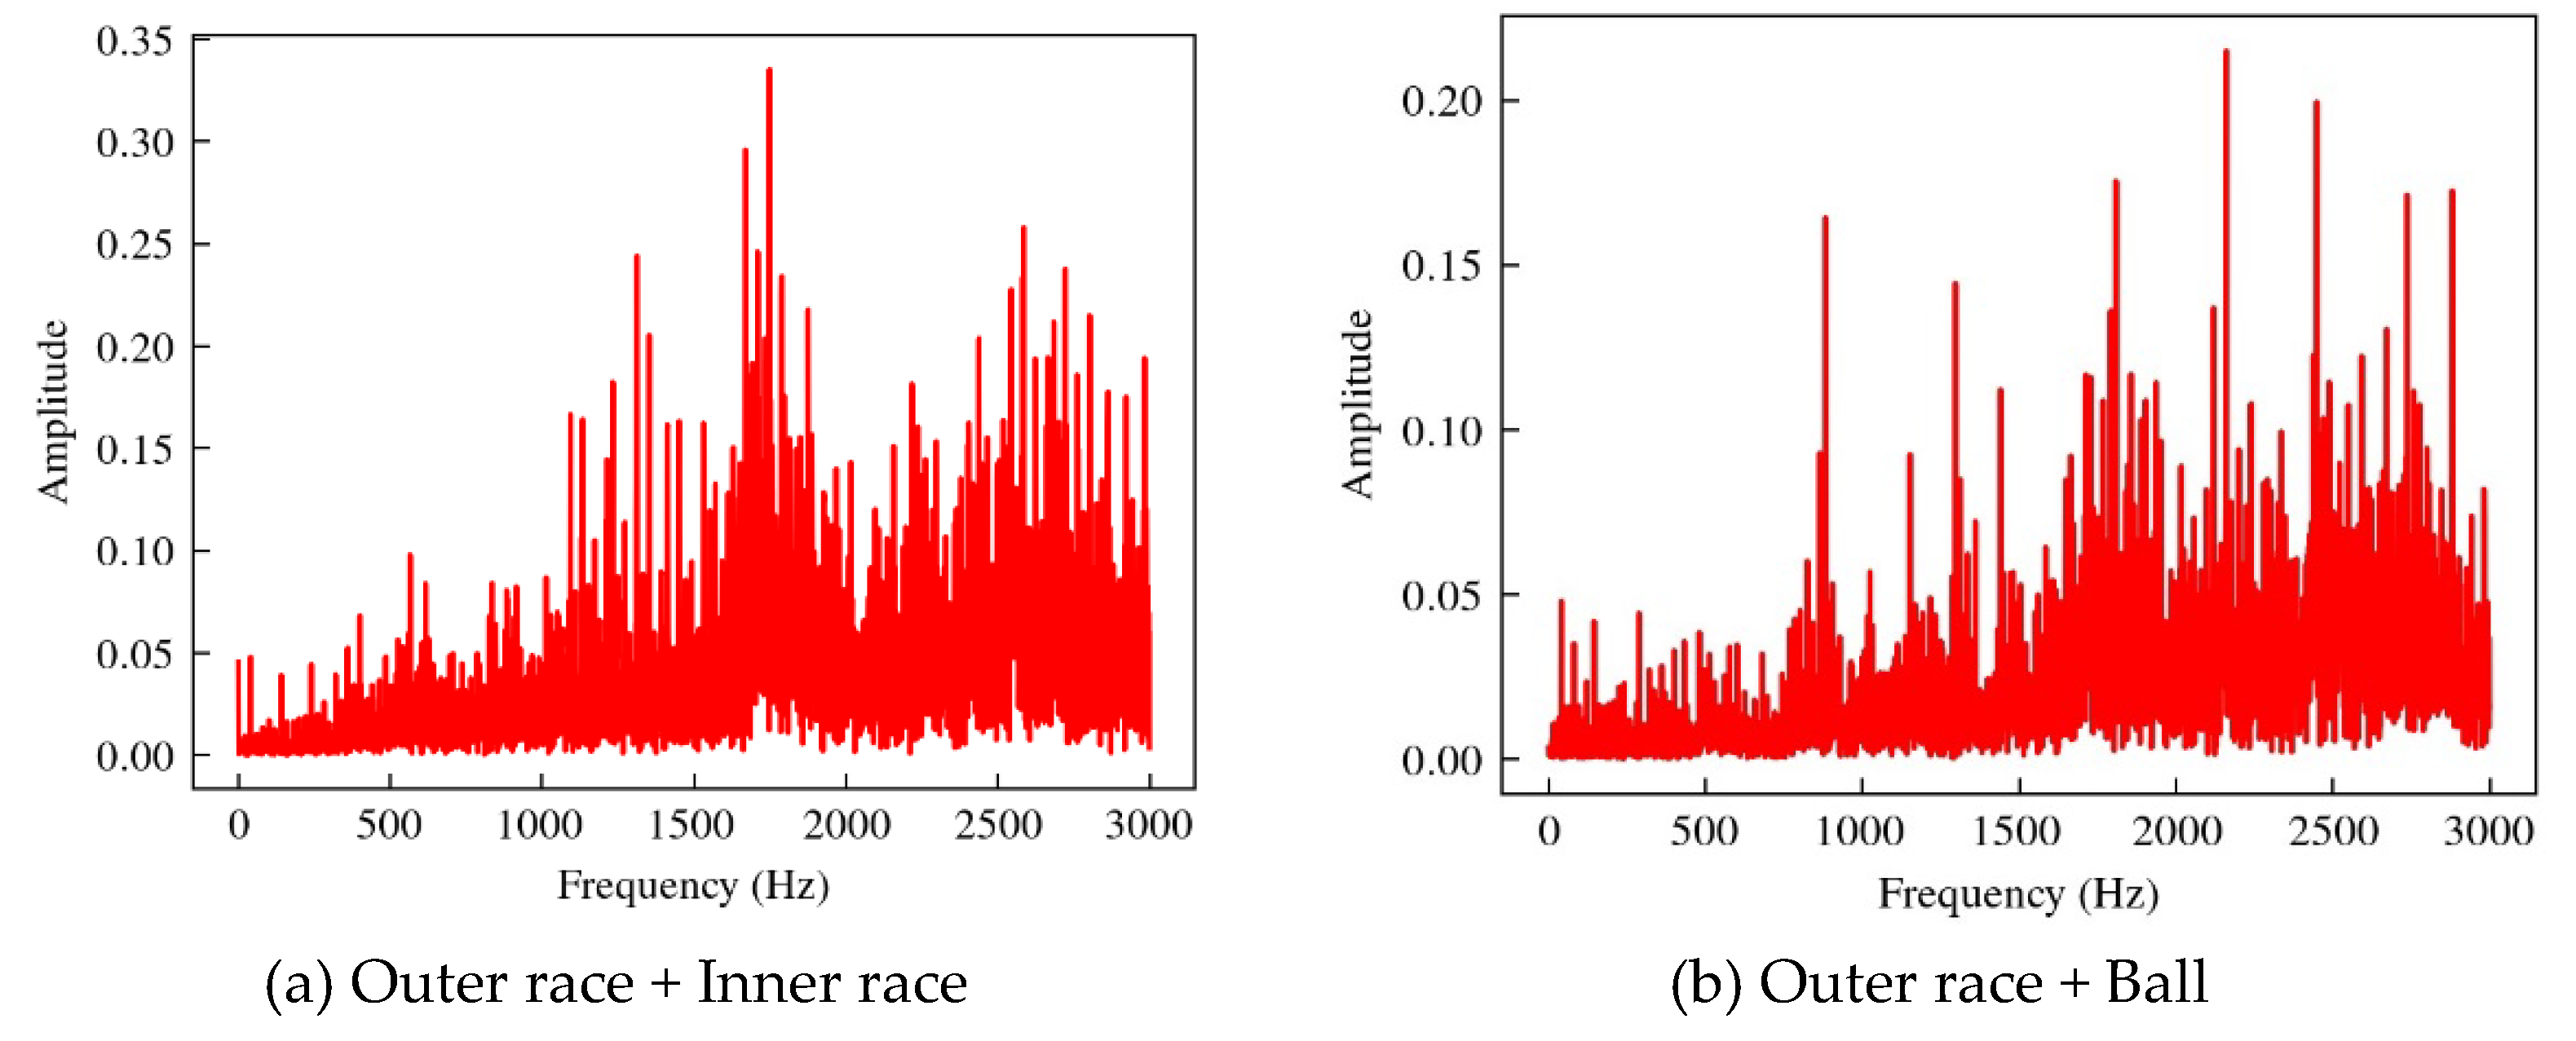
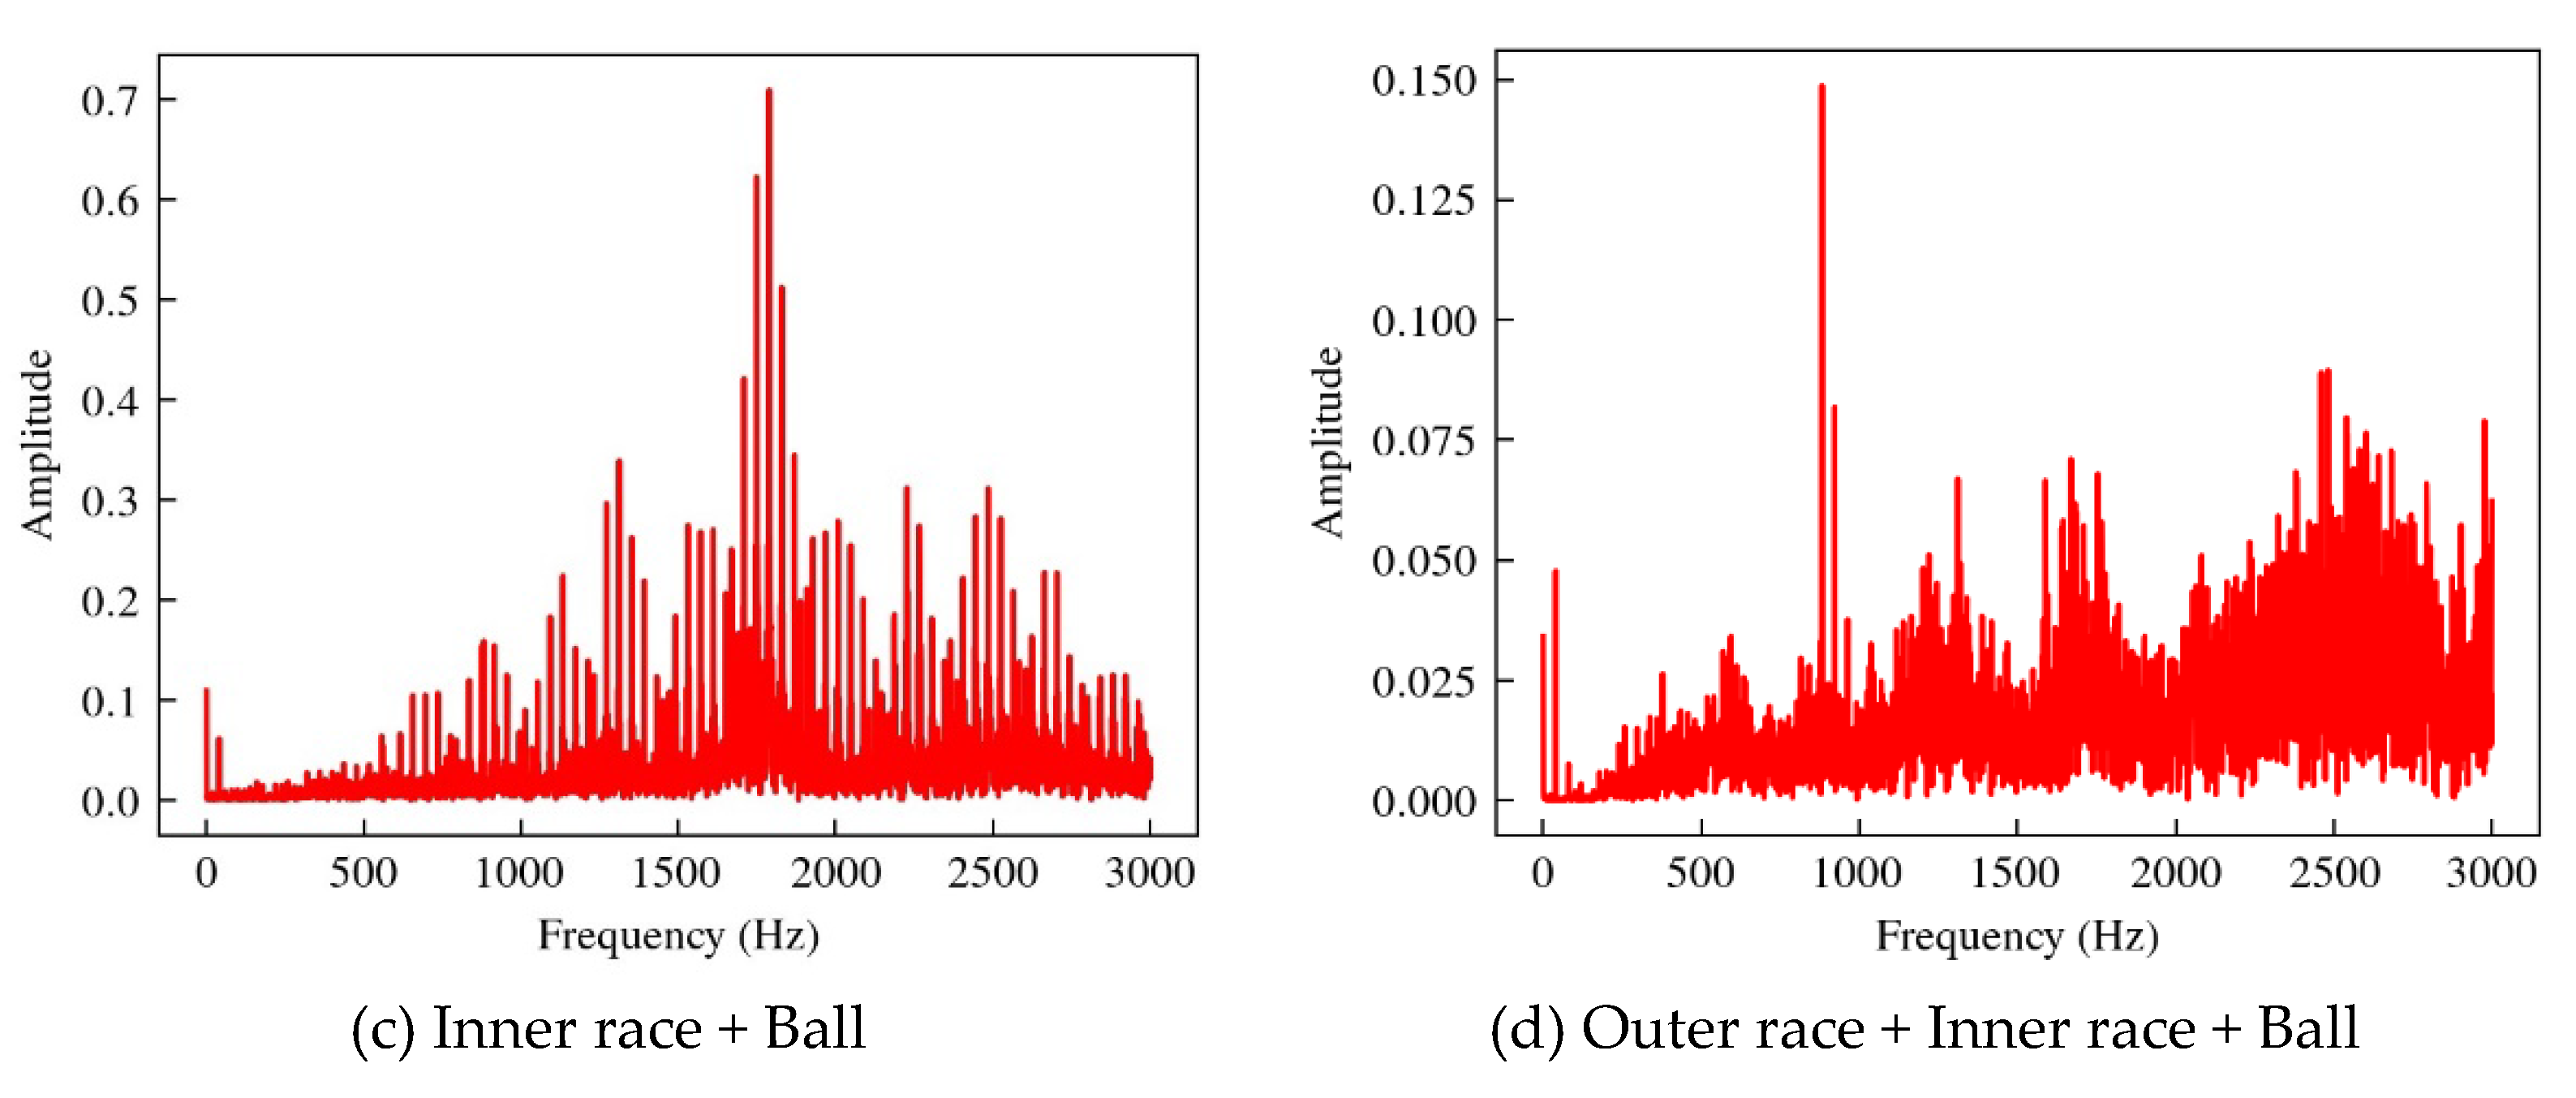
The spectrum of coupled fault data is shown in
Figure 6. The vibration spectrum of coupled fault is not a linear superposition of the base fault spectrum, but contains complex coupling relations, which requires a higher-order relationship model to obtain coupling fault features.
5. Coupling Fault Diagnosis
5.1. Coupling Fault Diagnosis Based on Feature Generation
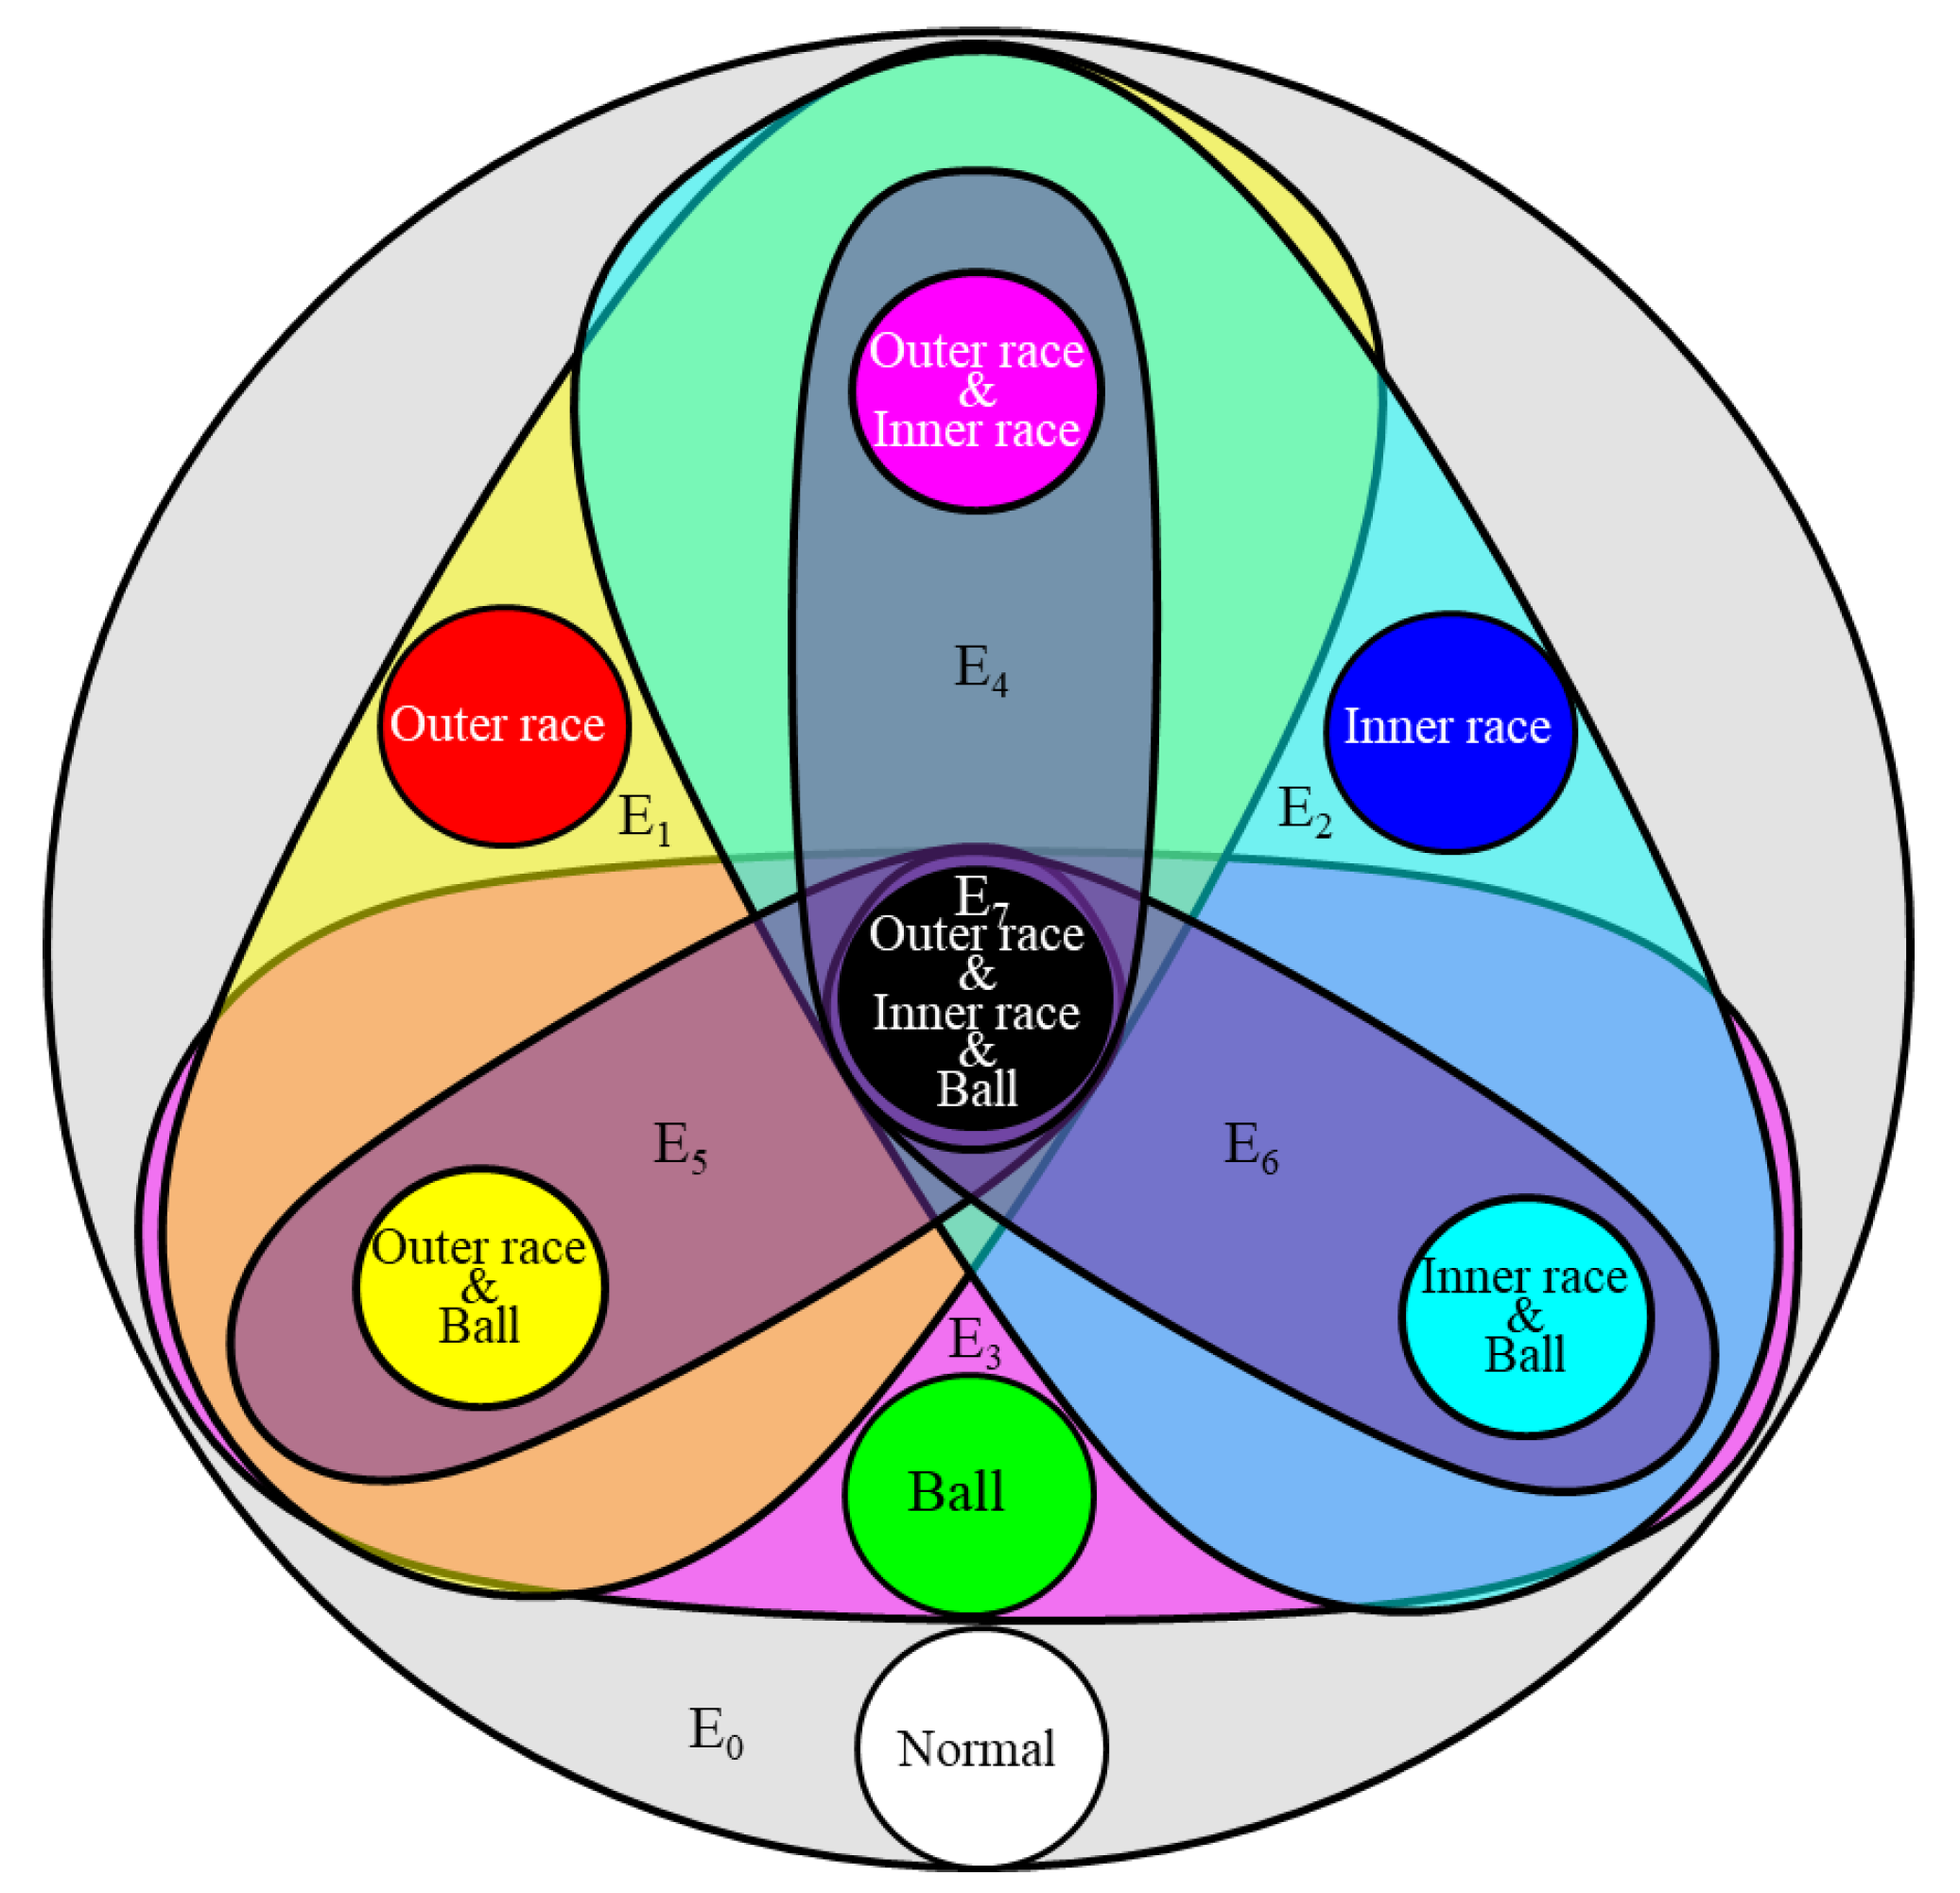
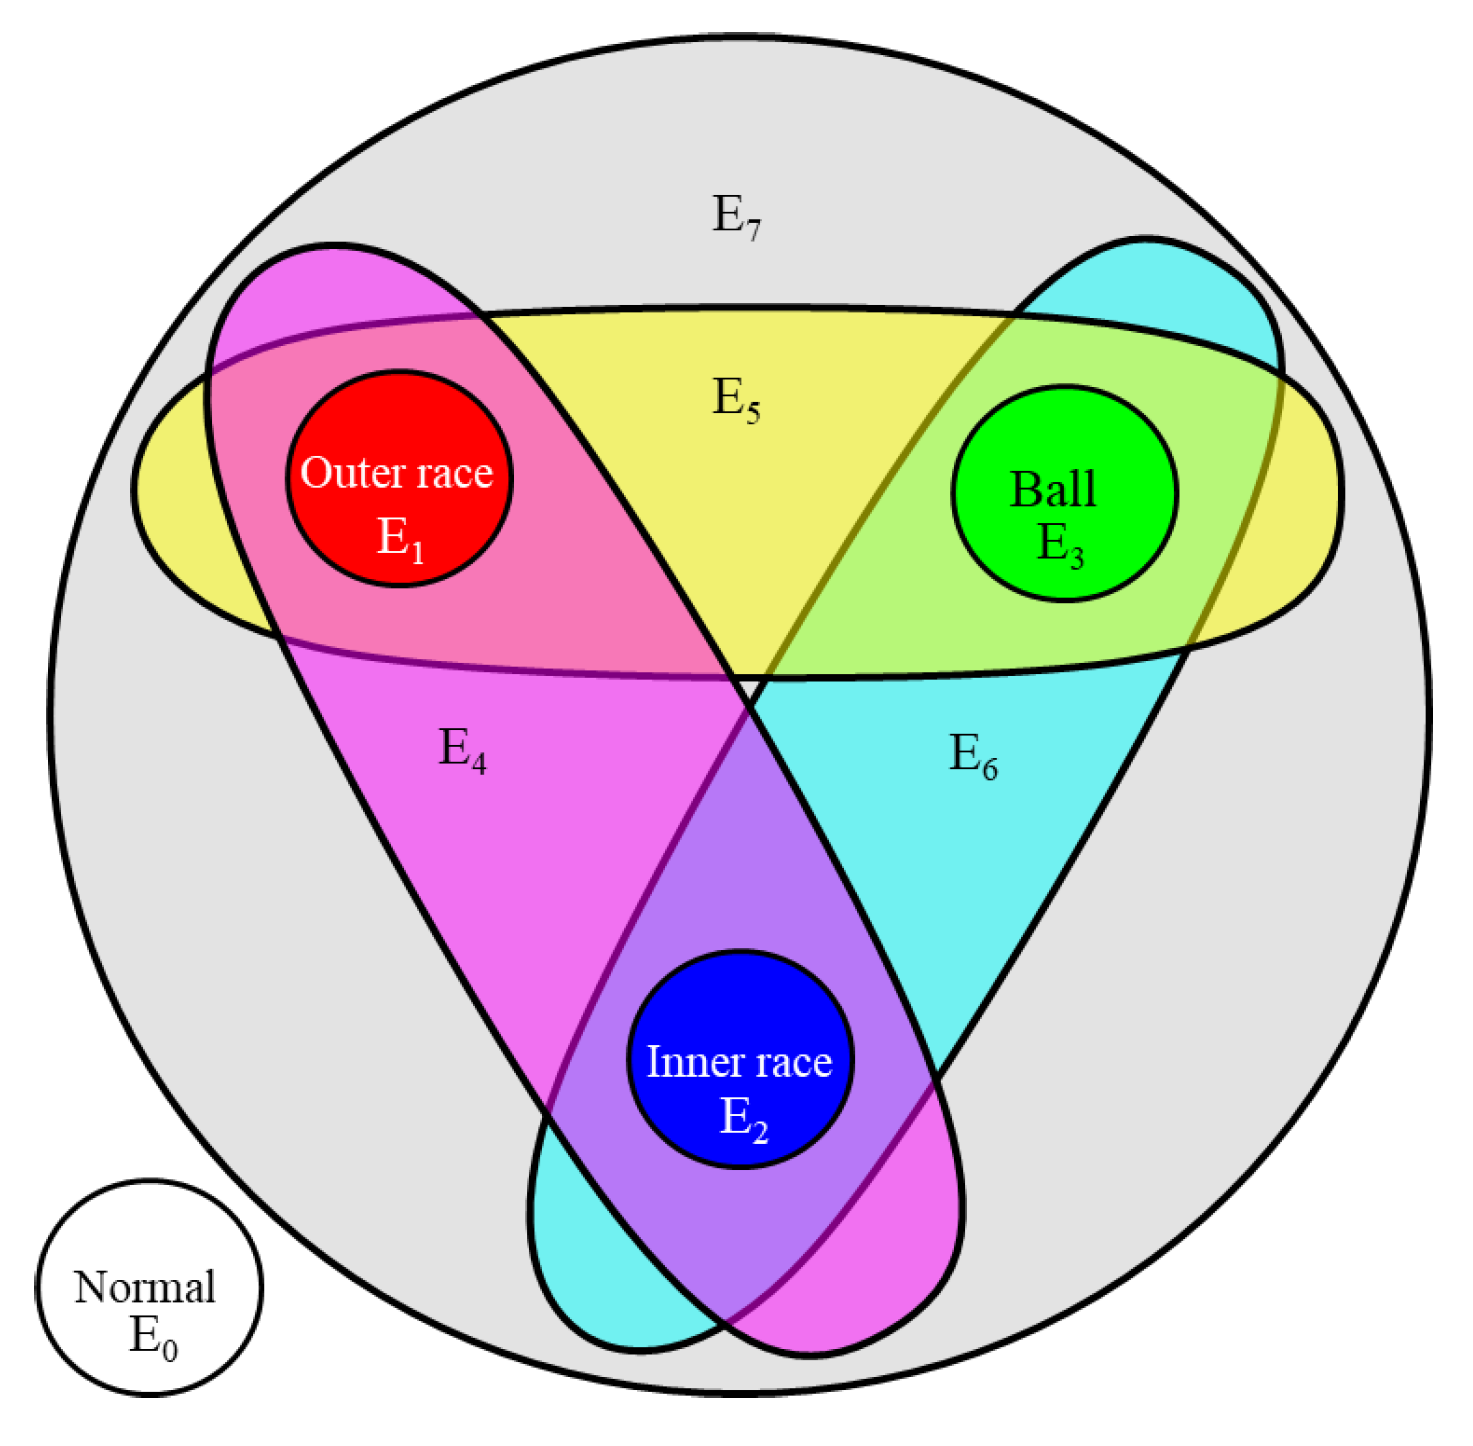
In the HGGAN architecture, the 4 base faults are defined as 4 graph nodes, and the 8 super edges represent 8 types of coupling faults respectively. As shown in
Figure 7, the normal state constitutes an independent hyperedge, the inner ring, the outer ring and the ball fault constitute an independent hyperedge with three primary colors respectively, the pairy-pair coupling constitutes three hyperedges respectively, and the three fault coupling constitutes hyperedge
, a total of 8 hyperedges.
Table 1.
Incidence matrix of HGGAN.
Table 1.
Incidence matrix of HGGAN.
| Fault Types |
|
|
|
|
|
|
|
|
| Normal |
1 |
0 |
0 |
0 |
0 |
0 |
0 |
0 |
| Outer race |
0 |
1 |
0 |
0 |
1 |
1 |
0 |
1 |
| Inner race |
0 |
0 |
1 |
0 |
1 |
0 |
1 |
1 |
| Ball |
0 |
0 |
0 |
1 |
0 |
1 |
1 |
1 |
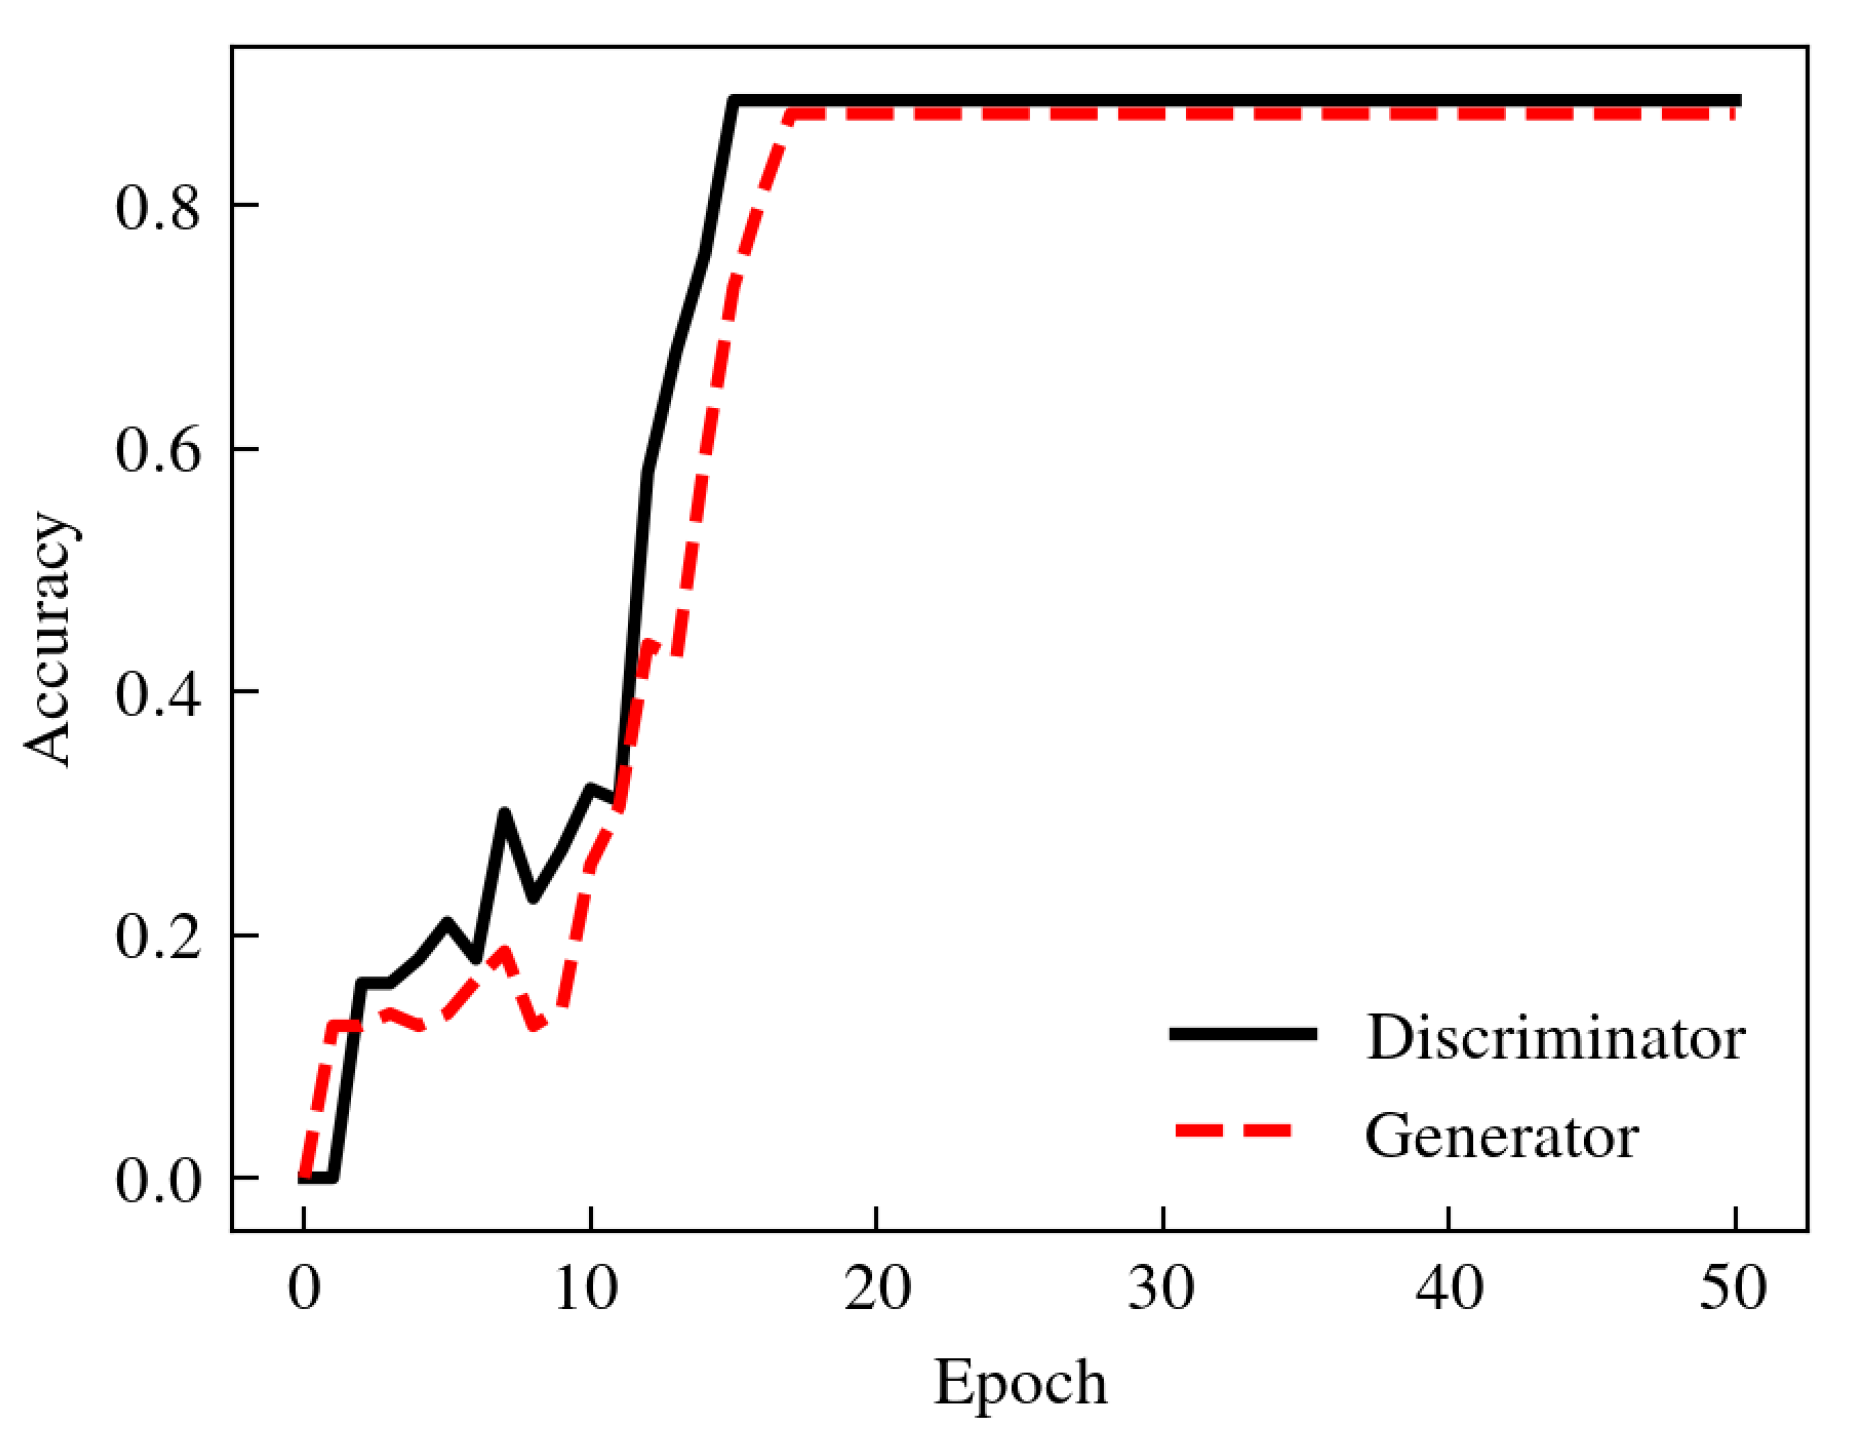
The data set is constructed based on the hypergraph topology, in which the training set contains 816 hypergraph samples and the test set contains 204 hypergraph samples. SGD optimizer was used for model training, SGD momentum was set to 0.9, step dynamic learning rate was adopted, the initial learning rate was 0.01, and the decay rate was 0.1. Input the sample data into the network for training, and the training results are shown in
Figure 8:
The accuracy of discriminator and generator was 88.6% and 87.5% respectively. The discriminator and generator played games with each other in the training process to jointly optimize the accuracy of the model. The accuracy of the discriminator was slightly ahead of the generator in the training process. Finally, the discriminator and generator models reached similar and strong fault diagnosis capabilities respectively at the 18th iteration.
The generator aggregates the two types of base faults through the hypergraph network to obtain a total of
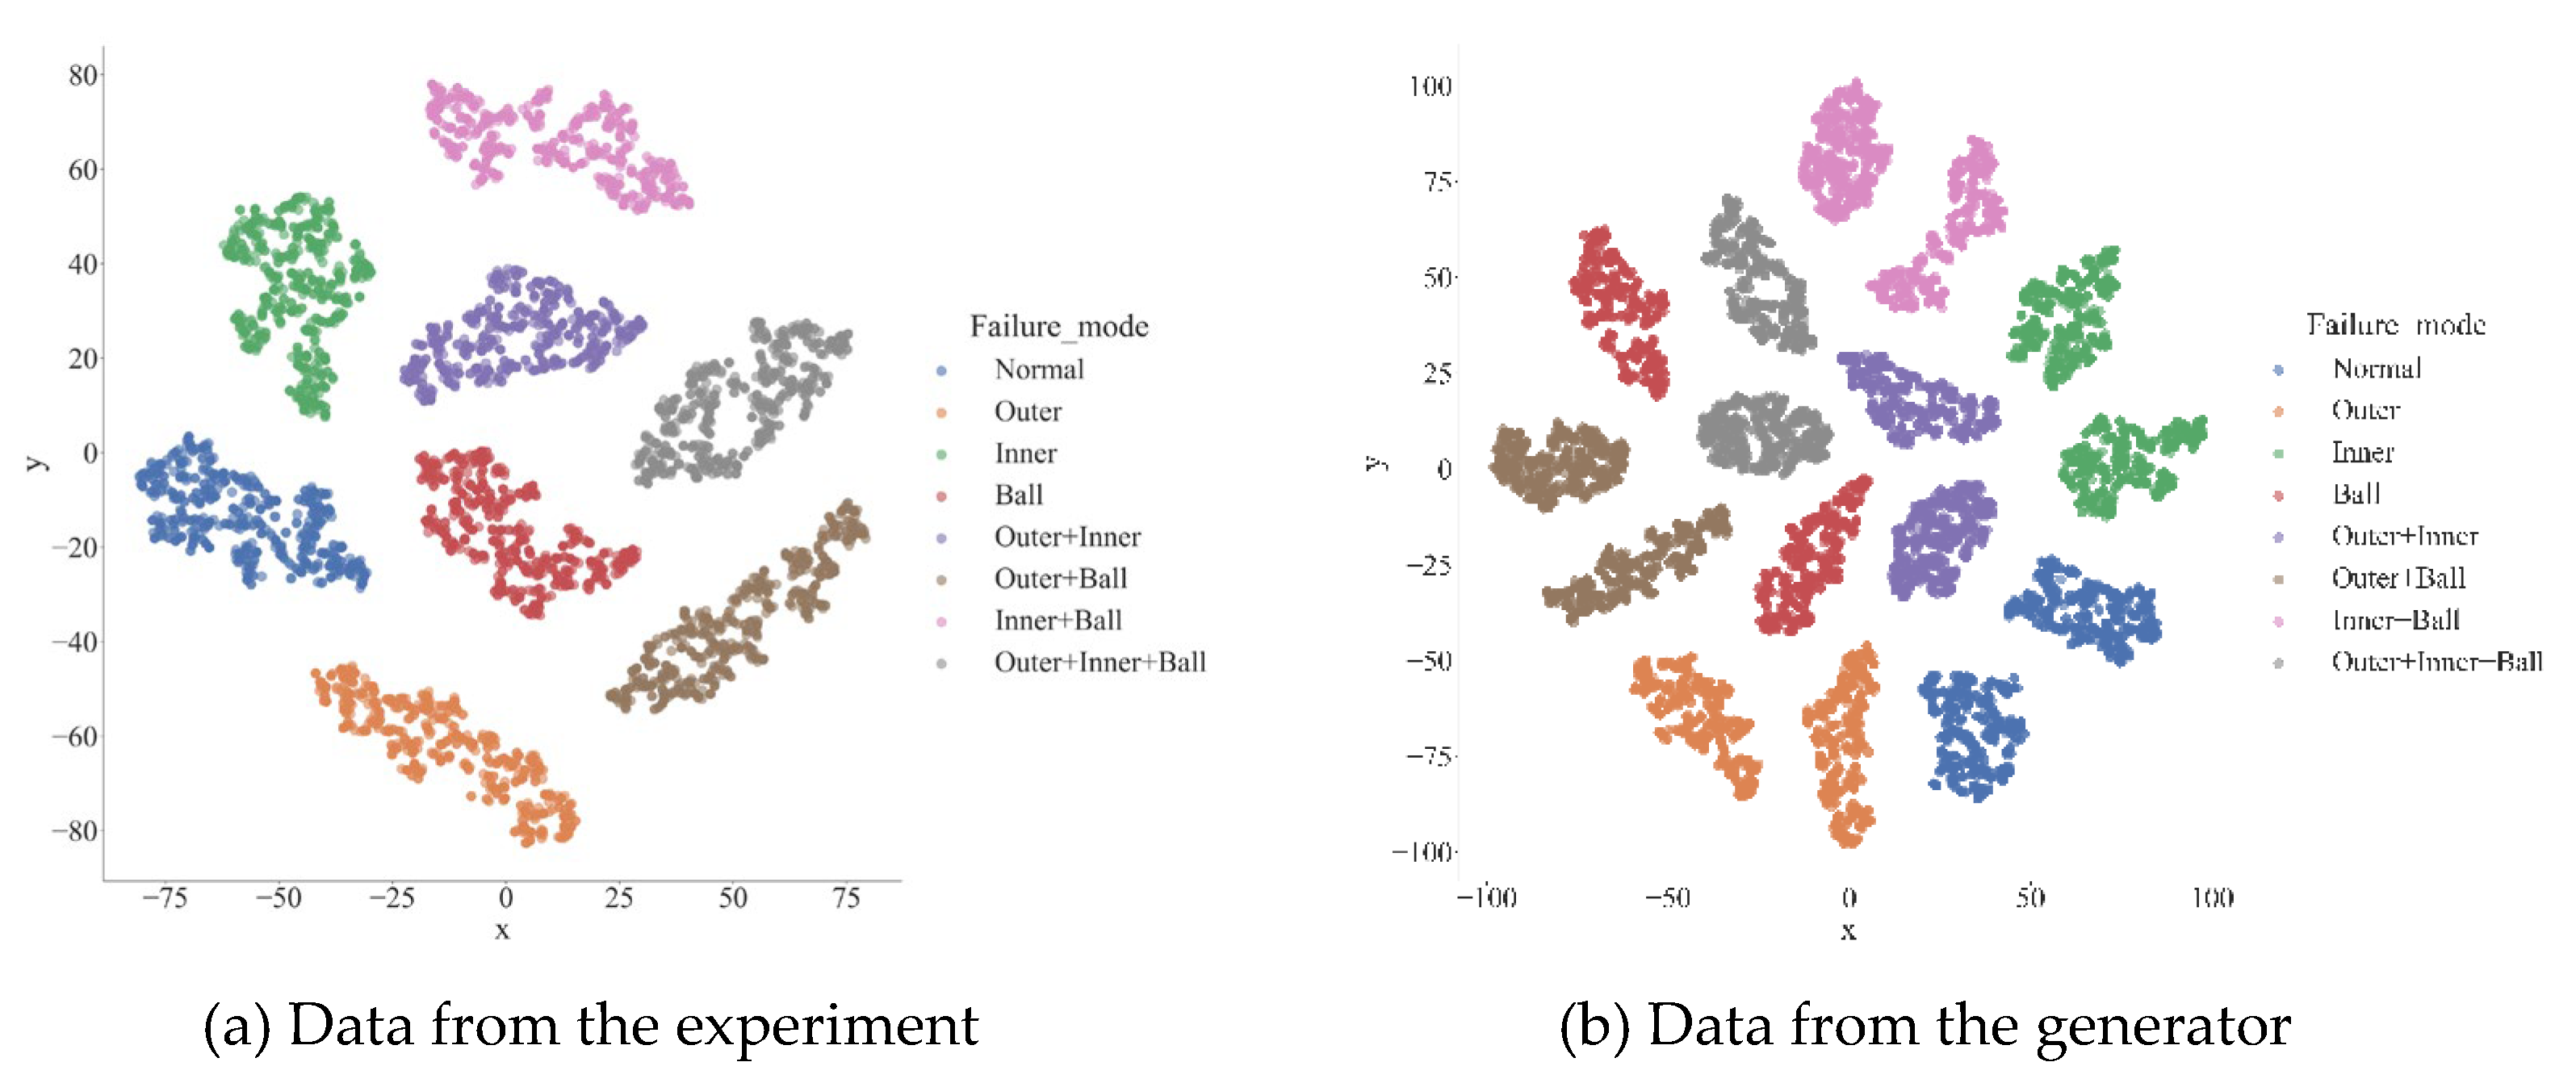
types of faults. The real data and the data generated by the generator are respectively reduced to 2-dimensional by TSNE, and their distribution is shown in
Figure 9. Although there is a clear dividing line between the data generated by the generator and the original data, similar faults are roughly located in the same area in the 2-dimensional plane, as shown in
Figure 9 (b). The reason is that the generator loss function is the cross entropy of the network output and the real label, which only has requirements on the size relationship of the output value, and has low requirements on the consistency of data values, so that the model has good generalization. Therefore, the data generated by the generator can realize more accurate fault diagnosis.
The discriminator obtained by the HGGAN model was compared with the MLP without adding a generator and the MLP-GAN model in which both the generator and discriminator is MLP. The diagnostic accuracy was shown in
Table 2. HGGAN has advantages over other models in terms of accuracy.
Compared with MLP, HGGAN’s discriminator has the same structure as MLP. By adding generator HGCN to generate negative samples and optimize MLP model parameters, HGGAN’s loss function is optimized, so its fault diagnosis accuracy is improved to a certain extent. Compared with MLP-GAN, HGGAN uses HGCN as a generator to extract higher-order relationships more effectively and generate more accurate fault feature data.
5.2. Coupling Fault Diagnosis Based on Feature Extraction
Under the IPHGAT architecture, this paper takes 4 base faults: normal, outer race fault, inner race fault, ball fault and 4 coupled faults: outer race + inner ring fault, outer race + ball fault, inner race + ball fault, outer race + inner race + ball fault as graph nodes, and establishes 8 hyperedges corresponding to all fault types. The topology of the hypergraph is shown in Figure. 10:
Figure 10.
Coupled fault topology in IPHGAT.
Figure 10.
Coupled fault topology in IPHGAT.
According to the fault coupling relationship, the correlation matrix of the hypergraph topology is obtained, as shown in
Table 3:
The hypergraph data
was input into the network for training. SGD optimizer was used for model training, SGD momentum was set to 0.9, and step dynamic learning rate was adopted, the initial learning rate was 0.01 and the attenuation rate was 0.1. Since the number of base faults involved in this paper was 4, the number of heads in multi-head IPHGAT was set to 4, which corresponded to the fault characteristics of each base fault. In the training process, the classification accuracy
of the base fault
, the classification accuracy
of the dynamic vertex fault
to be predicted and the correlation accuracy
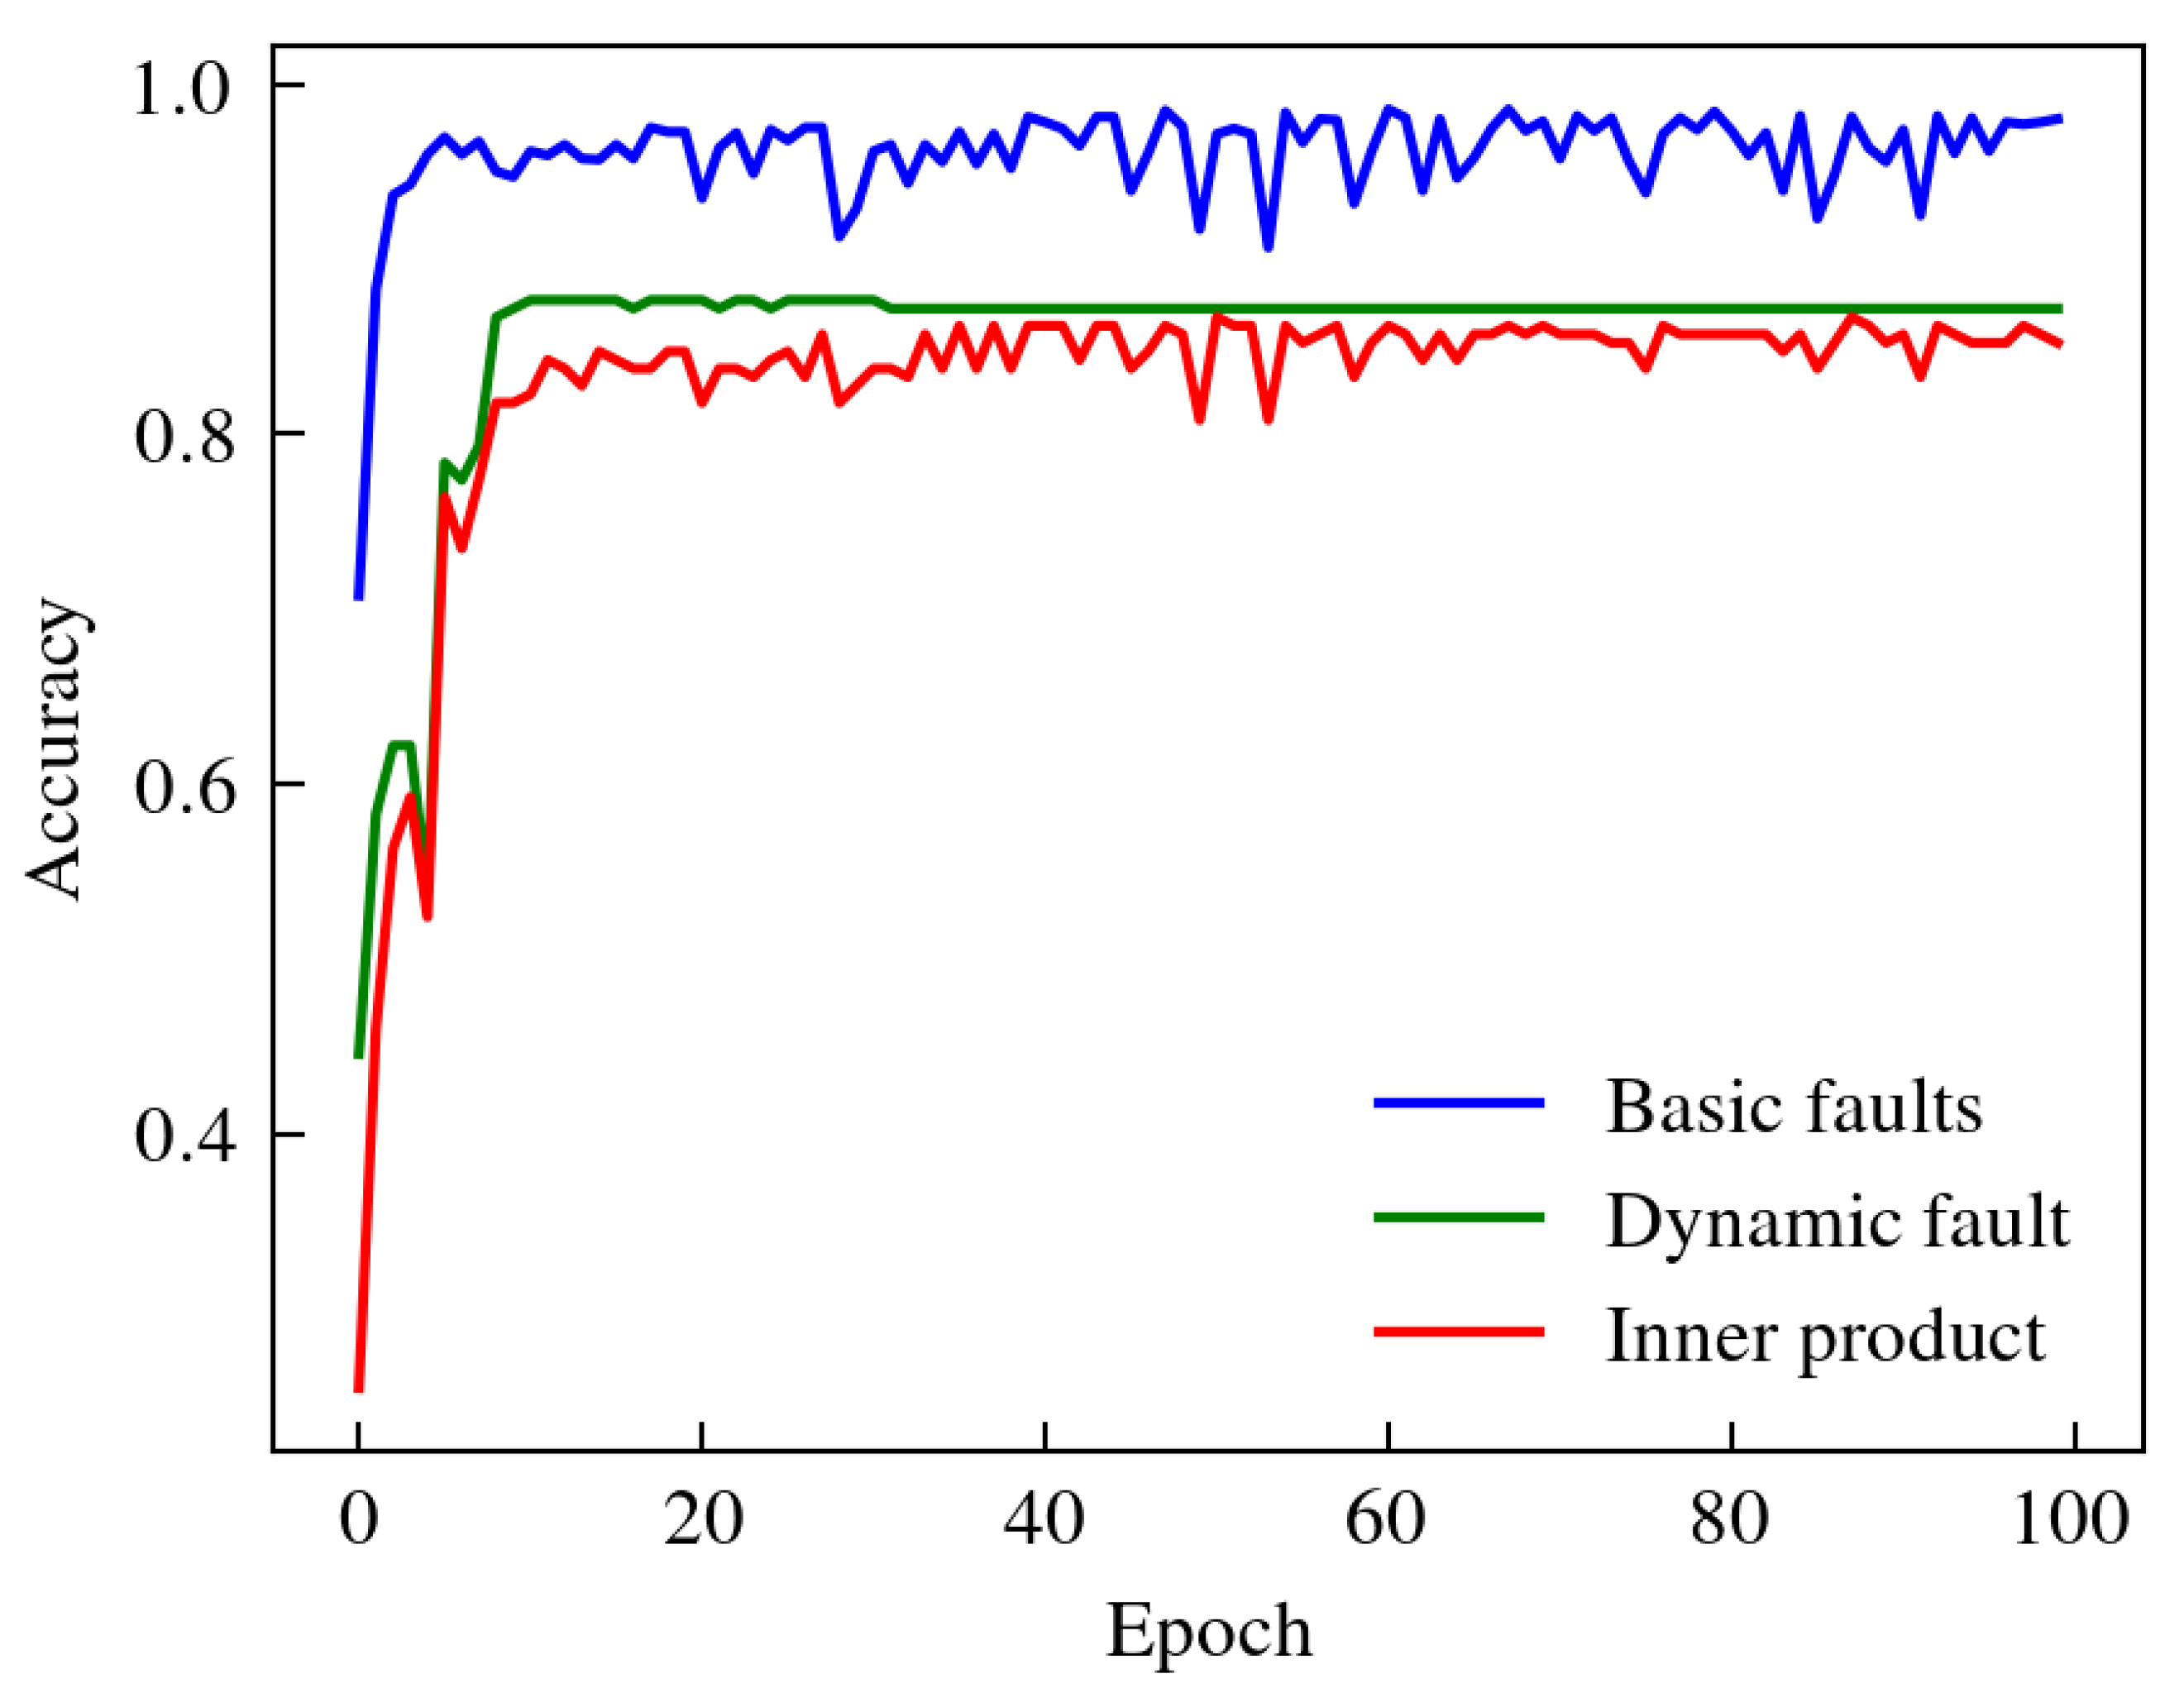
of the inner product are calculated respectively. As shown in
Figure 11,
and
reach 99.88% and 88.60% respectively, and the internal product correlation accuracy rate
reaches 86.76%, so IPHGAT can effectively classify coupling faults.
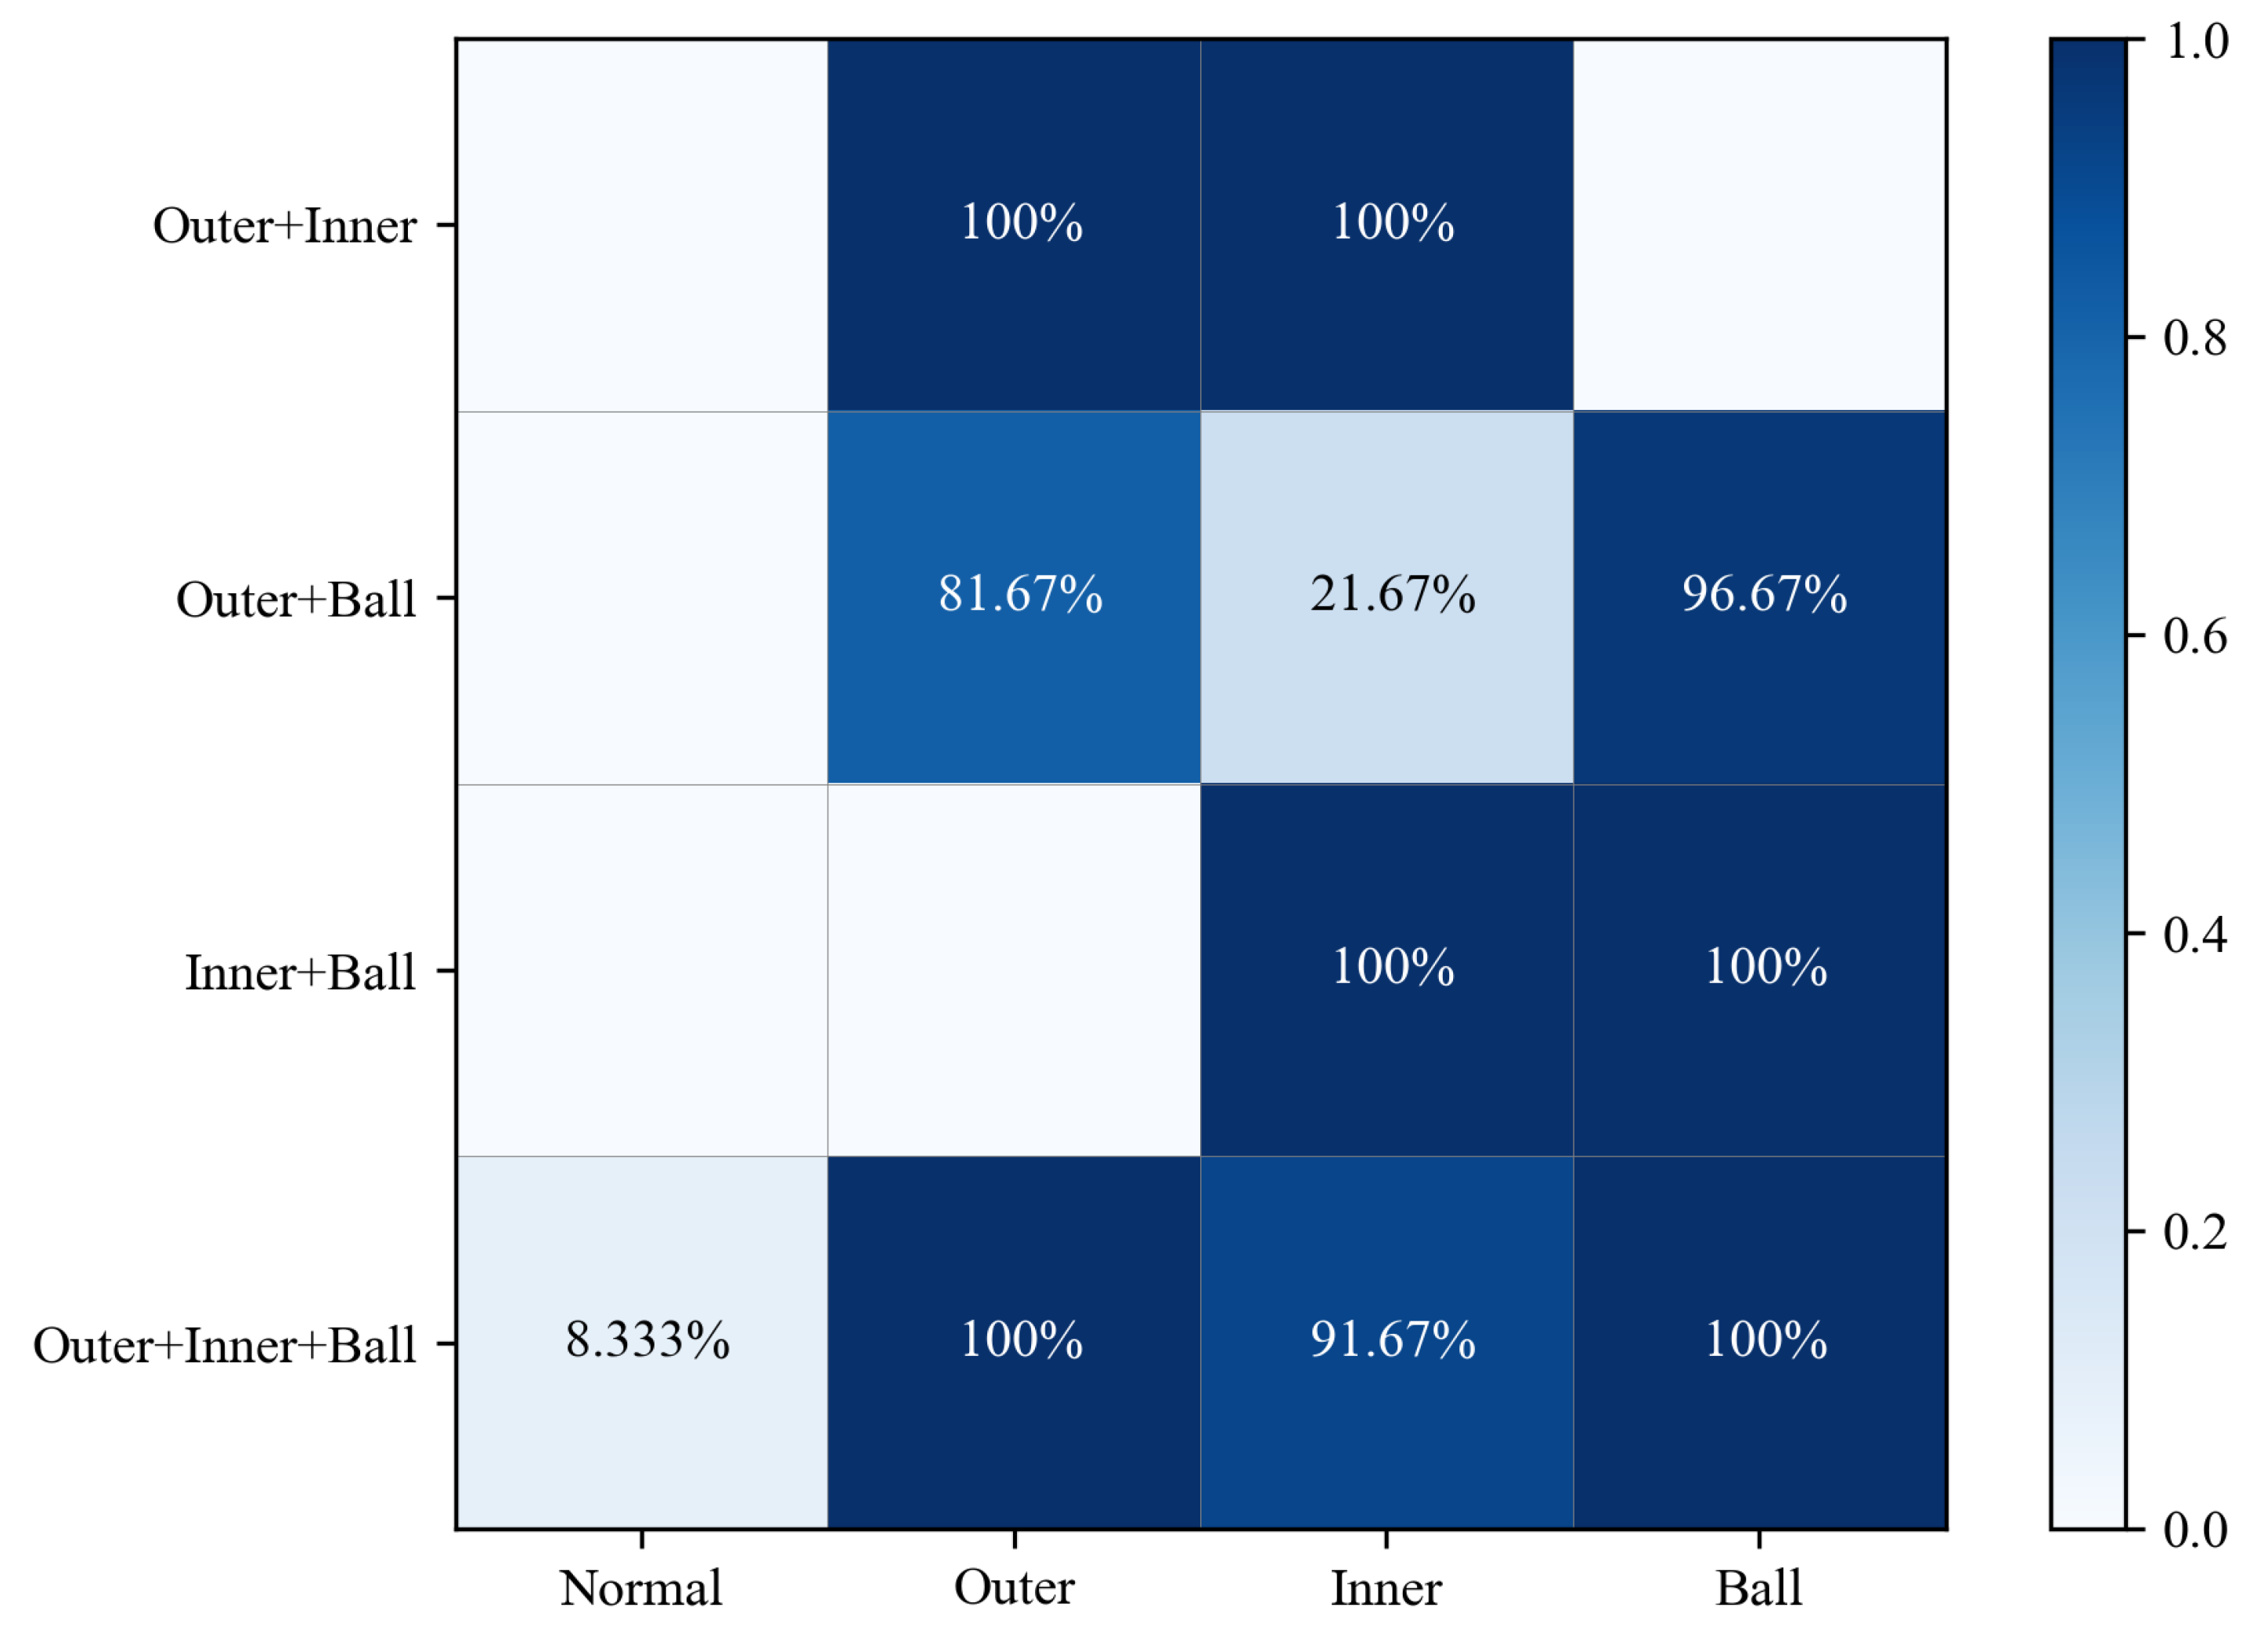
The inner product correlation between dynamic vertex faults and 8 types of fault data is . Input the test set data into the trained IPHGAT model, and take out the inner product correlation of coupled fault and base fault characteristics for analysis. As shown in Figure. 12, the vertical axis is the coupling fault to be predicted, and the horizontal axis is the base fault that makes up the coupling fault. In addition, the accuracy of base fault components of coupled faults is more than 91.67%, and the coupling analysis is basically consistent with the fault injection model.
The IPHGAT model based on the reductionist feature extraction framework extracts the fault component representing the base fault from the coupling fault, and analyzes the fault mode based on the correlation of the fault component, which enhances the interpretability of the model, and is of great significance for the coupling fault diagnosis of rotating machinery in industrial production environment.
