
Submitted:
23 August 2024
Posted:
26 August 2024
You are already at the latest version
Abstract
This study explores the impact on the stability of drying and encapsulation of a camu camu extract (CCX) using the non-thermal, high-throughput electrospraying assisted by pressurized gas (EAPG) technique. The dried and encapsulated products by the EAPG processing techniques were compared in terms of total soluble phenolic compounds, antioxidant activity, and storage stability. Whey protein concentrate (WPC) and zein (ZN) were selected as the protective excipients for encapsulation. Dried and encapsulated products were obtained in the form of microparticles, which were smaller and more spherical in the case of the encapsulates. No significant differences were observed in the total polyphenolic content (TSP), and only relatively small differences in the antioxidant capacity were measured among samples. The generated products were subjected to various storage conditions to assess their stability and the preservation of the TSP and the antioxidant properties, i.e. 0% relative humidity (RH) and 4°C; 0% RH and 21°C; 23% RH and 21°C; 56% RH and 21°C; and UV light exposure. The results indicated that ZN encapsulation notably enhanced the retention of total soluble polyphenols and antioxidant activity compared to WPC and dried CCX, especially in the ratio 2:1 (encapsulating polymer: dried CCX). This study demonstrates the potential of protein-based encapsulation, particularly using ZN, for stabilizing bioactive compounds against degradation mechanisms induced by humidity, temperature, or ultraviolet radiation exposure.
Keywords:
Camu camu extract
; room-temperature drying
; encapsulation
; microparticles
; whey protein concentrate
; zein
; EAPG
1. Introduction
There is a growing interest among consumers in natural bioactive compounds that possess the potential to promote health benefits and contribute to the prevention and/or treatment of chronic diseases. Consequently, investigating and researching these natural bioactive compounds is a matter of great importance for numerous laboratories and industries [1,2].
Among the bioactive compounds, phytochemicals stand out, due to their ability to inhibit oxidative reactions, thereby protecting the organism from reactive oxygen species, which are implicated in numerous degenerative diseases such as cataracts, atherosclerosis, and cancer [3].
The Amazon region boasts an extraordinary biodiversity of both native and exotic fruits. Camu camu (Myrciaria dubia (H.B.K) McVaugh) is a fruit that is distributed along Bolivia, Brazil, Colombia, Ecuador, Peru, and Venezuela, and it is emerging as a standout due to its remarkable nutritional prospects [4,5]. The composition of camu camu has garnered considerable interest owing to its elevated levels of bioactive compounds such as ascorbic and citric acid and phenolic compounds, including ellagic acid, ellagitannins, and proanthocyanidins [6,7,8], being reported for its purported bioactivities encompassing antihyperglycemic, anti-inflammatory, antihypertensive, and antimicrobial, among others [9,10,11]. In this sense, investigations have demonstrated that camu camu exhibits potent antioxidant and anti-inflammatory properties, surpassing those observed in vitamin C tablets when tested in human subjects [12]. Moreover, studies have also reported the potential antiobesity effects of camu camu in a rat model of diet-induced obesity [13]. Additionally, several studies have suggested that camu camu possesses antidiabetic activities, indicating its potential in treating this disease [7,14,15,16].
To develop functional ingredients based on the active properties of camu camu, it is necessary to extract the bioactive compounds from the fruit or the different parts of the plant [10,14], process that can be followed by a drying step to facilitate its industrial handling. However, it is well-known that some bioactive compounds present low solubility in water or are unstable and susceptible to high temperature, light, pH, oxidative stress, and degradative enzymes, which can negatively impact their biological activities. Consequently, developing strategies to protect and preserve them and to enhance their bioaccessibility and bioavailability is crucial [17,18]. Among these strategies, encapsulation has emerged as a promising approach to address this challenge. Encapsulation involves entrapping the bioactive components within a protective matrix, which can slow down degradation processes, prevent the loss of their functionality and increase bioavailability [2,19]. Therefore, encapsulating the bioactive compounds makes extending their shelf life possible, improving their stability throughout various processing stages and final use at consumption and enhancing their compatibility with different formulations [1,20]. Furthermore, the encapsulation strategy could provide controlled release mechanisms and a sustained and targeted delivery of these compounds in the body [21,22,23]. Thus, various encapsulation methods have been explored so far [24]. The choice of the suitable process varies with the active ingredient's nature, the coating material's properties, and the final product's desired characteristics based on the intended use.
Recent evidence underscores that microencapsulation is a potent process to enhance the stability and bioavailability of the naturally occurring bioactive compounds in camu camu, such as ascorbic acid and anthocyanins. Until now, Fujita et al. have reported the microencapsulation of camu camu juice into Arabic gum and maltodextrin via spray drying [25]. Figueiredo et al., reported the microencapsulation of the camu camu extract from pulp and peels by spray drying using maltodextrin, inulin, and oligofructose as encapsulating matrixes [26]. Complementary findings by García-Chacón et al., reveal that spray-drying of camu camu pulp with maltodextrin, whey protein, and a 50:50 mixture of both is a strategy to increase the bioactive compounds stability, modulate the fruit sensory properties, and improve their bioavailability [27].
However, among the techniques available, electrodynamic processing, including electrospraying or electrospinning, has emerged as a promising and versatile method for encapsulating bioactive agents. Electrospraying offers several advantages over traditional encapsulation techniques [28]: it enables the production of micro or nano-scale particles; it is simple and versatile in terms of the materials that can be processed; it allows the production of particles at low or ambient temperatures [28]. However, the main disadvantage of this technology is its low production yield, which has been solved thanks to the integration of electrospraying and gas-driven nebulization [29]. This technology has been named and patented as electrospraying assisted by pressurized gas (EAPG). The EAPG technology can be used for drying or microencapsulating bioactive compounds at room temperature. It involves atomizing the solution through a pneumatic injector using compressed air that nebulizes within a high electric field. This process enables the formation of fine droplets that get dried at room temperature and are collected as a free-flowing powder.
Hitherto, camu camu has been encapsulated mainly into polysaccharides [25,27]. However, based on our encapsulation expertise [30,31], food-grade proteins can provide increased stability to sensitive bioactive ingredients [32]. Therefore, this work aimed to study the potential of the room temperature EAPG technology to dry and microencapsulate a camu camu extract (CCX). Whey protein concentrate (WPC) and zein (ZN) were selected as encapsulating agents. The microcapsules were characterized by morphology, total soluble polyphenols (TSP) content, and antioxidant activity. Additionally, this study aimed to assess the storage stability of CCX EAPG-derived microcapsules under different humidity and temperature conditions and against photooxidation
2. Materials and Methods
2.1. Materials
Camu camu powder (CCP) was provided by Qomer BioActive Ingredients (Valencia, Spain). Whey protein concentrate (WPC) 80% was purchased from Beurrespa S.L. (Madrid, Spain). According to the distributor, WPC was claimed to contain 81.6% protein (on dry basis) and 7.5 % fat. Maize zein (ZN), gallic acid, sodium carbonate, Folin-Ciocalteau reagent, magnesium nitrate, potassium acetate, and silica gel were purchased from Sigma-Aldrich (Saint Louis, USA). Methanol (reagent grade) was purchased from Labbox (Premià de Dalt, Spain). Ethanol 96 vol.% from Panreac Química SLU (Barcelona, Spain). Deionized water was used throughout the study.
2.2. Preparation of Camu Camu Extract (CCX)
The CCP was extracted following a standardized adapted method as described by Fracassetti et al. [8]. A mixture of alcohol and water (85%) was used as the extraction solvent. The extraction process was carried out at a concentration of 5% (w/v), where 50 g of CCP was mixed with 1000 mL of the extraction solvent. The mixture was homogenized using a magnetic stirrer (H20 series, LBX Instruments, Premia de Dalt, Spain) at room temperature until complete dissolution of CCP. Subsequently, the mixture was sonicated in a SONOPULS HD 2200.2 (Bandelin electronic GMbH & Co. KG, Berlin, Germany) for an additional 30 min. After sonication, the solution was centrifuged at 3000 rpm for 15 minutes at 4°C using an Avanti J-26 XPI Beckman Coulter centrifuge (Brea, CA, USA). The resulting supernatant was then filtered using Whatman No. 1 filter paper under vacuum filtration. The filtered supernatant was collected and used for further encapsulation processes.
2.3. Preparation of the Polymer Solution
To prepare the encapsulating solutions, a 20% (w/v) solution of whey protein concentrate (WPC) in water was prepared, and a 4% (w/v) solution of zein (ZN) in an 85% (v/v) ethanol aqueous solution. Then, the encapsulating solutions were created by slowly adding the pre-prepared camu camu extract (CCX) to the respective encapsulating matrix solutions at ratios of 1:1 w/w and 2:1 w/w (encapsulant to dry weight CCX ratio). The solutions were continuously stirred using a magnetic stirrer (H20 series, LBX Instruments, Premia de Dalt, Spain) at room temperature overnight until a homogenous mixture of polymer solutions was obtained.
2.4. EAPG Process
The EAPG process was used to dry the CCX solution and to encapsulate the CCX into WPC and ZN, using the CapsultekTM pilot plant from Bioinicia S.L. (Valencia, Spain). The pilot plant consists of a nebulizer that generates aerosol droplets, which are subjected to a high electric field, a drying chamber, and a cyclonic collector. The process was conducted under controlled ambient conditions of 25 °C and 30% relative humidity (RH), as detailed in the study by Busolo et al. [29]. The solution was pumped to the injection unit at a flow rate of 10 mL/min, with an air pressure of 10 L/min and a voltage of 15 kV. The resulting particles were collected from the cyclone as a free-flowing powder, stored in flasks under vacuum at -20 °C, and protected from light to prevent oxidation until further analysis.
2.5. Microscopy
Scanning electron microscopy (SEM) analysis of the particle morphology was conducted using a Hitachi S-4800 field-emission scanning electron microscope (Hitachi High Technologies Corp., Tokyo, Japan). The microscope was operated at an electron beam acceleration of 5 kV. Before analysis, approximately 5 mg of the capsules from each sample were coated with a thin layer of gold/palladium to enhance conductivity and imaging quality during SEM observations. The SEM images were captured, and the average diameters of the particles were determined using Image J Launcher v1.41 software developed by the National Institutes of Health (Bethesda, USA).
2.6. Assessment of the Stability of CCX Formulations
The stability of CCX formulations was evaluated under different storage conditions of relative humidity (RH) and temperatures and accelerated oxidation conditions under ultraviolet (UV) radiation. To simulate different humidity levels, samples of CCX formulations were placed in desiccators containing either silica gel (0% RH), potassium acetate oversaturated solution (23% RH), or magnesium nitrate oversaturated solution (56% RH). The desiccators were kept at a cooling temperature (4°C) or ambient temperature (~21°C) accordingly. The samples were stored under the above conditions and monitored for 40 days. Weekly samples were collected and analyzed.
Regarding UV radiation, a commercially available OSRAM Ultra-Vitalux lamp (OSRAM, Garching, Germany) irradiated the samples with UV light. This lamp consists of a quartz discharge tube and a tungsten filament, producing a blend of radiation like natural sunlight. The lamp was operated at a power of 300 W, and only wavelengths like those present in daylight passed through the special glass bulb. After 1 h of exposure, the radiation between 315-400 nm was measured to be 13.6 W, and the radiation between 280 and 315 nm was measured to be 3 W. Approximately 20 g of capsules were evenly spread on Petri dishes and positioned at 20 cm under the UV lamp. The powder in the Petri dish was stirred daily to maintain a uniform treatment. The thickness of the powder layer was maintained below 5 mm to ensure consistent exposure to UV light. The capsules were subjected to the specified storage conditions, and their stability was evaluated over 40 days. Weekly samples were taken from the capsules for analysis.
The analysis of the samples was specifically made to focus on variations in total soluble polyphenols and antioxidant capacity, and attenuated total reflectance Fourier-transform infrared (ATR-FTIR) spectroscopy was utilized.
2.7. Total Soluble Polyphenols
The total soluble polyphenols (TSP) content in the CCX formulations was determined using the Folin-Ciocalteu method described by Singleton and Rossi [33]. For the analysis, 10 mg of the CCX formulations were diluted in ethanol at a concentration of 50% (v/v). Similarly, an equivalent amount of WPC-CCX capsules was diluted in ethanol at 33% (v/v), and an equivalent amount of ZN-CCX capsules was diluted in ethanol at 75% (v/v). After dissolution, 20 μL of the capsule's solution was mixed with 1.2 mL of water and 300 μL of sodium carbonate solution at a concentration of 7.5% (w/v) in Eppendorf tubes. The mixture was then homogenized for 1 minute using a vortex shaker and left to stand for 5 minutes.
Next, 380 μL of water was added to the mixture, followed by 100 μL of a 10% (v/v) Folin reagent solution. The reaction proceeded for 15 min under dark conditions and at room temperature. Subsequently, the absorbance of the resulting solution was measured in triplicate at a wavelength of 765 nm using a UV/Vis spectrophotometer (UV4000 Dinko Instruments, Barcelona, Spain). The absorbance values obtained were then used to calculate the total soluble polyphenols content of the samples, expressed in gallic acid equivalents (mg GAE/g of dried CCX).
2.8. Antioxidant Activity
The antioxidant capacity of the obtained CCX formulations was determined using the DPPH (2,2-diphenyl-2-picrylhydrazyl hydrate) free radical scavenging method. This method is commonly employed to assess the ability of samples to scavenge free radicals and indicate their antioxidant activity. To assess the antioxidant capacity, 10 mg of the dried CCX (or the equivalent amount of WPC-CCX or ZN-CCX capsules) was dissolved in ethanol at specific concentrations (50% v/v for the dried CCX, 33% v/v for WPC-CCX, and 75% v/v for ZN-CCX). Then, 50 μL of the prepared solutions were mixed with 950 μL of methanol.
An aliquot of 0.1 mL of the methanol solutions was then added to 1.9 mL of a DPPH methanolic solution (0.094 mM concentration). The mixture was vortexed and kept in dark conditions for 30 min at room temperature to allow the reaction between the DPPH radical and the samples.
A methanol solution without the sample was used as a blank for comparison. After the incubation period, the absorbance of the reaction mixture was measured in triplicate at a specific wavelength (e.g. 517 nm) using a UV/Vis spectrophotometer (UV4000 Dinko Instruments, Barcelona, Spain). The absorbance values obtained from the samples were compared to the blank to calculate the radical scavenging activity. The radical scavenging activity can be calculated using the following equation:
DPPH Inhibition (%) = ((Ac -As)/ Ac) x 100
DPPH Inhibition (%) is the inhibition percentage of DPPH, Ac is the absorbance of pure DPPH solution, and As is the absorbance of the incubated sample after reacting with DPPH.
By employing the DPPH free radical scavenging method and calculating the radical scavenging activity, the antioxidant capacity of the CCX formulations could be assessed, providing information about their ability to neutralize free radicals and potentially protect against oxidative stress.
2.9. Attenuated Total Reflection- Fourier Transform Infrared (ATR-FTIR)
The ATR-FTIR spectra of CCX formulations were measured using a Bruker Tensor 37 FT-IR Spectrometer equipped with an ATR sampling accessory called the low-temperature Golden Gate from Specac Ltd. This accessory ensures proper contact between the diamond crystal and the encapsulated samples, enhancing the quality of the spectra. Approximately 50 mg of the capsules were used for each measurement.
The spectra were precisely collected using ATR-FTIR spectroscopy within the 4000-600 cm-1 wavenumber range, capturing a comprehensive infrared frequency spectrum crucial for molecular bond characterization. The protocol averaged 10 scans per spectrum to enhance the signal-to-noise ratio, a standard analytical chemistry practice for data quality improvement. Spectral resolution was set at 4 cm-1, allowing proper resolution for molecular vibration interpretation.
The OPUS 4.0 data collection software program, developed by Bruker, was used to analyze the spectral data. This software enables the processing, analysis, and interpretation of the ATR-FTIR spectra, allowing for the identification and characterization of the encapsulated samples. Measurements were performed in triplicate to ensure the reproducibility and reliability of the results.
2.10. Statistical Analysis
The data were expressed as mean ± standard deviation. To determine the significance of the differences observed among the different samples, an analysis of variance (ANOVA) was conducted. Following ANOVA, a Tukey test was performed to compare the means of multiple groups. In this analysis, differences were considered significant when the p-value was less than 0.05. For this analysis, the software used was Statgraphics Centurion Version 17.2.04, developed by Statistical Graphics Corp.
3. Results and Discussion
This study investigates the effect of drying of CCX and its microencapsulation using WPC and ZN via the EAPG technology. The resulting microcapsules were analyzed for their morphology, total phenolic content, antioxidant activity, and storage stability under different ambient conditions.
3.1. Morphology
Figure 1 provides a comparative analysis of particle morphologies achieved through EAPG technology. When drying neat CCX (Figure 1A), irregular, non-uniform, and agglomerated structures were predominantly observed, resulting in a particle size distribution of 10.01 ± 1.84 μm, as shown in Table 1.
CCX encapsulates exhibited a spherical morphology, and the average particle sizes are gathered in Table 1. The encapsulates showed an average particle size around 6 µm with narrow size distribution and with no significant differences among formulations. All particle sizes were significantly below the organoleptic detection threshold of 20 µm, ensuring a seamless sensory experience [54] and the potential to maintain texture in the final product formulation. In addition, these results are consistent with earlier successful EAPG encapsulations of bioactive compounds, such as Eicosapentaenoic acid (EPA) [30] and Dragon’s blood sap (DBS) [31], which produced microparticles with average sizes around 6 µm and 11 µm, respectively.
In a recent study conducted by García-Chacón et al., the use of whey protein concentrate (WPC) and maltodextrin as coating agents were compared during the spray drying process of camu camu. Maltodextrin produced particles of sizes ranging from 1.5 to 12.5 μm, while whey protein resulted in particles ranging from 5 to 45 μm [27]. In another study, Figueredo et al. encapsulated a camu camu extract via spray drying using maltodextrin, inulin, and oligofructose as carrier agents, observing varying particle sizes between 5 and 54 μm [34]. Further investigation is needed to determine the effects of the EAPG method's particle size reduction on product homogeneity and sensory attributes.
3.2. Characterization of Antioxidant Activity and the Polyphenol Content
The antioxidant activity of the CCX, the EAPG-dried CCX, and the encapsulated forms consistently are shown in Table 1. Previous studies have demonstrated that camu camu possesses antioxidant capabilities that significantly surpass those of various fruits by over tenfold [27,35,36]. In our investigation, DPPH inhibition percentages for the CCX was 89.06%, which increased to some small extent to 94.07% for CCX-EAPG, potentially attributed to humidity loss during drying by EAPG. Regarding the encapsulates, the 2:1 encapsulation ratio in protein-based formulations was found to be more antioxidant for the 2:1 ratio than for the 1:1 ratio, especially in the case of zein. This observation is consistent with findings from prior studies on Dragon Blood Sap (DBS) with EAPG-delivered capsules [31], where a 1:1 coating-to-core ratio led to decreased DPPH radical scavenging activity. In any case, the differences among samples are relatively small and could be within the experimental error associated to the process and the analytical method.
To further investigate the stability and antioxidant characteristics of the processed materials, the total soluble polyphenols (TSP) was also determined using the Folin-Ciocalteu method. The results, shown in Table 1, unveiled consistent TSP levels across all samples, with a narrow range from 1.06 to 1.15 mg GAE/g dried CCX. The consistent retention of total soluble polyphenols (TSP) indicates the efficiency of the EAPG method in preserving the initial TSP content during drying or encapsulation. Moreover, the comparable TSP values among samples imply that the choice of coating materials did not significantly affect the polyphenol content. These results align with prior research demonstrating the preservation of bioactive compounds, including polyphenols, throughout encapsulation processes [31].
According to the literature, the total phenolic content within camu camu is influenced by factors such as fruit composition, ripeness, and postharvest processing methods. The camu camu flour used in this study was obtained through a comprehensive procedure involving handpicked fruits subject to fluidized bed drying at temperatures below 60°C, followed by the fruits being finely ground into a powder and packaged under controlled conditions to safeguard their purity. Regarding the results provided by other authors, Genovese et al. (2008) reported a concentration of 19.92 mg GAE/g in commercial camu camu fruit samples [37]. Similarly, Chirinos et al. (2010) observed varying polyphenolic content among different color stages of camu camu fruit, with concentrations ranging from 12.42 to 15.74 mg GAE/g [38]. Conversely, often overlooked seeds showcased a notably elevated phenolic content of 3.36 mg GAE/g, underscoring their potential as a concentrated source of valuable compounds. Fidelis et al. (2020) extended to seed extracts, documenting values ranging from 6.57 mg GAE/g to 54.20 mg GAE/g [39].
Furthermore, Fracassetti et al. (2013) noted substantial differences in TSP content among various components of camu camu [40]. Specifically, processed derivatives such as flour exhibited a higher concentration of phenolics at 6.73 mg GAE/g, whereas less processed forms like pulp powder contained significantly lower levels at 0.49 mg GAE/g. Despite being rich in phytonutrients, the peel displayed a relatively modest phenolic content of 0.11 mg GAE/g, whereas fresh pulp exhibited 0.09 mg GAE/g. Therefore, this aspect must be taken into account in order to consider the potential of industrialization.
3.3. Storage Stability
3.3.1. Polyphenol Content Stability
This study systematically evaluated the stability of the EAPG-dried CCX and the CCX microencapsulates under various storage conditions. Microcapsules were exposed to diverse relative humidity (0%, 23%, and 56%) and temperatures (4°C and 21°C) over 40 days. An accelerated aging treatment was conducted to assess photo-oxidation stability by subjecting the microcapsules to UV light irradiation. Throughout the study, TSP evolution was monitored for each formulation to indicate storage stability.
The EAPG-dried CCX exhibited a time-dependent reduction in TSP throughout the 40-day storage period (Figure 2A). Significant differences (p < 0.05) were observed among the storage conditions. Microcapsules stored under low humidity and temperature (0% RH, 4°C) displayed the lowest TSP reduction. Conversely, exposure to UV light irradiation or higher relative humidity (23% and 56% RH) and moderate temperature (21°C) substantially reduced TSP. This observation is consistent with prior scientific investigations emphasizing the vulnerability of polyphenols to temperature [41] and photodegradation when exposed to UV light [42] and humidity [43,44].
Regarding the encapsulates, the WPC-CCX 1:1 ratio microparticles (Figure 2B) displayed significant TSP decay across all tested storage conditions throughout the 40 days, although to a lesser extent than EAPG-dried CCX. Conversely, WPC-CCX microparticles at a 2:1 ratio (Figure 2C) demonstrated substantial TSP retention under most conditions, except for the high humidity (56% RH) experiment, where significant differences in TSP decay occurred.
In contrast, ZN-CCX microparticles at both 1:1 and 2:1 ratios (Figure 2D and 2E, respectively) exhibited superior TSP retention under most storage conditions, highlighting the efficiency of ZN in polyphenol protection. However, ZN encapsulation at a 1:1 ratio was seen to be less effective in TSP protection under high humidity, as evidenced by a significant decrease in TSP content at 56% RH. Therefore, the encapsulation with ZN at a 2:1 ratio exhibited the best preservation even under high relative humidity and UV light.
3.3.2. IP-DPPH Storage Stability
The study investigated the stability of the antioxidant activity measured as DPPH inhibition in the EAPG dried CCX and CCX microencapsulates under the studied storage conditions, including exposure to UV light as an accelerated photooxidation treatment (Figure 3).
Under low humidity conditions (0% RH), regardless of temperature, the dried CCX (Figure 3A) showed less than 20% decay in DPPH inhibition over the 40 days. Conversely, exposure to higher humidity levels (23% and 56%) or UV light resulted in a notable decrease in DPPH inhibition, up to approximately 30%. The effect of the high relative humidity and UV light on the stability of the antioxidant activity is consistent with the observations reported for dragon’s blood sap [43] and curcumin [45].
Regarding the formulations of the encapsulates, it was found that the same conditions affected the stability of the antioxidant activity. However, the encapsulant materials helped to decrease the observed decay. The microcapsules with a higher encapsulating material ratio (2:1) offered better protection against degradation compared to those with a lower ratio (1:1). WPC-CCX microcapsules displayed less DPPH inhibition compared to ZN-CCX microcapsules, suggesting that ZN provides better protection against the degradation of antioxidant activity. This is consistent with the stability results for TSP and with a previous work analyzing the stability of Dragon’s blood sap against different storage conditions [31].
3.4. ATR-FTIR Analysis
Attenuated Total Reflection - Fourier Transform Infrared Spectroscopy (ATR-FTIR) analysis of the EAPG dried CCX is shown in Figure 4. The band envelope at ca. 3260 cm⁻¹ is primarily associated with O-H stretching vibrations, a chemical group present in the main bioactive compounds of camu camu such as citric acid, ascorbic acid, or phenolic compounds [46,47], but that may also be associated with residual moisture or the residual ethanol from the extraction process. The band at ca. 2920 cm⁻¹ is attributed to alkyl -C-H stretching vibrations [46]. The band at around 1675 cm⁻¹ is assigned to the carbonyl group [47], a common chemical group in the bioactive compounds prevalent in camu camu [6,48]. The band at ca. 1600 cm⁻¹ is associated with alkenyl groups also characteristic of the main bioactive molecules present in camu camu [49,50]. The spectrum also features a band at ca. 1440 cm⁻¹ linked to -CH deformation and aromatic ring vibrations [51], also characteristics of some of the bioactive molecules of camu camu such as flavonoids and proanthocyanidins [27,36]. The band at around 1338 cm⁻¹ is related to C-C bending vibrations, while the band envelop from 1300 to 1000 cm⁻¹ is associated with C-O stretching vibrations related to ether, esters, and alcohol groups, even aromatic alcohols also present in the characteristic bioactive compounds of camu camu such as ascorbic acid, flavonoids and proanthocyanidins [52]. Lastly, out-of-plane C-H vibrations from 900 to 700 cm⁻¹ provide insights into the aliphatic hydrocarbon composition of the CCX [47,53].
The main characteristic bands of the camu camu dried extract were defined, and ATR-FTIR was used to determine the storage stability of the different formulations. Figure 5 illustrates the ATR-FTIR spectral evolution of the EAPG-dried CCX microparticles after 40 days under the studied storage conditions. Significant changes in the spectrum were primarily observed in the 1800-800 cm⁻¹ wavenumber range, which could indicate CCX degradation. The spectra were maximized to their highest intensity for clearer comparisons to compare relative changes among bands. After a 40-day storage period, the most significant changes in the dried CCX were observed when samples were subjected to high humidity conditions and exposure to UV light (as depicted in Figures 5E and 5F). These were mainly detected in the band envelopes at ca. 1800 - 1600 cm-1 and at ca. 1200-900 cm-1. The first band envelop is ascribed to the carbonyl stretching absorption, which showed a decrease in the number of carboxylic acid groups and an increase in the number of ketone and aldehyde groups, which is aligned with the reported reactions of oxidation of the main bioactive compounds in camu camu such as citric acid, ascorbic acid, flavonoids and proanthocyanidins [54,55,56,57,58]. Regarding the second band envelope at ca. 1200-900 cm-1, this is associated with the stretching vibration of the C-O bond. The observed changes in band position and intensity variation were due to the formation of linear and aromatic ether groups due to the oxidation reactions of the bioactive compounds present in the dried CCX [54,55,56,57,58]
Regarding the encapsulates, Figure 6 and Figure 7 provide the evolution of the ATR-FTIR spectra at the different storage conditions for the system WPC-CCX at 1:1 and 2:1 ratios, respectively. In contrast, Figure 8 and Figure 9 represent the spectra of the system ZN-CCX at 1:1 and 2:1 ratios, respectively. Both encapsulant matrices have a protein nature, and consequently, similar characteristic bands were detected; notably, the band located at ca. 1740 cm-1 ascribed to the trenching vibration of the C=O bond, the band at ca. 1632 cm-1 and at ca. 1520 cm-1 ascribed to the bending vibration of the N-H bond of amides I and II, respectively [59,60].
The ATR-FTIR spectroscopy analysis of WPC-CCX encapsulates revealed small shifts in the spectral evolution. The most significant changes were observed when samples were subjected to high humidity (Figure 6E and Figure 7E) and UV light (Figure 6F and Figure 7F), as an intensity variation in the band envelop between 1600 and 1800 cm-1 as a consequence of the formation of aldehydes, ketones, and esters as oxidation products of the bioactive compounds of camu camu [54,55,56,57,58], and a small decrease in the band associated to the secondary amine at ca 1520 cm-1, probably due to a slight degradation of the protein. The band envelope between 1200 and 900 cm-1 did not show significant differences, probably because the changes in the spectra might be hidden by the bands of the protein. No significant differences were detected for the ratios studied.
The spectral evolution of ATR-FTIR for ZN-CCX encapsulates at 1:1 and 2:1 encapsulation ratios is shown in Figure 8 and Figure 9, respectively. After 40 days of experimentation, slight changes become discernible at high relative humidity and under UV light radiation. Main variations were detected in the 1800-1600 cm-1 band envelope as a consequence of the increase of aldehyde and ketone as ester groups due to the progression of the oxidation reactions [54,55,56,57,58] and a slight decrease in intensity in the band related to the amide II of the protein. The band envelope between 1200 and 900 cm-1 did not show significant differences, probably because the changes in the spectra might be hidden by the bands of the protein. The ZN-CCX 2:1 encapsulation ratio (Figure 9) exhibits fewer changes than the 1:1 encapsulates, results that agree with the observations made in previous sections.
4. Conclusions
This study demonstrates for the first time the impact on stability of the electrohydrodynamic EAPG technique to dry or to encapsulate camu camu extract (CCX) at room temperature. The resulting microparticles exhibit favorable attributes for application in food products, effectively preserving the bioactive properties of CCX and maintaining consistent levels of total soluble polyphenols (TSP) and antioxidant activity (DPPH Inhibition). The comparative analysis conducted in this study demonstrates the superior effectiveness of the encapsulates, especially of ZN as an encapsulation material compared to WPC, in protecting the bioactive properties of camu camu when subjected to challenging storage conditions. The encapsulation system with a 2:1 ratio also demonstrated a markedly reduced degree of degradation compared to its 1:1 counterpart, particularly in environments with high humidity and UV light exposure. Considering the outcome of this work, it is possible to state that the EAPG technique stands out as a versatile and promising approach for creating small particle size and size distribution powders and encapsulated powders of camu-camu. The obtained results show the potential of this technology to positively impact the existing drying and encapsulation procedures, establishing a new standard to guarantee the stability and effectiveness of bioactive compounds across various applications, such as functional foods, cosmetics, agricultural inputs, or nutraceutical products.
Author Contributions
conceptualization: J.D.E.-G., C.P. and J.M.L.; methodology: J.D.E.-G., E.T., C.P. and J.M.L.; validation: C.P. and J.M.L.; formal analysis: J.D.E.-G.; investigation: J.D.E.-G., E.T. and C.P.; resources: J.M.L.; data curation: J.D.E.-G., C.P. and J.M.L.; writing—original draft preparation: J.D.E.-G.; writing—review and editing: C.P.; supervision: C.P., E.T. and J.M.L.; project administration: J.M.L.; funding acquisition: J.M.L. All authors have read and agreed to the published version of the manuscript
Funding
This research was funded by the Valencian Innovation Agency (AVI) BIOENCAP project (reference number INNCAD00-18-31), H2020 EU FODIAC project (reference number 778388), and the H2020 EU projects CAPSULTEK (reference number 873827), grant PID2021-128749OB-C31 funded by MCIN/AEI/10.13039/501100011033 and by ERDF A way of making Europe.
Data Availability Statement
Data is contained within the article.
Acknowledgments
J.D.E.G. would like to thank the Spanish Ministry of Economy, Industry, and Competitivity for his predoctoral grant (DI-6906). C.P. would like to thank the Valencian Ministry of Innovation, Universities, Science and Digital Society for her postdoctoral grant (CIAPOS/2021/45). The Accreditation as Center of Excellence Severo Ochoa CEX2021-001189-S funded by MCIU/AEI/10.13039/501100011033 is also fully acknowledged. The authors thank Alberto Rodríguez Escrivá and Alexandra Sánchez for their technical assistance.
Conflicts of Interest
The authors declare no conflict of interest.
Sample Availability
Samples of the compounds could be available from the authors on request.
References
- Alu’datt, M.H.; Alrosan, M.; Gammoh, S.; Tranchant, C.C.; Alhamad, M.N.; Rababah, T.; Zghoul, R.; Alzoubi, H.; Ghatasheh, S.; Ghozlan, K.; et al. Encapsulation-Based Technologies for Bioactive Compounds and Their Application in the Food Industry: A Roadmap for Food-Derived Functional and Health-Promoting Ingredients. Food Biosci 2022, 50. [Google Scholar] [CrossRef]
- Marcillo-Parra, V.; Tupuna-Yerovi, D.S.; González, Z.; Ruales, J. Encapsulation of Bioactive Compounds from Fruit and Vegetable By-Products for Food Application – A Review. Trends Food Sci Technol 2021, 116. [Google Scholar] [CrossRef]
- Thakur, M.; Singh, K.; Khedkar, R. Phytochemicals: Extraction Process, Safety Assessment, Toxicological Evaluations, and Regulatory Issues. Functional and Preservative Properties of Phytochemicals 2020, 341–361. [Google Scholar] [CrossRef]
- Santos, I.L.; Miranda, L.C.F.; da Cruz Rodrigues, A.M.; da Silva, L.H.M.; Amante, E.R. Camu-Camu [Myrciaria Dubia (HBK) McVaugh]: A Review of Properties and Proposals of Products for Integral Valorization of Raw Material. Food Chem 2022, 372. [Google Scholar] [CrossRef] [PubMed]
- Castro, J.C.; Maddox, J.D.; Cobos, M.; Imán, S.A. Myrciaria Dubia “Camu Camu” Fruit: Health-Promoting Phytochemicals and Functional Genomic Characteristics. In Breeding and Health Benefits of Fruit and Nut Crops; InTech, 2018. [Google Scholar]
- Akter, M.S.; Oh, S.; Eun, J.B.; Ahmed, M. Nutritional Compositions and Health Promoting Phytochemicals of Camu-Camu (Myrciaria Dubia) Fruit: A Review. Food Research International 2011, 44, 1728–1732. [Google Scholar] [CrossRef]
- Fujita, A.; Sarkar, D.; Genovese, M.I.; Shetty, K. Improving Anti-Hyperglycemic and Anti-Hypertensive Properties of Camu-Camu (Myriciaria Dubia Mc. Vaugh) Using Lactic Acid Bacterial Fermentation. Process Biochemistry 2017, 59, 133–140. [Google Scholar] [CrossRef]
- Fracassetti, D.; Costa, C.; Moulay, L.; Tomás-Barberán, F.A. Ellagic Acid Derivatives, Ellagitannins, Proanthocyanidins and Other Phenolics, Vitamin C and Antioxidant Capacity of Two Powder Products from Camu-Camu Fruit (Myrciaria Dubia). Food Chem 2013, 139, 578–588. [Google Scholar] [CrossRef]
- Carmo, M.A.V. do; Fidelis, M.; Pressete, C.G.; Marques, M.J.; Castro-Gamero, A.M.; Myoda, T.; Granato, D.; Azevedo, L. Hydroalcoholic Myrciaria Dubia (Camu-Camu) Seed Extracts Prevent Chromosome Damage and Act as Antioxidant and Cytotoxic Agents. Food Research International 2019, 125, 108551. [Google Scholar] [CrossRef]
- Miyashita, T.; Koizumi, R.; Myoda, T.; Sagane, Y.; Niwa, K.; Watanabe, T.; Minami, K. Data on a Single Oral Dose of Camu Camu (Myrciaria Dubia) Pericarp Extract on Flow-Mediated Vasodilation and Blood Pressure in Young Adult Humans. Data Brief 2018, 16, 993–999. [Google Scholar] [CrossRef]
- Fidelis, M.; Santos, J.S.; Escher, G.B.; Vieira do Carmo, M.; Azevedo, L.; Cristina da Silva, M.; Putnik, P.; Granato, D. In Vitro Antioxidant and Antihypertensive Compounds from Camu-Camu (Myrciaria Dubia McVaugh, Myrtaceae) Seed Coat: A Multivariate Structure-Activity Study. Food and Chemical Toxicology 2018, 120, 479–490. [Google Scholar] [CrossRef] [PubMed]
- Inoue, T.; Komoda, H.; Uchida, T.; Node, K. Tropical Fruit Camu-Camu (Myrciaria Dubia) Has Anti-Oxidative and Anti-Inflammatory Properties. J Cardiol 2008, 52, 127–132. [Google Scholar] [CrossRef]
- Anhê, F.F.; Nachbar, R.T.; Varin, T. v.; Trottier, J.; Dudonné, S.; le Barz, M.; Feutry, P.; Pilon, G.; Barbier, O.; Desjardins, Y.; et al. Treatment with Camu Camu (Myrciaria Dubia) Prevents Obesity by Altering the Gut Microbiota and Increasing Energy Expenditure in Diet-Induced Obese Mice. Gut 2019, 68, 453–464. [Google Scholar] [CrossRef]
- de Azevêdo, J.C.S.; Fujita, A.; de Oliveira, E.L.; Genovese, M.I.; Correia, R.T.P. Dried Camu-Camu (Myrciaria Dubia H.B.K. McVaugh) Industrial Residue: A Bioactive-Rich Amazonian Powder with Functional Attributes. Food Research International 2014, 62, 934–940. [Google Scholar] [CrossRef]
- Fujita, A.; Sarkar, D.; Wu, S.; Kennelly, E.; Shetty, K.; Genovese, M.I. Evaluation of Phenolic-Linked Bioactives of Camu-Camu (Myrciaria Dubia Mc. Vaugh) for Antihyperglycemia, Antihypertension, Antimicrobial Properties and Cellular Rejuvenation. Food Research International 2015, 77, 194–203. [Google Scholar] [CrossRef]
- Christensen, L.P. The Role of Direct and Indirect Polyphenolic Antioxidants in Protection against Oxidative Stress, 2nd ed.; Elsevier Inc., 2018; ISBN 9780128130063. [Google Scholar]
- Dahiya, D.; Terpou, A.; Dasenaki, M.; Nigam, P.S. Current Status and Future Prospects of Bioactive Molecules Delivered through Sustainable Encapsulation Techniques for Food Fortification. Sustainable Food Technology 2023, 1, 500–510. [Google Scholar] [CrossRef]
- De Mello Andrade, J.M.; Fasolo, D. Polyphenol Antioxidants from Natural Sources and Contribution to Health Promotion; Elsevier Inc., 2013; Vol. 1, ISBN 9780123984562. [Google Scholar]
- Raddatz, G.C.; de Menezes, C.R. Microencapsulation and Co-Encapsulation of Bioactive Compounds for Application in Food: Challenges and Perspectives. Ciência Rural 2021, 51, 1–8. [Google Scholar] [CrossRef]
- Zuidam, N.J.; Nedović, V.A. Encapsulation Technologies for Active Food Ingredients and Food Processing. Encapsulation Technologies for Active Food Ingredients and Food Processing 2010, 1–400. [Google Scholar] [CrossRef]
- Veršič, R.J. Inventing and Using Controlled-Release Technologies. Microencapsulation in the Food Industry 2014, 551–555. [Google Scholar] [CrossRef]
- Sobel, R.; Versic, R.; Gaonkar, A.G. Introduction to Microencapsulation and Controlled Delivery in Foods. In Microencapsulation in the Food Industry; 2014. [Google Scholar]
- Shafaei, Z.; Ghalandari, B.; Divsalar, A.; Saboury, A.A. Controlled Release Nutrition Delivery Based Intelligent and Targeted Nanoparticle; Elsevier Inc., 2017; ISBN 9780128043042. [Google Scholar]
- Guldiken, B.; Gulsunoglu, Z.; Bakir, S.; Catalkaya, G.; Capanoglu, E.; Nickerson, M. Innovations in Functional Foods Development. Food Technology Disruptions 2021, 73–130. [Google Scholar] [CrossRef]
- Fujita, A.; Sarkar, D.; Wu, S.; Kennelly, E.; Shetty, K.; Genovese, M.I. Evaluation of Phenolic-Linked Bioactives of Camu-Camu (Myrciaria Dubia Mc. Vaugh) for Antihyperglycemia, Antihypertension, Antimicrobial Properties and Cellular Rejuvenation. Food Research International 2015, 77, 194–203. [Google Scholar] [CrossRef]
- de Abreu Figueiredo, J.; Andrade Teixeira, M.; Henrique Campelo, P.; Maria Teixeira Lago, A.; Pereira de Souza, T.; Irene Yoshida, M.; Rodrigues de Oliveira, C.; Paula Aparecida Pereira, A.; Maria Pastore, G.; Aparecido Sanches, E.; et al. Encapsulation of Camu-Camu Extracts Using Prebiotic Biopolymers: Controlled Release of Bioactive Compounds and Effect on Their Physicochemical and Thermal Properties. Food Research International 2020, 137. [Google Scholar] [CrossRef] [PubMed]
- García-Chacón, J.M.; Rodríguez-Pulido, F.J.; Heredia, F.J.; González-Miret, M.L.; Osorio, C. Characterization and Bioaccessibility Assessment of Bioactive Compounds from Camu-Camu (Myrciaria Dubia) Powders and Their Food Applications. Food Research International 2024, 176. [Google Scholar] [CrossRef]
- Gómez-Mascaraque, L.G.; Lopez-Rubio, A. Production of Food Bioactive-Loaded Nanoparticles by Electrospraying. Nanoencapsulation of Food Ingredients by Specialized Equipment: Volume 3 in the Nanoencapsulation in the Food Industry series 2019, 107–149. [CrossRef]
- Busolo, M.A.; Torres-Giner, S.; Prieto, C.; Lagaron, J.M. Electrospraying Assisted by Pressurized Gas as an Innovative High-Throughput Process for the Microencapsulation and Stabilization of Docosahexaenoic Acid-Enriched Fish Oil in Zein Prolamine. Innovative Food Science and Emerging Technologies 2019, 51, 12–19. [Google Scholar] [CrossRef]
- Escobar-García, J.D.; Prieto, C.; Pardo-Figuerez, M.; Lagaron, J.M. Room Temperature Nanoencapsulation of Bioactive Eicosapentaenoic Acid Rich Oil within Whey Protein Microparticles. Nanomaterials 2021, 11, 1–16. [Google Scholar] [CrossRef] [PubMed]
- Escobar-García, J.D.; Prieto, C.; Pardo-Figuerez, M.; Lagaron, J.M. Dragon’s Blood Sap Microencapsulation within Whey Protein Concentrate and Zein Using Electrospraying Assisted by Pressurized Gas Technology. Molecules 2023, 28. [Google Scholar] [CrossRef] [PubMed]
- Jeevani, M.M.; Wijekoon, O.; Mahmood, K.; Ariffin, F.; Nafchi, A.M.; Zulkurnain, M. Recent Advances in Encapsulation of Fat-Soluble Vitamins Using Polysaccharides, Proteins, and Lipids: A Review on Delivery Systems, Formulation, and Industrial Applications. Int J Biol Macromol 2023, 241, 124539. [Google Scholar] [CrossRef]
- Singleton, V.L.; Rossi, J.A. Colorimetry of Total Phenolics with Phosphomolybdic-Phosphotungstic Acid Reagent. Am. J. Enol. Vitic. 1965, 16, 144–158. [Google Scholar] [CrossRef]
- A Figueiredo, J.; MT Lago, A.; M Mar, J.; S Silva, L.; A Sanches, E.; P Souza, T.; A Bezerra, J.; H Campelo, P.; A Botrel, D.; V Borges, S. Stability of Camu-Camu Encapsulated with Different Prebiotic Biopolymers. J Sci Food Agric 2020, 100, 3471–3480. [Google Scholar] [CrossRef]
- Fidelis, M.; do Carmo, M.A.V.; da Cruz, T.M.; Azevedo, L.; Myoda, T.; Miranda Furtado, M.; Boscacci Marques, M.; Sant’Ana, A.S.; Inês Genovese, M.; Young Oh, W.; et al. Camu-Camu Seed (Myrciaria Dubia) – From Side Stream to an Antioxidant, Antihyperglycemic, Antiproliferative, Antimicrobial, Antihemolytic, Anti-Inflammatory, and Antihypertensive Ingredient. Food Chem 2020, 310. [Google Scholar] [CrossRef]
- Grigio, M.L.; de Moura, E.A.; Chagas, E.A.; Durigan, M.F.B.; Chagas, P.C.; de Carvalho, G.F.; Zanchetta, J.J. Bioactive Compounds in and Antioxidant Activity of Camu-Camu Fruits Harvested at Different Maturation Stages during Postharvest Storage. Acta Sci Agron 2021, 43. [Google Scholar] [CrossRef]
- Genovese, M.I.; Da Silva Pinto, M.; De Souza Schmidt Gonçalves, A.E.; Lajolo, F.M. Bioactive Compounds and Antioxidant Capacity of Exotic Fruits and Commercial Frozen Pulps from Brazil. Food Science and Technology International 2008, 14, 207–214. [Google Scholar] [CrossRef]
- Chirinos, R.; Galarza, J.; Betalleluz-Pallardel, I.; Pedreschi, R.; Campos, D. Antioxidant Compounds and Antioxidant Capacity of Peruvian Camu Camu (Myrciaria Dubia (H.B.K.) McVaugh) Fruit at Different Maturity Stages. Food Chem 2010, 120, 1019–1024. [Google Scholar] [CrossRef]
- Fidelis, M.; de Oliveira, S.M.; Sousa Santos, J.; Bragueto Escher, G.; Silva Rocha, R.; Gomes Cruz, A.; Araújo Vieira do Carmo, M.; Azevedo, L.; Kaneshima, T.; Oh, W.Y.; et al. From Byproduct to a Functional Ingredient: Camu-Camu (Myrciaria Dubia) Seed Extract as an Antioxidant Agent in a Yogurt Model. J Dairy Sci 2020, 103, 1131–1140. [Google Scholar] [CrossRef]
- Fracassetti, D.; Costa, C.; Moulay, L.; Tomás-Barberán, F.A. Ellagic Acid Derivatives, Ellagitannins, Proanthocyanidins and Other Phenolics, Vitamin C and Antioxidant Capacity of Two Powder Products from Camu-Camu Fruit (Myrciaria Dubia). Food Chem 2013, 139, 578–588. [Google Scholar] [CrossRef]
- Alean, J.; Chejne, F.; Rojano, B. Degradation of Polyphenols during the Cocoa Drying Process. J Food Eng 2016, 189, 99–105. [Google Scholar] [CrossRef]
- Lavelli, V.; Sri Harsha, P.S.C.; Laureati, M.; Pagliarini, E. Degradation Kinetics of Encapsulated Grape Skin Phenolics and Micronized Grape Skins in Various Water Activity Environments and Criteria to Develop Wide-Ranging and Tailor-Made Food Applications. Innovative Food Science & Emerging Technologies 2017, 39, 156–164. [Google Scholar] [CrossRef]
- Escobar, J.D.; Prieto, C.; Pardo-Figuerez, M.; Lagaron, J.M. Dragon’s Blood Sap: Storage Stability and Antioxidant Activity. Molecules 2018, 23. [Google Scholar] [CrossRef] [PubMed]
- Moratalla-López, N.; Lorenzo, C.; Chaouqi, S.; Sánchez, A.M.; Alonso, G.L. Kinetics of Polyphenol Content of Dry Flowers and Floral Bio-Residues of Saffron at Different Temperatures and Relative Humidity Conditions. Food Chem 2019, 290, 87–94. [Google Scholar] [CrossRef]
- Niu, Y.; Ke, D.; Yang, Q.; Wang, X.; Chen, Z.; An, X.; Shen, W. Temperature-Dependent Stability and DPPH Scavenging Activity of Liposomal Curcumin at PH 7. 0. Food Chem 2012, 135, 1377–1382. [Google Scholar] [CrossRef] [PubMed]
- Bensemmane, N.; Bouzidi, N.; Daghbouche, Y.; Garrigues, S.; de la Guardia, M.; Hattab, M. El Prediction of Total Phenolic Acids Contained in Plant Extracts by PLS-ATR-FTIR. South African Journal of Botany 2022, 151, 295–305. [Google Scholar] [CrossRef]
- Merlic, C.A. IR Absorption Table 2012.
- Santos, I.L.; Miranda, L.C.F.; da Cruz Rodrigues, A.M.; da Silva, L.H.M.; Amante, E.R. Camu-Camu [Myrciaria Dubia (HBK) McVaugh]: A Review of Properties and Proposals of Products for Integral Valorization of Raw Material. Food Chem 2022, 372, 131290. [Google Scholar] [CrossRef] [PubMed]
- Zanatta, C.F.; Cuevas, E.; Bobbio, F.O.; Winterhalter, P.; Mercadante, A.Z. Determination of Anthocyanins from Camu-Camu (Myrciaria Dubia) by HPLC-PDA, HPLC-MS, and NMR. J Agric Food Chem 2005, 53, 9531–9535. [Google Scholar] [CrossRef]
- Abbas, O.; Compère, G.; Larondelle, Y.; Pompeu, D.; Rogez, H.; Baeten, V. Phenolic Compound Explorer: A Mid-Infrared Spectroscopy Database. Vib Spectrosc 2017, 92, 111–118. [Google Scholar] [CrossRef]
- Ping, L.; Pizzi, A.; Guo, Z.D.; Brosse, N. Condensed Tannins from Grape Pomace: Characterization by FTIR and MALDI TOF and Production of Environment Friendly Wood Adhesive. Ind Crops Prod 2012, 40, 13–20. [Google Scholar] [CrossRef]
- Schulz, H.; Baranska, M. Identification and Quantification of Valuable Plant Substances by IR and Raman Spectroscopy. Vib Spectrosc 2007, 43, 13–25. [Google Scholar] [CrossRef]
- de Abreu Figueiredo, J.; Andrade Teixeira, M.; Henrique Campelo, P.; Maria Teixeira Lago, A.; Pereira de Souza, T.; Irene Yoshida, M.; Rodrigues de Oliveira, C.; Paula Aparecida Pereira, A.; Maria Pastore, G.; Aparecido Sanches, E.; et al. Encapsulation of Camu-Camu Extracts Using Prebiotic Biopolymers: Controlled Release of Bioactive Compounds and Effect on Their Physicochemical and Thermal Properties. Food Research International 2020, 137, 109563. [Google Scholar] [CrossRef]
- Dangles, O.; Fenger, J.A. The Chemical Reactivity of Anthocyanins and Its Consequences in Food Science and Nutrition. Molecules 2018, 23. [Google Scholar] [CrossRef]
- Kuyper, A.C. The Oxidation of Citric Acid. J Am Chem Soc 1933, 55, 1722–1727. [Google Scholar] [CrossRef]
- Speisky, H.; Shahidi, F.; Costa de Camargo, A.; Fuentes, J. Revisiting the Oxidation of Flavonoids: Loss, Conservation or Enhancement of Their Antioxidant Properties. Antioxidants 2022, 11, 133. [Google Scholar] [CrossRef] [PubMed]
- Tu, Y.-J.; Njus, D.; Schlegel, H.B. A Theoretical Study of Ascorbic Acid Oxidation and HOO ˙/ O 2 ˙ − Radical Scavenging. Org Biomol Chem 2017, 15, 4417–4431. [Google Scholar] [CrossRef]
- Karonen, M.; Imran, I. Bin; Engström, M.T.; Salminen, J.P. Characterization of Natural and Alkaline-Oxidized Proanthocyanidins in Plant Extracts by Ultrahigh-Resolution UHPLC-MS/MS. Molecules 2021, 26. [Google Scholar] [CrossRef] [PubMed]
- He, Z.; Xu, M.; Zeng, M.; Qin, F.; Chen, J. Interactions of Milk α- And β-Casein with Malvidin-3-O-Glucoside and Their Effects on the Stability of Grape Skin Anthocyanin Extracts. Food Chem 2016, 199, 314–322. [Google Scholar] [CrossRef] [PubMed]
- Andrade, J.; Pereira, C.G.; Almeida Junior, J.C. de; Viana, C.C.R.; Neves, L.N. de O.; Silva, P.H.F. da; Bell, M.J.V.; Anjos, V. de C. dos FTIR-ATR Determination of Protein Content to Evaluate Whey Protein Concentrate Adulteration. LWT 2019, 99, 166–172. [Google Scholar] [CrossRef]
Figure 1.
SEM micrographs of dried CCX structures. (A) The neat CCX dried using the EAPG process. (B) WPC—CCX 1:1 w/w; (C) WPC—CCX 2:1 w/w; (D) ZN—CCX 1:1 w/w; (E) ZN—CCX 2:1 w/w. The scale bar corresponds to 30 µm.
Figure 1.
SEM micrographs of dried CCX structures. (A) The neat CCX dried using the EAPG process. (B) WPC—CCX 1:1 w/w; (C) WPC—CCX 2:1 w/w; (D) ZN—CCX 1:1 w/w; (E) ZN—CCX 2:1 w/w. The scale bar corresponds to 30 µm.
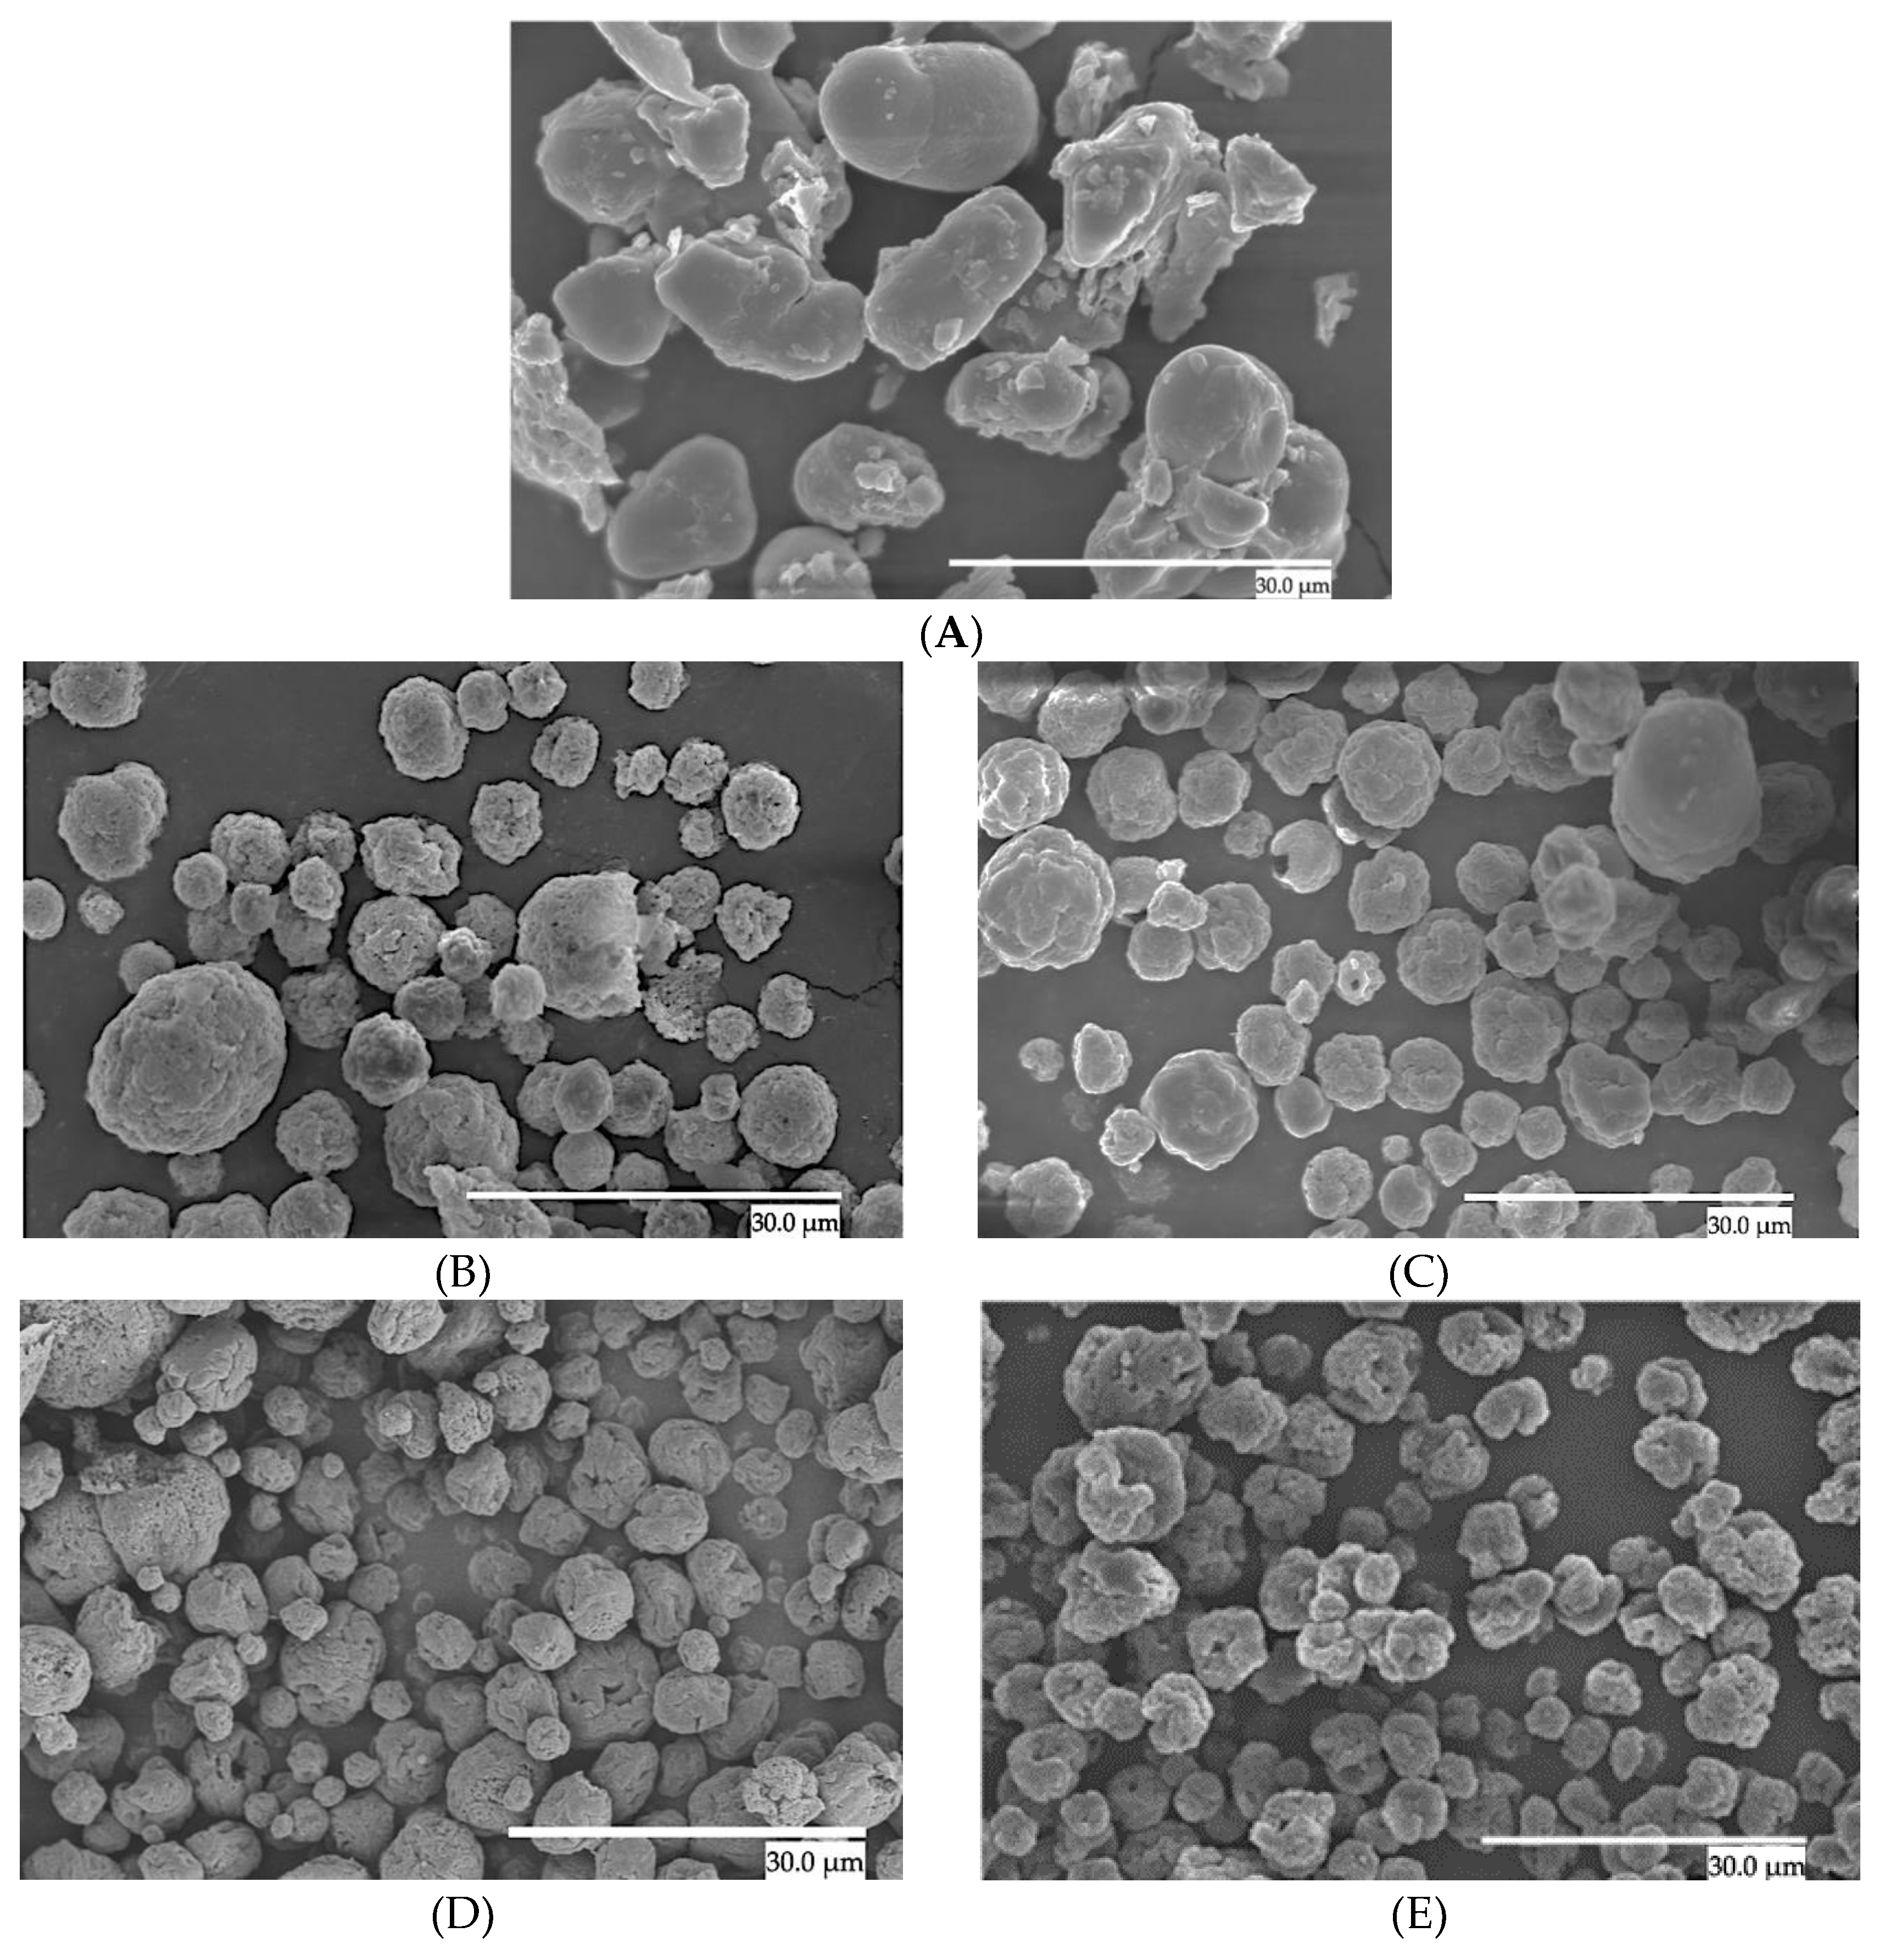
Figure 2.
Evolution of the TSP Decay of CCX EAPG-derived microcapsules over 40 days under diverse storage conditions. (A) EAPG dried CCX; (B) WPC—CCX 1:1 w/w; (C) WPC—CCX 2:1 w/w; (D) ZN—CCX 1:1 w/w; (E) ZN—CCX 2:1 w/w.
Figure 2.
Evolution of the TSP Decay of CCX EAPG-derived microcapsules over 40 days under diverse storage conditions. (A) EAPG dried CCX; (B) WPC—CCX 1:1 w/w; (C) WPC—CCX 2:1 w/w; (D) ZN—CCX 1:1 w/w; (E) ZN—CCX 2:1 w/w.
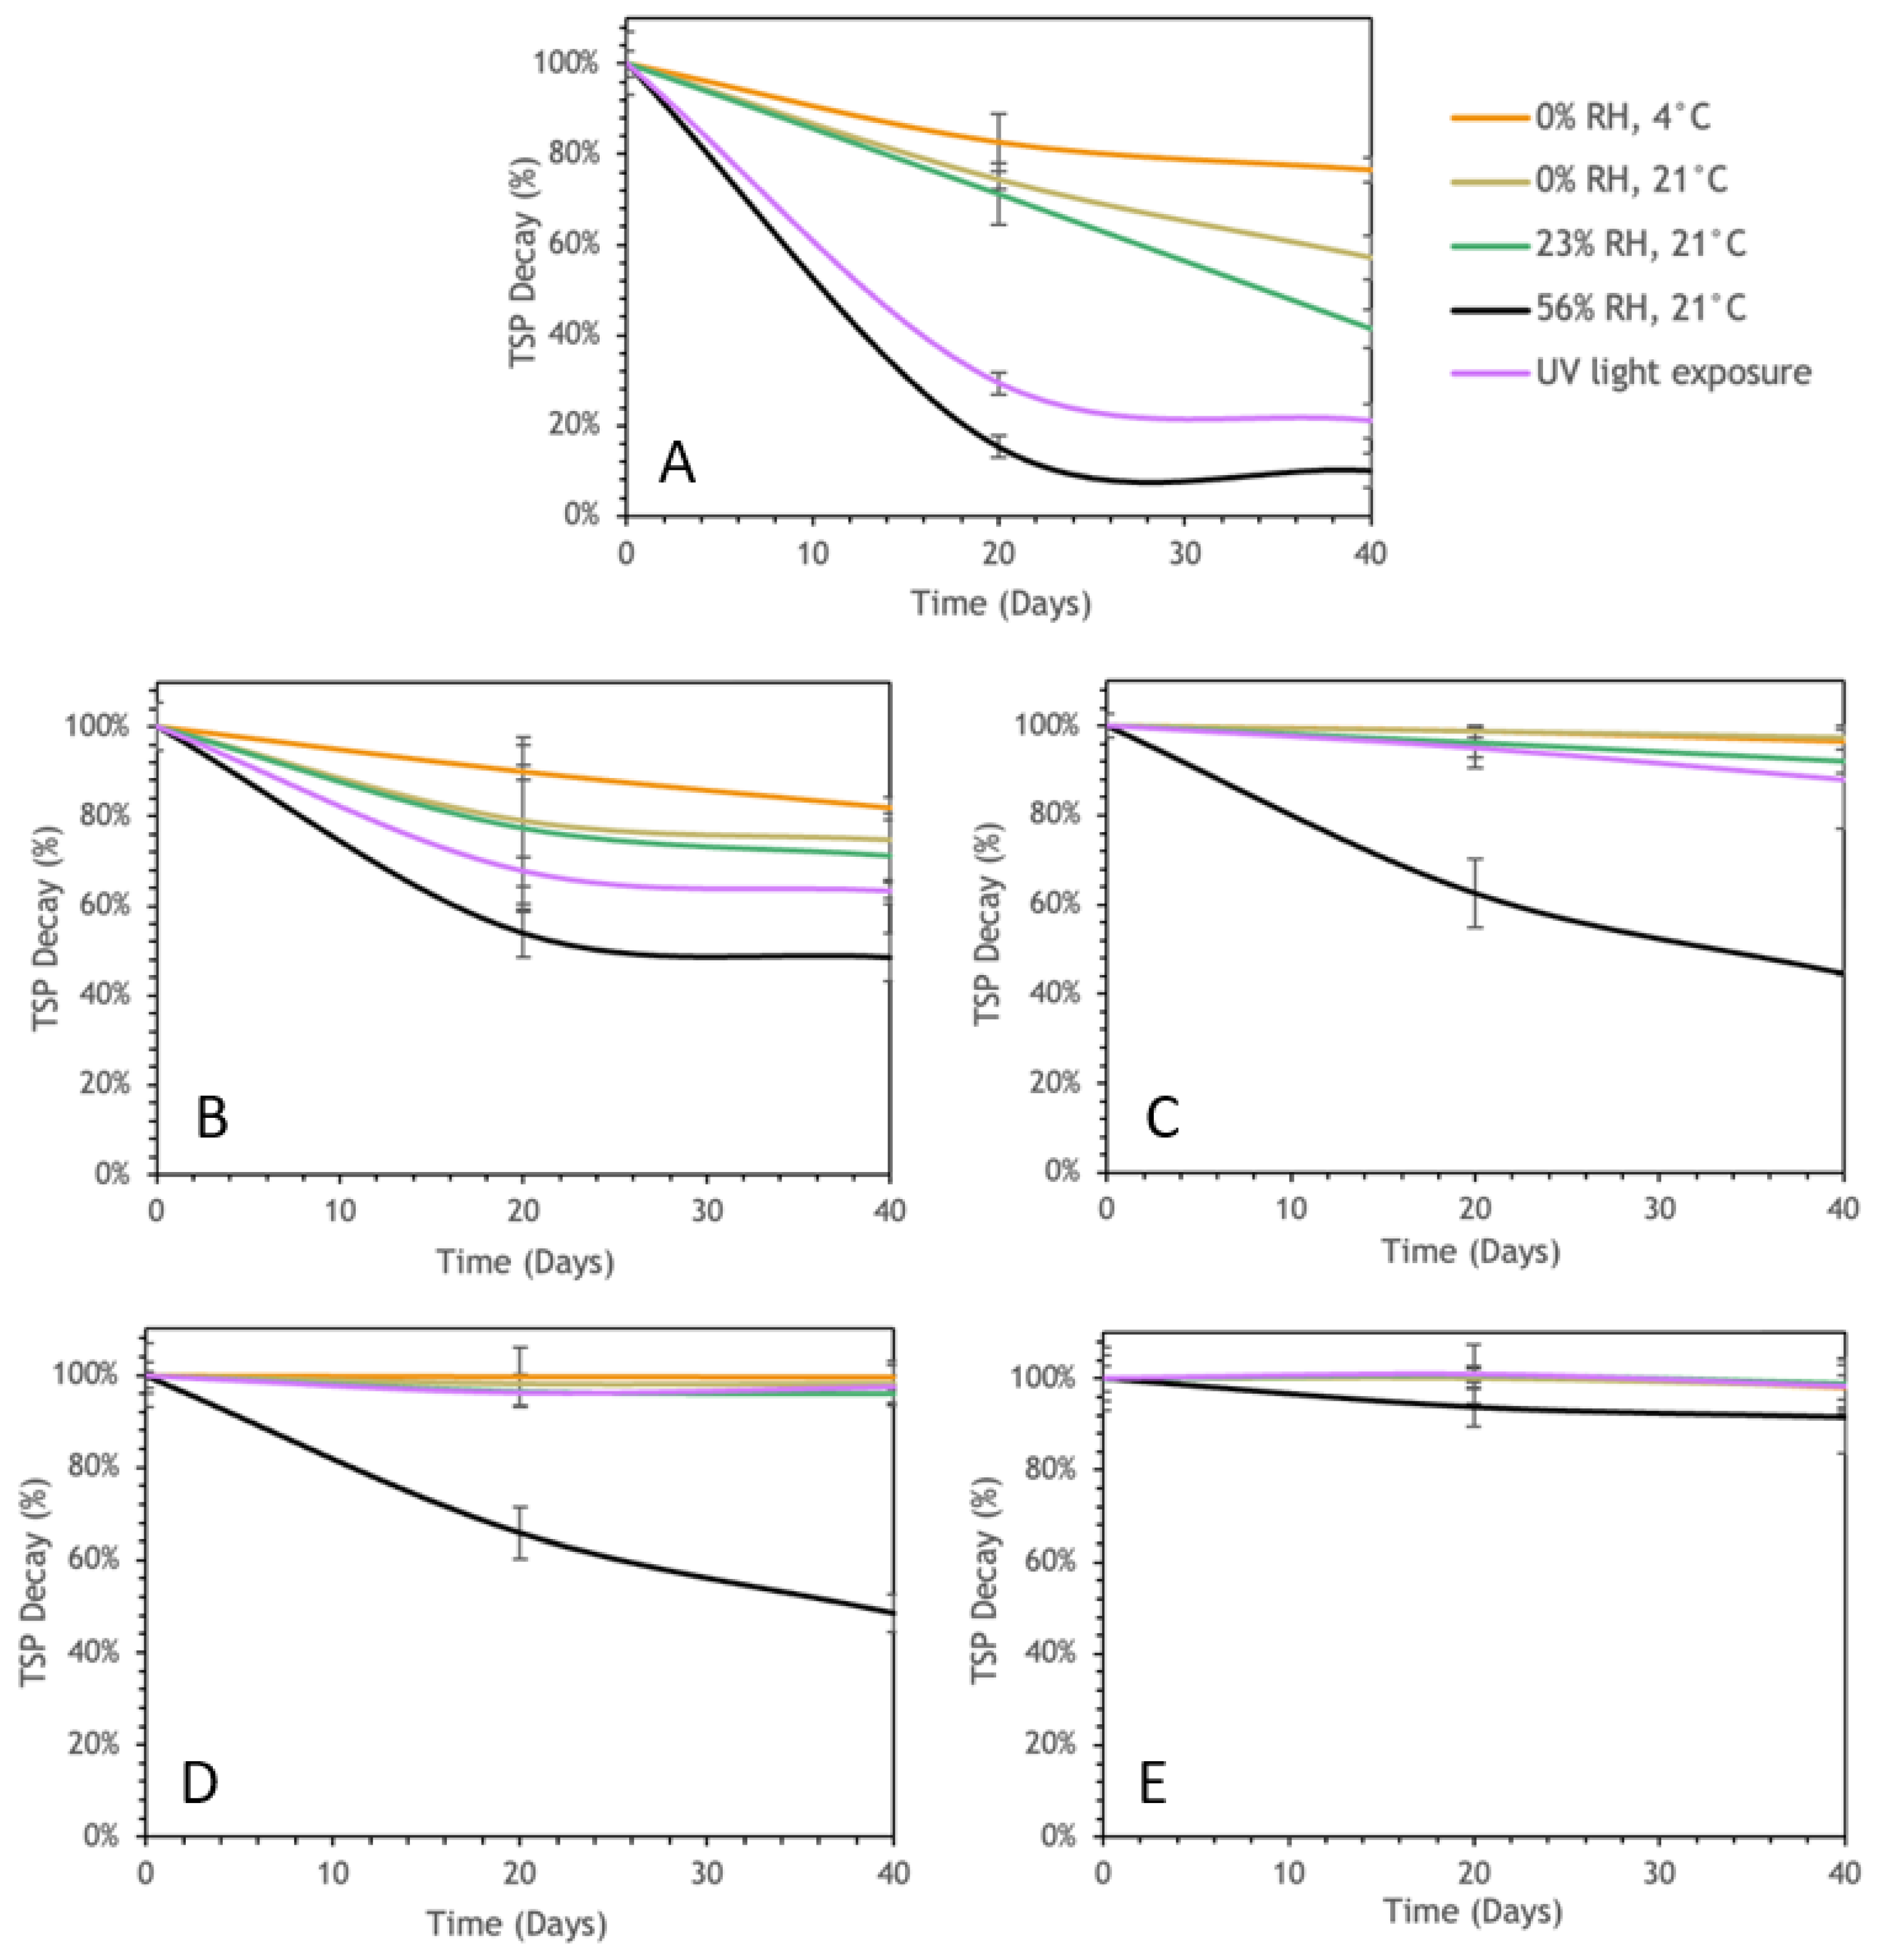
Figure 3.
Evolution of the DPPH inhibition Decay of CCX EAPG-derived microcapsules over 40 days under diverse storage conditions. (A) Non-encapsulated CCX; (B) WPC—CCX 1:1 w/w; (C) WPC—CCX 2:1 w/w; (D) ZN—CCX 1:1 w/w; (E) ZN—CCX 2:1 w/w.
Figure 3.
Evolution of the DPPH inhibition Decay of CCX EAPG-derived microcapsules over 40 days under diverse storage conditions. (A) Non-encapsulated CCX; (B) WPC—CCX 1:1 w/w; (C) WPC—CCX 2:1 w/w; (D) ZN—CCX 1:1 w/w; (E) ZN—CCX 2:1 w/w.
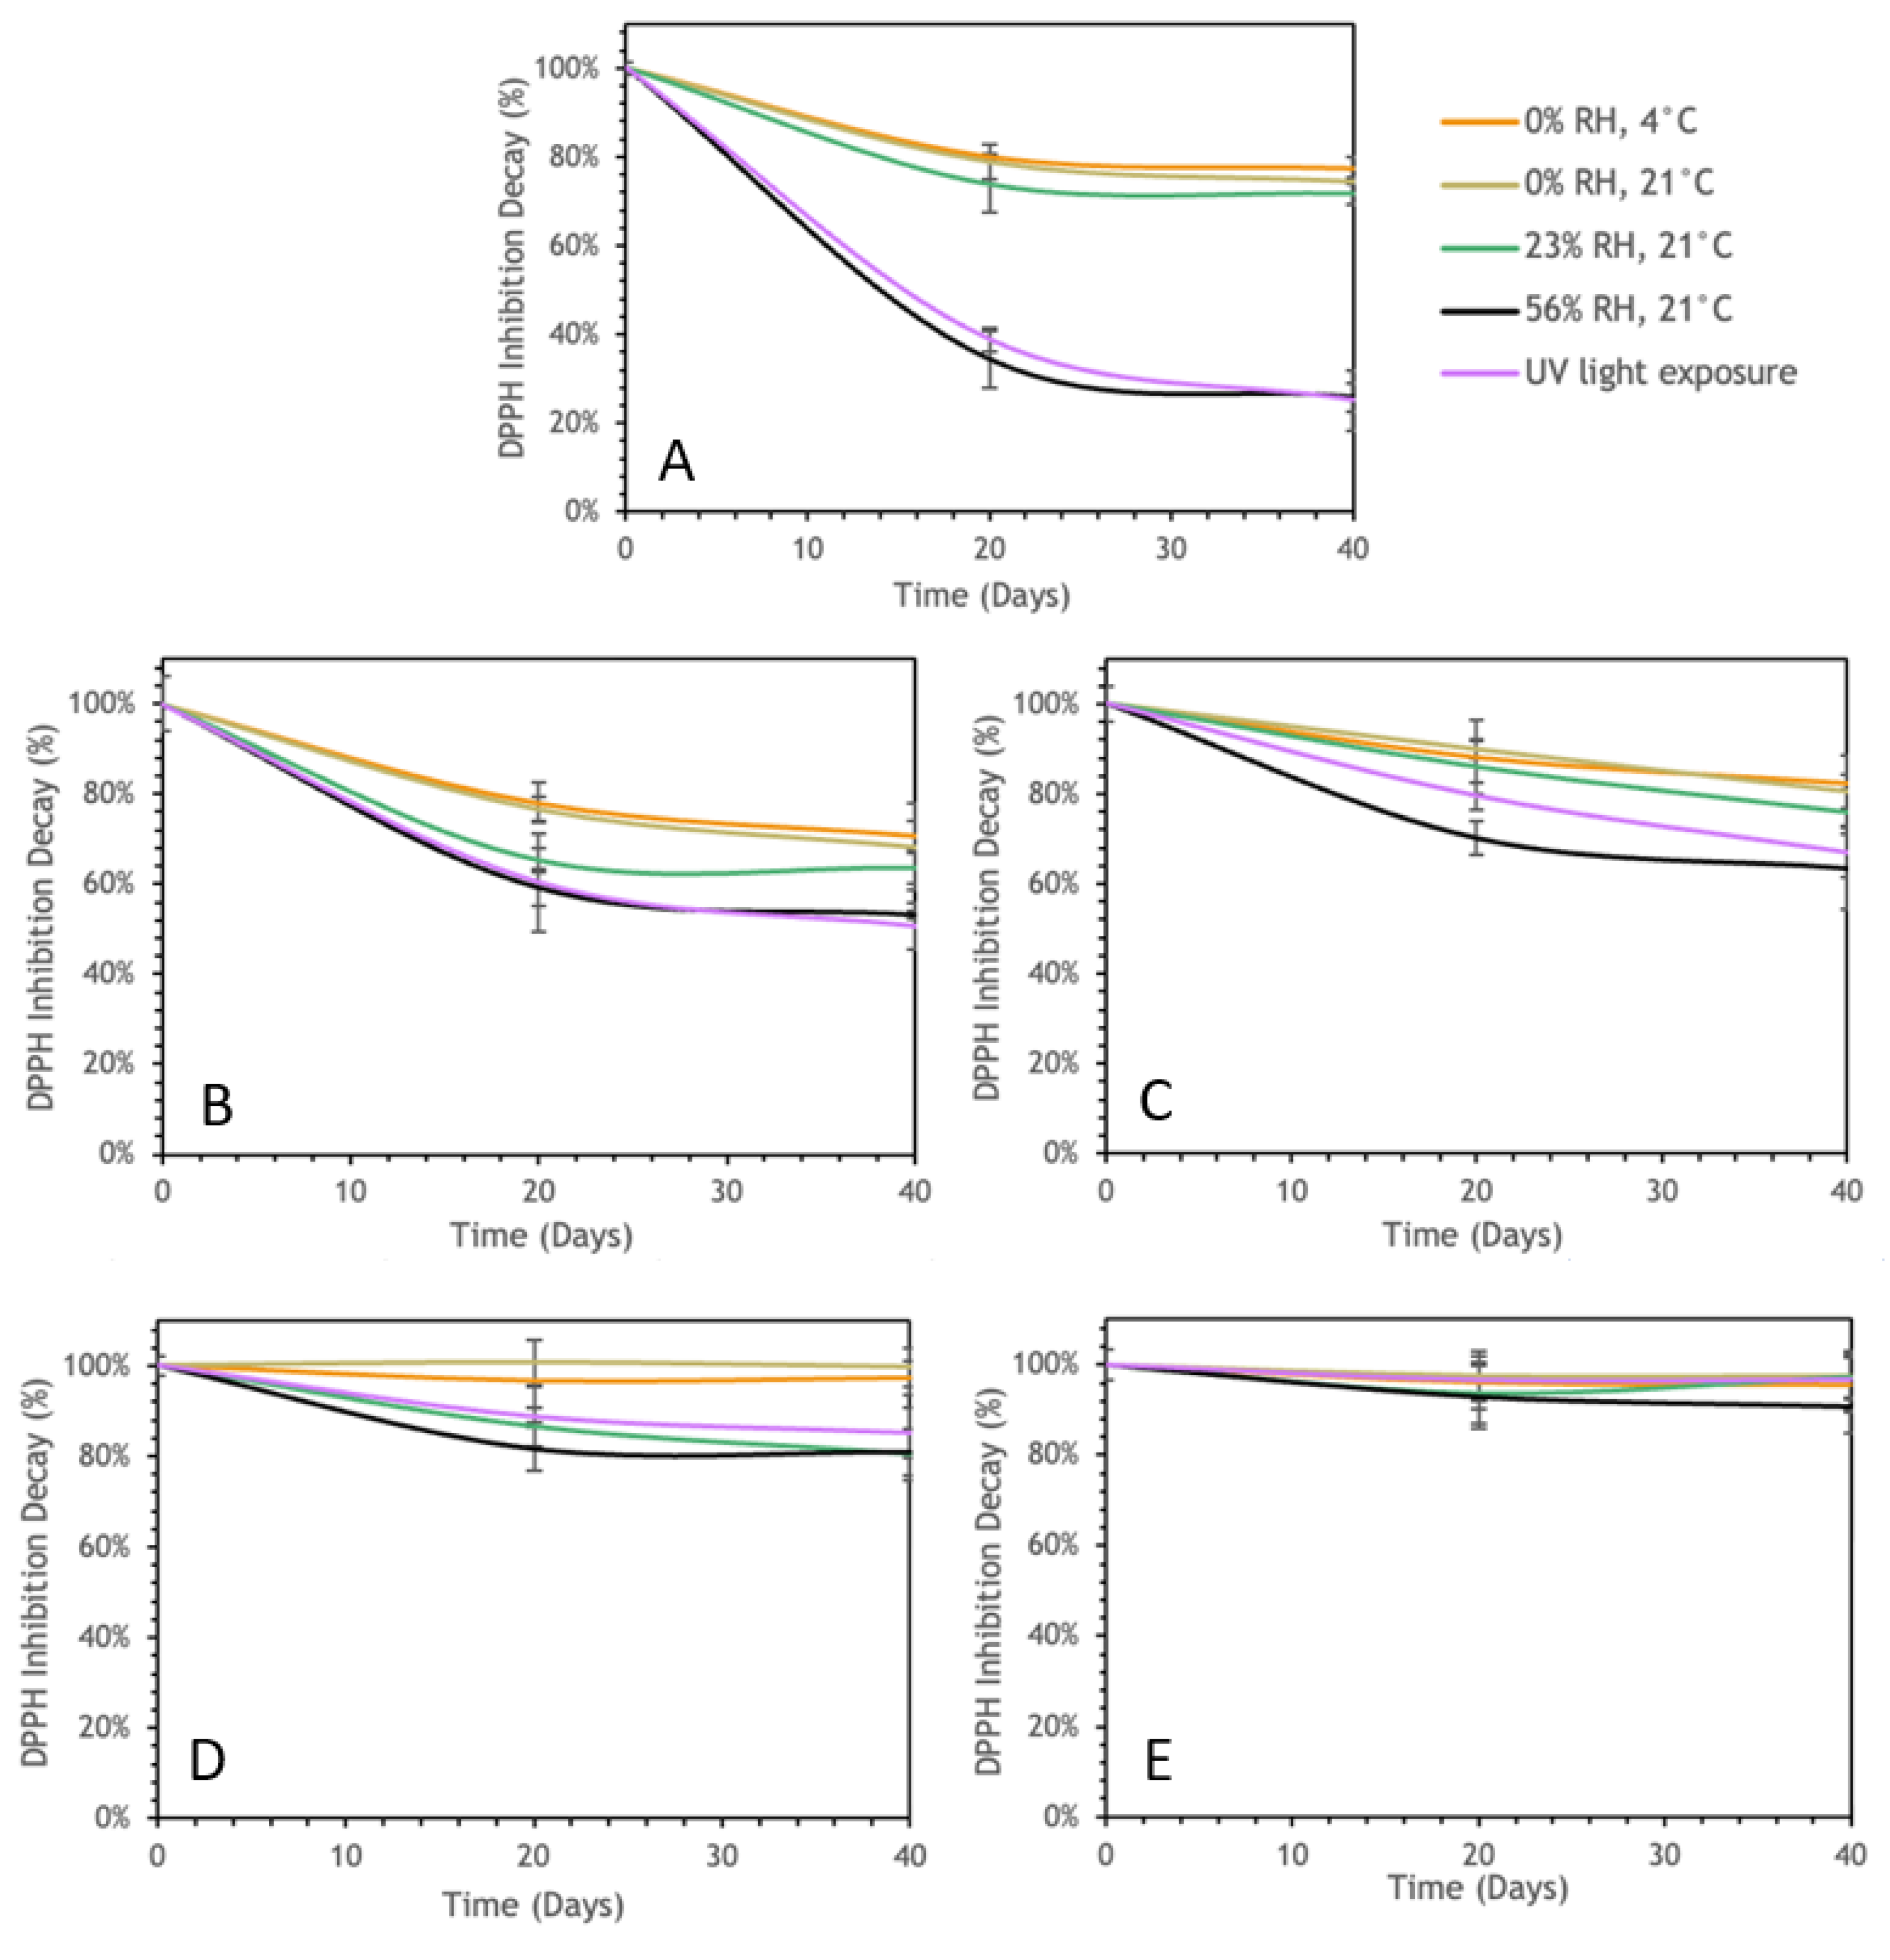
Figure 4.
Attenuated total reflection—Fourier transform infrared spectroscopy (ATR- FTIR) of EAPG dried CCX.
Figure 4.
Attenuated total reflection—Fourier transform infrared spectroscopy (ATR- FTIR) of EAPG dried CCX.
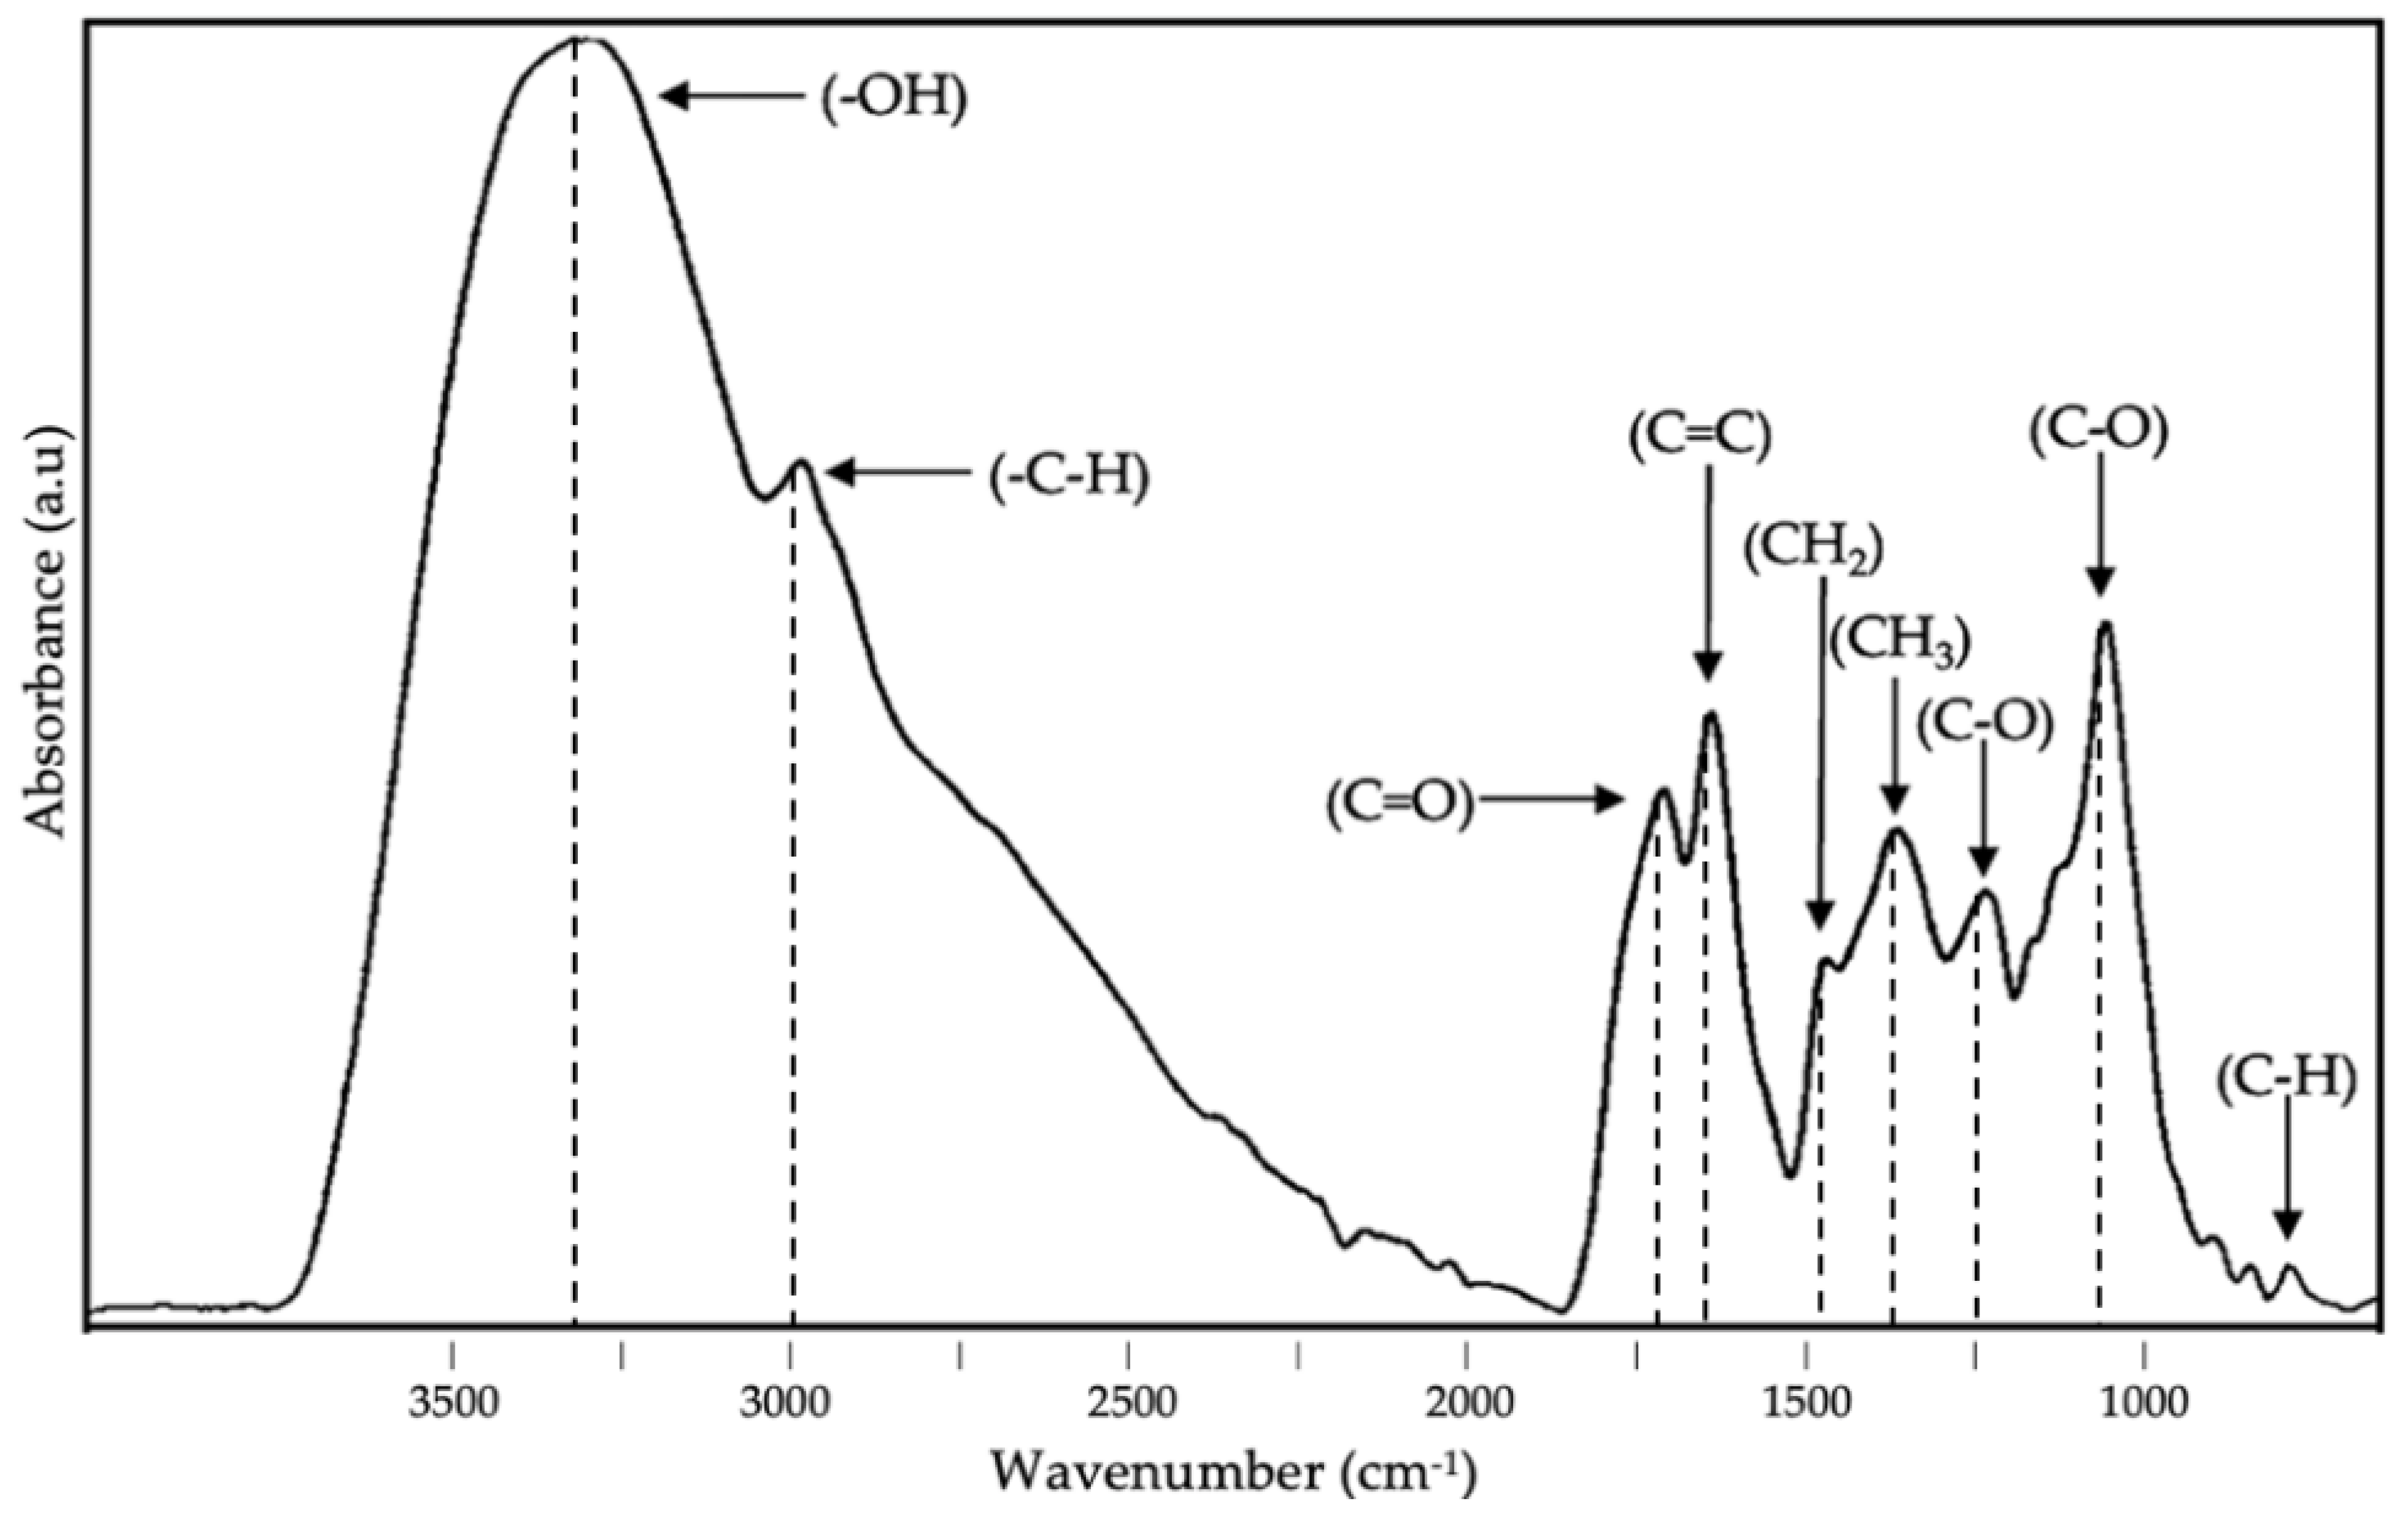
Figure 5.
Spectral evolution of Attenuated total reflection—Fourier transform infrared spectroscopy (ATR- FTIR) for the EAPG dried CCX stored under various conditions (A) 0 days; (B) 40 days, 0% RH, 4°C; (C) 40 days, 0% RH, 21°C; (D) 40 days, 23% RH, 21°C; (E) 40 days, 56% RH, 21°C; (F) 40 days, UV light exposure. The spectra were maximized to the band with the highest intensity in the wavelength range between 1800 and 800 cm−1.
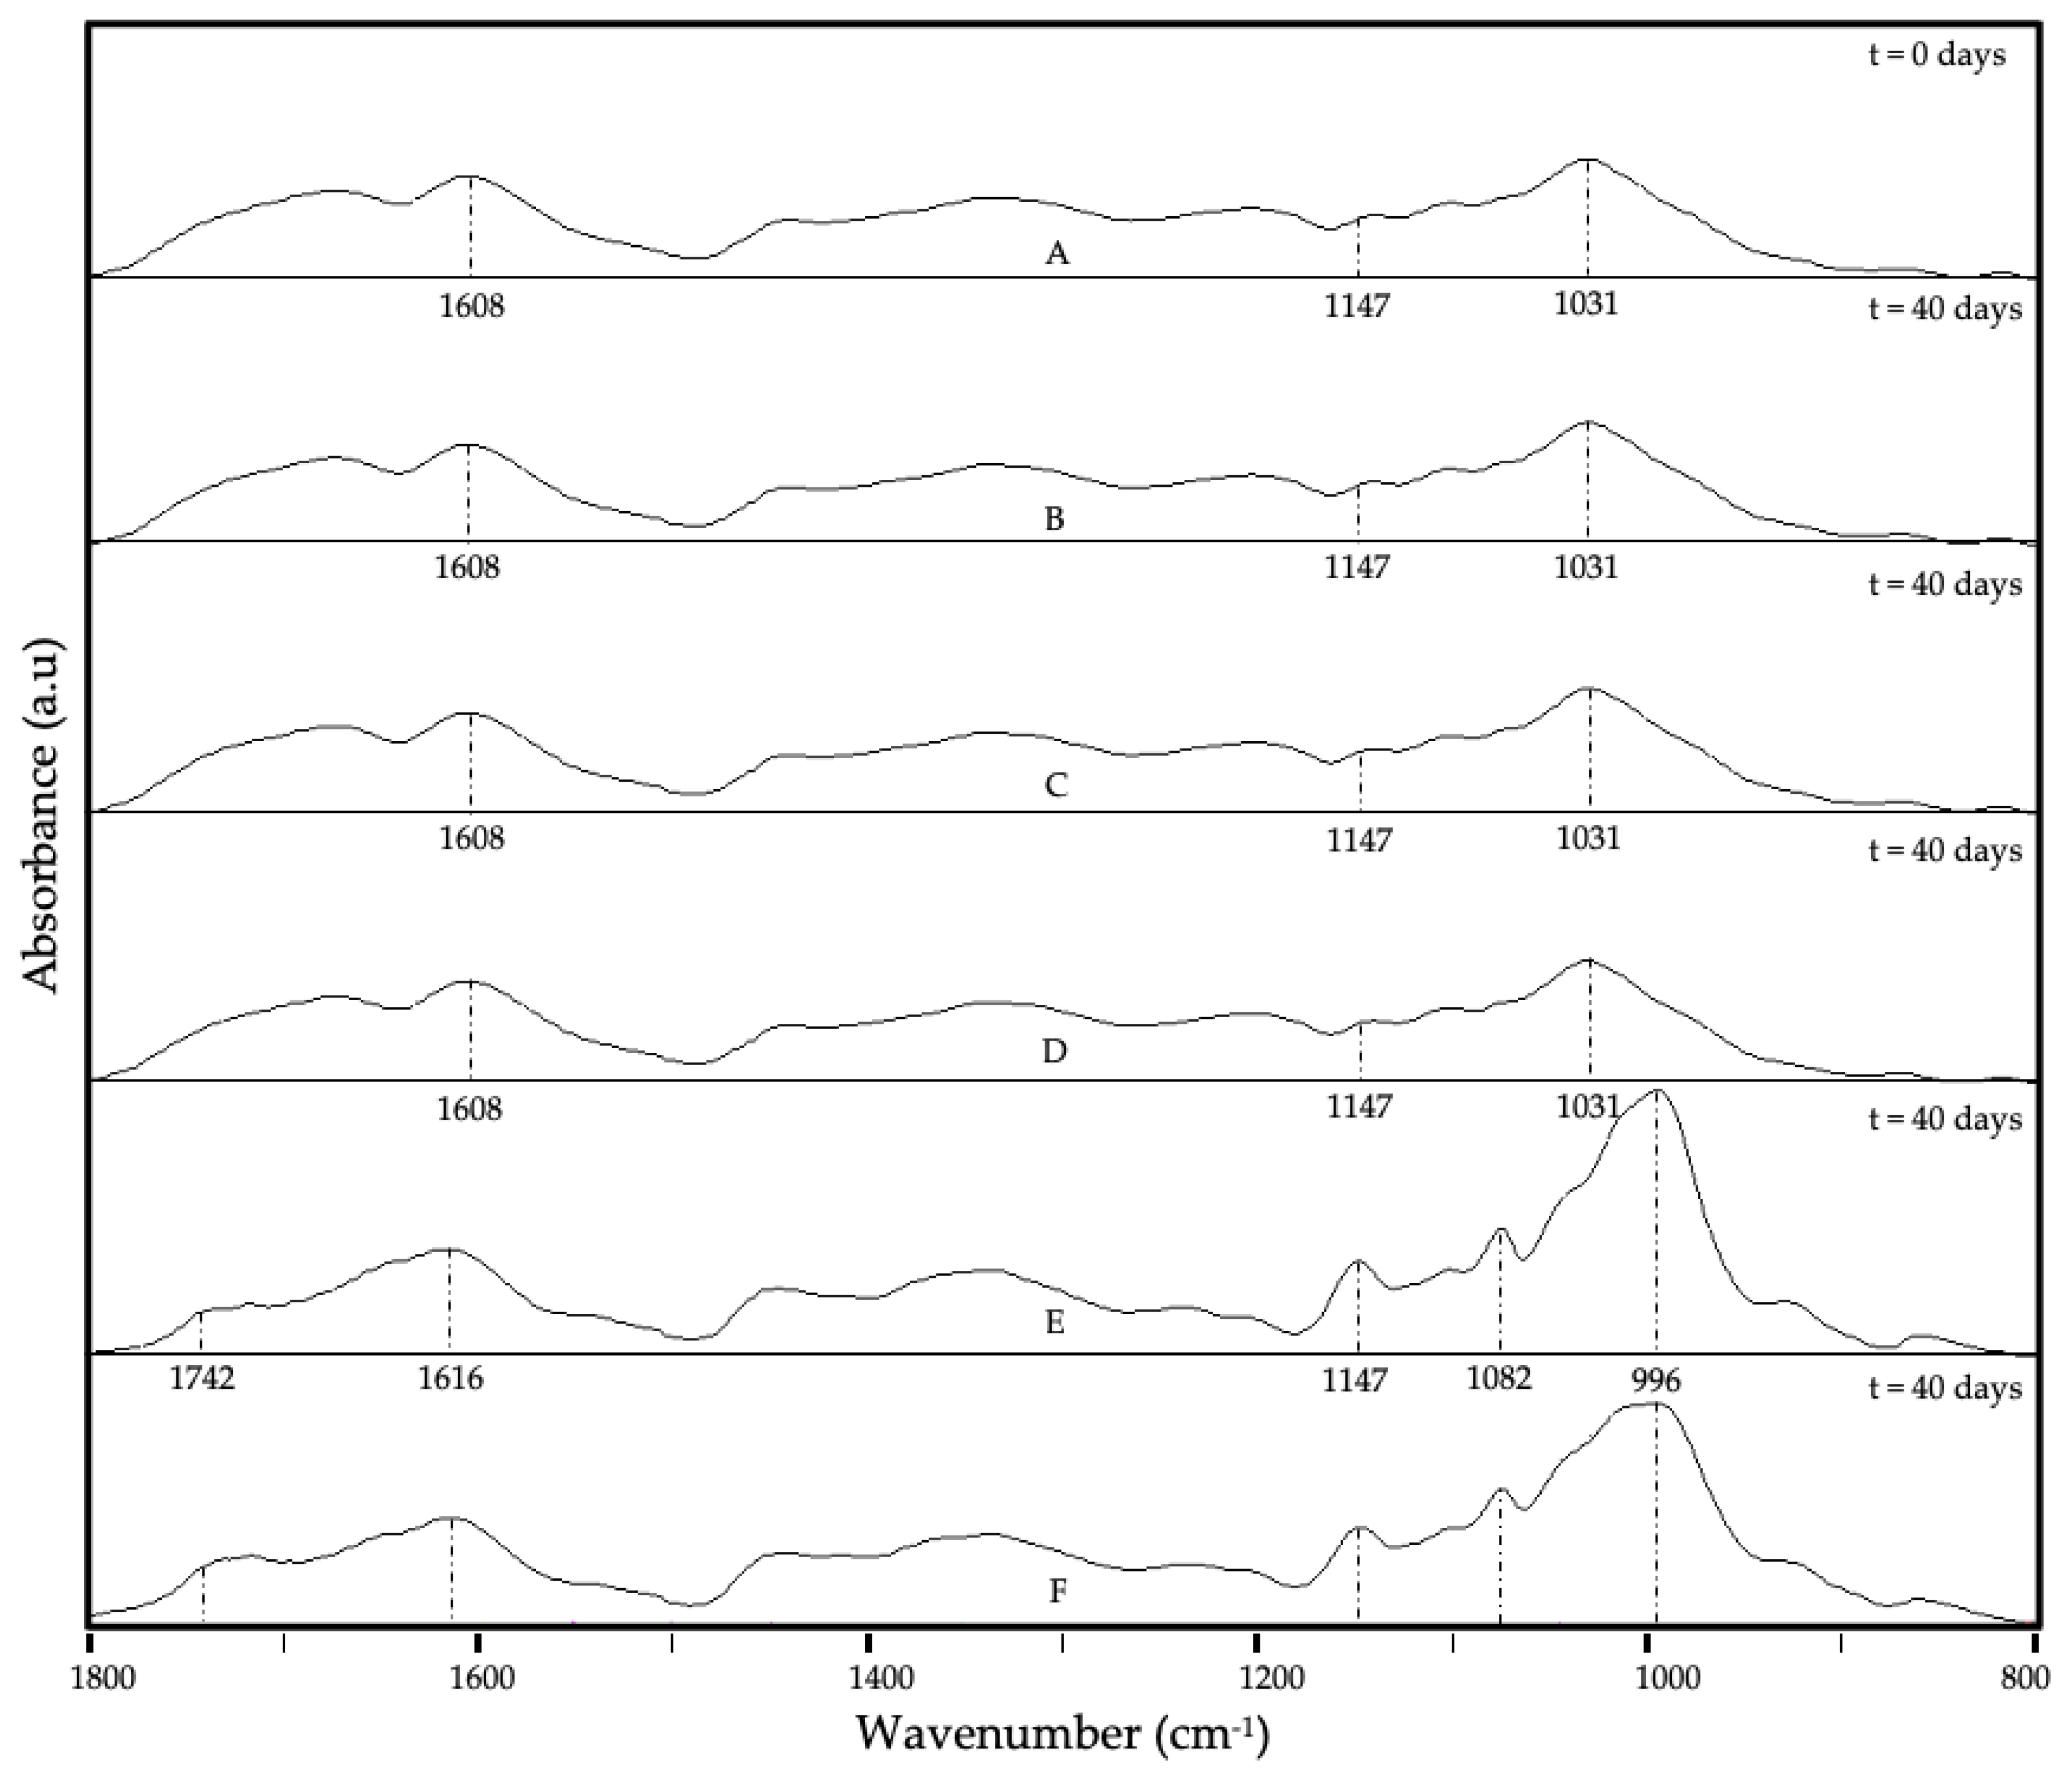
Figure 6.
Spectral Evolution of Attenuated total reflection—Fourier transform infrared spectroscopy (ATR- FTIR) for WPC-CCX 1:1 w/w EAPG-derived microcapsules stored under various conditions (A) 0 days; (B) 40 days, 0% RH, 4°C; (C) 40 days, 0% RH, 21°C; (D) 40 days, 23% RH, 21°C; (E) 40 days, 56% RH, 21°C; (F) 40 days, UV light exposure. The spectra were maximized to the band with the highest intensity in the wavelength range between 1800 and 800 cm−1.
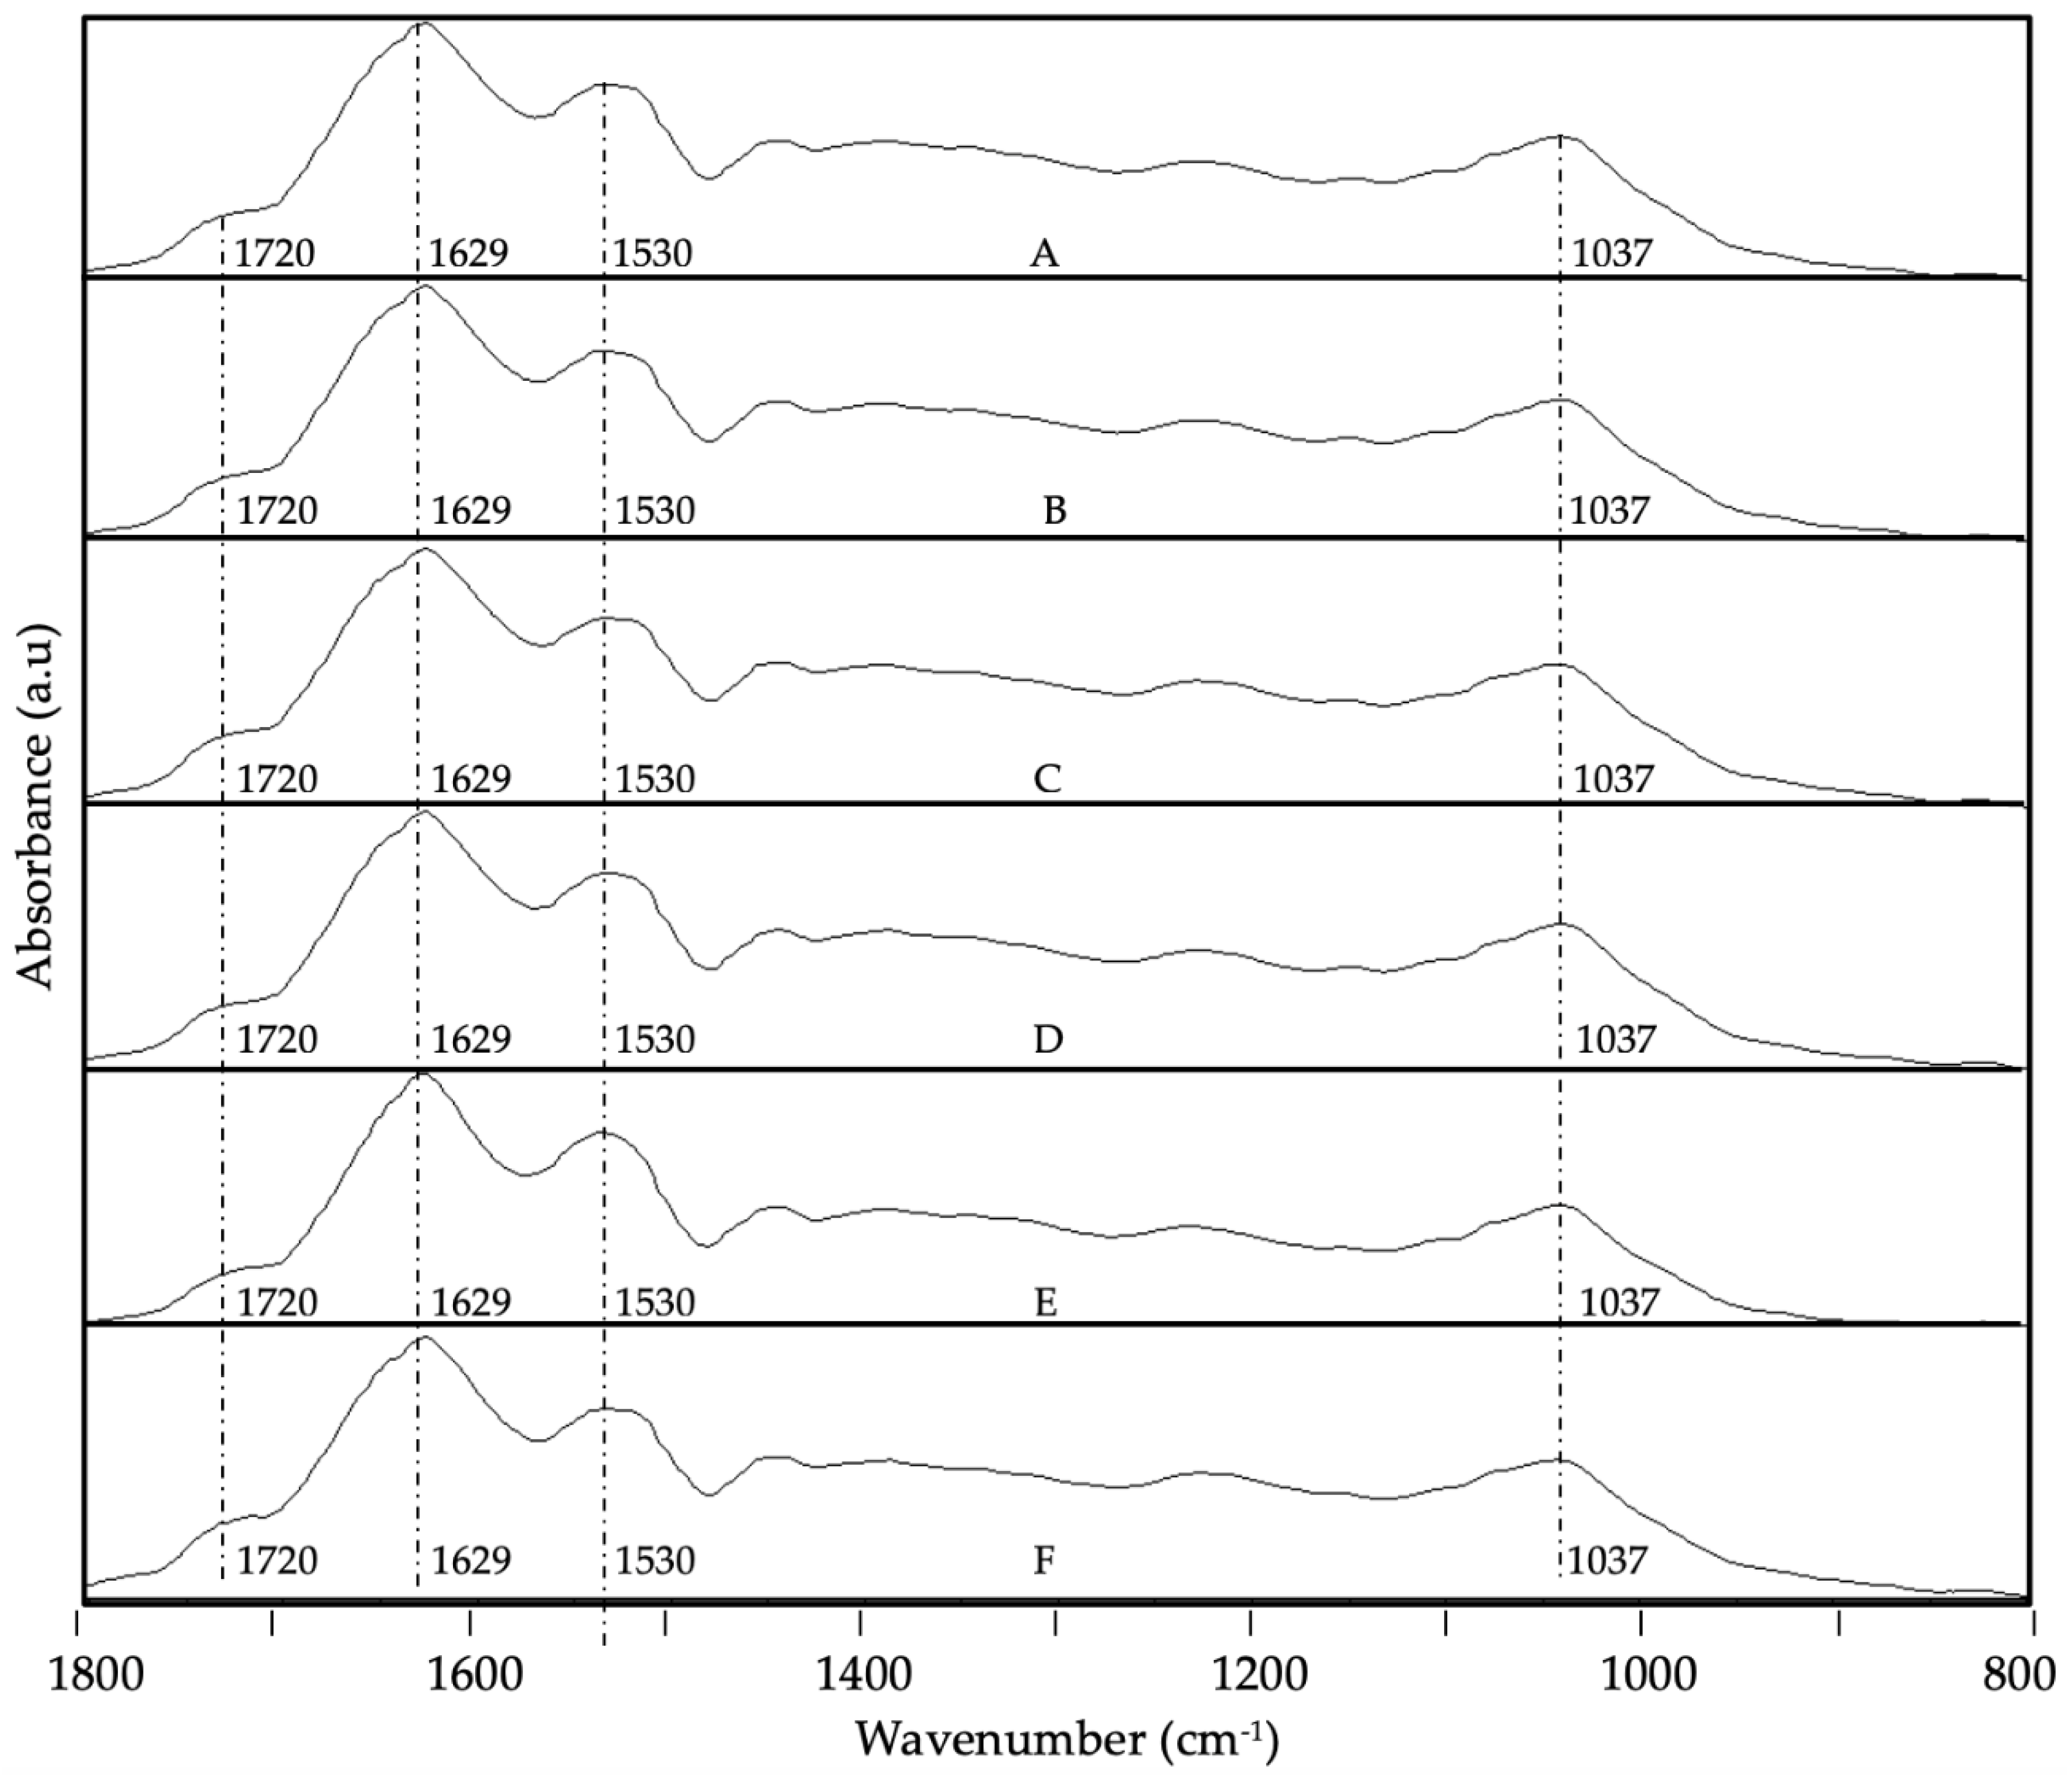
Figure 7.
Spectral Evolution of Attenuated total reflection—Fourier transform infrared spectroscopy (ATR- FTIR) for WPC-CCX 2:1 w/w EAPG-derived microcapsules stored under various conditions (A) 0 days; (B) 40 days, 0% RH, 4°C; (C) 40 days, 0% RH, 21°C; (D) 40 days, 23% RH, 21°C; (E) 40 days, 56% RH, 21°C; (F) 40 days, UV light exposure. The spectra were maximized to the band with the highest intensity in the wavelength range between 1800 and 800 cm−1.

Figure 8.
Spectral Evolution of Attenuated total reflection—Fourier transform infrared spectroscopy (ATR- FTIR) for ZN-CCX 1:1 w/w EAPG-derived microcapsules stored under various conditions (A) 0 days; (B) 40 days, 0% RH, 4°C; (C) 40 days, 0% RH, 21°C; (D) 40 days, 23% RH, 21°C; (E) 40 days, 56% RH, 21°C; (F) 40 days, UV light exposure. The spectra were maximized to the band with the highest intensity in the wavelength range between 1800 and 800 cm−1.
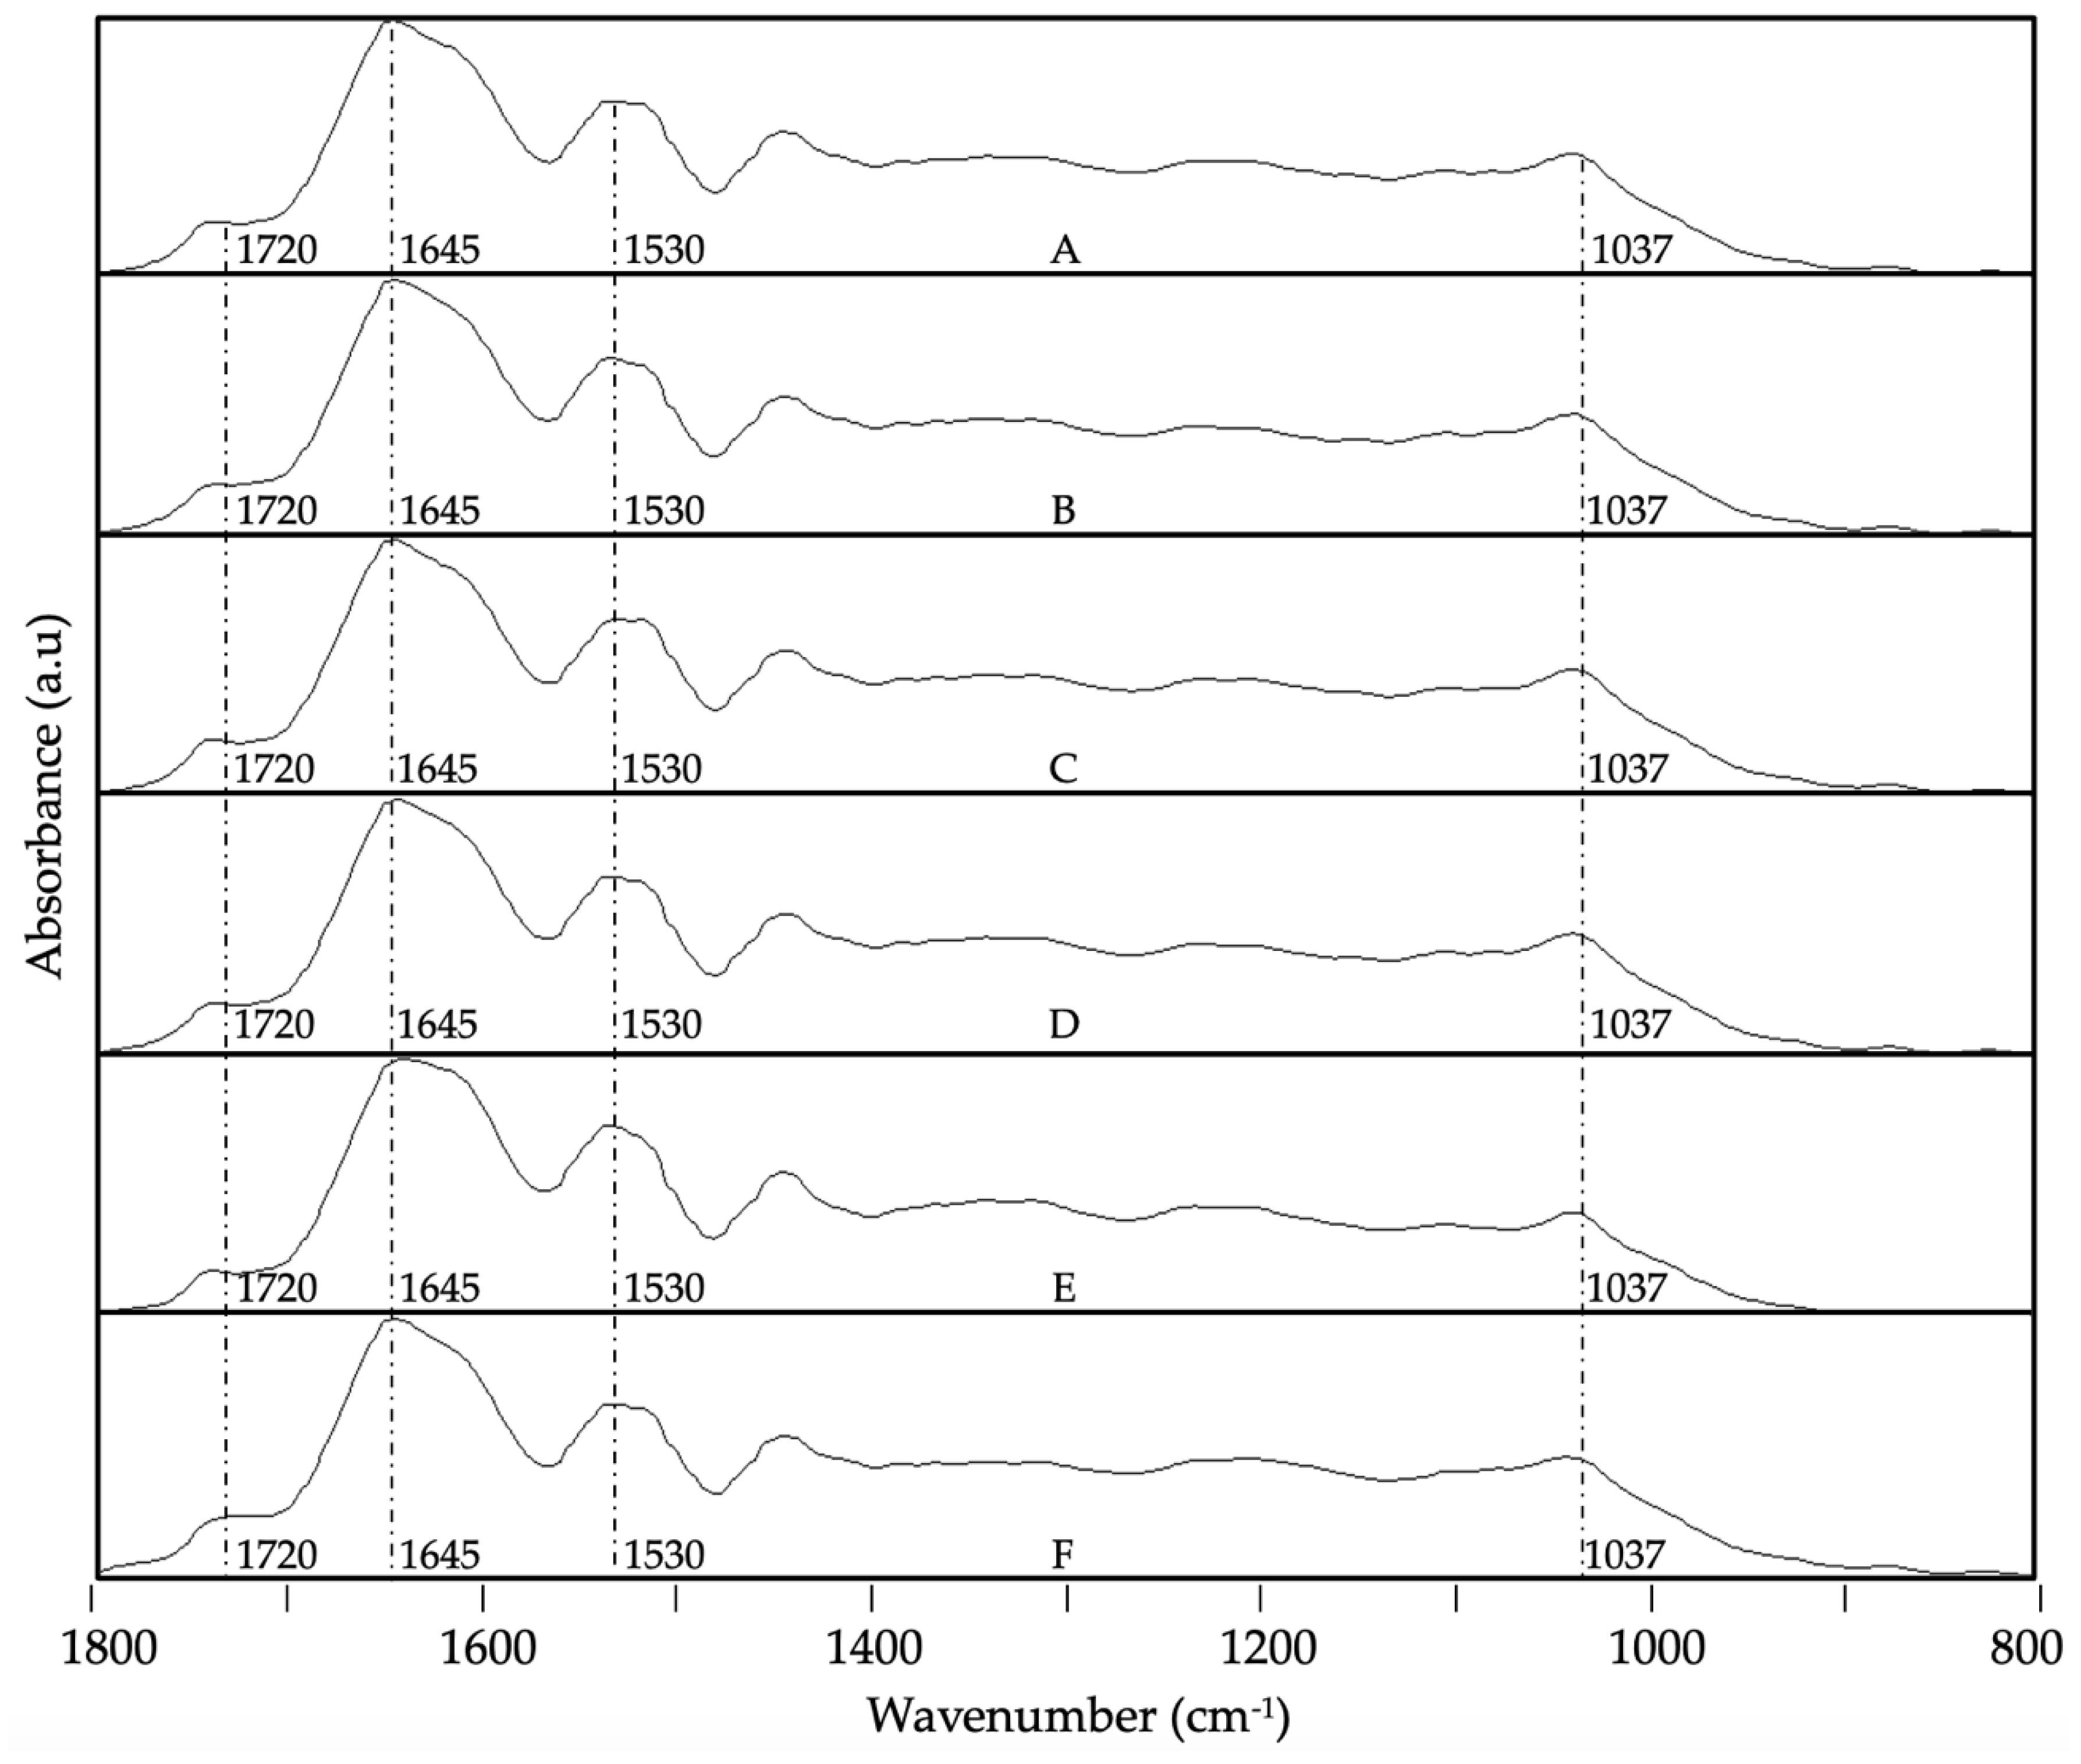
Figure 9.
Spectral Evolution of Attenuated total reflection—Fourier transform infrared spectroscopy (ATR- FTIR) for ZN-CCX 2:1 w/w EAPG-derived microcapsules stored under various conditions (A) 0 days; (B) 40 days, 0% RH, 4°C; (C) 40 days, 0% RH, 21°C; (D) 40 days, 23% RH, 21°C; (E) 40 days, 56% RH, 21°C; (F) 40 days, UV light exposure. The spectra were maximized to the band with the highest intensity in the wavelength range between 1800 and 800 cm−1.
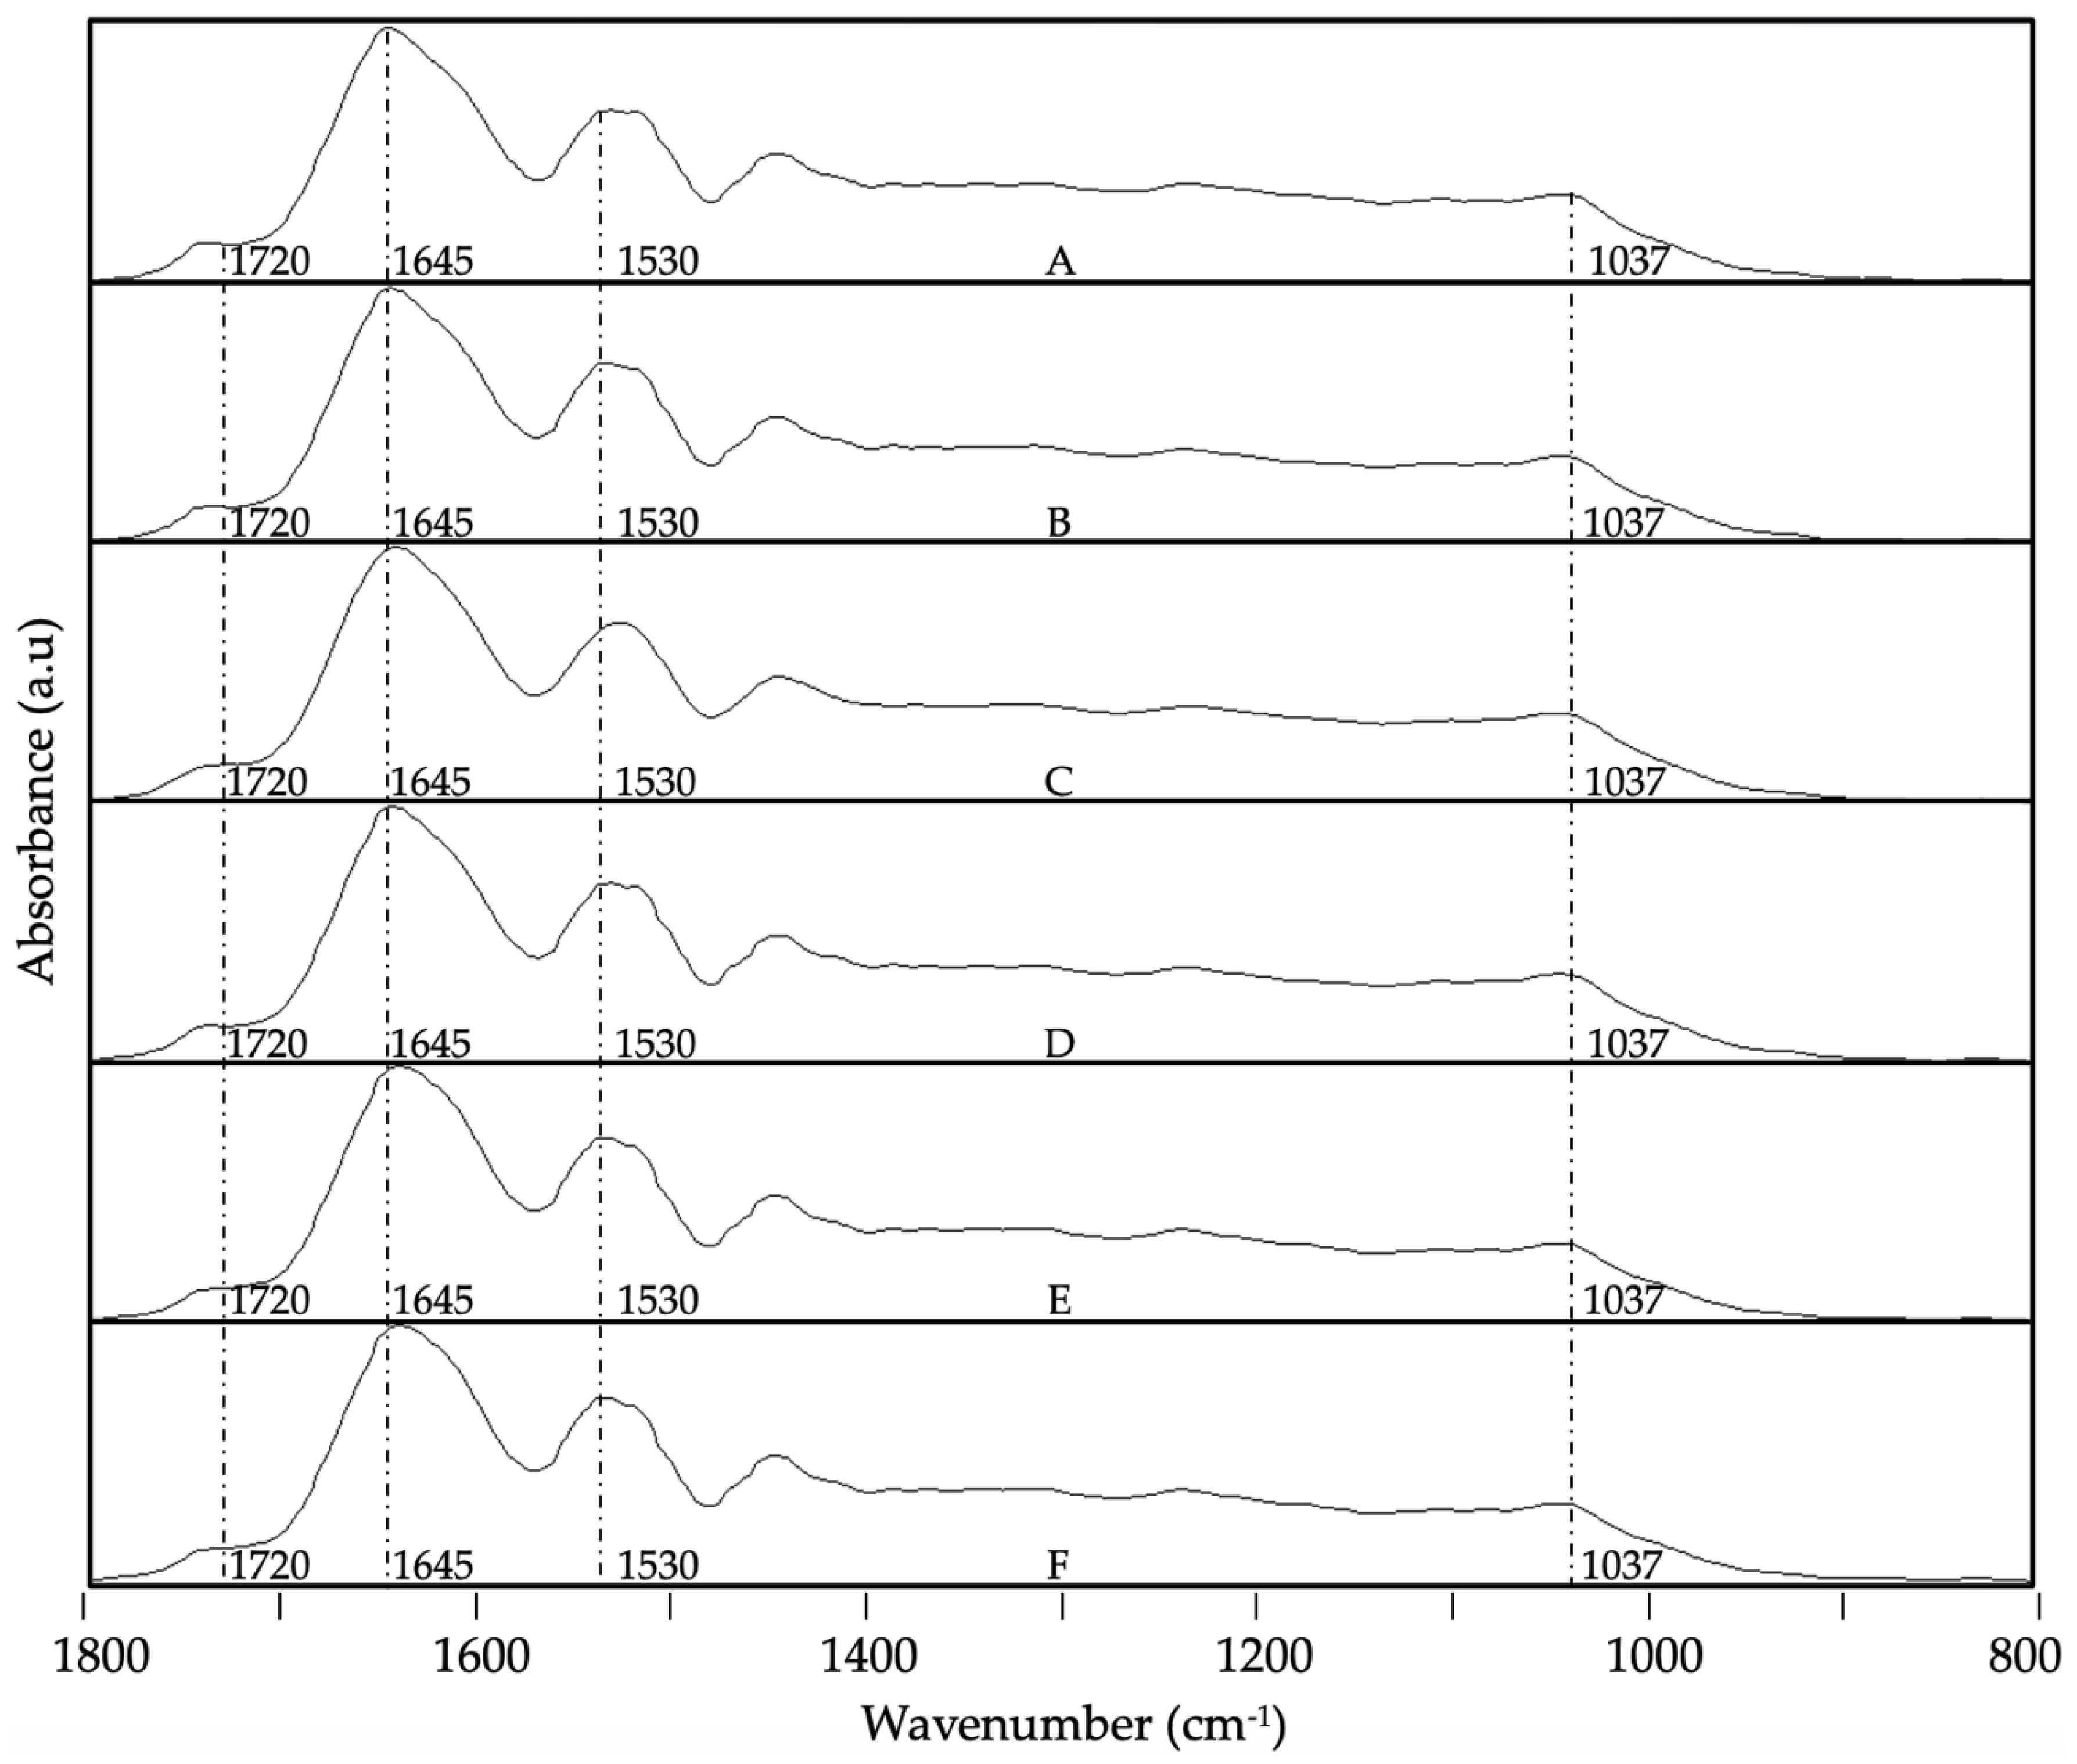

Table 1.
Particle size, total soluble polyphenol content, and antioxidant activity for CCX dried by EAPG (CCX-EAPG) and encapsulated CCX into whey protein concentrate (WPC) and zein (ZN).
Table 1.
Particle size, total soluble polyphenol content, and antioxidant activity for CCX dried by EAPG (CCX-EAPG) and encapsulated CCX into whey protein concentrate (WPC) and zein (ZN).
| Sample | Particle size (μm) |
DPPH inhibition (%) |
TSP (mg GAE/g dried CCX) |
|---|---|---|---|
| CCX | 89.06 ± 0.02 b | 1.13 ± 0.05 a | |
| CCX – EAPG | 10.01 ± 1.84 a | 94.03 ± 0.02 a | 1.14 ± 0.07 a |
| WPC - CCX 1:1 | 6.74 ± 2.57 ab | 91.60 ± 0.06 ab | 1.15 ± 0.04 a |
| WPC - CCX 2:1 | 7.24 ± 2.49 ab | 94.07 ± 0.04 a | 1.11 ± 0.05 a |
| ZN - CCX 1:1 | 6.24 ± 2.33 ab | 85.32 ± 0.02 b | 1.21 ± 0.06 a |
| ZN - CCX 2:1 | 5.85 ± 1.45 b | 93.22 ± 0.04 a | 1.15 ± 0.05 a |
Mean values ± standard deviation with different superscripts in the same column are significantly different (Tukey test, p ≤ 0.05). TSP – total soluble polyphenols. GAE – gallic acid equivalent. DPPH Inhibition percentage of the DPPH reactive.
Disclaimer/Publisher’s Note: The statements, opinions and data contained in all publications are solely those of the individual author(s) and contributor(s) and not of MDPI and/or the editor(s). MDPI and/or the editor(s) disclaim responsibility for any injury to people or property resulting from any ideas, methods, instructions or products referred to in the content. |
© 2024 by the authors. Licensee MDPI, Basel, Switzerland. This article is an open access article distributed under the terms and conditions of the Creative Commons Attribution (CC BY) license (http://creativecommons.org/licenses/by/4.0/).
Copyright: This open access article is published under a Creative Commons CC BY 4.0 license, which permit the free download, distribution, and reuse, provided that the author and preprint are cited in any reuse.


