1. Introduction
Corrugated boards are widely used in packaging. The main advantages of corrugated boards are their lightness, recyclability, and low cost [
1,
2,
3], which make them the best choice for producing containers for the shipment of goods.
FE-based simulation has been increasingly used in the last decades as the main structural analysis tool in many different industrial sectors. In combination with other numerical techniques and tools such as computational fluid dynamics (CFD), it has been used as the main basis for more recent concepts of virtual prototypes that replace manufacturing and testing of physical components. FEA technology has also been applied to various design problems in the packaging industry, contributing not only to time, test cost, and sample preparation but also to detailed analysis by adjusting various variables.
Most FEA studies have focused on analyzing the mechanisms of buckling, failure, stability, and adherence strength of corrugated boards [
1,
2,
7,
10,
11] and investigating the flat crush and bending behaviors by flute types [
4,
5]. Gilchrist et al. [
1] studied the possibility of replacing corrugated board bending tests through FEA, considering paper nonlinearity, and pointed out the adhesion conditions between the corrugating medium and linerboard as one of the causes of errors between the FEA and experimental results. Park et al. [
4] analyzed the stress vs. strain curve and the process of changing the flute shape as flat crush behavior for corrugated boards by flute type through FE-based simulation. They reported that if the material properties of corrugated board components and the FE modeling method for corrugated boards are improved, the flat crush behavior of corrugated boards can be predicted through FE-based simulation techniques. Some FEA studies [
8,
12,
13] have replaced conventional semi-empirical equations by optimizing combinations of corrugated boards to analyze the performance and strength of their boxes and develop FEA simulations. In addition, some researchers [
3,
8] conducted FEA on various specimens of standards for the edgewise compression strength (ECS) of corrugated boards worldwide and compared and analyzed their results according to specimen shapes. Jiménez and Liarte [
8] conducted FEA for edgewise compression test (ECT) specimens based on the recommendations of the FEFCO No. 8 testing standard [
14]. They found that the difference in the ECT values based on the frictional contact conditions between the modeled test specimen and the rigid surface of the testing machine was less than 3% for A-flute (A/F) and C-flute (C/F) and approximately 15% for B-flute (B/F). Park et al. [
3] analyzed the edgewise compression behaviors of single-wall (SW) (A/F and B/F) and double-wall (DW) (AB/F and BB/F) corrugated boards that are commonly used in South Korea [
15] using three standardized methods (KS M 7063-1 method A [
16], TAPPI T 838 [
17], and FEFCO No.8 [
15]), FEA simulations, and experimental methods. They reported that the ECS obtained through FEA and experimentally differed because of the contact condition between the liner and flute in the FE modeling of the corrugated boards. Moreover, the differences between the standards in the experiment and FEA were qualitatively consistent. Some studies have applied FEA to the design of ventilated corrugated board packages for the postharvest handling of horticultural products [
4,
18,
19]. Han and Park [
4] reported that the appropriate pattern and location of the ventilation holes were vertically oblong-shaped and symmetrically positioned within a certain distance to the right and left from the center of the front and rear faces of the packages, and the rate of decrease in compressive strength was the minimum among the types of ventilation holes of the same area when the length of the major axis of the ventilation hole was less than 1/4 of the depth of the box, and the ratio of the minor axis to the major axis was 1/3.5~1/2.5, provided that even-numbered holes were located symmetrically. The findings of Han and Park [
4] serve as the basis for the Korean Industrial Standards KS T 1020 [
20].
In this study, we investigated the possibility of alternative testing methods for four-point bending tests (FPBT) through FE-based simulation in two types of DW corrugated board (AB/F and BB/F) and two types of SW corrugated board (A/F and B/F). The research objectives are as follows.
- (1)
An FE-based simulation of the bending behavior, which is an out-of-plane characteristic of flute-type corrugated boards, was used to qualitatively analyze the effect of each structural factor constituting a corrugated board on the bending behavior (bending force vs. deflection).
- (2)
By comparing the FE-based simulation results and test results for the bending behavior of the corrugated board, to analyze whether FE-based simulation techniques are possible as an alternative test method for FPBT in corrugated boards.
2. Experiment Design
2.1. Four-Point Bending Test
The target corrugated board applied to the experiment of this study is two types of SW (A/F, B/F) and two types of DW (AB/F, BB/F); the board combination and detailed specifications of the samples are presented in Table 2.1.
Table 2.1.
Measured specifications of the target corrugated boards used in the study.
Table 2.1.
Measured specifications of the target corrugated boards used in the study.
| Kinds |
Board combination1)
|
Flute2)
|
Total thickness (mm) |
Components
(liner, corrugating medium) |
| Wave length (mm) |
Height
(mm) |
Take-up factor |
| SW |
A/F |
SK180/K180/ SK180 |
9.00
(8.33~9.38) |
4.90
(4.5~4.8) |
1.560
(1.6) |
5.34 |
-Thickness (mm):
0.22(SK180), 0.24(K180)
-Ring crush (kgf):
21.7(SK180), 20.2(K180)
-Tensile strength (MPa):
66.33(MD)/22.76(CD)(SK180),
52.97(MD)/18.18(CD)(K180) |
| B/F |
SK180/K180/ SK180 |
6.00
(5.27~6.25) |
2.65
(2.5~2.8) |
1.424
(1.4) |
3.09 |
| DW |
AB/F |
SK180/K180/K180/K180/ SK180 |
- |
- |
- |
8.23 |
| BB/F |
SK180/K180/K180/K180/ SK180 |
- |
- |
- |
5.98 |
According to TAPPI T 820 [
22], the dimensions of the bending test specimen of the target corrugated board were 500 × 50 mm (length × width) in both MD and CD. The manufactured specimens were conditioned for at least 48 h in a standard state (23±2℃, rh 50±2%) before the test, and the test was conducted in a laboratory where temperature and relative humidity were relatively well maintained [
23].
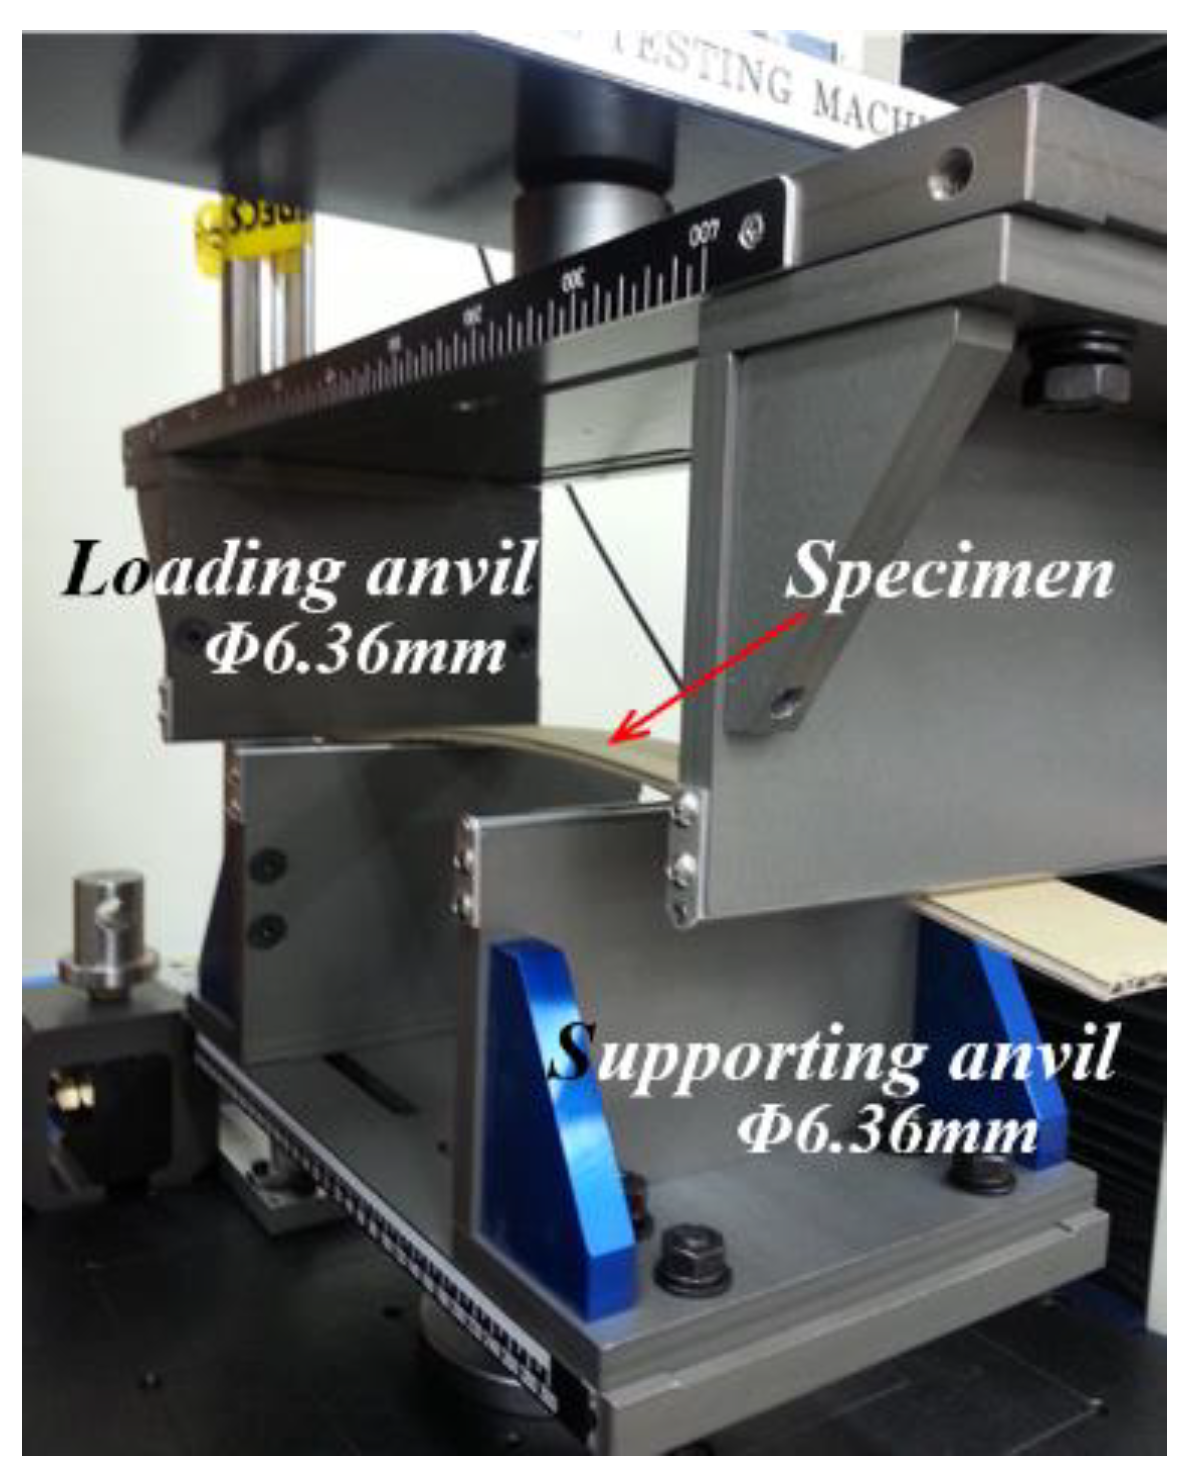
For the bending tests, the FPBT method was applied according to the TAPPI T 820 [
22]. As shown in Figure 2.1, the distances between the loading anvils and the supporting anvils were 400 mm and 200 mm, respectively. This reduced the test errors because only the pure bending force could be applied to the test specimen between the supporting anvils without the action of shear force [
5,
24,
25,
26].
Figure 2.1.
Experimental setup for measuring the bending force vs. deflection plot using the FPBT of corrugated boards.
Figure 2.1.
Experimental setup for measuring the bending force vs. deflection plot using the FPBT of corrugated boards.
The loading rate was set to 25.4 mm/min, which was sufficiently fast to suppress creep in the specimen during the bending test. The bending stiffness through FPBT was calculated using Equation (1).
where
Sb is the bending stiffness per unit width (N‧m),
E is the Young's modulus (Pa),
I is the moment of inertia of the beam (m
4),
F is the maximum bending force within proportional limit (N),
δ is the maximum deflection of central span within proportional limit (m),
ω is the width of test specimen (50 mm),
L is the bending length between supporting points (200 mm), and
a is the distance between the supporting and loading points (100 mm).
Based on the calculation of the deflections of the central and loading points of the specimen using the governing differential equation of an elastic line for the neutral axis of the specimen in four-point bending, the deflection of the central point of the specimen corresponded to 1/3 of the cross-head movement of the UTM, such as the deflection of the loading point [
26].
2.2. FE Modeling and Procedures
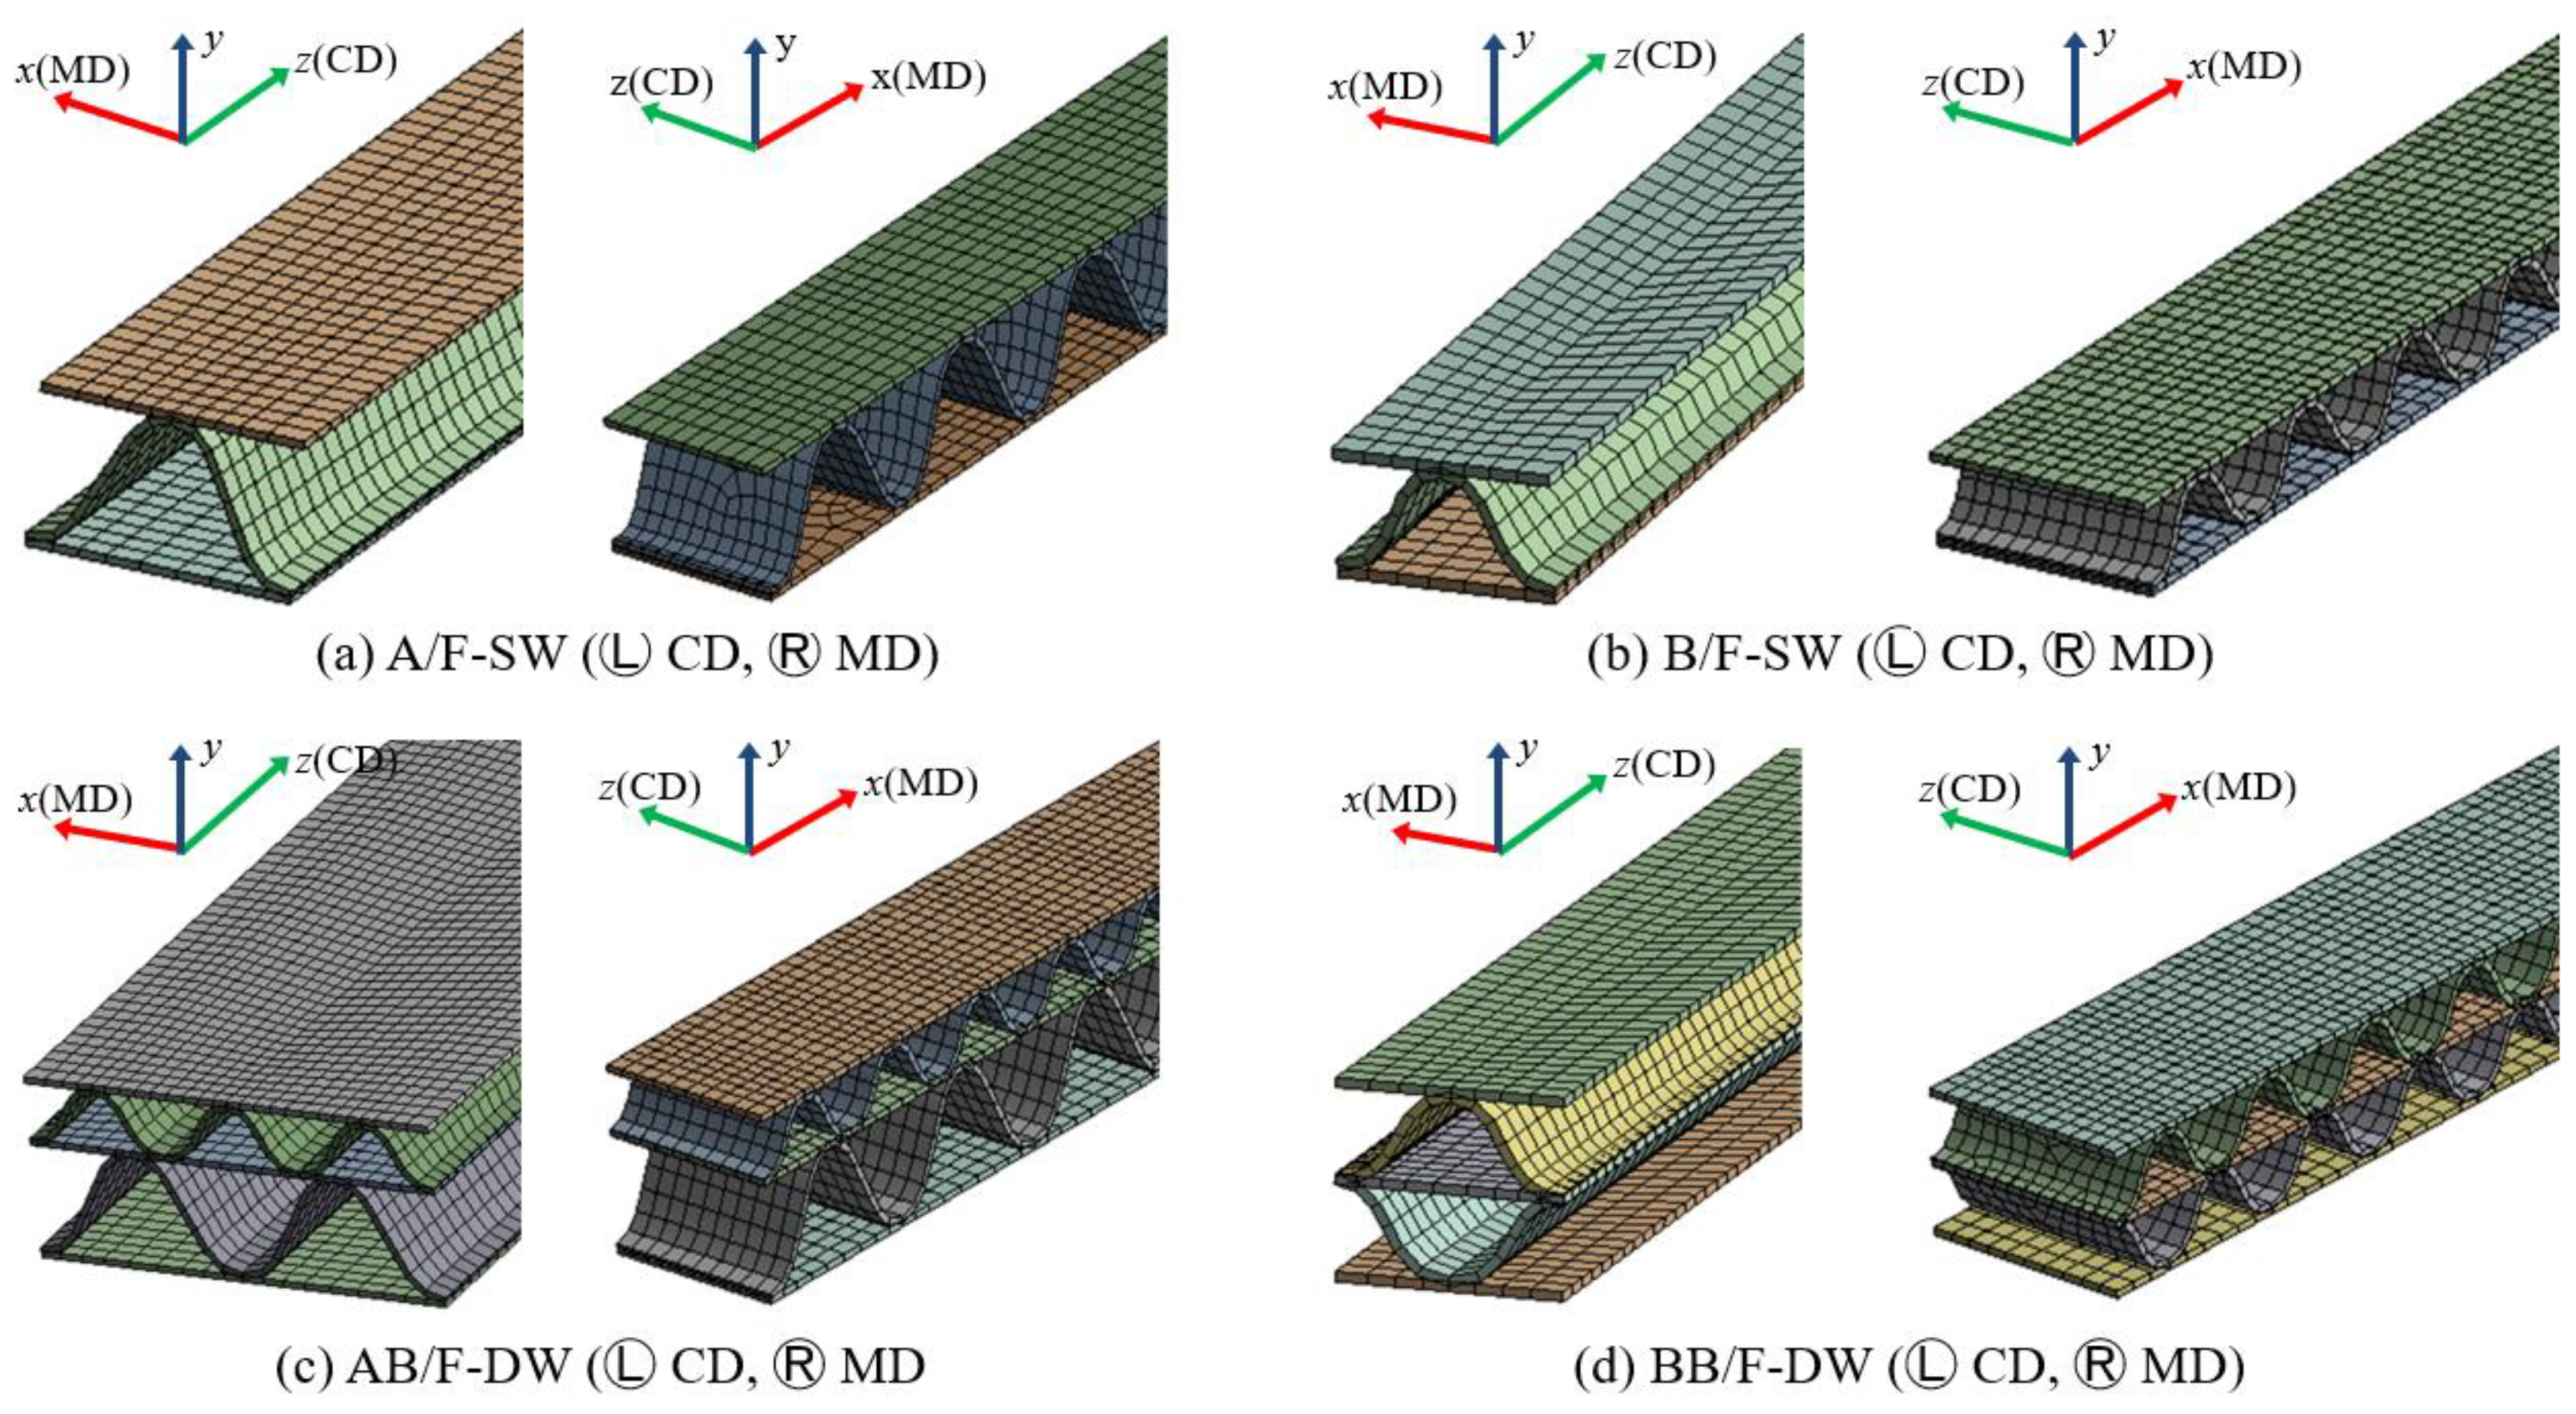
The FE model was developed based on the physical specifications (Table 2.1) of the corrugated boards used in the FPBT. The geometrical shape of the flute was modeled as a cosine function, and for simplification, the connection point between the liner and flute of the corrugated board was modeled using a sharing method for the points (nodes).
The length of the FE-modeled test specimen was 500 mm in both MD and CD; however, the width in the FE-modeled test specimen for CD was 9 mm for A/F-SW, 6 mm for B/F-SW, 18 mm for AB/F-DW, and 6 mm for B/F-DW, based on the least integer multiple or least common multiple of A/F and B/F wavelengths for the computational time and convergence, taking into account the continuity of the flute shape, that is, geometric symmetry. However, in the FE-modeled test specimen for MD, all the widths were 9 mm. A shell element with a two-dimensional shape and designating the thickness information as one input value was used for FE modeling.
The FE model for the loading and supporting anvils that applied and supported the bending force from the top and bottom of the FE-modeled test specimen was a cylinder of Φ6.36 mm (Figure 2.1).
Figure 2.2 shows the FE model mesh and geometry according to the flute type of the corrugated boards. In particular, in the case of BB/F-DW, which is increasingly used in Korea, a three-phase angle was modeled (Figure 2.3) to investigate the influence of the phase shift between flutings. A hexahedral mesh was used owing to its corrugated board shape. For example, the computational domains of A/F, B/F, AB/F, and BB/F for CD were discretized into 10,054 nodes and 9,064 mesh elements, 8,864 nodes and 8,225 mesh elements, 43,371 nodes and 43,642 mesh elements, and 16,817 nodes and 16,540 mesh elements, respectively.
Figure 2.2.
Meshed 3D models for FEA simulation.
Figure 2.2.
Meshed 3D models for FEA simulation.
Figure 2.3.
BB/F-DW of different phase angles (α) applied to the FEA: λ = wave length of B/F (6 mm).
Figure 2.3.
BB/F-DW of different phase angles (α) applied to the FEA: λ = wave length of B/F (6 mm).
The post-processor used in this study was Ansys Workbench [
27]. Nonlinear/large displacement conditions were applied in the FEA owing to the material properties of the corrugated board.
Frictional contact conditions were applied to the parts where contact between the flute and liner was expected when the FE-modeled test specimen was bent. However, a friction-free contact condition was applied between the FE-modeled supporting anvils and FE-modeled test specimen. The boundary and constraint conditions applied to the FE model in FEA were similar to those in the FPBT. Thus, both rotational and translational movements were constrained for the x-, y-, and z-axes in the FE-modeled supporting anvils, and only translational movement in the vertical direction was allowed for the FE-modeled loading anvils. In addition, the displacement in the width direction of all the liners and flutes of the FE-modeled test specimen was constrained (Figure 2.4).
Figure 2.4.
Load and boundary conditions in FEA for the FE-modeled test specimen.
Figure 2.4.
Load and boundary conditions in FEA for the FE-modeled test specimen.
To apply a bending force to the modeled test specimen, the FE-modeled loading anvils were displaced downward at a speed of 25.4 mm/min [
22]. Consequently, the specimen deflection caused by the moving loading anvils of the four-point bending tester used in the experiment was simulated. The reaction force transmitted to the FE-modelled supporting anvils via the FE model test specimen was analyzed to obtain bending force vs. deflection plots.
2.3. Material Properties
The required material properties for FEA were the Young’s modulus, Poisson’s ratio, shear modulus, yield strength, and frictional coefficient of the corrugated board components. These components, such as liners and corrugating media, were assumed to be orthotropic materials, implying that their material properties were symmetrical for the MD, CD, and thickness directions [
28,
29]. Therefore, each board had nine elastic material properties: E
x, E
y, E
z, G
xy, G
xz, G
yz, μ
xy, μ
xz, and μ
yz, and two strength values: σ
x(MD) and σ
y(CD) [
3,
4,
5,
28]. The values of these properties in the FEA were set based on those reported by Park et al. [
3,
4] and are listed in Table 2.2.
Table 2.2.
Orthotropic material properties of corrugated board components used in the FEA [
3,
4].
Table 2.2.
Orthotropic material properties of corrugated board components used in the FEA [
3,
4].
| Boards |
Young’s modulus (GPa) |
Poisson’s ratio |
Shear modulus (GPa) |
Yield strength (MPa) |
|
Ex(MD) |
Ey(CD) |
Ez(Thick.) |
μxy
|
μxz
|
μyz
|
Gxy
|
Gxz
|
Gyz
|
σx(MD) |
σy(CD) |
| K180 |
2.20(±0.02) |
0.37(±0.01) |
0.011 |
0.34 |
0.01 |
0.01 |
0.349 |
0.040 |
0.010 |
29.09(±0.8) |
12.12(±0.1) |
| SK180 |
3.16(±0.07) |
0.40(±0.01) |
0.016 |
0.34 |
0.01 |
0.01 |
0.435 |
0.057 |
0.011 |
42.50(±0.8) |
19.50(±0.5) |
As the modeled test specimen was bent, the contact area between the flute and liner on the left and right portions of the shared nodes gradually increased. Accordingly, frictional contact conditions at the section where contact was expected were implemented to accurately analyze the bending behavior of the corrugated board. In this study, the static-frictional coefficients listed in Table 2.3 were set based on those reported by Park et al. [
3,
4].
Table 2.3.
Frictional coefficients between boards used in the FEA [
3].
Table 2.3.
Frictional coefficients between boards used in the FEA [
3].
| Classify |
Static-frictional coefficient |
| MD-MD |
CD-CD |
MD-CD |
| K180-K180 |
0.23(±0.02) |
0.29(±0.01) |
0.26(±0.02) |
| SK180-SK180 |
0.37(±0.06) |
0.41(±0.03) |
0.39(±0.03) |
| K180-SK180 |
0.23(±0.04) |
0.35(±0.02) |
0.32(±0.04) |
| Average |
0.28 |
0.35 |
0.32 |
3. Results and Discussion
3.1. FE Simulation for Four-Point Bending Behavior
The relationship between bending force and deflection was analyzed as the bending behavior of the modeled test specimen of the corrugated boards by bending at a loading rate of 25.4 mm/min with boundaries and constraints similar to those of the FPBT [
22,
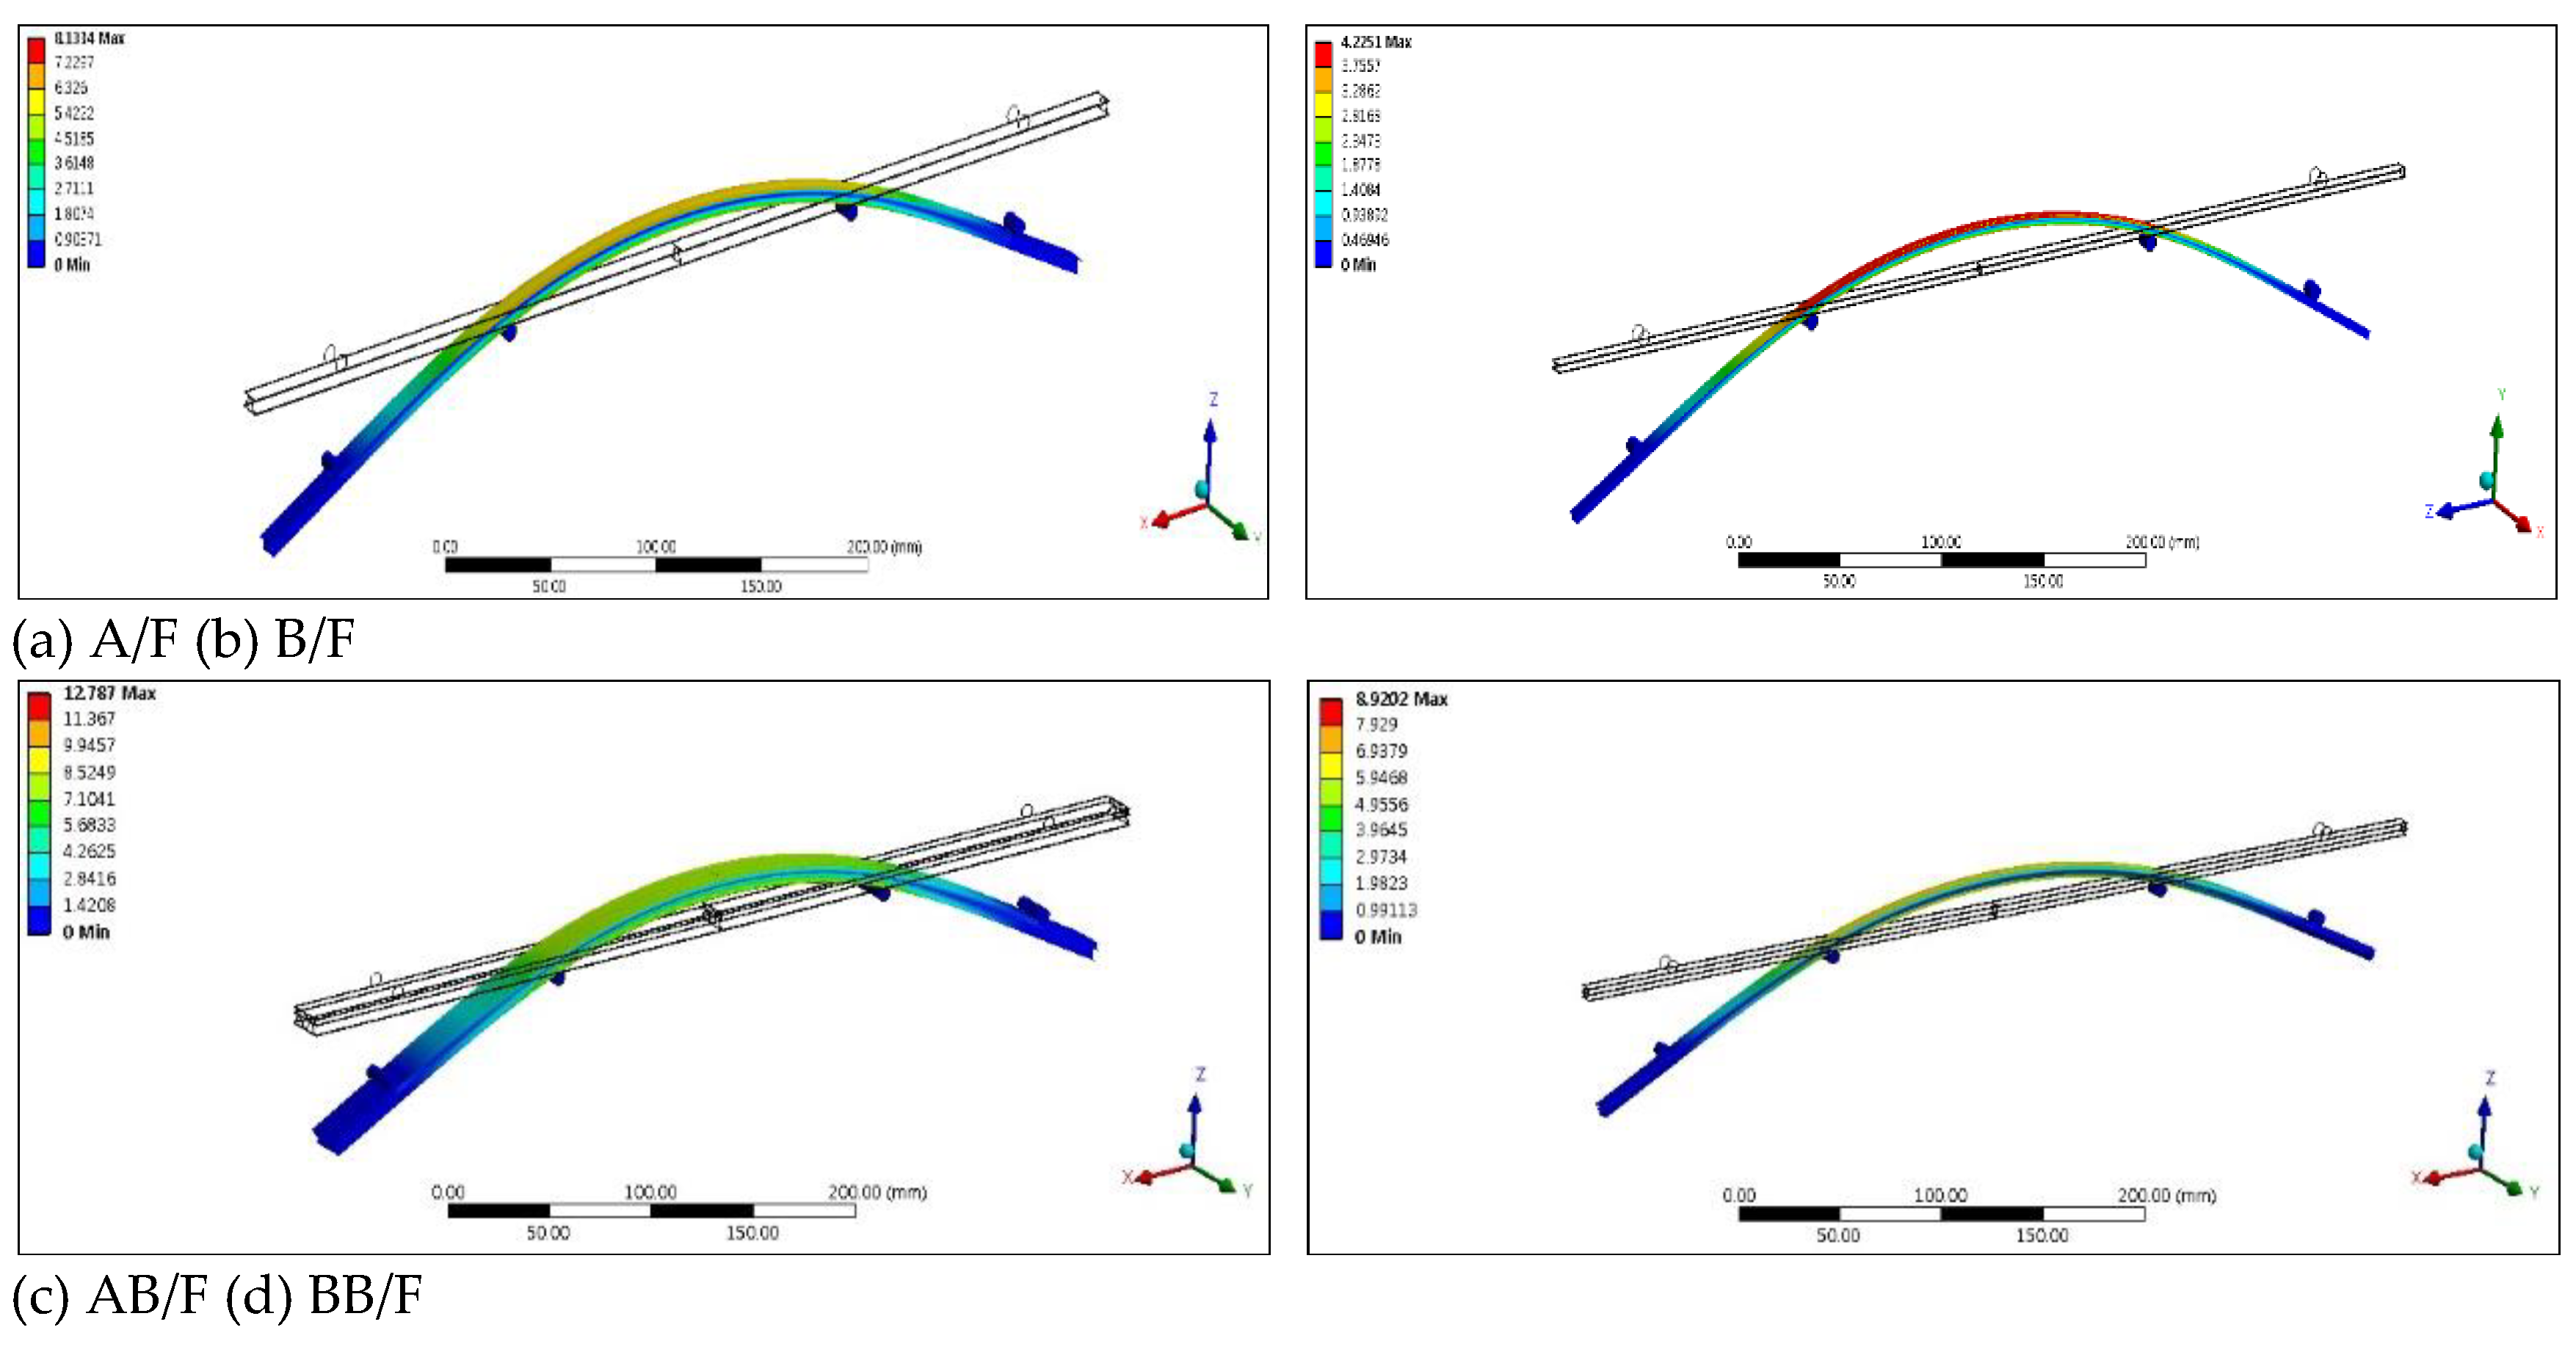
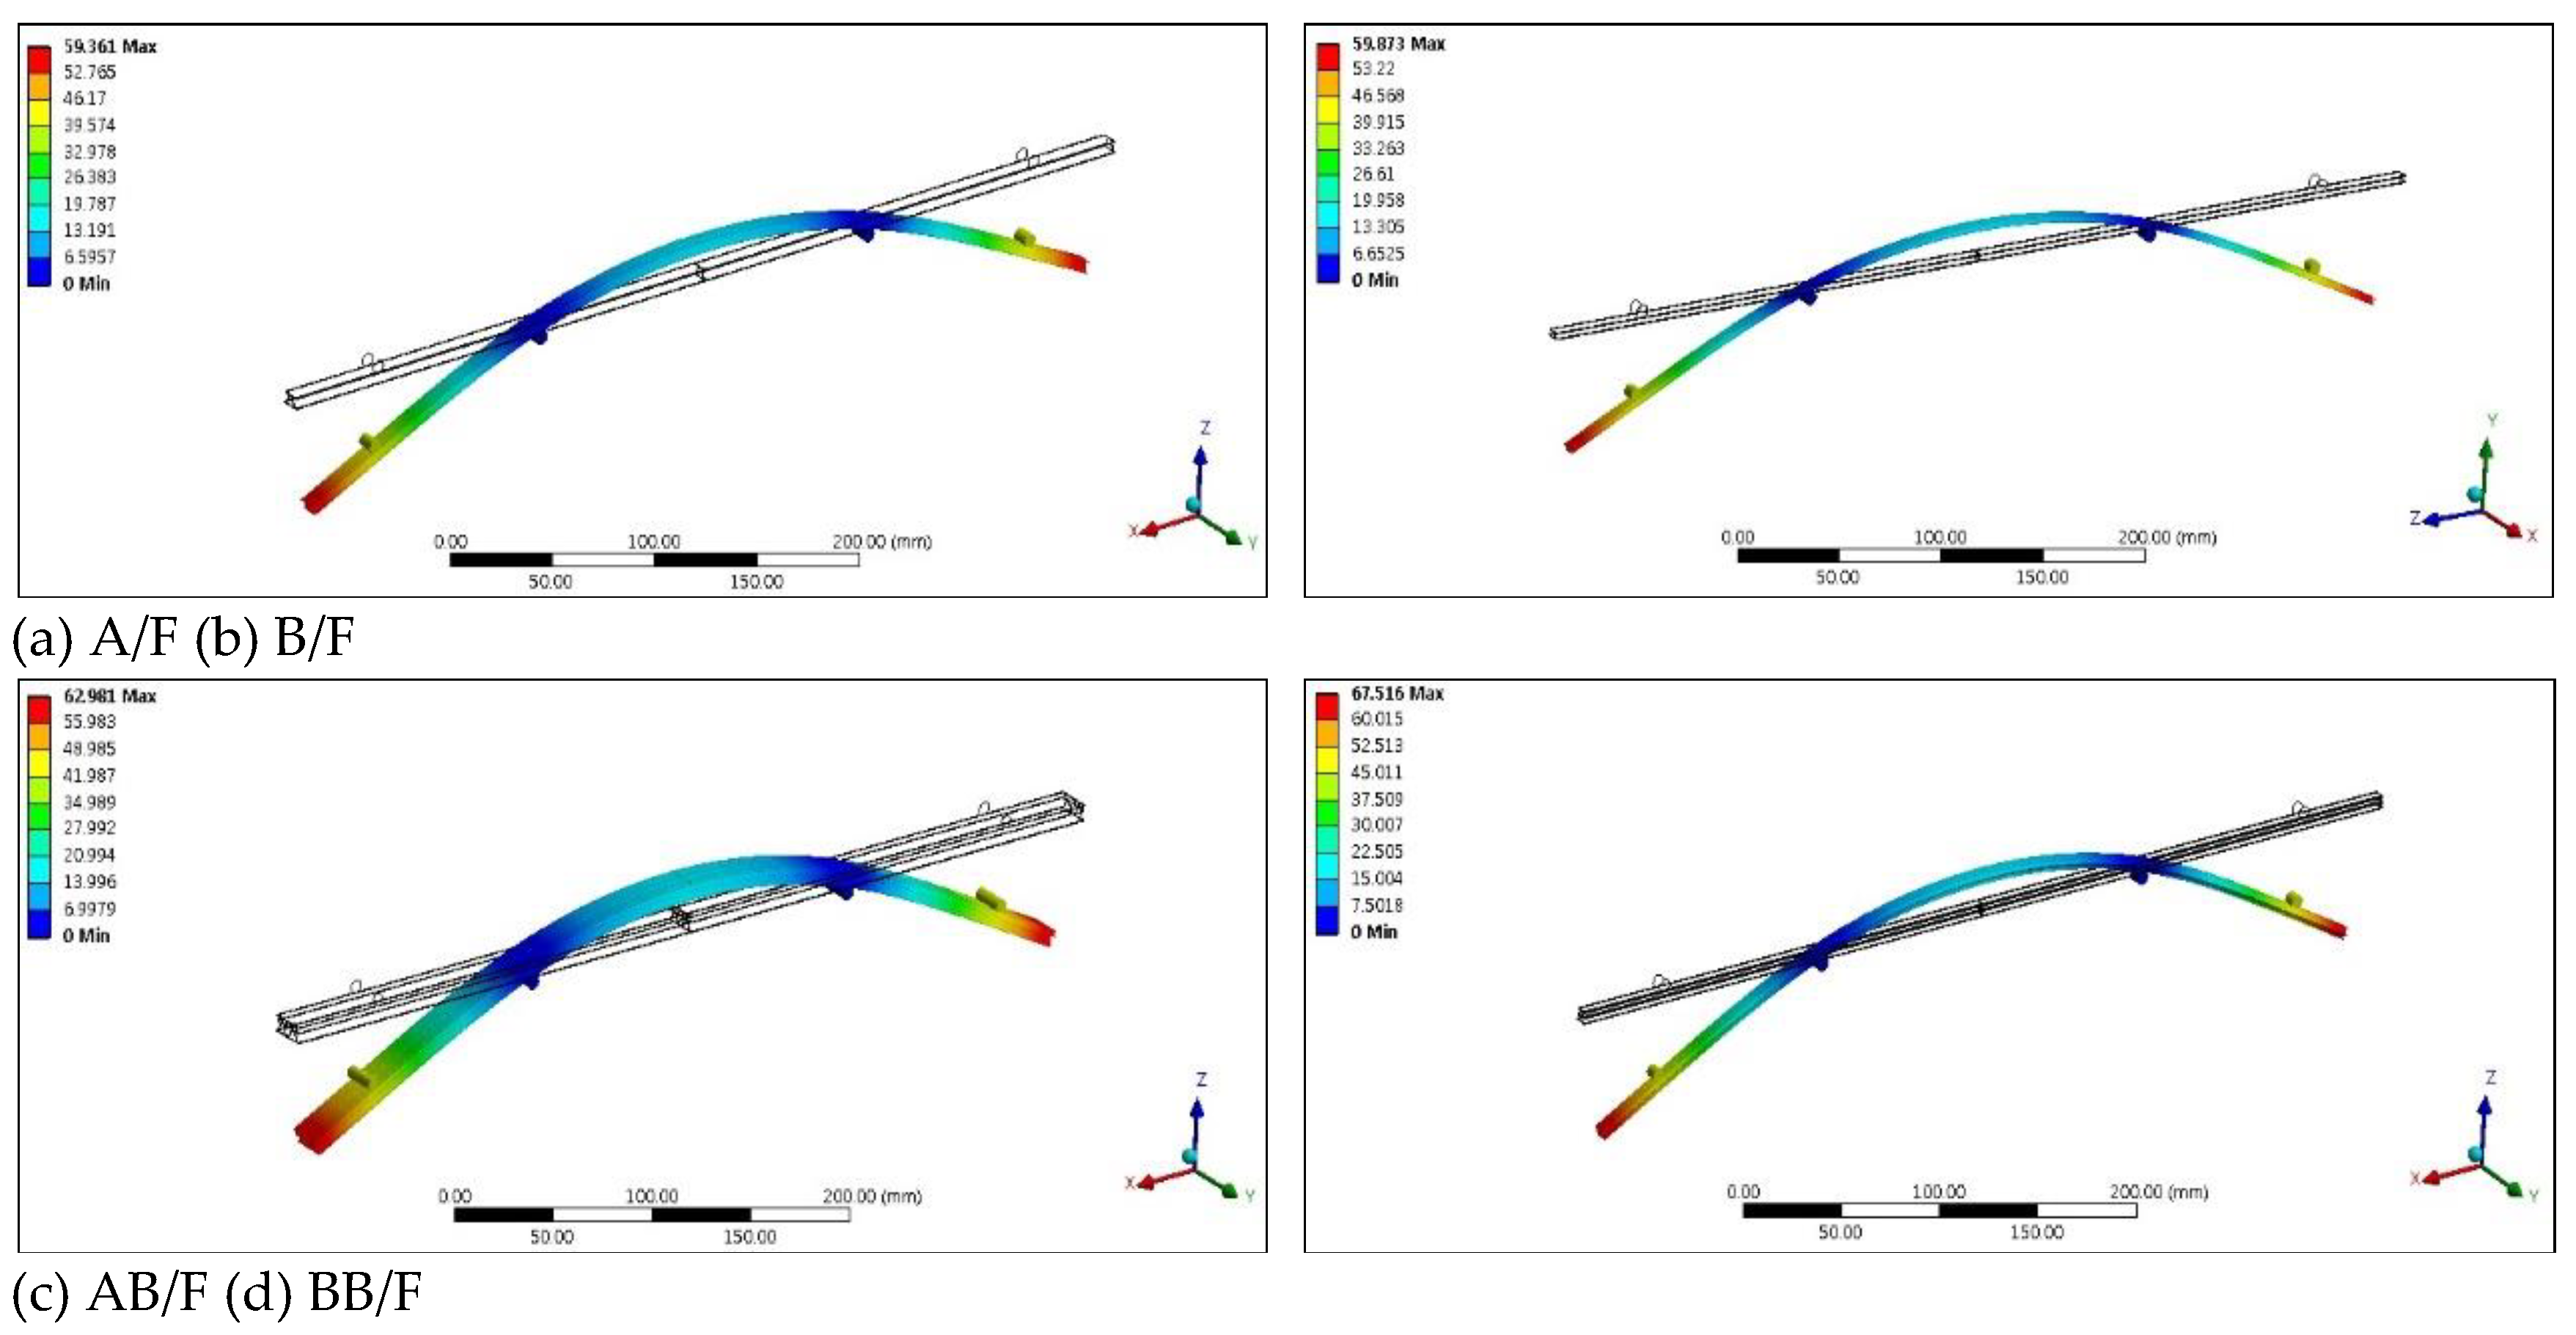
23]. As an example of the FEA simulation results, Figures 3.1 and 3.2 show the stress and displacement distributions at the peak of the bending force versus the deflection plot for CD bending, respectively.
Figure 3.1.
Stress distribution at the peak of the bending force versus deflection plot for CD bending of the corrugated board.
Figure 3.1.
Stress distribution at the peak of the bending force versus deflection plot for CD bending of the corrugated board.
Figure 3.2.
Displacement distribution at the peak of the bending force versus deflection plot for CD bending of the corrugated board.
Figure 3.2.
Displacement distribution at the peak of the bending force versus deflection plot for CD bending of the corrugated board.
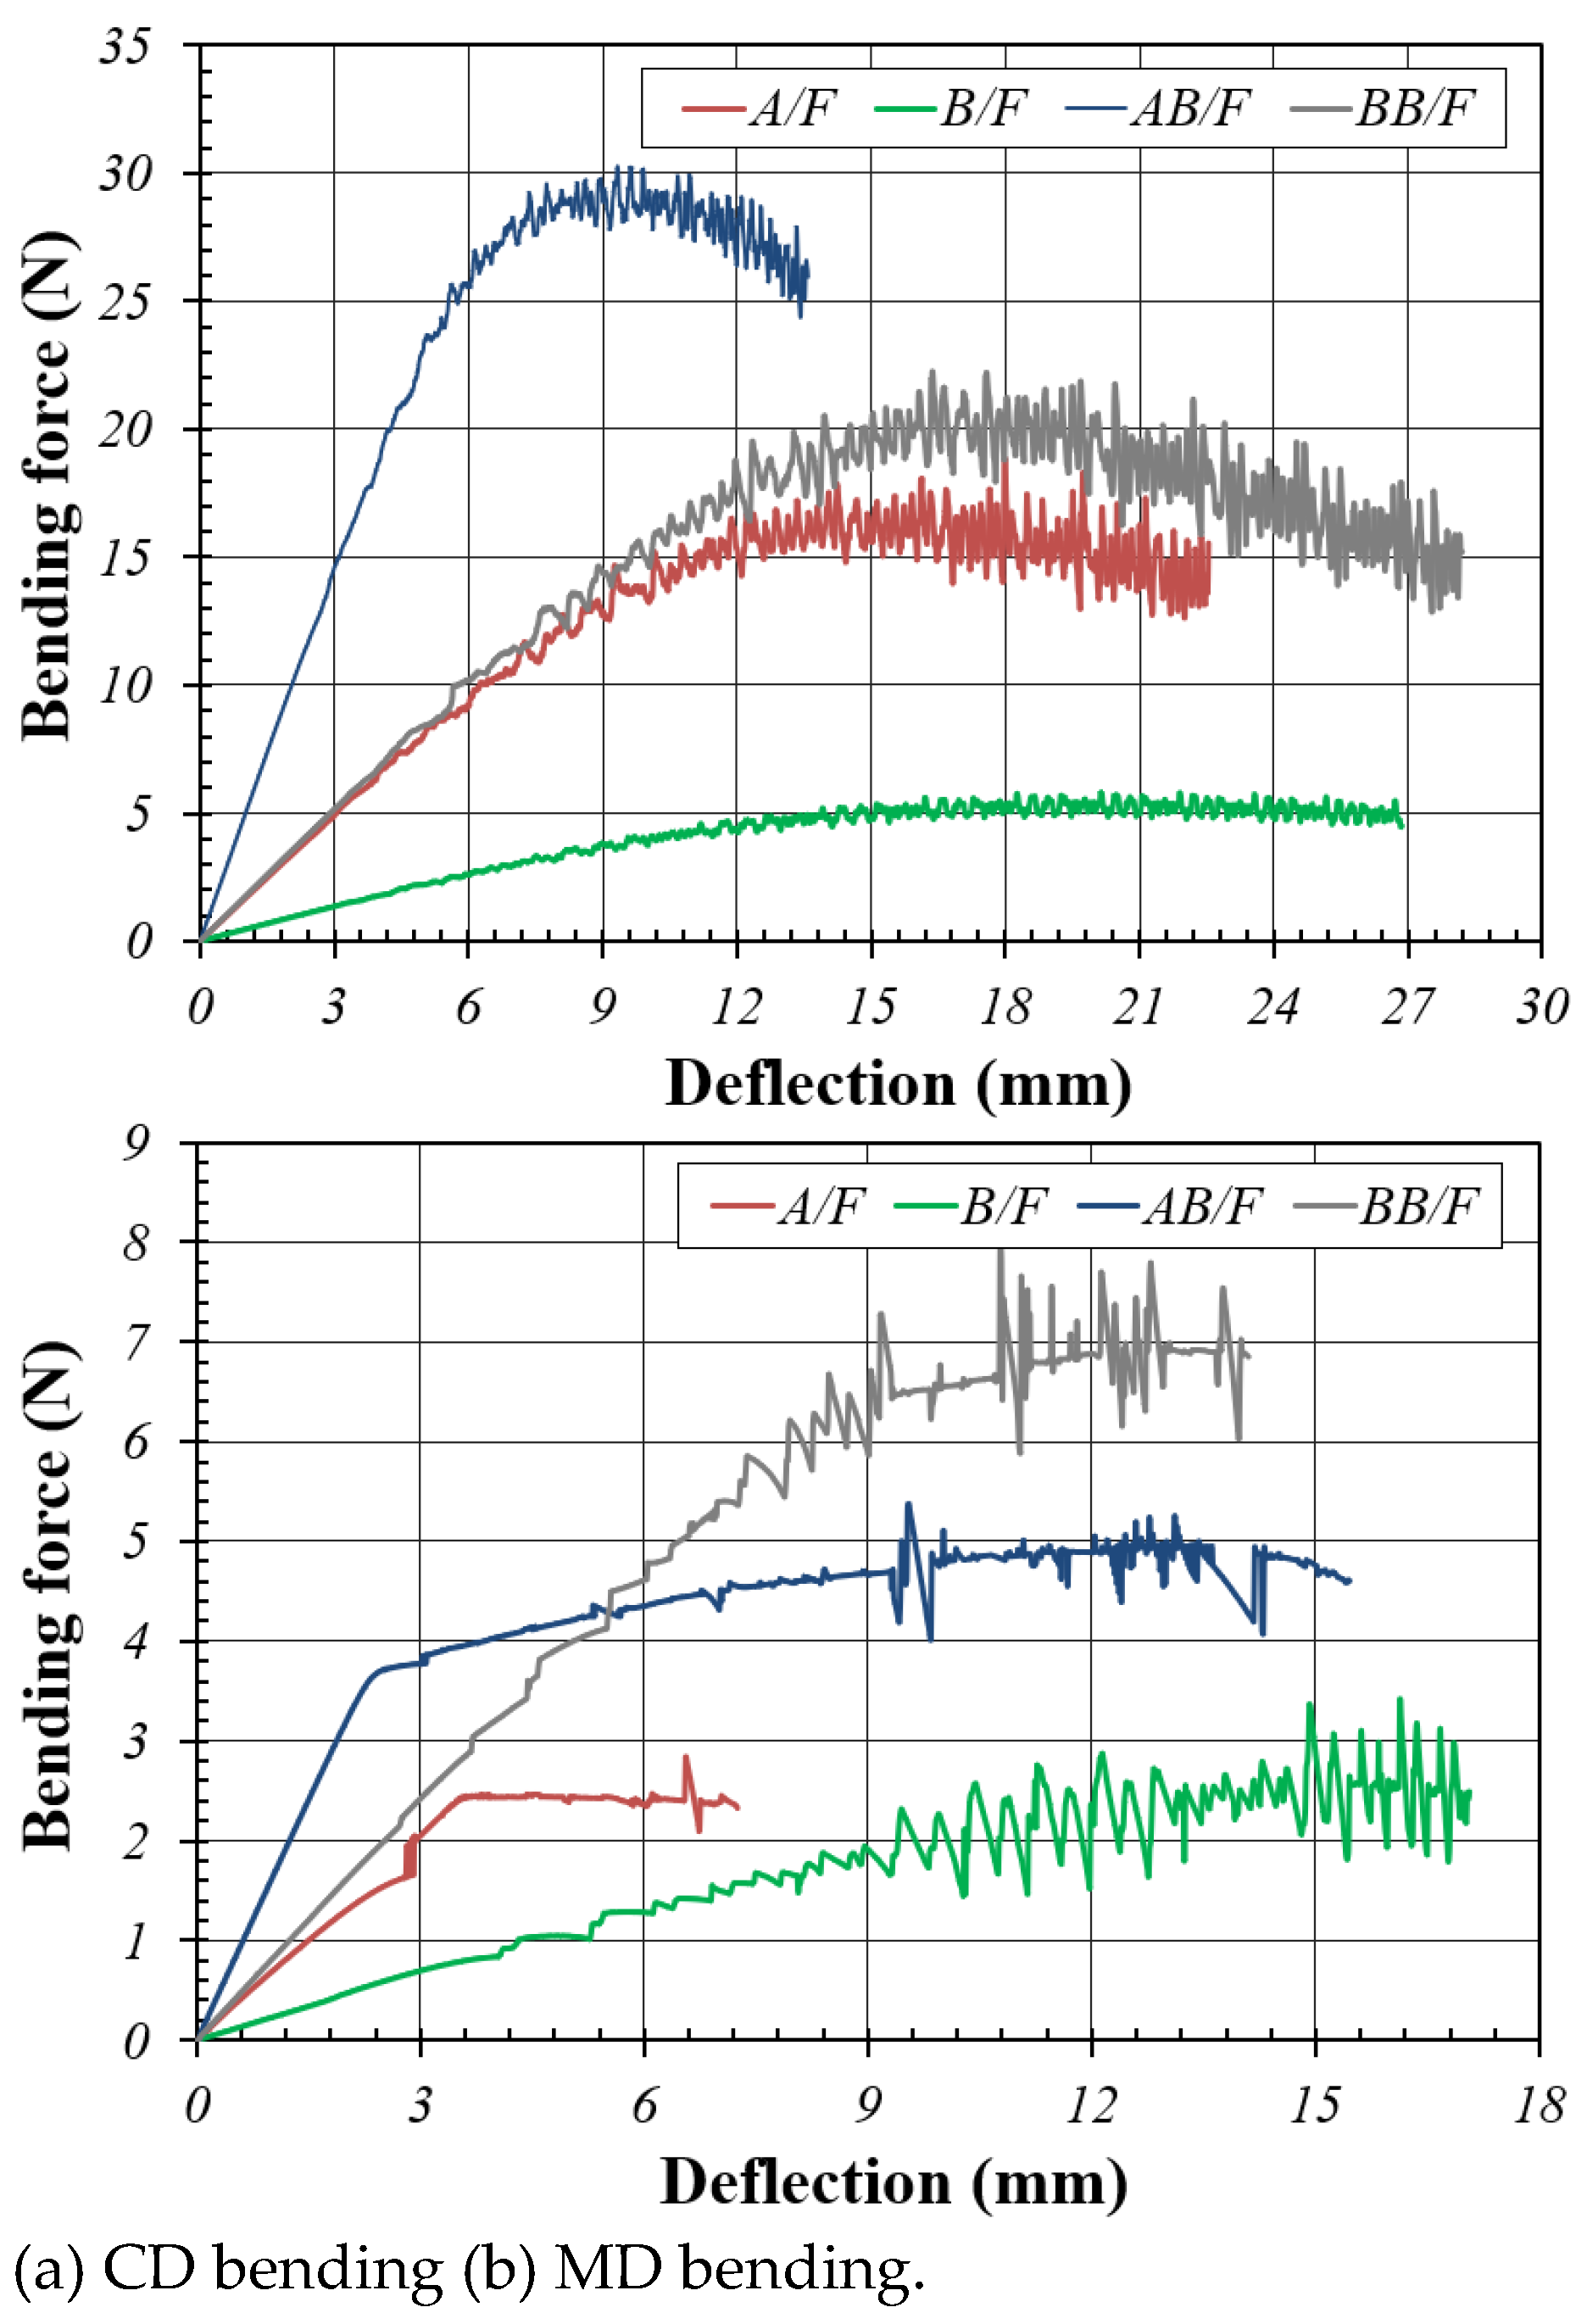
In the FEA simulation of the target corrugated boards, the width of the test specimen modeled by the flute type was different; however, in analyzing the results, the value obtained by converting each FEA result to a width of 50 mm was used. As shown in Figure 3.3(a), the plot between bending force and deflection for CD bending exhibited a clear difference based on flute type; thus, it was possible to obtain information such as the slope and peak value through the plot. However, the plot between bending force and deflection for MD bending shown in Figure 3.3(b) is unreliable because of the pre-failure of the modeled test specimen after a certain deflection. This is because the contact conditions between the modeled test specimen and the modeled loading and supporting anvils varied depending on the flute type.
Figure 3.3.
Plot between bending force and deflection through FEA simulation of the corrugated boards.
Figure 3.3.
Plot between bending force and deflection through FEA simulation of the corrugated boards.
Based on the result of the FEA simulation of the CD bending of the corrugated boards, the slope of the bending force versus deflection plot was in the order of AB/F-DW, BB/F-DW, A/F-SW, and B/F-SW; however, the difference between A/F-SW and BB/F-DW was small. This result can also be well understood from the comparison of bending stiffness calculated using Equation (1) based on the top value (F/δ) of each plot [
5,
24,
26,
30]. As shown in Table 3.1, AB/F-DW was the highest at 16.36, followed by BB/F-DW at 5.91, A/F-SW at 5.27, and B/F-SW at 1.42. These results were found to be closely related to the order of the corrugated board size shown in Table 2.1. The difference in bending stiffness between A/F-SW and BB/F-DW, which had little difference in thickness, was also small. In this study, it was impossible to analyze the effect of the difference in the strength quality of the components on the bending stiffness because the liner and corrugating medium, which were components of the corrugated boards used in this study, were the same in all samples. However, Park et al. [
5] reported that in a study on the bending balance of corrugated boards through FEA simulations, the bending stiffness of the corrugated board had a greater influence on the liner than on the corrugating medium, and in the case of DW, the outer and inner liners had a larger effect on the bending stiffness than the middle liner.
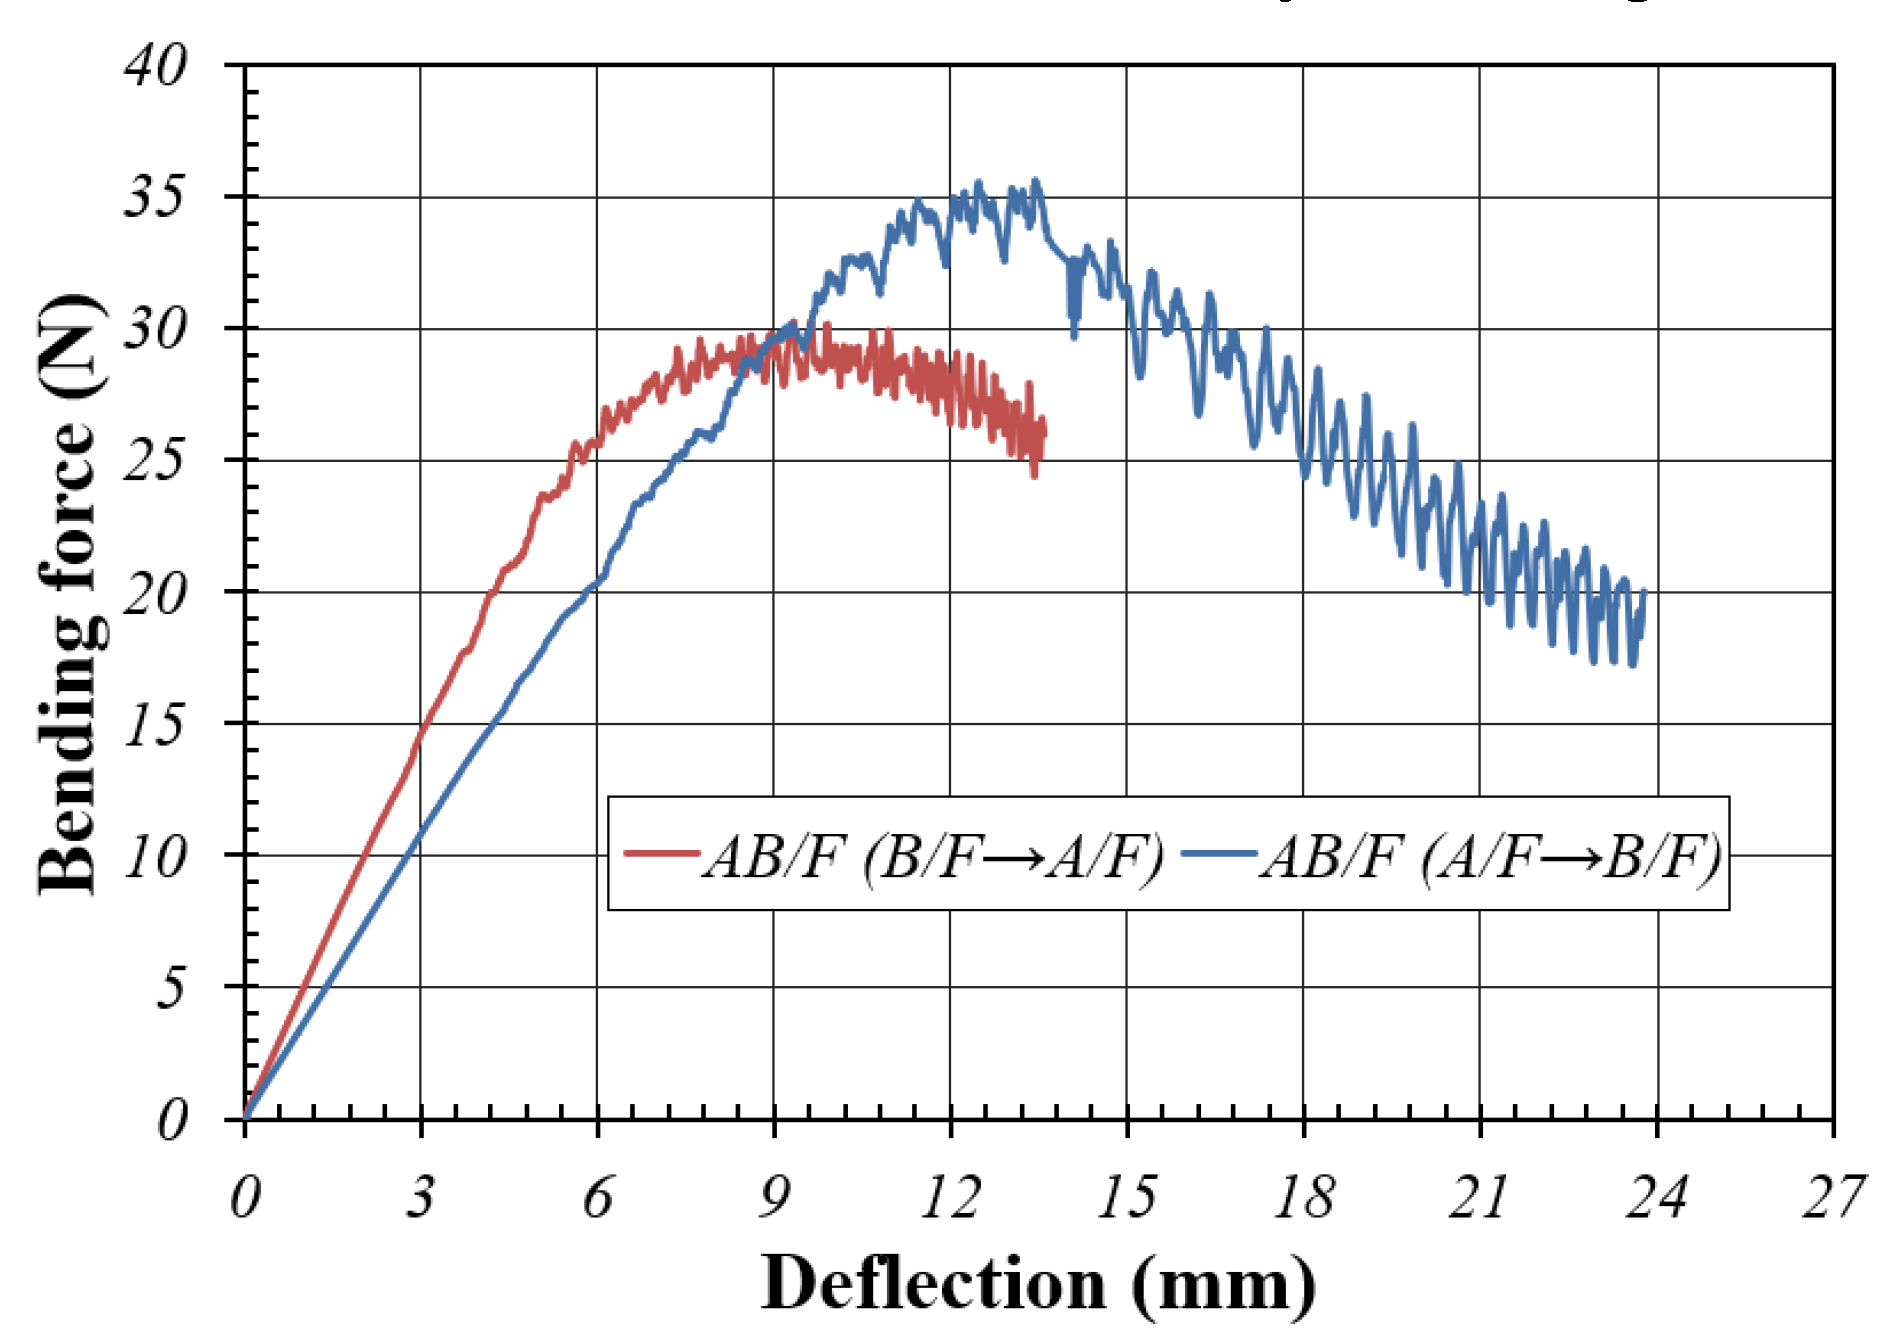
Figure 3.4 shows the plot between bending force and deflection obtained through the FEA simulation according to the direction of CD bending in AB/F-DW. When the bending was B/F→A/F, the slope of the plot (outer-liner was tensioned, and inner-liner was compressed) was larger than that of the opposite A/F→B/F. In the bending stiffness calculated based on the top value, the bending stiffness of the former case was approximately 17.2% larger than that of the latter. This is a condition in which the side panels of the regular slotted container (RSC)-type corrugated package of AB/F-DW are mainly bent out of the package under vertical compression. This phenomenon can also be observed in the FEA results of the ECT FE model for the AB/F-DW corrugated board previously reported by Park et al. [
3], although the load type was different from that in this study. In other words, when the CD FE model with a slenderness ratio above a certain level in AB/F-DW receives edgewise compression, a larger compressive stress acts on the inner liner in contact with the A/F. Consequently, the modeled test specimen bulges in the B/F direction, the inner liner is placed in the compression state, and the outer liner is placed in the tension state, eventually reaching failure.
Figure 3.4.
Plot between bending force and deflection based on the FEA simulation of the CD bending of the AB/F-DW corrugated board.
Figure 3.4.
Plot between bending force and deflection based on the FEA simulation of the CD bending of the AB/F-DW corrugated board.
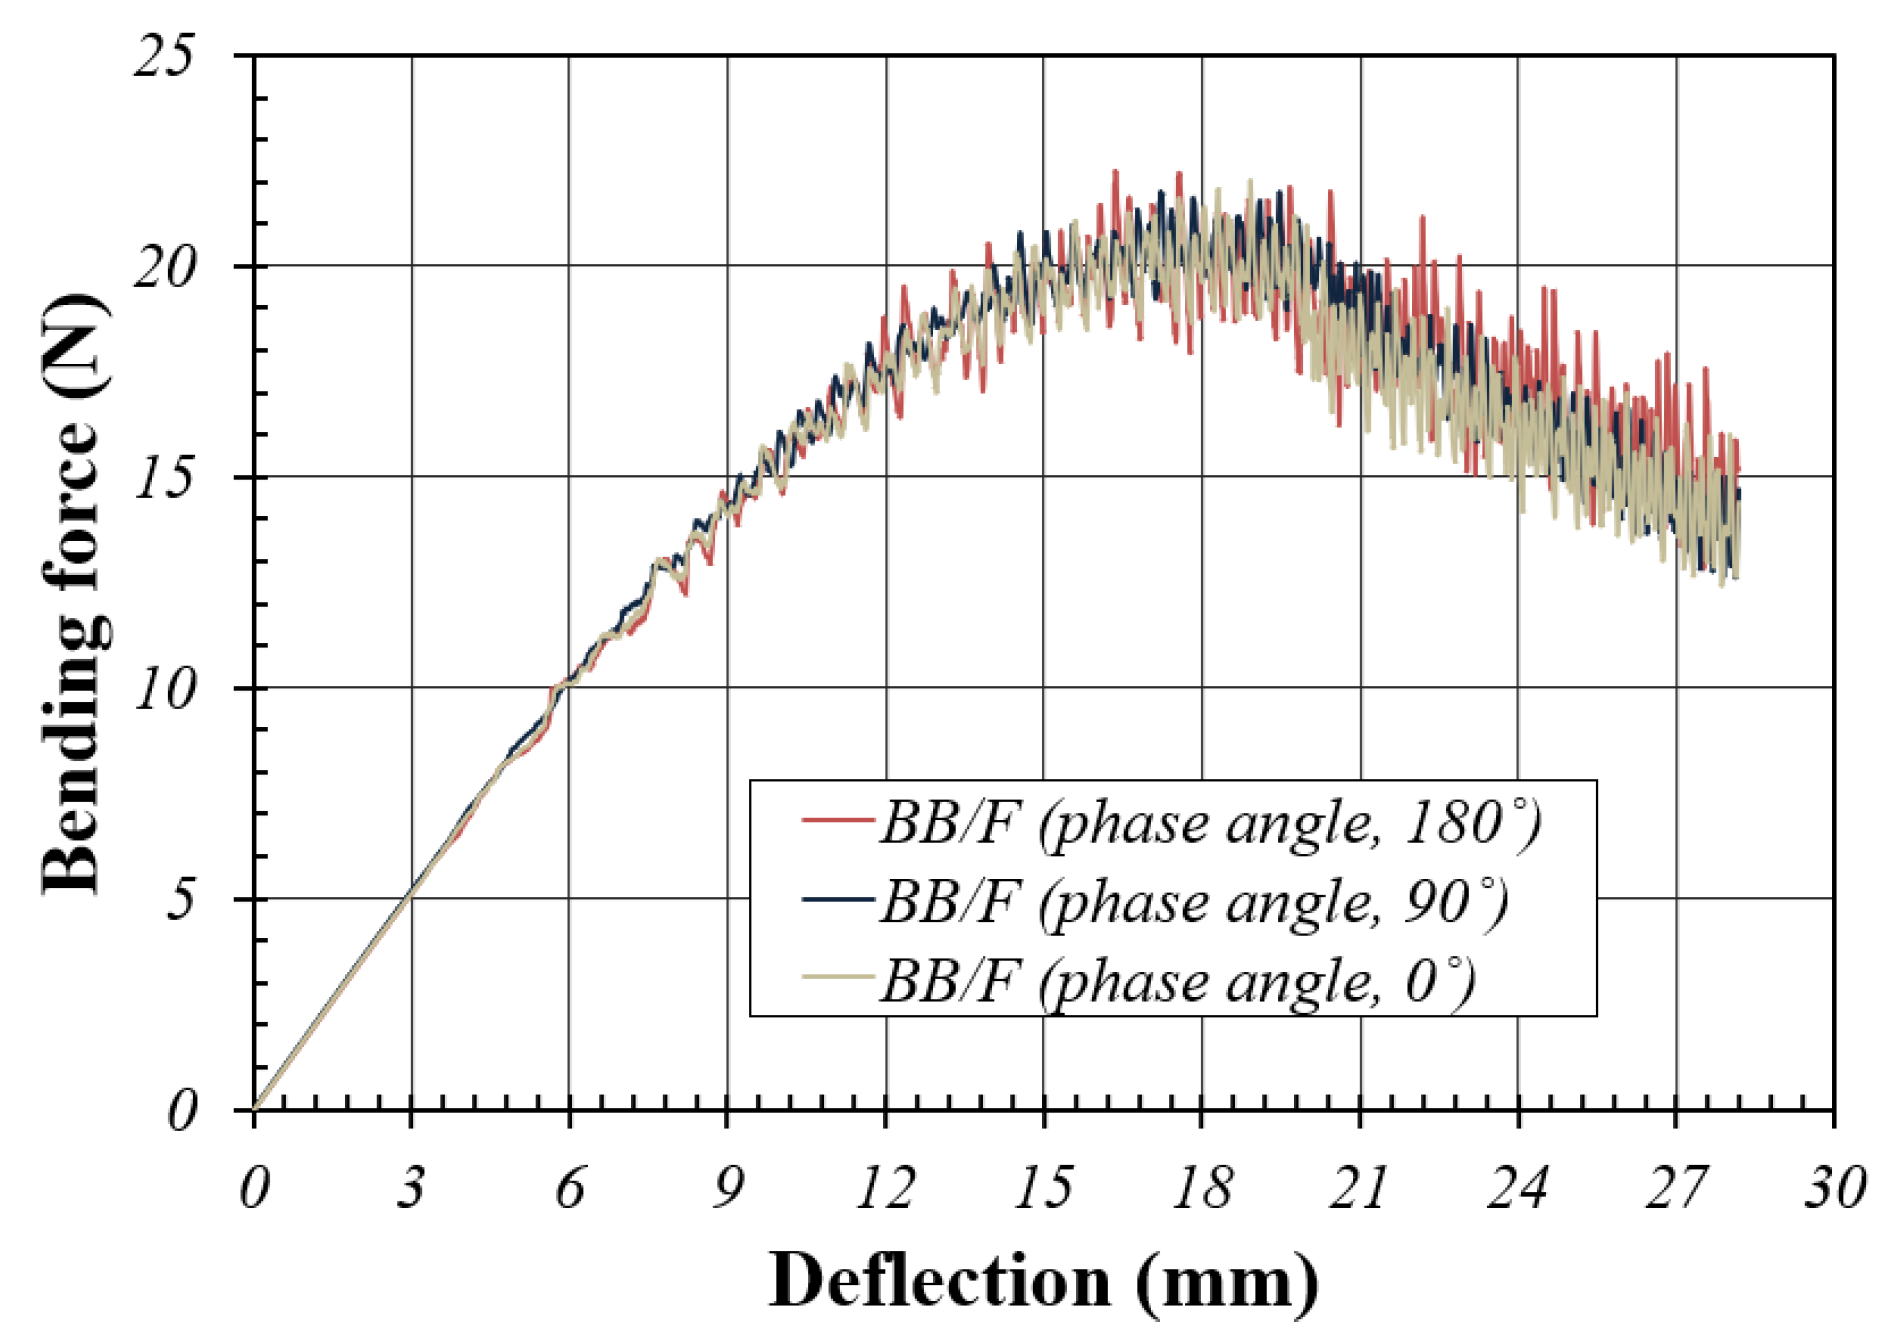
Figure 3.5 shows the FEA simulation results according to the contact condition between the two flutes in the BB/F-DW corrugated board, that is, the phase difference between the bottom of the upper flute and top of the lower flute. Consequently, the difference in bending behavior based on the contact condition of the two flutes was found to be insignificant. Although the load form was different from that in this study, Armentani et al. [
6] published similar FEA results. In other words, in the case of CC/F-DW corrugated board with the same flutes, the critical buckling load for the ECT condition for CD was less than approximately 3% depending on the phase shift of the two flutes (the largest when φ = 0 and the smallest when φ=π); however, the critical buckling load of CB/F-DW corrugated board with different flutes was approximately 27.3% smaller than that of CC/F-DW (phase shift, φ = 0).
Figure 3.5.
Plot between bending force and deflection based on the FEA simulation of the CD bending of the BB/F-DW corrugated board.
Figure 3.5.
Plot between bending force and deflection based on the FEA simulation of the CD bending of the BB/F-DW corrugated board.
3.2. Comparison with the Experimental Study
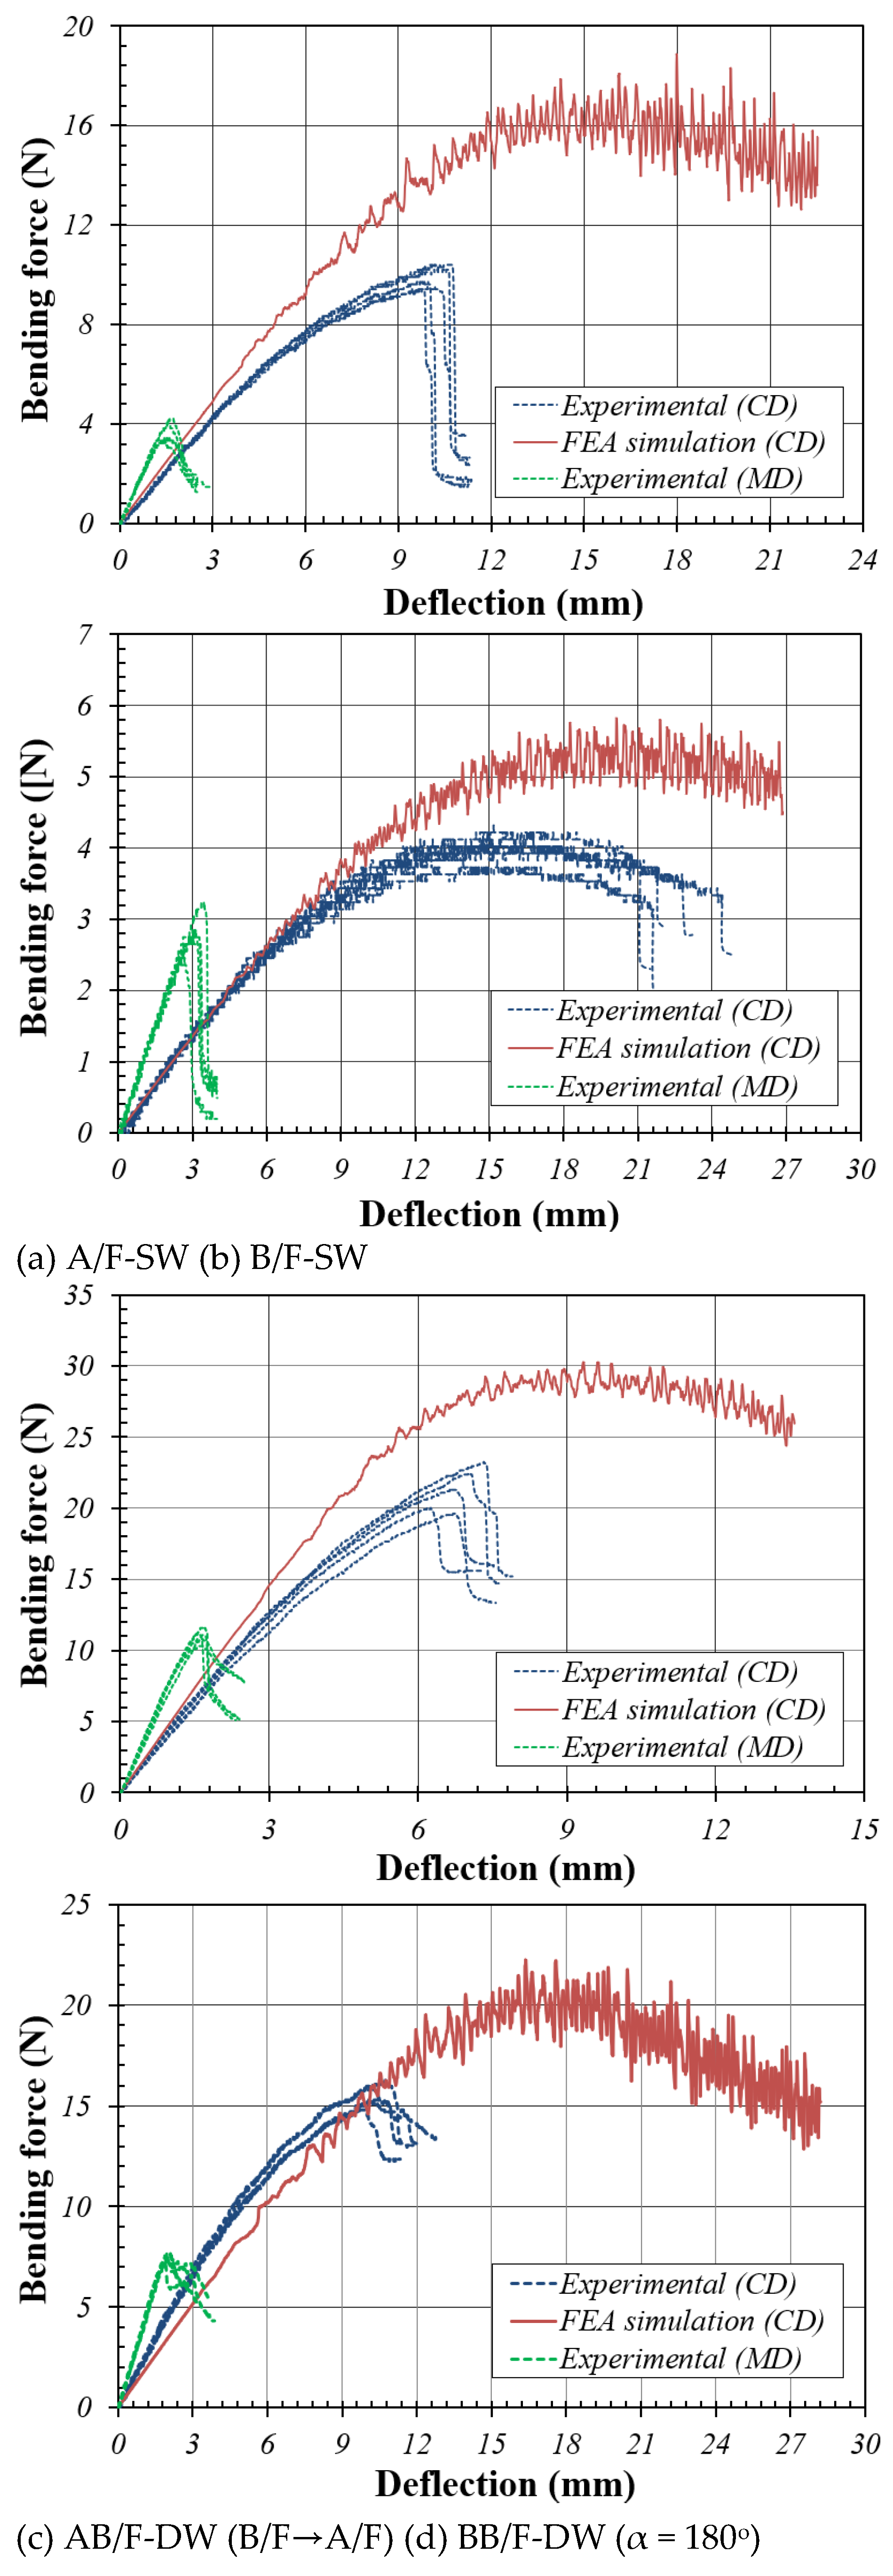
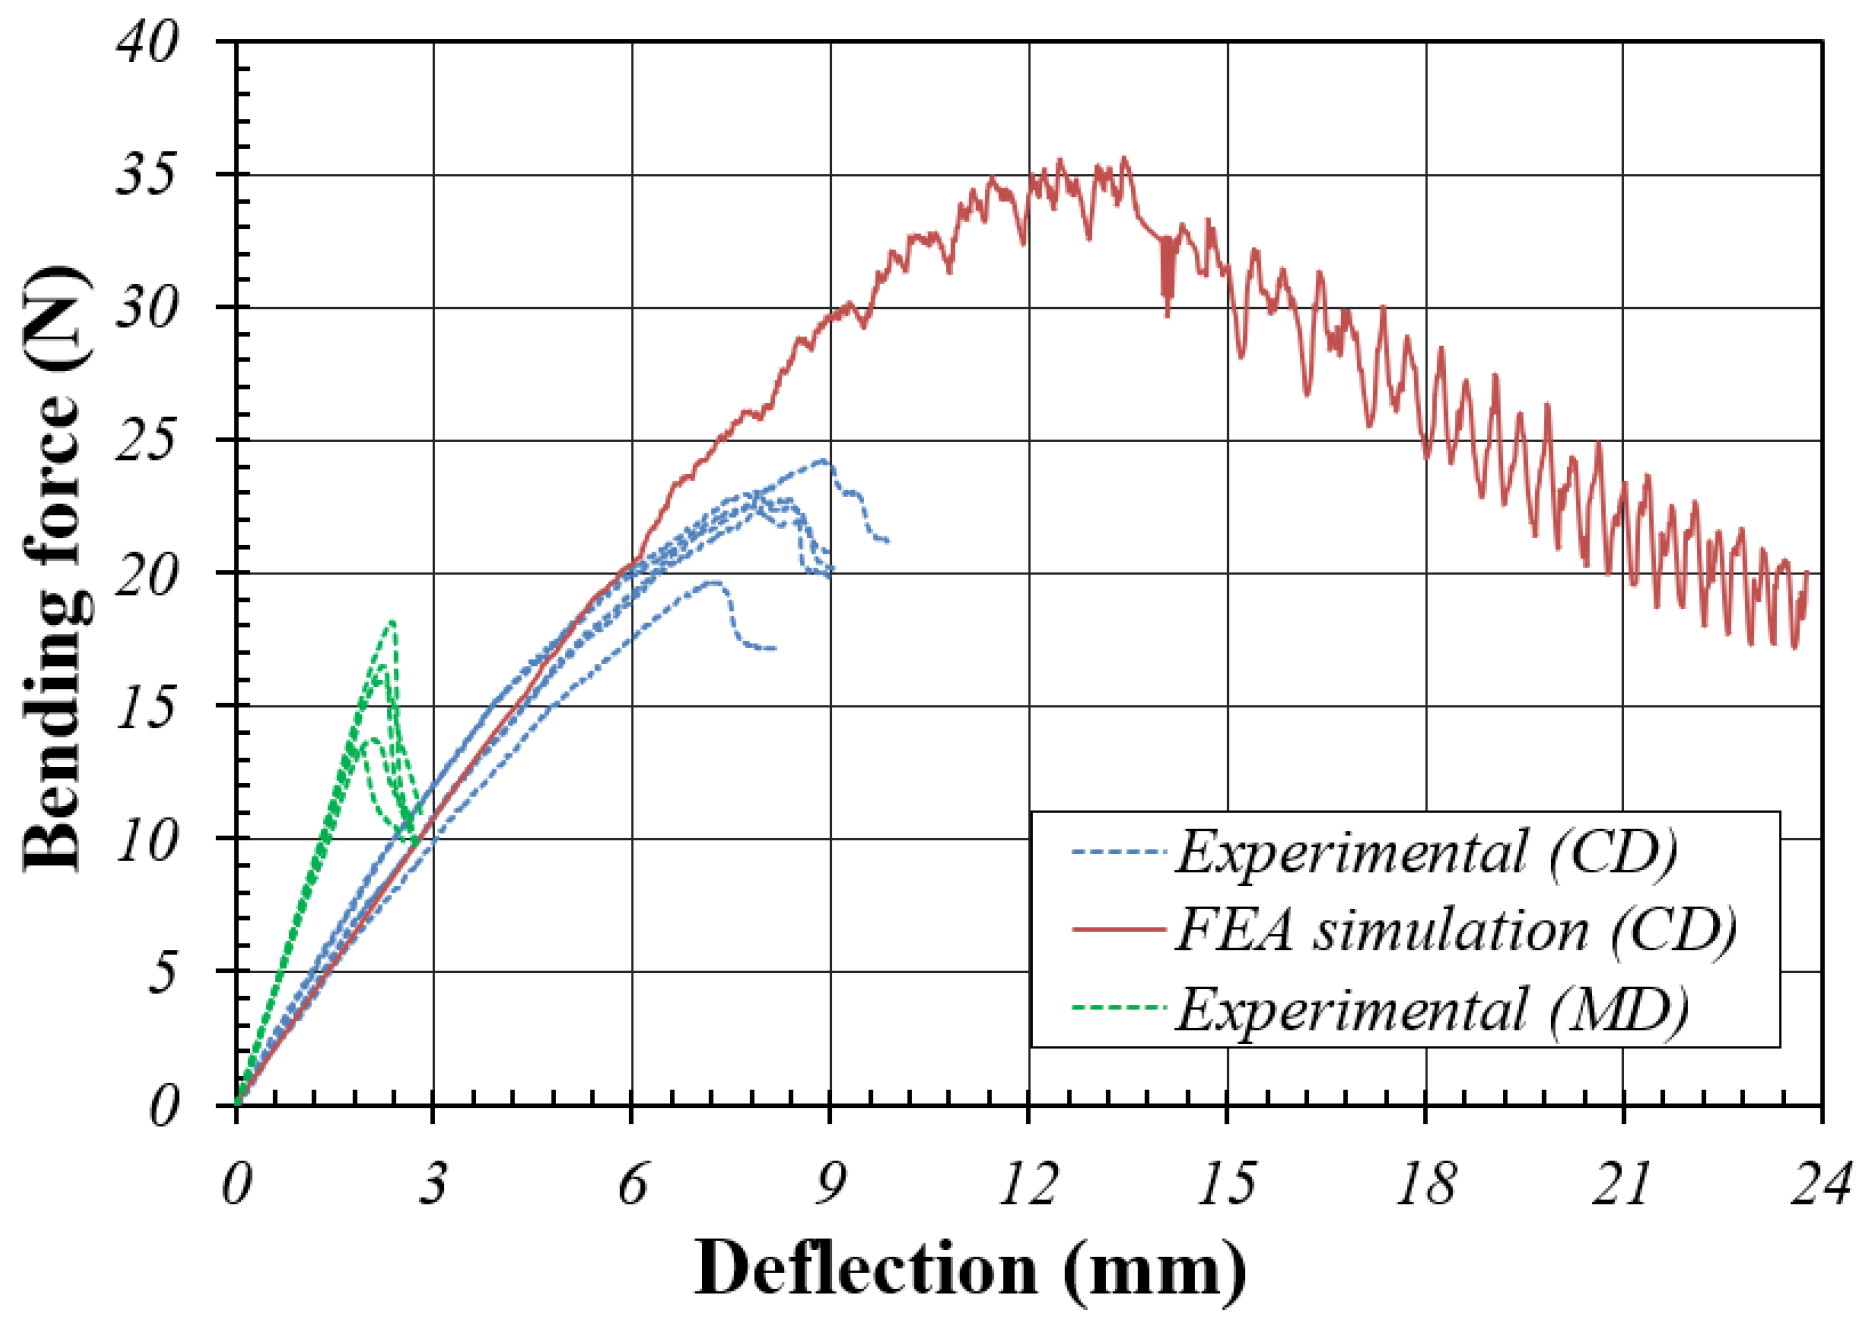
The plot between bending force and deflection based on the FPBT of the corrugated boards is shown in Figure 3.6, along with the FEA simulation results. The slope of the curve obtained from the experiment and FEA simulation exhibited similar trend for CD bending. However, as mentioned earlier, for MD bending, the FEA simulation was impossible because a large error was observed depending on the contact condition between the modeled test specimen and the modeled loading and supporting anvils. In the individual repetition tests, there was little difference between the slope and peak value of the curve for CD bending; however, a large error was observed for MD bending.
The calculated bending stiffness based on the peak value of the plot was in the order of AB/F-DW, BB/F-DW, A/F, and B/F in both CD and MD bending. Based on AB/F of CD bending, A/F corresponded to 32%, B/F-SW 9%, and BB/F-DW 49%, whereas in MD bending, A/F-SW corresponded to 35%, B/F-SW 14%, and BB/F-DW 55%. In addition, the bending stiffness of MD bending was approximately 2.2 to 3.4 times larger than that of CD bending, and the difference was the largest in B/F-SW and the smallest in AB/F-DW. In general, the bending stiffness in CD bending between the FEA simulation and experiment was in good agreement (Table 3.1).
In AB/F-DW, the difference in bending stiffness for CD bending based on the bending direction was approximately 14.7% higher when bending with B/F→A/F through FEA than in the opposite case; however, it was approximately 10.5%, which was smaller than that obtained in the experiment.
Overall, the bending behavior of the corrugated boards for CD bending could be simulated relatively well through FEA simulation; however, for MD bending, FEA simulation was impossible owing to a large decrease in convergence and an error in FEA results depending on the contact conditions with the modeled loading and supporting anvils caused by the non-uniformity of the MD cross-section.
Figure 3.6.
Plots between bending force and deflection based on the different flute types of the corrugated boards.
Figure 3.6.
Plots between bending force and deflection based on the different flute types of the corrugated boards.
Figure 3.7.
Bending force vs. deflection plot (A/F→B/F) of AB/F-DW.
Figure 3.7.
Bending force vs. deflection plot (A/F→B/F) of AB/F-DW.
Table 3.1.
Comparison of bending stiffness through experiment and FEA simulation on target corrugated boards.
Table 3.1.
Comparison of bending stiffness through experiment and FEA simulation on target corrugated boards.
| Flute types |
Max. bending force
(N) |
Peak deflection
(mm) |
Bending stiffness (Nm) |
| Experiment |
FEA |
| CD |
MD |
CD |
MD |
CD |
MD |
CD |
MD |
| A/F |
9.52
10.40
10.20
9.71
9.42 |
3.43
4.22
3.43
4.02
2.34 |
9.94
9.86
10.16
9.44
9.44 |
1.41
1.57
1.50
1.53
1.23 |
4.79
5.27
5.02
5.14
4.99 |
5.04
(±0.16) |
12.16
13.44
11.43
13.14
9.51 |
11.94
(±1.41) |
5.27 |
no |
| B/F |
4.02
4.32
4.12
3.83
4.12 |
3.24
2.45
2.84
2.75
2.84 |
14.27
15.16
14.59
13.94
14.67 |
3.57
2.45
3.00
2.89
3.03 |
1.41
1.42
1.41
1.37
1.40 |
1.40
(±0.02) |
4.54
5.00
4.73
4.76
4.69 |
4.73
(±0.15) |
1.42 |
no |
AB/F
(B/F→A/F)
|
21.40
20.01
22.50
19.60
23.25 |
11.09
11.56
10.79
10.00
11.18 |
6.66
6.18
7.01
6.70
7.32 |
1.65
1.61
1.55
1.56
1.55 |
16.07
16.19
16.05
14.63
15.88 |
15.76
(±0.58) |
33.61
35.90
34.81
32.05
36.06 |
34.49
(±1.50) |
16.36 |
no |
| BB/F |
14.81
15.89
15.20
15.30
16.28 |
7.55
7.65
7.26
7.26
7.16 |
9.55
9.92
9.94
10.06
10.73 |
2.11
2.96
1.91
1.91
1.84 |
7.75
8.01
7.65
7.60
7.59 |
7.72
(±0.16) |
17.89
19.52
19.01
19.01
19.46 |
18.97
(±0.58) |
5.91 |
no |
AB/F_re
(A/F→B/F)
|
22.56
23.05
19.62
22.76
24.23 |
13.44
16.48
18.15
15.89
15.89 |
7.83
7.81
7.11
8.23
8.81 |
1.85
2.19
2.35
2.14
2.01 |
14.41
14.76
13.80
13.83
13.75 |
14.11
(±0.40) |
36.32
37.63
38.62
37.13
34.15 |
36.77
(±1.50) |
13.96 |
no |
4. Summary and Conclusions
In the packaging industry, there is a growing demand for the reduction of packaging waste and use of more eco-friendly materials. One of the existing eco-friendly packaging materials are the corrugated boards. They have high strength and stiffness per unit weight compared with plastic foam-based packaging materials. FEA simulation techniques have been applied to various packaging designs based on corrugated boards with anisotropic properties, saving experimental cost and time and contributing to detailed design problems by adjusting various variables and preparing samples that are inaccessible by experimental methods. In addition, many researchers have pointed out problems such as the validation of FEA material properties and FE modeling to improve the reliability of FEA simulation results in various problems.
In this study, the bending behavior, which is important in corrugated packages, was qualitatively analyzed for various variables through an FE-based simulation, and the possibility of an alternative test method for four-point bending tests on corrugated boards was investigated through a similarity analysis with the experimental results. A detailed summary of the results is provided below.
- (1)
Overall, the CD bending behavior of corrugated boards could be simulated relatively well through FEA simulation; however, it was impossible to simulate the MD bending behavior through FE-based simulation because of a decrease in convergence and a large error caused by the variability of the contact condition of the modeled test specimen with a non-uniform MD cross-section.
- (2)
The thickness of the corrugated board had the largest effect on the CD bending stiffness through FEA simulation; under the same conditions, A/F-SW was approximately 3.7 times that of B/F-SW, and the difference in bending stiffness between A/F-SW and BB/F-DW, where the difference in thickness was not large, was small. Based on the experimental results, compared to the CD bending stiffness of AB/F-DW under the same conditions, BB/F-DW was 49%, A/F-SW was 32%, and B/F-SW was 9%, which agreed well with the FEA simulation results.
- (3)
In AB/F-DW, the difference in CD bending stiffness based on the bending direction was approximately 17.2% greater when bending was performed with B/F→A/F through FEA simulation than the opposite case, and approxiately 10.5%, which was smaller than this through the experiment. However, the difference between the bending behavior (bending force versus deflection) and bending stiffness based on the phase shift between the two flutes constituting BB/F-DW was found to be insignificant.
Author Contributions
Data curation, J.-M.P. and H.-M.J.; formal analysis, J.-M.P. and J.-M.S.; investigation, J.-S.K. and H.-M.J.; software, J.-M.P. and J.-M.S. ; validation, J.-M.P. and J.-M.S.; visualization, J.-M.P. and J.-M.S.; writing—original draft, J.-M.P. and H.-M.J.; writing—review and editing, J.-M.P., J.-S.K. and H.-M.J.; supervision, H.-M.J. All authors have read and agreed to the published version of the manuscript.
Funding
This research received no funding.
Institutional Review Board Statement
Not applicable.
Informed Consent Statement
Not applicable.
Conflicts of Interest
The authors declare no conflicts of interest.
References
- Gilchrist, A.C.; Suhling, J.C.; Urbanik, T.J. Nonlinear finite element modeling of corrugated board. Mech. Cellul. Mater. 1999, 85, 101–106. [Google Scholar]
- Haj-Ali, R.J.; Choi, B.S.; Wei, R. Refined nonlinear finite element models for corrugated fiberboards. Compos. Struct. 2009, 87, 321–333. [Google Scholar] [CrossRef]
- Park, J.M.; Park, M.J.; Choi, D.S.; Jung, H.M.; Hwang, S.W. Finite Element-based Simulation for Edgewise Compression Behavior of Corrugated paperboard for Packaging of Agricultural Products. Applied Sciences 2020, 10, 6716. [Google Scholar] [CrossRef]
- Park, J.M.; Sim, J.M.; and Jung, H.M. Finite Element Simulation of the Flat Crush Behavior of Corrugated Packages. Appl. Sci. 2021, 11, 7867. [Google Scholar] [CrossRef]
- Park, J.M.; Kim, G.S.; Kwon, S.H. Finite element analysis of corrugated board under bending stress. J. Fac. Agric. Kyushu Univ. 2012, 57, 181–188. [Google Scholar] [CrossRef] [PubMed]
- Armentani, E.; Caputo, F.; Esposito, R. FE analyses of stability of single and double corrugated boards. In Proceedings of the 4th International Conference on Axiomatic Design, Firenze, Italy, 13–16 June 2006; 13-16.
- Rahman, A.A.; Abubakr, S. A finite element investigation of the role of adhesive in the buckling failure of corrugated fiberboard. Wood Fiber Sci. 2004, 36, 260–268. [Google Scholar]
- Jiménez, M.A.; Liarte, E. Simulation of the edge crush test of corrugated paperboard using ABAQUS. In Proceedings of the ABAQUS World Users Conference 2003, Munich, Germany, 4-6 June 2003. [Google Scholar]
- Biancolini, M.E. Evaluation of equivalent stiffness properties of corrugated board. Compos. Struct. 2005, 69, 322–328. [Google Scholar] [CrossRef]
- Aboura, Z.; Talbi, N.; Allaoui, S.; Benzeggagh, M.L. Elastic behavior of corrugated cardboard-Experiments and modelling. Compos. Struct. 2004, 63, 53–62. [Google Scholar] [CrossRef]
- Hallbäck, N.; Korin, C.; Barbier, C. Finite element analysis of hot melt adhesive joints in carton board. Packag. Technol. Sci. 2014, 27, 701–712. [Google Scholar] [CrossRef]
- Han, J.G.; Park, J.M. Finite element analysis of vent/hand hole designs for corrugated fiberboard boxes. Packag. Technol. Sci. 2007, 20, 39–47. [Google Scholar] [CrossRef]
- Urbanik, T.J.; Saliklis, E.P. Finite element corroboration of buckling phenomena observed in corrugated boxes. Wood Fiber Sci. 2003, 35, 322–333. [Google Scholar]
- FEFCO NO. 8. Edgewise Crush Resistance of Corrugated Fiberboard; FEFCO: Brussel, Belgium, 1997.
- Korea Corrugated Packaging Case Industry Association (KCCA). 2013 production status of corrugated package. Corrugated Packaging Logistic 2014, 114, 50–54. [Google Scholar]
- Korean Standard Association (KSA). Determination of Edgewise Crush Resistance of Corrugated Fiberboard; KS M 7063-1; KSA: Seoul, Korea, 2021. [Google Scholar]
- TAPPI T 838 cm-12. Edge Crush Test Using Neckdown; TAPPI: Peachtree Corners, GA, USA, 2009. [Google Scholar]
- Fadiji, T.; Ambaw, A.; Coetzee, C.J.; Berry, T.M.; Opara, U.L. Application of finite element analysis to predict the mechanical strength of ventilated corrugated paperboard packaging for handling fresh produce. Biosystems Engineering 2018, 174, 260–281. [Google Scholar] [CrossRef]
- Fadiji, T.: Coetzee, C.; Opara, U.L. Compression strength of ventilated corrugated paperboard packages: Numerical modelling, experimental validation and effects of vent geometric design. Biosystems Engineering 2016, 151, 231–247. [Google Scholar] [CrossRef]
- Korean Standard Association (KSA). General rules for air hole design purposes of corrugated fiberbioard case for optimum compression load: KS T 1020; KSA; Seoul, Korea, 2012.
- Korean Standard Association (KSA). Corrugated fibreboards for shipping containers: KS T 1034; KSA; Seoul, Korea, 2020.
- Tappi T 820. Flexural stiffness of corrugated board. TAPPI: Peachtree Corners, GA, USA, 2009.
- American Society for Testing and Materials. ASTM D 685. Practice for conditioning paper and paper products for testing. ASTM: West Conshohocken, PA, USA, 2008.
- Markstrom, H. 2005. Testing methods and instruments for corrugated board, Stockholm: Lorentzen & Wettre.
- Lorentzen &Wettre. Lorentzen & Wettre Handbook; Pulp and Paper Testing; Lorentzen & Wettre: Kista, Sweden, 2013.
- Lee, M.H.; Park, J.M. Flexural stiffness of selected corrugated structures. Packaging Technology and Science 2004, 17, 275–286. [Google Scholar] [CrossRef]
- ANSYS Inc. ANSYS Design Xplorer 14.5, Workbench User Guide; ANSYS Inc.: Canonsburg, PA, USA, 2014.
- Baum, G.A.; Brennan, D.C.; Habeger, C.C. Orthotropic elastic constants of paper. Tappi 1981, 64, 97–101. [Google Scholar]
- Pilkey, W.D. Formulas for Stress, Strain and Structure Matrices; John Wiley & Sons, Inc.: New York, NY, USA, 1994; p. 1536. [Google Scholar]
- Urbanik, T.J. Effect of corrugated flute shape on fiberboard edgewise crush strength and bending stiffness. J. Pulp and Paper Science 2001, 27, 330–335. [Google Scholar]
|
Disclaimer/Publisher’s Note: The statements, opinions and data contained in all publications are solely those of the individual author(s) and contributor(s) and not of MDPI and/or the editor(s). MDPI and/or the editor(s) disclaim responsibility for any injury to people or property resulting from any ideas, methods, instructions or products referred to in the content. |
© 2024 by the authors. Licensee MDPI, Basel, Switzerland. This article is an open access article distributed under the terms and conditions of the Creative Commons Attribution (CC BY) license (http://creativecommons.org/licenses/by/4.0/).
