1. Introduction
In recent years, the use of unmanned aerial vehicle (UAV) has increased exponentially and the threats brought by UAV users, such as unauthorized imaging and filming in restricted areas, illegal surveillance, air collision, drug smuggling, terrorist attacks and radio frequency (RF) interference. Accurate identification of UAV and other aerial targets is the most important measure to ensure safety and security[
1]. Therefore, it is necessary to remotely detect the UAV, which has led to many efforts and research projects for UAV detection. Radar technology is widely used in UAV detection because of its universality and reliability, and radar communication integration technology has become a hot research field in monitoring air targets because of its low cost and wide coverage. In this field, Orthogonal Frequency Division Multiplexing (OFDM) signal has gained an increasingly prominent position due to its wide application in communication systems including digital broadcasting, mobile communication and WLAN. In addition, OFDM signal usually provides the advantage of wide bandwidth, which makes it become the focus of attention in the field of integrated radar and communication[
2].
Compared with traditional radar signals, although OFDM signals show considerable performance in communication, weak signals are often masked by strong signals because the signal form is not specially designed for radar detection. These strong signals include strong target signals and strong clutter, etc. But in practical applications, the ambiguity floor of strong clutters is the primary factor obscuring targets; to obtain better detection performance, relevant researches mainly focus on clutter suppression [
3,
4,
5,
6,
7,
8,
9,
10,
11,
12].
To increase the sensing function in the existing These clutter suppression techniques are mainly based on the difference in spectrum between the moving target echo and the clutter, suppress clutter by filtering method and extract the target signal. To achieve a higher detection probability, it is imperative to suppress strong clutters characterized by a high ambiguity floor. The Extensive Cancellation Algorithm (ECA) [
3] was initially introduced by projecting the signal onto the direction orthogonal to the clutter subspace, a method not confined to a specific signal model. However, when suppressing a large region on RD map, a sizable clutter dictionary matrix is required, posing significant challenges in terms of storage and computational requirements in many cases. Hence, aiming at reducing memory load, improvements mainly revolve around segmentation [
4,
5,
6], iteration [
7,
8,
9], and approximation [
10,
11,
12]. Firstly, there are methods pursuing higher performance by processing on small fragments, such as ECA Batches (ECA-B) [
4], sliding ECA (ECA-S) [
5] and generalized sub-band cancellation (GSC) [
6]. ECA-B and ECA-S achieve wider notch in Doppler domain, while GSC achieves wider notch in range domain. Although the memory and computational load are diminished due to the wide notch compared with ECA, they lack robustness to the intricate clutter distribution, who must take a trade-off among notch depth, notch width and memory load. Then, the iterative methods [
7,
8] are considered, with the continuous suppression technique [
7,
8,
12] to deal with “off-grid” clutter. However, the multi-path returns are not orthogonal to each other in most cases, leading to computational inefficiency [
12]. Finally, ECA by sub-carrier (ECA-C) [
9] and its improved versions [
10,
11] gain computational advantage by leveraging OFDM signal model in sub-carrier domain.
However, there are some problems in these clutter suppression technologies [
13,
14]. First of all, When the clutter is time-varying, the clutter has a certain speed, so the improvement factor of moving target display (MTI) is limited, and it is difficult to fully meet the clutter suppression requirements. For instance, suppression of fixed clutter by cancellation method, the improvement factor can reach more than 60dB; Such as, the velocity of wave clutter in bad sea conditions may even exceed 10 m/s, so it is difficult to carry out clutter cancellation completely. In addition, only the amplitude information of the radar echo signal is used in the detection process, and the false alarm rate can be well controlled in the weak clutter environment, but in the complex strong clutter environment, the clutter and the target are not easy to distinguish in amplitude, and Suppressing clutter only by controlling the amplitude threshold can easily lead to the loss of target trace. Therefore, in the integrated radar communication system using OFDM signals, the conventional radar clutter suppression technology will produce serious clutter residue in the face of complex and strong clutter environment such as sea surface, mountains and cities, resulting in a large number of false alarms [
15].
Too many false alarms exist will seriously affect radar target detection performance. On the one hand, in the initial process of the target track, if the extracted trace contains many false alarms, these false alarms will join in the establishment of the track and lead to false track, which will not only waste system resources but also increase the calculation and complexity of computer data processing, so the existence of false alarms directly restricts the quality of radar automatic track initiation. On the other hand, the false alarm points may be associated with the existing correct track, which will lead to the deviation of the track and make the radar tracking module unable to complete the tracking task. Therefore, it is of great significance to study the methods to suppress false alarms [
16].
There are many ways to suppress false alarms in radar field. For example, the false target recognition method based on measurement fusion is adopted to effectively identify true and false targets and reduce the false alarm probability of radar [
17]. A block filtering method for ground surveillance radar is proposed [
18] which can reduce false alarms by calculating the risk coefficient of the target. Reference [
19] using the method of inter-frame data processing, the clutter in a single stagnation area can be processed in time to reduce the false alarms. An Error detection method was used to suppress false alarms [
20], but the suppression effect was limited. Block filtering method based on clutter feature evaluation can effectively distinguish radar targets and clutter by comprehensive feature factors [
21,
22], features extraction and support vector machine are used to eliminate false alarms. Reference [
23] present an adaptive clutter suppression method for airborne pulse Doppler radar. Based on the comprehensive analysis of the clutter generation process, this method dynamically reduces the false alarm by using the specific frequency and distance characteristics of clutter to improve the radar detection performance. Since the false alarms generated by the residual clutter after clutter suppression has similar two-dimensional distribution with the target, it is difficult to distinguish them. When there are numerous false alarm points exist, it is still difficult to ensure that the target will not be misjudged as a false alarm while maintaining a certain false alarm rate.
Considering that the false alarms are primarily generated by the clutter residue after clutter suppression, it exhibits non-stationary characteristics across multiple dimensions such as time and space. Conversely, the target points arise from the echo reflected by the actual targets and demonstrates stable characteristics in multiple dimensions such as time and space. To suppress false alarms while retaining the target, this paper analyzes the characteristics of the spatial-temporal stationarity of the target signal and clutter in a short time interval, using the stationarity differences between the target signal and the false alarm in range, Doppler, energy and azimuth, and proposes a radar false alarm suppression method based on the target spatial-temporal stationarity. Simulation and experiments show that this method can effectively reduce false alarms and significantly improve the efficiency of target detection. The main contributions of this paper are summarized as follows:
Firstly, the time domain model of radar signal is introduced and analyzes the cause of false alarm points in RD spectrum of radar echo signal after clutter suppression. The difference of spatial-temporal stationarity between clutter and target in a short time is analyzed from the perspective of signal stationarity, which provides a theoretical basis for false alarm suppression algorithm proposed later.
Secondly, the principle and specific steps of radar false alarm suppression method based on target spatial-temporal stationarity are analyzed in detail. Including: to achieve sub-frame data with short time intervals, a multi-frame sliding matched filtering method is proposed, that is, the data of two adjacent frames are spliced and then sliding for matching filtering, and an explanation is provided on how to determine the length of the sliding window; Then the peak points with higher energy than floor energy in each sub-frame are extracted, and the azimuth of each peak point is obtained by using the single snapshot angle measurement method based on sparse representation. Combining the information of range, velocity and energy, the Mahalanobis distance between the peak points in adjacent sub-frames is calculated, and the target is selected according to the Mahalanobis distance between the peak points. Finally, the target track generation method based on spatial-temporal stationarity is used to generate the track and further eliminate the residual false alarms.
Lastly, the simulation experiment and field experiment are carried out. Simulation results show that the false alarm suppression algorithm can effectively reduce the false alarm points remaining after clutter suppression while retaining the weak target signal. In addition, through the comparison between the target tracking results after the field experiment and the actual UAV track, it is found that more ideal target tracking results can be obtained after the false alarm is suppressed by the false alarm suppression algorithm,
The outline of this paper lies is as follows: The time-domain radar signal model is given and analyzes the stationarity difference between the target signal and the false alarm in a short time in Section II. In Section III the principle of the algorithm proposed in this paper is analyzed in detail and the specific steps are explained. The Section IV verifies the algorithm with simulation data. The Section V uses false alarm suppression algorithm in field experiment. The Section VI draws a conclusion.
2. Theoretical Model
2.1. Radar Echo Model in Time Domain
Given that the radar base-band signal is
, it is assumed that the radar receiver meets the following conditions: (1) the receiving channel contains
non time-varying clutters (including direct wave) and
time-varying clutters; (2) There are
moving targets in the monitoring area. So the radar received signal
can be expressed as
Where w(t) is additive noise. Obviously, there aretime-varying clutters, time-varying clutters andtargets in (1), where、、represent complex amplitude, delay and Doppler frequency, respectively. For time-varying clutters, andare time-varying non-stationary random signals. Due to the presence of clutter and noise, the target is always hidden and difficult to find in field experiment.
For better detection performance, clutter suppression of radar echo is needed. The existing time domain algorithm takes advantage of the characteristic that the direct wave and clutter in the receiving channel are the delay of the transmitted signal, and suppresses the clutter through adaptive filter or orthogonal projection. After being suppressed by time domain suppression algorithm, the radar echo is represented as
As indicated by (2), the non time-varying clutter is effectively filtered out through suppression. Besides targets and noise, the echo signal also contains the suppressed time-varying clutter residue. , are the complex amplitude and Doppler frequency of the suppressed residual time-varying clutter, respectively, both are time-varying non-stationary signals.
The phenomenon arises from the distinct time-varying characteristics of each clutter component in the echo signal, making it exceedingly challenging to accurately estimate these characteristics for achieving “perfect” suppression. When the real radar data contains a significant amount of time-varying clutter, the clutter templates in the clutter matrix constructed during clutter suppression may differ from the actual clutter. Hence, the time-domain suppression algorithm is theoretically capable of completely filtering non time-varying clutter. However, when faced with time-varying clutter, it can only be approximated by the clutter template and cannot achieve complete filtration. The signal is sampled at the sampling rate
, and the coherent processing length is
, where
T is the duration of the base-band signal
, and its vector form is
Whereis the residual of suppressed time-varying clutter, and the floor energy of these residual clutter may be very low, but after “range correlation-Doppler transform”, they will appear as peaks similar to the target on the RD spectrum, which has a negative impact on target detection due to the existence of such false target peaks.
2.2. Stationarity Analysis of Target and Clutter
Compared with non-stationary random time-varying clutter, the echo state of the target mainly depends on its motion state. For air target, assuming that the maximum velocity of target is
, and the maximum turning radius of the target is
r, the distance corresponding to a range cell in RD spectrum is
, and the Doppler speed corresponding to a Doppler cell is
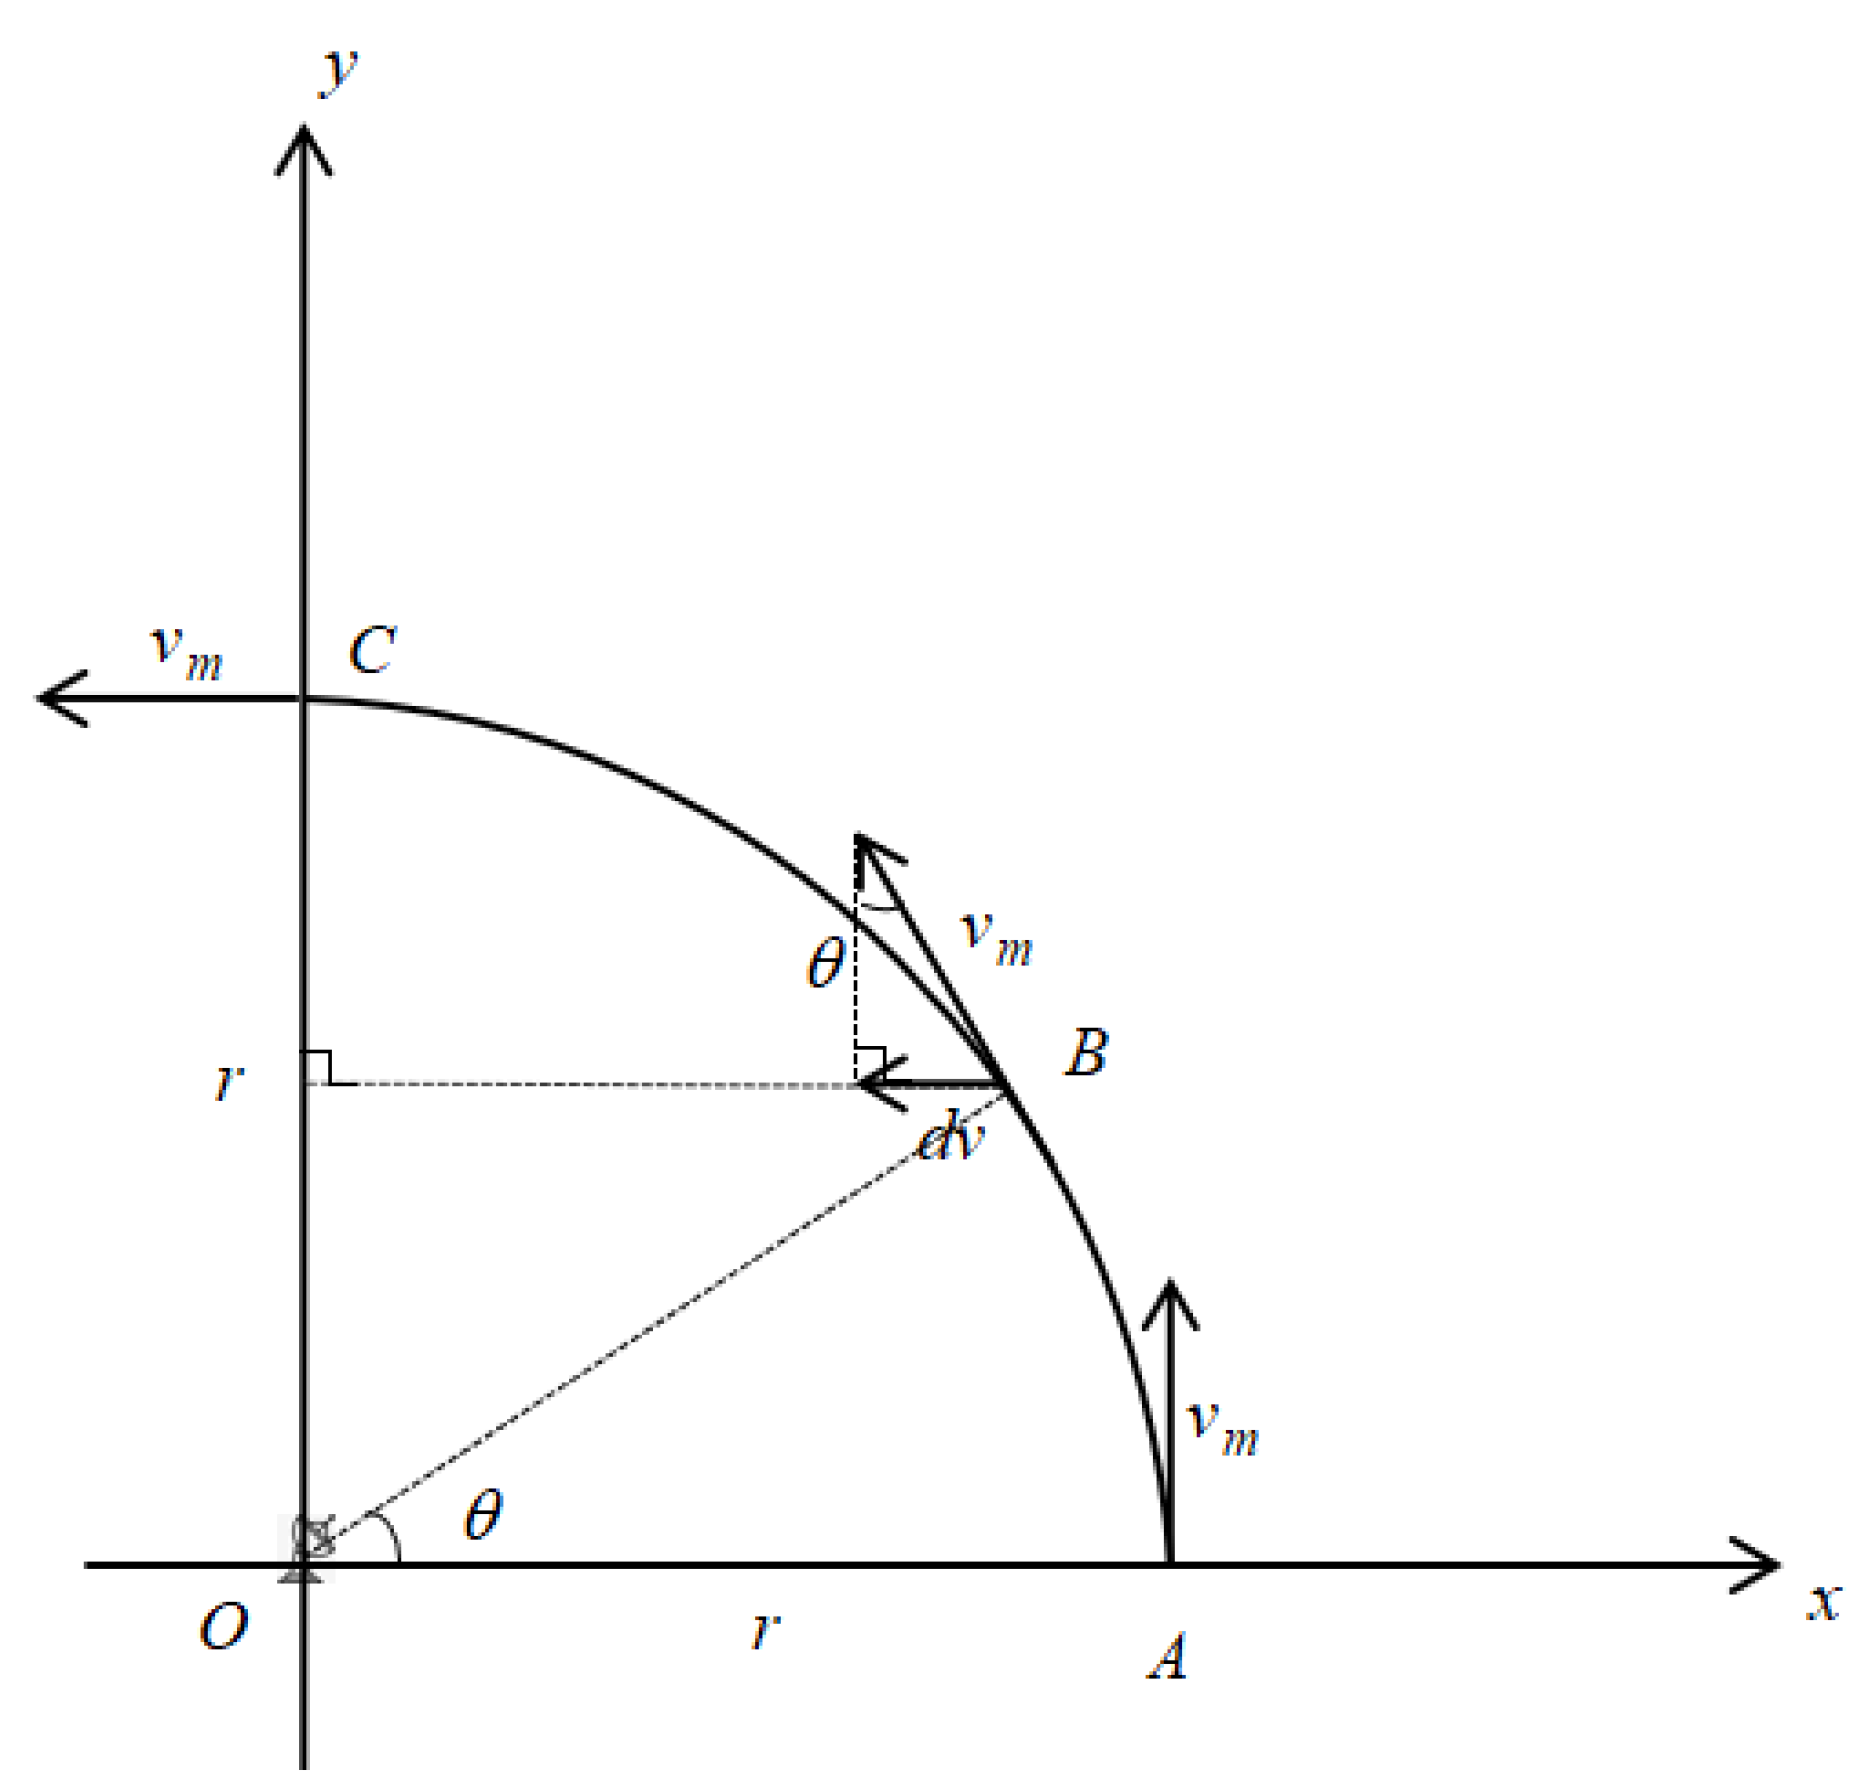
. When the Doppler velocity of the target changes the most, the target does the turning maneuver at the maximum speed, as shown in
Figure 1.
The X-axis is the radial direction from the target to the receiving station. The distance
R from the target to the receiving station satisfies
. When the target starts turning at point A along the Y-axis, and just turns 90 degree to point C, the change of Doppler velocity is
(
), and it takes
for the target to go from A to C. Assuming that the change of Doppler velocity from the target to point B is just a Doppler cell
dv, the change of angle
satisfies
, then it takes
to go from A to B.
In field experiment, the timeof one frame usually satisfies, so the change of Doppler velocity between adjacent frames in the field experiment is the main factor for the position change of the target on the RD spectrum. But if the time interval satisfies, the target Doppler velocity change cannot exceed one Doppler cell within the time length of , which means that the Doppler velocity v of the target will change relatively stable within .
The time for the target distance to change by one range cell is
, but for the radar is often satisfied
, that is to say, it is difficult for the target’s change in distance within a single frame of data does not exceed one distance cell, indicating that the change of the target distance
R in time is relatively stable. So choose an appropriate time interval
, the target signal is stationary change and meets the requirements.
The change of target’s azimuth
is related to the moving velocity, range and moving time of the target, which in time
it is satisfied
According to (5), range changes , so there is in the time interval ,that is, so the change of target azimuth in time is relatively stable. Therefore, in time, the target can be regarded as a static scatter, so its scattered energy E also changes smoothly.
For the false alarm generated after clutter suppression, it mainly comes from the time-varying clutter residue after suppression. According to (2), its signal form can be expressed as
Since the working environment is not in an ideal state, various clutter, such as sea clutter and ground clutter, are generated based on the target echo [Error! Reference source not found.]. For sea clutter, it is a non-stationary time-varying clutter, the velocity of wave clutter in bad sea conditions may exceed 10 m/s, which is far less than the velocity of air targets, so sea clutter is usually distributed near both sides of 0 Doppler. Since the time domain clutter suppression is difficult to eliminate the influence of time varying clutter, the false alarm points in RD spectrum after clutter suppression are generated by the residual time varying clutter.
For residual time-varying clutter, its complex amplitudeand Doppler frequency shiftare non-stationary random signals. Within t time interval, and, andare randomly varying and uncorrelated. Therefore, the energy, range, Doppler velocity and azimuth information of false alarm signals generated by ionospheric clutter residues are also non-stationary signals that change with time, that means false alarm points are non-stationary in time and space.
3. False Alarm Suppression Algorithm Based on Target Spatial-Temporal Stationarity
The difference between the target signal and the clutter signal in spatial-temporal stationarity is introduced above. In a short time interval , the target is a stationary signal and clutter is a non-stationary signal, so the target state is more stable than the false alarm point. Therefore, the target and false alarm point can be distinguished according to their amplitude fluctuation, Doppler velocity change, range change and azimuth stationarity characteristics, achieve the purpose of reducing false alarm.
3.1. Time Domain Signal Characterization Based on Multi-Frame Sliding
The target is stationary in a short time. To ensure the short-time stationarity of the target, a multi-frame sliding matching filtering method is proposed. Radar target echo signal can be regarded as a sample of reference signal after time delay and Doppler frequency shift, and it is a linear superposition of multiple target echoes, clutters and noise. The echo signal passes through a range-Doppler two-dimensional matched filter, and the received signal is sampled at a sampling rate
, assuming that the base-band signal transmitted by the radar is
, the echo signal after clutter suppression is
, the two-dimensional matched filtering process of radar echo signal can be expressed as
Using the method of “range correlation-Doppler transform” to realize two-dimensional matched filtering, then (8) can be rewritten as
Where
is the length of sub-segments (in the OFDM radar communication integrated system is an OFDM symbol length),
is the number of sub-segments, and
. If
, equation (9) is simplified as follows
Bringing (2) into (10) will form a peak in the form of sinc function at the correspondingandpositions. the number of false alarm points caused by clutter is much larger than the target peak due to.
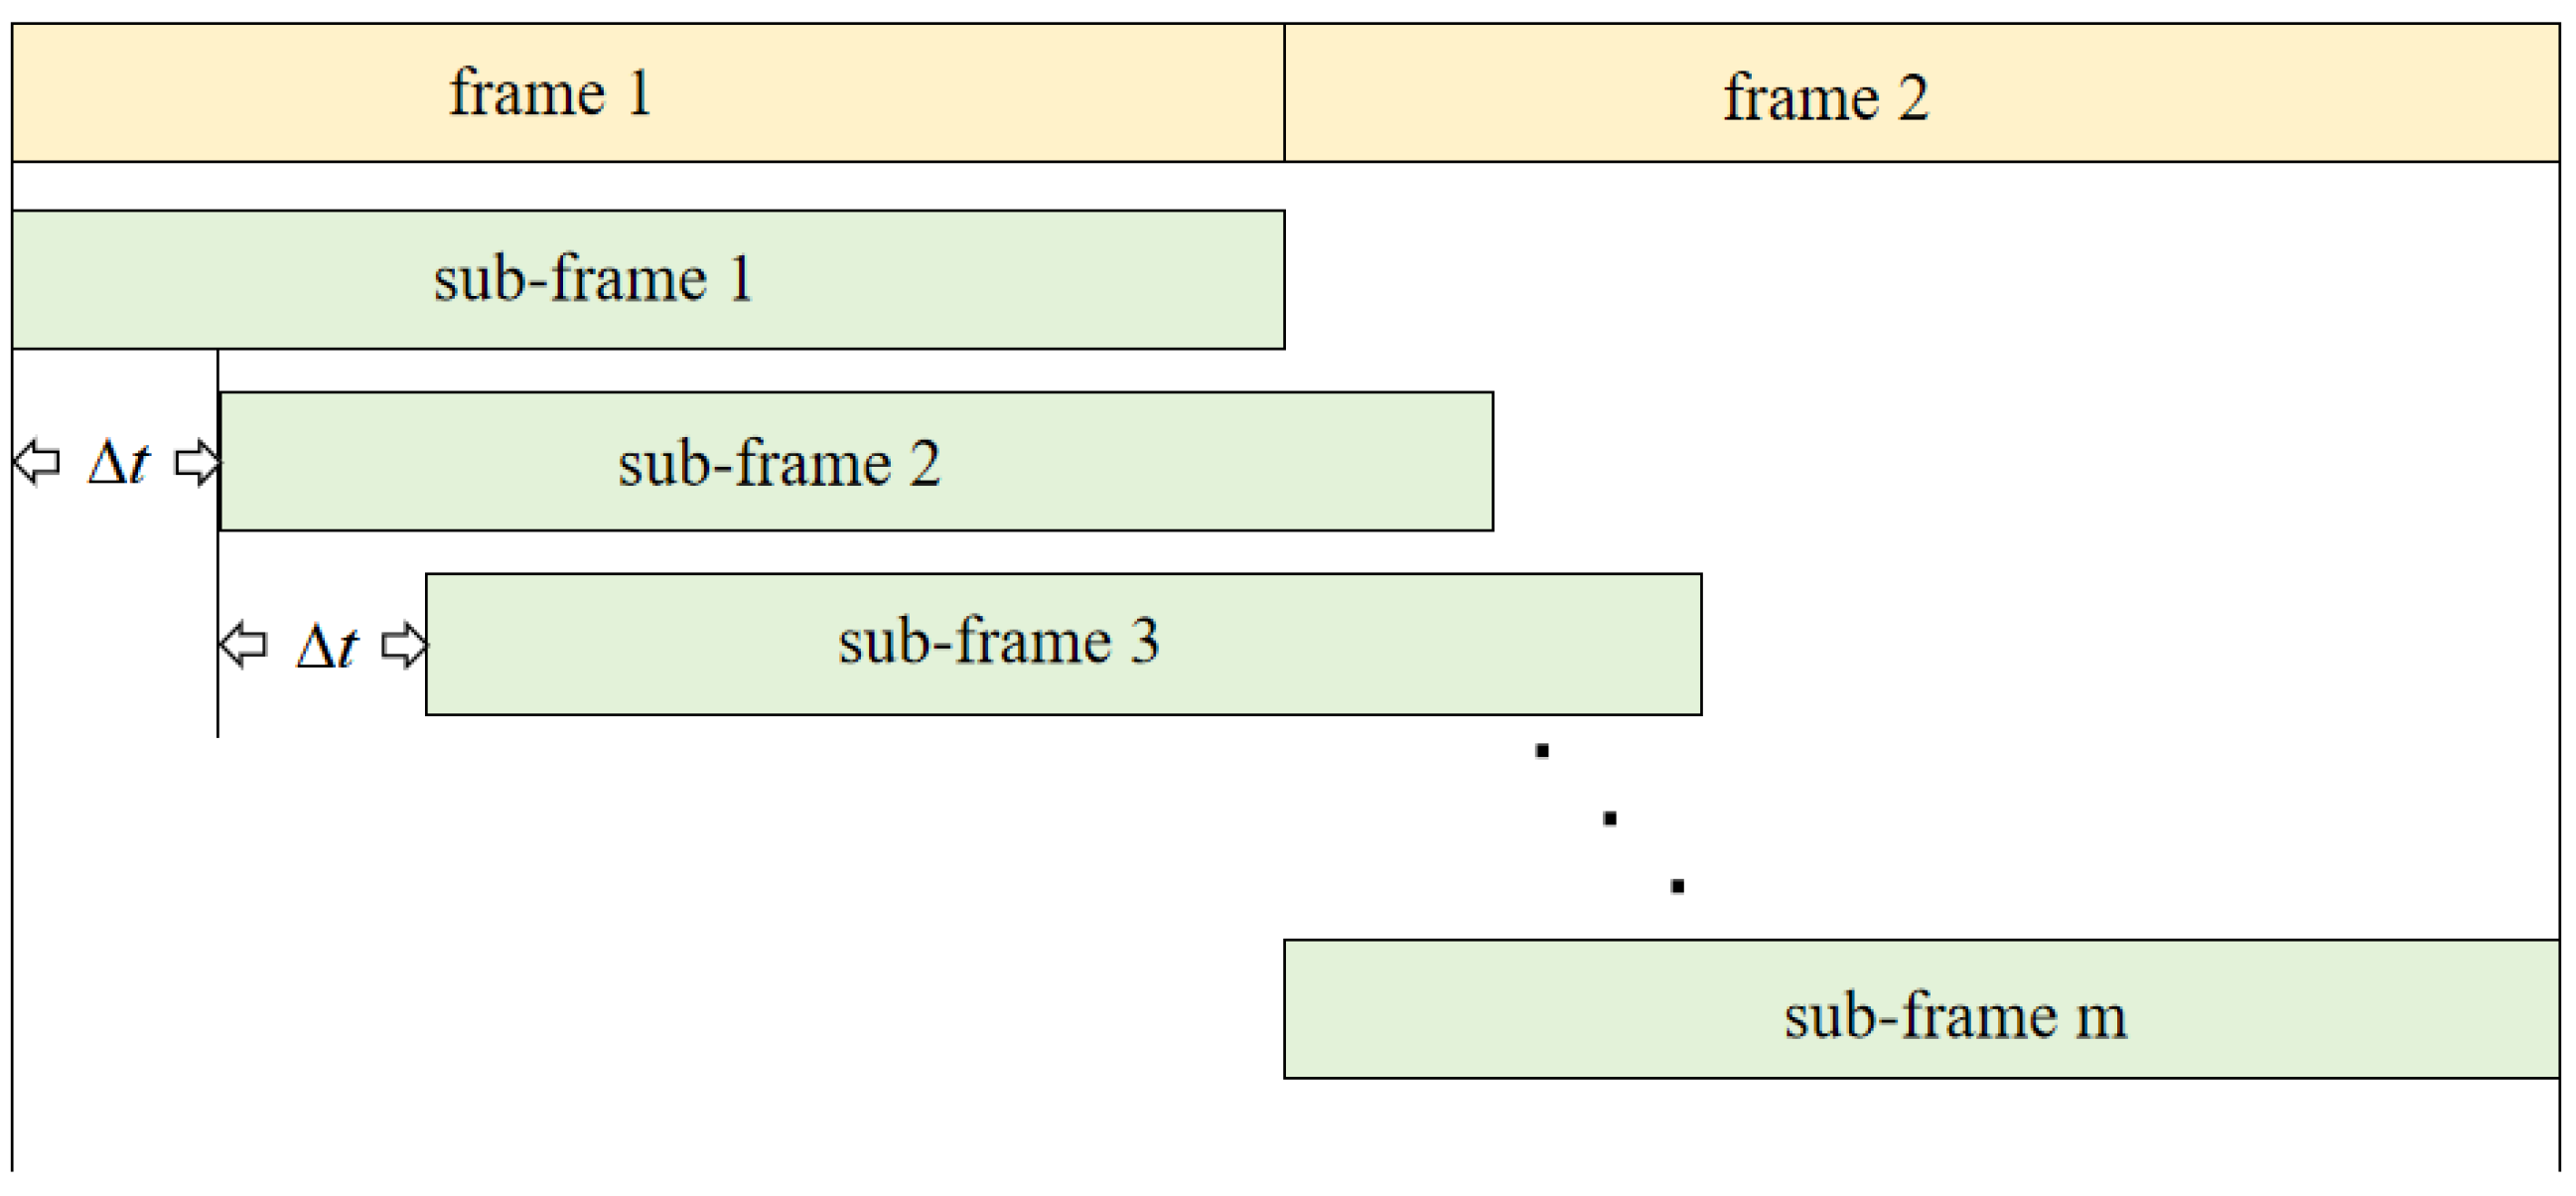
To reduce false alarms by utilizing the difference in stationarity between the target signal and clutter, a sliding matching filtering method is used to ensure the concept of short time intervals. This involves splicing adjacent frames of data and using a smaller time window for sliding matching filtering to generate RD information, as shown in
Figure 2.
Splicing adjacent frames of suppressed data and sliding with
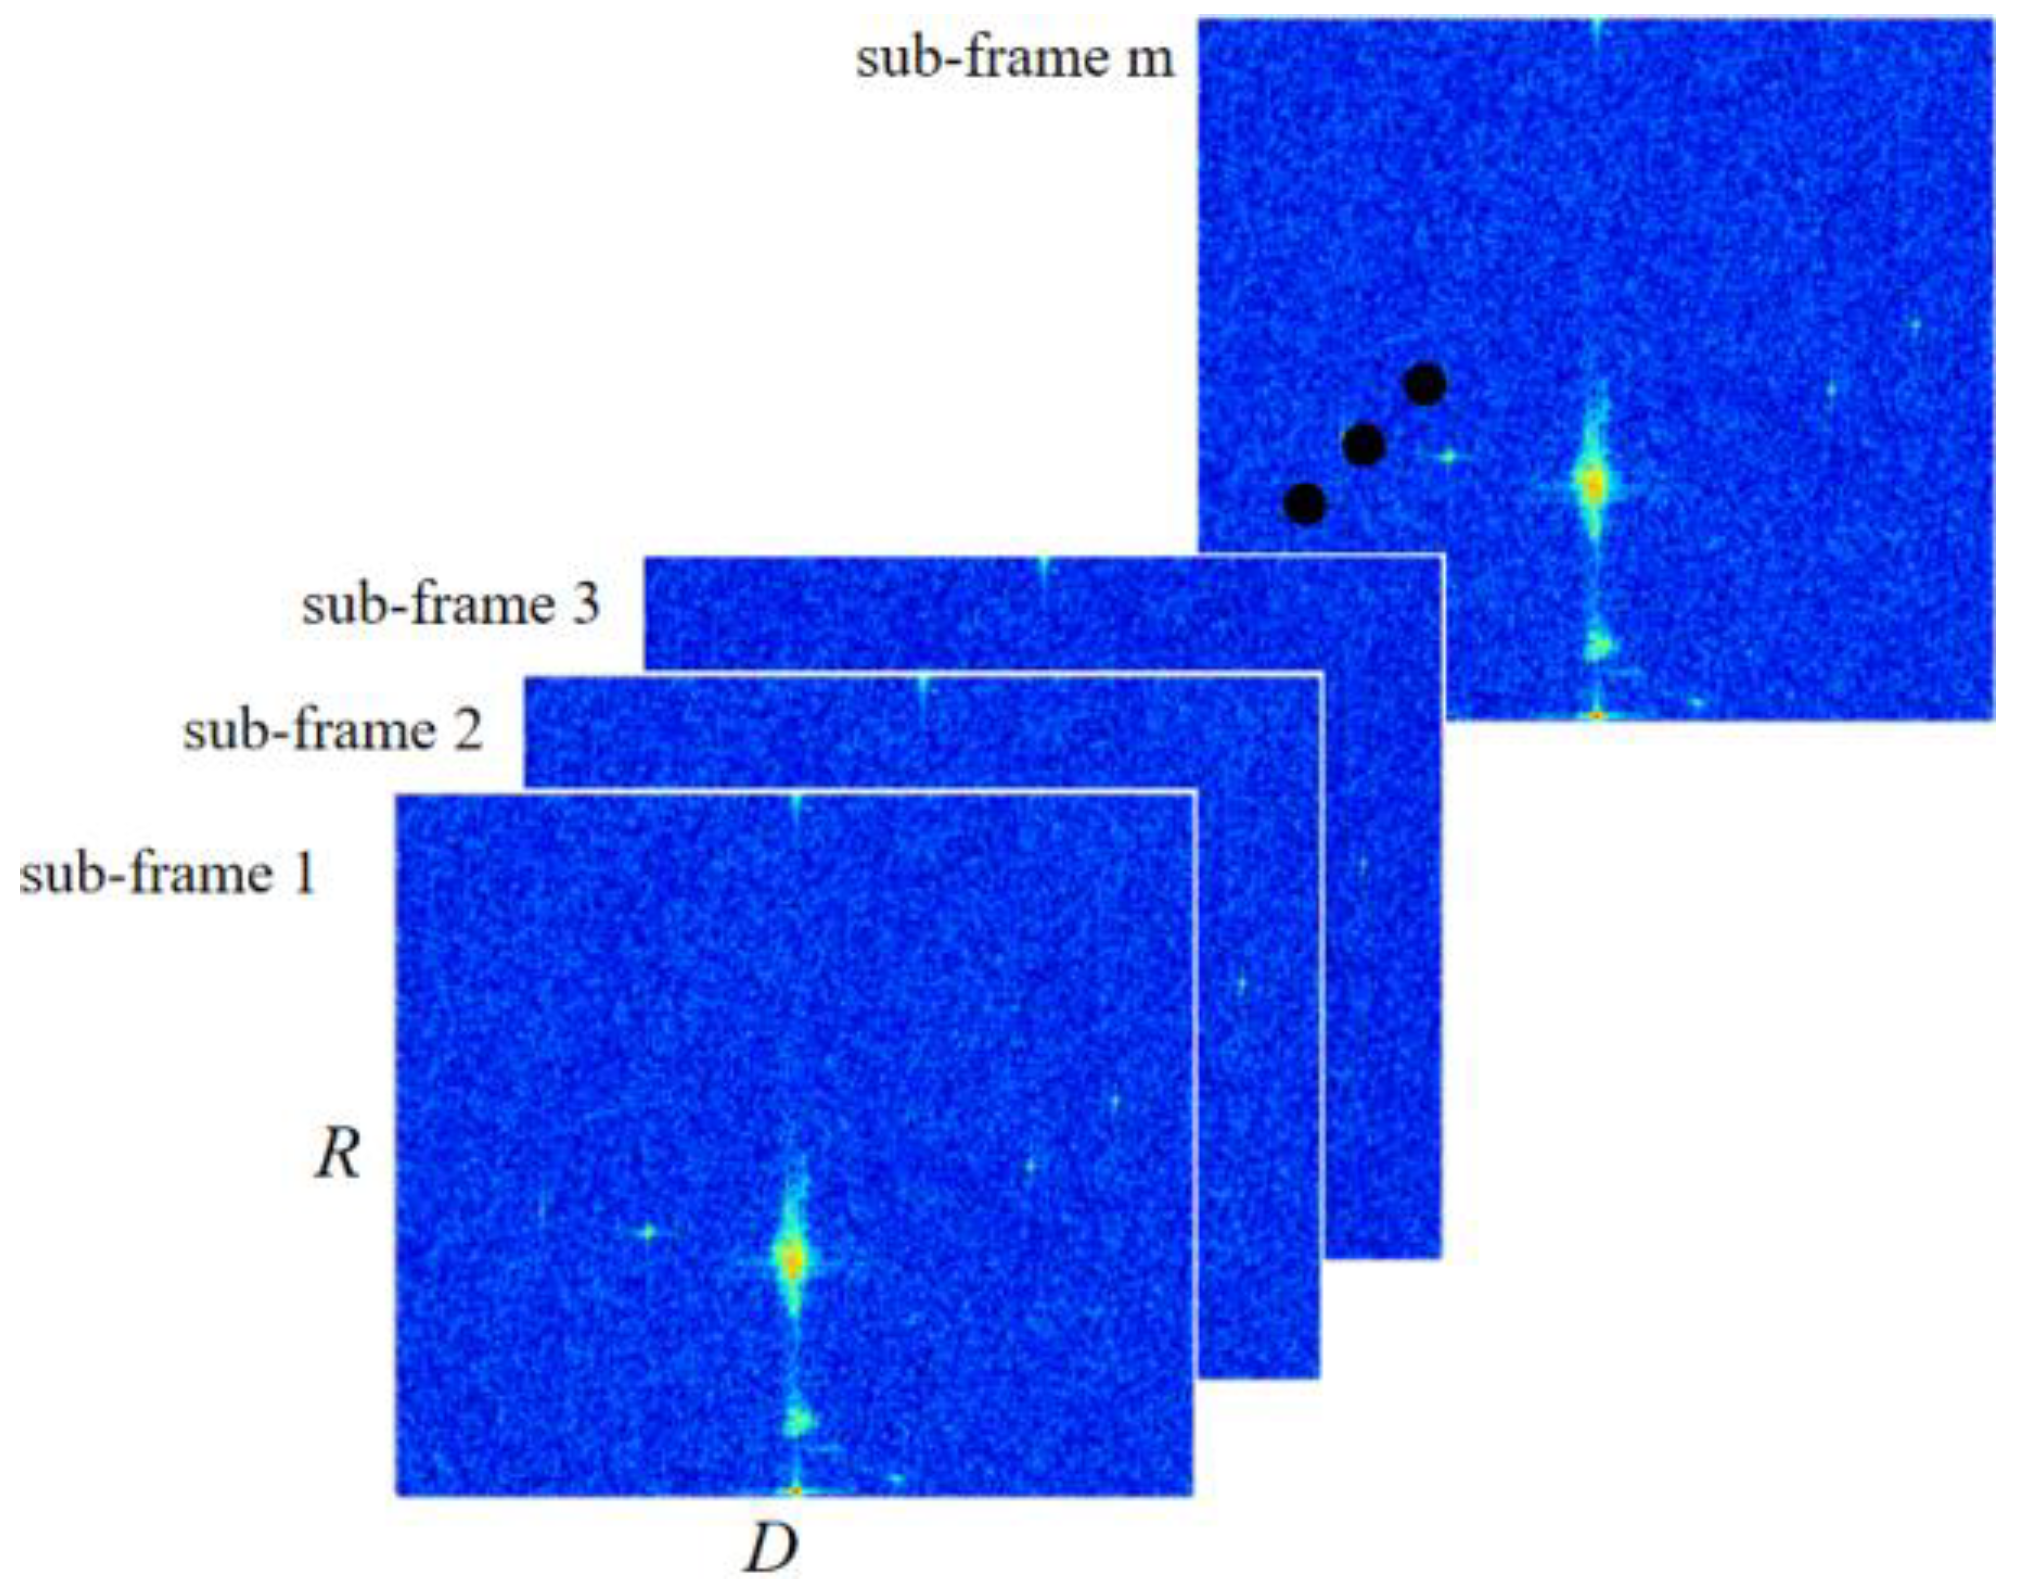
as the time interval to carry out matched filtering, so that can get several sub-frames RD
i(
i = 1, 2,..,
m) as shown in
Figure 3.
Where
and RD
i can be expressed as
Where, compared with matched filtering every frame, there is a shorter time interval between sub-frames RDito ensure the stationarity of the target signal.
Regarding the determination of the sliding window length
, the first thing to consider is the stationarity of the target state, which ensures that its position on the RD spectrum does not change due to target motion during the sliding window time interval. The distance
dr corresponding to each range cell in the RD spectrum and the Doppler velocity
dv corresponding to each Doppler cell are as follows
Where, . Bringing (12) into (8), it can be seen that the sliding window time should meet, . Since the smalleris, the more sub-frames RDiis, which will lead to the increase of calculation and memory load. Therefore, the specific value ofshould be selected according to the actual situation.
After multi-frame sliding matching filtering, extract all peaks whose energy is higher than the floor energy on the RD spectrum of the sub-frame, and obtain the information of these peaks’ range R, Doppler velocity v and energy E . It is sure that the target peak is included among these numerous peaks, but it is difficult to distinguish the target peak due to too many false alarms exist.
3.2. Spatial Signal Characterization Based on Single Snapshot Measurement Angle
After got the information of range
R, Doppler velocity
v and energy
E on the sub-frame RD spectrum, it is necessary to obtain the azimuth information of these peaks to distinguish the target from false alarm effectively. Because the data used in this paper are all single snapshot data, the DOA estimation method based on sparse representation is chosen to estimate the azimuth, which has the characteristics of high precision and high resolution, and there is no need for decoherence preprocessing and no requirement for the number of snapshots of the data [
24].
Consider dividing the airspace into
with equal angle, and assume that every possible angle
(
n=1,2,...,
L) corresponds to a potential target signal
, then the array manifold matrix’s
each column corresponds to the azimuth information of a potential target signal. To reflect sparsity, the number of potential targets
L should be much larger than the actual number of targets
N. so a
dimensional sparse signal
is constructed, where
(
n=1,2,...,
L), only the
N positions
of actual targets correspond to non-zero value of
, while the other
L-
N positions are all zero values. The model of sparse representation of signal is
Where
is the snapshot data of the
j-th distance gate after pulse compression;
E is the noise component of the data; The matrix
Φ is a redundant dictionary, which consists of steering vectors of all possible angles in space, namely
As can be seen from (13), the single snapshot data
Y can be sparsely represented based on the redundant dictionary
Φ, and its representation coefficient is sparse signal
S. By solving for the sparse signal
S and identifying the positions of its non-zero elements, it becomes possible to estimate the direction of arrival (DOA) angle of the target. To solve this problem, the constraint criterion of minimizing
norm (0<p<1) is adopted, and the regularization idea is introduced into the algorithm to reduce the influence of noise on the reconstruction algorithm, thus improving the accuracy of angle estimation [
24]. The DOA estimation problem of (13) can be equivalent to the solution of the following problem.
Where , 0<p<1 is norm.
Under the maximum a posteriori probability (MAP) criterion, the solution of (15) can be expressed as
Where the cost function is
, regularization coefficient is
,
is noise variance and
[
25].
To get the optimal solution of (16), it is necessary to meet its necessary conditions.
Where matrix
, parameter
. It can be obtained from (17)
The weighted matrix is introduced by using the idea of weighted minimization iterative solution of Focus [
26] algorithm.
Introduce an iterative process, let
and
, the optimal solution can be solved iteratively by
By solving for the sparse solution
, identify the positions of the non-zero elements or N largest elements
in
, and then based on the correspondence of
, the estimated DOA value
of the target can be obtained
Where is the normalized space spectrum. From this, the angle estimation of any peaks can be obtained.
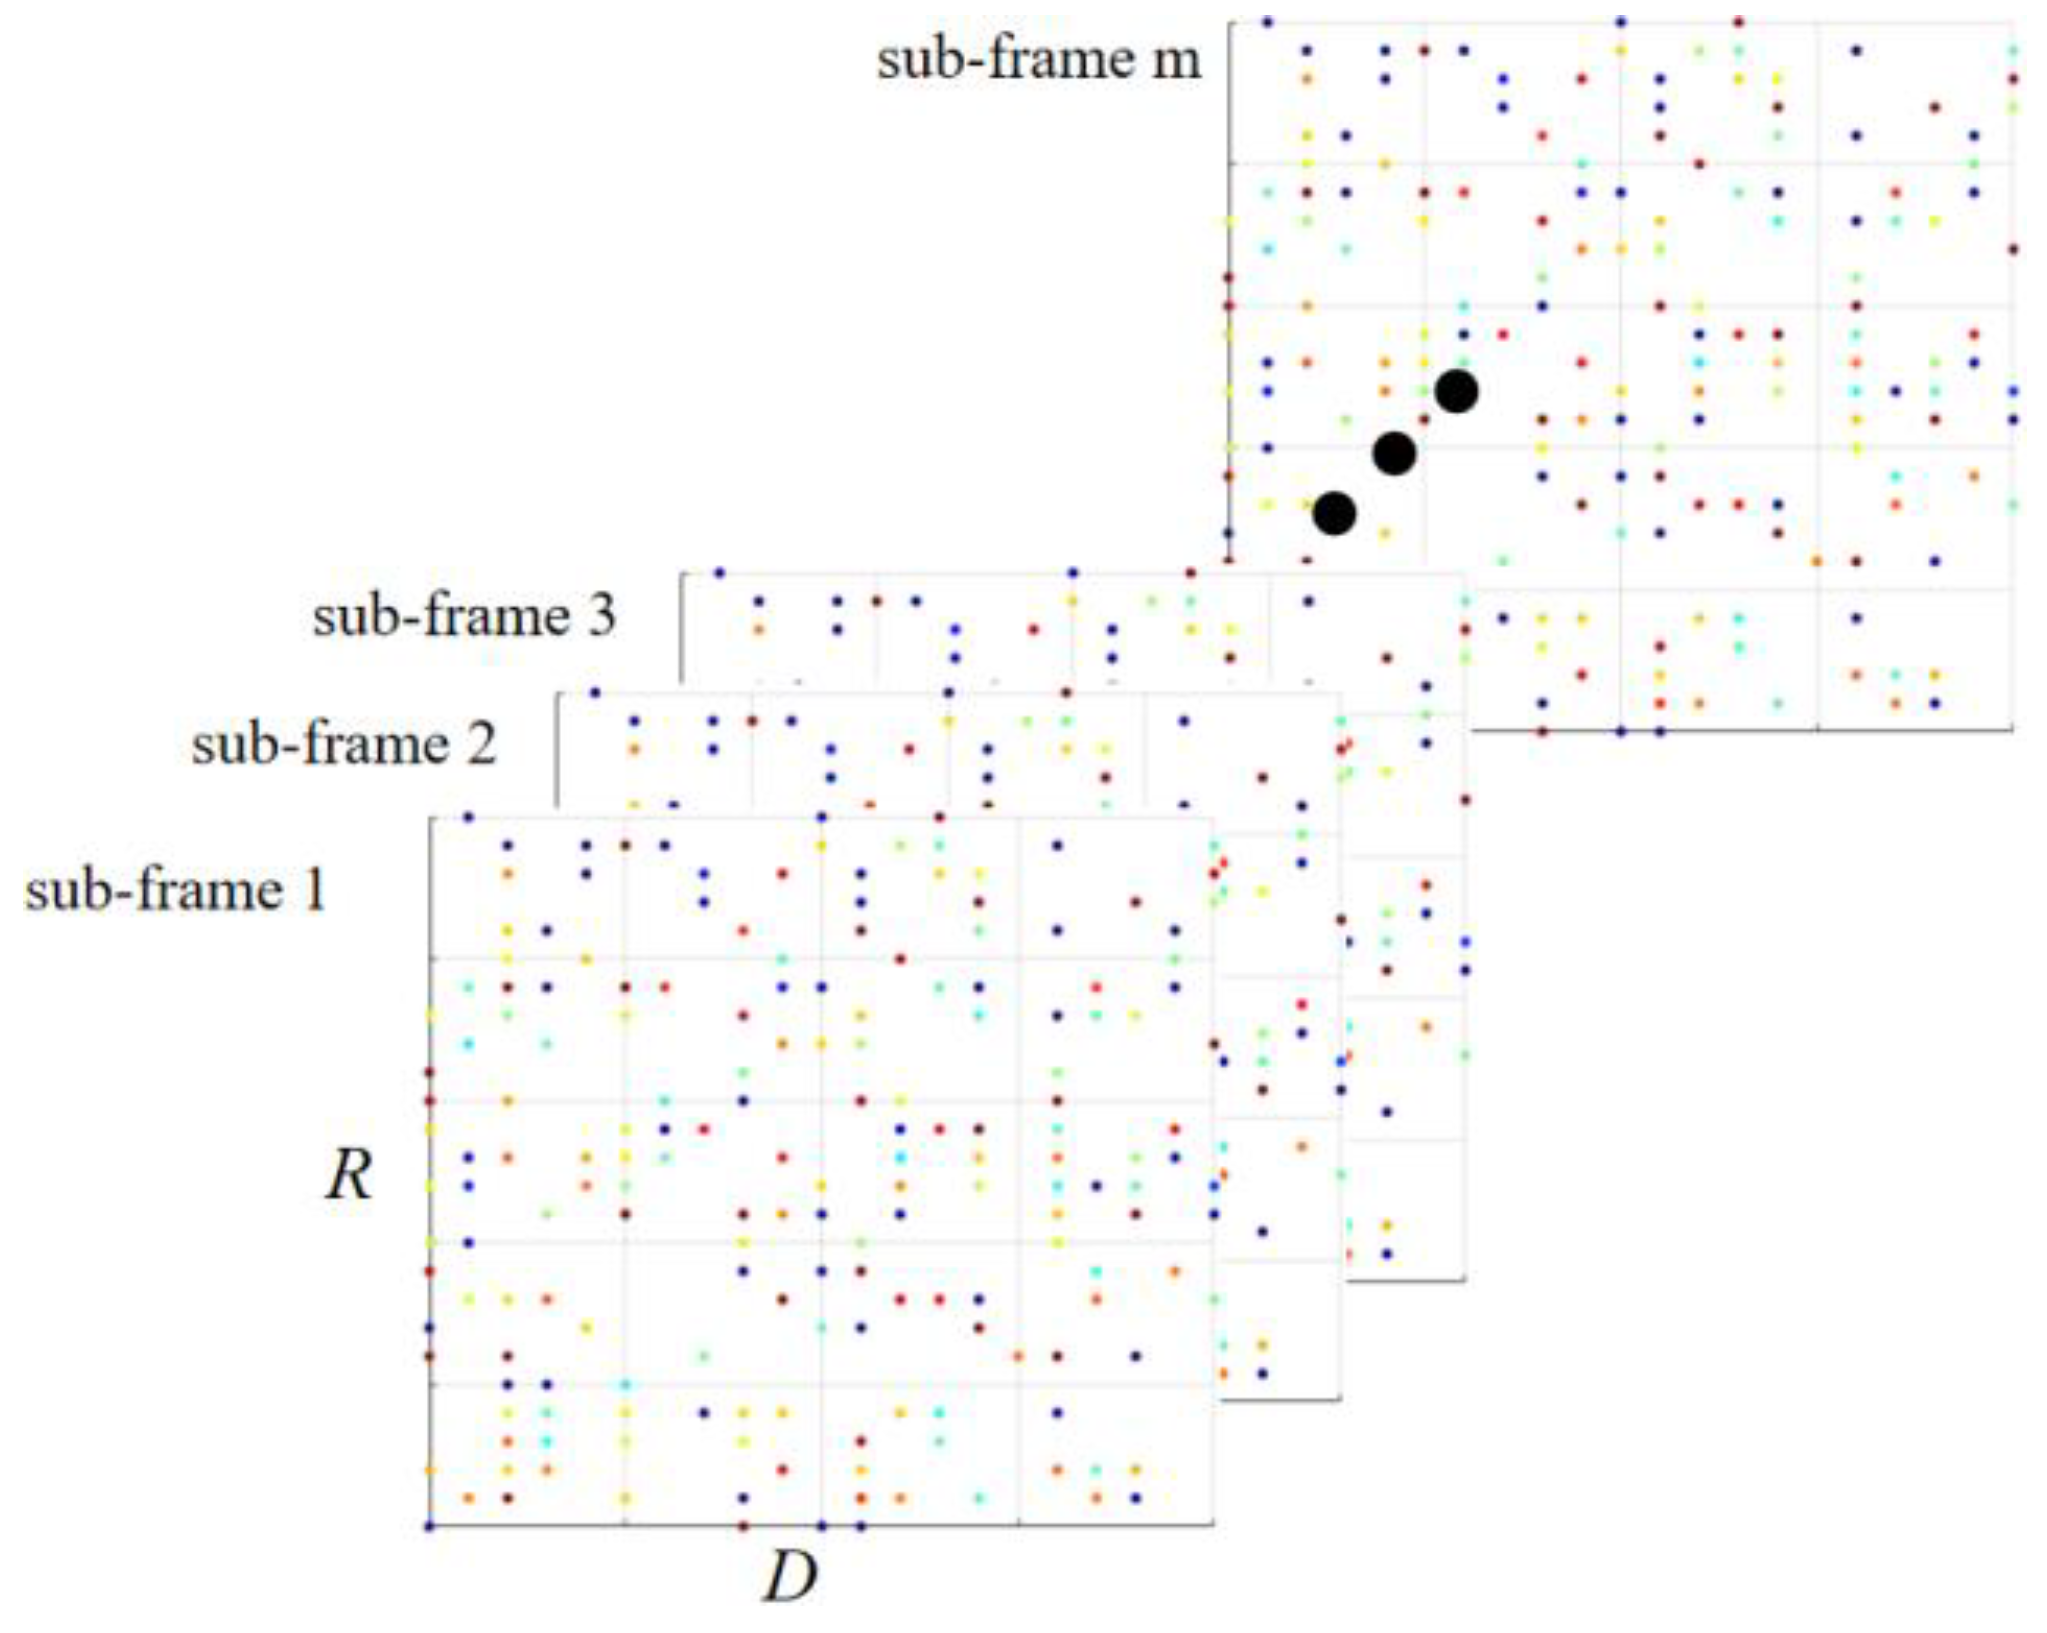
By estimating the azimuth of each peak point extracted from the RD spectrum of each sub-frame, Combining the range and Doppler information of each peak point, the azimuth spectrum of each peak point in each sub-frame can be got, and the azimuth of each peak point are expressed in different colors. The result is shown in
Figure 4.
3.3. False Alarm Reduction Method Based on Mahalanobis Distance
Mahalanobis distance was proposed by Indian statistician Mahalanobis P C, which is a generalization of Euclidean distance. It calculates the distance between two points by covariance, which is an effective method to calculate the similarity between two unknown sample sets [
27].
The peak information matrix
in sub-frame RD
i (
i=1,2,...,
m) was calculated through the above section. Each sub-frame RD
i has
peaks, where
is the peak information vector
obtained from the RD spectrum of the
i-th sub-frame,
represent the range bin, Doppler bin, energy, and azimuth information corresponding to the peak, respectively. Assuming that there are
targets, the peak information matrix
can be rewritten as
Where, are the target peak matrix and the false peak matrix of the sub-frame RDi , respectively, and .
For any peak information vector
in the peak information matrix
of the sub-frame RD
i, it can be observed from the range-Doppler information obtained on the RD spectrum that most peaks in the peak information matrix
of adjacent sub-frame RD
i+1 do not correspond to
. To reduce computational complexity and enhance algorithm efficiency, a preliminary pairing can be made according to the range-Doppler information first. Euclidean distance is utilized for this purpose, range-Doppler (
) position of any peak
in the sub-frame RD
i, a circular region centered on (
) with
as the radius is defined as the matching range, the peak
in the adjacent sub-frame RD
i+1 satisfies
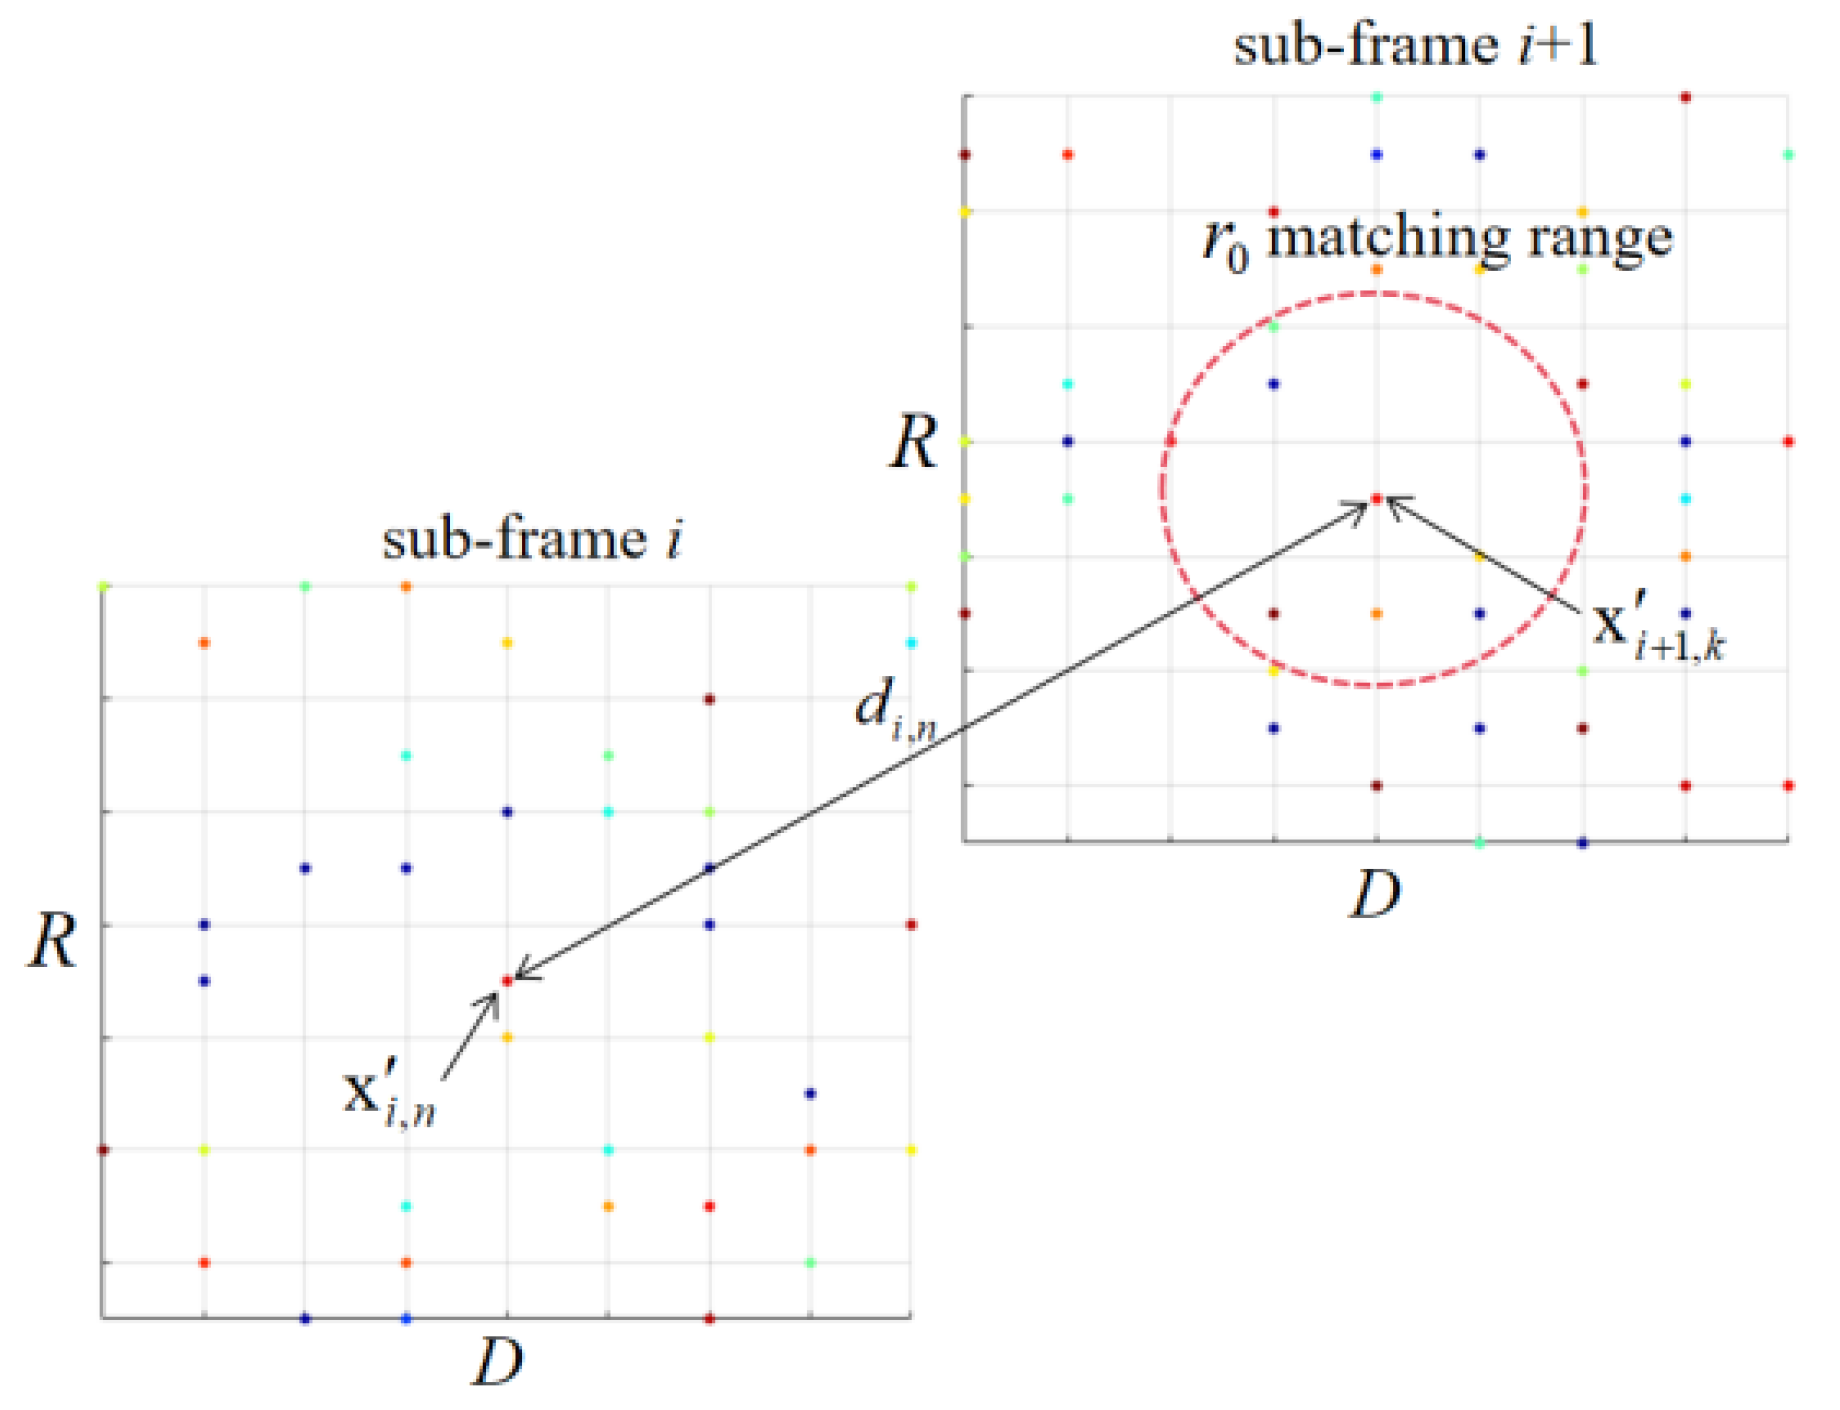
It can be considered that matches and retains them, while any peaks that fail to match successfully can be considered false alarms to eliminate. The matching range is usually 2-3 cells, which not only ensures that the target is not lost while minimizing false alarms. In this way, the matching peak information matricesand of adjacent sub-frames are obtained, in which there are fewer peak information vectors. The preliminary reduction of false alarm rate is completed, and the calculation amount is also reduced for the following steps.
In order to further reduce the false alarm rate, the Mahalanobis distance from the matched peak
in sub-frame RD
i to the matched peak
in sub-frame RD
i+1 is calculated by making full use of the peak distance, Doppler velocity, energy and azimuth information, and the minimum Mahalanobis distance is taken as the distance
from the peak
to sub-frame RD
i+1. The process is shown in
Figure 5. For
there is
is the Mahalanobis distance from
to
.
is the inverse of
and
covariance matrix:
If the covariance matrix is diagonal matrix, the Mahalanobis distance is simplified to Euclidean distance. Through the above operations, we can get the Mahalanobis distancefrom all the peaks in the sub-frame RDi to the adjacent sub-frame RDi+1. Since the target signal is a stationary signal relative to the false alarm in a short time interval, the Mahalanobis distance of the target is smaller than that of the false alarm. For detectingtargets, it become to find the peaks corresponding to minimum Mahalanobis distances in .
However, the exact number of targets can’t be known in field experiment, so we set a reference threshold
dthr. When the value in Mahalanobis distance
from all peaks
in sub-frame RD
i to adjacent sub-frame RD
i+1 is less than the reference threshold
dthr, the corresponding peak points can be considered as suspected targets
. The reference threshold
dthr is set as the Mahalanobis distance when the target peak information vector changes the most between adjacent sub-frames. Assuming that one target information of sub-frame is
and it will change to
when it changes the most in adjacent sub-frames. According to practical engineering experience,
,
usually does not exceed 2 cells,
does not exceed 5dB, and
is 1/2 beam width, so the reference threshold
dthr is.
The final target detection result should be the intersection of multiple sub-frame detection results.
Through the above steps, many false alarm points are eliminated.
3.4. Target Track Generation Based on Spatial-Temporal Stationarity
After removing a large number of false alarms, there are still scattered false alarms in the RD spectrum, but these false alarms cannot form a stable track, so the track can be generated according to the temporal and spatial stability of the target to further remove scattered points. The specific implementation method is as follows: firstly, all peak points of the first frame data are taken as the start of the trace; Then the Mahalanobis distance and SNR between points in adjacent frames are used as the criterion of target association; If the target trace is not generated in the first frame, the newly generated points in each frame that are not associated with the previous frame will be taken as the start of the new trace; In order to reduce false dots and reduce computational load and cut off multiple frames of no associated trace. The process of updating the trace is as follows:
(1) Prediction: Assume that the state of the uncut trace
at time
k-1 is
, and the three parameters represent the range, velocity and azimuth, respectively. Assume that the aircraft moves in a straight line at a constant speed in the adjacent frame time, then predict the state of point trace at time
k as follows
Equation (29) considers that after time T, the target range state will change according to the Doppler state, and the azimuth angle will remain unchanged. The Doppler state will change slightly due to the position change relative to the receiving station during the flight, so w is the Doppler state adjustment parameter.
Association: as the point set detected at time k is associated with the uncut off trace according to the following rules:
define as the neighborhood point set in the range of 2 range cells, 4 Doppler cells and 1/2 beam-width (assuming that the range is) around the predicted state of the trace is obtained by screening; If the neighborhood point set is an empty set, the trace state is directly updated to ; If the neighborhood point set has at least one point, the point with the strongest SNR is used as the relevant point.
Evaluating the quality of the trace
and updating trace: For the trace which is not associated with a new point, it will be cut-off if it is not associated for three consecutive frames; For related trace, to reduce the influence of trace offset caused by measurement error and process error, the state of trace shall be smoothed as follows
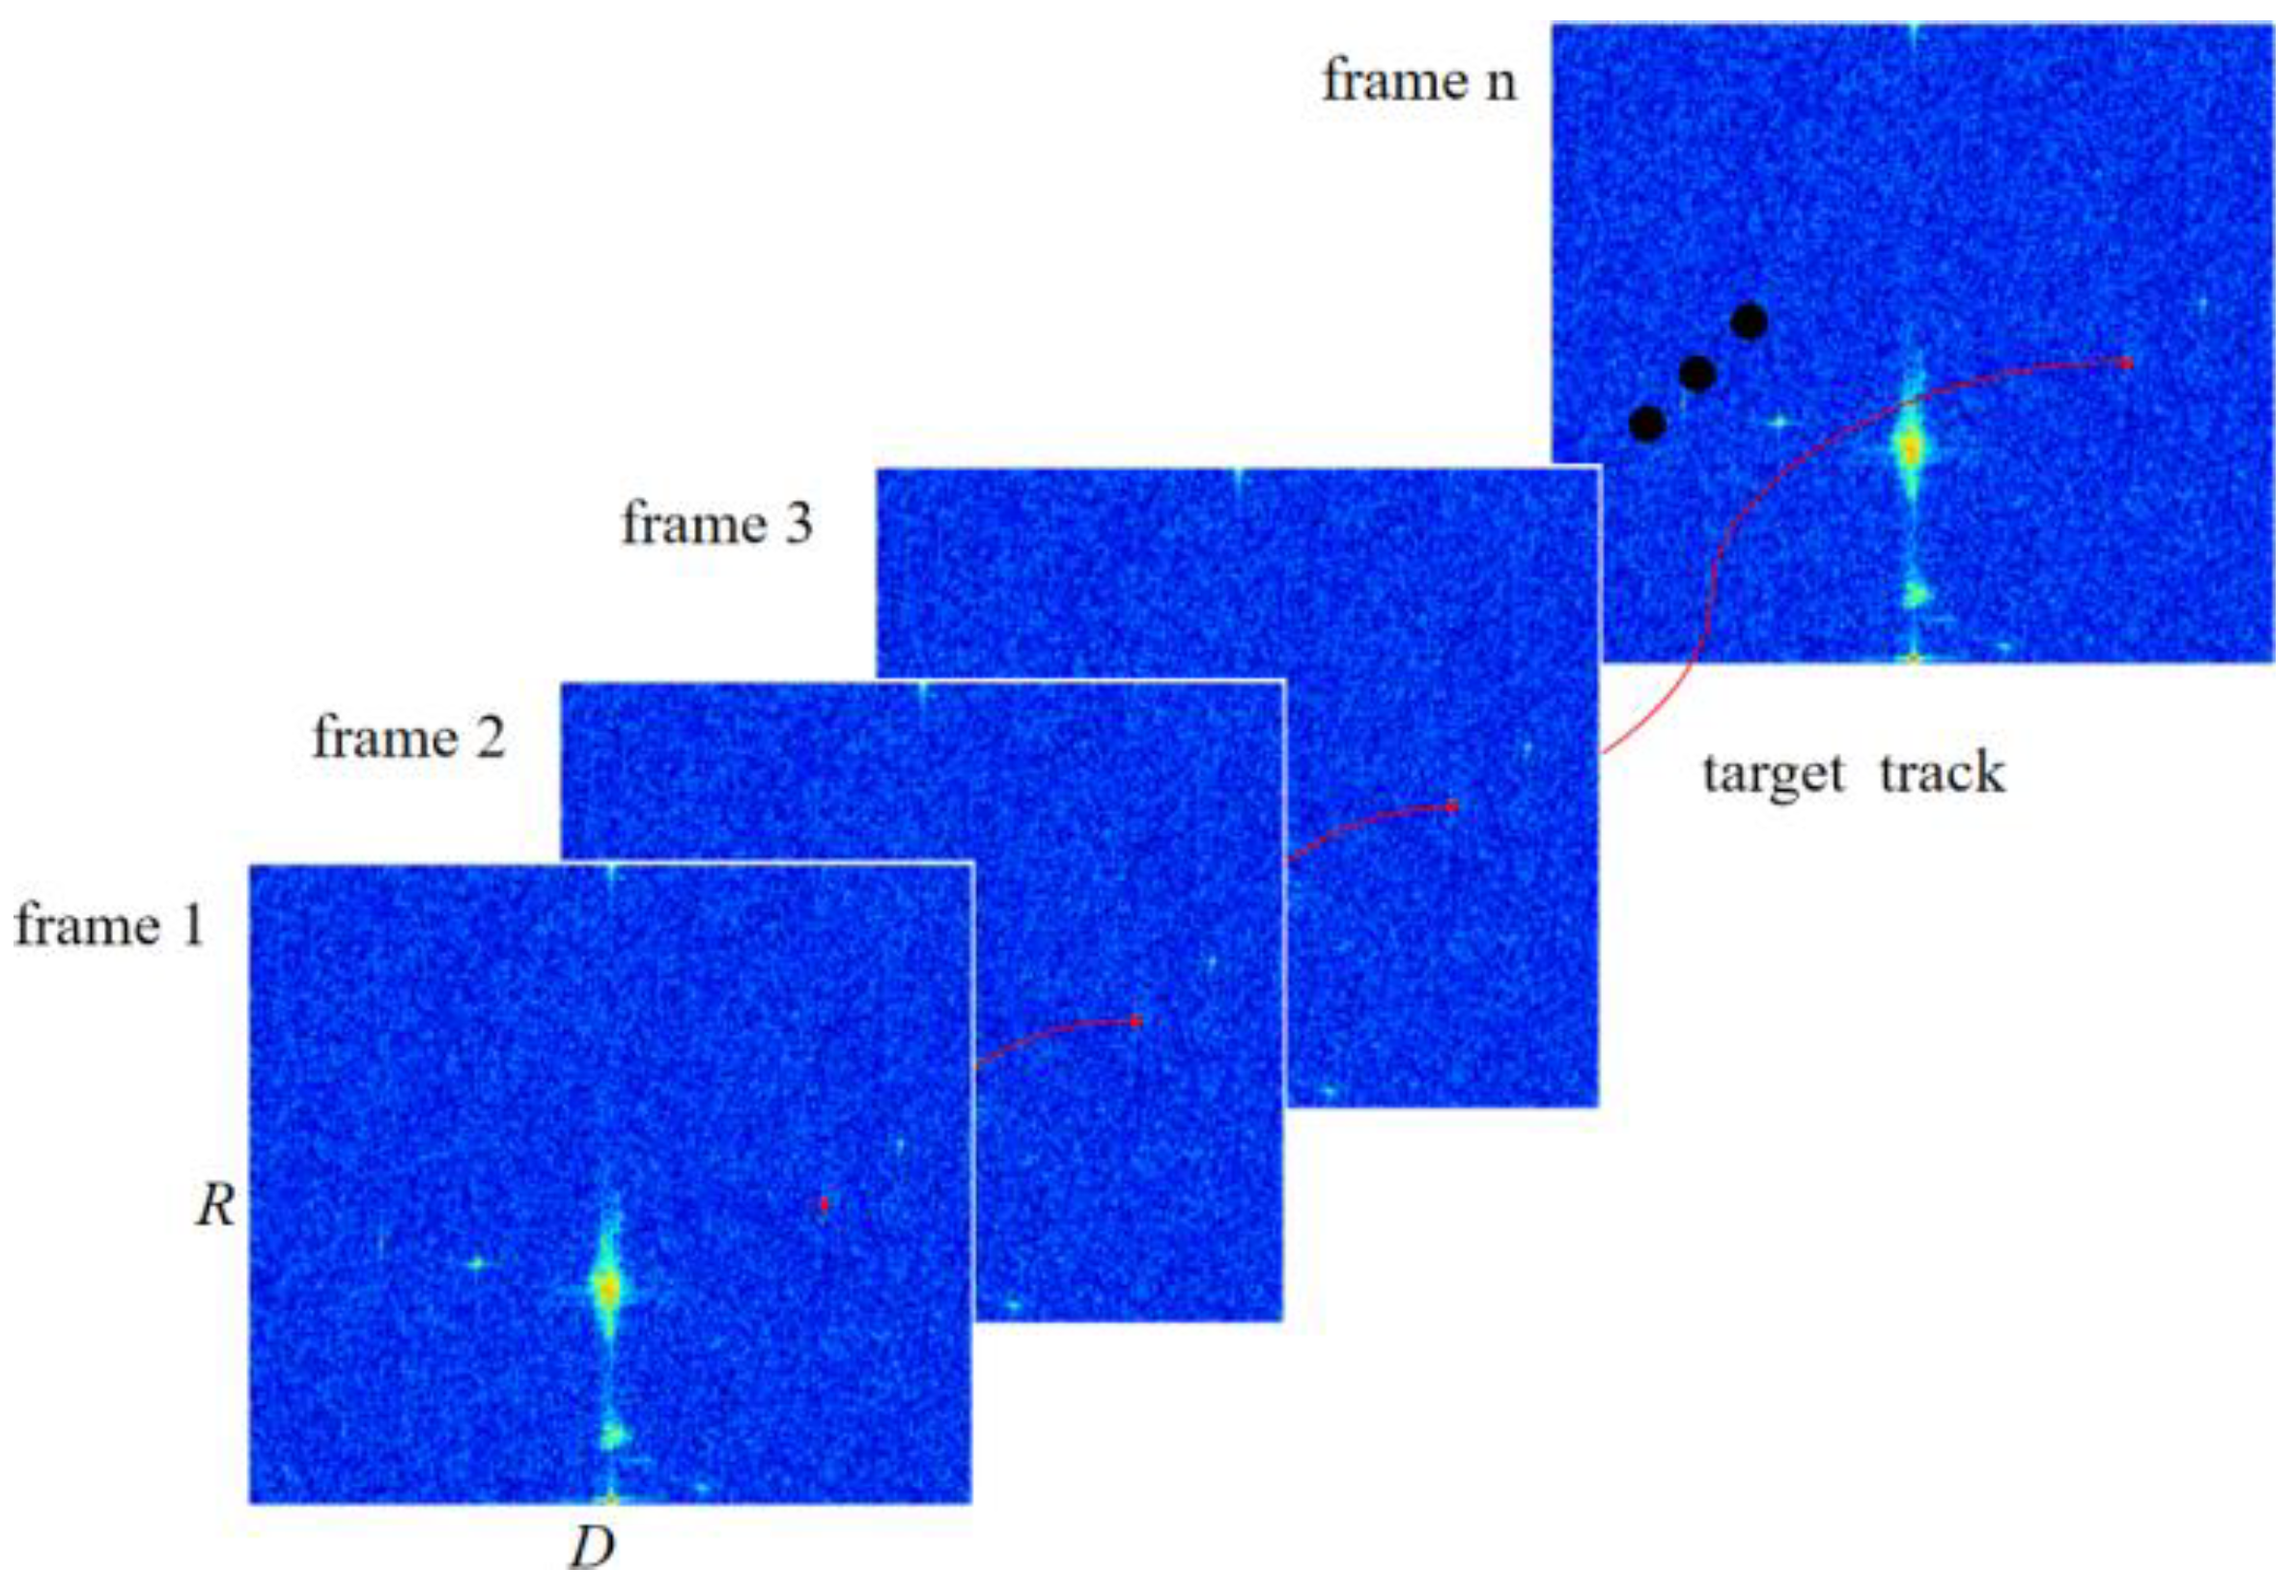
p is the smoothing coefficient, and its value is between 0~1. For points that are not associated with any trace, it is taken as a new starting point trace. As shown in
Figure 6. Through tracking, the target points that form a stable track are retained, and the target track is obtained, while the scattered points that cannot form a track are eliminated, to further reduce false alarms and improve the target detection ability.
4. Simulation Experiment Results
4.1. Conventional Time-Domain Suppression
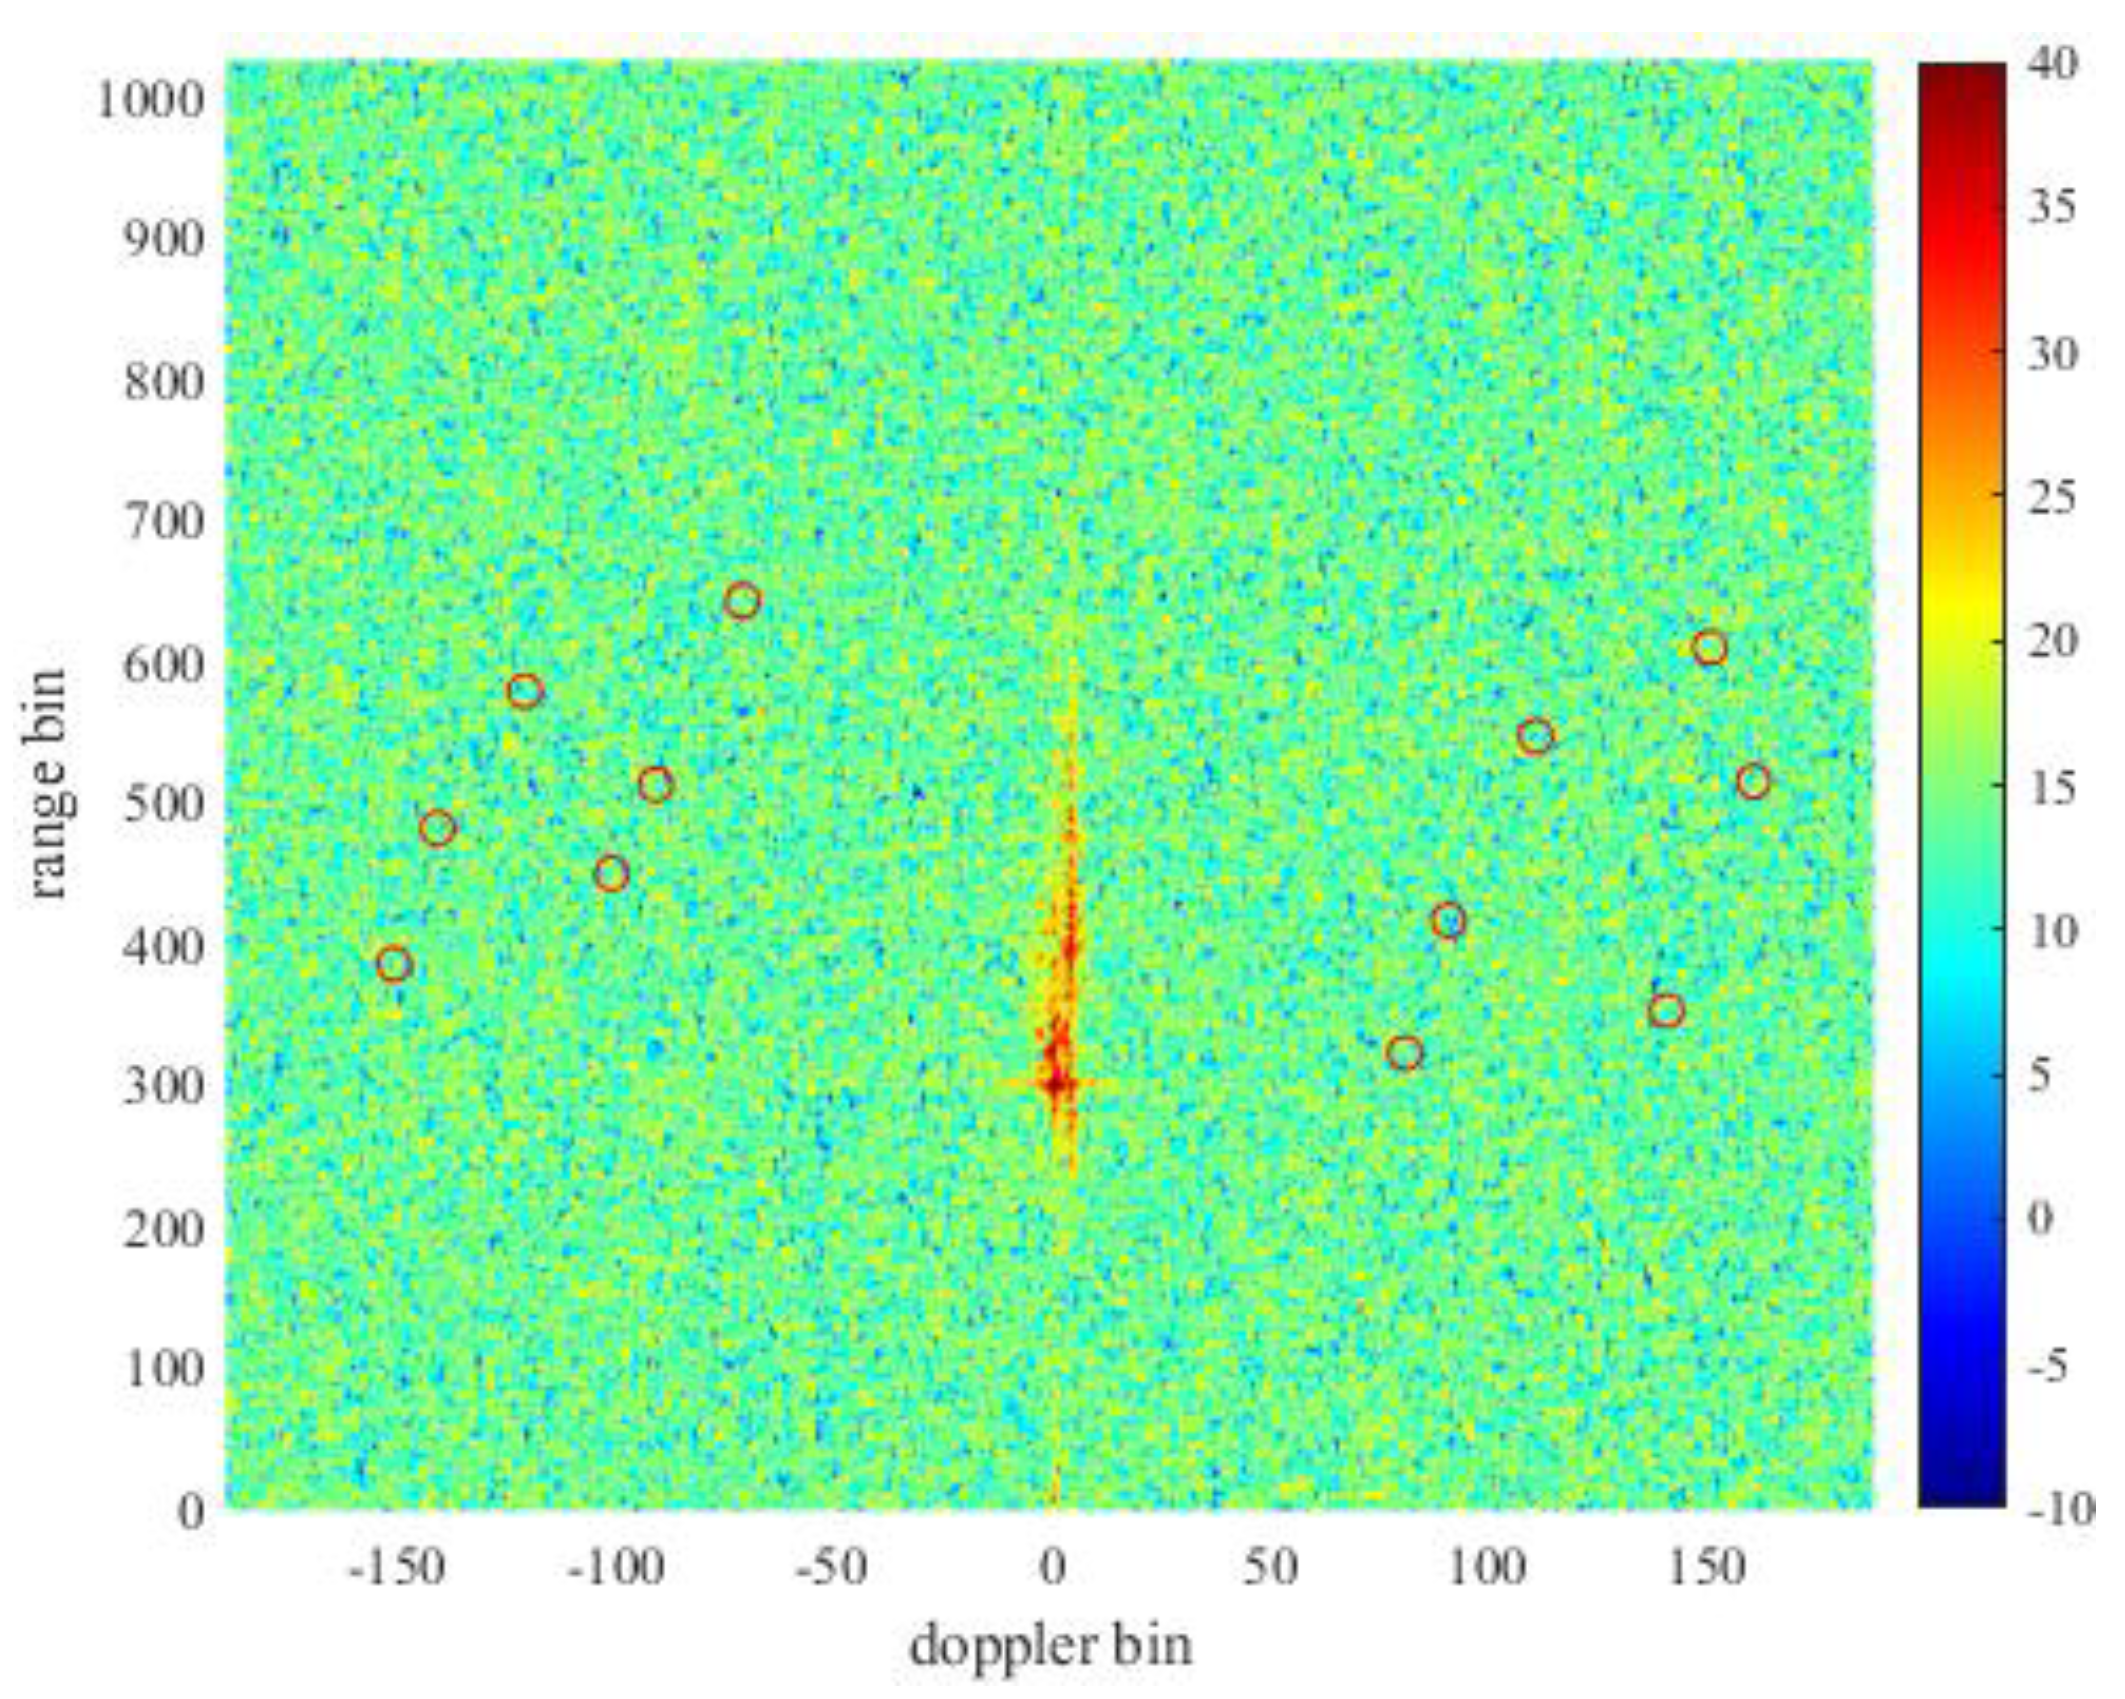
Echoes include echoes from targets and various clutter, among which the clutter is mainly sea clutter, and the data mainly includes two types of clutter, located in the range of 20 to 700 range bins and -10 to 10 Doppler bins. The Clutter distribution in the original data RD spectrum is shown in
Figure 7.
We randomly put 12 simulation targets randomly in the direction of the main lobe, and their range-Doppler positions are (385,-151), (481,-141), (578,-121), (449,-101), (512,-91), (642,-71), (322,81), (416,91), (546,111), (352,141), (514,161), (609,151), respectively, and their energies were different. The original RD spectrum is generated as shown in
Figure 7. Where the simulation target is circled in red circle. Apparently in the raw data, all targets are obscured by the energy of the clutter.
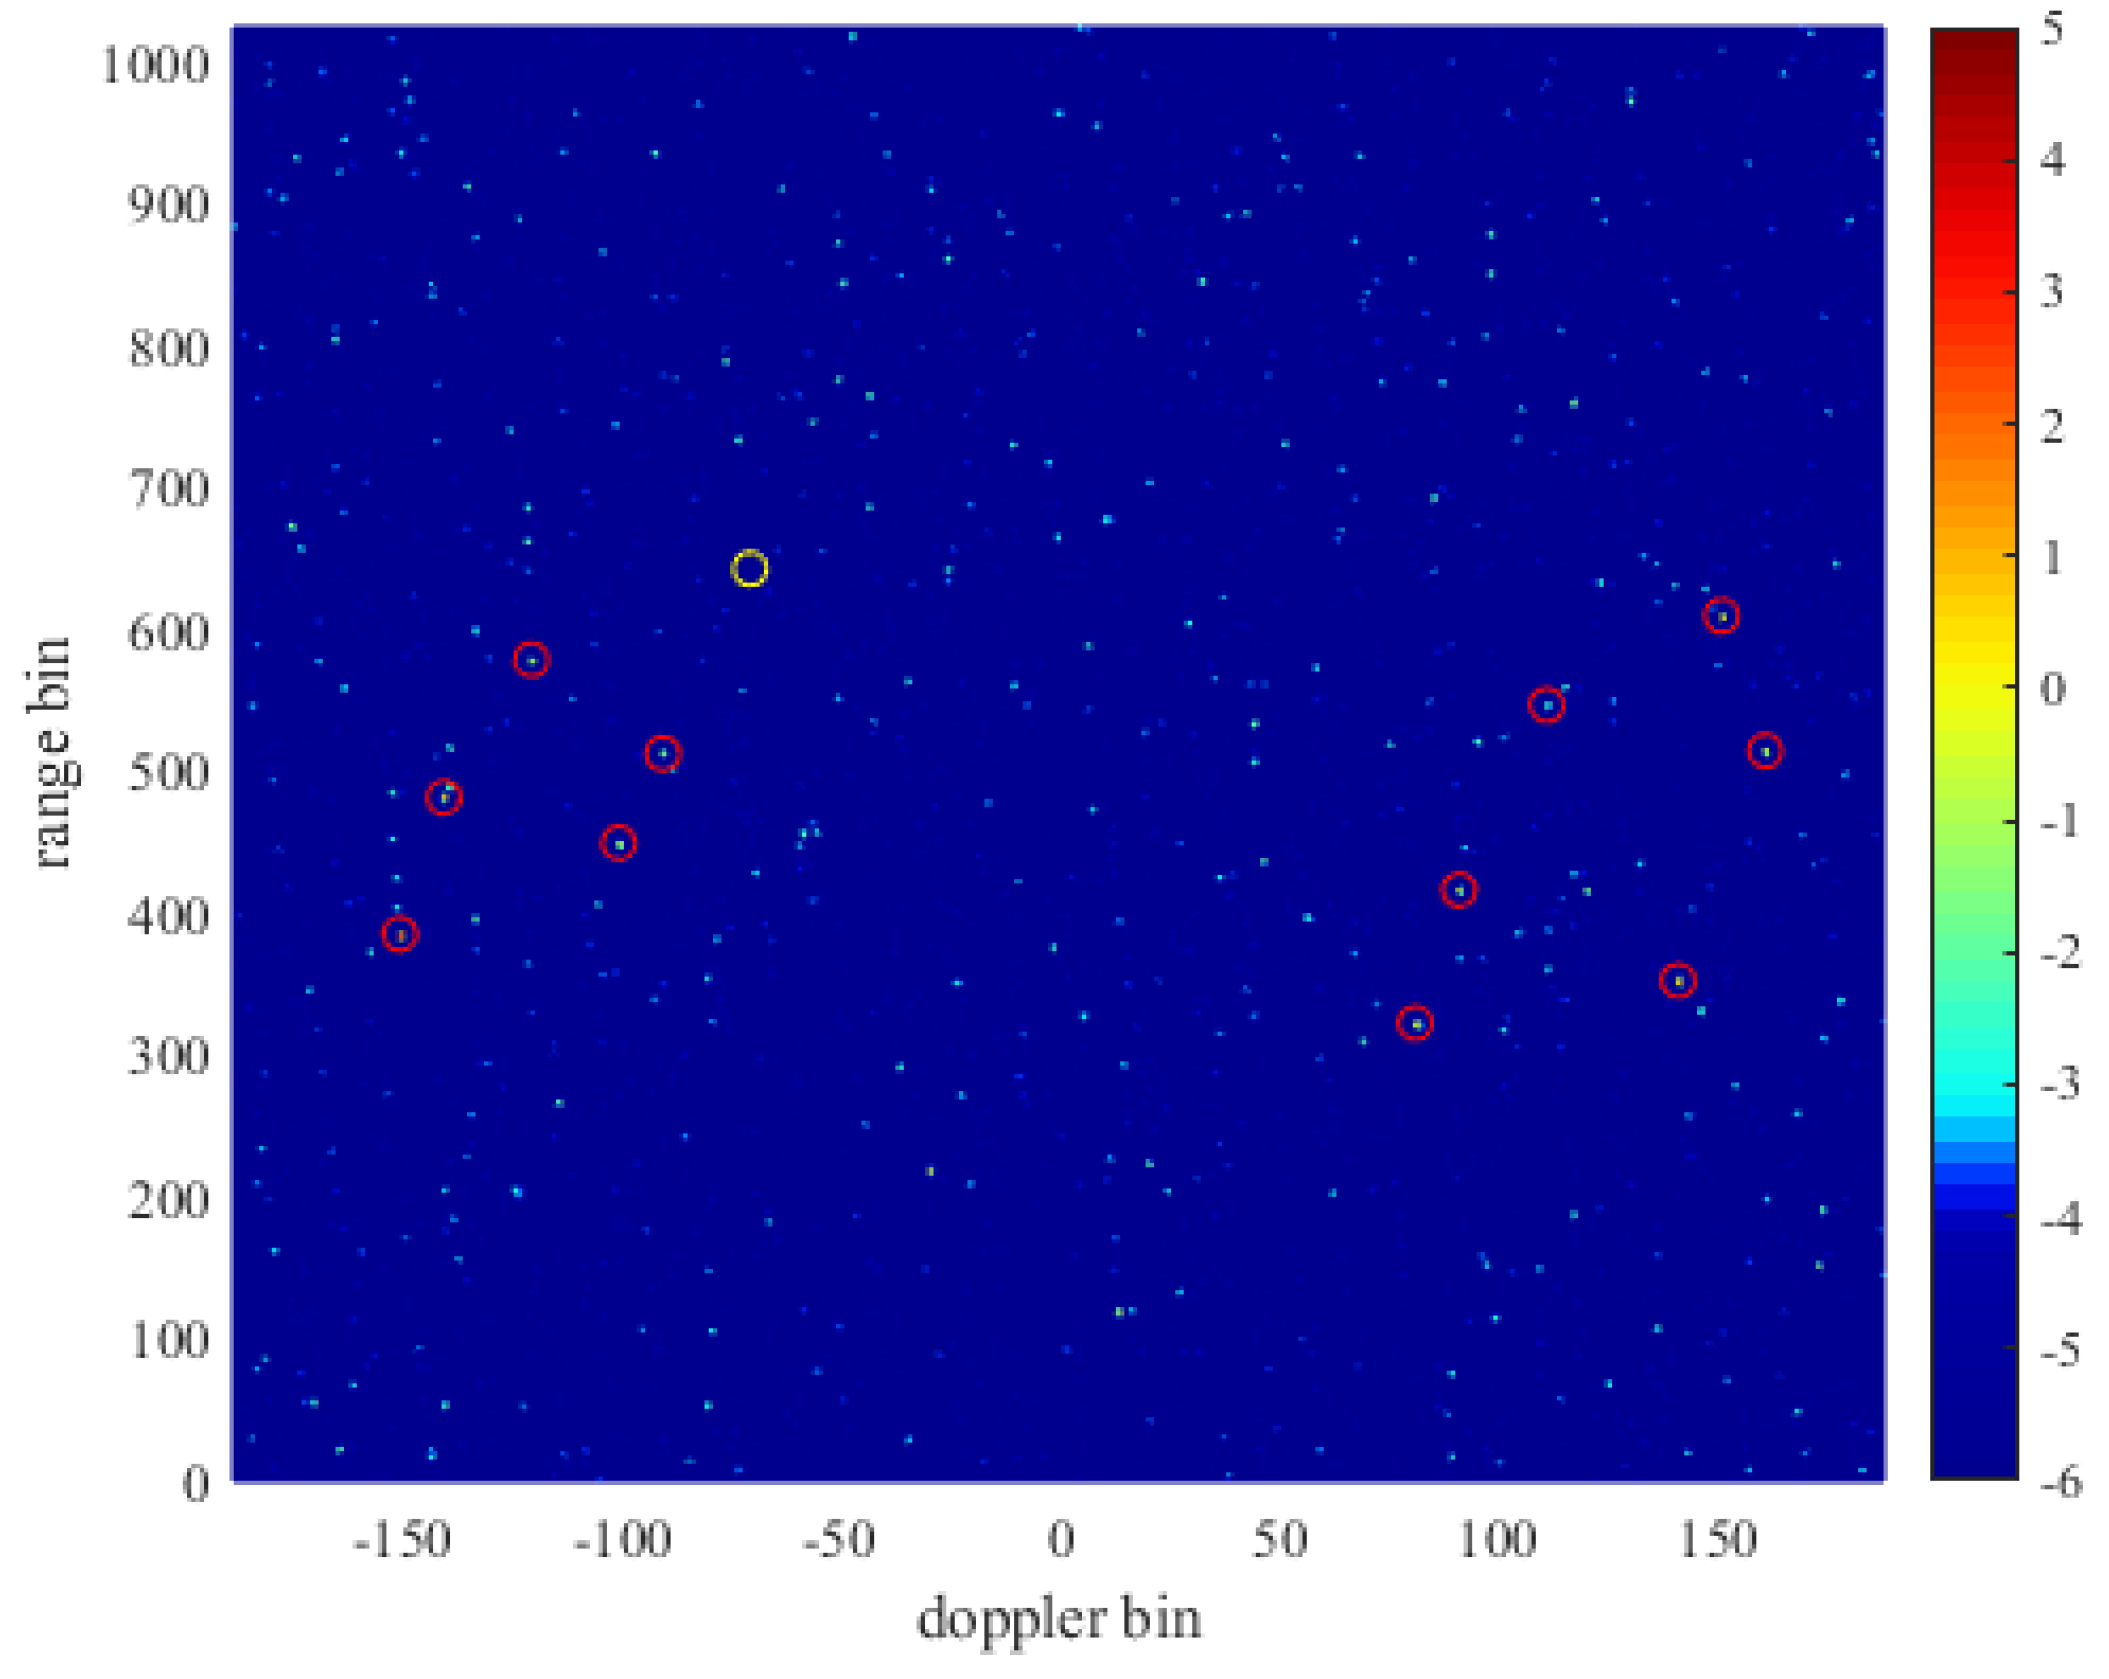
To make the target appear, it is necessary to suppress clutter in the original data. Here, the time-domain cancellation algorithm is used to suppress clutter. As shown in
Figure 8. After clutter suppression, a large amount of clutter is suppressed and the floor energy is reduced, so that the simulation target can be displayed and circled. The simulation targets in red circle in figure are high SNR targets with a minimum SNR of 11.2dB after clutter suppression due to the high energy set, so they are very evident on the RD spectrum. The simulation target at (642, -71) circled in yellow has a low SNR of only 7.8dB after clutter suppression due to the low set energy, so it is not significant in the RD spectrum. While the simulat”on t’rget at (642, -71) circled in yellow has a low SNR of only 7.8dB after clutter suppression due to the low set energy, so it is not significant in the RD spectrum.
4.2. Multi-Frame Sliding Matching Filtering
To ensure the short-term stationarity of the target, the suppressed adjacent two frames of data are spliced, and the sliding matching filter is used to generate sub-frames with the same accumulation time. The length of sliding window time window here is , that is, four sub-frames of data can be obtained for every two frames of original data.
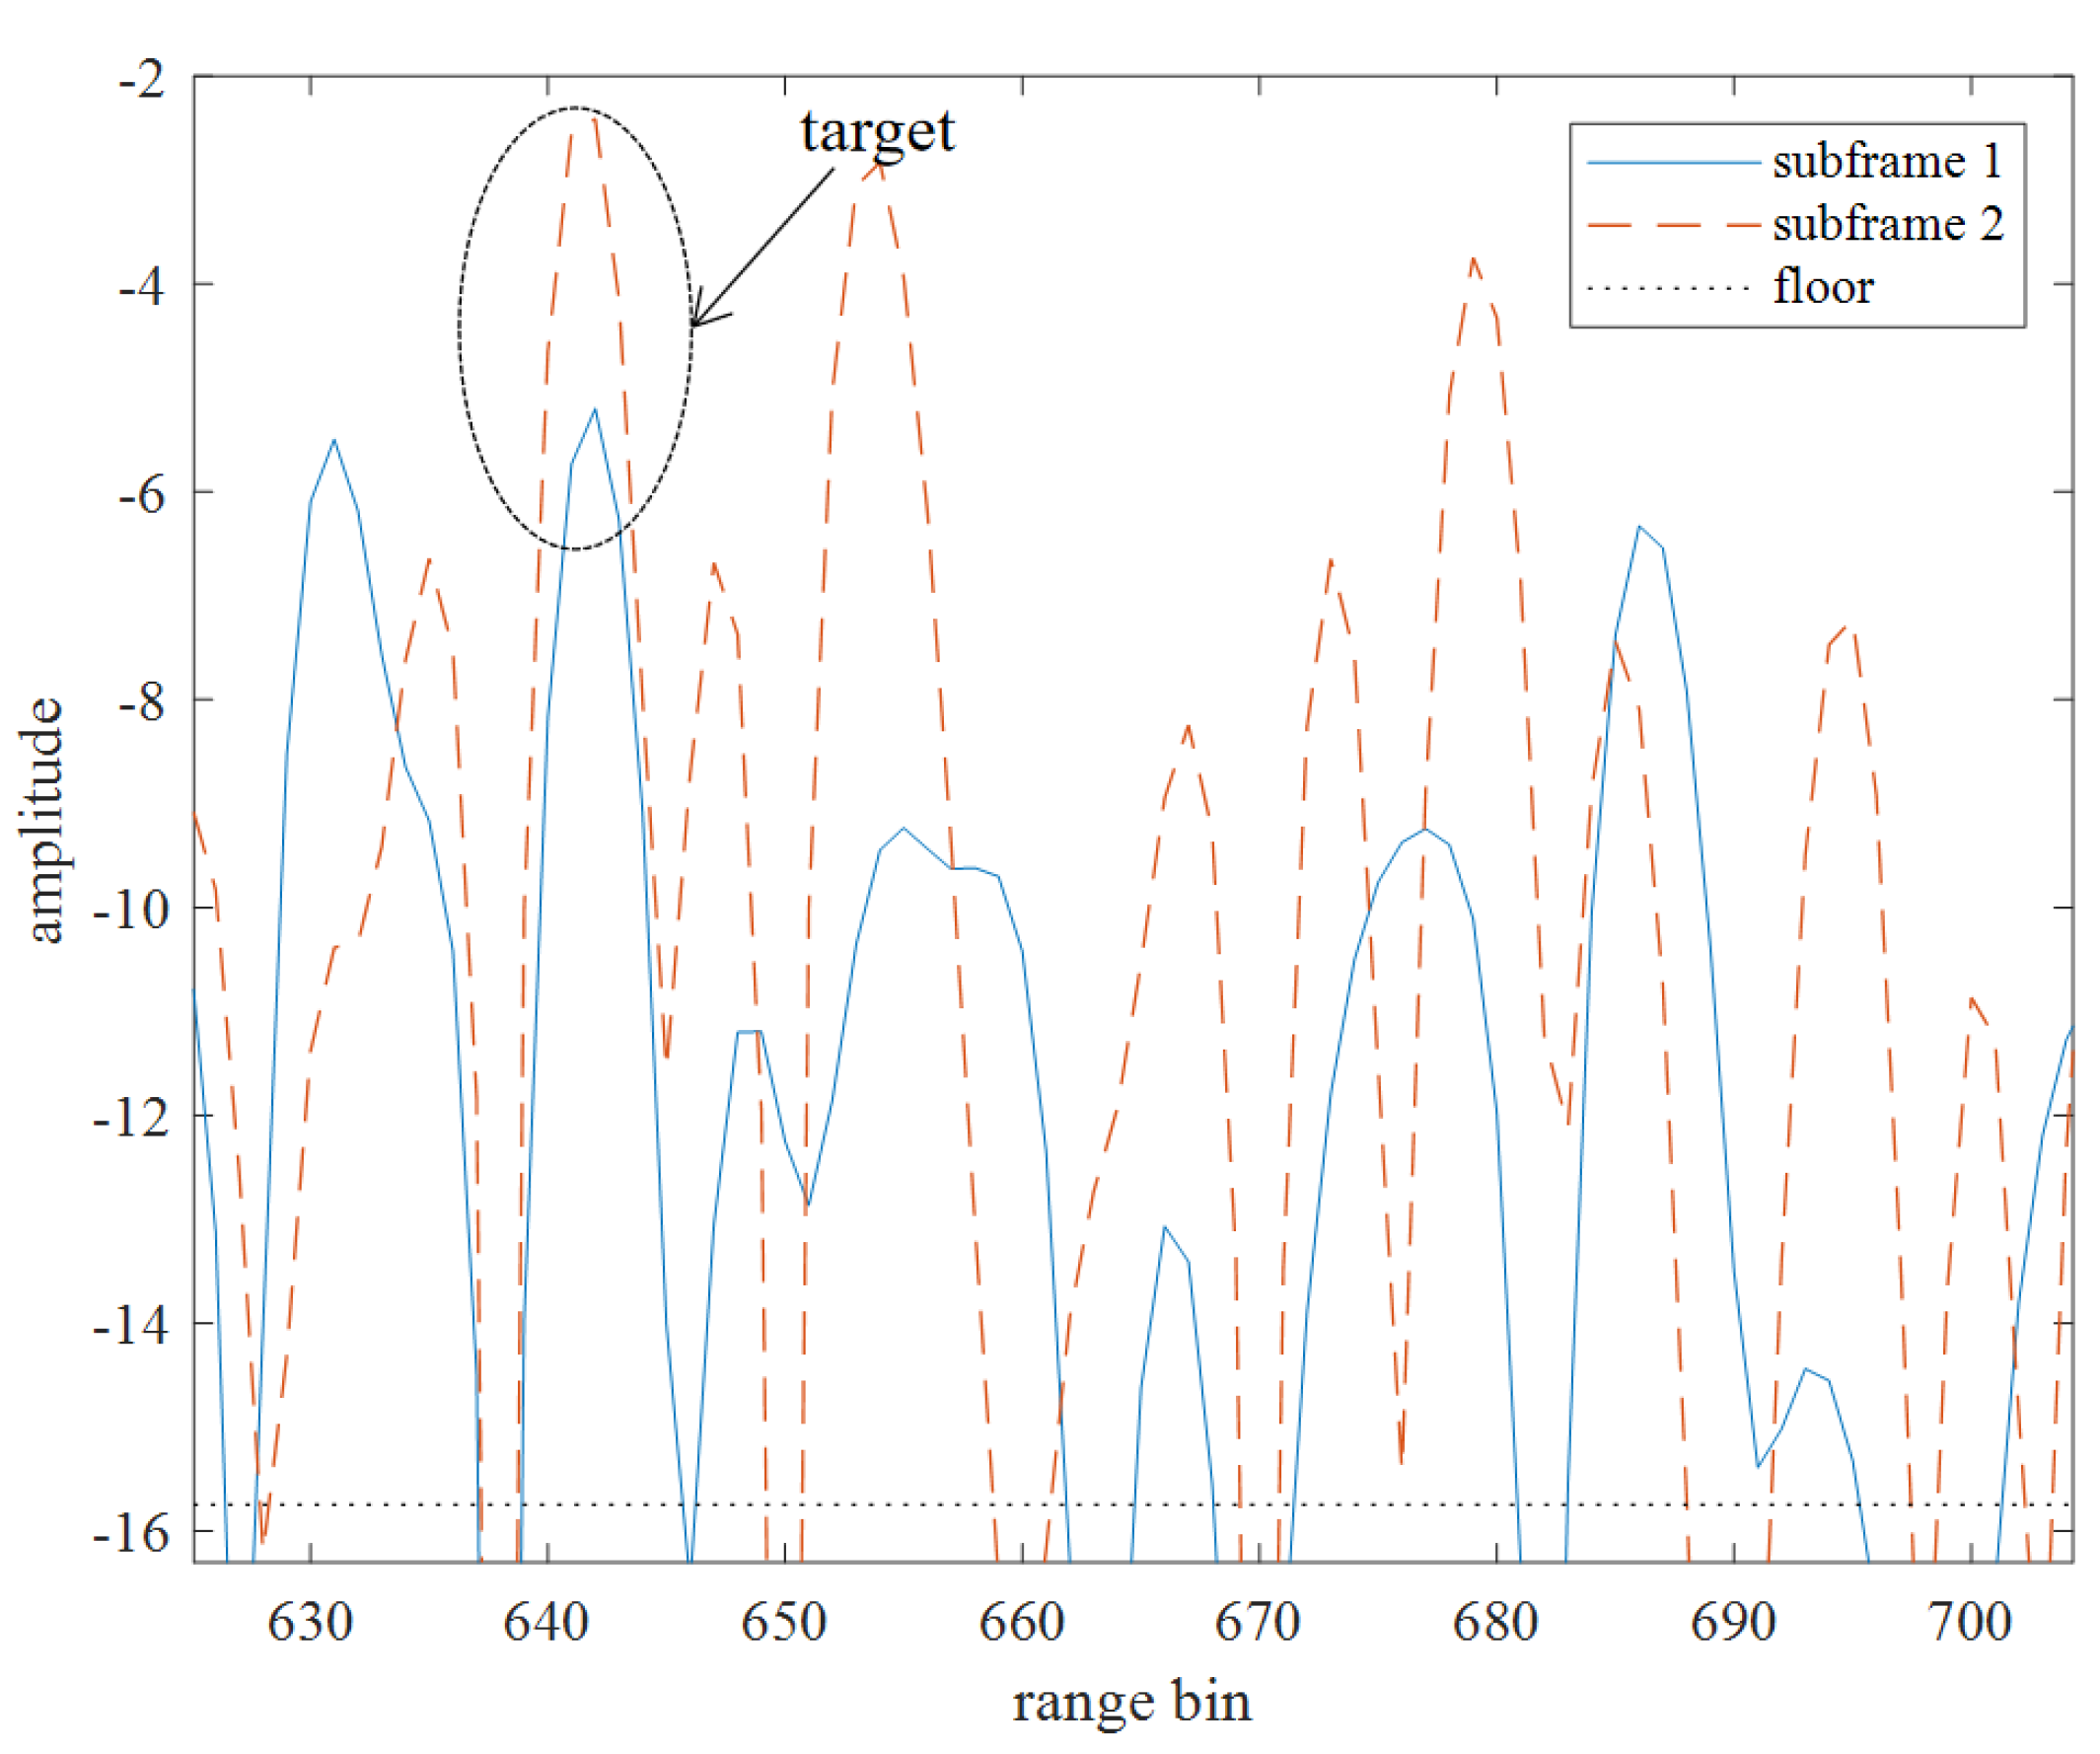
According to the Doppler slice of the low SNR simulation target (642, -71) in
Figure 9. This target has a peak higher than the floor energy at the corresponding position, so this target will not be lost when extracting all the peaks higher than the floor energy in the RD spectrum to generate the peak information matrix.
The comparison of Doppler slices of RD spectrum for low SNR simulation target in the first and second sub-frames shows in
Figure 9. The target has a peak and basically overlap in the RD spectrum of the two sub-frames, and there are only differences in energy. The target peak energy in the first sub-frame is -5.2dB while in the second sub-frame is -2.4dB, the energy fluctuation is less than 3dB. Compared with most other peaks, the performance of the target peak is more stable in the two sub-frames. It shows that under the appropriate sliding window length, the weak target signal keeps the relative time stable, but the false alarm is more random, so this feature can be used to reduce the false alarm rate.
4.3. Spatial Signal Processing Based on Single Snapshot Angle Measurement
According to the above operations, we can extract the range, Doppler and energy information of all the peaks with energy higher than the floor in each sub-frame, but to generate a complete peak information matrix, we need to know the azimuth information of each peak in each sub-frame, to distinguish the target from the false alarm more effectively. According to the spatial signal processing method based on single snapshot angle measurement mentioned in Section III, DOA estimation is performed on these peaks.
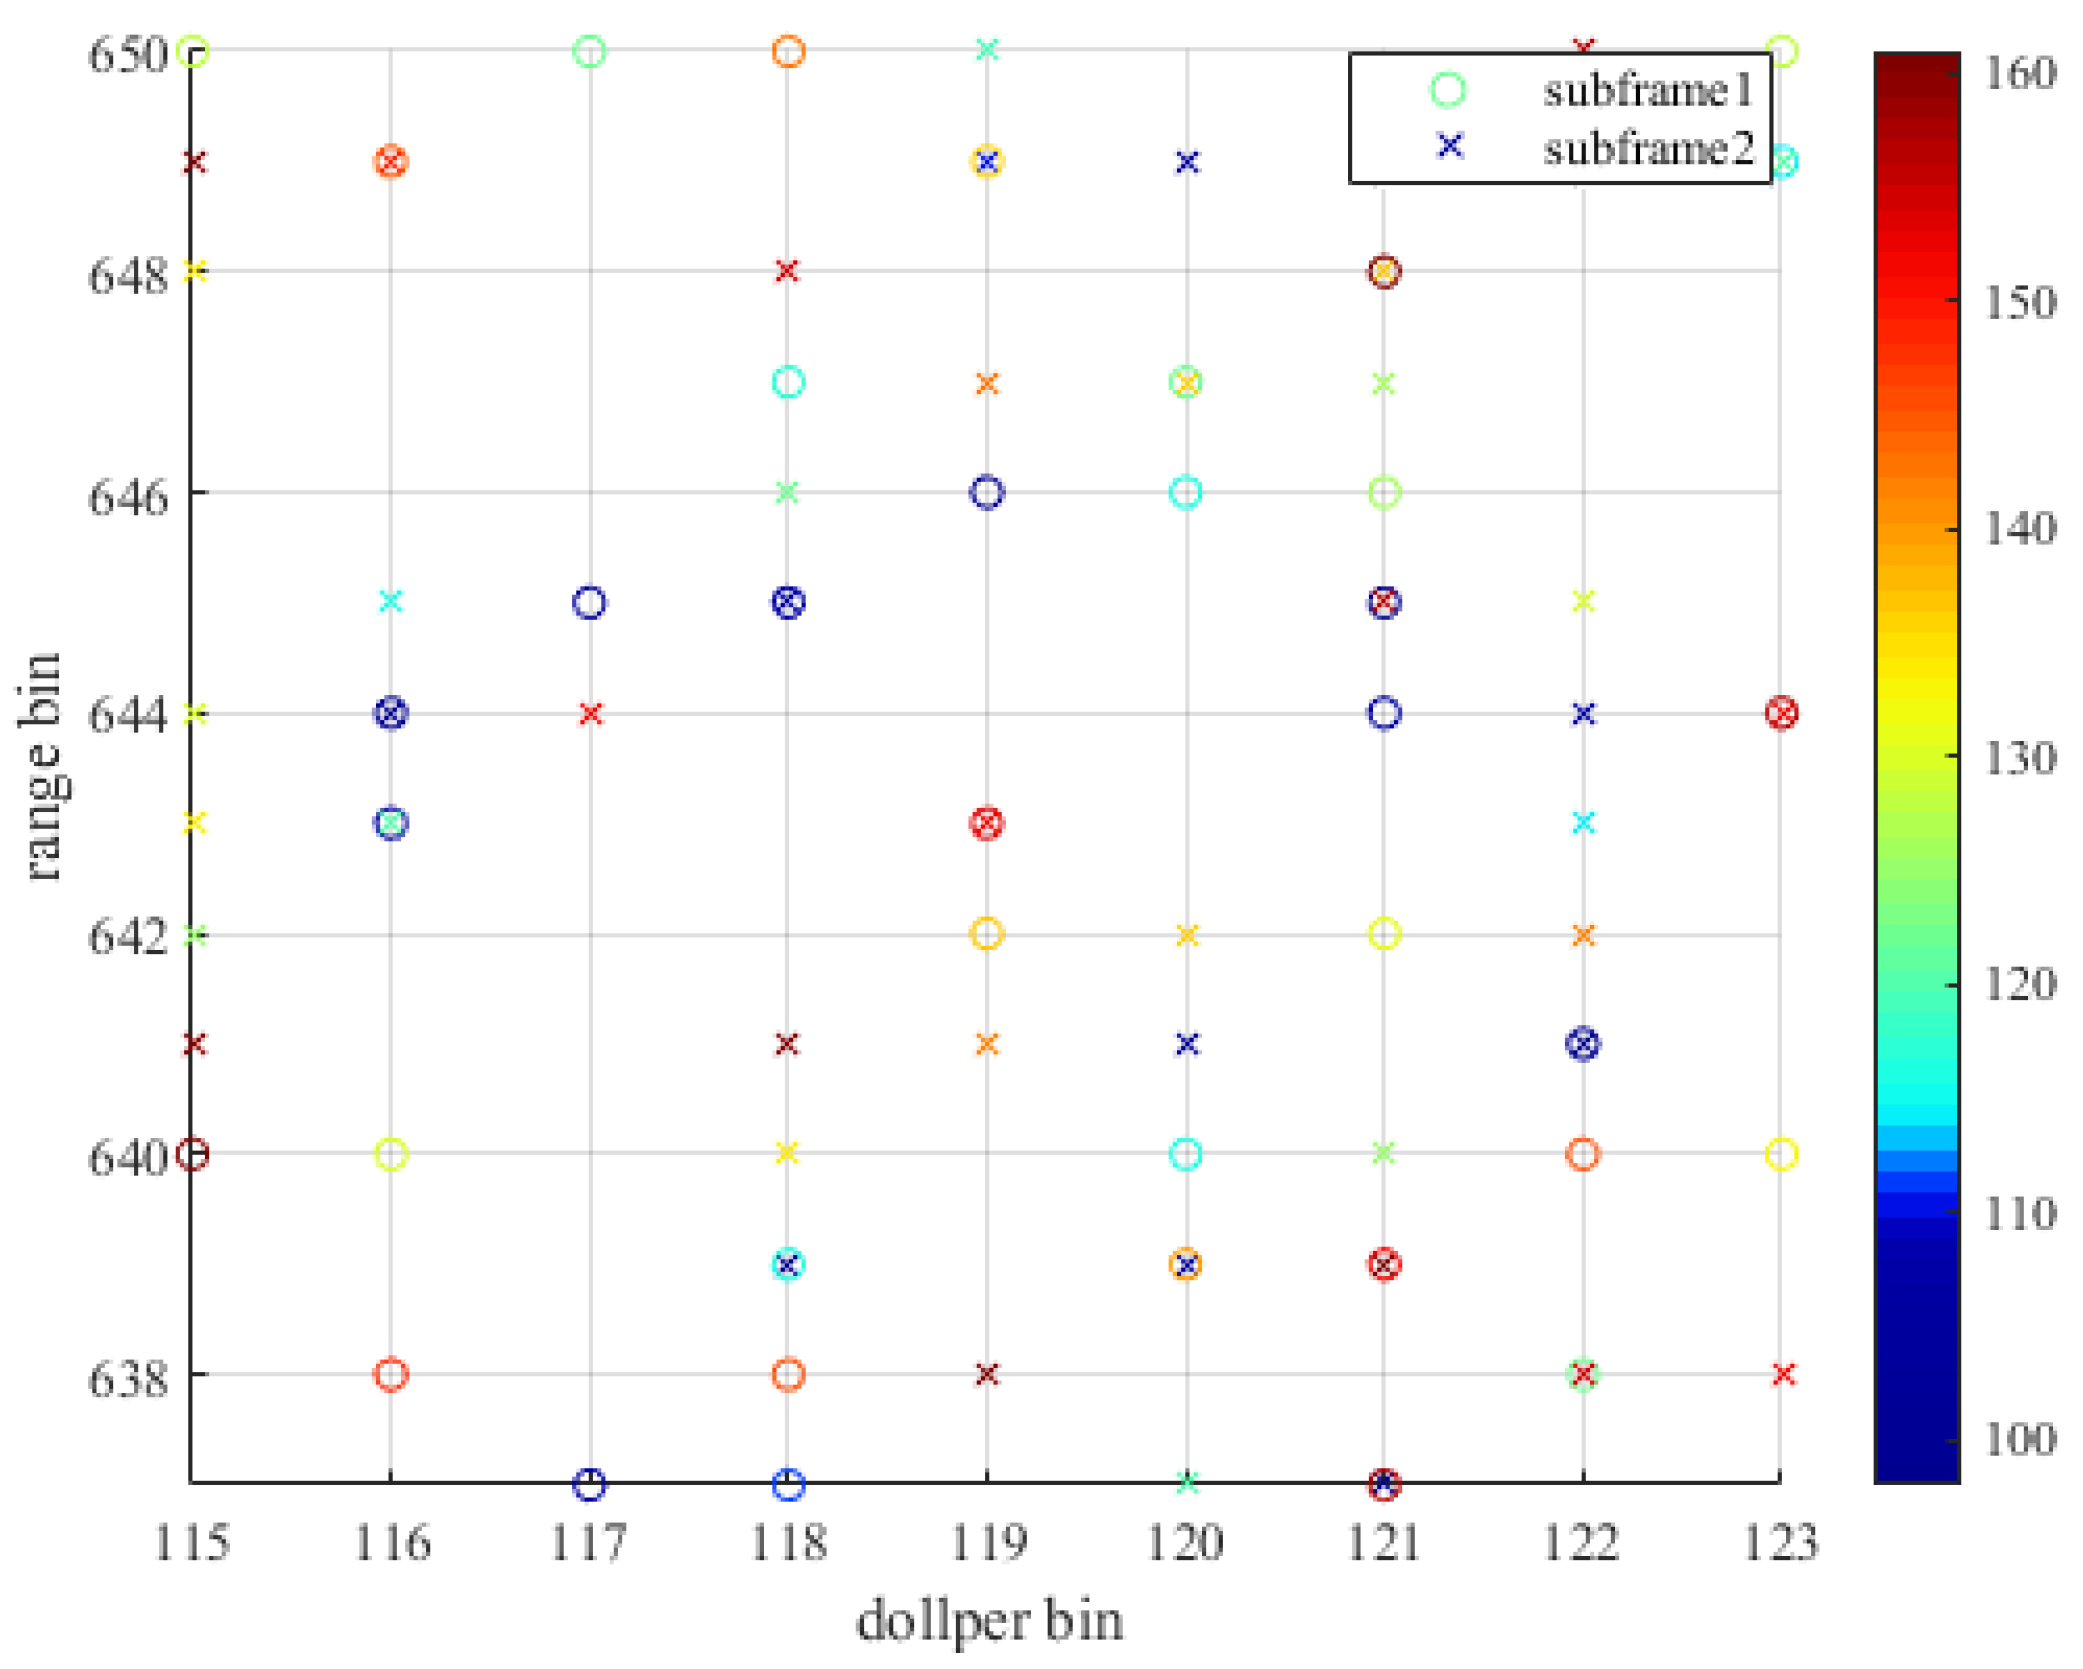
After obtaining the azimuth information of the peak point in each sub-frame, the peak azimuth spectrum can be generated. The comparison of the peak Angle spectrum of two adjacent sub-frames shows in
Figure 10. In which the dot is the peak azimuth spectrum of sub-frame 1, the cross is the peak angle spectrum of sub-frame 2, and the target is a weak simulation target, and the color represents the value of the azimuth angle. The weak target is detected in both adjacent sub-frames by sliding matching filtering, and both are detected in the direction of the main lobe. At the same time, there are completely different peak points in the azimuth spectrum of the two sub-frames at different range, Doppler and azimuth angles, indicating that these peak points are spatially unstable compared with the target. Therefore, the target can be distinguished from false alarms by the spatial stationary characteristics.
4.4. Spatial Signal Processing Based on Single Snapshot Angle Measurement
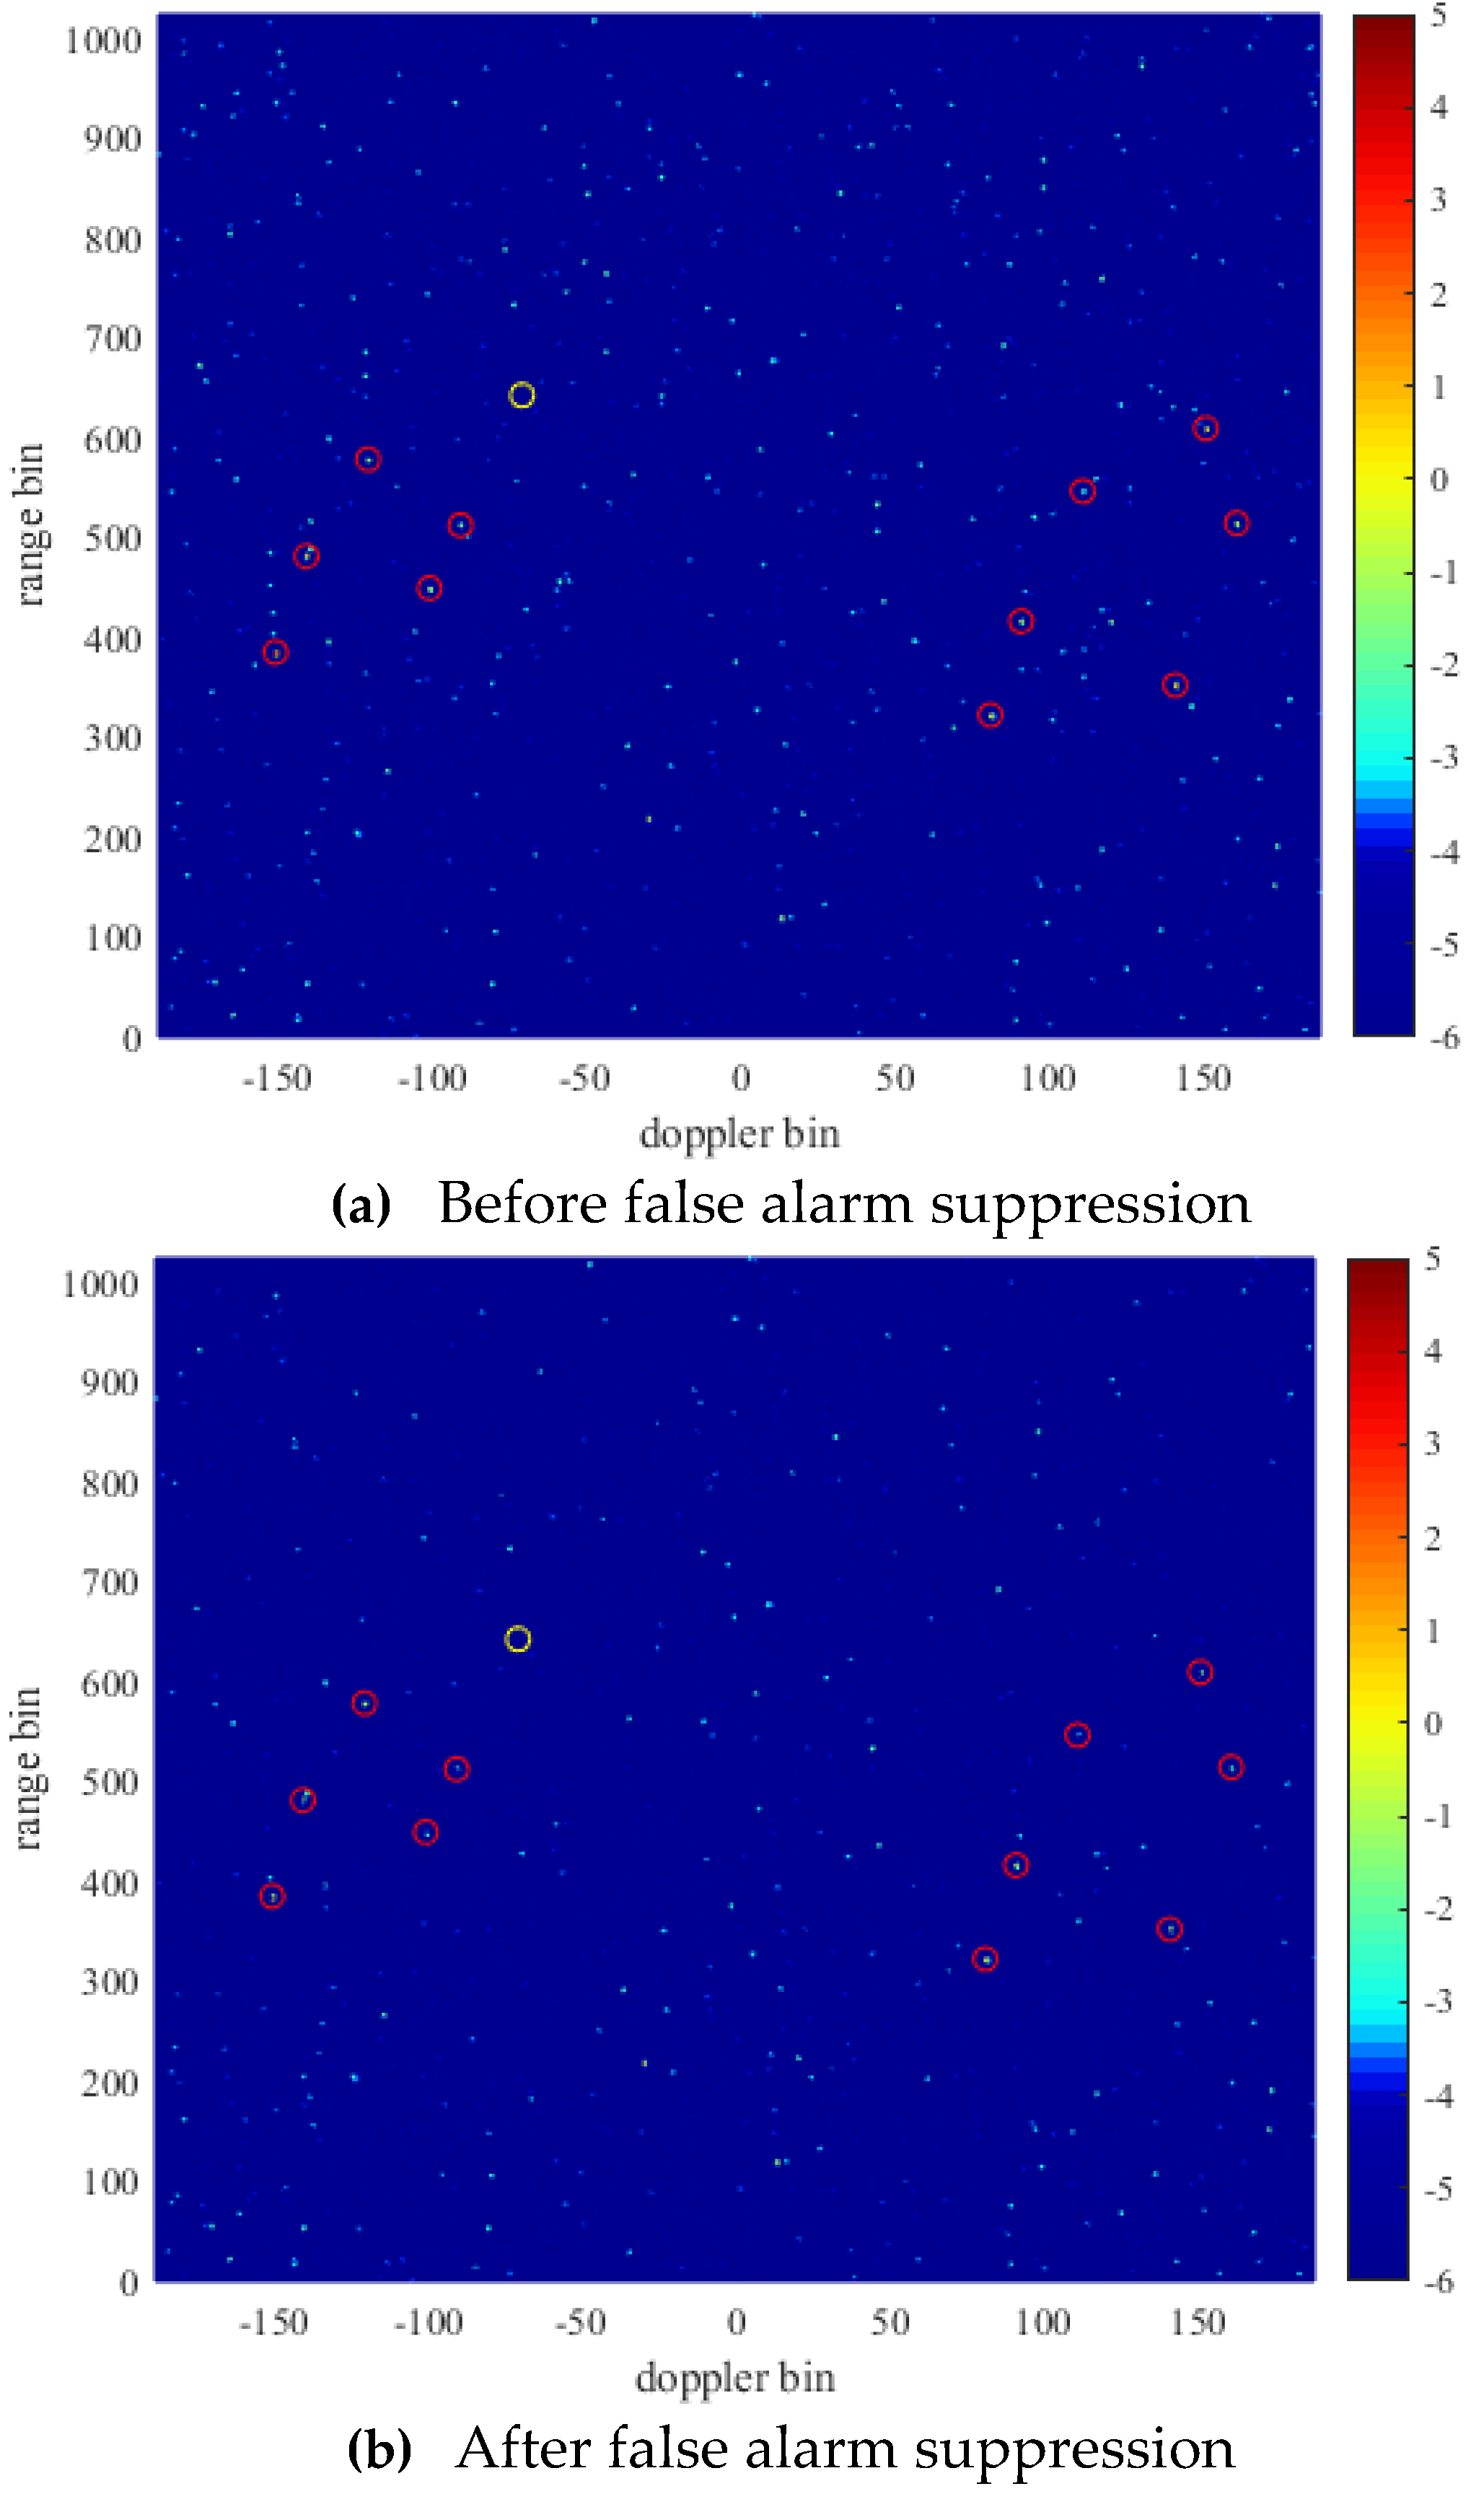
After gaining the peak range, Doppler, energy, and azimuth information in each sub-frame, false alarms are reduced according to the method described above, and the peaks whose Mahalanobis distance is less than the reference threshold dthr in each sub-frame are retained, and the peak energy whose Mahalanobis distance is more than the reference threshold dthr is suppressed into the floor energy.
As can be seen from
Figure 11. There are a lot of bright spots disappear in the RD spectrum after reducing the false alarm, which means that a large number of false alarms are eliminated. There are 12,608 peak points can be detected in the RD spectrum before false alarm, and 517 peak points remain after reducing false alarm, that is, more than 95% of false alarm points are eliminated. For the weak target in the yellow circle, the peak of the weak target in the RD spectrum still exists and its energy remains unchanged after false alarm suppression, which indicates that the radar false alarm suppression method based on target space-time stationarity can effectively reduce the false alarm rate while retaining the weak target signal.
4.5. Target Track Generation Based on Spatial-Temporal Stationarity
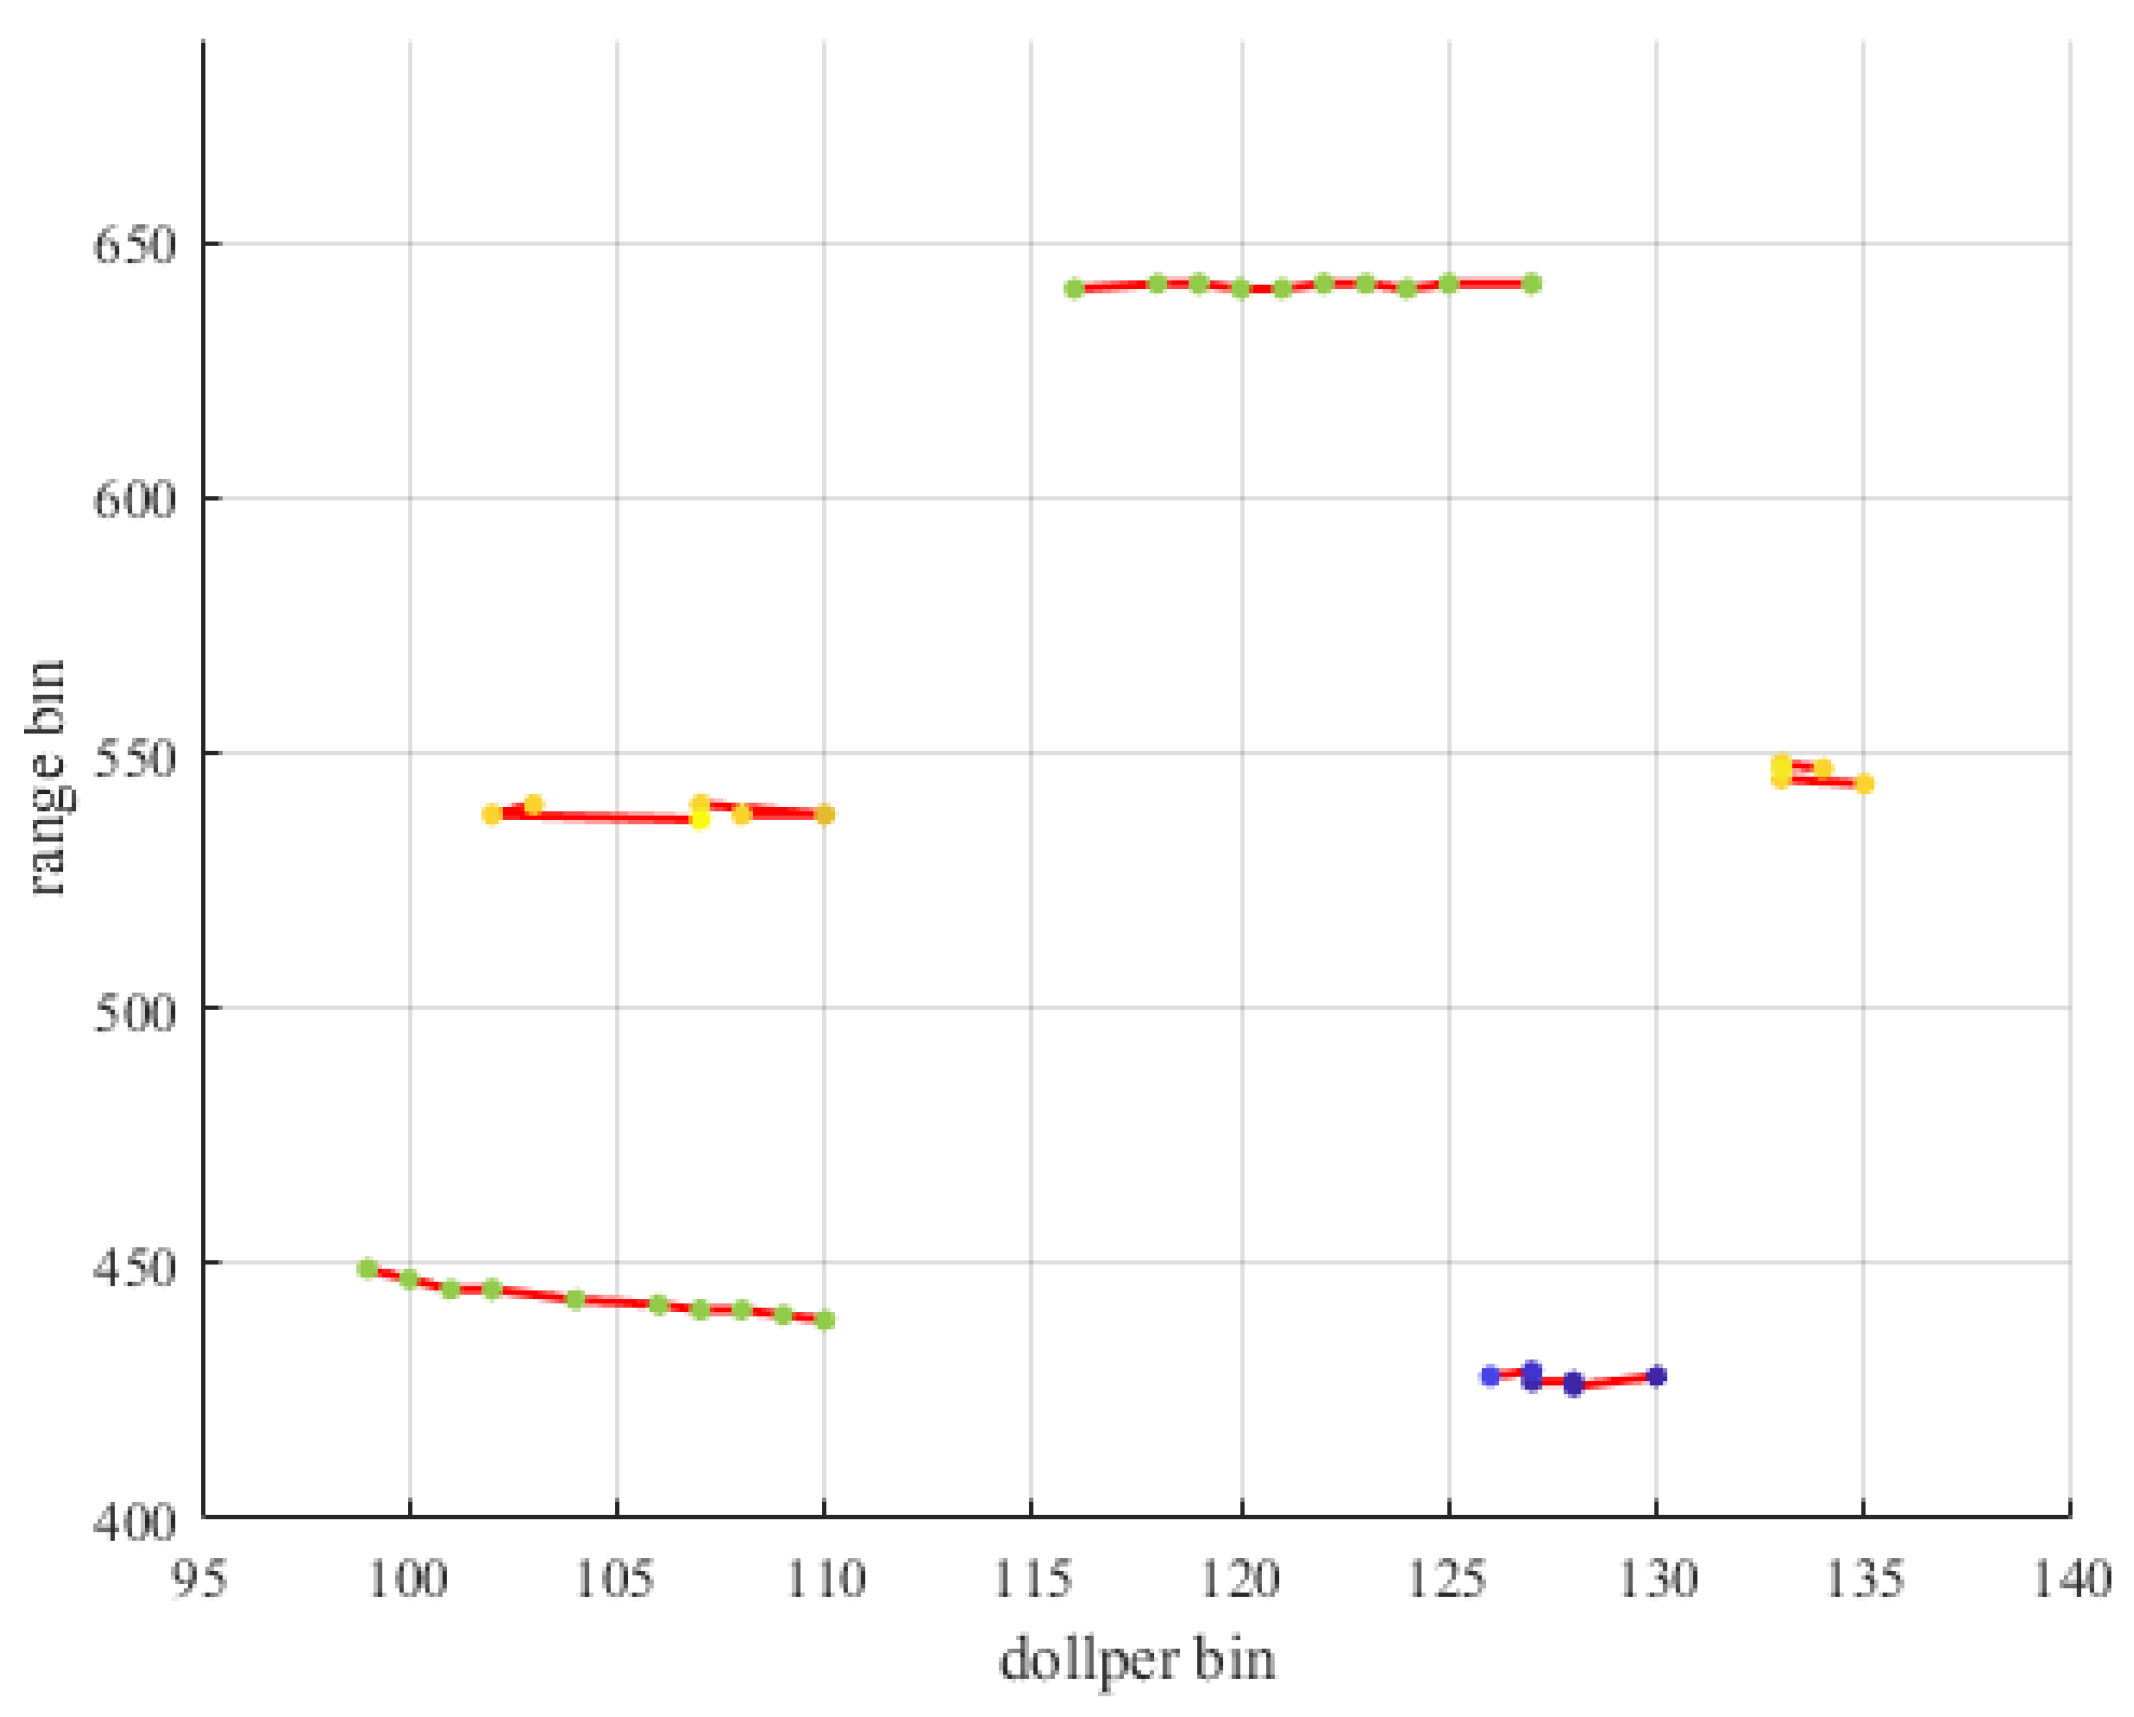
Two simulation tracks were placed near the range-Doppler unit positions (449, -101) and (642, -71) with a duration of ten frames of data length. The target track generation based on spatial-temporal stationarity is performed after ten frames of data are processed by traditional time-domain clutter suppression and false alarm suppression.
The tracking results are shown in
Figure 12. The track generation method based on spatial-temporal stationarity successfully tracked two simulation tracks, indicating that if the target can form a stable track, the points in the track can be tracked and retained during the tracking process. Therefore, the spatial-temporal stationarity of the target is used to generate the track, the scattered false alarm points can be further eliminated while retaining the target trace.
To verify the effect of the algorithm in practical application, we use the radar signal integration system based on OFDM signal to conduct field experiments. The radar beam of this system is oriented toward the ocean, and multiple UAVs fly in the experiment site and record their track information, which will be used to compare the track tracking results of the algorithm.
As can be seen from
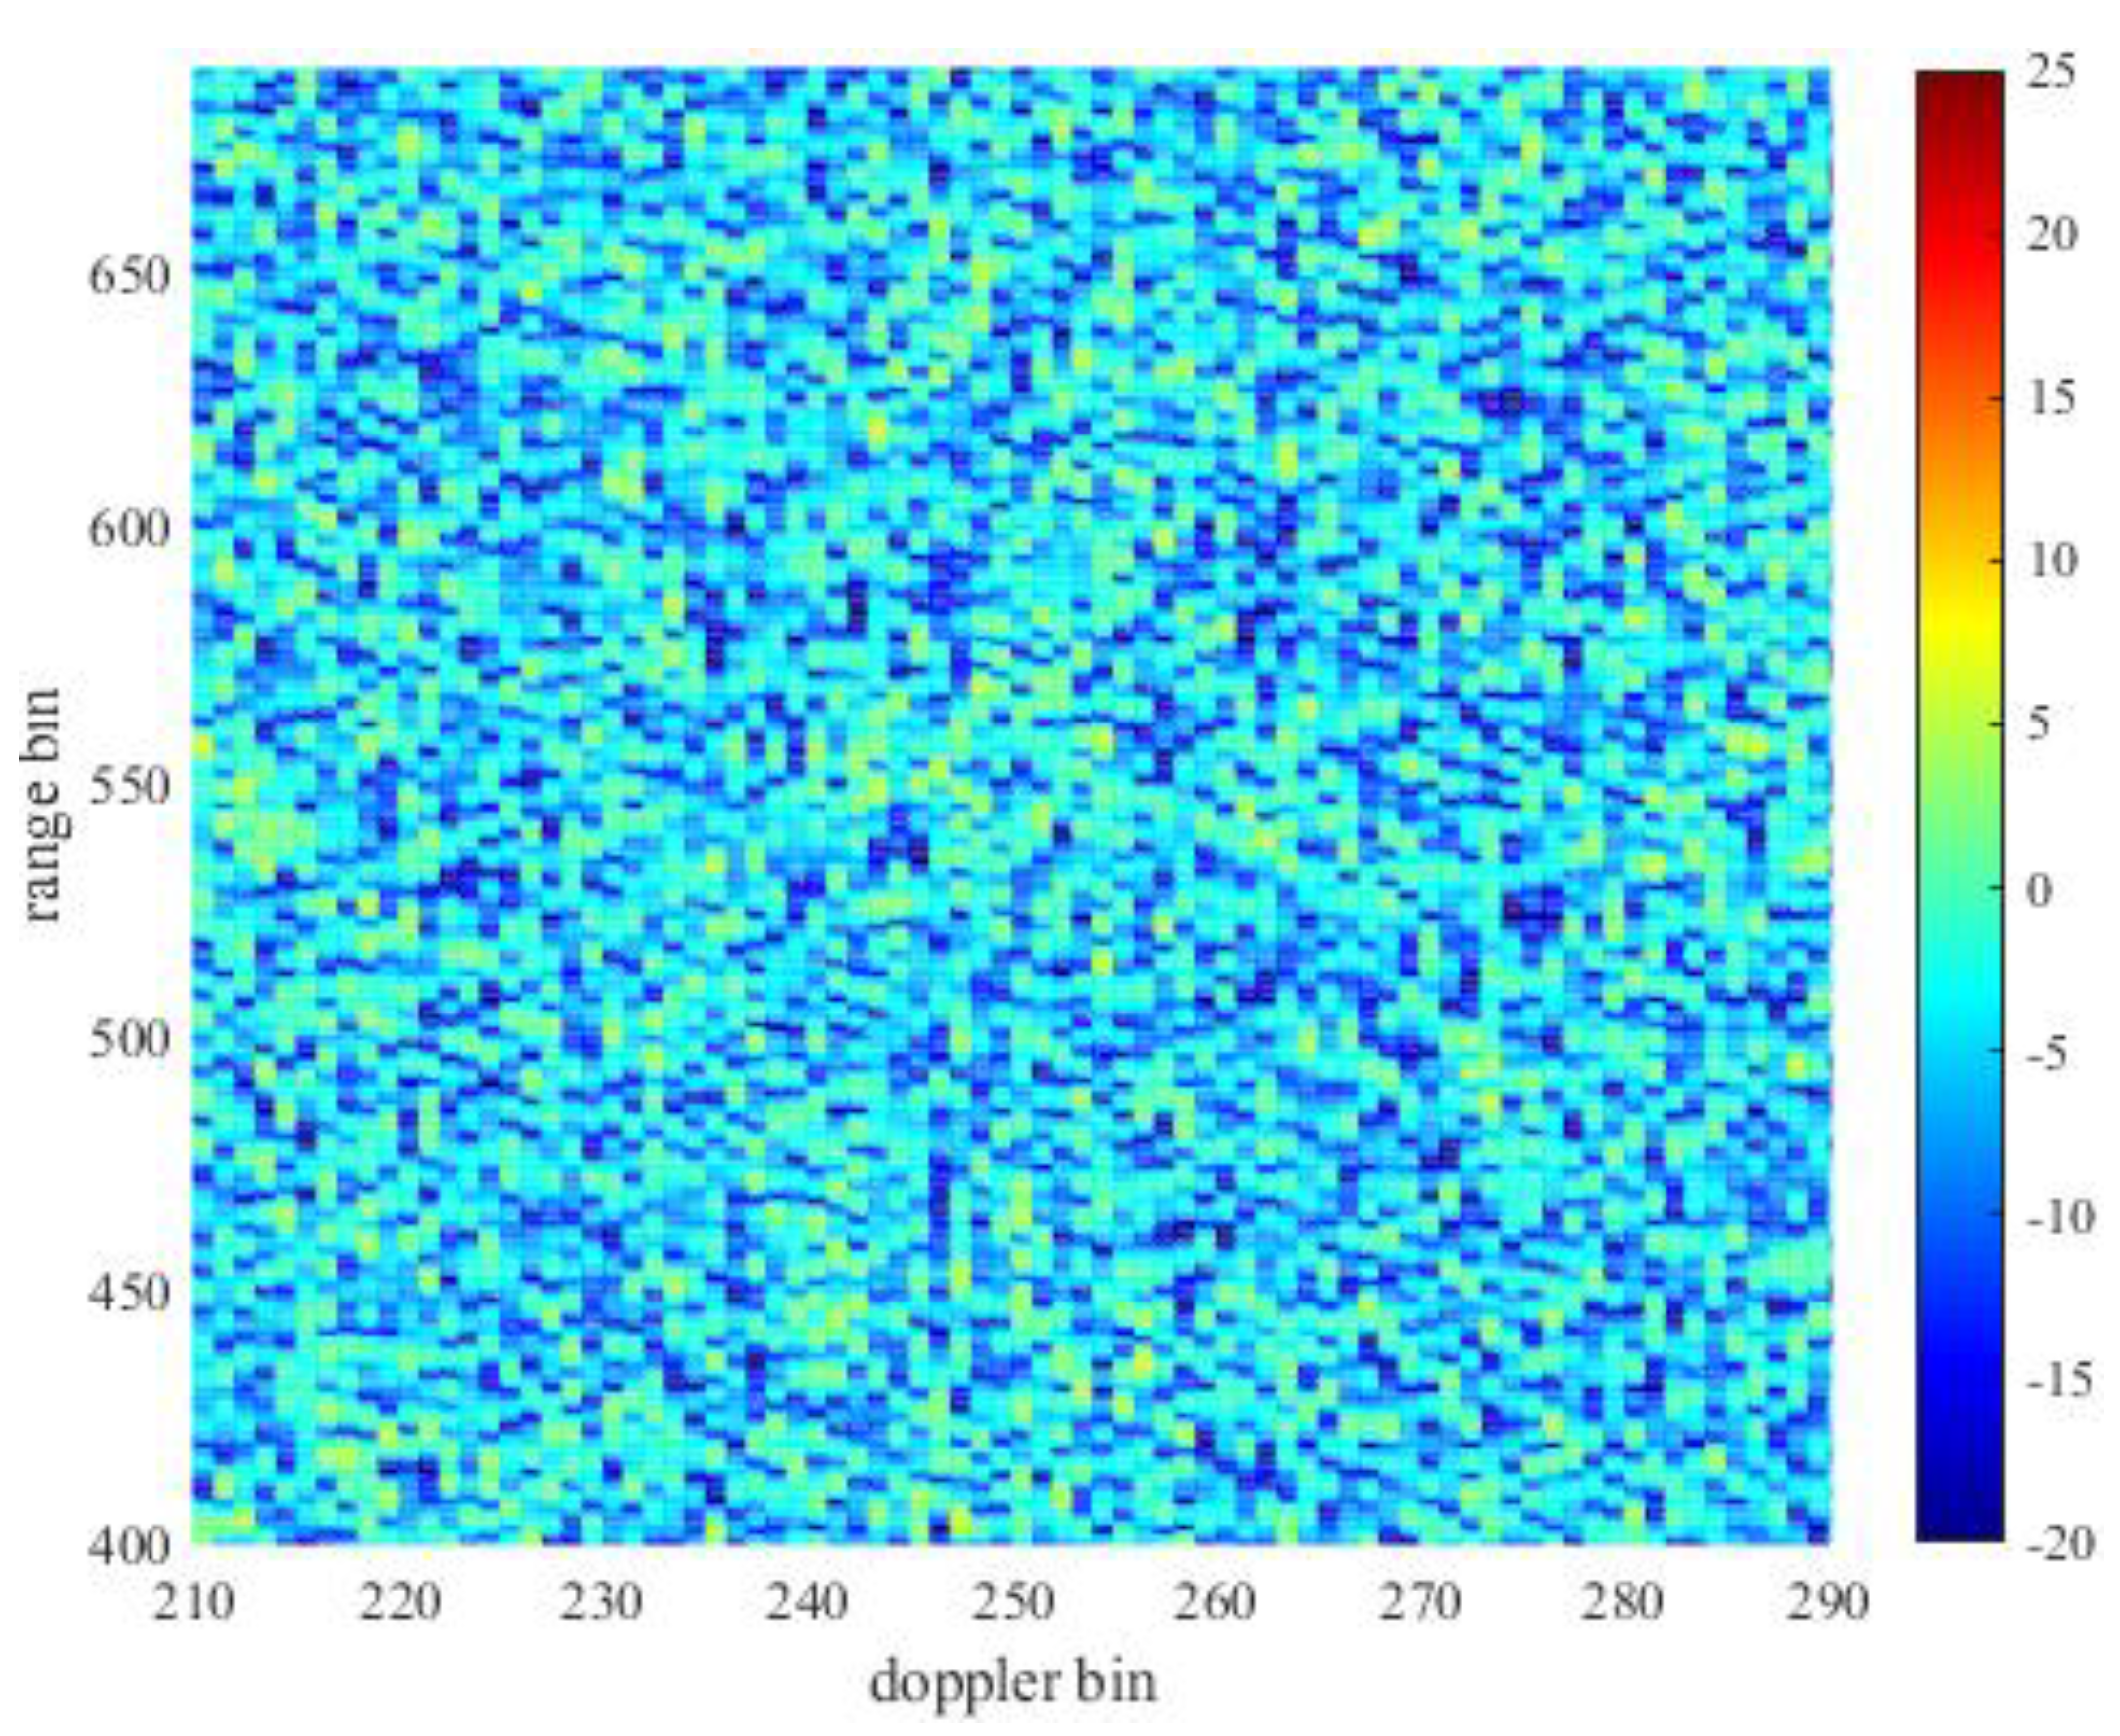
Figure 13. The clutter in the raw data RD spectrum is mainly sea clutter because the radar main lobe is toward the ocean. The existence of these clutter increases the floor energy of the raw data RD spectrum, which leads to the target being buried under the clutter energy. Therefore, clutter suppression is needed to reduce the floor energy to expose the peak of the target. The results of traditional time domain suppression are shown in
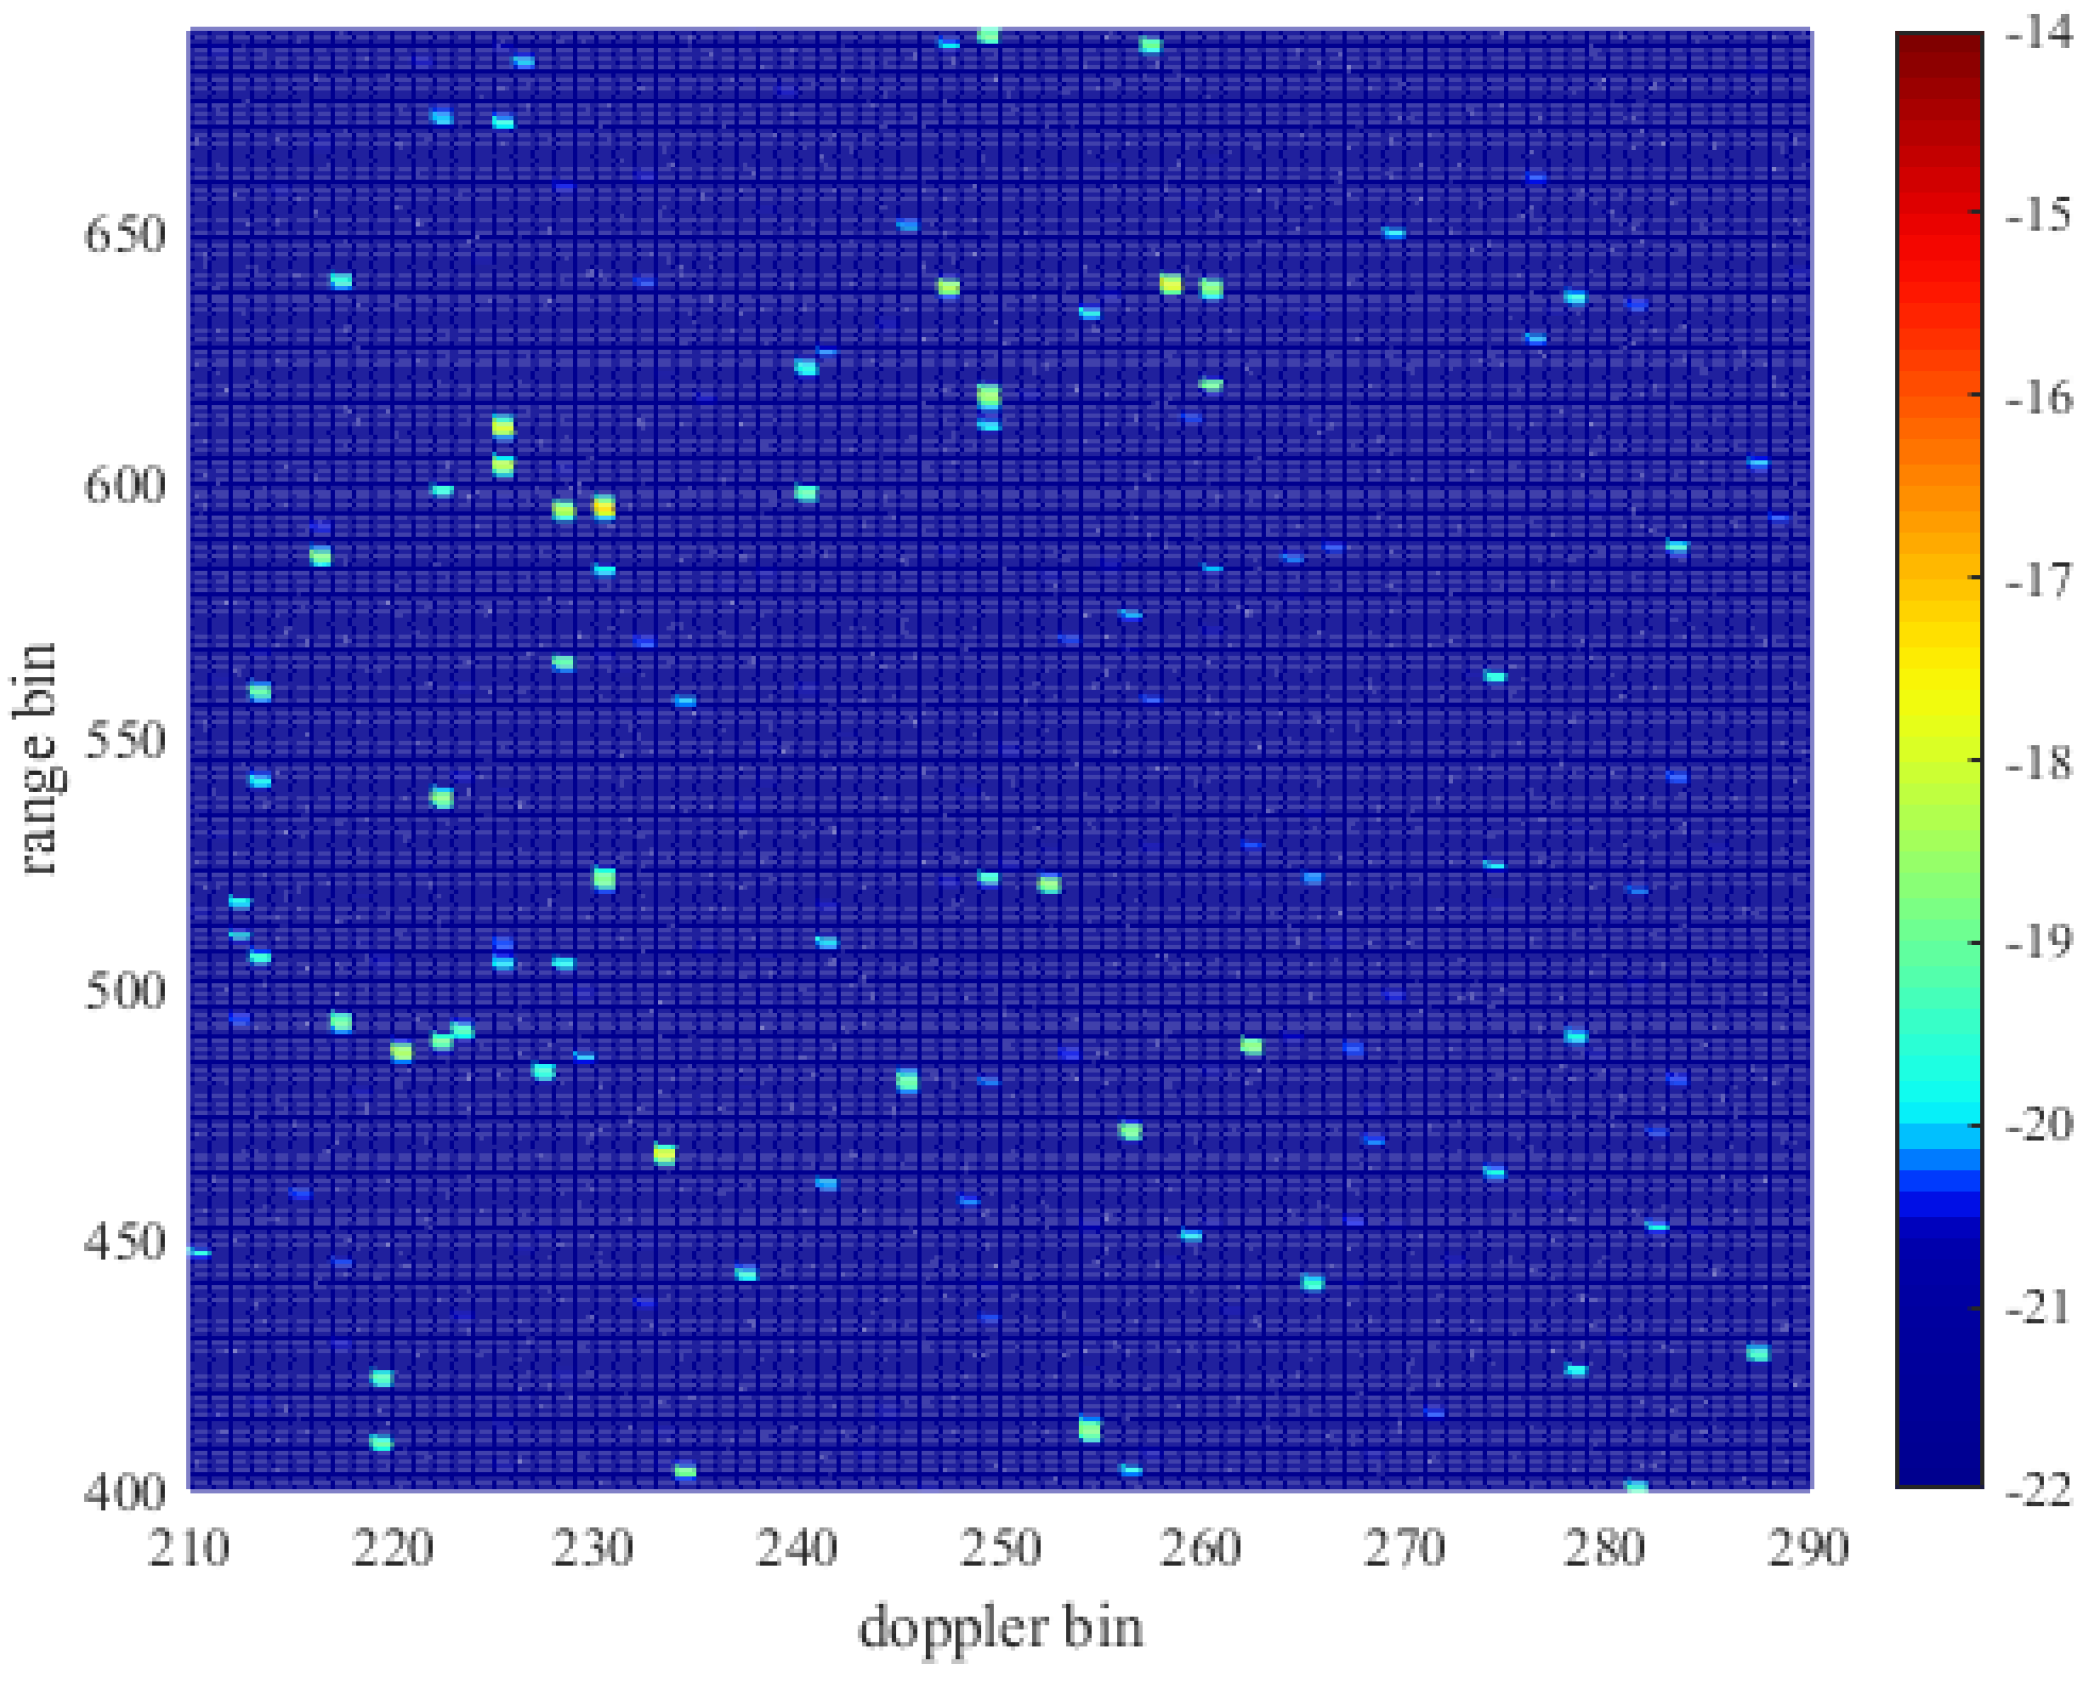
Figure 14. After clutter suppression, the floor energy is reduced by about 25dB, which is enough to make the target manifest. However, due to the influence of clutter residue, there are a lot of false alarms in the suppressed RD spectrum, which have a bad influence on the target detection.
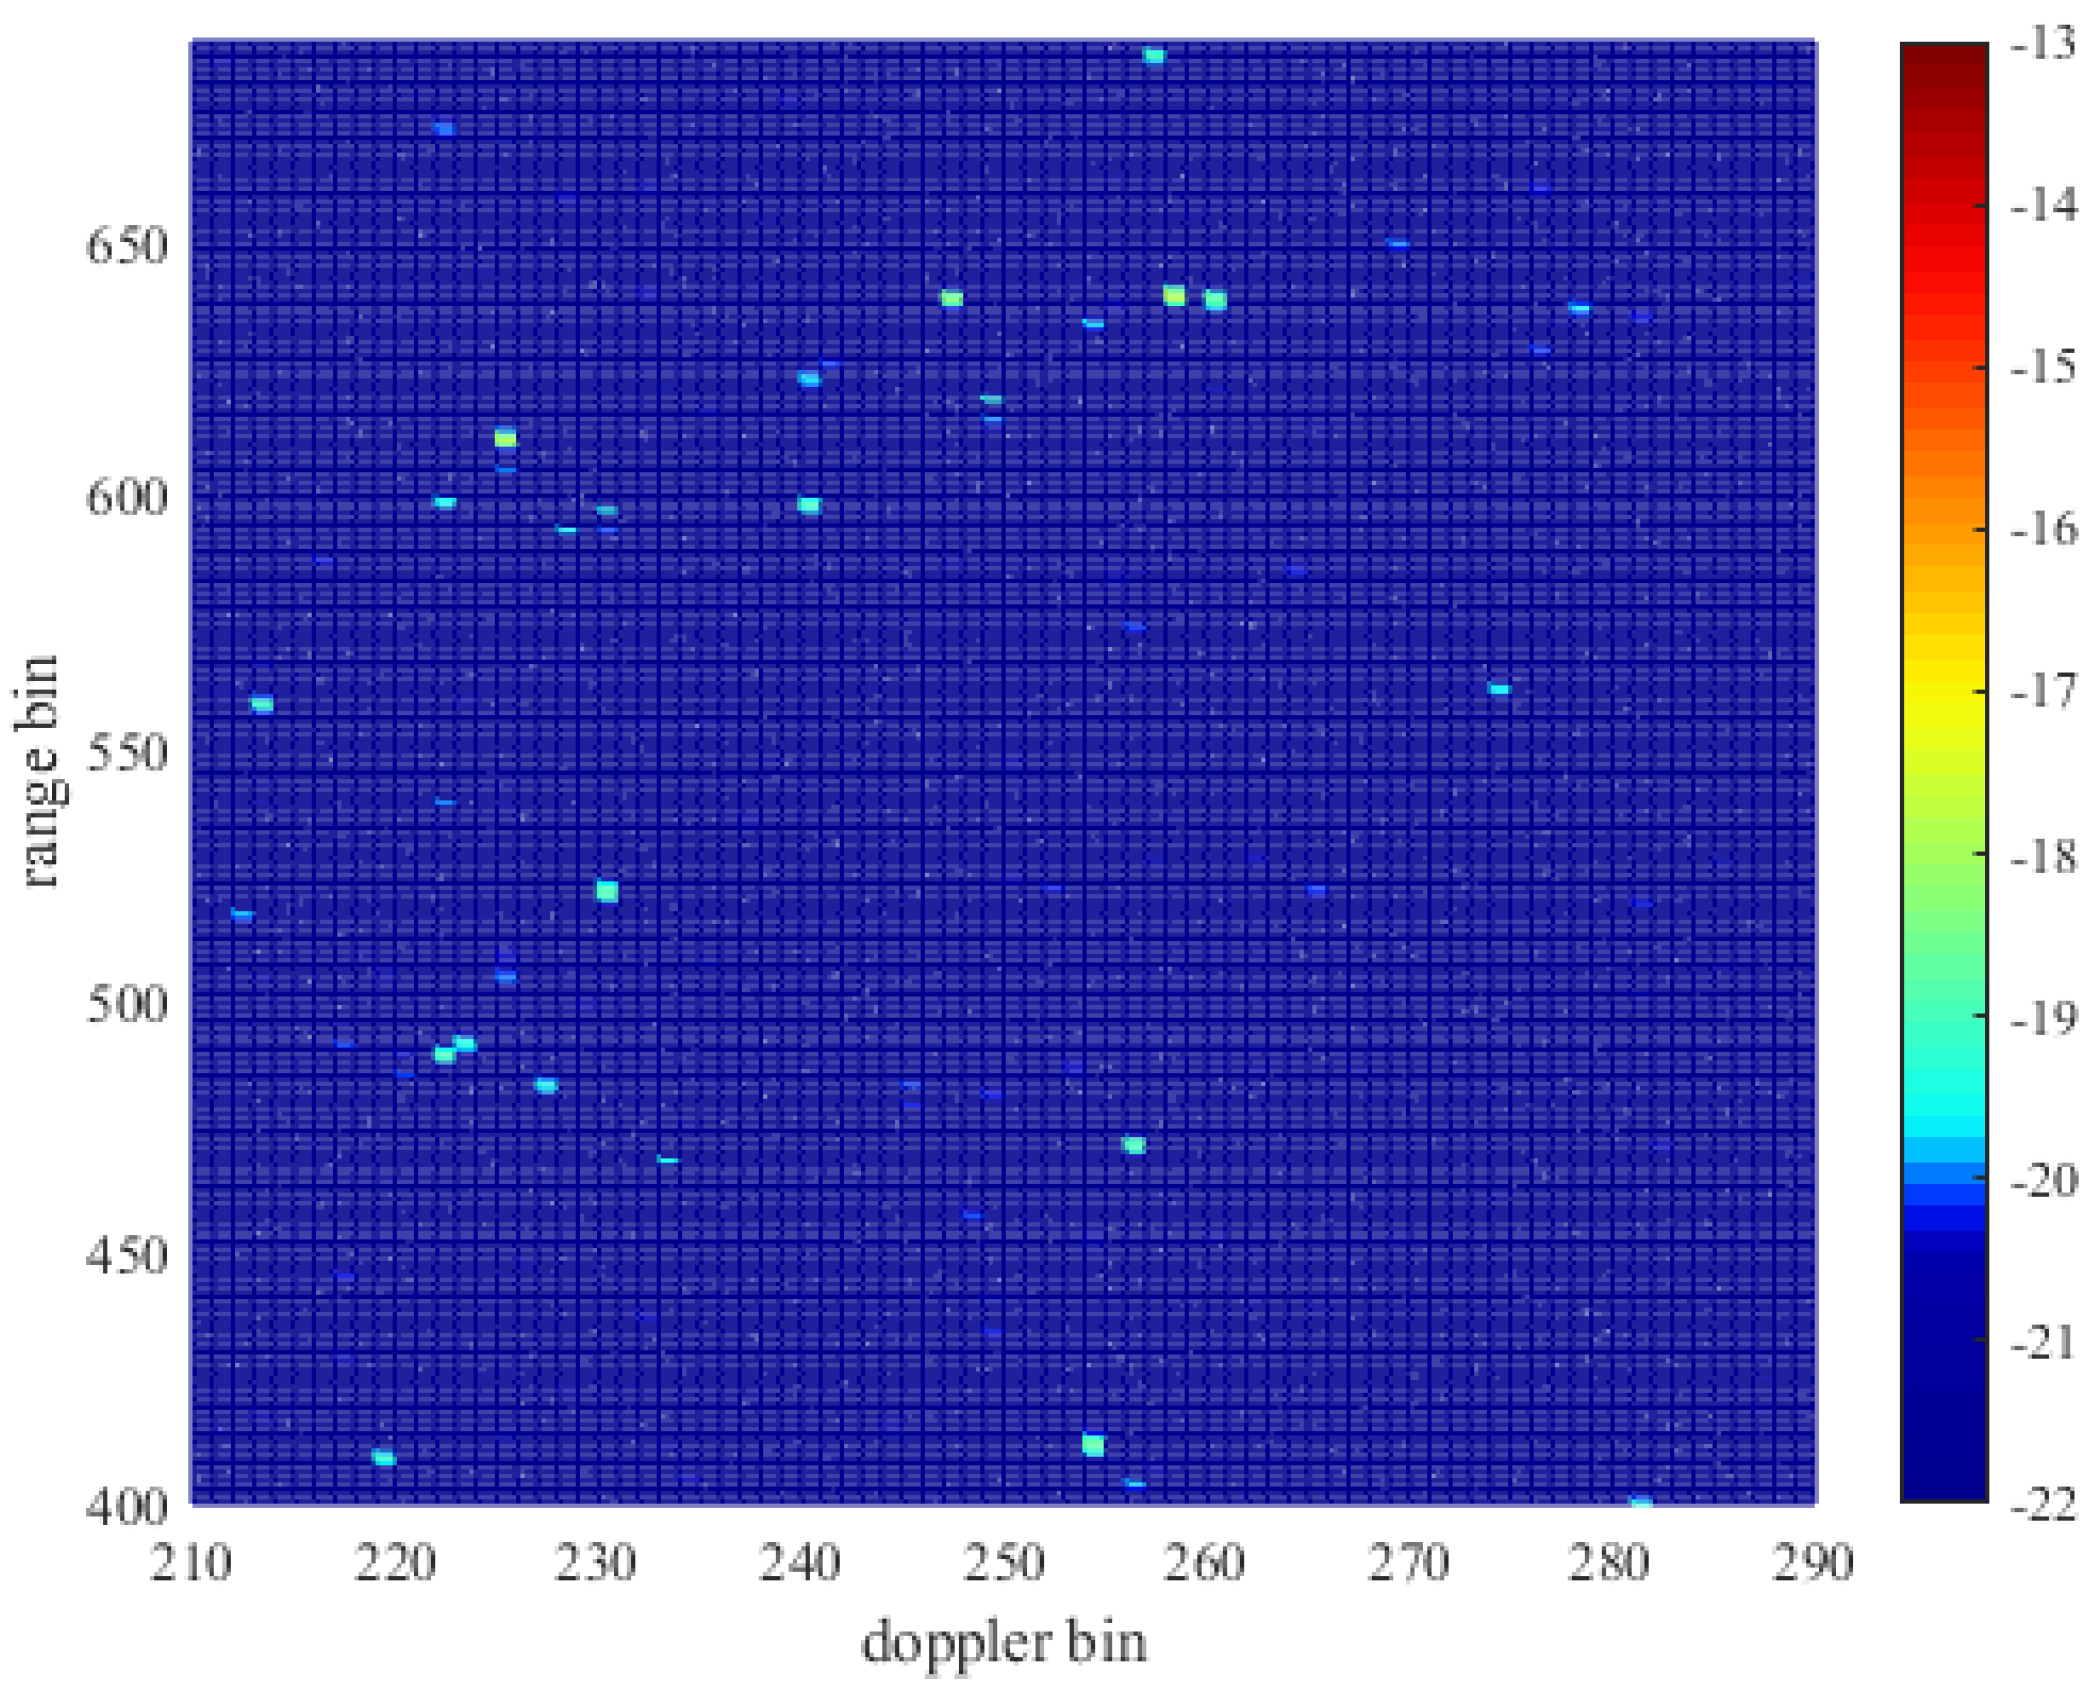
For better target detection performance, radar false alarm suppression based on the spatial-temporal stationarity of the target is performed on the suppressed data, and the results were shown in
Figure 15. Before false alarm suppression, 210,952 peak points could be extracted from the whole RD spectrum, and 14634 peak points were retained after false alarm suppression. More than 93% of false peaks in the RD spectrum were removed. Using the same method to process continuous multi-frame data, the average processing effect of multi-frame data can reach to eliminate 91% false alarm points.
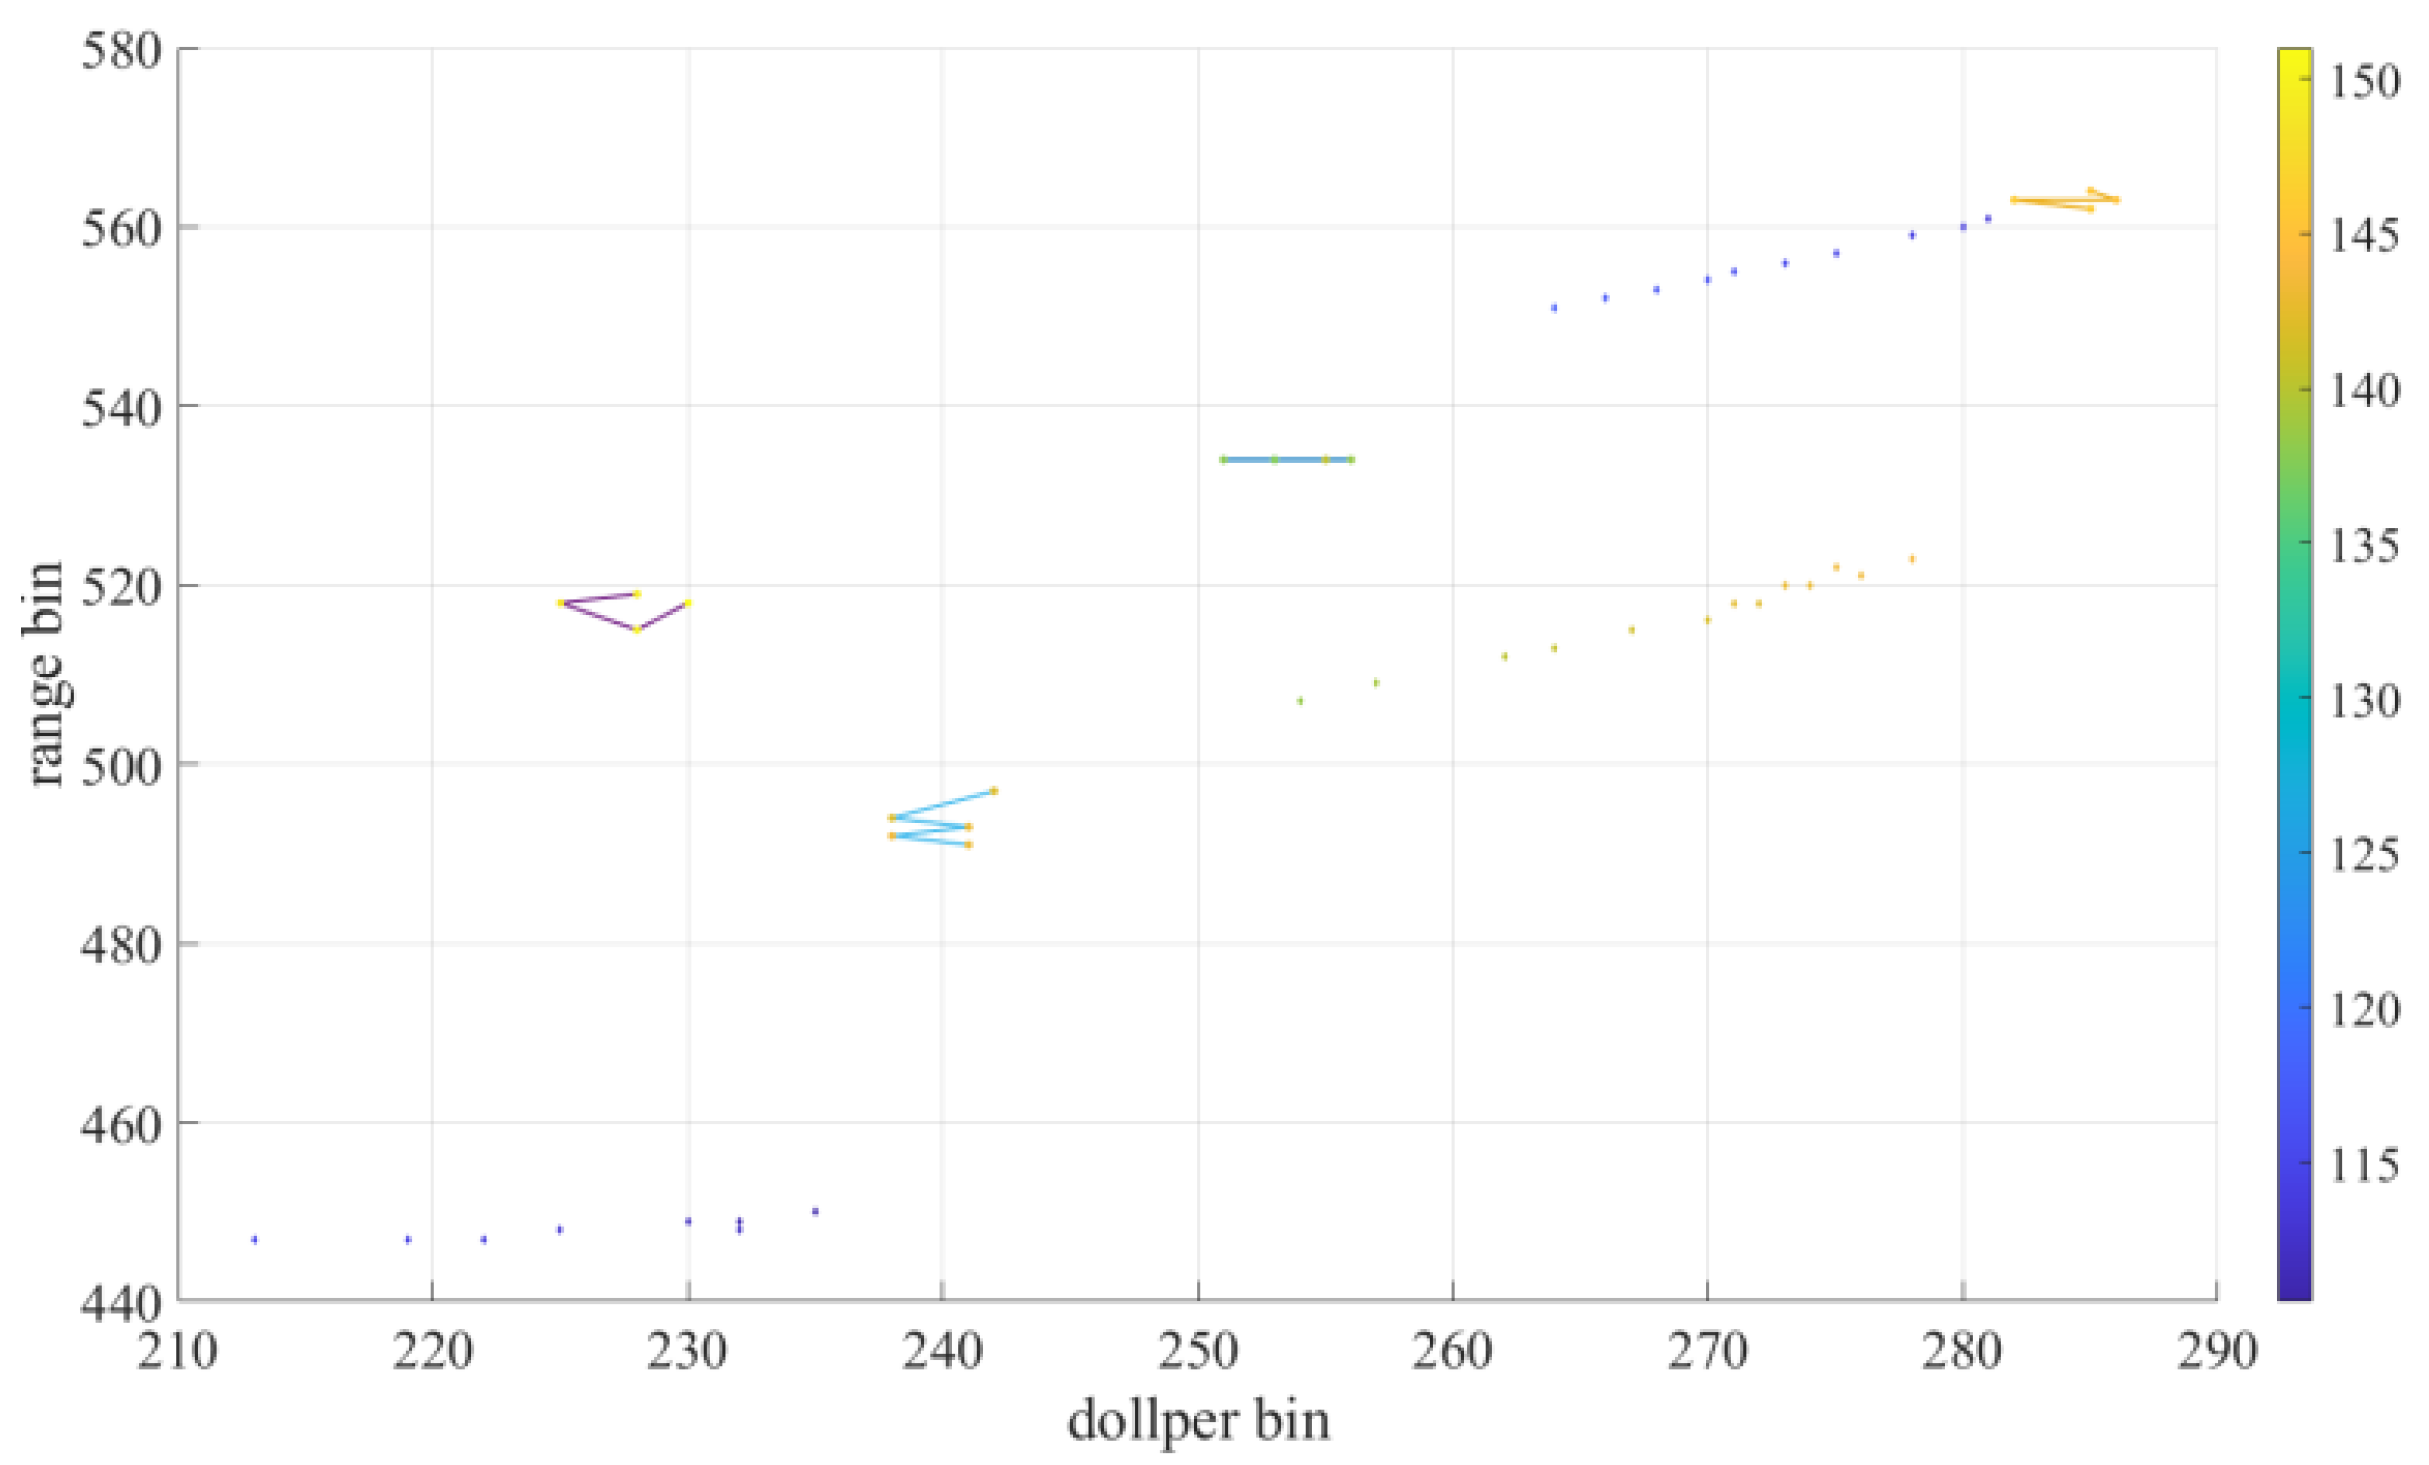
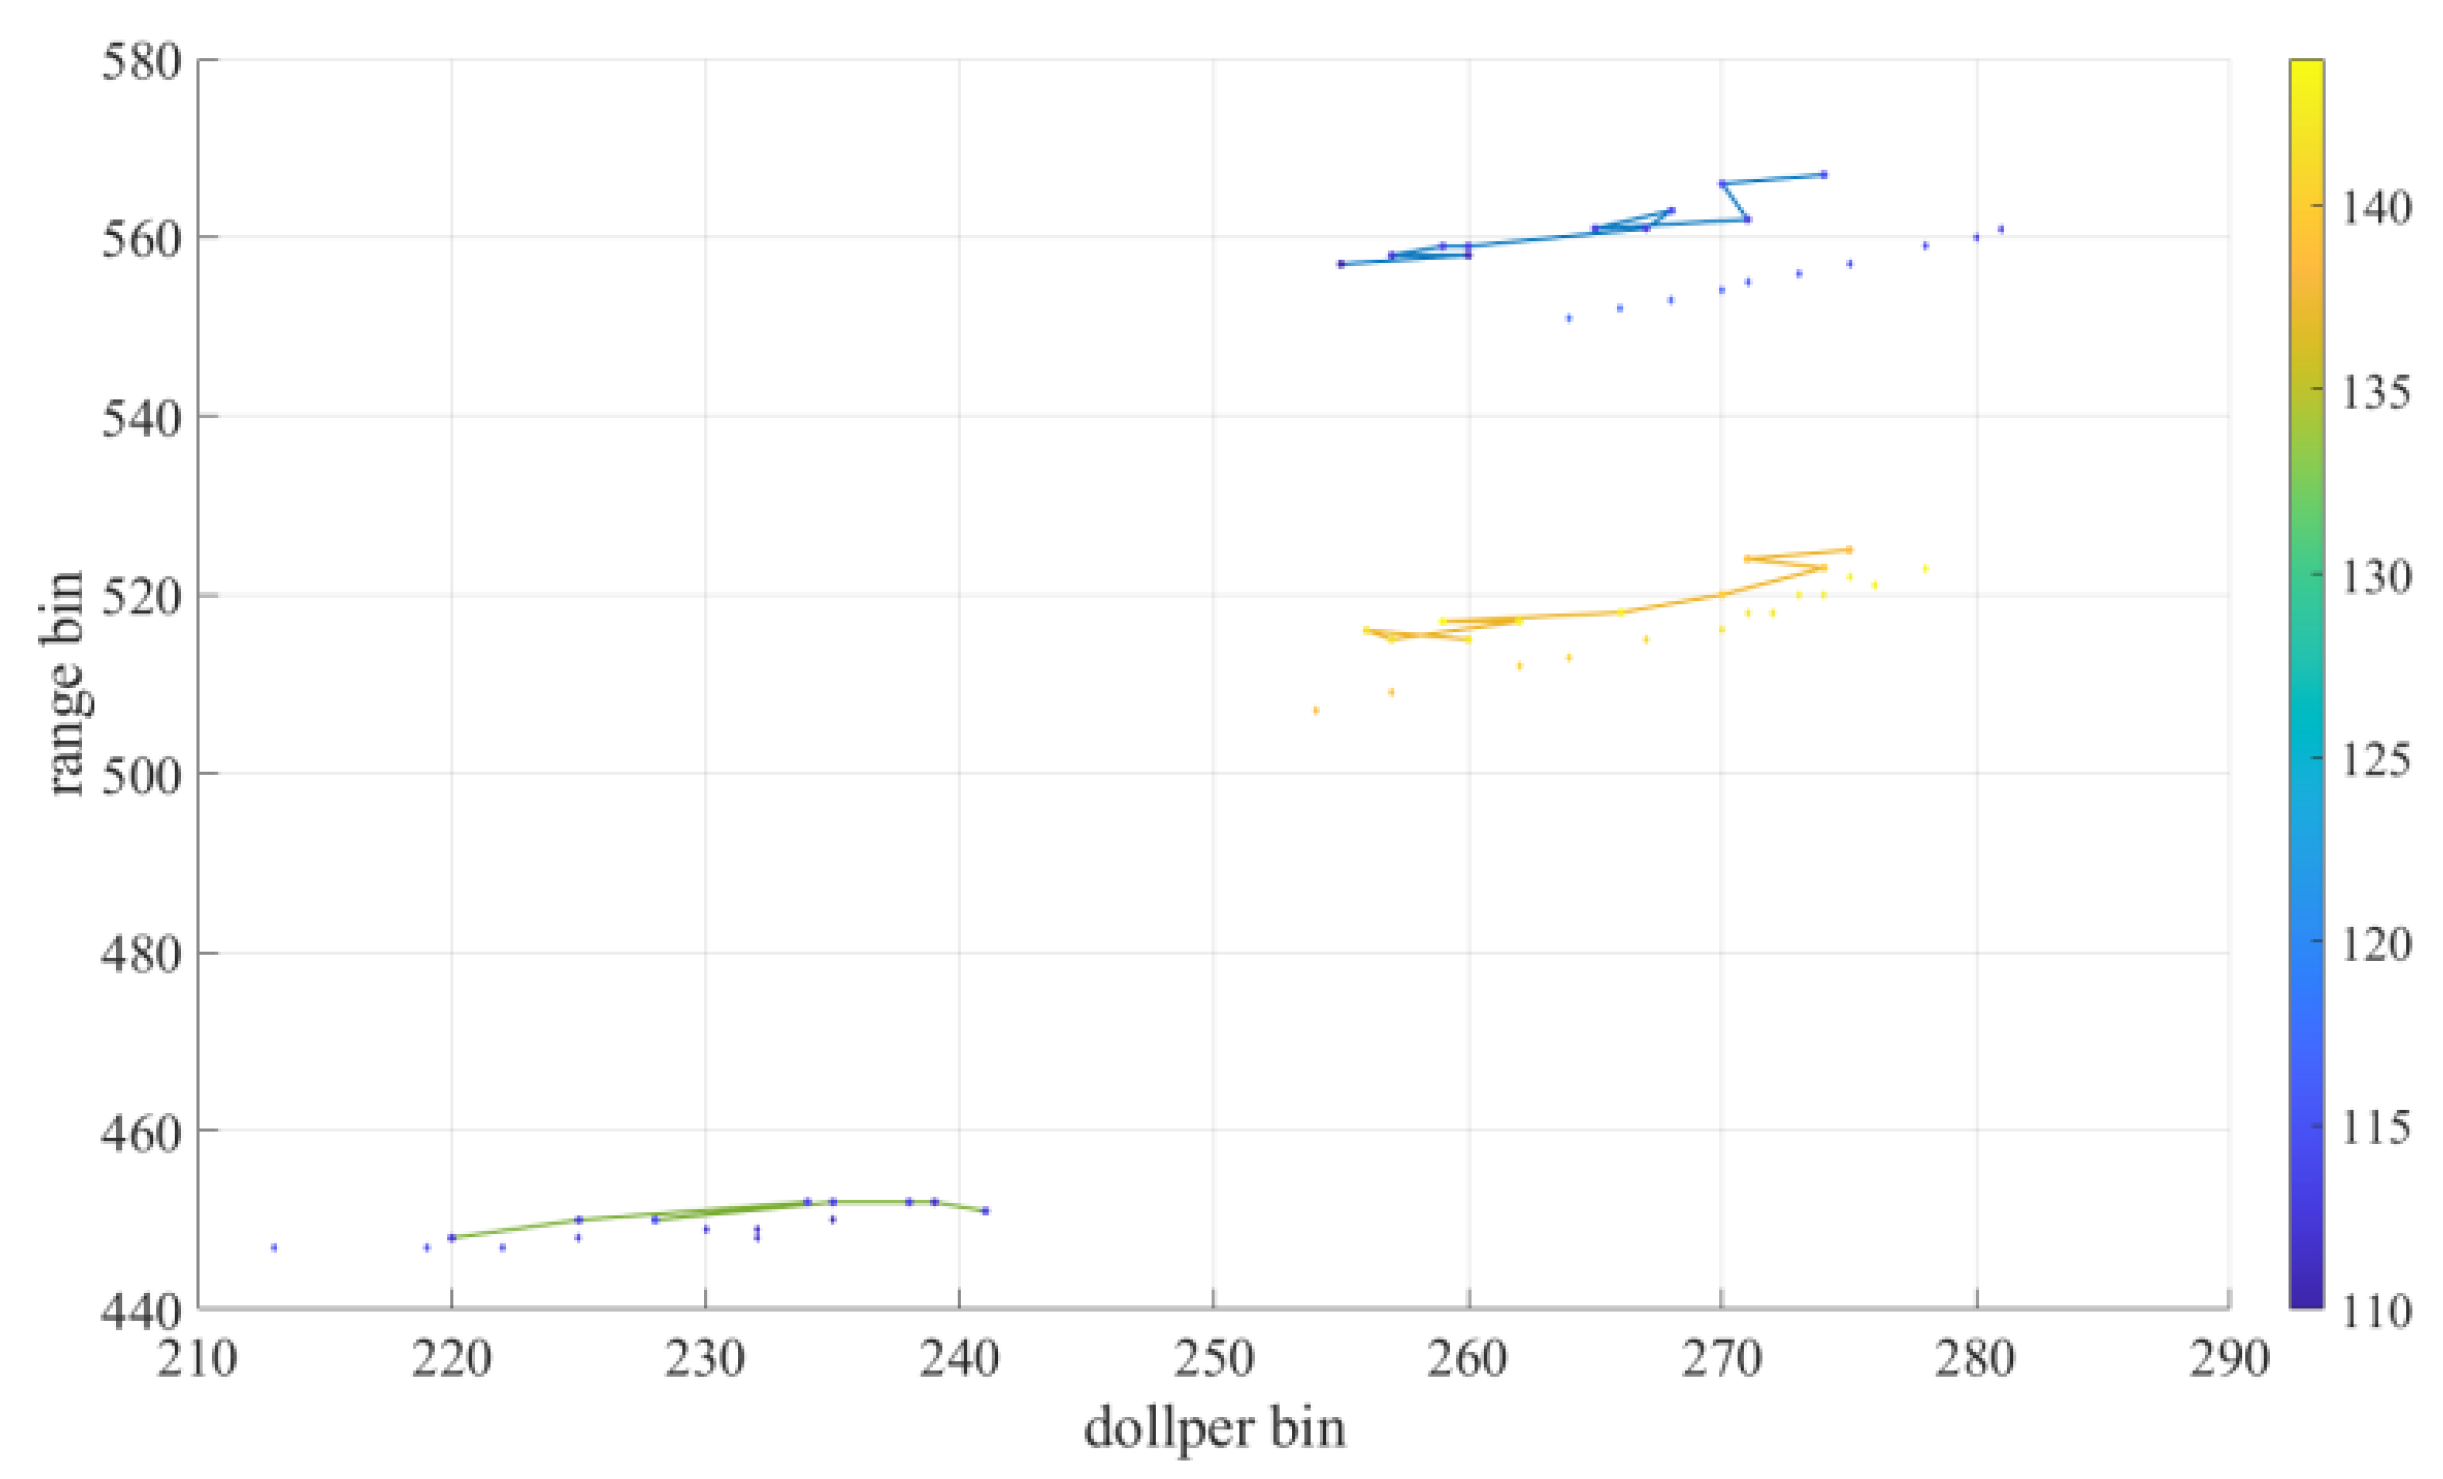
In order to further screen targets, meanwhile compare the influence on target tracking before and after false alarm suppression, the target tracking algorithm based on the spatial-temporal stationarity of the target is used to track the multi-frame peak points detected before and after false alarm suppression, and the tracking results are compared with the actual UAV track.
Figure 16 and
Figure 17 are present the tracking results before and after reducing false alarms, respectively. In the figure, the dot connection line is the tracked trace, the scatter point is the actual UAV track, and the color of the point represents the azimuth. Owing to the substantial interference in field experiment, if false alarm suppression is not implemented after the data is suppressed in the time-domain clutter, false alarm will be mixed into the track during the tracking process. Since the false alarms are not stable, which will lead to the interruption of the track, thus making it difficult to track the trace similar to the actual UAV track. However, using the algorithm proposed in this paper to suppress the false alarm, the tracking results are very close to the actual UAV track, which fully validates the effectiveness of the radar false alarm suppression algorithm based on the space-time stationarity of the target.
This paper analyzes the reasons why there are still a lot of false alarms in the RD spectrum after conventional clutter suppression of radar data in the radar communication integration system using OFDM signals. Considering the difference of stationarity between target signal and clutter in a short time interval, a radar false alarm suppression algorithm based on the difference of stationarity between target signal and clutter in range, Doppler, energy and azimuth is proposed. Firstly, to ensure the short-time stationarity of the target, the RD spectrum of sub-frames with short time interval is obtained by using the sliding matching filtering method and extract the peak points. Then, the Mahalanobis distance between the peak points of each sub-frame is used to eliminate false alarm points. Finally, false alarm points are further eliminated through the target tracking and retain the real target information, so as to improve the radar target detection performance. The simulation results show that this method can reduce more than false alarm points 90% without exerting influence on the detection of the target. In order to verify the effect of the algorithm in practical application, we also use the radar communication integration system to carry out field experiments, and the experimental data show that the algorithm can effectively eliminate false alarm points and improve the performance of target detection. Compared with the target tracking results before and after false alarm suppression, the tracking results after false alarm suppression are consistent with the actual UAV track. In the future work, we will further analyze the characteristics difference between clutter and target, achieve better false alarm removal effect to further improve the target detection ability.
