Preprint
Article

A Comparative Study of Metaheuristic Feature Selection Algorithms for Respiratory Disease Classification

Altmetrics

Downloads

72

Views

41

Comments

0

A peer-reviewed article of this preprint also exists.

Submitted:

26 August 2024

Posted:

27 August 2024

You are already at the latest version

Alerts
Abstract
Correct diagnosis and early treatment of respiratory diseases can significantly improve the health status of patients, reduce healthcare expences, and enhance quality of life. Therefore, there has been extensive interest in developing automatic respiratory disease detection systems. Most of these methods have recently been using machine and deep learning algorithms. The success of machine learning methods depends heavily on the selection of proper features to be used in the classifier. Although metaheuristic-based feature selection methods have been successful in addressing difficulties presented by high-dimensional medical data in various biomedical classification tasks, there is not much research on the utilization of metaheuristic methods in respiratory disease classification. This paper aims to conduct a detailed and comparative analysis of six widely used metaheuristic optimization methods using eight different transfer functions in respiratory disease classification. For this purpose, two different classification cases were examined: binary and multi-class. The findings demonstrate that metaheuristic algorithms using correct transfer functions could effectively reduce data dimensionality while enhancing classification accuracy.
Keywords: 
Subject: Computer Science and Mathematics  -   Artificial Intelligence and Machine Learning

1. Introduction

Many respiratory diseases affect the respiratory system, such as chronic obstructive pulmonary disease (COPD), asthma, pneumonia, bronchiectasis, bronchiolitis, and upper/lower respiratory tract infections. These diseases are at the top of the list when considering global deaths, emphasizing the importance of accurate and early diagnosis of them. Correct diagnosis and early treatment of respiratory diseases can significantly improve the health status of patients, reduce healthcare costs, and improve quality of life. Among the various diagnostic tools available, analysis of respiratory sounds by auscultation is a basic method for identifying respiratory abnormalities. Respiratory sounds such as roughness, coarse crackling, monophonic wheeze, polyphonic wheeze, stridor, bronchus, and squawk provide valuable clues about the respiratory system. Upper Respiratory Tract Infection (URTI), Chronic Obstructive Pulmonary Disease (COPD), Bronchiectasis, Pneumonia, Bronchiolitis, Asthma, and Lower Respiratory Tract Infection are among the most common respiratory diseases that can be detected by auscultation methods. Traditional auscultation relies heavily on the experience and interpretation capability of the physician, which can lead to variabilities in diagnosis. Digital stethoscopes and advanced signal processing algorithms provide a more objective analysis of respiratory sounds. They also paved the way for the use of automatic decision-making algorithms.
Recent advancements in machine and deep learning algorithms encouraged researchers working on respiratory sound analysis to develop automated classification systems. Studies in this field fall under two main groups. The first group includes the classification of respiratory diseases such as asthma, COPD, etc. The second group focuses on classifying respiratory sounds as crackle, wheeze, etc. Under these main topics, many valuable studies exist in the literature. Shuvo et al. used a lightweight convolutional neural network (CNN) model, which demonstrates significant efficacy in classifying respiratory auscultation sounds [1]. The model employs a hybrid approach utilizing empirical mode decomposition and continuous wavelet transform, achieving an accuracy of 98.92% in 3-class chronic disease classification and 98.70% in six-class pathological classification. Naqvi and Choudhry presented an automated low-cost diagnostic method for Chronic Obstructive Pulmonary Disease (COPD) and pneumonia, utilizing respiratory sound (LS) analysis from the ICBHI open-access LS database [2]. The method achieved a classification accuracy of 99.7%. García-Ordás proposed a novel approach utilizing a Variational Convolutional Autoencoder (VAE) combined with a Convolutional Neural Network (CNN) to classify respiratory sounds into healthy, chronic disease, and non-chronic disease categories as well as six specific pathologies. They achieved performance improvements over state-of-the-art methods with a reported F-Score of 0.993 in the ternary classification [3]. Fraiwan et al. investigated the classification of respiratory diseases using respiratory sound signals achieving an accuracy of 98.27% with boosted decision trees, which outperformed traditional classifiers such as support vector machines [4]. Pham et al. presented a robust deep-learning framework for the analysis of respiratory anomalies and the detection of respiratory diseases using auscultation recordings. They got an 84% ICHBI score that averages specificity and sensitivity metrics which surpasses the previous state-of-the-art result of 72% [5]. In another study by Pham et al., an inception-based deep learning model was developed to detect respiratory anomalies and respiratory diseases from audio recordings utilizing the ICBHI benchmark dataset. The model achieved competitive scores of 0.53/0.45 ICHBI score for respiratory anomaly detection and 0.87/0.85 for disease prediction, outperforming several state-of-the-art systems [6]. Kababulut et al. introduced a clinical decision support system for respiratory disease identification using decision tree algorithms and Shapley-based feature selection to improve performance. Their findings highlight that effective feature selection significantly enhances classification performance in respiratory disease detection [7]. Sfayyih et al. analyzed deep learning applications in respiratory sound analysis, focusing on the effectiveness of CNNs in classifying respiratory sounds. The authors conclude that deep learning techniques show high accuracy in diagnosing respiratory conditions, underscoring AI's potential in medical diagnostics [8].
It is widely known that feature extraction has a substantial impact on the efficiency of clinical decision systems. The literature presents numerous diverse feature extraction methods. Classical methods such as Fourier Transform [9], Empirical Mode Decomposition [1], Wavelet Transform [1,6], and Mel-Frequency Cepstral Coefficients (MFCC) [10,11,12,13,14,15] are among the most commonly used methods for feature extraction in respiratory sound classification field. The proper selection of the most descriptive feature subsets from all extracted features has also been very important for the success of the classification system. Through feature selection, the computational burden on the classifier is reduced by employing a smaller feature size, and also classification performance is increased. Therefore, finding effective feature selection (FS) methods has been an extensively studied topic. Abdel-Basset et al. discussed the critical role of feature selection in enhancing the performance of machine learning algorithms, particularly in the context of high-dimensional datasets. They categorized feature selection methods into wrapper, filter, and embedded approaches, highlighting that wrapper methods, while computationally intensive, often yield superior subsets of features tailored to specific classifiers [16]. Kang et al. provide a comprehensive overview of FS techniques, highlighting their significance in managing the challenges posed by high-dimensional datasets [17]. Iqbal et al. presented a comprehensive approach to feature extraction and selection from physiological signals [18].
In recent years, the application of nature-inspired metaheuristic algorithms for feature selection has gained significant attention within the machine learning community. Metaheuristic methods range from well-established techniques like genetic algorithm (GA) and particle swarm optimization (PSO) to newer and more creative approaches such as grey wolf optimization (GWO), teaching learning-based optimization (TLO), whale optimization algorithm (WOA), and Equilibrium optimizer (EO). FS with metaheuristic methods was found to be superior to classical techniques in many studies. The comprehensive review conducted by Nssibi et al. evaluated various metaheuristic techniques, highlighting their effectiveness in navigating the complex search space associated with feature selection tasks [19]. Sathiyabhama et al. introduced a novel computer-aided diagnosis (CAD) system that employs a GWO and Rough Set-based approach to identify abnormalities in mammogram images effectively [20]. Kang et al. introduced the Two-Stage Teaching-Learning-Based Optimization (TS-TLBO) algorithm, which demonstrates significant improvements in classification accuracy [17]. Nadimi-Shahraki et al. presented an enhanced version of the Whale Optimization Algorithm (E-WOA) specifically tailored for medical feature selection with a focus on the COVID-19 case study. The experimental results demonstrated that E-WOA significantly outperforms traditional WOA variants and other well-known optimization algorithms [21]. Chen et al. introduced a novel approach that combines Particle Swarm Optimization (PSO) with the 1-Nearest Neighbor (1-NN) classifier, demonstrating its effectiveness on various life science datasets [22]. Elgamal et al. introduced an enhanced version of the Harris Hawks Optimization (HHO) algorithm, termed Chaotic Harris Hawks Optimization (CHHO), which integrates chaotic maps and Simulated Annealing (SA) to address the limitations of the standard HHO [23]. Rajammal et al. presented a Binary Improved Grey Wolf Optimizer (BIGWO) that integrates a mutation operation and an Adaptive k-nearest Neighbour (AkNN) algorithm to enhance feature selection efficacy [24]. Prabhakar and Won propose several innovative techniques including metaheuristics feature selection methods for classification in telemedicine applications. The study highlights the effectiveness of these methods in analyzing respiratory sounds and showcases the potential for enhanced diagnostic capabilities in healthcare settings [25]. Abedi et al. developed an innovative algorithm that utilizes GA and support vector machine (SVM) classification to analyze thoracic respiratory effort and oximetric signal features [26]. Álvarez et al. conducted a comprehensive study for detecting OSA patients. The authors employed GA for feature selection achieving very high diagnostic accuracy [27]. All of these studies show that metaheuristic feature selection methods have been successful in addressing the difficulties presented especially by high-dimensional data. Classifier models using features selected by metaheuristic methods enhance prediction accuracy, decrease computing costs, and clarify the process by eliminating unimportant features.
Though successfully used for feature selection in many studies, there is not much research on the utilization of metaheuristic feature selection methods in respiratory disease classification. This study aims to conduct a detailed and comparative analysis of metaheuristic optimization methods in respiratory disease classification. For this purpose, various features were extracted from audio recordings obtained from the publicly available ICBHI 2017 Respiratory Sound Database [28] using 15 frequently used feature extraction techniques. Then, by employing diverse statistical metrics on the collected numerical data, a new feature set was acquired. Next, to determine the best features that enhance classification performance, six well-known metaheuristics methods were employed with eight transfer functions. Finally, the performances of each method were measured and compared with each other using a simple and identical k-NN classifier. In this study, two different classification problems were examined. The first one is a binary classification task (respiratory disease vs healthy) while the second one is a multi-class task (healthy, chronic respiratory disease, nonchronic respiratory disease). Since the database used is highly imbalanced, F1 and MCC metrics were used as the main performance metrics instead of accuracy. The findings demonstrate that metaheuristic algorithms using correct transfer functions could effectively reduce data dimensionality while enhancing classification accuracy.
This paper is organized as follows. Section 2 provides information about the materials and methods used, including the feature extraction methods from audio recordings, implementation of metaheuristic feature selection methods and transfer functions, classification stage, and evaluation of the results. Section 3 conducts a detailed comparative analysis based on the results obtained. Finally, Section 4 presents the discussion and conclusions of the study.

2. Materials and Methods

2.1. Data Source

The present study utilizes the openly accessible ICBHI 2017 Respiratory Sound Database[28]. ICBHI 2017 comprises 5.5 hours of recordings obtained from seven different chest locations, namely trachea, left and right anterior, posterior, and lateral. Recordings encompass a total of 6898 breathing cycles, which were labeled by respiratory specialists as containing crackles, wheezes, a combination of both, or no abnormal respiratory sounds. The database was compiled from 126 individual participants over several years by two separate study teams located in two countries. A total of 920 audio samples were recorded using heterogeneous types of equipment, namely Meditron, LittC2SE, Litt3200 stethoscopes, and AKGC417L microphone. The respiratory cycles were also categorized into eight distinct conditions by experts: Upper Respiratory Tract Infection (URTI), Chronic Obstructive Pulmonary Disease (COPD), Bronchiectasis, Pneumonia, Bronchiolitis, Asthma, Lower Respiratory Tract Infection (LRTI), and Healthy.

2.2. Feature Extraction

The feature extraction phase was executed utilizing Python's Librosa library version 0.10. The default value of the library was utilized as the number of features to be extracted for each method. In this study, 15 distinct methods are employed for the feature extraction procedure. The specific characteristics of these methods are displayed in Table 1. Since the number of features obtained from each method is very large (several thousands), a new and reduced feature set was generated by computing 5 statistical measures (minimum, maximum, mean, standard deviation, and skewness) of feature values for each feature extraction method. Then, these features were concatenated to form the feature vector for each sample. This way, each sample is represented by 15x5=75 feature values.

2.3. Classification Cases Examined

Once the feature extraction step is completed, feature selection and classification stages follow. This study examines two different cases. Case 1 examines a binary classification task where respiratory sound recordings are categorized into two classes disease and healthy. The disease class consists of recordings that belong to individuals with 7 respiratory diseases specified in Section 2.1; the healthy class comprises data collected from individuals who do not have any respiratory illness. Case 2 pertains to a multi-class categorization with three distinct classes: chronic respiratory disease, non-chronic respiratory disease, and healthy. Chronic disease class was formed by amalgamating instances of individuals with COPD, Asthma, and Bronchiectasis, which are representative of chronic respiratory conditions. The non-chronic class consists of respiratory sound recordings obtained from individuals diagnosed with Pneumonia, URTI, Bronchiolitis, and LRTI. The scenario for the healthy class is analogous to Case 1. Table 2 provides information about the datasets utilized.

2.4. Feature Selection by Metaheuristic Methods

This study examines 6 different metaheuristic methods with various transfer functions to identify the most effective approach for classifying respiratory diseases from respiratory sounds. The methods include genetic algorithm (GA), particle swarm optimization (PSO), grey wolf optimization (GWO), teaching learning-based optimization (TLO), whale optimization algorithm (WOA), and equilibrium optimizer (EO). Each algorithm was executed for 25 trials using identical experimental settings to achieve statistically meaningful outcomes. In each trial, the population was initialized with a size of 100 individuals, and the simulation was run for 50 iterations.
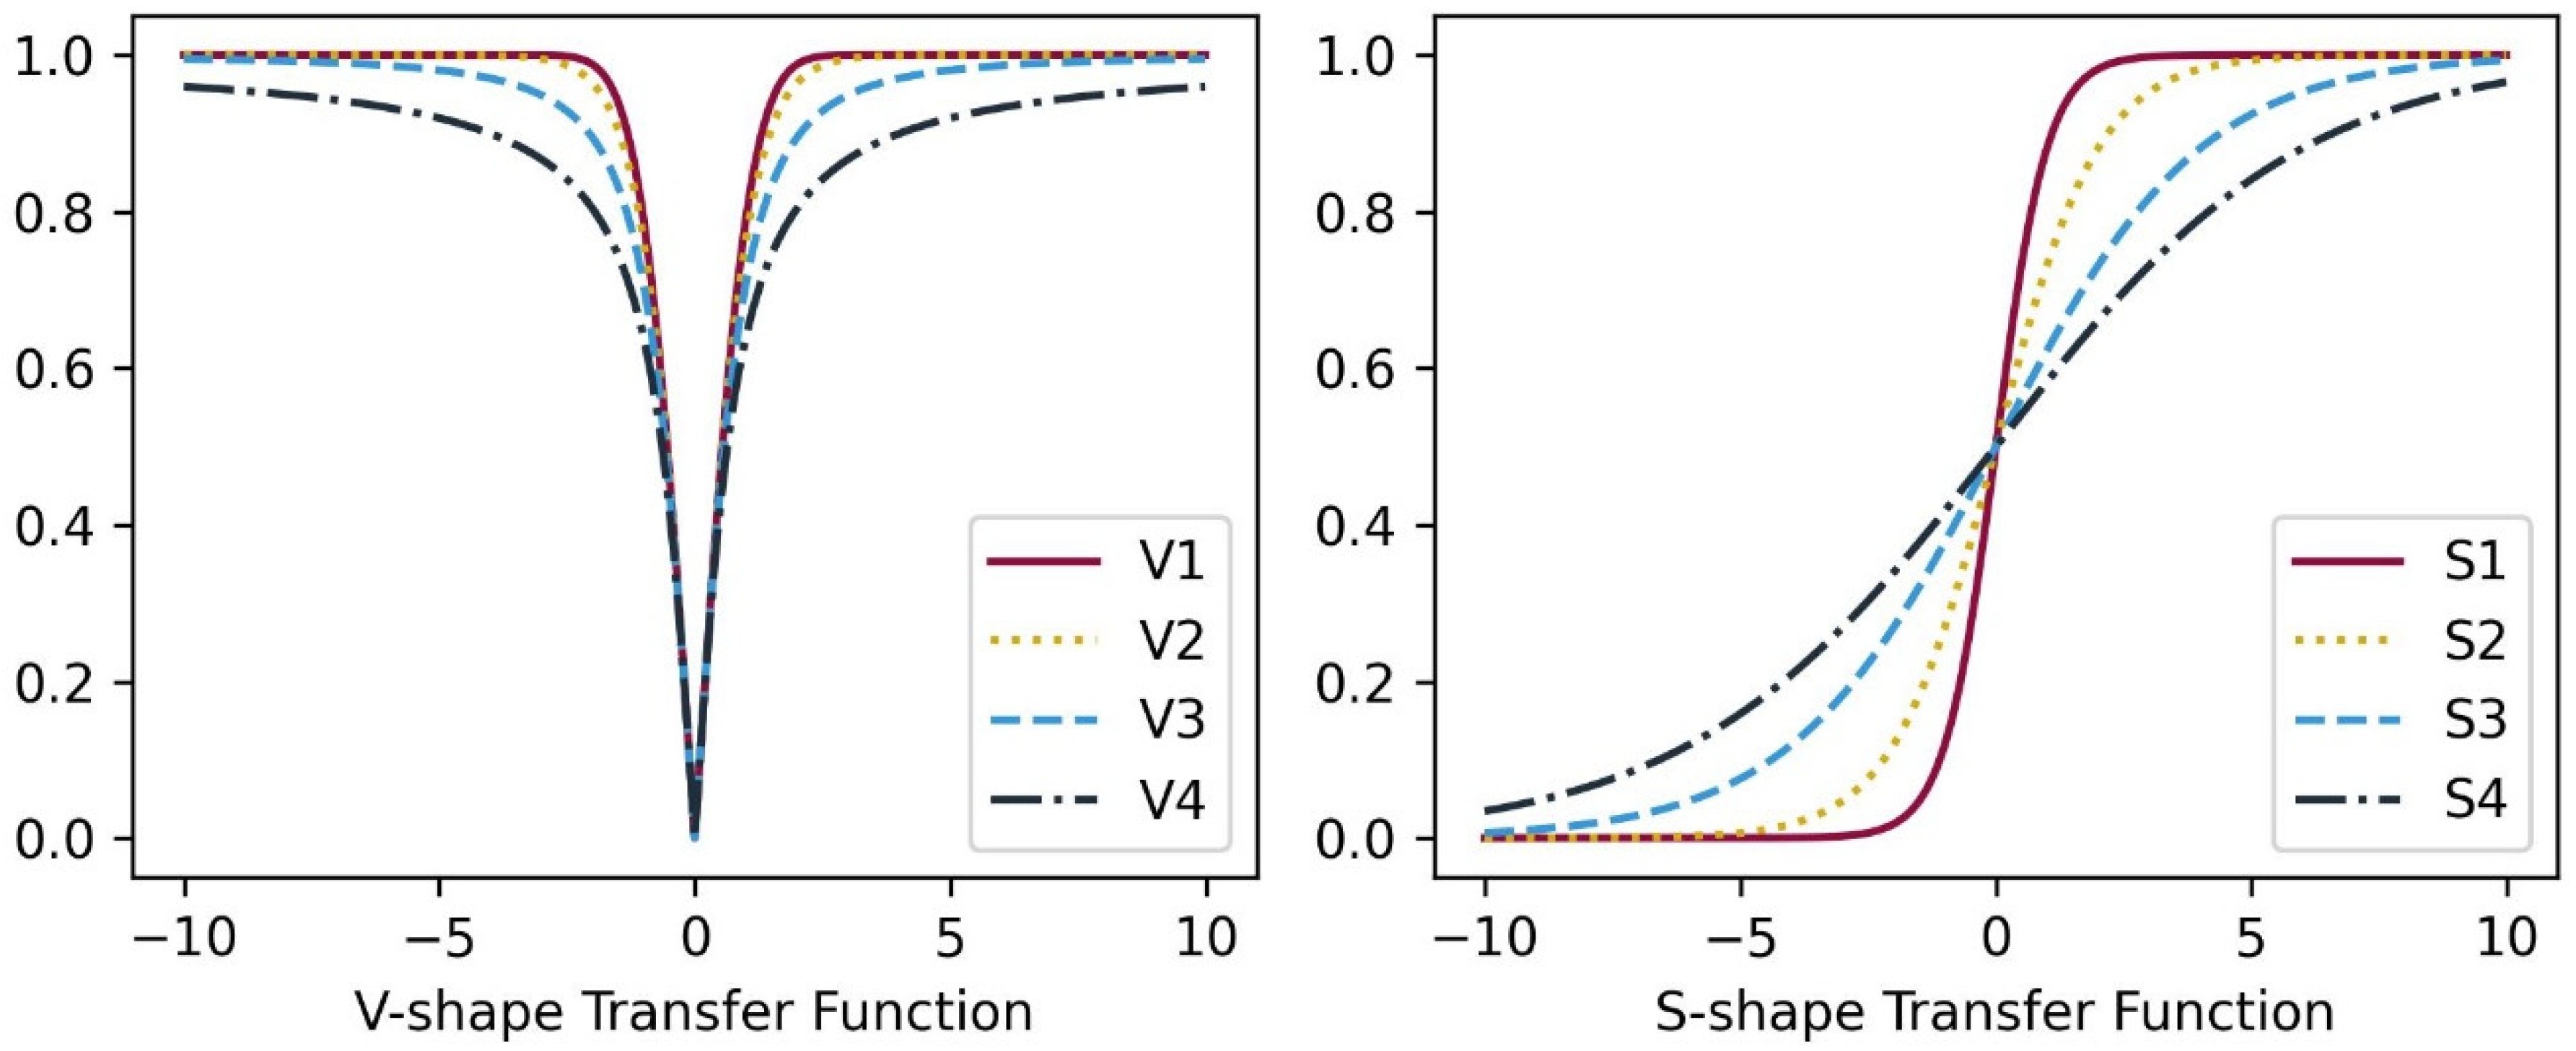
Metaheuristic algorithms inherently generate continuous solutions that lie within the upper and lower boundaries of the search space. One of the primary strategies to discretize these approaches is by utilizing transfer functions. The primary objective of transfer functions is to acquire a 0-1 vector representing the characteristics to be chosen for feature selection while keeping the original procedure unchanged. Thus, this approach yields a solution or possible answers to the binary optimization issue of identifying the most efficient characteristics for diagnosing respiratory disease. Transfer functions exhibit distinct characteristics, and when employed for discretization, varying outcomes are bound to arise [29]. Various transfer functions have been examined in many studies, but it remains necessary to make comparisons to determine which specific transfer functions should be employed to achieve discretization. To this end, this study utilizes a total of eight commonly employed transfer functions, which belong to two distinct families, namely S-shaped and V-shaped functions. Formulas for S-shaped transfer functions S1 to S4 and V-shaped transfer functions V1 to V4 are provided in Table 3. The function curves for them are given in Figure 1.
Our study introduces a wrapper feature selection strategy that utilizes the aforementioned metaheuristic search algorithms and k-NN classifier as the evaluator. When using feature selection methods, it is crucial to consider both a solution’s representation and the optimization process’s evaluation. The dataset used in this study exhibits a serious class imbalance issue. Thus, accurate prediction of minority classes is also crucial for a reliable model. Therefore, we used the Matthews Correlation Coefficient (MCC) as the fitness value for the optimization problem since the MCC metric is more suitable for distinguishing between various misclassification distributions in datasets with imbalanced class issues [30].

2.5. Classifier

When the studies in the field of feature selection using metaheuristic methods are analyzed, it is seen that the k-NN algorithm has been frequently utilized as the classifier [31,32,33,34]. This is due to its simplicity, practicality, ease of application and use, as well as its ability to provide rapid and accurate results when dealing with large datasets. For the same reasons, a simple k-NN (k=5) classifier is utilized in this study. This classifier functions as a decision-maker during both the feature selection and classification phases. To make the comparisons fair, the same classifier is used in all trials.

3. Results

This study conducts experiments for comparing six different metaheuristics feature selection methods using eight different transfer functions from two families (V-shaped and S-shaped) to determine the best feature selection methods to be used for respiratory disease classification problems. This means finding the methods that lead to high classification performance while using a small number of features. Findings are examined, evaluated, and commented on below under three headings: transfer function fitness values, comparison of the classification performances of metaheuristic feature selection methods, and comparison with traditional feature selection methods.

3.1. Fitness Values of Transfer Functions for Each Feature Selection Method

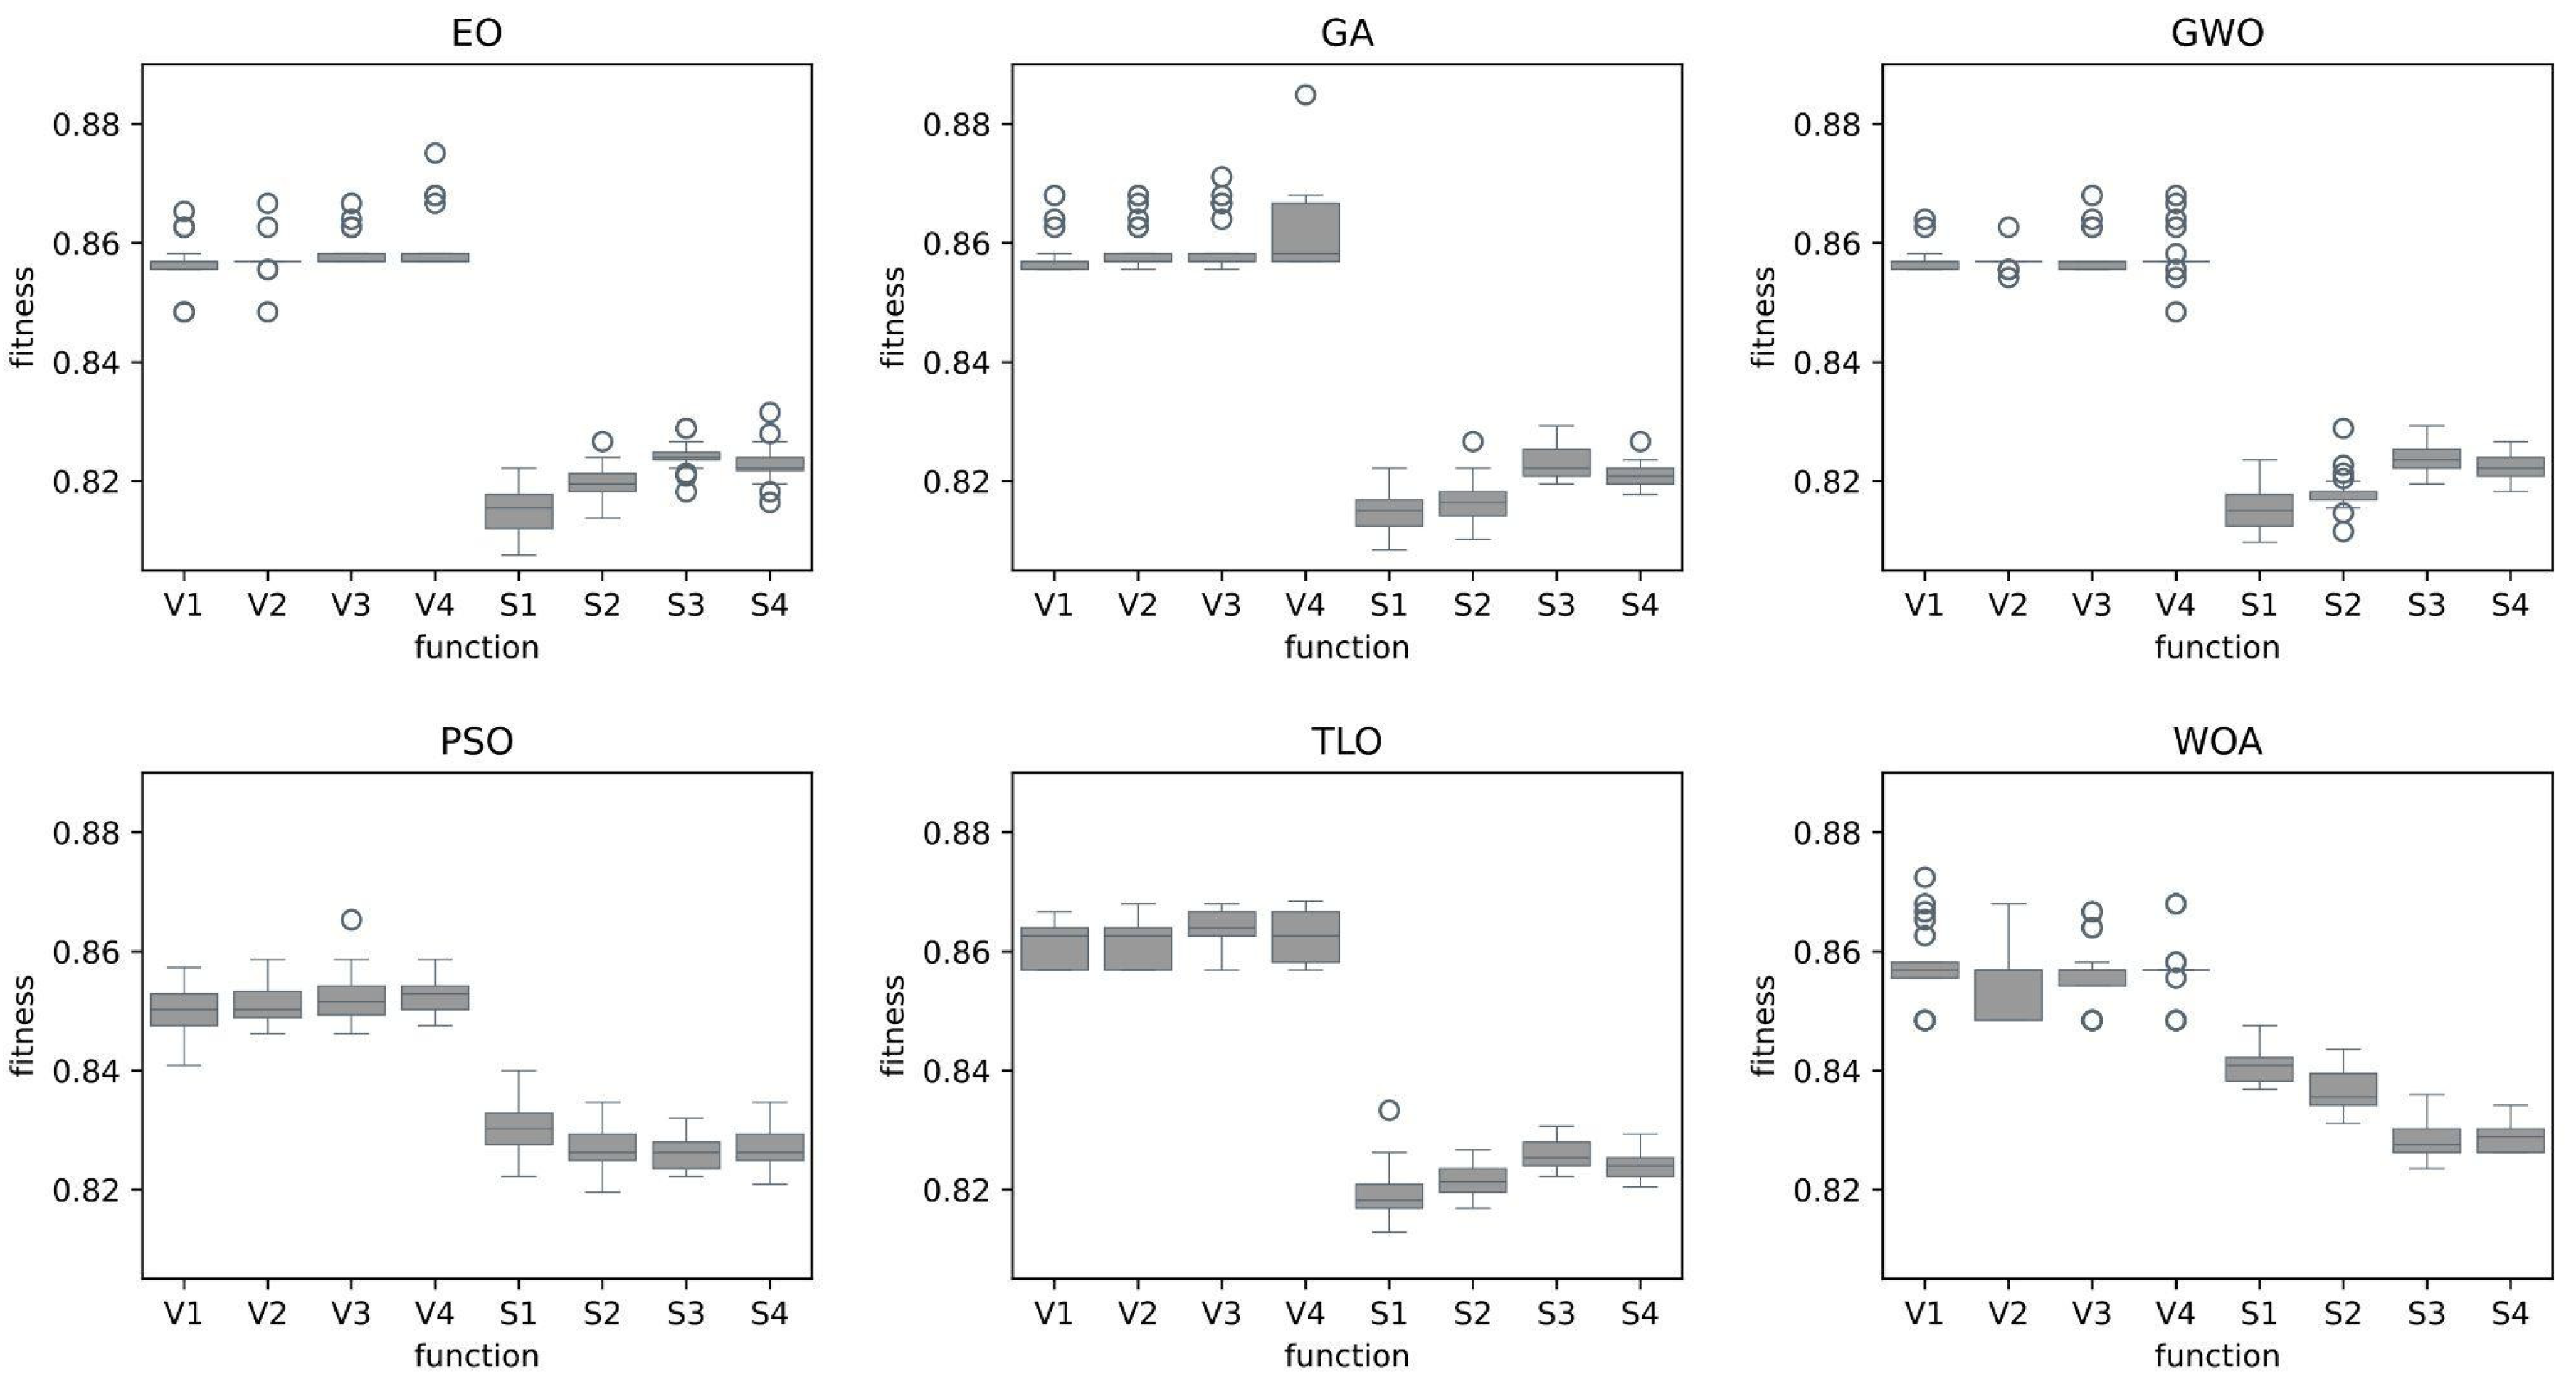
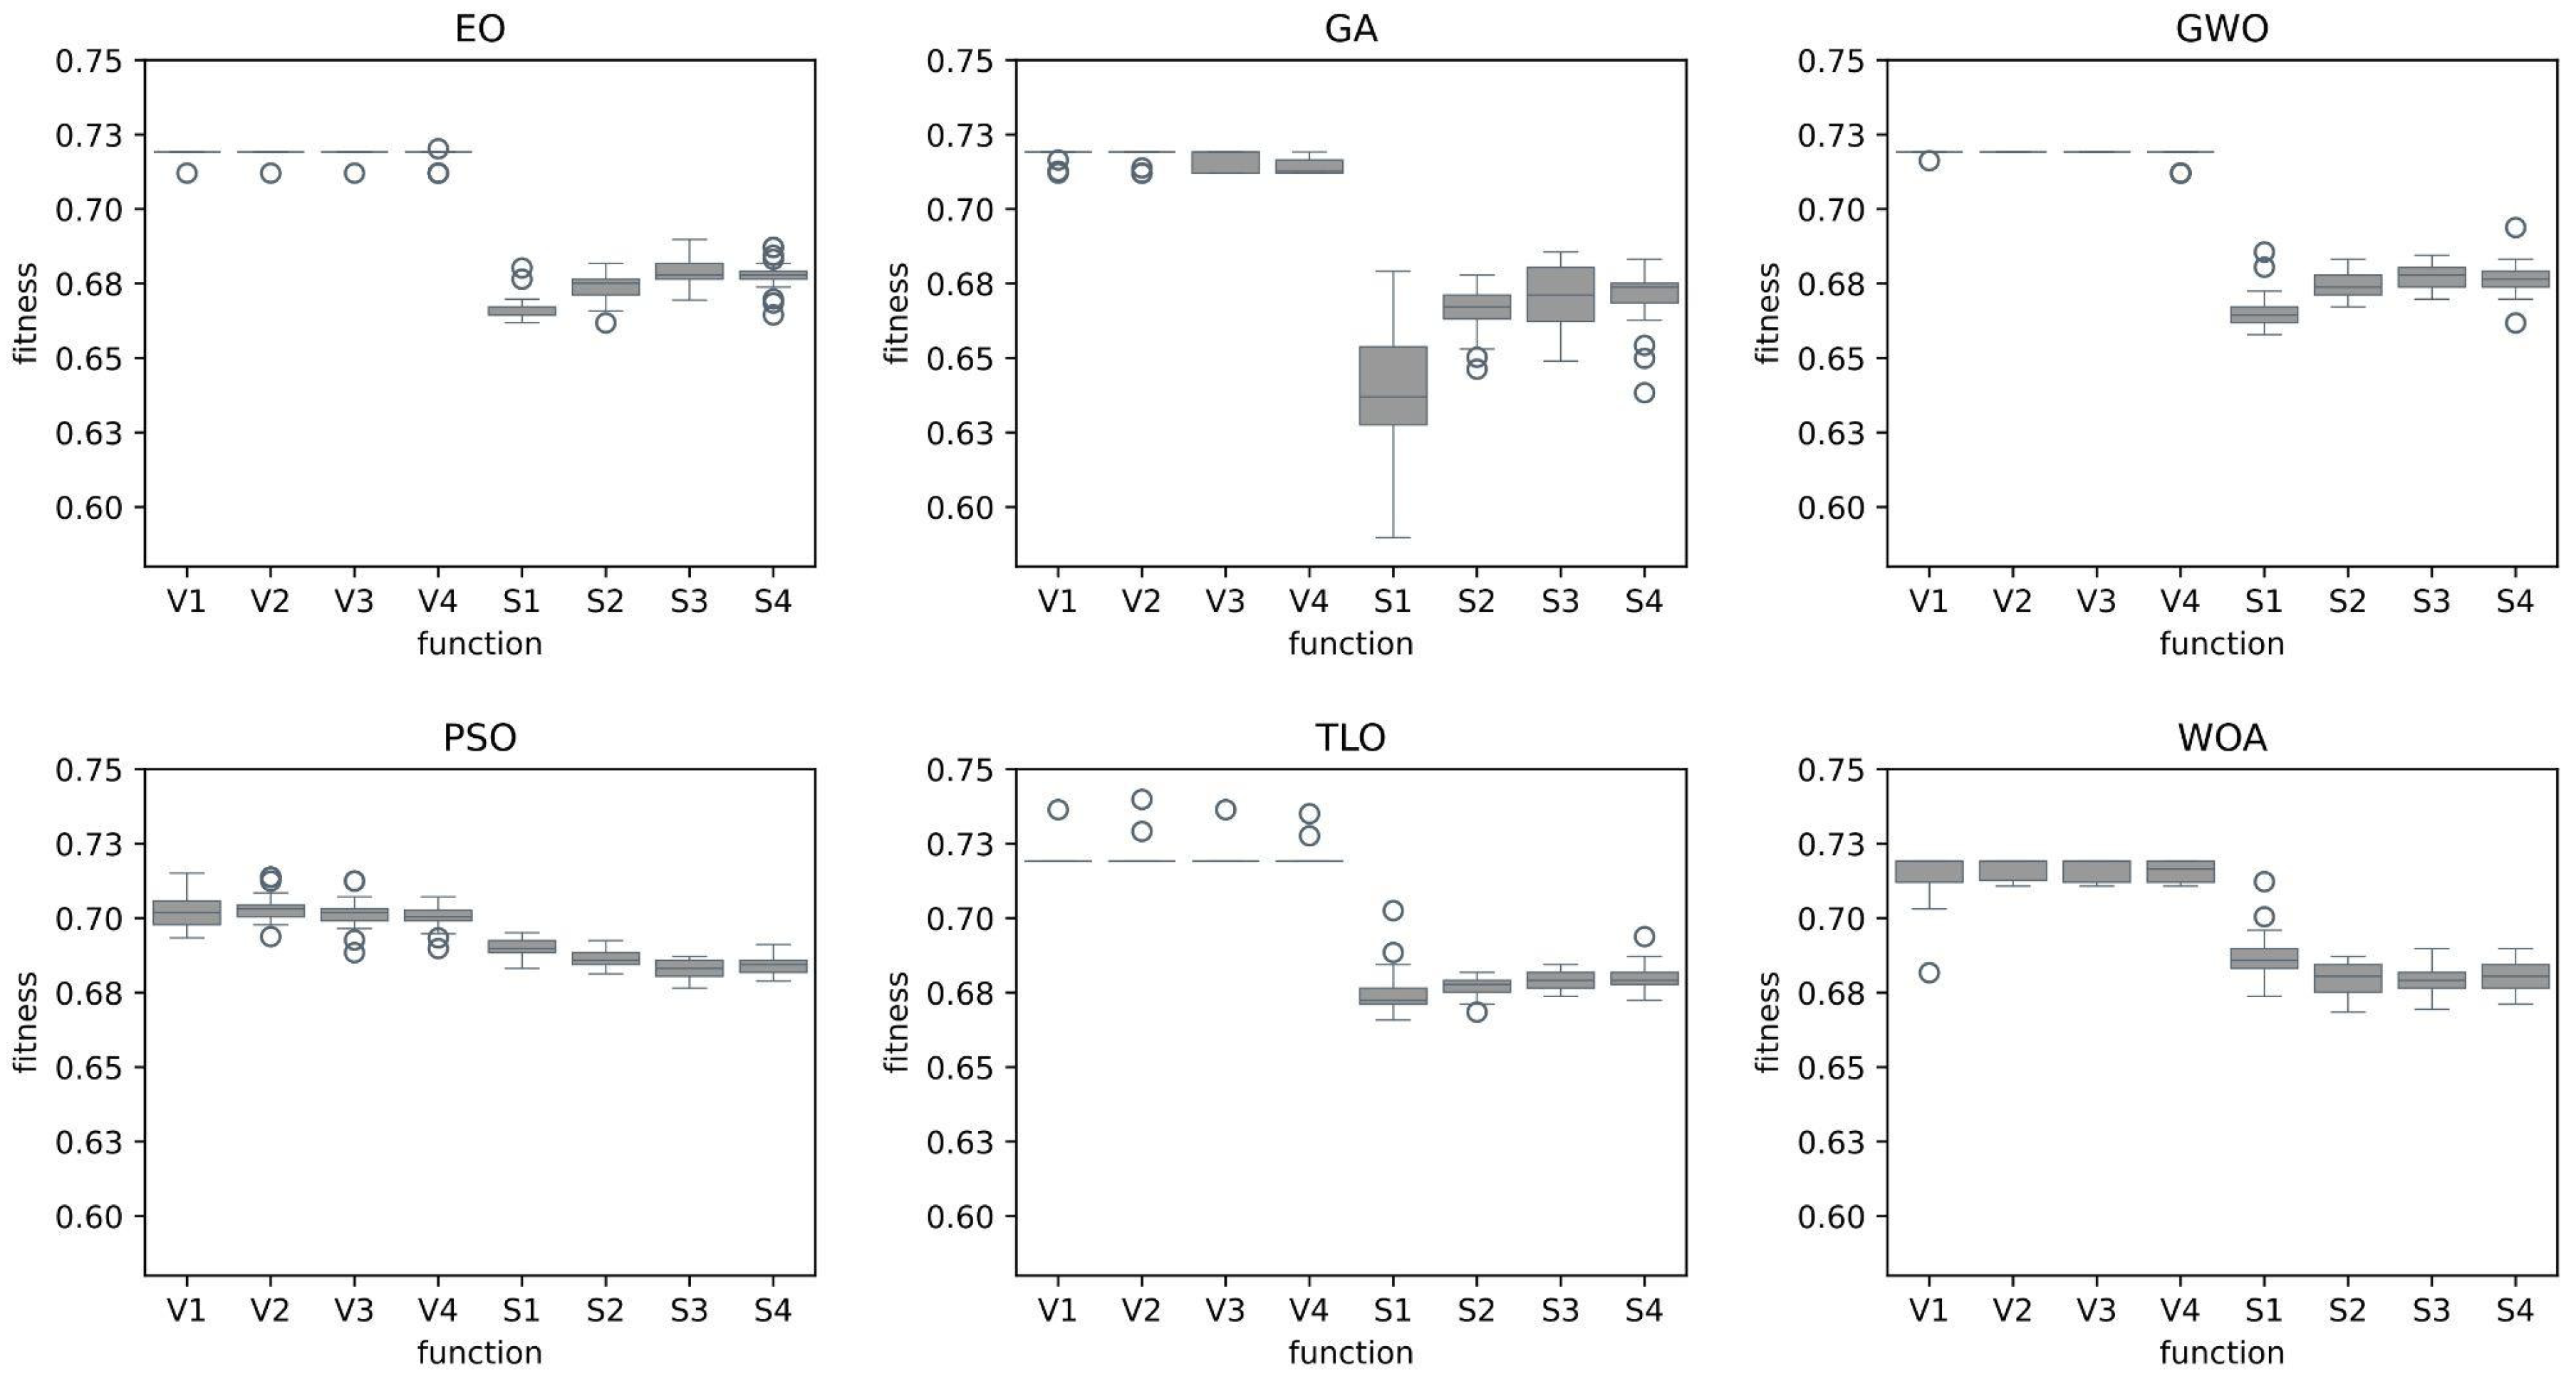
During the feature selection phase, the classification model has been trained using the training data and then evaluated using the test data. The fitness values are computed by comparing the actual values with the predicted results. This process is repeated 25 times for each transfer function for each optimization method. Since there is an issue of imbalance in the class labels for both Case 1 and Case 2, the MCC metric was used to utilize the results. Figure 2 and Figure 3 display the fitness values of eight transfer functions for each feature selection method obtained after 25 trials for Case 1 and Case 2, respectively.
As can be seen from Figure 2 and Figure 3, fitness values of V-shaped functions exhibit higher values than S-shaped ones. In addition, the vertical size of the plots, which represent the dispersion of fitness values in 25 trials, shows that V-shaped functions are generally more stable than S-shaped ones. This implies that the fitness values of V-shaped functions do not change much from trial to trial.

3.2. Classification Performance Comparison of Metaheuristic Feature Selection Methods

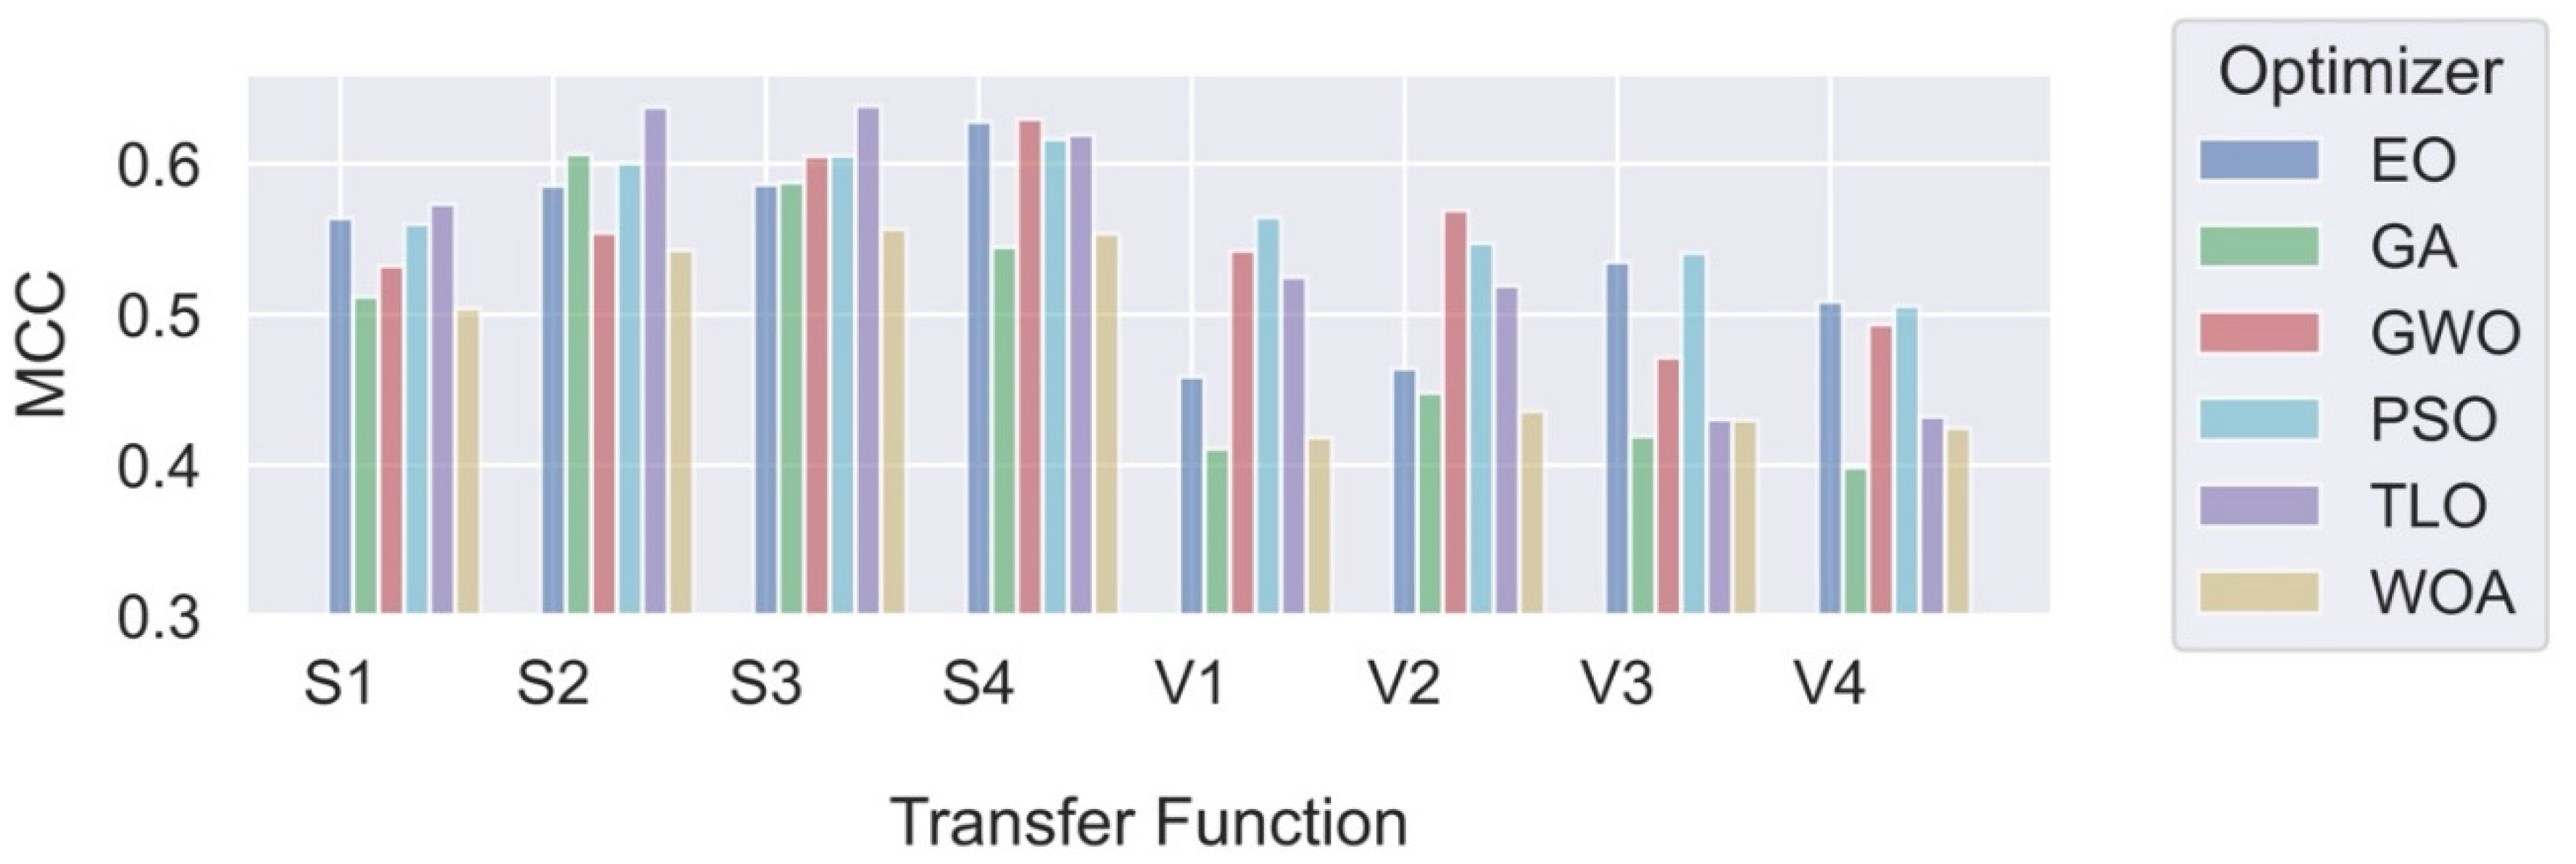
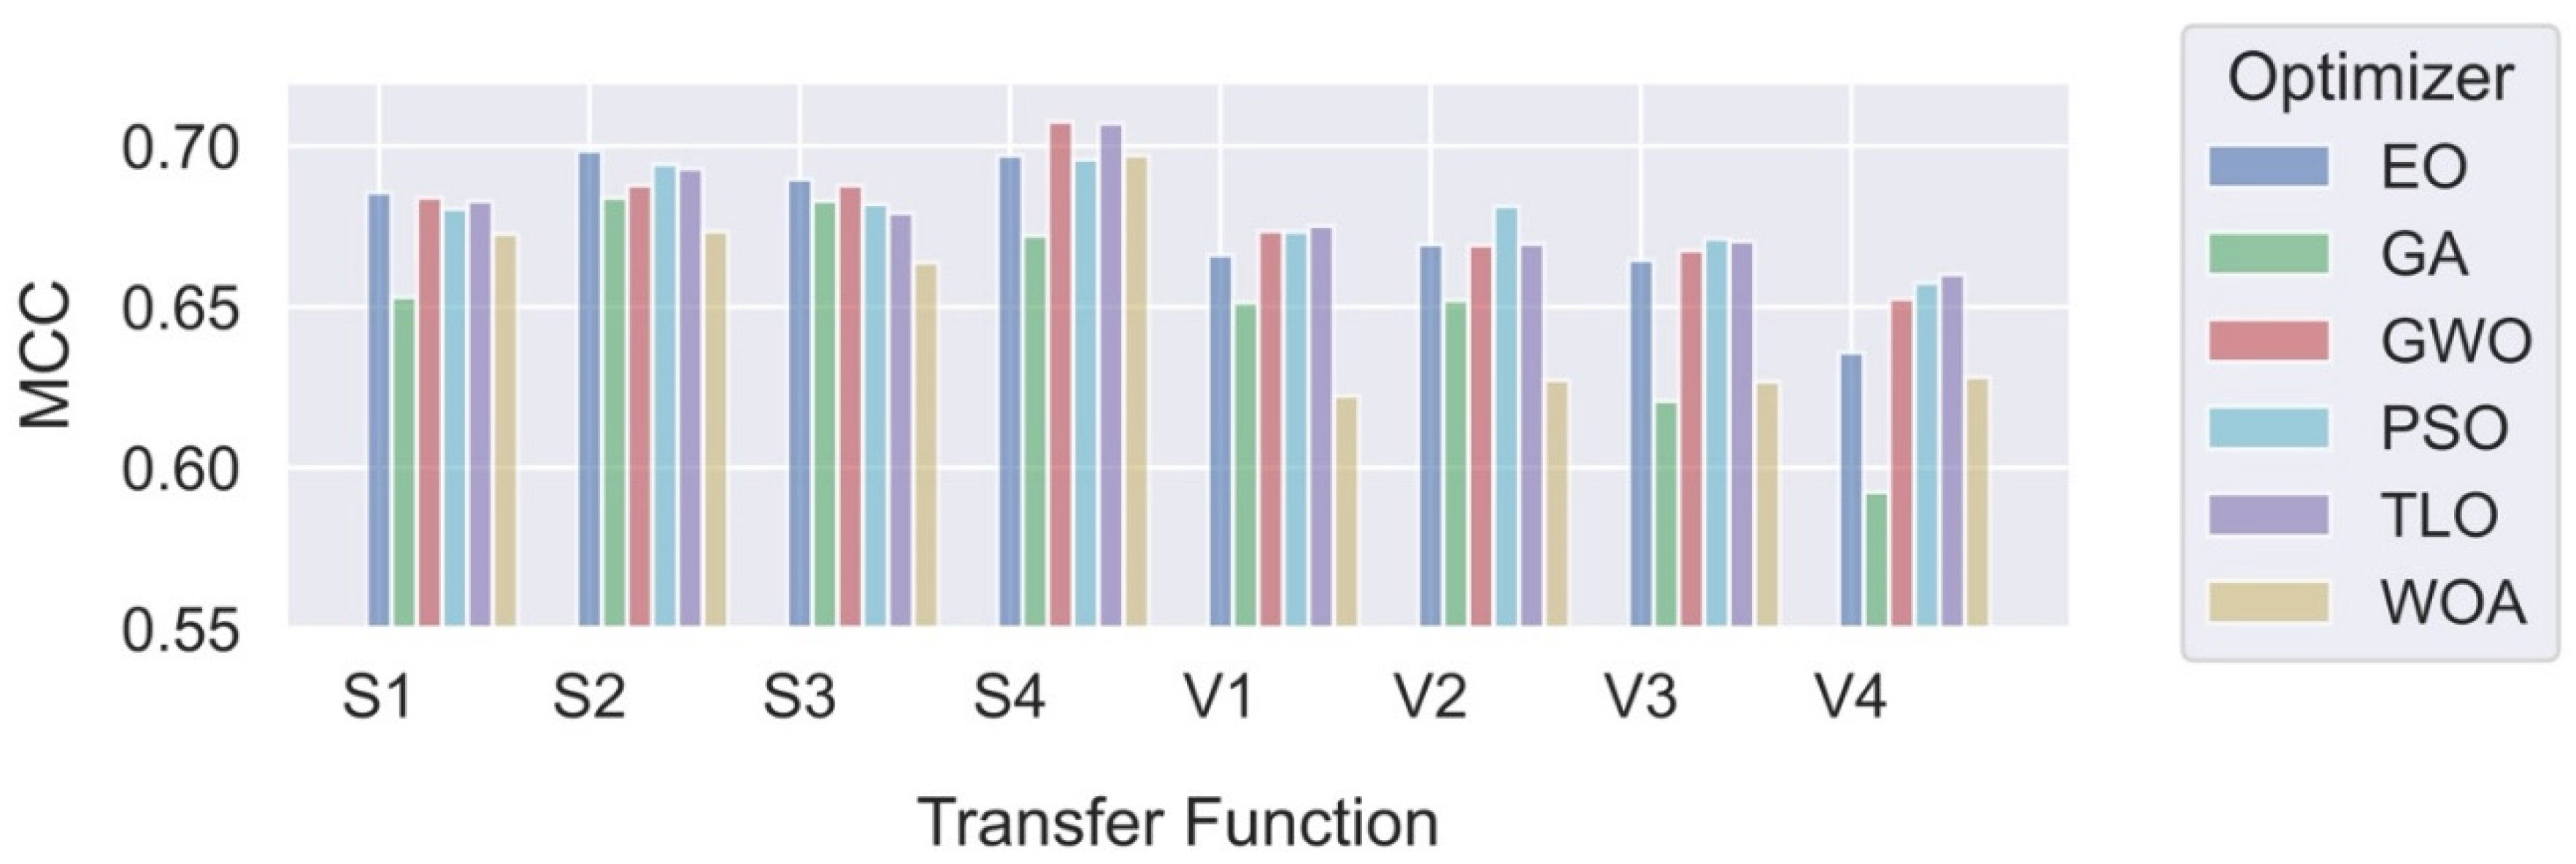
Once the feature selection process was concluded, the k-NN classifier was fed by the selected features for training and then testing. The dataset was partitioned into 80% for training and 20% for testing. Classification conditions are maintained consistent by using the same random state rate and identical test data for the evaluation of all methods. Evaluation of the classification results is made based on both MCC and F1 scores since the dataset is highly imbalanced. Every metaheuristic method for each of eight different transfer functions is employed 25 times and statistical averages (mean and standard deviation) are calculated for each of these 25 runs for fair assessment. We first compared the effects of transfer function families. In other words, we took the average of scores obtained for all V-shaped functions; we did the same thing for all S-shaped functions. The results are presented in Table 4 for Case 1 and Table 5 for Case 2. The bold-styled values in these tables represent the best average scores obtained for each transfer function family. The performance results of each individual transfer function are also presented in graphical format in Figure 4 and Figure 5. It can be observed that methods using S-shaped transfer functions obtain higher classification performance than those using V-shaped ones.
In addition to classification performance, the number of features selected by metaheuristic algorithms for different transfer functions was also investigated and compared. Every metaheuristic method for each of eight different transfer functions is employed 25 times and statistical averages (mean and standard deviation) are calculated for each of these 25 runs for fair assessment. We first compared the effects of transfer function families. In other words, we took the average of scores obtained for all V-shaped functions; we did the same thing for all S-shaped functions. Results are presented in Table 6 and Table 7 for Case 1 and Case 2, respectively.
The dispersion of selected feature size in one of 25 trials for each individual transfer function is also presented as a scatter plot in Figure 6 and Figure 7, for Case 1 and 2 respectively. It can be observed that methods using V-shaped functions use significantly fewer features than those using S-shaped ones.

3.3. Comparison with Classical Feature Selection Methods

In this section, the effectiveness of metaheuristic feature selection methods is compared with the following classical feature selection methods: Spearman correlation (Spearman), Mutual information (MI), Relief, Variance Threshold (VAR), Mean Absolute Difference (MAD), Dispersion Ratio (DR), Lasso, Tree-based, Recursive feature elimination (RFE), and Sequential forward selection (SFS). These classical methods were implemented using the Mafese library, which is an open-source Python library. The number of features to be selected was determined by ranking them based on their MCC scores. This was done by calculating all possible combinations of features within the range of minimum and maximum number of features for each method. The number of features that lead to the highest MCC value was taken as the optimum feature size for that method. The performance values are presented in Table 8 and Table 9 for Cases 1 and 2, respectively. Bold types represent the highest scores for each metric. In order to compare the results of classical feature selection methods with metaheuristic ones, the highest average performance values, obtained over 25 trials, for each metaheuristic method are presented in Table 10 and Table 11 for Cases 1 and 2, respectively. These tables also show with which transfer functions (one for S-shaped functions and the other for V-shaped functions), these values are obtained. Table 8, Table 9, Table 10 and Table 11 also represent the number of features selected by each method.

4. Discussion

In this study, we explored and compared the performances of nature-inspired metaheuristic algorithms for feature selection in respiratory disease classification. The primary objective is to enhance the classification accuracy while reducing the feature set size, thereby improving the computational efficiency of the model. The experiments were conducted on a dataset consisting of respiratory sound recordings belonging to different diseases. Our approach utilized a variety of metaheuristic algorithms and two different classes of transfer functions to select the most relevant features. We first analyzed the fitness values of eight different transfer functions belonging to two different families for each metaheuristic feature selection algorithm. It is seen that fitness values of V-shaped functions exhibit slightly higher values than S-shaped ones. However, the vertical size of the plots, which represent the dispersion of fitness values in 25 trials (Figure 6 and Figure 7), shows that V-shaped functions are generally more stable than S-shaped ones. This leads to the conclusion that fitness values of V-shaped functions do not change much from trial to trial. Then we analyzed the effects of these metaheuristic algorithms and transfer functions on the classification performance. It comes out that MHA methods using S-shaped transfer functions obtain slightly better classification performance than the same methods when they use V-shaped functions. However, using V-shaped transfer functions seems to have two important advantages. First of all, they are much more stable, which means that their fitness values do not change much from trial to trial. Second, the number of features selected by MHA methods when employing V-shaped transfer functions is significantly less than the same methods when they use S-shaped functions.
Finally, we compared the performances of MHA-based feature selection methods with classical methods. Upon analysis of the results, it becomes evident that the proposed MHA-based feature selection methods, with one exception, outperform the classical methods in both binary and multi-class cases. The “Sequential” feature selection method obtained the highest scores in both cases. However, this method uses a very large number of features, increasing the computational burden on the classification system. Optimization methods that achieve the highest MCC scores with S-shaped functions for both cases are GWO and TLO; while the best results with V-valued transfer functions for both cases are obtained with GWO and PSO. Although their performance is slightly less than those using S-shaped functions, the methods used with V-shaped functions achieve this performance by using significantly smaller number of features. Therefore, it seems that if classification performance is the priority, then MHA methods (in particular, GWO and TLO) with S-shaped transfer functions should be the choice. However, if both classification performance and reduced number of features are required, then MHA feature selection methods (in particular, GWO and PSO) using V-shaped transfer functions should be used.
One point needs explanation at this point. The accuracy value is greater than other metrics with classical feature selection methods. This result can lead to the conclusion that metaheuristic methods are worse. However, we want to emphasize that the ACC metric could be misleading in datasets with class imbalance. Therefore, in such datasets, metrics such as MCC or F1 should be used. Our study uses a highly imbalanced dataset. Thus, we used these two metrics for measuring classification performances. This way, we have derived models that can also accurately forecast minority classes. This facilitates the creation of more dependable systems in the field of medical data, particularly in the realm of diagnosing respiratory diseases.
This detailed comparison study shows the superiority of metaheuristic feature selection algorithms in respiratory disease classification compared to classical ones. The use of nature-inspired algorithms provides a robust mechanism for navigating the high-dimensional feature space, ensuring that the selected features contribute maximally to the classification task. Furthermore, the reduction in the number of features not only decreases the computational load but also minimizes the risk of overfitting. This is particularly important in the context of respiratory disease classification, where the diversity and variability of the data can lead to complex decision boundaries. The overall improvement in classification accuracy and computational efficiency underscores the effectiveness of these algorithms in feature selection for respiratory disease classification.
In conclusion, when combined with positive results from the literature for other medical diagnostic applications, it would be correct to say that the integration of nature-inspired metaheuristic algorithms with machine learning models presents a promising avenue for improving the accuracy and efficiency in many classification tasks. Future work could explore the combination of these algorithms with other advanced machine learning techniques, such as ensemble learning, to further enhance the robustness and generalizability of the models.

Supplementary Materials

The following supporting information can be downloaded at the website of this paper posted on Preprints.org.

Author Contributions

Conceptualization, D.G.K., N.Ö, O.D.; methodology, F.Y.K. and N.Ö.; software, N.Ö. and O.D.; validation, N.Ö., O.D. and F.Y.K.; formal analysis, D.G.K.; investigation, D.G.K. and M.K.; resources, F.Y.K.; data curation, N.Ö.; writing—original draft preparation, O.D., N.Ö., F.Y.K..; writing—review and editing, D.G.K. and M.K.; visualization, N.Ö. and O.D.; supervision, D.G.K. and M.K. All authors have read and agreed to the published version of the manuscript.

Funding

This research received no external funding.

Institutional Review Board Statement

Not applicable.

Informed Consent Statement

Not applicable.

Data Availability Statement

The data used in this study are openly available in [ICBHI 2017] at [https://doi.org/10.1007/978-981-10-7419-6_6], reference number [28].

Conflicts of Interest

The authors declare no conflicts of interest.

References

  1. S. B. Shuvo, S. N. Ali, S. I. Swapnil, T. Hasan, and M. I. H. Bhuiyan, “A Lightweight CNN Model for Detecting Respiratory Diseases from Lung Auscultation Sounds Using EMD-CWT-Based Hybrid Scalogram,” IEEE J Biomed Health Inform, vol. 25, no. 7, pp. 2595–2603, Jul. 2021. [CrossRef]
  2. S. Z. H. Naqvi and M. A. Choudhry, “An automated system for classification of chronic obstructive pulmonary disease and pneumonia patients using lung sound analysis,” Sensors (Switzerland), vol. 20, no. 22, pp. 1–23, Nov. 2020. [CrossRef]
  3. M. T. García-Ordás, J. A. Benítez-Andrades, I. García-Rodríguez, C. Benavides, and H. Alaiz-Moretón, “Detecting respiratory pathologies using convolutional neural networks and variational autoencoders for unbalancing data,” Sensors (Switzerland), vol. 20, no. 4, Feb. 2020. [CrossRef]
  4. L. Fraiwan, O. Hassanin, M. Fraiwan, B. Khassawneh, A. M. Ibnian, and M. Alkhodari, “Automatic identification of respiratory diseases from stethoscopic lung sound signals using ensemble classifiers,” Biocybern Biomed Eng, vol. 41, no. 1, pp. 1–14, Jan. 2021. [CrossRef]
  5. L. Pham, H. Phan, R. Palaniappan, A. Mertins, and I. McLoughlin, “CNN-MoE based framework for classification of respiratory anomalies and lung disease detection,” Apr. 2020, [Online]. Available: http://arxiv.org/abs/2004.04072.
  6. L. Pham, H. Phan, R. King, A. Mertins, and I. McLoughlin, “Inception-Based Network and Multi-Spectrogram Ensemble Applied For Predicting Respiratory Anomalies and Lung Diseases,” Dec. 2020, [Online]. Available: http://arxiv.org/abs/2012. 1369.
  7. F. Y. Kababulut, D. Gürkan Kuntalp, O. Düzyel, N. Özcan, and M. Kuntalp, “A New Shapley-Based Feature Selection Method in a Clinical Decision Support System for the Identification of Lung Diseases,” Diagnostics, vol. 13, no. 23, Dec. 2023. [CrossRef]
  8. A.H. Sfayyih et al., “Acoustic-Based Deep Learning Architectures for Lung Disease Diagnosis: A Comprehensive Overview,” May 01, 2023, Multidisciplinary Digital Publishing Institute (MDPI). [CrossRef]
  9. S. B. Manir, M. Karim, and Md. A. Kiber, “Assessment of Lung Diseases from Features Extraction of Breath Sounds Using Digital Signal Processing Methods,” in 2020 Emerging Technology in Computing, Communication and Electronics (ETCCE), IEEE, Dec. 2020, pp. 1–6. [CrossRef]
  10. D. Bardou, K. Zhang, and S. M. Ahmad, “Lung sounds classification using convolutional neural networks,” Artif Intell Med, vol. 88, pp. 58–69, Jun. 2018. [CrossRef]
  11. M. M. Jaber, S. K. Abd, P. M. Shakeel, M. A. Burhanuddin, M. A. Mohammed, and S. Yussof, “A telemedicine tool framework for lung sounds classification using ensemble classifier algorithms,” Measurement (Lond), vol. 162, Oct. 2020. [CrossRef]
  12. S. Z. H. Naqvi and M. A. Choudhry, “An automated system for classification of chronic obstructive pulmonary disease and pneumonia patients using lung sound analysis,” Sensors (Switzerland), vol. 20, no. 22, pp. 1–23, Nov. 2020. [CrossRef]
  13. B. M. Rocha, D. Pessoa, A. Marques, P. Carvalho, and R. P. Paiva, “Automatic classification of adventitious respiratory sounds: A (un)solved problem?,” Sensors (Switzerland), vol. 21, no. 1, pp. 1–19, Jan. 2021. [CrossRef]
  14. N. Sengupta, M. Sahidullah, and G. Saha, “Lung sound classification using cepstral-based statistical features,” Comput Biol Med, vol. 75, pp. 118–129, Aug. 2016. [CrossRef]
  15. A. Srivastava, S. Jain, R. Miranda, S. Patil, S. Pandya, and K. Kotecha, “Deep learning based respiratory sound analysis for detection of chronic obstructive pulmonary disease,” PeerJ Comput Sci, vol. 7, pp. 1–22, 2021. [CrossRef]
  16. M. Abdel-Basset, D. El-Shahat, I. El-henawy, V. H. C. de Albuquerque, and S. Mirjalili, “A new fusion of grey wolf optimizer algorithm with a two-phase mutation for feature selection,” Expert Syst Appl, vol. 139, Jan. 2020. [CrossRef]
  17. Y. Kang, H. Wang, B. Pu, L. Tao, J. Chen, and P. S. Yu, “A Hybrid Two-Stage Teaching-Learning-Based Optimization Algorithm for Feature Selection in Bioinformatics,” IEEE/ACM Trans Comput Biol Bioinform, vol. 20, no. 3, pp. 1746–1760, May 2023. [CrossRef]
  18. T. Iqbal, A. Elahi, W. Wijns, B. Amin, and A. Shahzad, “Improved Stress Classification Using Automatic Feature Selection from Heart Rate and Respiratory Rate Time Signals,” Applied Sciences (Switzerland), vol. 13, no. 5, Mar. 2023. [CrossRef]
  19. M. Nssibi, G. Manita, and O. Korbaa, “Advances in nature-inspired metaheuristic optimization for feature selection problem: A comprehensive survey,” Aug. 01, 2023, Elsevier Ireland Ltd. [CrossRef]
  20. B. Sathiyabhama et al., “A novel feature selection framework based on grey wolf optimizer for mammogram image analysis,” Neural Comput Appl, vol. 33, no. 21, pp. 14583–14602, Nov. 2021. [CrossRef]
  21. M. H. Nadimi-Shahraki, H. Zamani, and S. Mirjalili, “Enhanced whale optimization algorithm for medical feature selection: A COVID-19 case study,” Comput Biol Med, vol. 148, Sep. 2022. [CrossRef]
  22. L. F. Chen, C. T. Su, K. H. Chen, and P. C. Wang, “Particle swarm optimization for feature selection with application in obstructive sleep apnea diagnosis,” Neural Comput Appl, vol. 21, no. 8, pp. 2087–2096, Nov. 2012. [CrossRef]
  23. Z. M. Elgamal, N. B. M. Yasin, M. Tubishat, M. Alswaitti, and S. Mirjalili, “An improved harris hawks optimization algorithm with simulated annealing for feature selection in the medical field,” IEEE Access, vol. 8, pp. 186638–186652, 2020. [CrossRef]
  24. R. Ramasamy Rajammal, S. Mirjalili, G. Ekambaram, and N. Palanisamy, “Binary Grey Wolf Optimizer with Mutation and Adaptive K-nearest Neighbour for Feature Selection in Parkinson’s Disease Diagnosis,” Knowl Based Syst, vol. 246, Jun. 2022. [CrossRef]
  25. S. K. Prabhakar and D. O. Won, “HISET: Hybrid interpretable strategies with ensemble techniques for respiratory sound classification,” Heliyon, vol. 9, no. 8, Aug. 2023. [CrossRef]
  26. Z. Abedi, N. Naghavi, and F. Rezaeitalab, “Detection and classification of sleep apnea using genetic algorithms and SVM-based classification of thoracic respiratory effort and oximetric signal features,” Comput Intell, vol. 33, no. 4, pp. 1005–1018, Nov. 2017. [CrossRef]
  27. D. Álvarez, R. Hornero, J. V. Marcos, and F. del Campo, “Feature selection from nocturnal oximetry using genetic algorithms to assist in obstructive sleep apnoea diagnosis,” Med Eng Phys, vol. 34, no. 8, pp. 1049–1057, Oct. 2012. [CrossRef]
  28. Rocha, B. M., Filos, D., Mendes, L., Vogiatzis, I., Perantoni, E., Kaimakamis, E., Natsiavas, P., Oliveira, A., Jácome, C., Marques, A., Paiva, R. P., Chouvarda, I., Carvalho, P., & Maglaveras, N. (2017). A Respiratory Sound Database for the Development of Automated Classification. Precision Medicine Powered by PHealth and Connected Health. ICBHI 2017. https://bhichallenge.med.auth.gr/.
  29. L. Wang, Y. He, X. Wang, Z. Zhou, H. Ouyang, and S. Mirjalili, “A novel discrete differential evolution algorithm combining transfer function with modulo operation for solving the multiple knapsack problem,” Inf Sci (N Y), vol. 680, Oct. 2024. [CrossRef]
  30. G. Jurman, S. Riccadonna, and C. Furlanello, “A comparison of MCC and CEN error measures in multi-class prediction,” PLoS One, vol. 7, no. 8, Aug. 2012. [CrossRef]
  31. M. Alweshah, S. Alkhalaileh, M. A. Al-Betar, and A. A. Bakar, “Coronavirus herd immunity optimizer with greedy crossover for feature selection in medical diagnosis,” Knowl Based Syst, vol. 235, Jan. 2022. [CrossRef]
  32. J. Nourmohammadi-Khiarak, M. R. Feizi-Derakhshi, K. Behrouzi, S. Mazaheri, Y. Zamani-Harghalani, and R. M. Tayebi, “New hybrid method for heart disease diagnosis utilizing optimization algorithm in feature selection,” Health Technol (Berl), vol. 10, no. 3, pp. 667–678, May 2020. [CrossRef]
  33. N. B. Oğur et al., “Detection of depression and anxiety in the perinatal period using Marine Predators Algorithm and kNN,” Comput Biol Med, vol. 161, Jul. 2023. [CrossRef]
  34. A. Wang, N. An, G. Chen, L. Li, and G. Alterovitz, “Accelerating wrapper-based feature selection with K-nearest-neighbor,” Knowl Based Syst, vol. 83, no. 1, pp. 81–91, 2015. [CrossRef]
Figure 1. V-shaped and S-shaped transfer functions.
Preprints 116300 g001
Figure 2. Fitness values of different transfer functions for each feature selection method for Case1.
Preprints 116300 g002
Figure 3. Fitness values of different transfer functions for each feature selection method for Case2.
Preprints 116300 g003
Figure 4. Comparison of Metaheuristic Algorithms for Individual Transfer Functions for Case 1.
Preprints 116300 g004
Figure 5. Comparison of Metaheuristic Algorithms for Individual Transfer Functions for Case 2.
Preprints 116300 g005
Figure 6. Feature Size for Case 1.
Preprints 116300 g006
Figure 7. Feature Size for Case 2.
Preprints 116300 g007
Table 1. Feature extraction methods employed in the study.
No Method Abbreviation Explanation
1 Chroma Short Time Fourier Transform Chro_stft It calculates a chromatogram by analyzing either a waveform or a power spectrogram.
2 Chroma Constant-Q chromagram Chro_cqt It calculates the Constant-Q chromagram.
3 Chroma Energy Normalized Chro_cens It calculates the chroma variant known as Chroma Energy Normalized.
4 Chroma Variable-Q chromagram Chro_ vqt It calculates the Variable-Q chromagram.
5 Mel-Scaled Spectrogram Mel_spe It calculates a mel-scaled spectrogram.
6 Mel-Frequency Cepstral Coefficients Mfcc It calculates the mel-frequency cepstral coefficients
7 Root Mean Square Rms It calculates the root mean square value for each frame, using either the audio samples or the spectrogram.
8 Spectral Centroid Spec_cent It calculates the spectral centroid. Every individual frame of a magnitude spectrogram is standardized and considered as a distribution across frequency bins. From this distribution, the average value is calculated for each frame.
9 Spectral Bandwidth Spec_bandw It calculates the spectral bandwidth.
10 Spectral Contrast Spec_cont It calculates the spectral content of each frame by dividing it into sub-bands. The energy contrast for each sub-band is determined by comparing the average energy in the highest quantile (peak energy) with that of the lowest quantile (valley energy).
11 Spectral Flatness Spec_flat It calculates the spectral flatness. Spectral flatness, also known as tonality coefficient, is a metric used to quantify the degree to which a sound resembles noise rather than a distinct tone. A spectral flatness value closer to 1.0 indicates that the spectrum is more similar to white noise.
12 Spectral Roll-off Frequency Spec_rof It calculates the roll-off frequency. The roll-off frequency is determined for each frame as the central frequency of a spectrogram bin that contains at least roll_percent of the energy of the spectrum in that frame, as well as the bins below it.
13 Polynomial Features Poly_fea It obtains the coefficients for fitting a polynomial to the individual columns of a spectrogram.
14 Tonal Centroid Features Tonnetz It calculates the tonal centroid characteristics. This representation employs the technique of projecting chroma features onto a 6-dimensional basis, where the perfect fifth, minor third, and major third are each represented by two-dimensional coordinates.
15 Zero Crossing Rate Zero_cr It calculates the rate at which the audio time series crosses the zero axis.
Table 2. Distribution of data in Case 1 and Case 2.
Case Class Sample Size # of Features
1 healthy 35 75
disease 885
2 healthy 35
chronic disease 810
non-chronic disease 75
Table 3. V-shaped and S-shaped transfer functions.
V- Shape S- Shape
Name Formula Name Formula
V1 V 1 ( x ) = | e r f ( π 2 x ) | S1 S 1 ( x ) = 1 1 + e 2 x
V2 V 2 ( x ) = | t a n h ( x ) | S2 S 2 ( x ) = 1 1 + e x
V3 V 3 ( x ) = | x 1 + x 2 ) | S3 S 3 ( x ) = 1 1 + e ( x 2 )
V4 V 4 ( x ) = | 2 π a r c t a n ( π 2 x ) | S4 S 3 ( x ) = 1 1 + e ( x 3 )
Table 4. Comparison of Metaheuristic Algorithms for S- and V-shaped Transfer Function Families for Case 1.
Shape Method Mean MCC Std of MCC
S EO 0,5909 0,1211
GA 0,5627 0,1206
GWO 0,5803 0,1136
PSO 0,5956 0,1043
TLO 0,6171 0,1055
WOA 0,5392 0,1174
V EO 0,4916 0,1335
GA 0,4193 0,1704
GWO 0,5191 0,1476
PSO 0,5395 0,1621
TLO 0,4767 0,1891
WOA 0,4272 0,1626
Table 5. Comparison of Metaheuristic Algorithms for S- and V-shaped Transfer Function Families for Case 2.
Shape Method Mean MCC Std of MCC
S EO 0,6927 0,0528
GA 0,6730 0,0548
GWO 0,6918 0,0523
PSO 0,6882 0,0414
TLO 0,6905 0,0466
WOA 0,6768 0,0550
V EO 0,6590 0,0410
GA 0,6292 0,0604
GWO 0,6657 0,0345
PSO 0,6709 0,0445
TLO 0,6688 0,0326
WOA 0,6262 0,0667
Table 6. Number of Selected Features for Case 1.
Method Shape Mean Std Shape Mean Std
EO S 30,90 4,49 V 3,21 0,94
GA 31,02 3,48 3,03 1,00
GWO 30,56 3,75 3,44 0,87
PSO 27,13 3,53 8,47 3,44
TLO 30,85 3,84 3,93 1,59
WOA 19,73 5,88 2,96 1,00
Table 7. Number of Selected Features for Case 2.
Opt. Shape Mean Std Shape Mean Std
EO S 39,57 5,29 V 5,83 0,59
GA 42,56 7,96 5,72 1,33
GWO 39,78 5,64 5,90 0,44
PSO 30,71 3,05 18,31 3,57
TLO 36,99 3,69 6,17 1,00
WOA 33,26 5,55 5,55 0,77
Table 8. Best Performances of Classical FS Methods for Case 1.
Method ACC F1 Macro MCC # of Features
DR 0,978 0,744 0,506 17
Lasso 0,967 0,492 -0,012 3
MAD 0,973 0,493 0,000 7
MI 0,978 0,661 0,442 9
RELIEF 0,973 0,493 0,000 7
Recursive 0,978 0,744 0,506 31
SPEARMAN 0,989 0,872 0,770 55
Sequential 0,989 0,897 0,794 47
Tree 0,978 0,661 0,442 11
VAR 0,973 0,493 0,000 7
Table 9. Best Performances of Classical FS Methods for Case 2.
Method ACC F1 Macro MCC # of Features
DR 0,918 0,689 0,597 18
Lasso 0,842 0,352 0,054 5
MAD 0,891 0,511 0,528 14
MI 0,891 0,511 0,528 57
RELIEF 0,891 0,511 0,528 14
Recursive 0,940 0,677 0,711 39
SPEARMAN 0,891 0,511 0,528 72
Sequential 0,962 0,797 0,829 67
Tree 0,908 0,515 0,533 27
VAR 0,891 0,511 0,528 15
Table 10. Best results according to the average of 25 trials of MHA FS methods for Case 1.
Optimizer Function ACC F1 Macro MCC Average # of Features
EO S4 0,918 0,630 0,628 29,92
V3 0,905 0,612 0,535 3,36
GA S2 0,914 0,616 0,606 33,44
V2 0,891 0,567 0,448 3,2
GWO S4 0,918 0,629 0,630 30,52
V2 0,911 0,637 0,569 3,4
PSO S4 0,916 0,643 0,616 28,08
V1 0,908 0,610 0,564 9,24
TLO S3 0,920 0,636 0,638 29,04
V1 0,905 0,590 0,525 4,2
WOA S3 0,903 0,599 0,557 25,56
V2 0,888 0,536 0,436 3,16
Table 11. Best results according to average of 25 trials of MHA FS methods for Case 2.
Method T-Function ACC F1 Macro MCC Average # of Features
EO S2 0,937 0,704 0,698 40,04
V2 0,931 0,698 0,669 5,92
GA S2 0,934 0,683 0,684 43,44
V2 0,928 0,685 0,652 5,92
GWO S4 0,938 0,716 0,708 37,6
V1 0,931 0,706 0,674 6
PSO S4 0,936 0,713 0,696 31,88
V2 0,933 0,712 0,681 17,76
TLO S4 0,938 0,710 0,707 34,68
V1 0,931 0,701 0,675 5,96
WOA S4 0,937 0,697 0,697 34,88
V4 0,924 0,656 0,628 5,56
Disclaimer/Publisher’s Note: The statements, opinions and data contained in all publications are solely those of the individual author(s) and contributor(s) and not of MDPI and/or the editor(s). MDPI and/or the editor(s) disclaim responsibility for any injury to people or property resulting from any ideas, methods, instructions or products referred to in the content.
Copyright: This open access article is published under a Creative Commons CC BY 4.0 license, which permit the free download, distribution, and reuse, provided that the author and preprint are cited in any reuse.
Prerpints.org logo

Preprints.org is a free preprint server supported by MDPI in Basel, Switzerland.

Subscribe

© 2024 MDPI (Basel, Switzerland) unless otherwise stated