Preprint
Article

Static Resilience Evolution of the Global Wood Forest Products Trade Network from 2002 to 2021: A Complex Directed Weighted Network Analysis Perspective

Altmetrics

Downloads

60

Views

39

Comments

0

A peer-reviewed article of this preprint also exists.

Submitted:

26 August 2024

Posted:

27 August 2024

You are already at the latest version

Alerts
Abstract
Based on the perspective of complex directed weighted network analysis, this paper constructs a static resilience evaluation framework for trade networks from two dimensions: structural resilience and node resilience. It studies the evolution of static resilience in the upstream, midstream, downstream, and recycling trade networks of global wood forest products from 2002 to 2021. The study finds that the total trade volume of global wood forest products has increased by 58.0%, 77.3%, 71.2%, and 77.2% in the upstream, midstream, downstream, and recycling sectors, respectively. The downstream trade network exhibits efficient information transmission and resource mobility capabilities. All four types of trade networks exhibit scale-free characteristics, with core countries such as China, the United States, and Germany playing a dominant role in the network and playing a crucial role in network robustness, but also increasing network vulnerability. In terms of unweighted assortativity, all four networks exhibit the characteristic of "small countries relying on hubs," while the weighted assortativity of the downstream network is positive, indicating enhanced network resilience. In terms of node resilience, countries exhibit significant differences and dynamic changes. China demonstrates strong resilience and adaptability, while the United States maintains its core position. China's influence in the downstream network has significantly increased, and India has rapidly emerged in the recycling network. To enhance network resilience, it is necessary to increase diversity and redundancy, establish effective emergency response mechanisms, and promote the diversification and green transformation of the supply chain.
Keywords: 
Subject: Engineering  -   Safety, Risk, Reliability and Quality

1. Introduction

As a key component of global economic activity, the trade in global wood forest products plays a crucial role in promoting economic development, meeting the wood demand of various countries, and protecting forest resources [1,2,3]. The distribution of global forest resources is uneven, mainly concentrated in a few countries such as Russia, Brazil, Canada, the United States, and China [4]. This imbalance in resource distribution has accelerated the vigorous development of international trade in wood forest products. Countries balance supply and demand through trade to meet their own economic development and consumption needs. According to UN Comtrade data, the global trade volume of wood forest products increased from 253.103 billion USD in 2002 to 538.862 billion USD in 2021, with an average annual growth rate of 5.94%. The trade scale increased from 394.6 million tons in 2002 to 672.8 million tons in 2021, with an average annual growth rate of 3.71%.
The global trade in wood forest products has formed a complex system, with its production processes being split by the global value chain and distributed across the world, forming an intertwined “network structure.” Changes in this structure are influenced by domestic and international factors as well as the evolution of the trade network itself, which are related to the efficiency and stability of global trade and also pose higher requirements for the formulation of trade policies for wood forest products [5].
Social network analysis, as a powerful tool for exploring trade network structures and trade partnerships, has been widely used in the study of wood forest product trade networks. Scholars have delved into the structure and complexity of global wood forest product trade networks through indicators such as network density, node degree, node strength, clustering coefficient, fully demonstrating the unique advantages of social network analysis in revealing global trade relationships and identifying key nodes [6,7,8,9]. With the deepening of research, researchers have begun to further utilize complex network theory, which integrates theories and methods from multiple disciplines such as physics, mathematics, and computer science, providing a more multidimensional perspective for the study of global wood forest product trade. They have constructed global or regional wood forest product trade network models, conducted deep analyses of network structures, evolution, and influencing factors, and comprehensively revealed the core countries, marginal countries, trade communities, and their dynamic changes in the global wood forest product trade. Consistent research results indicate that the global wood forest product network exhibits significant small-world characteristics, with trade relationships gradually deepening over time, trade volumes continuously expanding, trade network structures becoming more ordered, and bidirectional exchanges between trading countries increasing [2,5,10,11,12,13,14]. However, despite the focus of existing research on the structure and characteristics of the global wood forest product trade network, there is a relative lack of thorough exploration of network resilience and robustness, resulting in an incomplete and superficial understanding of the evolution process of resilience in the global wood forest product trade network.
The concept of resilience originates from mechanics [15], where it is used to describe the ability of a material to rebound after being subjected to external forces. Later, it was innovatively introduced into the field of ecosystem restoration and further extended to more complex social-ecological systems [16]. With the continuous development of complex network theory, scholars have begun to focus on the study of network resilience, particularly in the fields of urban networks [17], transportation networks [18], economic networks [19], supply chain networks [20], and ecological networks [21].
Network resilience refers to the ability formed by individuals within a network system through collaboration and complementarity in social, economic, organizational, and other domains. It is the ability to respond and adapt to external acute shocks and chronic stresses, and to recover or transform from them [22]. In the economic domain, the analysis of network resilience is particularly crucial, and network structural attributes become the foundation for measuring the functionality and resilience of trade networks [23]. A poorly designed network structure may quickly collapse in the face of disturbances and shocks, while a well-designed network structure can rapidly absorb shocks and efficiently recover, thereby maintaining the “robustness” of the network [24].
Currently, there is no unified method for assessing network resilience. Some scholars have used complex network models to analyze the impact of network efficiency, redundancy, diversity, and modularity on network resilience [19,25]. They have found that highly efficient networks may be more vulnerable when facing shocks, while redundancy, diversity, and high modularity are effective strategies for enhancing system resilience [26]. Some scholars have constructed global trade network models for different industries such as food [27,28,29], oil and gas resources [30,31,32], mineral resources [33,34,35,36,37], and wood forest products, based on their global trade data. They have selected one or more network indicators such as hierarchy, matching, transmission, diversity, and agglomeration to reflect the structural resilience of the network, and used various centrality indicators of nodes to represent node resilience. Further, they have assessed the dynamic resilience of the trade network by simulating its response to different types of shocks, such as the removal of nodes or edges. However, due to the complexity and imbalance of the network itself, most current network resilience analyses focus on unweighted networks and fail to consider the interaction of node and edge weights in expressing network structure. Trade networks are typical directed and weighted networks, with significant heterogeneity, complexity, and imbalance in network nodes and edges. Network weights are crucial for comprehensively measuring network resilience [38].
Network resilience has a specific and tangible real-world context. Analyzing, interpreting, and revealing the complex phenomena and objective laws of network resilience requires full attention to the uniqueness of trade networks, as no two real-world network resilience mechanisms are exactly the same [39]. Therefore, this paper uses global trade data for wood forest products from UN Comtrade from 2002 to 2021 as a basis to construct directed and weighted trade networks for different stages of the supply chain and conduct empirical research on network static resilience.
This study is expected to reveal the topological structures of upstream, midstream, downstream, and recycling networks in the global trade of wood forest products, as well as the dynamic evolution patterns of static network resilience. This will provide a scientific basis for global trade policy formulation, optimal resource allocation, and environmental protection. The specific contributions include: Firstly, based on complex network theory, constructing a static resilience measurement framework for directed and weighted trade networks, designing multi-dimensional static weighted indicators to assess their resilience, and providing methodological exploration for scientifically understanding the resilience mechanisms of trade networks; Secondly, constructing four types of global trade network models for wood forest products, clearly showcasing the topological structures of these networks, which is significant for understanding the global trade pattern of wood forest products and formulating relevant strategies; Thirdly, analyzing the evolution characteristics of static resilience in the four types of global trade networks for wood forest products from multiple dimensions, which provides important decision-making reference value for assessing their ability to resist external shocks and formulating effective trade strategies and policy adjustments; Fourthly, combining the research results, proposing strategic suggestions to enhance the resilience of global trade networks for wood forest products, providing strong support for the sustainable development of the global wood industry.

2. Research Methodology and Data Sources

2.1. Research Framework

Wood forest products, as direct conversions of forest resources, encompass a wide range of products from upstream raw materials such as logs, sawn timber, and wood pulp, to midstream processed products like plywood and composites, and downstream consumer goods like paper products, woodwork, furniture, as well as recycled products like waste paper. Building upon existing research definitions of wood forest products [40,41], this paper further categorizes them into four major groups based on their supply chain positions: upstream, midstream, downstream, and recycled wood forest products. The specific classification and corresponding HS codes are illustrated in Figure 1.
Drawing from complex network and resilience theories, this paper measures the static resilience of the global wood forest product network from two aspects: structural resilience and nodal resilience. Structural resilience reveals the overall resilience of the network at a macro level, while nodal resilience highlights the local resilience at a micro level. As a typical directed weighted network, the resilience measurement of the global wood forest product trade network necessitates attention not only to trade relationships between countries (regions) but also to the significant impact of trade volumes on resilience. Based on existing research findings [33,37,38,42], and in conjunction with the actual situation of global wood forest product trade, we have constructed a weighted indicator system for considering key factors such as trade volumes, enables a more accurate assessment of the resilience level of the global wood forest product trade network.
Table 1. Weighted Indicator System for Evaluating the Static Resilience of the Global Wood Forest Products Network.
Type Influencing Factor Weighted Indicator Impact on Network Resilience
Structural Resilience Transmissibility Weighted
Global
Efficiency
Measures the speed and capacity of information transmission or material flow within the global wood forest product trade network, considering trade intensity weighting. Higher efficiency indicates smoother transmission and stronger resilience.
Clustering Weighted
Average
Clustering
Coefficient
Measures the modular characteristics of the global wood forest product trade network, considering trade volume weighting. Higher coefficients indicate tighter local clustering, better network connectivity and transmission efficiency, and stronger resilience.
Hierarchy Weighted
Degree
Distribution
Reflects the probability distribution of node-weighted degrees considering trade volumes. Moderate hierarchy and flat structures contribute to balance between robustness and vulnerability, enhancing network resilience.
Assortativity Weighted
Assortativity
Coefficient
Reflects the tendency of countries (regions) to connect with partners of similar total trade volumes. Assortative networks strengthen hub connections, providing stability and rapid recovery, while disassortative networks facilitate information exchange and resource sharing but may lead to over-reliance on hubs, affecting resilience and stability.
Nodal Resilience Node Strength Weighted
Out-degree &
In-degree
High weighted degrees indicate higher anti-interference ability but may also make nodes “single points of failure.”
Transit Capacity Weighted Betweenness Centrality High values indicate nodes occupying central positions, controlling critical trade flows, and acting as bridges. High centrality reflects both closeness and potential influence in risk transmission.
Diffusion Capacity Weighted Closeness
Centrality
Reflects a node’s centrality based on trade intensity. High closeness enables nodes to rapidly acquire and disseminate information, mitigating or blocking further risk transmission.
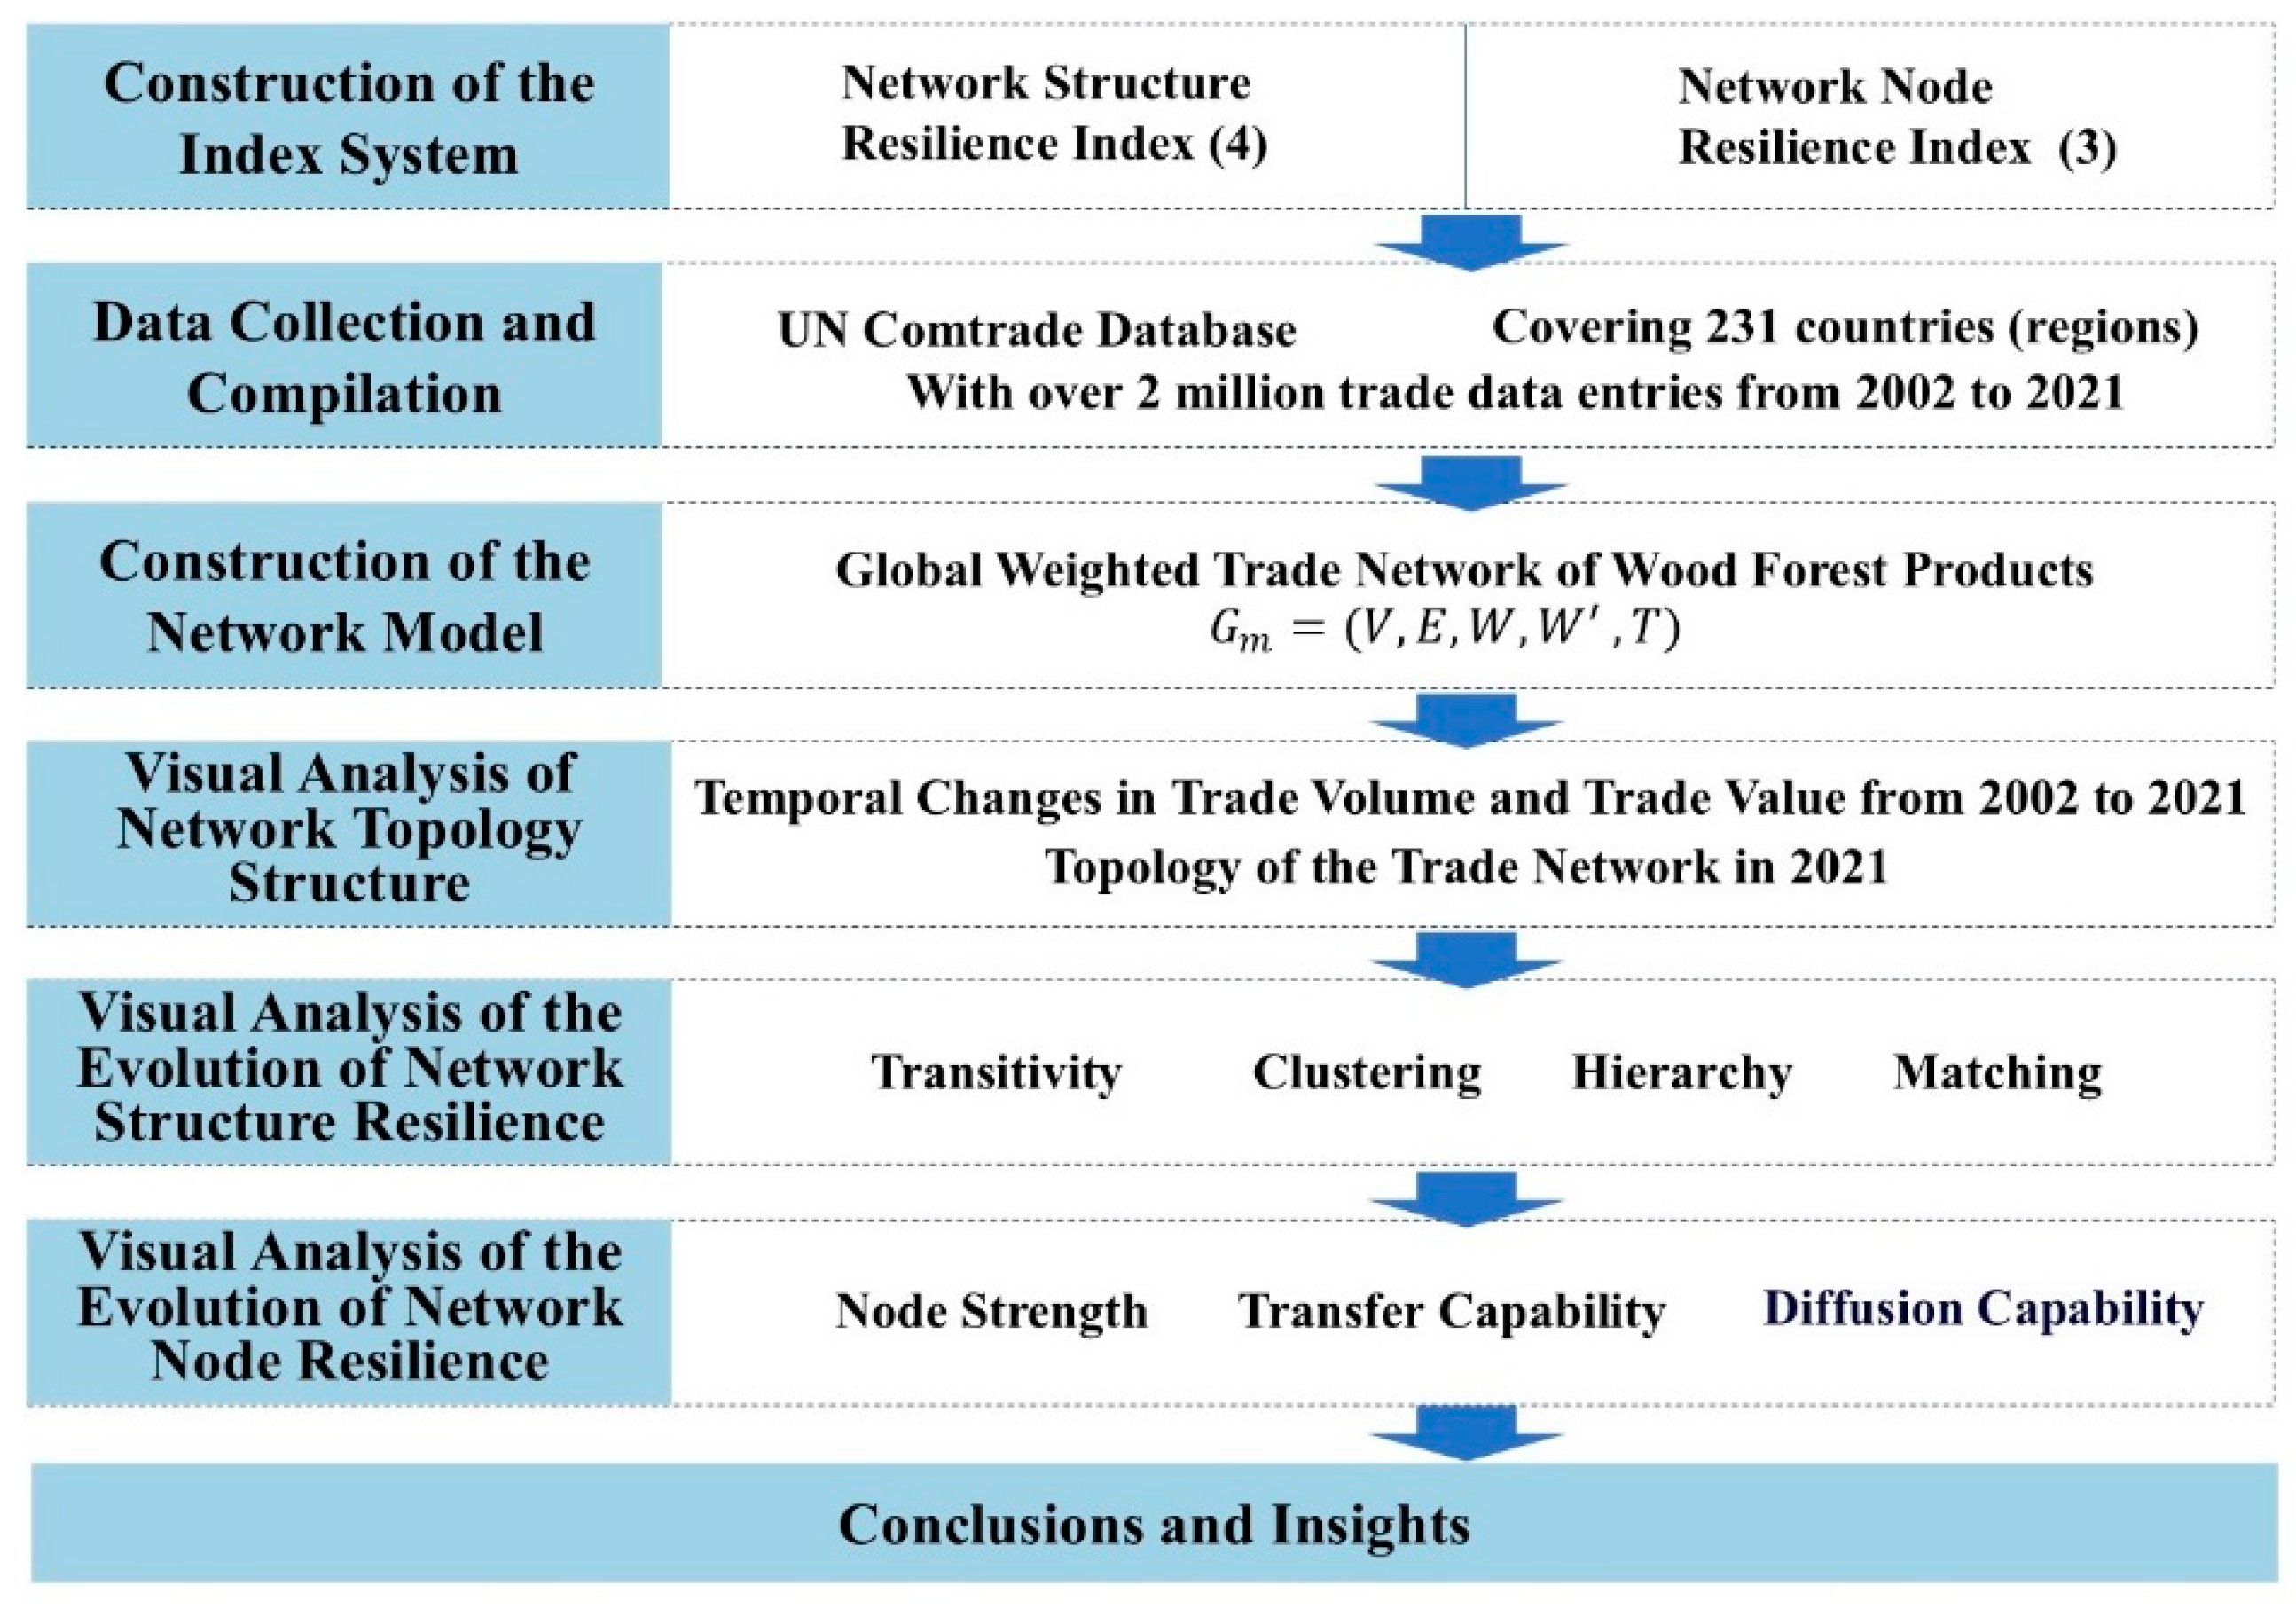
Based on this indicator system, we further collected data to construct directed weighted trade network models for upstream, midstream, downstream, and recycled wood forest products, systematically conducting empirical research on network static resilience. The research framework is illustrated in Figure 2.

2.2. Research Methodology

2.2.1. Construction of the Global Wood Forest Products Trade Network

The global wood forest products trade network is constructed with countries (regions)involved in this trade as network nodes, their trade relationships as edges, and trade volumes and trade closeness as weights. A complex network model is established based on these parameters. The following definitions are applied to the global wood forest products trade network:
G m = ( V , E , W , W , T )
where m represents the four different types of wood forest products networks categorized as upstream, midstream, downstream, and recycling. V is the set of nodes representing all countries (regions); E is the set of edges representing trade relationships among countries (regions); W is the function set of trade volumes between countries (regions); W is the function set of trade closeness between countries (regions); and T represents the year.
In this study, trade volume (in kilograms) rather than trade value (in US dollars) is chosen as one of the edge weights to avoid uncertainties arising from inflation and price fluctuations, thereby more authentically revealing trade relationships and dependencies with in the supply chain, which is crucial for analyzing network resilience evolution.
Additionally, trade closeness is incorporated as another edge weight to explore its impact on the shortest path length. In weighted networks, the path length is not only related to the number of connecting edges but also to the weight of trade closeness. Generally, the larger the trade volume between countries (regions), the lower the transaction costs, the closer the trade ties, leading to a smaller trade closeness weight and a shorter shortest pathlength. The specific calculation formula is:
w i j = 1 + ln M a x ( w i j ) ln w i j
where   w i j represents the trade closeness between country (region) I and j; M a x ( w i j ) is the maximum trade volume among all edges in the network; and w i j is the trade volume of wood forest products between country (region) i and j.
From the above formula, in the global wood forest products trade network, the edge with the maximum trade volume has a trade closeness weight of 1, while other edges have trade closeness weights greater than “1”. In reality, trade closeness is undoubtedly influenced by more complex factors, such as political relations, geographical locations, cultural differences, and numerous other difficult-to-quantify factors. However, within the specific analytical framework of this study, we focus solely on trade volume as the core factor.

2.2.2. Related Indicators of Network Structural Resilience

Network structural resilience refers to the ability of a network to maintain its overall functionality and continuous operation in the face of failures, attacks, or disruptions. Drawing on existing research [43,44] and innovatively incorporating trade volume and trade closeness weights, this study measures the structural resilience of the weighted network from four aspects: transitivity, clustering, hierarchy, and assortativity.
(1) Transitivity – Weighted Global Efficiency
Weighted global efficiency refers to the average of the reciprocals of the weighted shortest path lengths between all node pairs in the network, reflecting the speed and capacity of information transmission throughout the network. Based on existing research [43], the calculation formula for weighted global efficiency is:
E w ' = 1 N N 1 i j 1 d w ' i j
where E w represents the weighted (trade closeness) global efficiency; N is the total number of nodes in the network; and d w i j is the weighted shortest path between nodes i and j.
In the global wood forest products trade network, a high weighted global efficiency indicates the presence of more redundant paths and backup mechanisms to with stand potential failures or shocks. Conversely, a low weighted global efficiency suggests vulnerability due to uneven trade volume distribution or poor network connectivity, making it susceptible to difficulties when faced with disruptions.
(2) Clustering - Weighted Average Clustering Coefficient
The weighted average clustering coefficient is the arithmetic mean of the weighted clustering coefficients of all nodes in the network. It reflects the intensity of tight clustering among nodes based on trade volumes. According to existing research findings [43], this coefficient is calculated by taking the ratio of the total actual trade volumes among a country’s (or region’s) direct trading neighbors to the theoretical maximum possible trade volumes among those neighbors, and then averaging these ratios across all nodes. The formula is as follows:
C w i = 1 k i ( k i 1 ) M a x ( w i j ) s t s , t   i s   a d j a c e n t   t o   i d w s t
C w = 1 N i = 1 N C w i
where C w i represents the weighted (trade volume) clustering coefficient of node i; d w s t represents the trade volume between node s and node t; k i represents the degree of node i ; M a x ( w i j ) represents the maximum edge trade volume; C w represents the weighted average clustering coefficient.
In the global wood product trade network, a high weighted average clustering coefficient indicates that nodes tend to form closely connected clusters, with frequent trade and tight cooperation within these clusters. This results in good local connectivity and stability, enhancing the resilience and robustness of the local network.
(3) Hierarchy - Weighted Degree Distribution
Hierarchy is measured through the network’s degree distribution index [44]. Weighted degree distribution refers to the probability distribution of node degrees, considering trade volumes as weights. The larger the absolute value of the slope of the weighted degree distribution, the more significant the hierarchy in terms of weighted degrees among nodes. For the wood product trade network, a power-law curve is plotted using the weighted (trade volume) degree of nodes against their rank (where nodes are ordered by degree from largest to smallest). The formula is as follows:
w i = C ( w i * ) α
l n w i = l n C + α l n w i *
where w i represents the weighted (trade volume) degree of node i in the network; w i * represents the ranking of node i’s weighted degree among all weighted node degrees; C is a proportional constant; α is the slope of the weighted degree distribution curve, measuring the hierarchical nature of the network.
In the wood product trade network, a larger span of node weighted degree rankings implies a higher level of hierarchy, indicating the presence of one or more core nodes forming a centralized network structure. This structure enhances the network’s “robustness,” fostering cohesion and competitiveness. However, it may also lead to path dependencies among non-core nodes, thereby increasing the network’s “vulnerability.” In contrast, networks with lower hierarchy have lower risk sensitivity but lack cohesion, organization, and competitiveness.
(4) Assortativity – Weighted Assortativity Coefficient
The assortativity coefficient is a Pearson correlation coefficient based on “degree,” used to measure the relationship between connected node pairs [45]. The weighted assortativity coefficient refers to the tendency of countries (regions) in the network to connect with countries (regions) of similar total trade volumes, taking into account the trade volume weighting. The assortativity coefficient ranges from -1 to 1. If the assortativity coefficient is positive, it indicates an assortative network, where hub countries (regions) are more likely to connect with each other, exhibiting a polarization effect. Conversely, if the assortativity coefficient is negative, it represents a disassortative network, where hubs tend to establish trade relations with countries (regions) of lower total trade volumes, exhibiting a trickledown effect [42]. If the assortativity coefficient is zero, it signifies that there is no significant correlation in total trade volumes between interacting countries (regions). The formula for calculating the weighted assortativity coefficient is as follows [46]:
r ω = H 1 i ω i ( j i k i ) H 1 i 1 2 ω i ( j i + k i ) 2 H 1 i 1 2 ω i ( j i 2 + k i 2 ) H 1 i 1 2 ω i ( j i + k i ) 2
where   r ω represents the weighted (trade volume) assortativity, where j i and   k i   are the degrees of nodes j and k connected by the i-th edge, ω i   represents the trade volume weightof the i-th edge, and H = i ω i is the sum of the trade volume weights of all edges.
In the global wood forest products trade network, an assortative network strengthens connections among hub countries (regions), providing stability and rapid recovery capabilities, but may hinder cross-community information flow, limiting responsiveness. In contrast, a disassortative network facilitates information exchange and resource sharing between hub and peripheral countries (regions), dispersing risks, enhancing diversity and adaptability, but may lead to over-reliance on a few hub countries (regions) or connections, affecting network stability and resilience.

2.2.3. Indicators Related to Node Resilience in Networks

Node resilience is a multidimensional and comprehensive concept that encapsulates not only a node’s self-recovery and anti-interference capabilities in the face of failures, attacks, or disruptions but also its role and effectiveness in risk propagation within the network. Based on existing research [33], this study comprehensively assesses node resilience from three major aspects: node strength, transit efficiency, and diffusion influence, innovatively incorporating weighted factors such as trade volume and trade intimacy to portray nodes’ resilience more comprehensively in the network.
(1)Node Strength – Weighted Degree
Node strength, also known as weighted degree, represents the total trade volume between a country (or region) and all its direct trading partners within a given time period. In the directed global trade network of wood forest products, it is further classified into weighted out-degree and weighted in-degree, with the formulas as follows [47]:
W i o u t = j = 1 N t a i j t w i j  
W i i n = j = 1 N t a j i t w j i  
where W i o u t represents the weighted out-degree of node i ; W i i n represents the weighted in-degree of node i; w i j represents the trade volume from node i to node j; w j i represents the trade volume from node j to node i; both a i j   and a j i   indicate the trade relationship betweenthe two nodes.
In the global trade network of wood forest products, countries (or regions) with high node strength establish strong connections with multiple other countries, enhancing their redundancy and flexibility. This facilitates swift response and recovery from external disturbances, strengthening their resilience. During random attacks, these high-strength nodes rely on their stronger anti-interference and recovery capabilities to mitigate impacts while maintaining stable trade activities to support other nodes. However, under targeted attacks, their central positions in the network may render them more vulnerable, accelerating risk propagation and exacerbating the overall network’s exposure.
(2) Transit Capability – Weighted Betweenness Centrality
Transit capability is characterized by weighted betweenness centrality [33], which measures the extent to which a country (or region) lies on the weighted shortest paths between other trading pairs, evaluating its importance and influence in the network from a “bridge” perspective. The formula is as follows:
B C w i = s i t n w s t i g w s t  
where B C w i   represents the weighted (trade closeness) betweenness centrality of node i; g w s t is the number of weighted shortest paths from node s to node t, and n w s t i   is the number of weighted shortest paths among the g w s t weighted shortest paths from node s to node t that pass through node i.
In the global trade network, countries with high weighted betweenness centrality, due to their direct trade links with multiple countries, form multiple redundant paths. This allows them to maintain trade via alternative routes during random disruptions, demonstrating strong anti-interference ability. However, targeted attacks on these transit hubs can disrupt critical network pathways, impeding information and resource flows, potentially triggering cascading failures and network collapse.
(3) Diffusion Capability – Weighted Closeness Centrality
Diffusion capability is represented by weighted closeness centrality, which considers the reciprocal of the sum of weighted shortest path lengths from a node to all other nodes in the network, incorporating trade intimacy [47]. A higher value indicates closer trade relations with other nodes, enabling faster information or resource dissemination. The formula is as follows:
C C w ' i = 1 d w ' i = N j = 1 N d w i j
where C C w i represents the weighted (trade tightness) closeness centrality of node i; N represents the total number of nodes in the network; d w i represents the weighted shortest path length from node i to node j; j = 1 N d w i j represents the sum of the weighted shortest paths from node i to all other nodes in the network.
In the global trade network of wood forest products, countries (or regions) with high weighted closeness centrality exhibit strong market influence, bargaining power, and risk diversification strategies due to their extensive and intimate trade connections. These enable them to rapidly acquire and disseminate information, effectively integrate and allocate resources. Under random disturbances, nodes with high weighted closeness centrality, owing to their positional advantages, can swiftly receive and transmit information, respond promptly, and maintain stable operation, ensuring network connectivity and information transmission efficiency. Random interference is unlikely to simultaneously target multiple such nodes. However, under deliberate attacks, the failure of these highly diffusive nodes can lead to information silos, impeding information transmission speed and efficiency, potentially causing a significant decline in network connectivity, thereby affecting overall network functionality and stability.

2.2.4. Data Sources and Data Processing

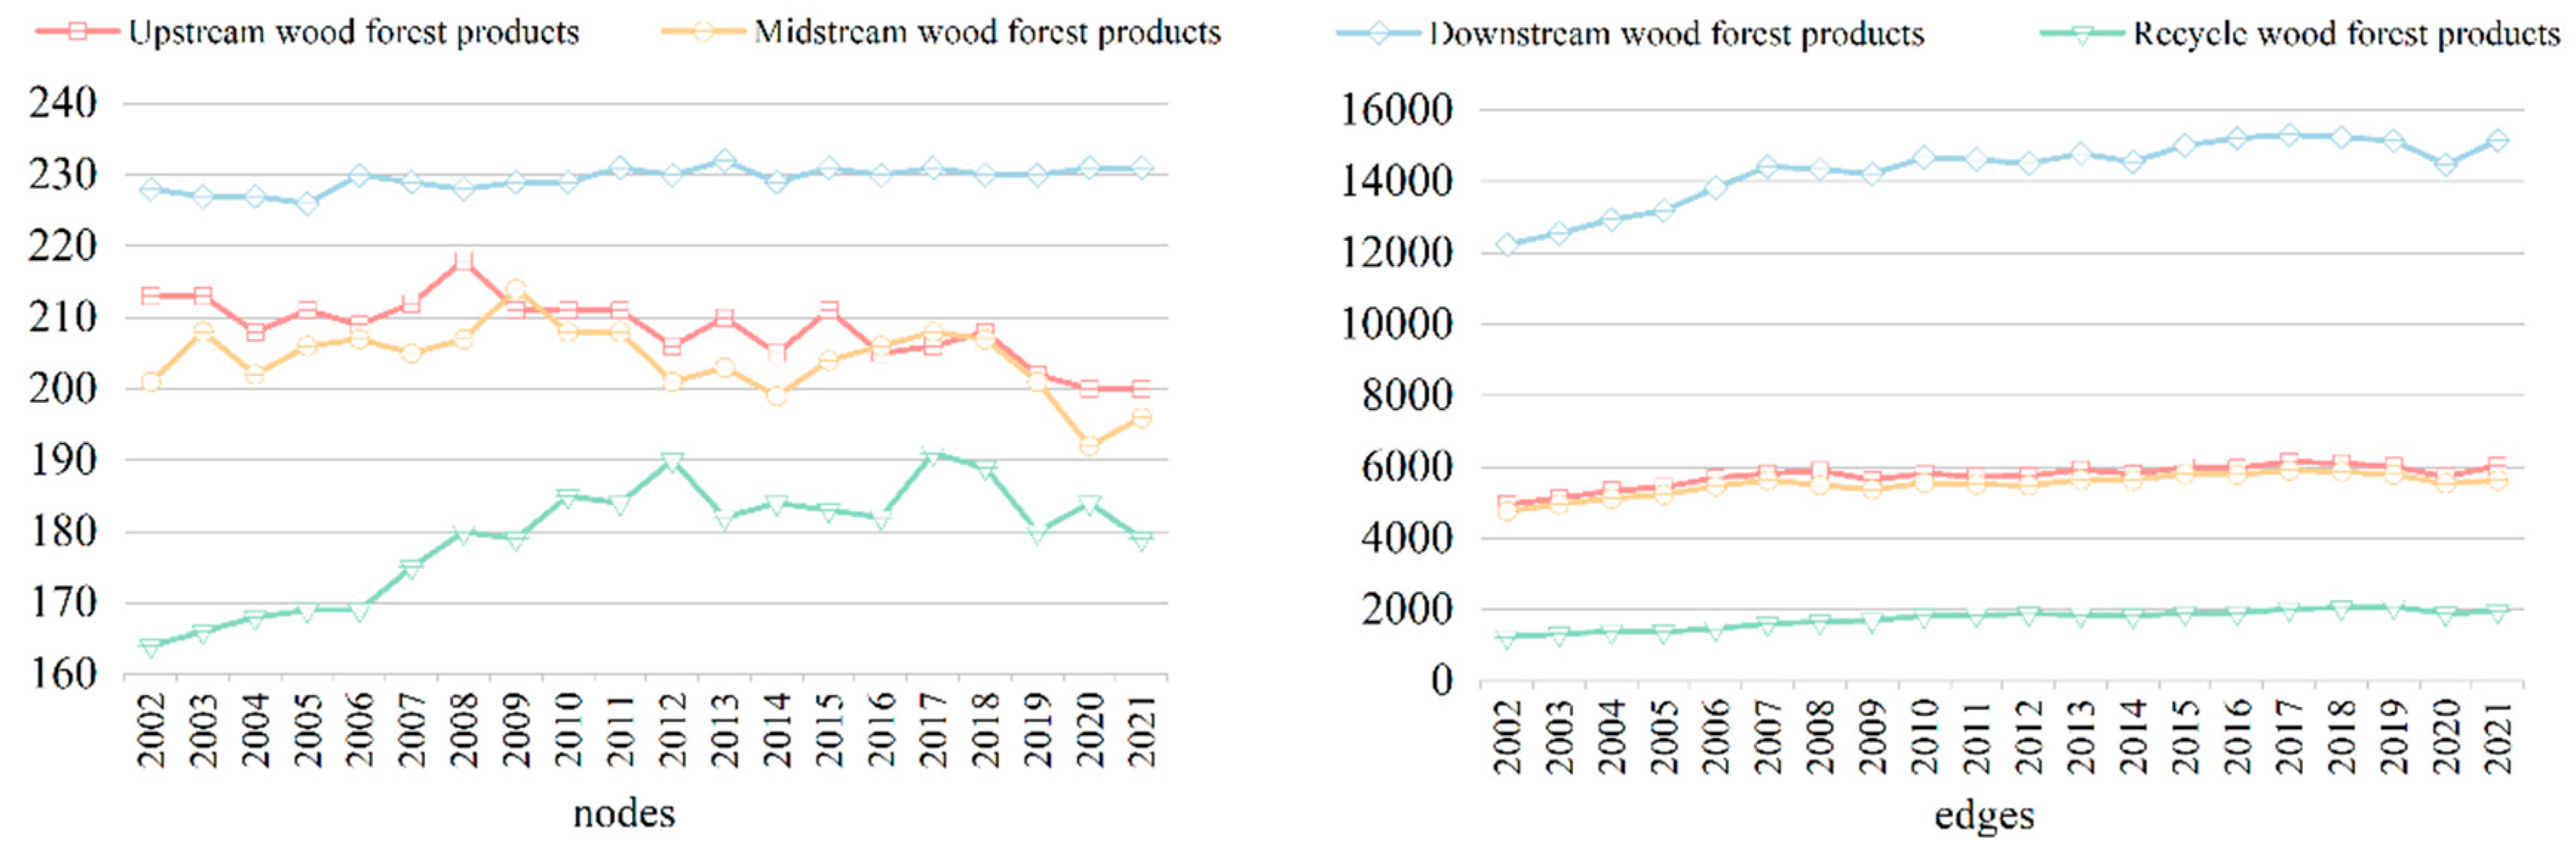
This study utilizes data spanning from 2002 to 2021 sourced from the UN Comtrade Database, covering over 2 million trade records between 231 countries (and regions) globally. Given data consistency concerns, the study adopts import-based data for analysis [33,38,48], and addresses issues such as missing data, regional consolidation (merging data from Hong Kong and Macao, China, into China, excluding Taiwan, China), and trade relationship thresholds (setting a $50 threshold, ignoring trade relationships below this value). Ultimately, the inter-country trade data is classified and summed based on four categories: upstream, midstream, downstream, and recycling, resulting in the data sets presented in Figure 3.
In the following sections, we will leverage a network static resilience evaluation index system and employ Python computer simulation techniques to measure and visualize the static resilience of the global trade network of wood forest products.

3. Results Analysis

3.1. Overall Characteristics of the Global Trade Network for Wood Forest Products

3.1.1. Temporal Changes in Trade Scale

This paper statistics the overall changes in the trade volume and value of upstream, midstream, downstream, and recycled wood forest products from 2002 to 2021 (Figure 4). Upstream wood forest products have a large international supply trade volume but a low unit price, accounting for the largest proportion of trade volume, exceeding half of the total, yet their share of trade value is only about 1/4. Downstream wood forest products have a large trade value and a high unit price, accounting for nearly 3/5 of the total trade value, but only 1/4 of the total trade volume. The following analysis primarily focuses on trade volume to analyze the global trade network for wood forest products.
From the perspective of changes in international trade volume, the total trade volume of upstream, midstream, downstream, and recycled wood forest products increased by58.0%, 77.3%, 71.2%, and 77.2% respectively, indicating an overall upward trend in global trade volume for wood forest products from 2002 to 2021. Upstream products experienced the smallest growth, while midstream, downstream, and recycled wood forest products showed significant increases in trade volume. This trend is mainly driven by global and regional policies, environmental pressures, market demands, and supply chain optimization. With the enhancement of environmental awareness, governments have restricted log exports and encouraged domestic wood processing. Meanwhile, changes in market demand structure have led downstream industries to prefer purchasing midstream primary processed products to improve supply chain efficiency and added value. This phenomenon not only reflects the adjustment and optimization of the global wood supply chain but also embodies the balancing strategies of various countries between environmental protection and economic development. The notable upward trend in recycled trade volume reflects the enhancement of environmental awareness, strengthening of policy support, technological advancements, expansion of market demand, and the influence of international trade, which is significant for promoting resource recycling, reducing environmental pollution, and fostering sustainable development.
However, Figure 4 shows a significant drop in data for 2009, 2015, and 2020, mainly attributed to global economic fluctuations and external shocks. After the 2008 financial crisis, market demand plummeted in 2009, hindering exports. In 2015, the slowdown in global economic growth and internal industry issues impacted global trade volume. The COVID-19 pandemic in 2020 caused the global economy to stagnate, supply chains to disrupt, demand to plummet, and exports to suffer severely. These events reveal the inadequacy of the global trade network for wood forest products in the face of external shocks, highlighting the need to strengthen its resilience and robustness to withstand future risks and challenges.

3.1.2. Network Topology

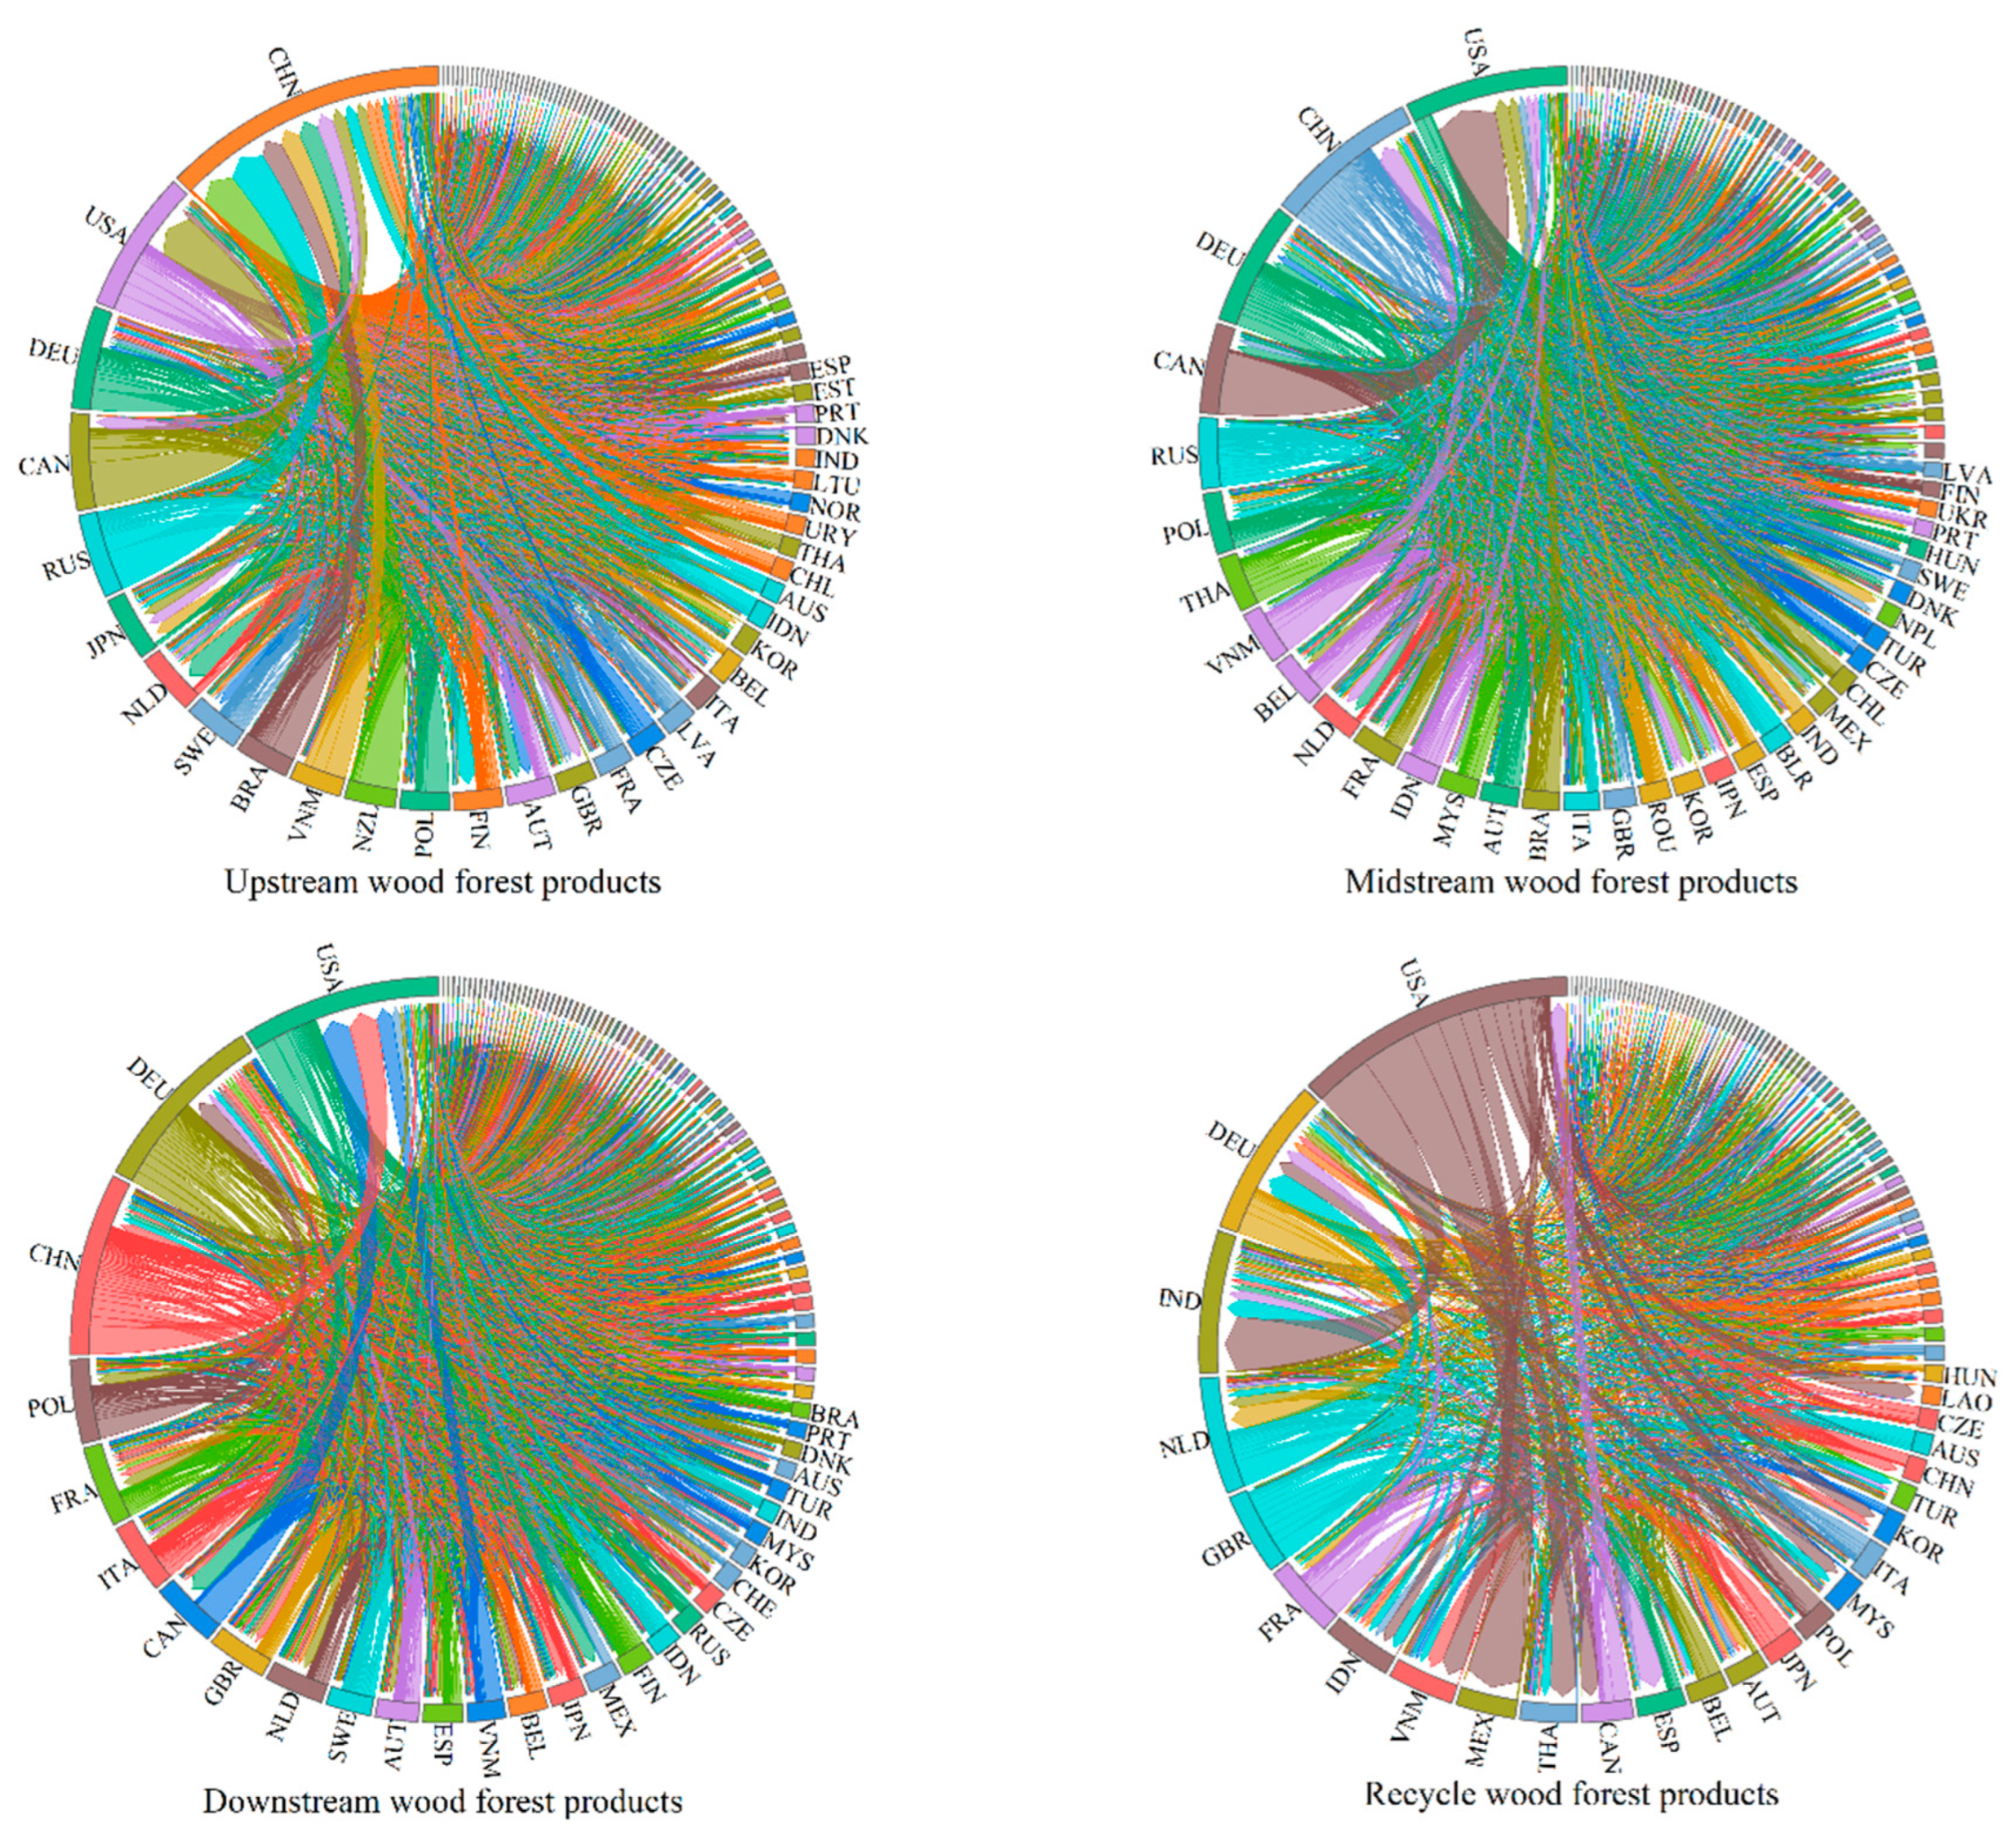
To clearly illustrate the structure of the global trade network for wood forest products in 2021, this paper employs chord diagrams to visualize the trade characteristics of four types of networks (Figure 5). The thickness of the arcs in the diagram represents the trade volume between countries (regions), and the arrows indicate the direction of trade. The wood forest products in different supply chain segments exhibit differentiated trade patterns among various countries (regions), reflecting differences in market activity, trade relationships, and network equilibrium. In terms of network density, the downstream segment is the highest, followed by the upstream and midstream segments, while there cycling segment is the lowest. In terms of trade scale, the upstream and recycling networks exhibit significantly higher polarization than the midstream and downstream networks.
In the upstream network, China, the United States, Germany, Canada, and Russia serve as core countries, with their combined trade volume accounting for nearly 1/3 of the total upstream trade volume, highlighting the uneven distribution of global wood product resources. As a major importer of timber, China has integrated global supply chain resources and established long-term cooperative relationships with countries rich in forest resources, forming a stable trade chain that has effectively enhanced its dominant position in the international market and node resilience.
The midstream network is dominated by wood panels, with the United States, Germany, China, and Canada accounting for nearly 1/4 of the global trade volume. These countries are not only important producers and consumers of wood panels but also possess developed manufacturing industries and stable market demand, making the midstream network resilient and capable of strong recovery in the face of external shocks. In the downstream network, the United States, China, and Germany also occupy core positions, with their trade volume accounting for nearly 1/4 of the global total. China’s exports in this segment far exceed its imports, demonstrating the advanced level of its furniture manufacturing industry and its important position in the global market, which has also enhanced the resilience and diversity of the downstream network.
In the recycling network, the United States is the largest exporter of waste paper, benefiting from its mature recycling system and widespread participation from the government and the public. The implementation of China’s “ban on waste imports” has prompted the United States to adjust its export strategy and shift towards countries (regions) such as India and Mexico, testing the adaptability and resilience of the recycling network. In summary, the global trade network for wood forest products exhibits certain resilience characteristics in different segments but also faces challenges such as uneven resource distribution and strong market dependence.

3.2. Evolution of Network Structural Resilience

3.2.1. Network Transitivity and Clustering

From 2002 to 2021, the weighted global efficiency of the global trade network for wood forest products showed significant differences across different segments (Figure 6). The downstream segment had significantly higher global efficiency, indicating its highly efficient transmission performance. Although the recycling network started with a lower base, its steady growth highlights the trend of circular economy and resource-efficient utilization. In terms of trends, both the downstream and recycling networks showed a steady increase in global efficiency. In contrast, while the upstream and midstream networks remained stable, they experienced significant declines during external shocks such as the 2008 financial crisis and the 2020 COVID-19 pandemic, exposing their vulnerability in complex environments.
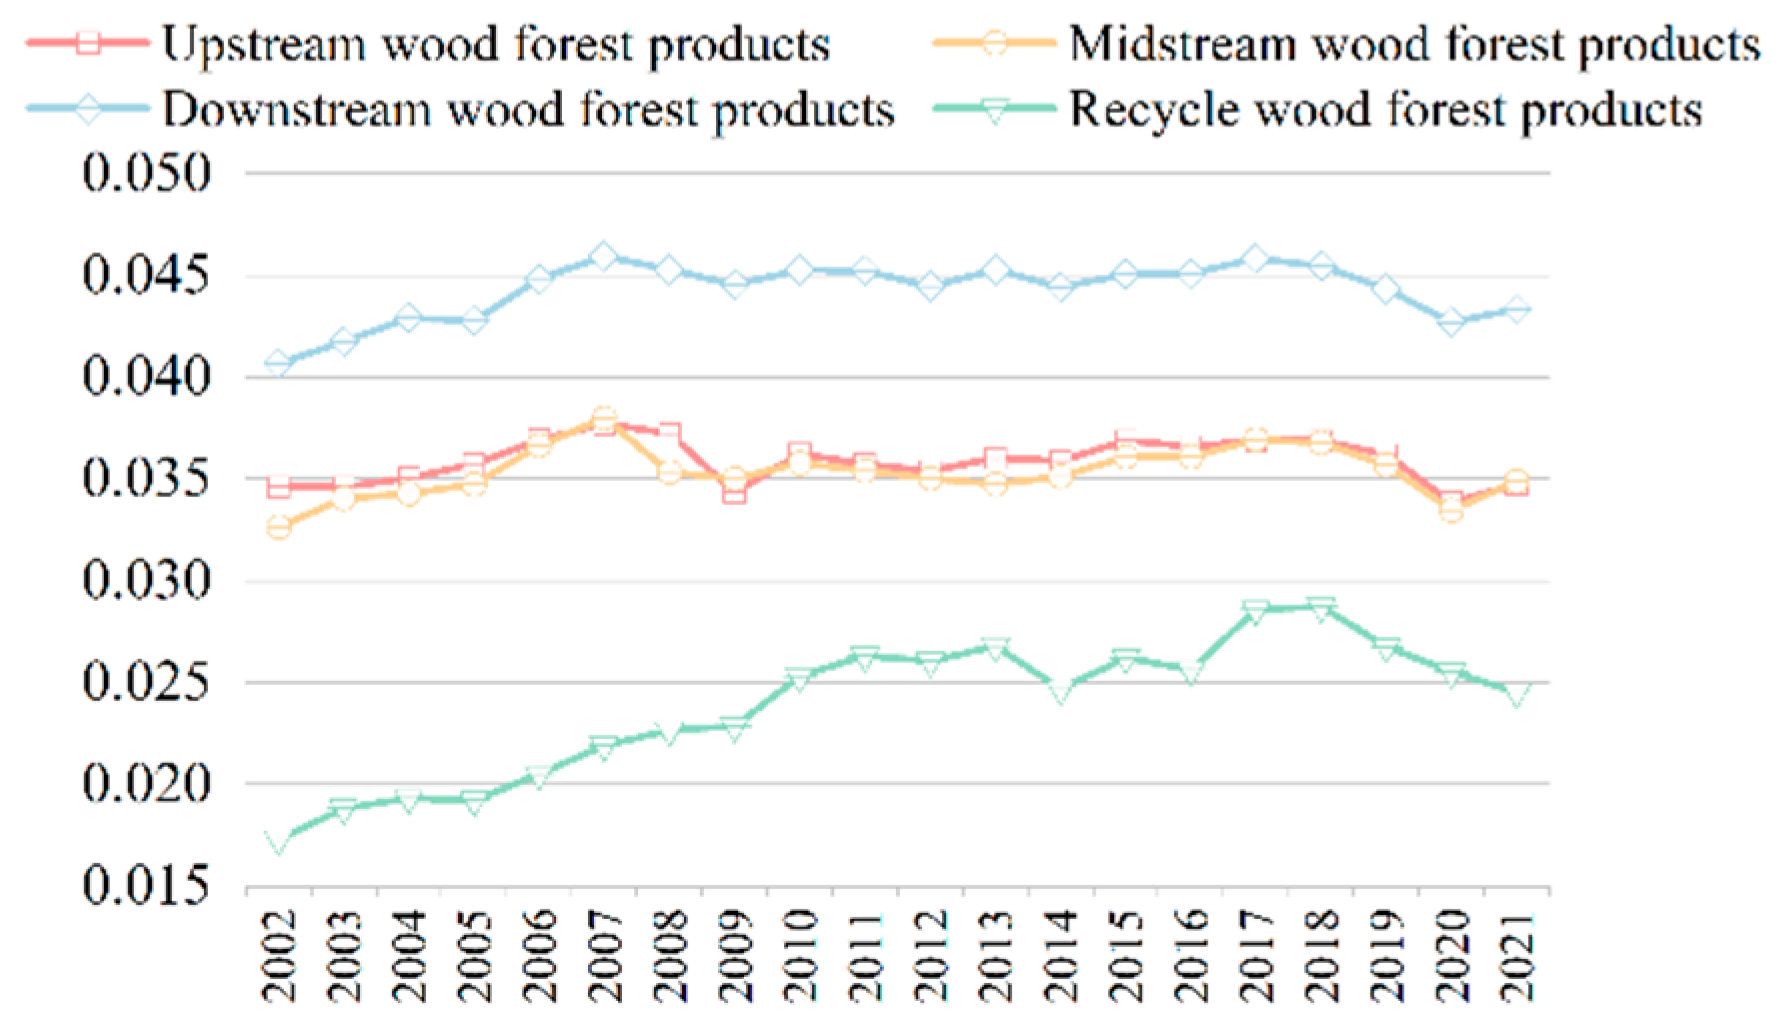
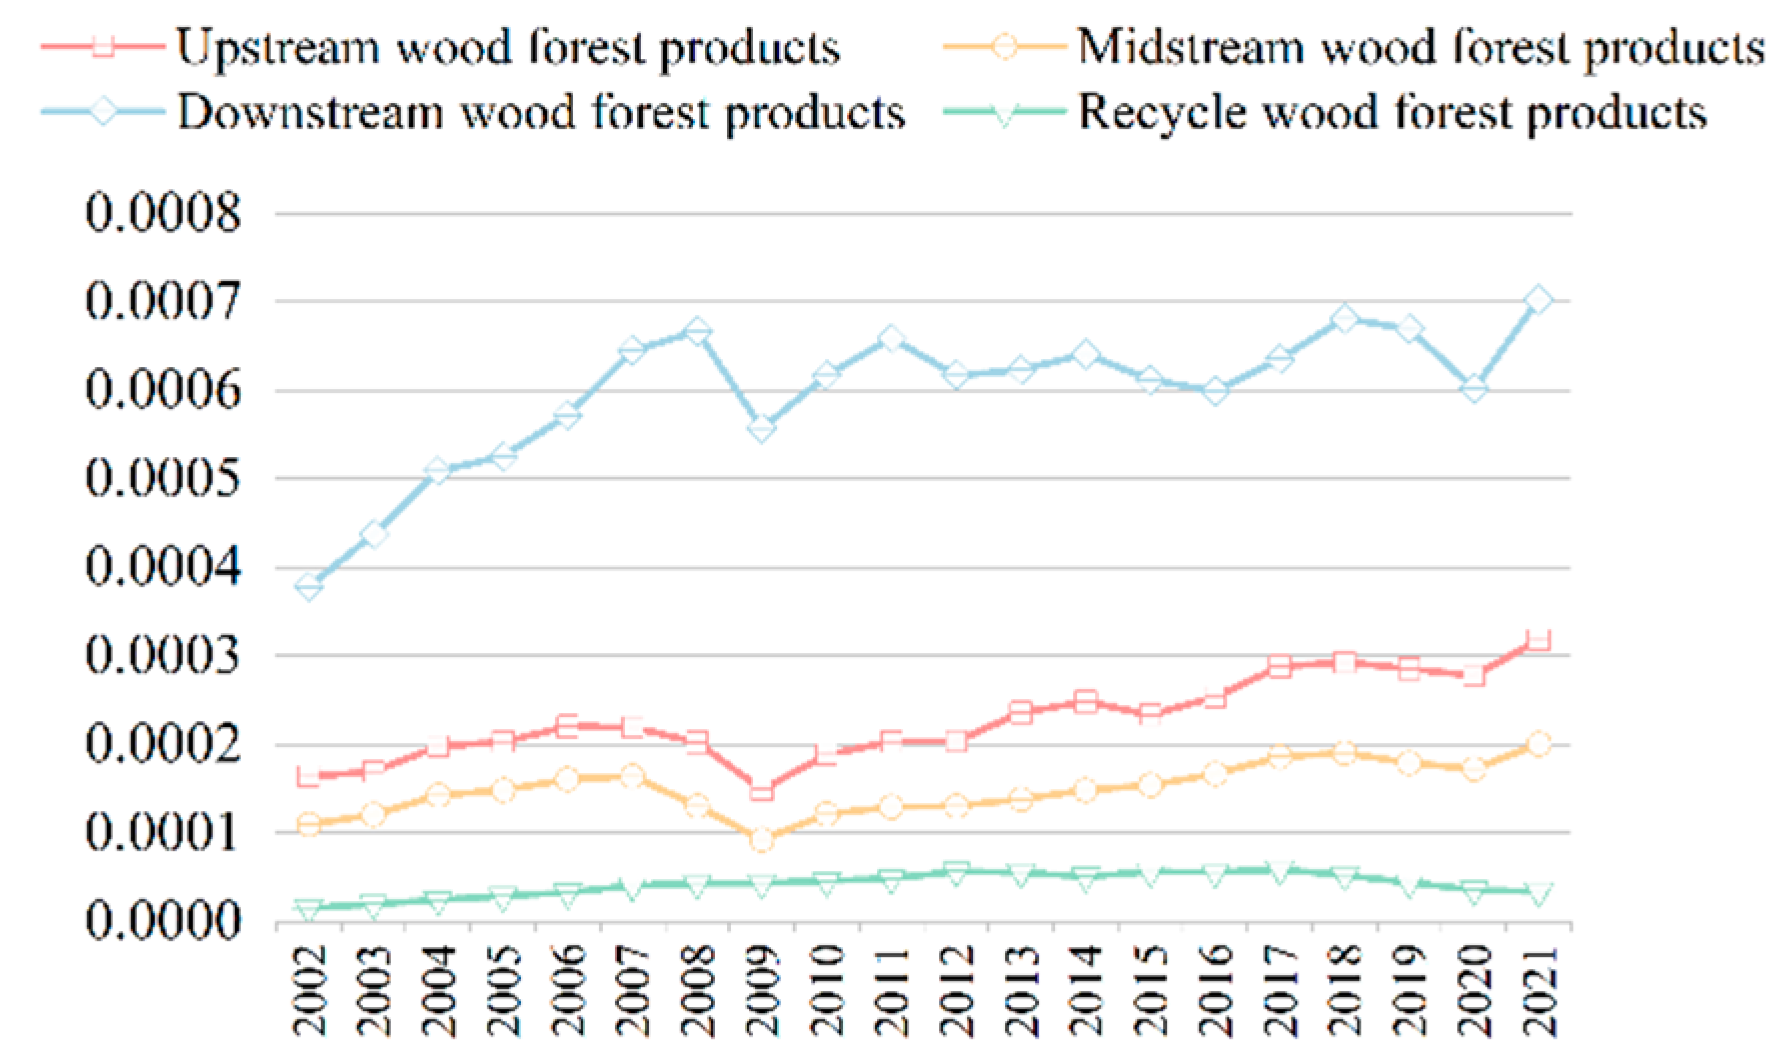
From 2002 to 2021, the downstream network had the highest and continuously increasing weighted average clustering coefficient (Figure 7), indicating that trade connections among countries (regions) for downstream consumer goods became closer, forming highly clustered subgroups. This structure enhances the network’s ability to resist attacks and tolerate faults, thereby improving network resilience. The upstream and midstream networks had relatively moderate average clustering coefficients but showed an upward trend, indicating gradually strengthening network connections and increased clustering. Although the recycling network had a relatively low average clustering coefficient, it showed a slight increase, indicating enhanced connections among countries (regions).

3.2.2. Network Hierarchy

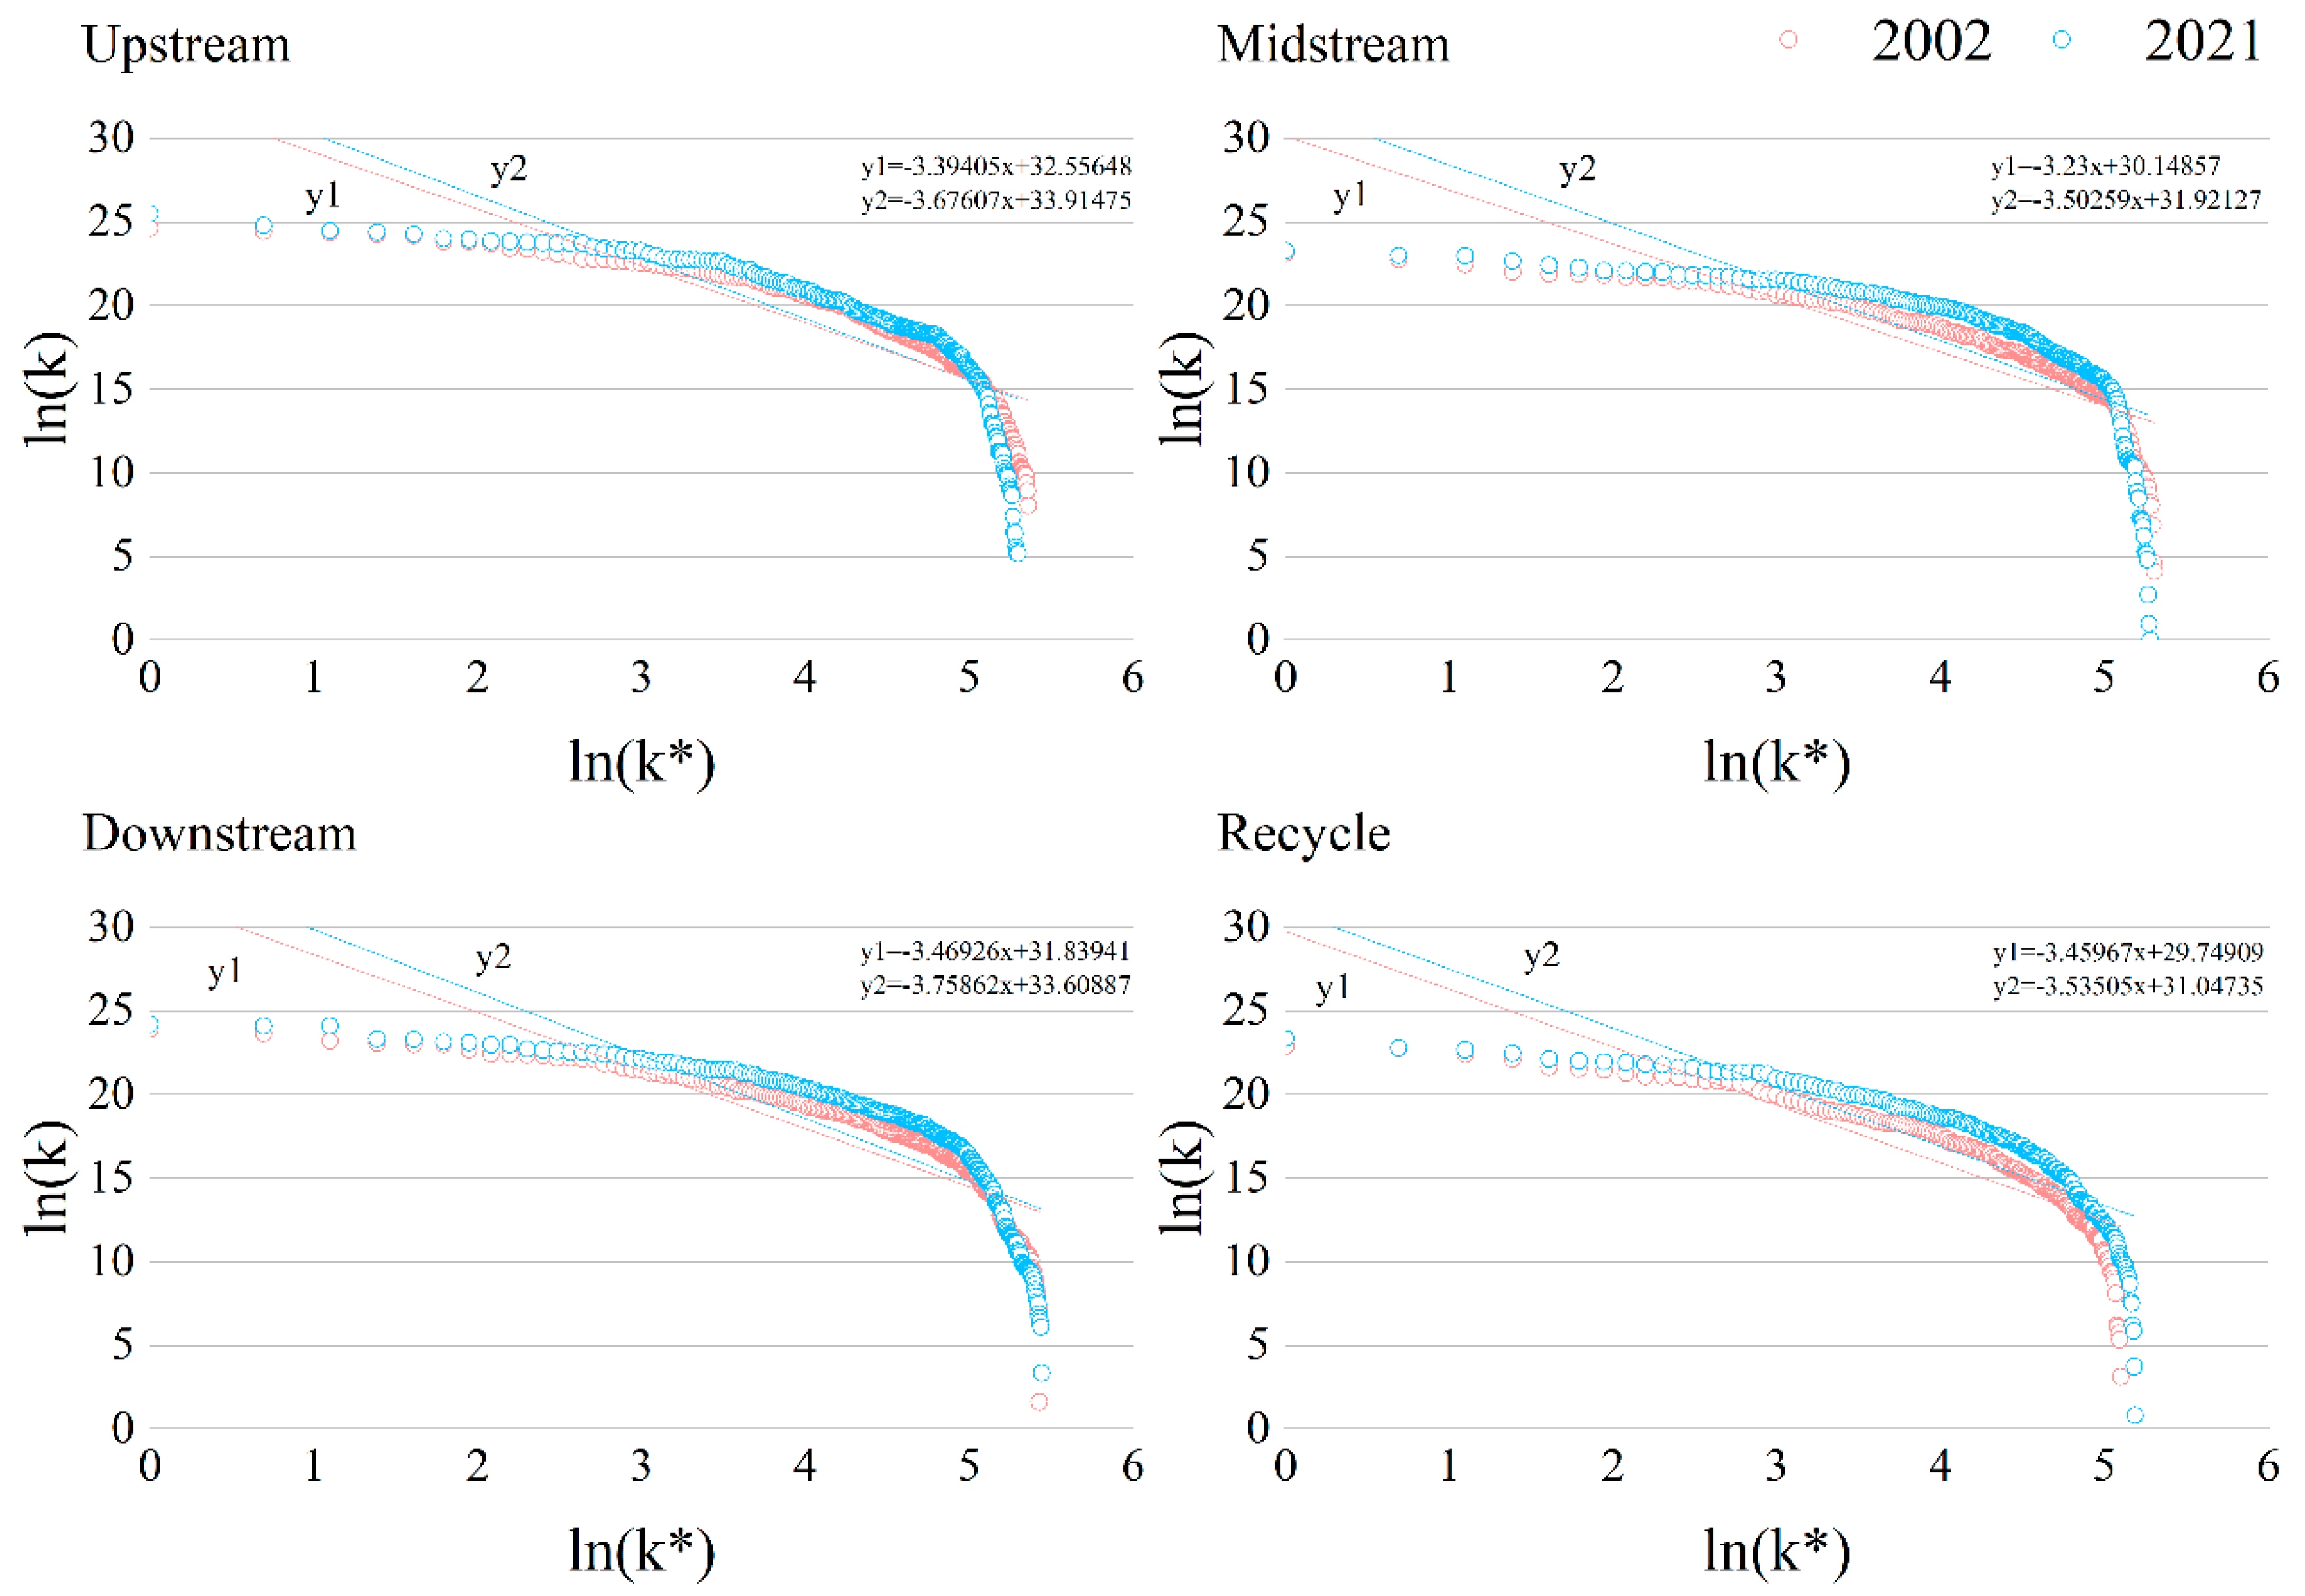
Figure 8 shows that the weighted degree distribution of the wood product trade network follows a power-law distribution in double logarithmic coordinates, exhibiting scale-free network characteristics, where network function is primarily determined by core nodes. A comparison over time shows that while the slope of the fitting curve for the four types of products did not change significantly, the absolute value of the slope in2021 was higher than that in 2002, indicating enhanced hierarchy, increased cohesion and competitiveness of core countries (regions), enhanced robustness of the network to random disturbances, but also correspondingly increased vulnerability to deliberate attacks.
Data from 2021 shows that the absolute values of the curve slopes for the upstream, midstream, downstream, and recycling networks are 1.103, 1.117, 0.827, and 1.186, respectively. This data indicates that the recycling network has the highest hierarchy among the upstream, midstream, downstream, and recycling networks, with prominent core countries such as the United States, Germany, and India, and strong network cohesion. In contrast, the downstream wood product network has the weakest hierarchy and a flat structure, with widely distributed trade connections, which weakens the Matthew effect. The upstream and midstream networks still exhibit relatively high hierarchy, with trade activities and national status concentrated in core countries such as China, the United States, Germany, Canada, and Russia, which have strong economic strength and trade resilience. Diversified trade relationships and close cooperation enhance the stability of the wood product trade network. However, this also means that the failure of core nodes, especially China, may have a significant impact on the network.

3.2.3. Network Matching

To gain a deeper understanding of the matching characteristics of the global trade network for Wood Forest Products, this paper conducted assessments and comparisons of assortativity and weighted assortativity for the four types of networks. Assortativity only considers the number of trade connections between countries (regions), while weighted assortativity further considers the impact of trade volume.
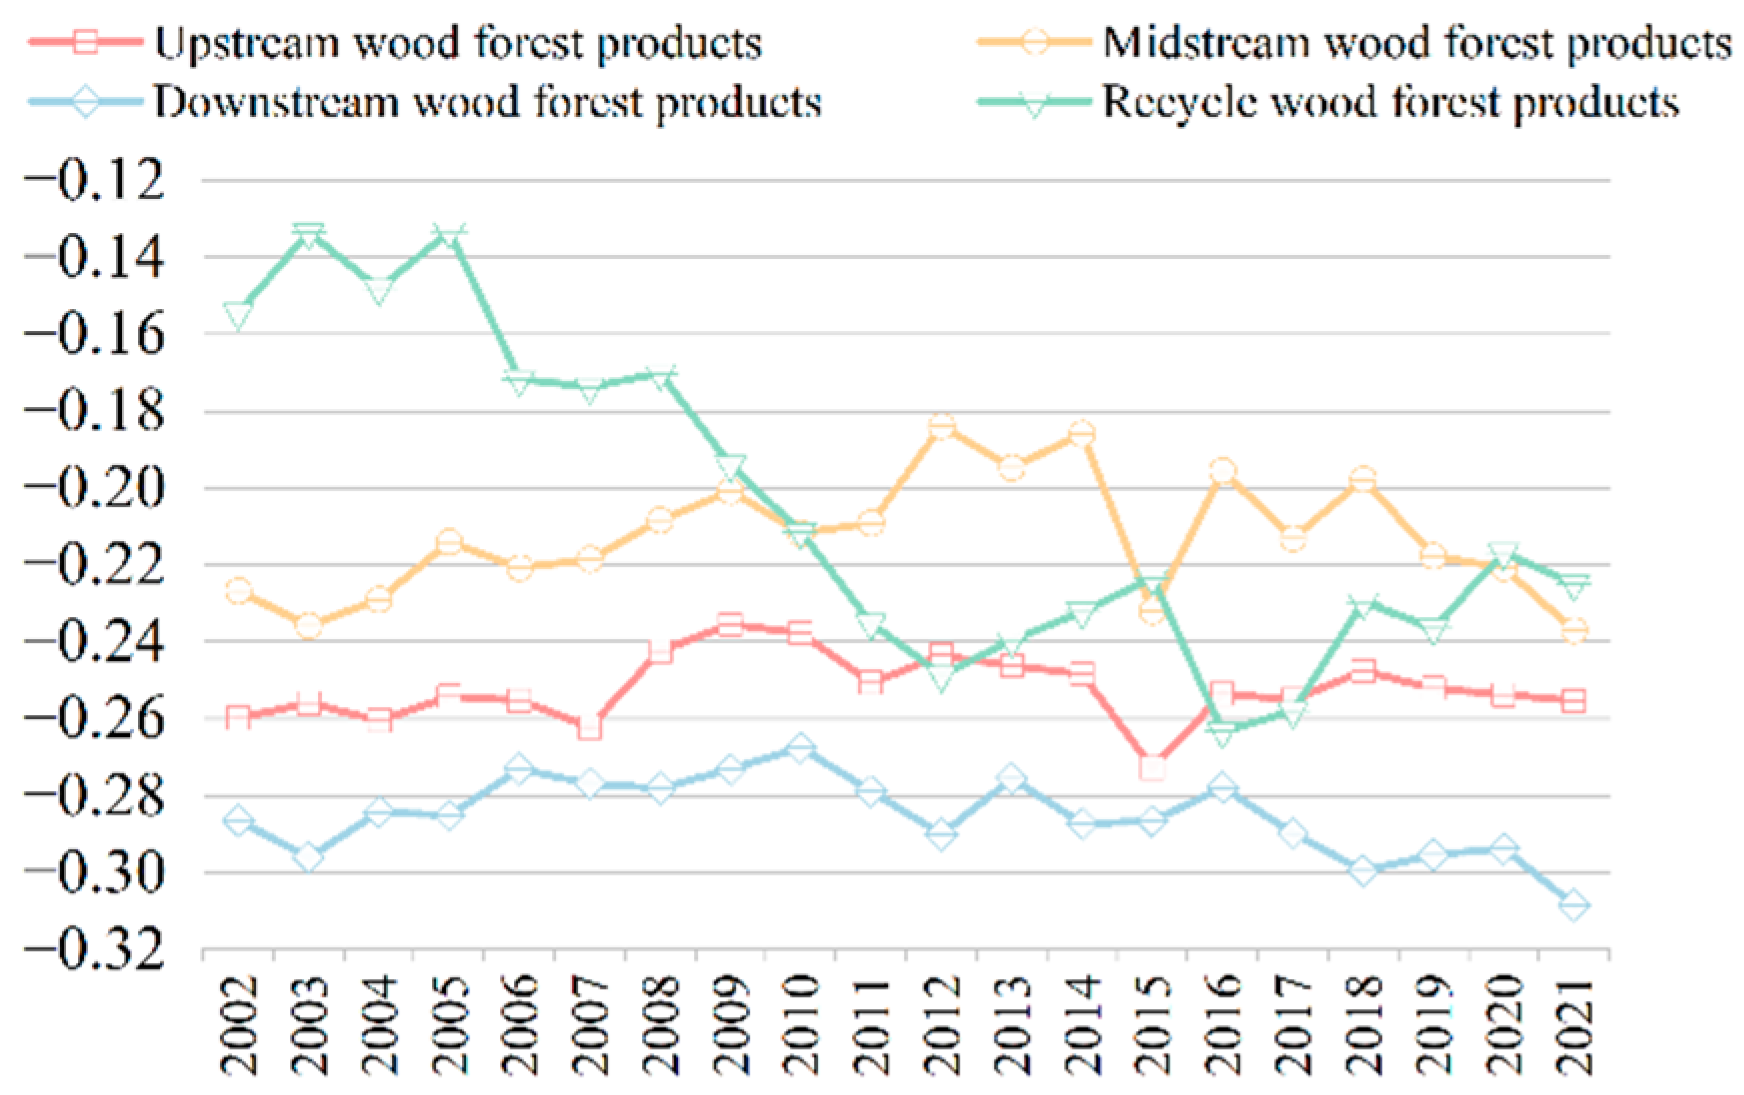
From 2002 to 2021, the assortativity of the four types of wood product trade networks was negative (Figure 9), indicating that the networks have disassortative characteristics, i.e., “small countries (regions) depend on hubs.” This suggests that hub countries (regions)play important intermediary and bridge roles in the trade network, significantly influencing trade flows and resource allocation.
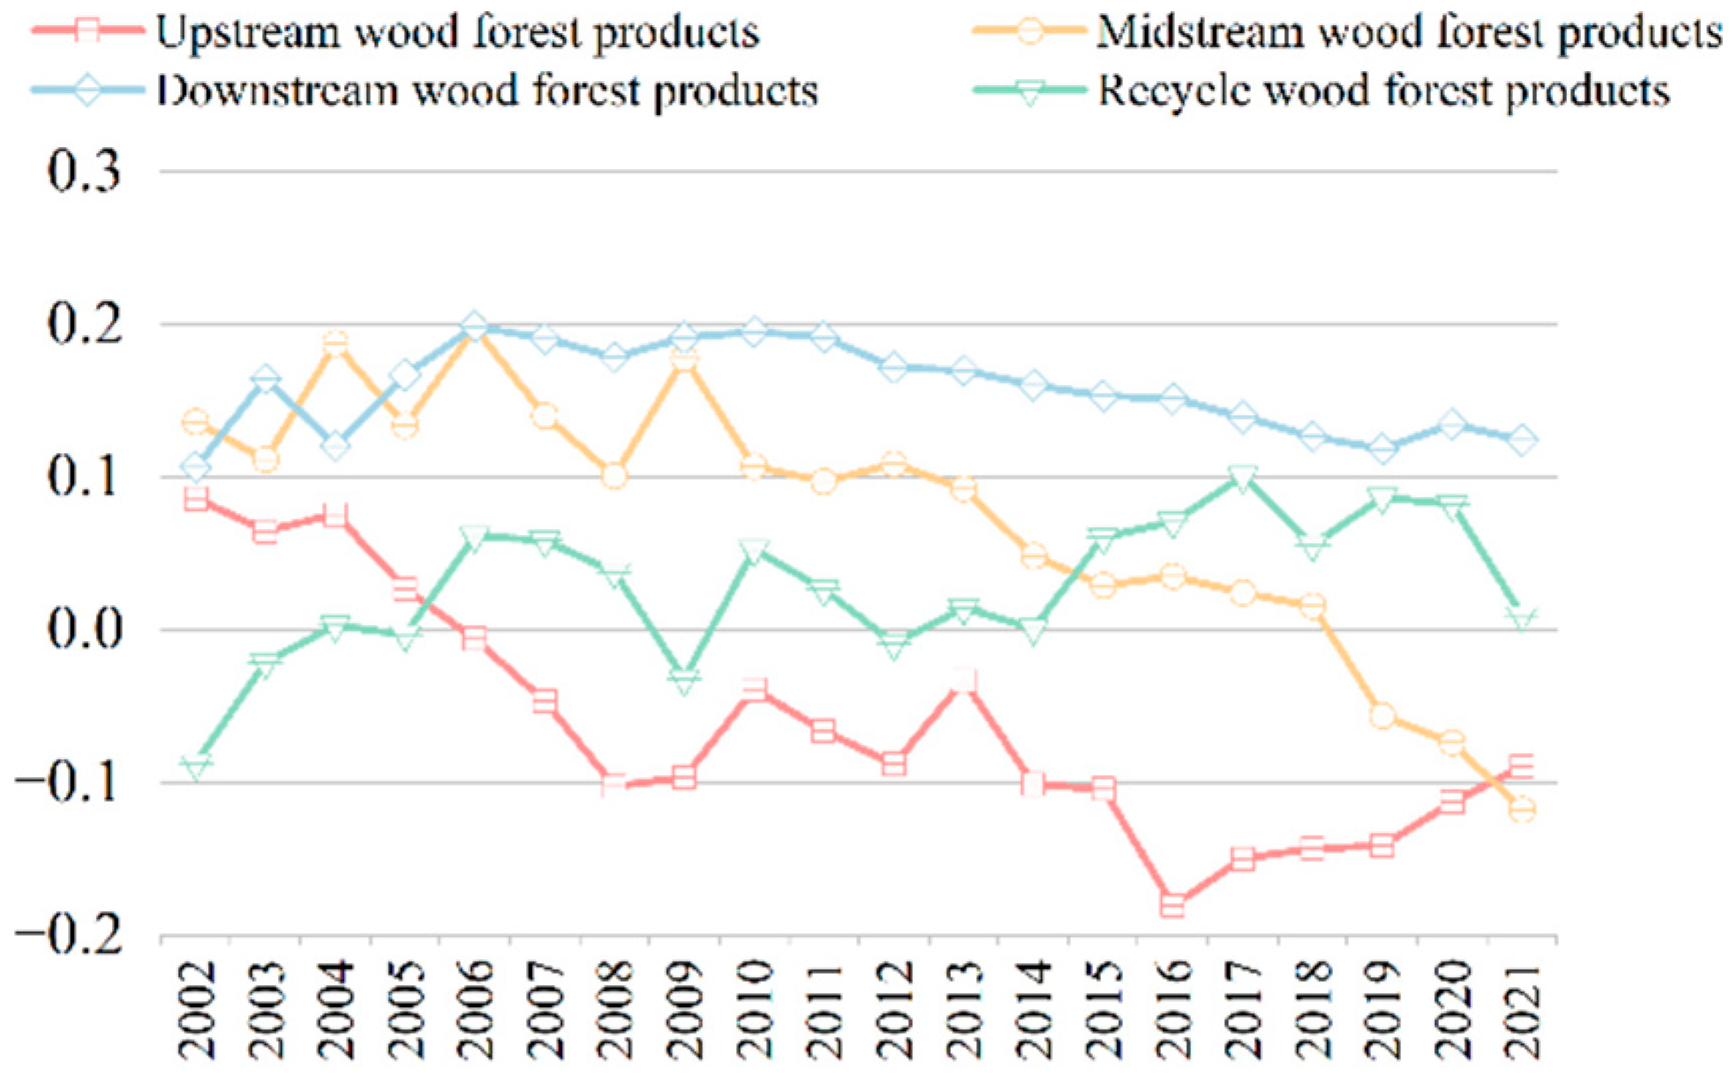
There are significant differences in the evolution of network weighted assortativity and assortativity (Figure 10). The weighted assortativity of the downstream network remains consistently above 0, indicating an assortative network. This suggests that although there is disassortativity in trade connections among hub countries, core countries tend to form closer trade relationships. This close cooperation and frequent interaction facilitate mutual support and enhance network resilience.
The assortativity of the recycling network shows a decreasing trend, while the weighted assortativity shows an increasing trend. This suggests that over the past 20 years, the trade connections of core countries (regions) in the recycling network have exhibited diversification and marginal expansion trends. However, the growth in trade volume between core countries is more significant, with hub countries (regions) strengthening cooperation and interaction with each other. Through resource sharing and risk-sharing mechanisms, they enhance the stability and resilience of the entire recycling network.
The weighted assortativity of the upstream and midstream networks has significantly decreased, transitioning from assortative networks to disassortative networks, indicating the emergence of a trickle-down effect. Hub countries have started to engage in timber trade with more countries (regions). While diversification increases network complexity, it may also diversify risks, enhance adaptability, and strengthen long-term network resilience.

3.3. Evolution of Network Node Resilience

3.3.1. Evolution Trend of Upstream Core Node Resilience

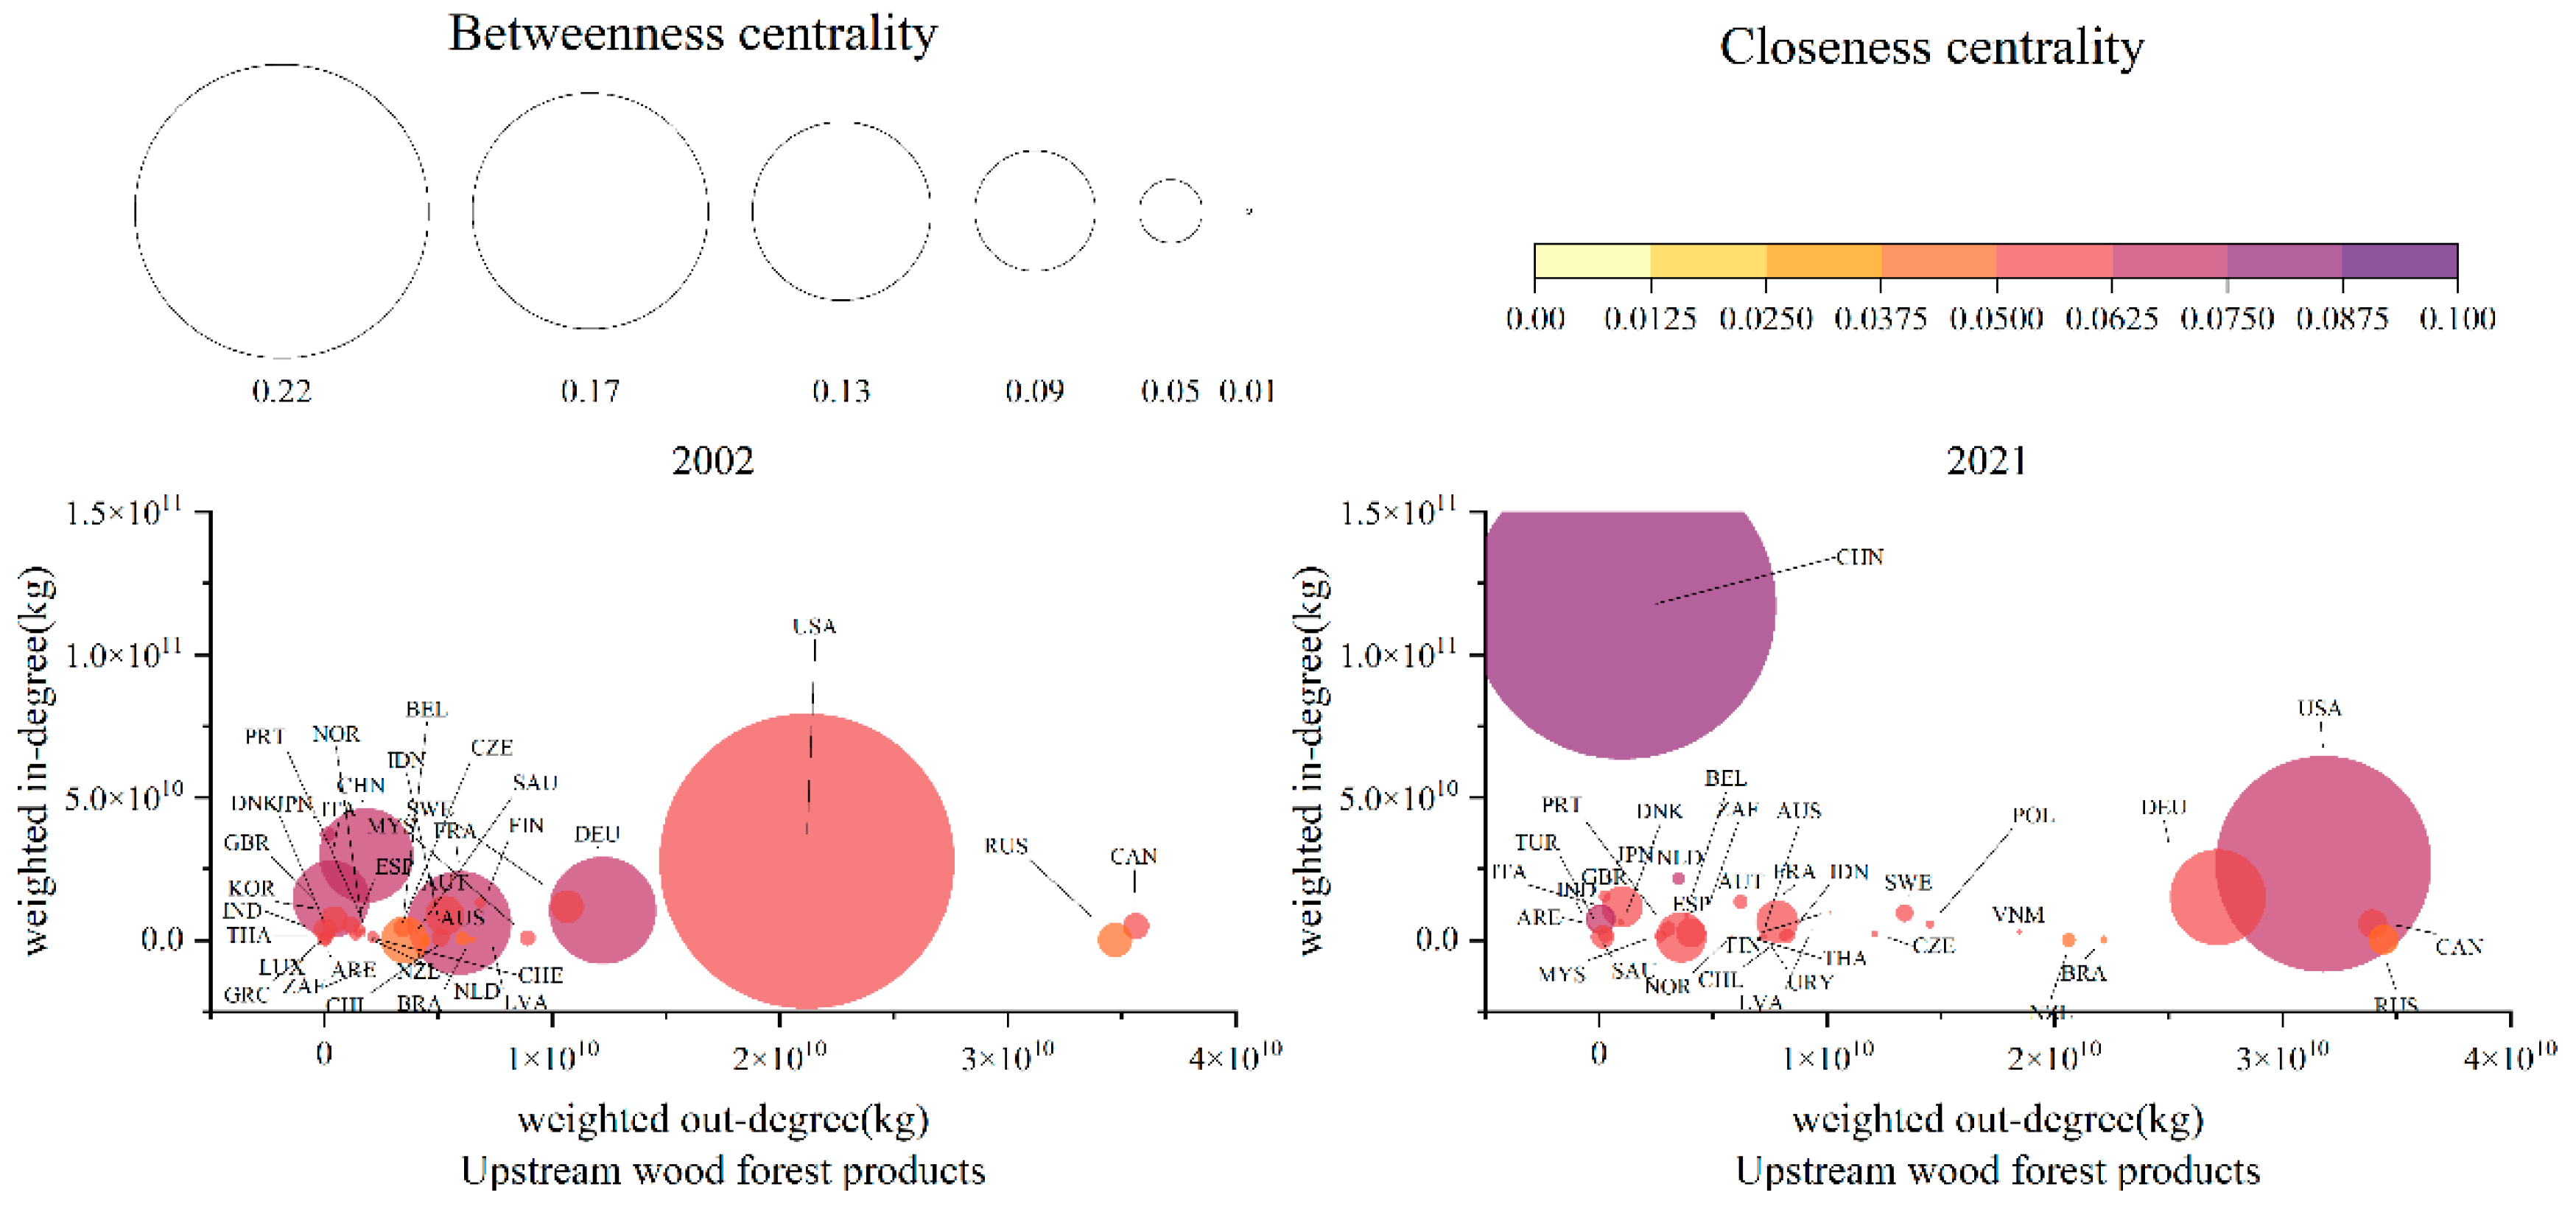
Figure 11 shows that compared to 2002, China has become a superpower in importing upstream wood forest products in 2021, with the highest weighted in-degree, weighted betweenness centrality, and weighted closeness centrality. This indicates that China has a tight supply of upstream timber resources and a high degree of dependence on imports. The rapid development of its manufacturing and construction industries has significantly increased the demand for upstream timber, elevating China’s position in the global trade network for wood forest products. By diversifying its imports to Cope with market fluctuations, China has demonstrated strong resilience and adaptability, consolidating its leading position globally.
From 2002 to 2021, the United States’ weighted closeness centrality in the upstream network has increased, indicating an enhancement in its global trade relationships. However, the decline in its weighted out-degree and betweenness centrality reveals a weakening of its export influence and bridge role, reflecting challenges such as resource constraints, rising costs, and intensified international competition, while also embodying the diversification trend in the global trade network for wood forest products. Russia and Canada remain major exporters of upstream timber, but their intermediary and information dissemination capabilities are relatively weak, and their trade stability and recovery need to be enhanced. Germany’s timber exports have grown significantly, but its information dissemination capability has declined, although its influence remains strong.

3.3.2. Evolution Trend of Midstream Core Node Resilience

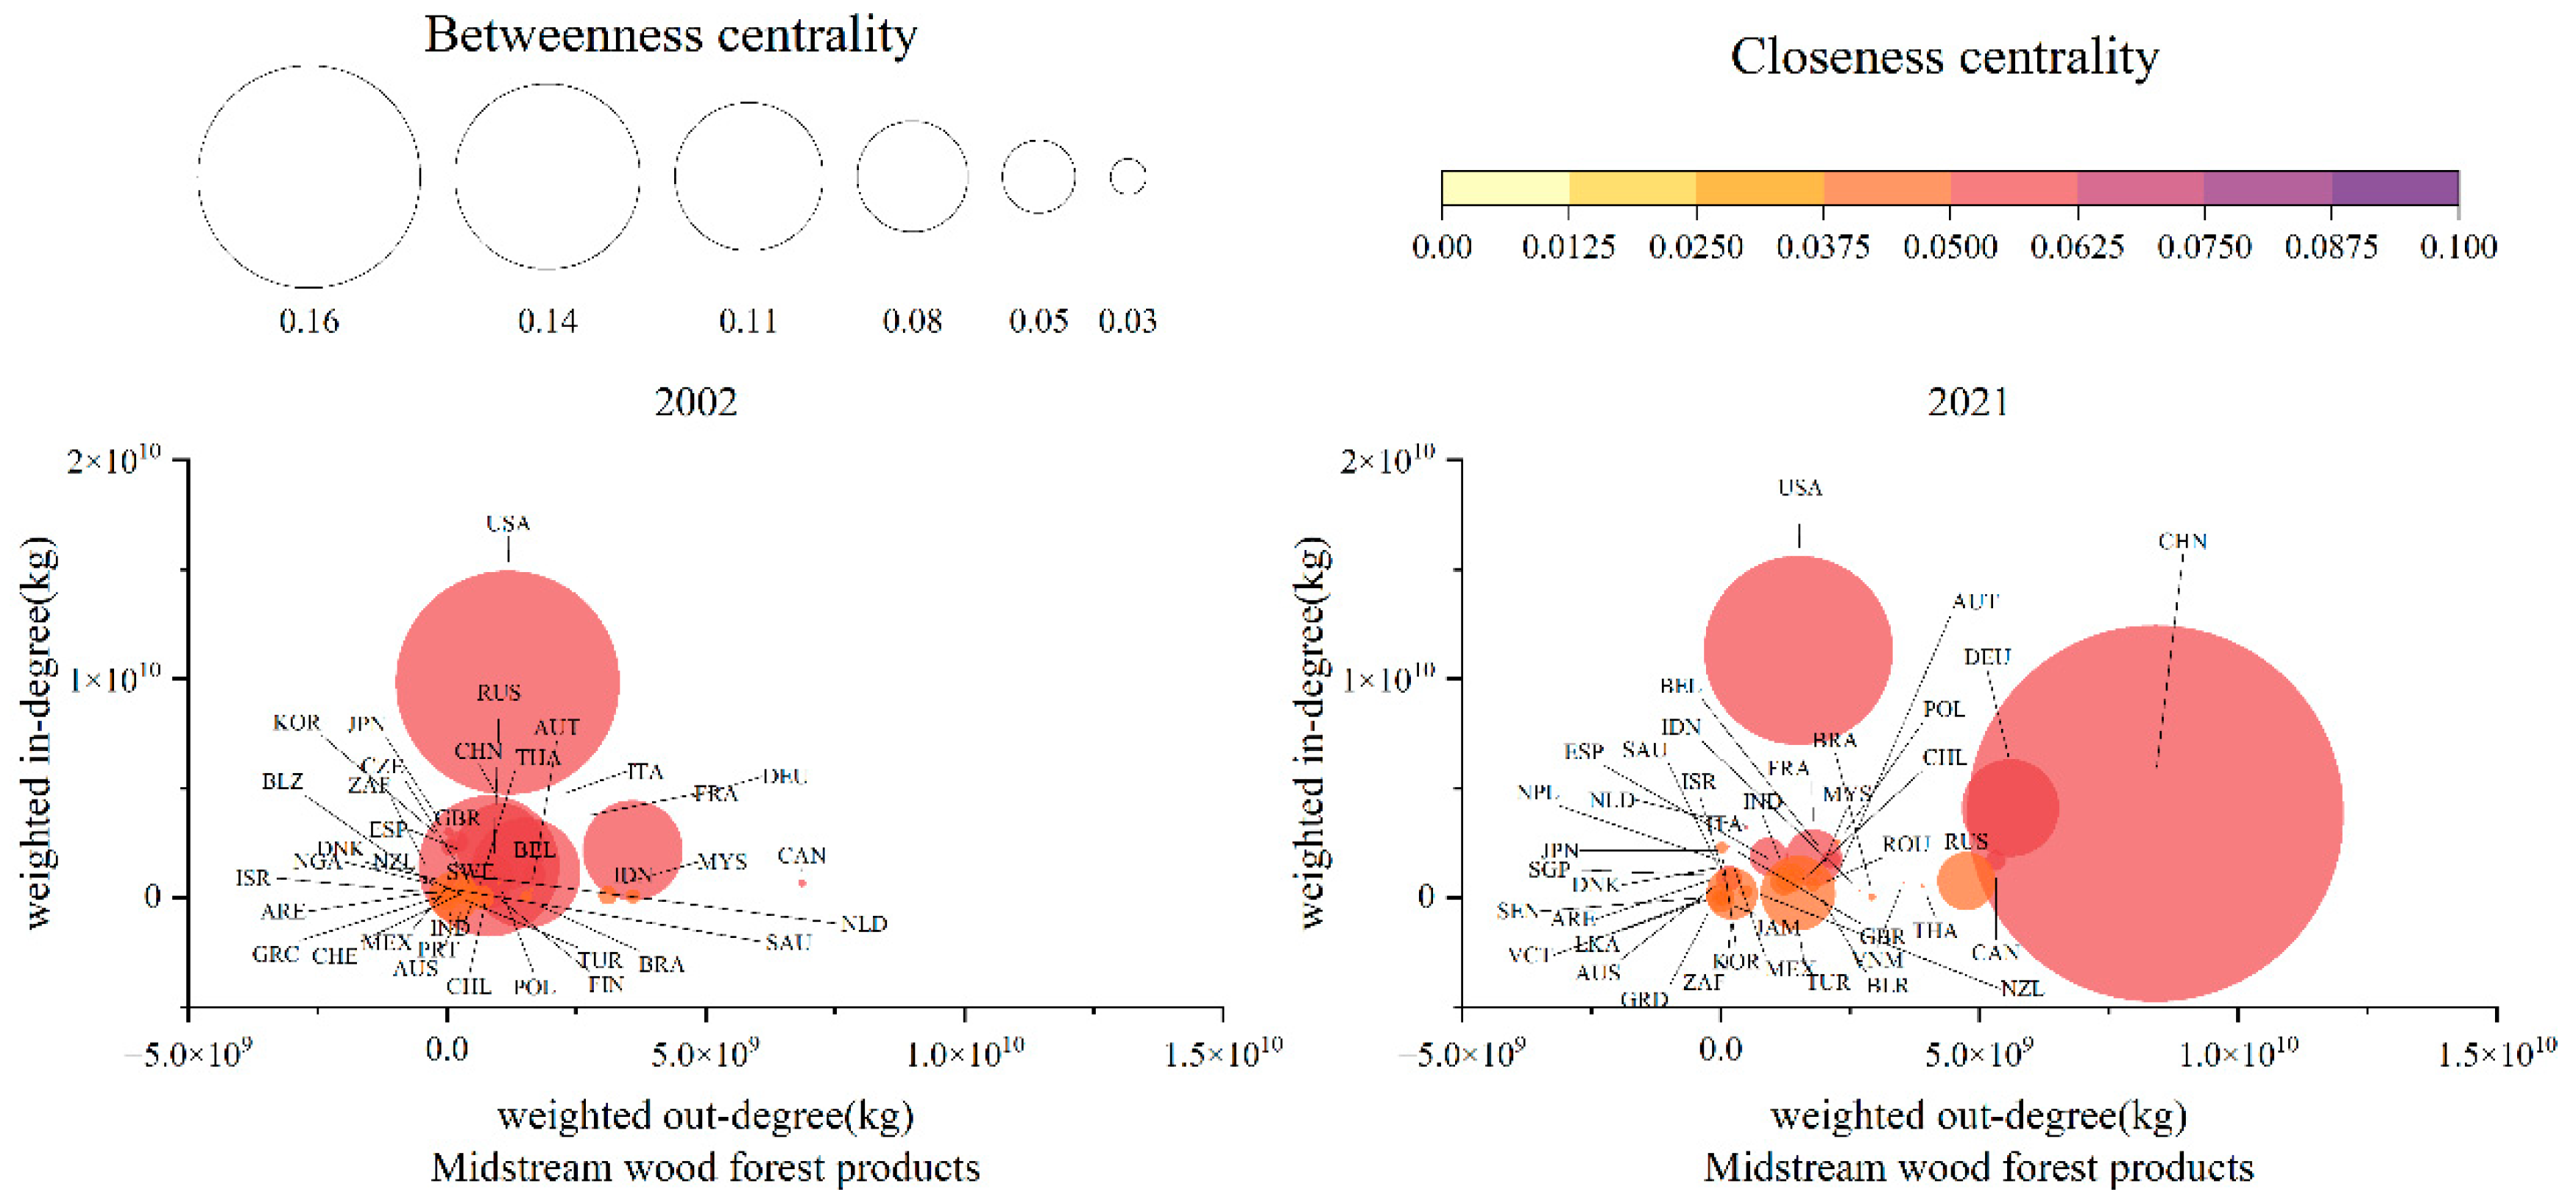
As shown in Figure 12, compared to 2002, China’s prominence in the midstream product network in 2021 is evident, with its weighted out-degree and weighted betweenness centrality ranking first, attributed to the stable production and continuous improvement of China’s wood panel industry. China’s significant influence in the network is crucial for maintaining network stability. The United States, with its weighted in-degree and weighted closeness centrality ranking first in both 2002 and 2021, not only demonstrates its core market position and strong influence in the global trade network of wood forest products but also showcases the stability of its supply chain and network resilience.
Canada, leveraging its solid foundation of forest resources and robust export capacity, has consistently ranked among the top three in weighted out-degree in both 2002 and 2021,with a notable increase in weighted closeness centrality. However, its consistently low weighted betweenness centrality indicates limited bridging roles and potential challenges to its node resilience from trade dependencies.
Russia’s weighted out-degree for midstream wood forest products has significantly risen from 13th place in 2002 to 4th place in 2021, highlighting its enhanced processing and manufacturing capabilities and export competitiveness. The slight increase in weighted betweenness centrality suggests Russia’s growing bridging role and node influence in the midstream wood product trade network. Nevertheless, the slight decrease in weighted closeness centrality might imply a shift in its position within the midstream trade network, necessitating attention to new market challenges.

3.3.3. Evolution Trend of Downstream Core Node Resilience

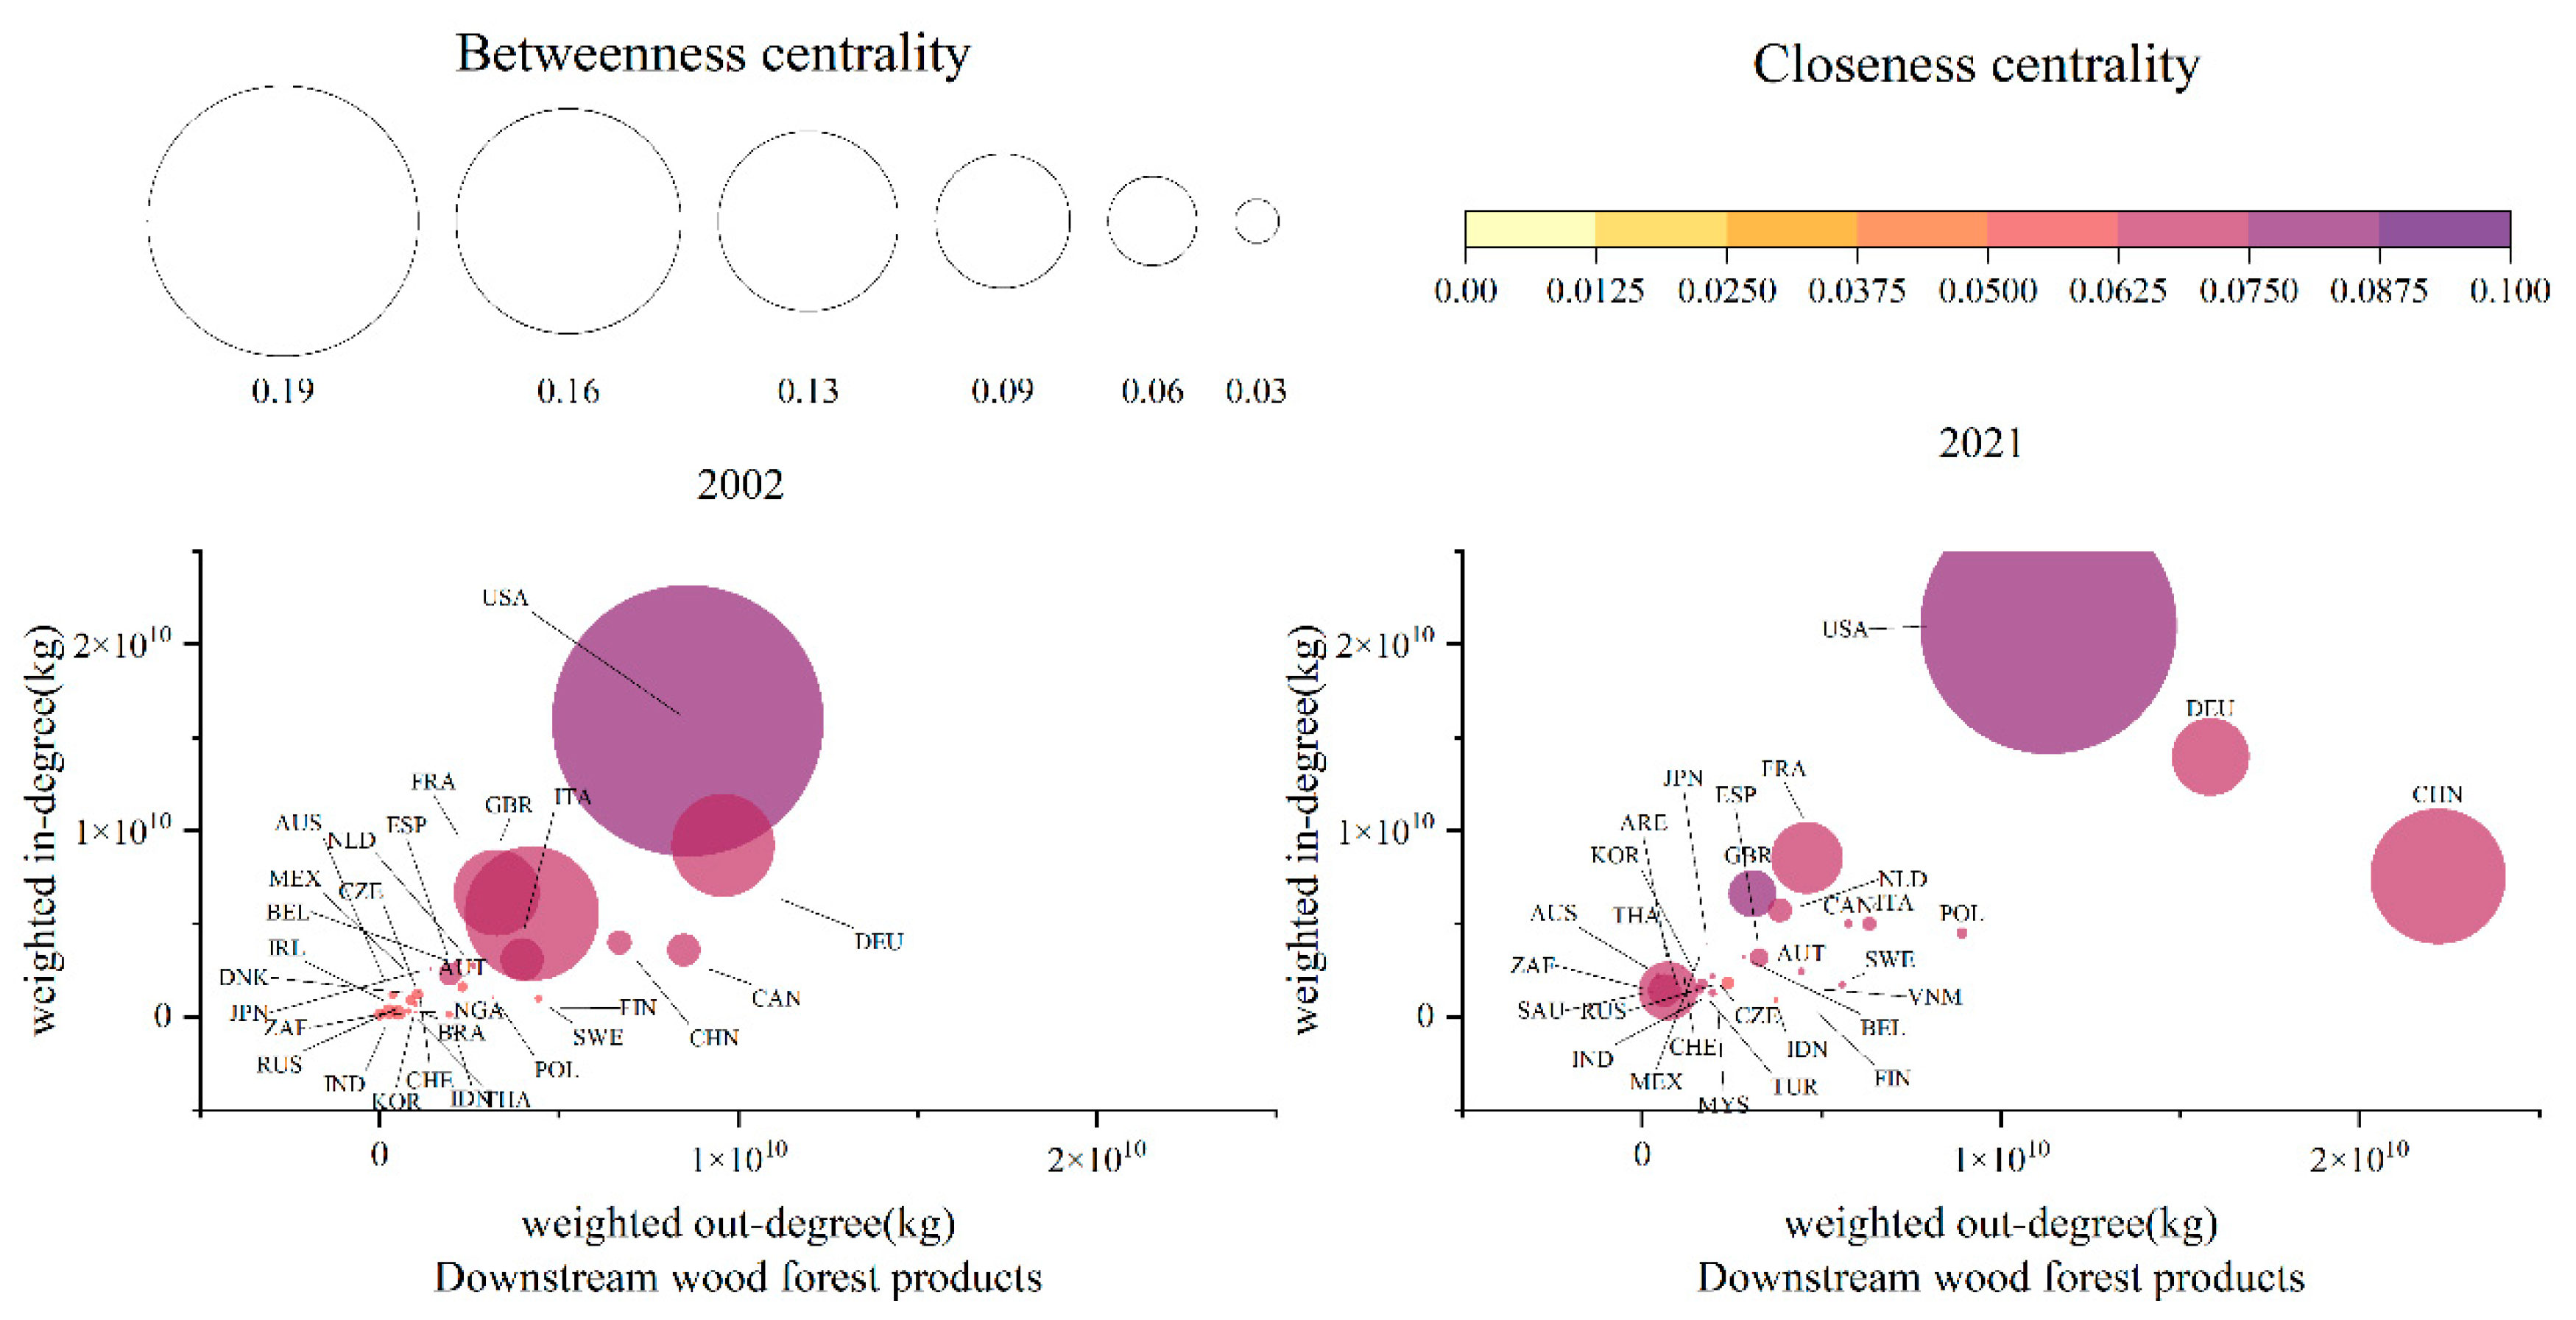
The downstream network nodes are noticeably darker than those in the other three types of networks, as shown in Figure 13, indicating that the weighted closeness centrality of downstream nodes is significantly higher than that of other networks. The trade network features a highly interconnected structure, efficient information dissemination and resource flow, and strong network cohesion.
In both 2002 and 2021, the United States, Germany, and China consistently ranked at the forefront in terms of weighted in-degree and out-degree in downstream wood product trade, serving as core nodes in the network. They possess abundant forest resources or stable raw material supplies, well-established industrial chains, strong market adaptability, and government policy support, demonstrating robust node resilience.
From 2002 to 2021, China’s weighted out-degree, weighted betweenness centrality, and weighted closeness centrality in downstream wood product trade have significantly improved, indicating notable enhancements in its market influence, processing and manufacturing capabilities, and information dissemination capacity. China has become a core bridge in the network. In the face of international trade uncertainties, China has exhibited strong node resilience, effectively addressing challenges and maintaining its stable position and sustained development within the network

3.3.4. Evolution Trend of Recycling Core Node Resilience

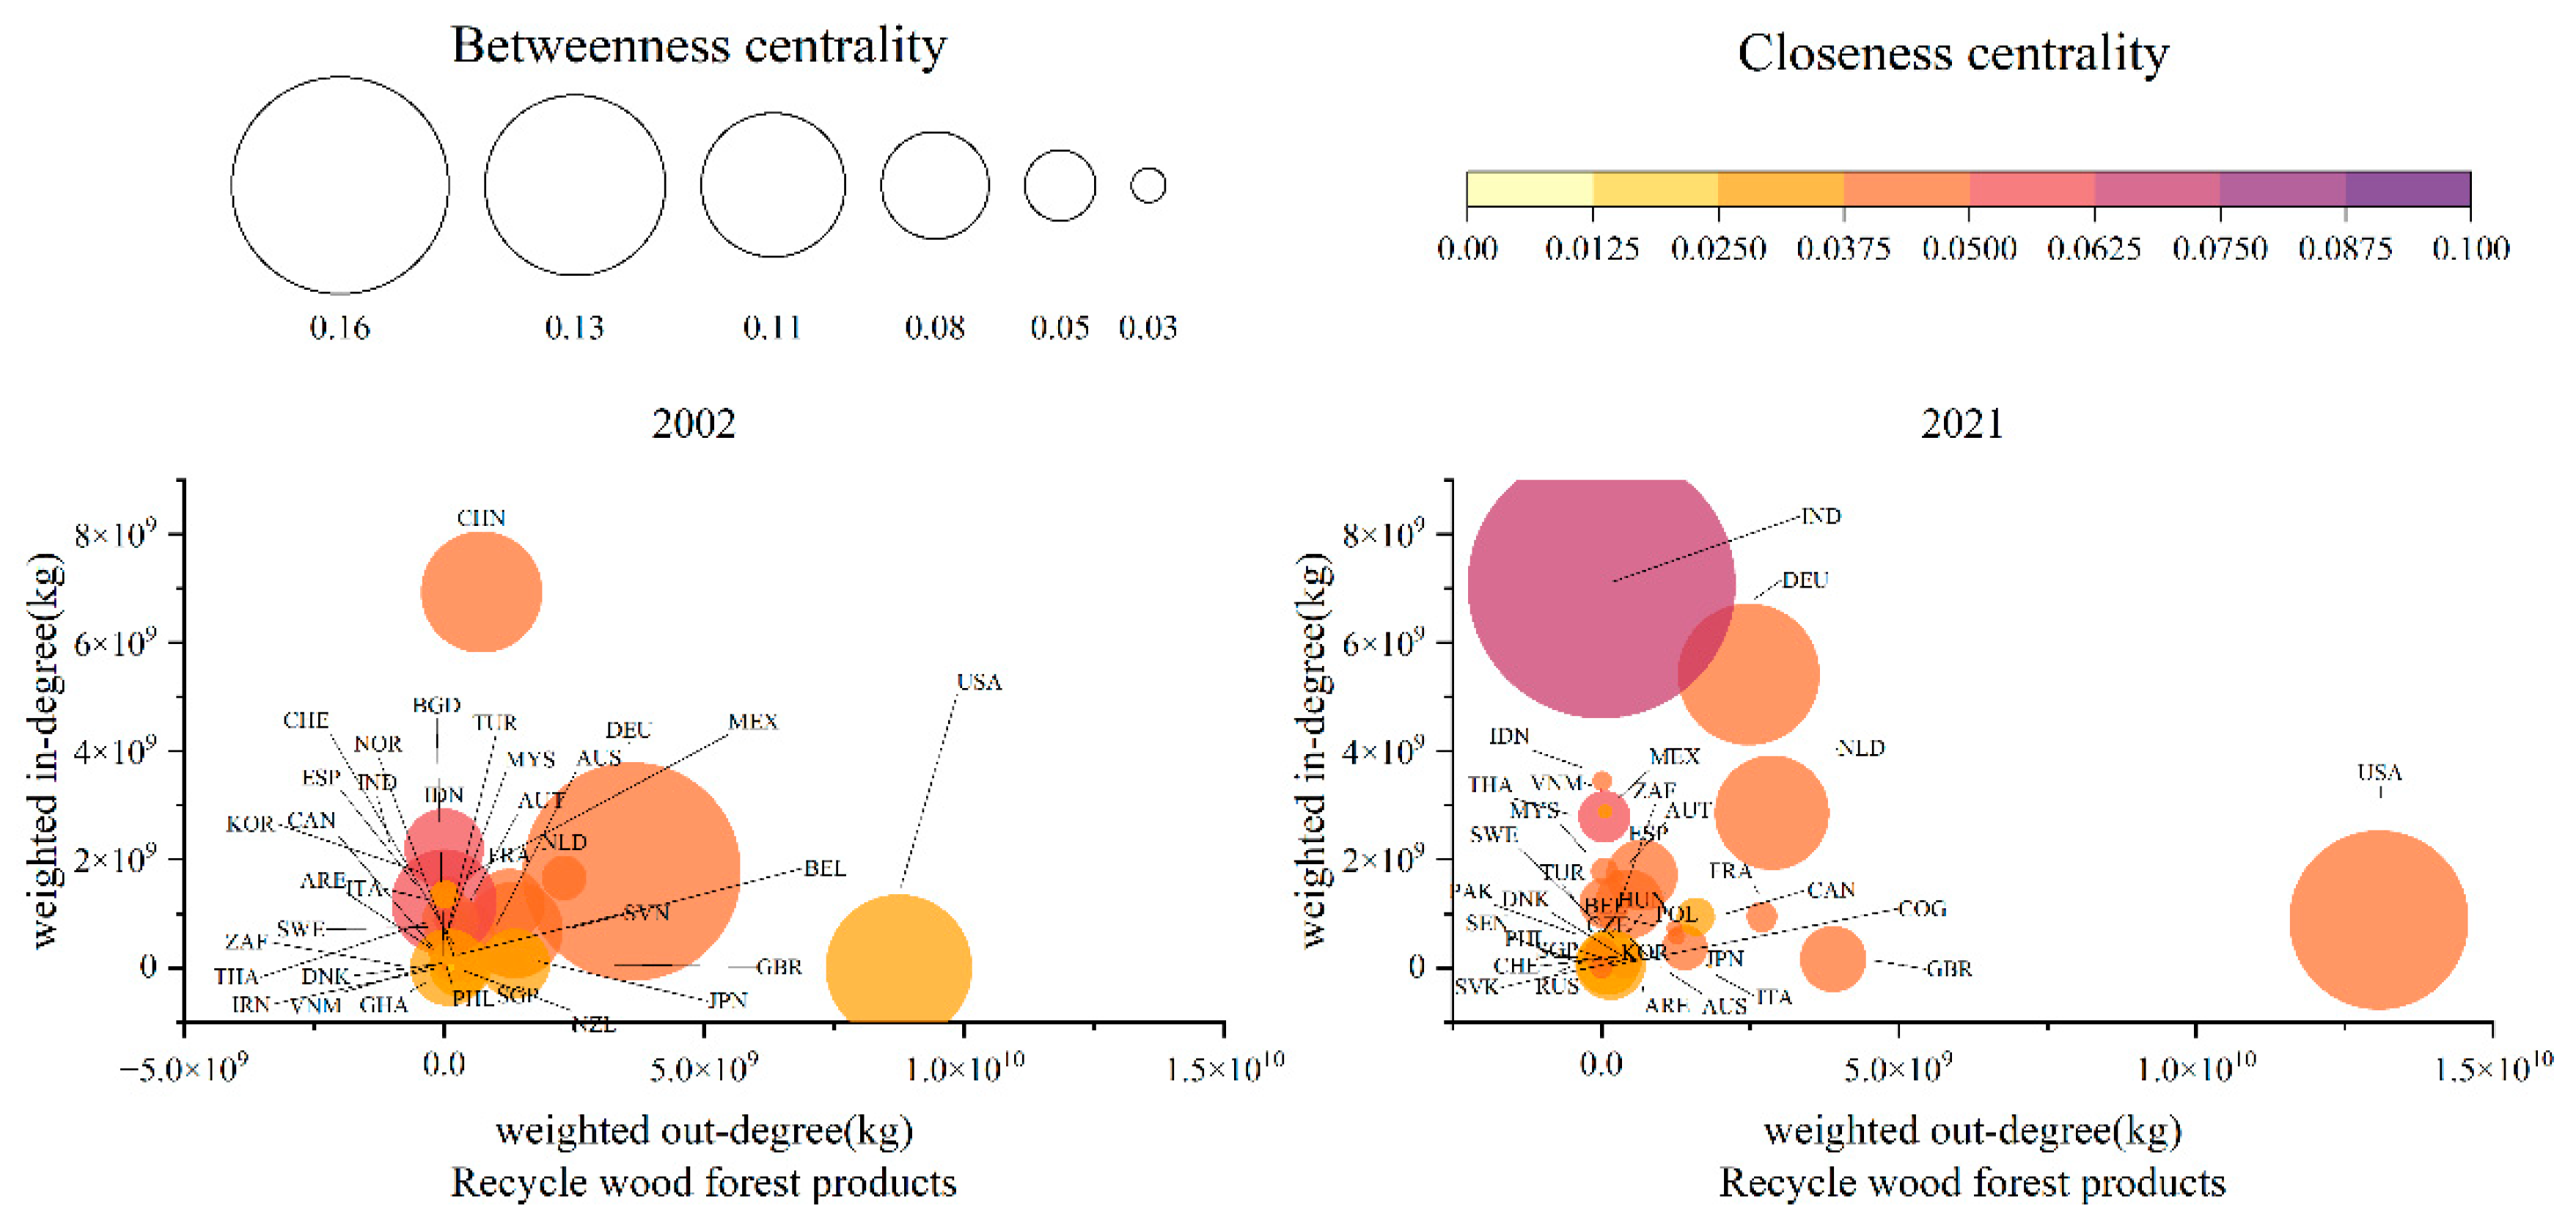
Recycled wood forest products primarily consist of waste paper, and the network nodes appear lighter in color, as shown in Figure 14, indicating lower weighted closeness centrality of recycling network nodes and lower connectivity and volume in waste paper recycling trade. This phenomenon can be attributed to factors such as low market maturity, high environmental protection technology barriers, differences in environmental protection policies, tax policies, and technical management levels across countries.
The United States has long been a leader in the waste paper recycling network, with advantages such as market dominance and a well-established industrial chain forming the foundation of its node resilience. From 2002 to 2021, there has been a shift in import core nodes within the recycling network. While China initially dominated imports, its influence subsequently weakened, and India rapidly emerged as the new import core, demonstrating strong competitiveness. Germany consistently ranked second in terms of weighted indegree in the recycling network in both 2002 and 2021, benefiting from domestic demand, resource conditions, an efficient recycling system, and government support, which drove significant imports of waste paper. However, its weighted betweenness centrality and weighted closeness centrality have decreased, indicating a mature recycling trade network, intensified market competition, and a slight reduction in the node’s bridging and diffusion capabilities.

4. Conclusion and Discussion

4.1. Conclusion

Based on the perspective of complex directed weighted network analysis, this paper constructs upstream, midstream, downstream, and recycling trade networks for global wood forest products and conducts an empirical analysis of the topological structure and static resilience of these four types of networks from 2002 to 2021. The results indicate:
(1) From 2002 to 2021, global trade in wood forest products experienced fluctuating growth, with notable growth in the trade volume of midstream primary processedproducts. Influenced by environmental protection policies, market demand, and supply chain optimization, the growth in upstream trade volume for logs and sawn timber was relatively small, reflecting export restrictions on logs and increased demand for primary processed products. The significant growth in waste paper recycling trade volume demonstrates the global enhancement of environmental awareness, policy support, technological advancements, expansion of market demand, and the promotion of international trade.
(2) In 2021, the four types of wood forest product trade networks exhibited different trade dynamics. The downstream trade network had the highest density, while the recycling trade network had the lowest. Core countries such as China, the United States, Germany, Canada, and others dominated multiple supply chain segments. Upstream timber trade was led by China, the United States, Germany, Canada, and Russia, while midstream man-made board trade centered around the United States, Germany, and China. The downstream supply and demand saw significant shares held by China, the United States, and Germany. The United States led in waste paper recycling, while after China’s policy adjustments, the waste paper market shifted towards India and Southeast Asia.
(3) From 2002 to 2021, the downstream network significantly led in global efficiency, with the largest weighted average clustering coefficient that continued to rise. This indicated that the downstream network had high efficiency and stability in information transmission and resource flow, with better transmission and agglomeration than upstream, midstream, and recycling networks.
(4) From 2002 to 2021, the hierarchy of the four types of wood forest product trade networks slightly increased, all exhibiting scale-free network characteristics. Core countries(regions) dominated the networks, making them more robust against random disturbances but potentially more vulnerable to deliberate attacks.
(5) From 2002 to 2021, the unweighted assortativity of the trade networks for the four types of wood forest products all exhibited a disassortative characteristic of “small countries (regions) relying on hubs”. In contrast, the weighted assortativity of the downstream network was positive, indicating closer trade relationships among core countries, which contributed to enhancing network resilience. In the recycling network, the weighted assortativity increased while the unweighted assortativity decreased, indicating a trend of diversification and marginal expansion in trade connections. However, the trade volume among core countries increased significantly, cooperation was strengthened, and network stability and resilience were enhanced. The weighted assortativity of the upstream and midstream networks shifted from positive to negative, indicating the emergence of a trickle-down effect. In the long run, this can disperse risks, enhance adaptability, and improve resilience.
(6) From the perspective of node resilience, China has become a superpower in importing upstream wood forest products, demonstrating high dependence on timber and exhibiting strong resilience and adaptability. In the midstream network, China also occupies a core position with significant export and intermediary roles. The United States maintains its core position in both upstream and midstream networks, ensuring supply chain stability. The downstream trade network is highly interconnected, with the United States, Germany, and China as core nodes, among which China’s influence has significantly increased. In the recycling wood forest product network, trade connections are less tight, with the United States dominating, China’s influence waning, and India rapidly emerging.

4.2. Discussion

In summary, the global trade network of wood forest products has undergone significant structural evolution and scale expansion over the past two decades. The implementation of environmental policies and changes in market demand have jointly driven adjustments in the trade pattern, while core countries such as China have increasingly prominent status and influence in the global network. Looking ahead, enhancing network resilience to effectively respond to disruptions and disturbances, while promoting sustainable supply of wood forest products and driving the green transformation of the industry, will be key strategies to address changes and challenges in the global market.
(1) Core countries such as China and the United States occupy a dominant position in the global network, enhancing network resilience but also increasing vulnerability to deliberate attacks. To cope with disruptions, all node countries (regions) should strive to enhance network diversity and redundancy, reduce dependence on a single core node, and establish a diversified supply chain layout to mitigate the impact of unexpected events on the overall operation of the network.
(2) In response to potential disruption risks in the network, emergency response mechanisms should be formulated to ensure swift response and recovery of network functions in the event of natural disasters, political conflicts, or economic turmoil. Additionally, by enhancing node resilience, including strengthening infrastructure construction, improving technological capabilities, and refining laws and regulations, the global wood product supply chain can more effectively resist random disturbances and deliberate attacks, ensuring its continuity and stability.
(3) To promote sustainable supply of wood forest products and drive the green transformation of the industry, countries should strengthen policy coordination and cooperation, promote supply chain diversification and localization, implement strict environmental regulations and standards, promote waste paper recycling systems, improve resource utilization efficiency, and jointly address global environmental challenges to contribute to the sustainable development of the wood product industry.
Regarding research on the resilience of the global wood product network, future exploration can delve into dynamic resilience assessment, simulating network dynamics by introducing different types of disturbances, and analyzing network resilience performance and recovery capabilities in the face of random or deliberate attacks. Simultaneously, comprehensive consideration of multiple factors such as policy, technology, culture, and geographical location on network resilience should be integrated into a more comprehensive analytical framework. Furthermore, cross-regional cooperation mechanisms should be explored, examining how to enhance the resilience of the overall network through strengthened international policy coordination, information sharing, and technological exchanges, and proposing specific cooperation strategies and policy recommendations to provide robust support for the sustainable development of global wood product trade.

Author Contributions

Conceptualization, Z.W., X.H. and Y.P.; methodology, Z.W., X.H. and Y.P.; software, X.H. and W.T.; validation, X.H.; formal analysis, X.H.; investigation, Z.W. and X.H.;resources, Z.W. and Y.P.; data curation, X.H. and M.Z.; writing—original draft preparation, X.H.; writing—review and editing, Z.W.,X.H. and M.Z.; visualization, X.H. and W.T.; funding acquisition, Z.W. and Y.P. All authors have read and agreed to the published version of the manuscript.

Funding

This work was supported by China National Social Science Foundation Project (22BGL114); Hunan Provincial Key R&D Programme Project (2022GK2025);Youth Scientific Research Foundation, Central South University of Forestry and Technology(2018QZ003).

References

  1. Cao, X.P.; Yang, S.; Huang, X.M.; Tong, J.X. Dynamic decomposition of factors influencing the export growth of China’s wood forest products. Sustainability 2018, 10, 2780. [Google Scholar] [CrossRef]
  2. Long, T.; Pan, H.X.; Dong, C.; Qin, T.; Ma, P. Exploring the competitive evolution of global wood forest product trade based on complex network analysis. Physica A: Statistical Mechanics and its Applications 2019, 525, 1224–1232. [Google Scholar] [CrossRef]
  3. Köhl, M.; Lasco, R.; Cifuentes, M.; Örjan Jonsson. ; Korhonen, K.T.; Mundhenk, P.; de Jesus Navar, J.; Stinson, G. Changes in forest production, biomass and carbon: Results from the 2015 UN FAO Global Forest Resource Assessment. Forest Ecology and Management 2015, 352, 21–34. [Google Scholar] [CrossRef]
  4. FAO. The State of the World’s Forests 2024. Technical report, Food and Agriculture Organization of the United Nations, 2024.
  5. Liu, L.; Chen, Y.; Yu, J.; Sun, Y. Study on the resilience of global trade network of wood forest products. IssuesofForestryEconomics 2024, 44, 218–224. [Google Scholar] [CrossRef]
  6. Lovric´, M.; Re, R.D.; Vidale, E.; Pettenella, D.; Mavsar, R. Social network analysis as a tool for the analysis of international trade of wood and non-wood forest products. Forest Policy and Economics 2018, 86, 45–66. [Google Scholar] [CrossRef]
  7. Zhou, Y.Y.; Hong, Y.P.; Cheng, B.D.; Xiong, L.C. The Spatial Correlation and Driving Mechanism of Wood-Based Products Trade Network in RCEP Countries. Sustainability 2021, 13, 10063–10063. [Google Scholar] [CrossRef]
  8. Gao, L.; Pei, T.W.; Yu, T. Trade Creation or Diversion?—Evidence from China’s Forest Wood Product Trade. Forests 2024, 15, 1276–1276. [Google Scholar] [CrossRef]
  9. Tian, G.; Jiang, Q.Q. Social Network Analysis on International Roundwood Trade Pattern in 2005—2014. World Forestry esearch 2016, 29, 87–91. [Google Scholar] [CrossRef]
  10. Liu, L.; Chen, Y.; Yu, J.; Cheng, R. Analysis of the Trade Network of Global Wood Forest Products and its Evolution from 1995 to 2020. Forest Products Journal 2024, 74, 121–129. [Google Scholar] [CrossRef]
  11. Pizzol, M.; Scotti, M. Identifying marginal supplying countries of wood products via trade network analysis. The International Journal of Life Cycle Assessment 2017, 22, 1146–1158. [Google Scholar] [CrossRef]
  12. Wang, R.; Wu, H.M.; Zhe, R.; Zhang, Y.A. Complex network analysis of global forest products trade pattern. Canadian Journal of Forest Research 2022, 53, 271–283. [Google Scholar] [CrossRef]
  13. Hou, F.M.; Xiao, J.X.; Zhang, F.J.; Xiao, H.; Chen, Y. The Impact of Global Trade Networks on the Division of Labor in Value Chains——Based on Wood Forest Products Perspective. Forestry Economics 2022, 44, 50–64. [Google Scholar] [CrossRef]
  14. Wang, F.; Tian, M.H.; Yin, R S. e.a. Change of global woody forest products trading network and relationship between large supply and demand countries. Resources Science 2021, 43, 1008–1024. [Google Scholar] [CrossRef]
  15. Holling, C.S.; et al. Resilience and stability of ecological systems. Annual Review of Ecology and Systematics 1973. [Google Scholar] [CrossRef]
  16. Li, L.G.; Zhang, P.Y.; Tan, J.T.; Guan, H.M. Review on the Evolution of Resilience Concept and Research Progress on Regional Economic Resilience. Human Geography 2019, 34, 1–7+151. [Google Scholar] [CrossRef]
  17. Liu, W.; Song, Z.Y. Review of studies on the resilience of urban critical infrastructure networks. Reliability Engineering and System Safety 2020, 193, 106617–106617. [Google Scholar] [CrossRef]
  18. Department of Transportation Engineering, I.U.o.T.; Department of Transportation Engineering, I.U.o.T.; Complex.; Sustainable Urban Networks (CSUN) Laboratory, U.o.I.a.C.; of Civil, D.; Materials Engineering, U.o.I.a.C.; Department of Transportation Engineering, I.U.o.T. Correction to: The role of travel demand and network centrality on the connectivity and resilience of an urban street system. Transportation 2019, 46, 1969–1969.
  19. Ali, K.; Elena, R.; D, F.B. Network structure impacts global commodity trade growth and resilience. PloS one 2017, 12, e0171184. [Google Scholar]
  20. Ahmed, M.; Kannan, G.; Nasiru, Z.; Jacob, P.; Zainul, A.A. Multi-tier supply chain network design: A key towards sustainability and resilience. Computers Industrial Engineering 2023, 182. [Google Scholar]
  21. Kharrazi, A.; Akiyama, T.; Yu, Y.; Li, J. Evaluating the evolution of the Heihe River basin using the ecological network analysis: Efficiency, resilience, and implications for water resource management policy. Science of the Total Environment 2016, 572, 688–696. 22. Wei, Y.; Xiu, C.L. Study on the concept and analytical framework of city network resilience. Progress in Geography 2020, 39, 488–502. [CrossRef]
  22. Jiao, B. Measuring the Resilience of International Energy Trade Networks From an Energy Security Perspective. Journal of Industrial Technological Economics 2024, 43, 131–140. [Google Scholar] [CrossRef]
  23. Sharifi, A. Resilient urban forms: A review of literature on streets and street networks. Building and Environment 2019, 147, 171–187. [Google Scholar] [CrossRef]
  24. Caschili, S.; Medda, F.R.; Wilson, A. An Interdependent Multi-Layer Model: Resilience of International Networks. Networks and Spatial Economics 2015, 15, 313–335. [Google Scholar] [CrossRef]
  25. Kharrazi, A.; Yu, Y.; Jacob, A.; Vora, N.; Fath, B.D. Redundancy, Diversity, and Modularity in Network Resilience: Applications for International Trade and Implications for Public Policy. Current Research in Environmental Sustainability 2020, 2, 100006–100006. [Google Scholar] [CrossRef]
  26. S., S.J.; L., H.H.; Emily, D.S.; Debra, C.; Melissa, C.; Kelly, H.; Buck, J.; Jordyn, K.; Emma, K.; Steve, K.; et al. Alternative Seafood Networks During COVID-19: Implications for Resilience and Sustainability13; Frontiers in Sustainable Food Systems 2021, 5. [Google Scholar]
  27. Berfin, K.D.; Megan, K. A complex network framework for the efficiency and resilience trade-off in global food trade. Environmental Research Letters 2021, 16. [Google Scholar]
  28. R, F.K.; T, B.C.; Madhur, A. Dynamics of the Global Wheat Trade Network and Resilience to Shocks. Scientific reports 2017, 7, 7177. [Google Scholar]
  29. Shahnazi, R.; Sajedianfard, N.; Melatos, M. Import and export resilience of the global oil trade network. Energy Reports 2023, 10, 2017–2035. [Google Scholar] [CrossRef]
  30. Yuan, X.J.; Ge, C.B.; Liu, Y.P.; Li, N.; Wang, Y. Evolution of Global Crude Oil Trade Network Structure and Resilience. Sustainability 2022, 14, 16059–16059. [Google Scholar] [CrossRef]
  31. Sun, X.; Wei, Y.; Jin, Y.; Song, W.; Li, X.L. The evolution of structural resilience of global oil and gas resources trade network. Global Networks 2022, 23, 391–411. [Google Scholar] [CrossRef]
  32. Yu, Y.; Ma, D.P.; Wang, X.M. International trade network resilience for products in the whole industrial chain of iron ore resources. Resources Science 2022, 44, 2006–2021. [Google Scholar] [CrossRef]
  33. Shen, X.; Guo, H.X.; Cheng, J.H. The resilience of nodes in critical mineral resources supply chain networks under emergent risk:.
  34. Take nickel products as an example. Resources Science 2022, 44, 85–96. [CrossRef]
  35. Yu, Y.; Ma, D.P.; Zhu, W.W. Resilience assessment of international cobalt trade network. Resources Policy 2023, 83. [Google Scholar] [CrossRef]
  36. Chen, Y.R.; Chen, M.P. Evolution of the global phosphorus trade network: A production perspective on resilience. Journal of Cleaner Production 2023, 405. [Google Scholar] [CrossRef]
  37. Zuo, Z.L.; Cheng, J.H.; Guo, H X. e.a. Resilience evolution and evaluation of the trade network structure in the lithium industry chain. China population, resources and environment 2024, 34, 155–166. [Google Scholar]
  38. Chen, W.; Wang, X.R.; Long, Y.; Zhao, X.Q.; Liu, Z.G. Resilience Evolution of the Trade Networks in Regions along the Belt and Road. Economic Geography 2024, 44, 22–31. [Google Scholar] [CrossRef]
  39. Shen, Z.H.; Wang, H.Y.; Hu, Z.H. Supply Chain Resilience:Adapting to Complexity—Based on the perspective of Complex System Thinking. Chinese journal of Management Science 2022, 30, 1–7. [Google Scholar] [CrossRef]
  40. Xu, R.L. Research on the Influence of TPP on Chinese Forest Products Trade. Master’s thesis, Beijing Forestry University, 2017. [Google Scholar]
  41. Li, Y.X. Research on the Evolution and Influencing Factors of RCEP Members’Wood Products Trade Network and the Influence of China’s Stat. Master’s thesis, Beijing Forestry University, 2022. [Google Scholar]
  42. Chen, Y.R.; Chen, M.P. Evolution of global phosphorus products trade pattern and China’s phosphorus import and export security. Resources Science 2024, 46, 85–99. [Google Scholar] [CrossRef]
  43. Wang, X.F.; Li, X.; Chen, G.R. Network Science: An Introduction; Higher Education Press: Beijing, 2012. [Google Scholar]
  44. Joan, C.; Raphael, S.; Jerome, V. Lock-in or lock-out? How structural properties of knowledge networks affect regional resilience. Journal of Economic Geography 2013, 14, 199–219. [Google Scholar]
  45. Newman, M.E.J. Assortative Mixing in Networks. Phys. Rev. Lett. 2002, 89, 208701. [Google Scholar] [CrossRef]
  46. U. , P.; M., S. Assortative mixing in weighted directed networks. Physica A: Statistical Mechanics and its Applications 2022, 604. [Google Scholar]
  47. Newman, M.E.J. The Structure and Function of Complex Networks. SIAM Review 2003, 45, 167–256. [Google Scholar] [CrossRef]
  48. Zhou, M.J.; Wang, F.Y.; Shao, L.G. Resilience evaluation of the rare earth supply chain in countries (regions) outside China: A case study of NdFeB permanent magnet. Resources Science 2023, 45, 1746–1760. [Google Scholar] [CrossRef]
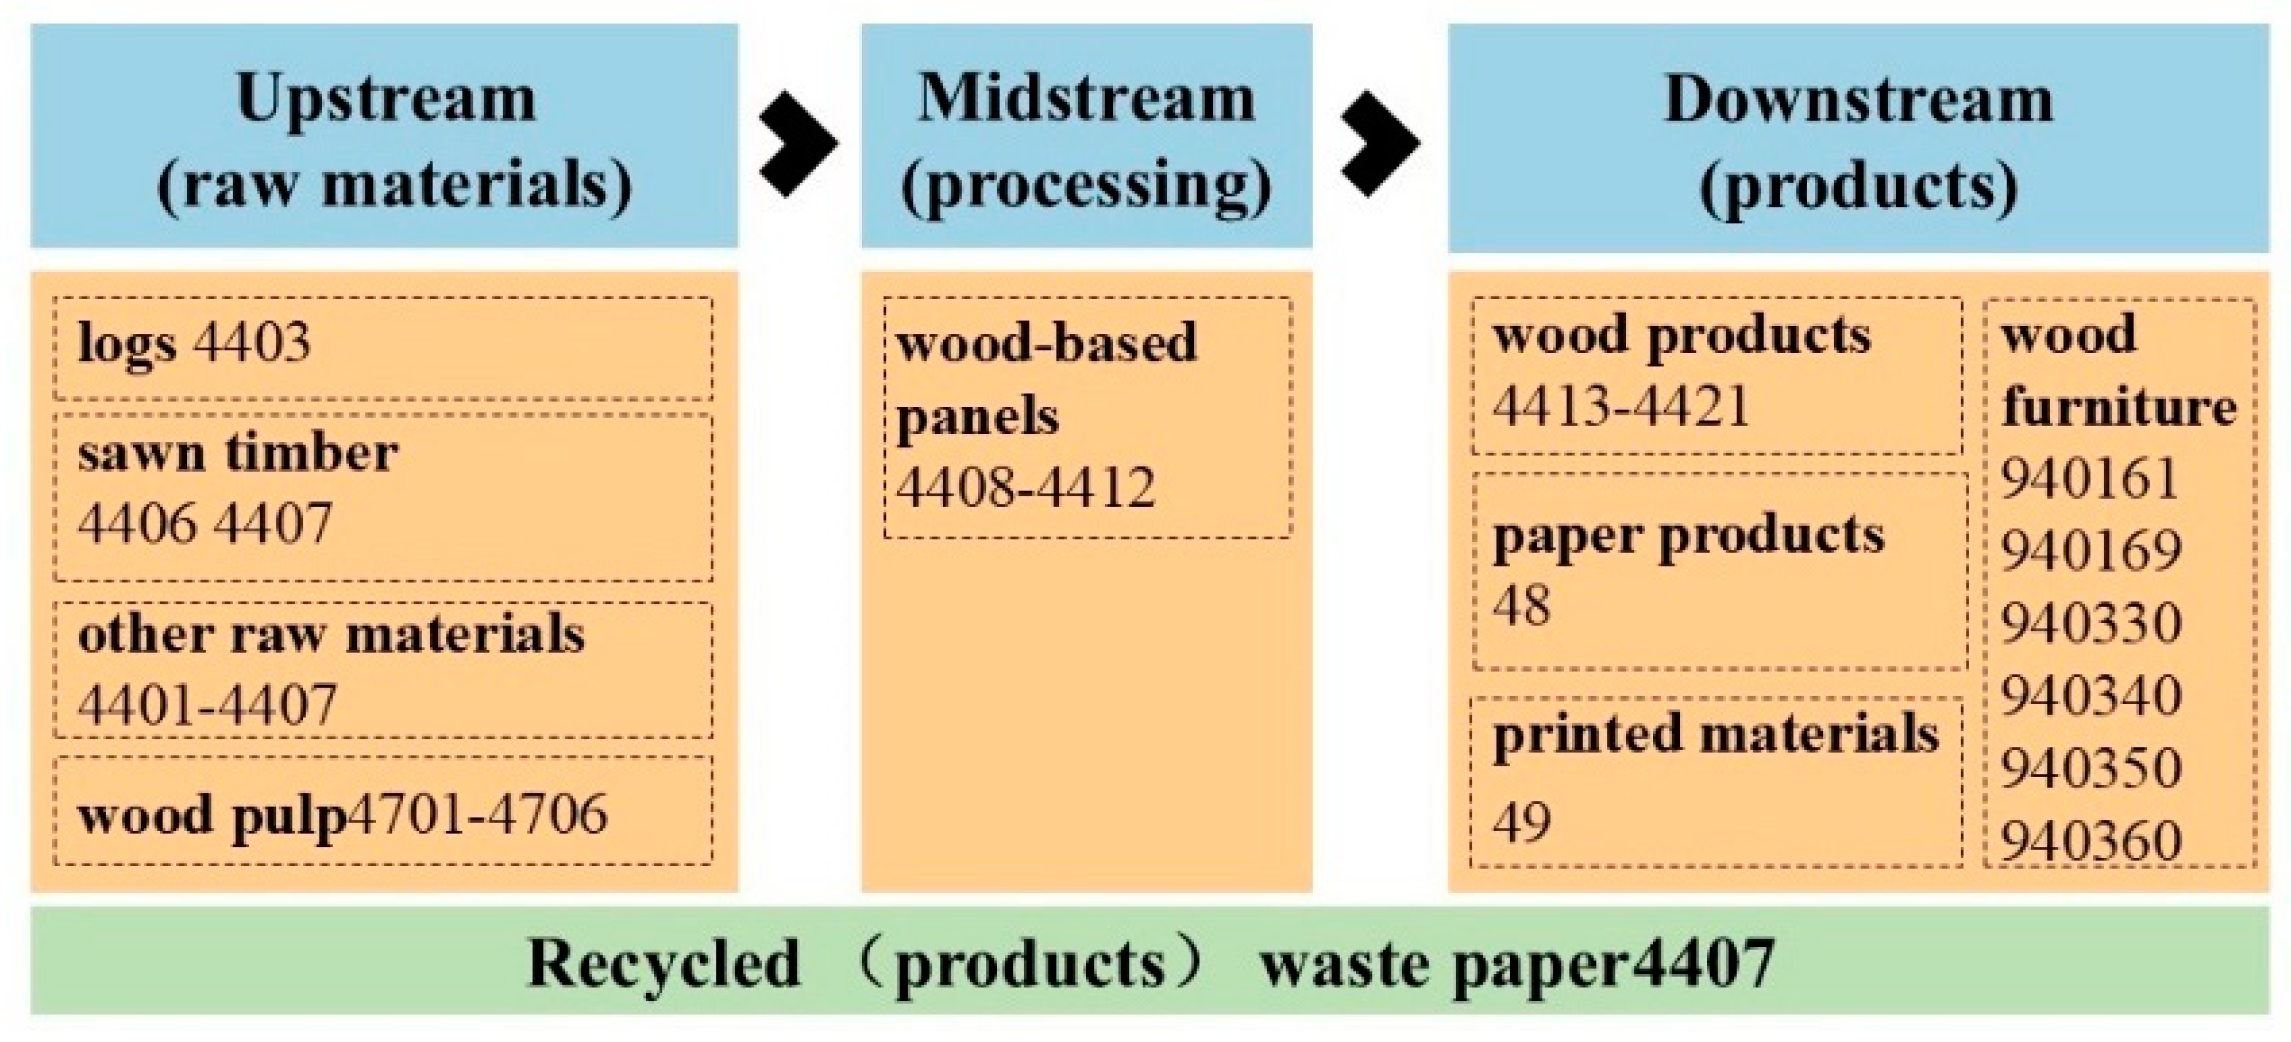
Figure 1. Classification and HS Codes of wood Forest Products.
Preprints 116263 g001
Figure 2. Research Framework.
Preprints 116263 g002
Figure 3. Number of Nodes Representing Countries (Regions) and Edges Representing Trade Relationships in the Global Wood Forest Products Trade Network from 2002 to 2021.
Preprints 116263 g003
Figure 4. Temporal Changes in the Volume and Value of Global Wood Forest Products Trade. From 2002 to 2021.
Preprints 116263 g004
Figure 5. Topological Structure of the Trade Network for Four Types of Wood Forest Products in 2021.
Preprints 116263 g005
Figure 6. Evolution of Weighted Global Efficiency. from 2002 to 2021.
Preprints 116263 g006
Figure 7. Evolution of Weighted Average Clustering Coefficient. from 2002 to2021.
Preprints 116263 g007
Figure 8. Weighted Degree Distribution of the Trade Network. for Four Types of Wood Forest Productsin 2002 and 2021.
Preprints 116263 g008
Figure 9. Evolution of Unweighted Assortativity. from 2002 to 2021.
Preprints 116263 g009
Figure 10. Evolution of Weighted Assortativity. from 2002 to2021.
Preprints 116263 g010
Figure 11. Evolution Trend of Recycling Core Nodes Resilience.
Preprints 116263 g011
Figure 12. Evolution Trend of Midstream Core Nodes Resilience.
Preprints 116263 g012
Figure 13. Evolution Trend of Downstream Core Nodes Resilience.
Preprints 116263 g013
Figure 14. Evolution Trend of Recycling Core Nodes Resilience.
Preprints 116263 g014
Disclaimer/Publisher’s Note: The statements, opinions and data contained in all publications are solely those of the individual author(s) and contributor(s) and not of MDPI and/or the editor(s). MDPI and/or the editor(s) disclaim responsibility for any injury to people or property resulting from any ideas, methods, instructions or products referred to in the content.
Copyright: This open access article is published under a Creative Commons CC BY 4.0 license, which permit the free download, distribution, and reuse, provided that the author and preprint are cited in any reuse.
Prerpints.org logo

Preprints.org is a free preprint server supported by MDPI in Basel, Switzerland.

Subscribe

© 2024 MDPI (Basel, Switzerland) unless otherwise stated