1. Introduction
The poly-3-hydroxybutyrate (P3HB) is a material recognized as a bioplastic material that belongs to the polyester family of polyhydroxyalkanoates (PHAs). The P3HB shares thermomechanical properties to currently used petrochemical plastics, but it is biodegradable and biocompatible [
1]. Therefore, P3HB is a material utilized in diverse areas, like biomedical, pharmaceutical, veterinary, foods packages and cosmetics [
2,
3].
Many species of bacteria use different carbon sources to accumulate P3HB as a natural mechanism for carbon and energy storage [
4].
Azotobacter vinelandii is an interesting P3HB production model, able to synthesize this polymer under conditions of nutritional limitation, either of phosphates or mainly of oxygen; and using different substrates, such as cane molasses, glucose, sucrose and compostable waste [
5].
The P3HB is storaged in granules, also named “carbonosomes” due to its complexity acquired by the binding of diverse GAPs (granules-associated proteins), which are the P3HB synthases, P3HB depolymerases, regulatory proteins (like PhaR), and the phasins [
6,
7]. The phasins are non-catalytic proteins (10-24 kDa), and are the major group of GAPs on the P3HB granule surface. Phasins are very important to the control of the size, number and distribution of the granules in the cells, in addition to the regulation of the P3HB synthases and P3HB depolymerases activities [
8].
It has been observed that the overexpression of some phasin genes (like
phaP1 and
phaP2 in
C. necator) in conjunction with genetic regulators of P3HB metabolism (such as the PhaR targets) is related to an increased production and accumulation of P3HB under non-oxygen limiting conditions [
9].
Likewise, it is known that phasins can also contribute to the regulation of P3HB depolymerization. In 2004, Handrik and collaborators reported that the phasin PhaP could function as activator of the soluble PHB depolymerase of
R. rubrum; surprisingly, PhaP is also a thermoresistant and chemoresistant protein [
10].
Some of the hypothesis that explain the relationship between phasins and the modulation of the activity of synthases and depolymerases is that, since the phasins are found on the surface of the granules, they interact with P3HB synthases and P3HB depolymerases, causing allosteric changes that change activity or binding to the PHB granule [
11]. However, the study of the relationship between phasins and synthesis and depolymerization activities has been carried out mainly at the genetic level [
10].
On the other hand, it has been proposed that phasins can act as chaperones that help the cell to relieve different types of stresses, such as thermal shocks, halophilic environments and oxidative stress [
12].
PhbP2 and PhbP3 phasins have recently been discovered in
A. vinelandii, and it is known that the inactivation of PhbP2 phasin promotes the synthesis of P3HB, and that inactivation of PhbP3 phasin reduces P3HB production in
A. vinelandii in cultures in shaken flasks in PYS-rich medium [
13,
18]. However, the mechanism by which PhbP2 and PhbP3 phasins are involved in the regulation of P3HB synthesis and degradation has not been described in detail.
On the other hand, it has been reported in that the increase in the agitation rate in bioreactors, and therefore in the oxygen transfer rate (OTR), can generate an effect known as "sublethal damage", where it is proposed that the high OTR results in a condition of oxidative stress [
14,
16]. The OTR is an important factor in the operation and optimization of biopolymer production. In microorganisms like
A. vinelandii, a thorough understanding of OTR and culture under the oxygen-limited conditions is crucial for the P3HB production [
17].
Taking the above into consideration, the aim of this work was to analyze the effect of the absence of phasins PhbP2 and PhbP3 on the growth rate, production and molecular mass of P3HB in cultures under low and high OTRs.
2. Materials and Methods
2.1. Maintenance and Preservation of Strain
The strains OP-PhbP2 ̄ and OP-PhbP3 ̄ were constructed by inserting an antibiotic cassette resistance (tetracycline and kanamycin respectively), interrupting the expression of
avin_03930 and
avin_034720 genes from the OP strain genetic background (the OP strain have a mutation in
algU, that regulates positively the alginate biosynthesis), that encode the
A. vinelandii proteins phasin PhbP2 and PhbP3 [
18]. The strains were stored in cryovials 1:1 glycerol 80 % culture, at -70 °C.
The OP, OP-PhbP2 ̄ and OP-PhbP3 ̄ strains were grown in Petri dishes with solid PYS medium which contains sucrose (20 g L ̄ ¹), peptone (5 g L ̄ ¹), yeast extract (3 g L ̄ ¹), agar (18 g L ̄ ¹) and the corresponding antibiotics selection tetracycline (60 μg mL ̄ ¹) and kanamycin (3 μg mL ̄ ¹). The inoculum was obtained through cells grown in 500 mL shaken flask with 100 mL of liquid PYS medium (in g L ̄ ¹: 20 sucrose, 5 peptone and 3 yeast extract) without antibiotic, under 200 rpm and 29 °C, for 24 hours until reaching an optical density of 0.16 ± 0.02, corresponding to 0.08 ± 0.02 g L ̄ ¹ of cell dry weight.
2.2. Bioreactor Cultures
The culture was carried out in a 3 L Applikon (Holland) bioreactor, equipped with two Rushton turbines (impeller diameter/tank diameter = 0.35), 6 flat-blade and a 7-hole diffuser to provide bubbling aeration. pH was controlled to 7.2 ± 0.1 by the automatic addition of NaOH 2N and HCl 2N through cultivation. Cultures were conducted in PYS medium, at 29 °C using an agitation rate of 300 and 500 rpm for all three strains evaluated, with a working volume of 2 L and an aeration of 1 vvm. A gas analyzer (Teledyne Analytical Instruments, model 7500) was used to measure O
2 and CO
2 in the gaseous flow at the bioreactor output. The gas analysis equipment was calibrated using nitrogen (auto zero setting) and a reference gas (1 % CO
2 and 5 % O
2, for SPAN). The estimation of the oxygen OTR was made from the online analysis of the level of gaseous oxygen at the outlet of the bioreactor, using the equation:
Where
is the molecular mass of oxygen (g mmol⁻¹),
is the volumetric inlet air flow at standard conditions (L h ̄ ¹),
is the working volume (l),
is the mol volume of the ideal gas at standard conditions (L mmol ̄ ¹),
and
are the molar fraction of oxygen and carbon dioxide in the inlet air (mol mol ̄ ¹),
and
are the molar fraction of the oxygen and carbon dioxide in the outlet gas of the fermenter (mol mol ̄ ¹).
2.3. Determination of Growth Kinetics and P3HB Production
Bacterial growth was measured as protein and performed using the Lowry method as described by García et al. [
19].
For the quantification of P3HB, 3-5 mg of dry biomass was taken and 1 mL of concentrated H
2SO
4 was added. The mixture was heated to 90 °C for 1 h. The samples were allowed to cool, then diluted 1:50 with MilliQ water, and a 20 μL sample was injected into high-pressure liquid chromatography (HPLC) (Waters Alliance 2695) using an Aminex HPX-87H column (Bio Rad), using 5 mM H₂SO₄ mobile phase and a Waters 2996 diode array detector was used [
13]. The area under the curve was quantified at 220 nm. The standard was prepared through hydrolysis of commercial P3HB (1-0.1 mg mL ̄ ¹) [
20].
The specific growth rate (μ) was measured as García et al reported [
15]
The specific oxygen uptake rate (qO₂) was calculated with the equation:
2.4. Molecular Weight Determination of P3HB
The biomass contained in 3 or 6 mL of sample was recovered by centrifugation. Subsequently, the biomass was washed with 1 mL of distilled water, resuspended, and centrifuged again at 8060 x g for 10 min (Eppendorf, model 5804 R). 1 mL of acetone was added, and the cell pack was agitated for 10 min. The sample was centrifuged at 8060 x g for 10 min, acetone was discarded and 2 mL of chloroform was added to solubilize P3HB, leaving it in contact for 20-24 h at room temperature for subsequent filtration prior to molecular weight analysis.
The molecular weight distribution was determined by gel permeation chromatography (GPC). A Shodex K-807L column was used, which allows the analysis of P3HB samples with molecular weights from 1,000 to 20,000 kDa. The column was coupled to HPLC equipment (Waters Alliance 2695) with a refractive index detector (Waters, 2414). The injection volume was 50 μL, at a working temperature of 30 °C and a run time of 30 min at a flow of 1 mL min⁻¹ using chloroform as a mobile phase. Polystyrene standards were used for the construction of the calibration curve with molecular weights between 2.9 x 10³- 5.6.0x10⁶ Da. Samples were prepared at a concentration of 1-2 mg mL⁻¹ and dissolved 24 h prior to analysis. Each sample was filtered with glass syringes and chloroform-resistant PTFE membranes with a pore size of 0.45 μm (Merk, Millipore, No. SLCR033NB).
Empower Chromatography Data System (Waters) was used for the processing and quantification of the molecular weight of the samples. From the calibration curve, an equation was obtained to estimate the molecular weight of P3HB depending on the elution volume [
17].
3. Results and Discussion
3.1. Growth kinetics, OTR Profiles and qO₂ in Bioreactor Cultures at 300 and 500 rpm with OP, OP-PhbP2 ̄ and OP-PhbP3 ̄ Strain
In order to evaluate the effect of inactivating the phasins PhbP2 and PhbP3 under different OTR conditions, the OP wild type strain and its derivative mutants were tested under two agitation rates (300 and 500 rpm), corresponding to low and high oxygen transfer rates (OTR).
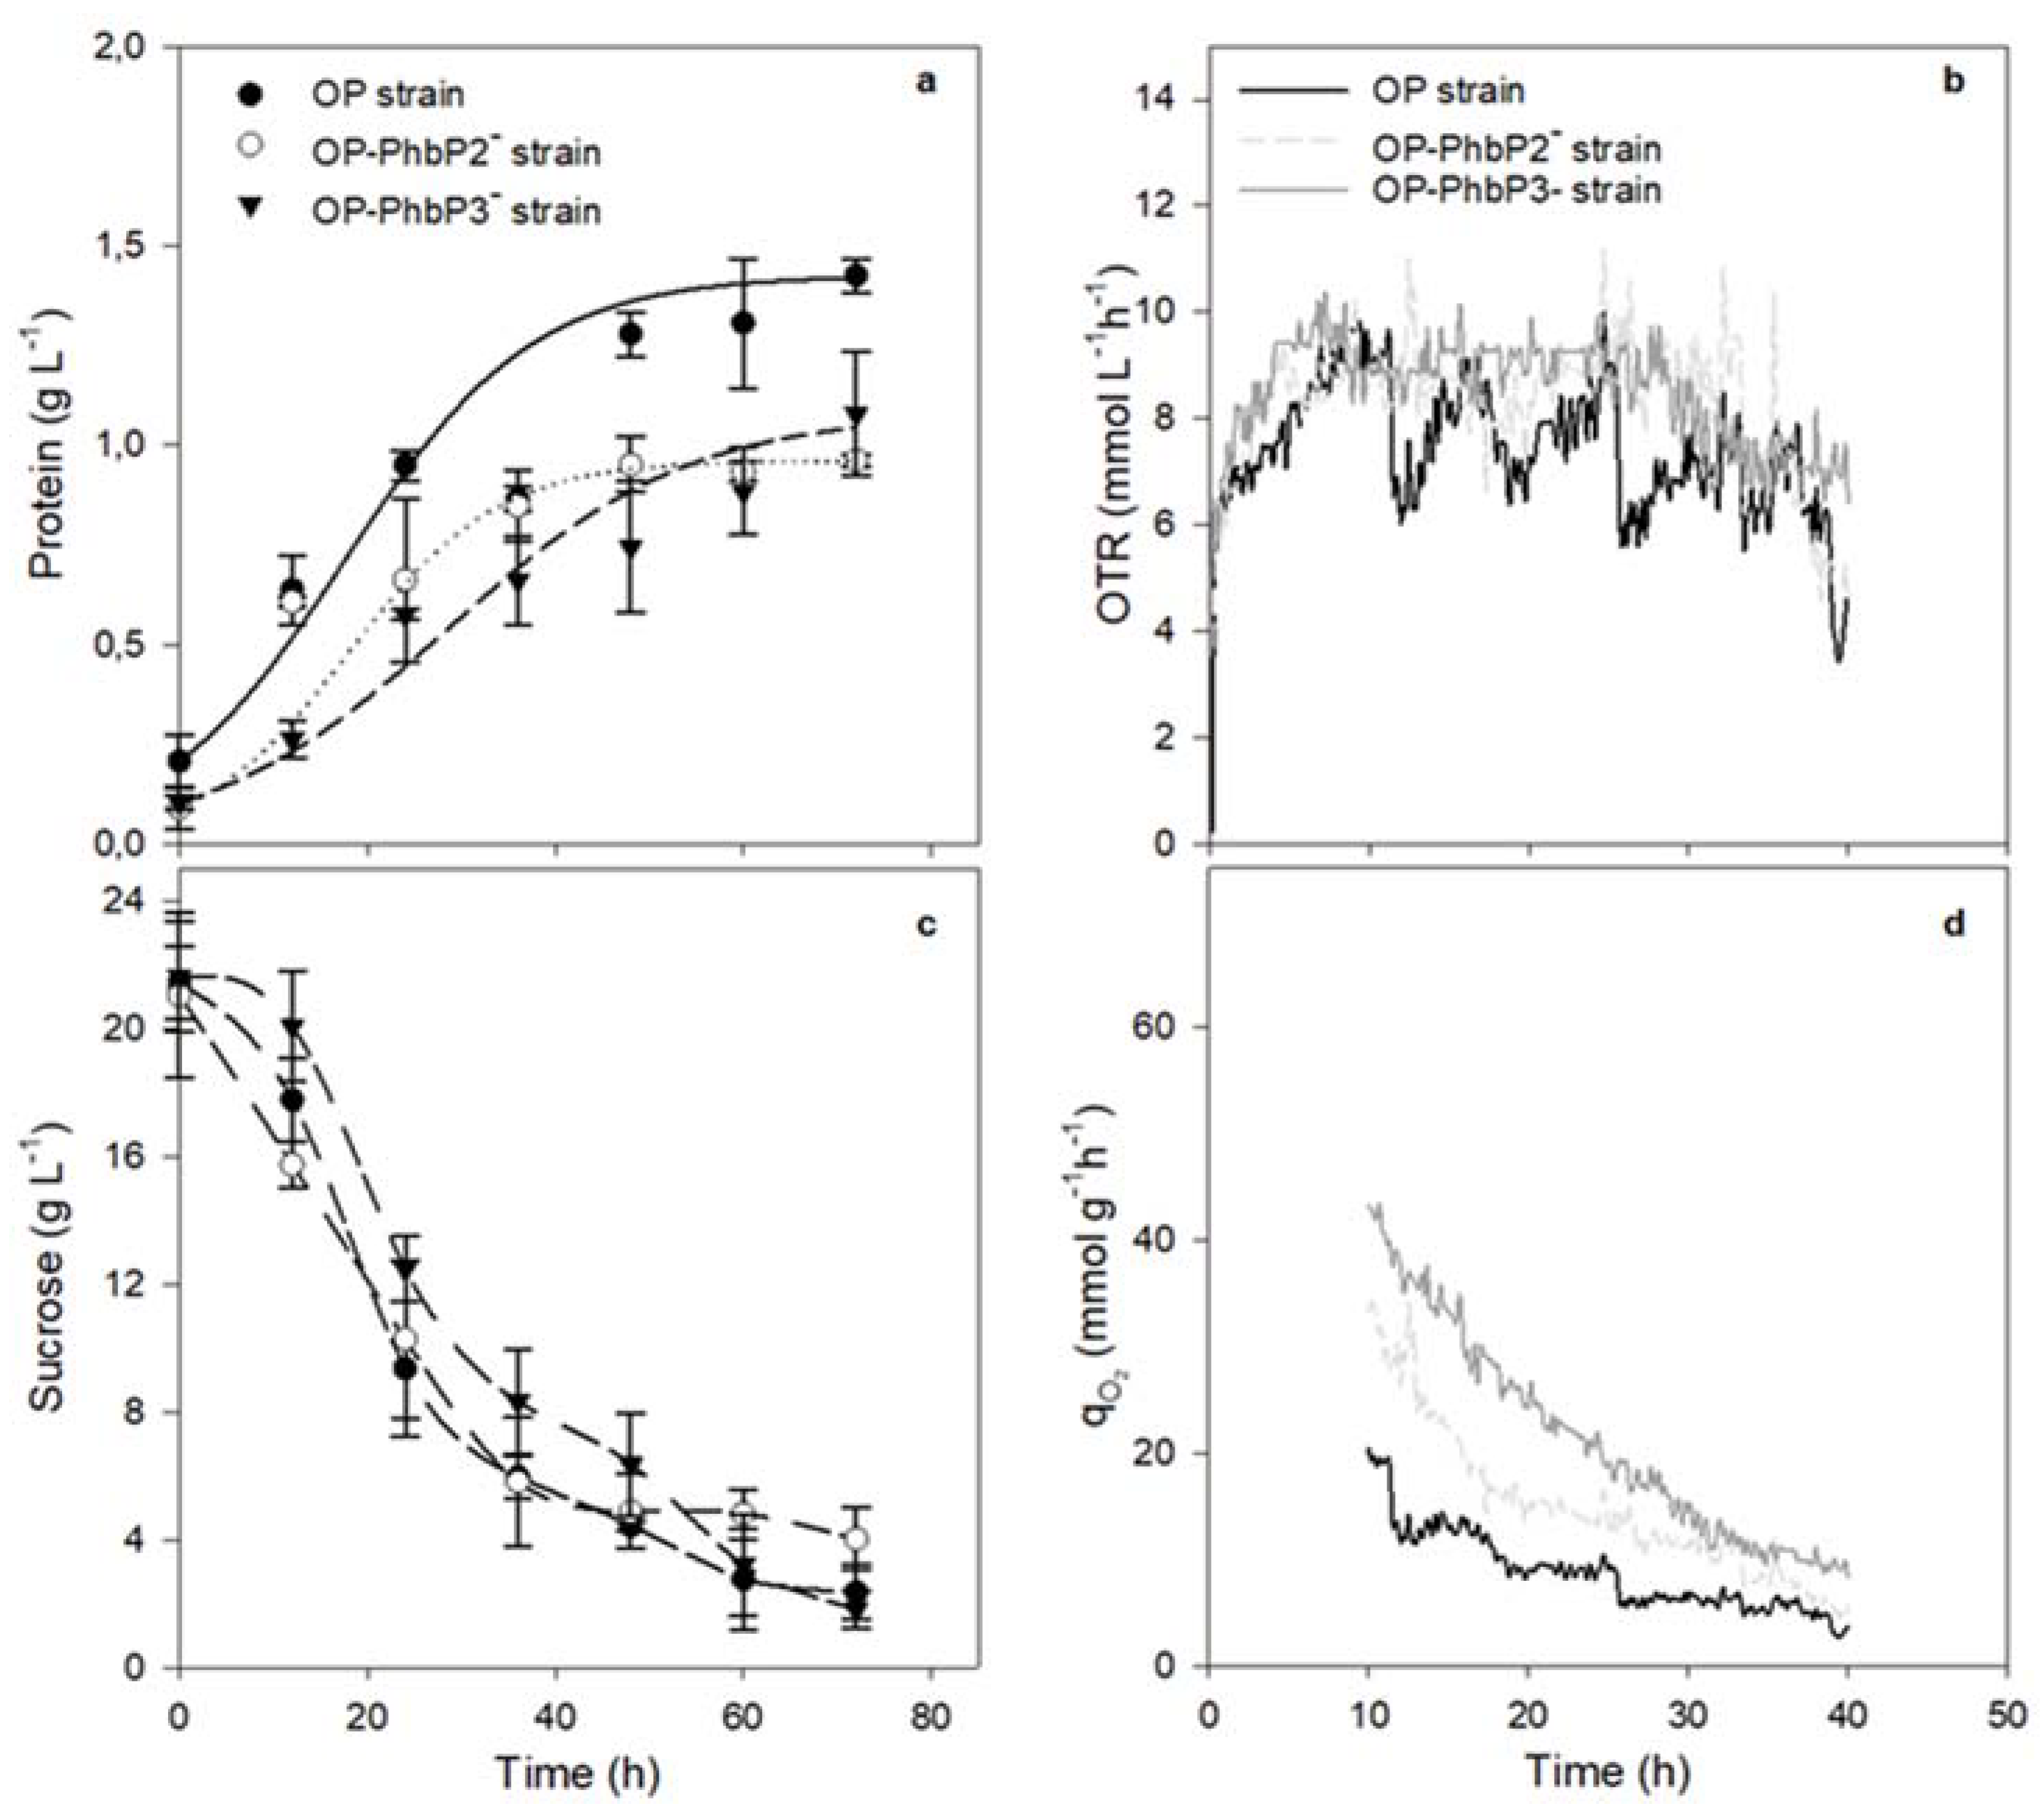
Figure 1a shows the bacterial growth kinetics, measured as protein, of the three strains grown at 500 rpm in PYS medium. In the cultures using the OP-PhbP2⁻ and OP-PhbP3⁻ strains, the cellular growth was lower compared to that of the OP strain. In the case of OP strain, the maximal protein concentration was 1.43 ± 0.04 g L⁻¹; whereas, the cultures with the mutant strains OP-PhbP2⁻ and OP-PhbP3⁻ reached 0.96 ± 0.02 g L⁻¹ and 1.08 ± 0.15 g L⁻¹, respectively. The specific growth rate (m) was 0.05 ± 0.01 h⁻¹ for OP-PhbP2⁻ and 0.04 ± 0.01 h⁻¹ for OP-PhbP3⁻ . In the case of the culture with the parental strain OP, the m was higher (0.08 ± 0.02 h⁻¹) (
Table 1).
Although the μ was lower in the cultures conducted with the mutant strains, the OTR profiles (
Figure 1b) were very similar for the three strains evaluated. For example, the OTR increased during the first 10 h of cultivation, reaching maximal values between 8.1 and 8.9 mmol L⁻¹ h⁻¹ depending on the strain evaluated. Regardless of the strain, the OTR remained constant from 10 to 24 h of cultivation, which was a sign of oxygen limitation in the culture, with a plateau region characteristic of this kind of limitation, as previously described by Díaz-Barrera et al. [
14] and Castillo et al. [
20]. After 24 h the OTR dropped drastically to a minimal value of 3 mmol L⁻¹ h⁻¹.
Figure 1 (c) shows the sucrose consumption during the cultivation. For the three strains evaluated, the rate of sucrose consumption at 500 rpm was the same, with values of 0.25 g L⁻¹ h. At the end of the culture (72 h), a residual sugar concentration of 2 g L⁻¹ was determined for the cultures with the OP strain and OP-PhbP3⁻strains, and 4.0 g L⁻¹in the cultures with the mutant OP-PhbP2⁻. It is known that in cultures of
A. vinelandii the affinity constant (Ks) for sucrose is 0.1 g L⁻¹ [
21]. Therefore, the cultures were not limited by the carbon source, thus, it is possible that other nutrients, such as phosphates or trace elements, are responsible for this drop in oxygen transfer rate and oxygen consumption.
The qO₂ was calculated in the range from 12 to 36 h, since in that period the dissolved oxygen tension (DOT) remained constant and therefore is valid to assume that the oxygen transfer rate = oxygen uptake rate [
21]. As shown in
Figure 1d, the highest value of qO₂ was reached with the mutant strains along the culture. In the cultures at 500 rpm, this value was two to three-fold higher compared with that obtained with the OP strain during the growth phase (12 - 24 h). For example, at 12 h of culture the qO₂ for the culture of OP-PhbP3 ̄ strain was 37.33 ± 1.60 mmoL g⁻¹ h⁻¹ and 25.5 ± 1.04 mmoL g⁻¹ h⁻¹ for the culture with mutant OP-PhbP2 ̄; whereas for the OP strain was 9.19 ± 1.01 mmoL g⁻¹ h⁻¹ (
Table 1).
It has previously been reported that variations in agitation rate, and therefore in the OTR, could promote an effect known as “semi-lethal damage”; where it is proposed that high OTR, similar to those achieved at 500 rpm, results in a condition of oxidative stress [
14,
16]. Previous studies have reported that in cultures of
A. vinelandii at 500 rpm, it is possible to find a situation that causes semi-lethal cell damage [
14]. Considering this starting point, and that in the mutant strains phasins PhbP2 and PhbP3 are not expressed, we propose that these phasins may be playing another function distinct to P3HB metabolism, as chaperone proteins that protect cells against oxidative stress, as it has been shown for other phasins [
22,
23].
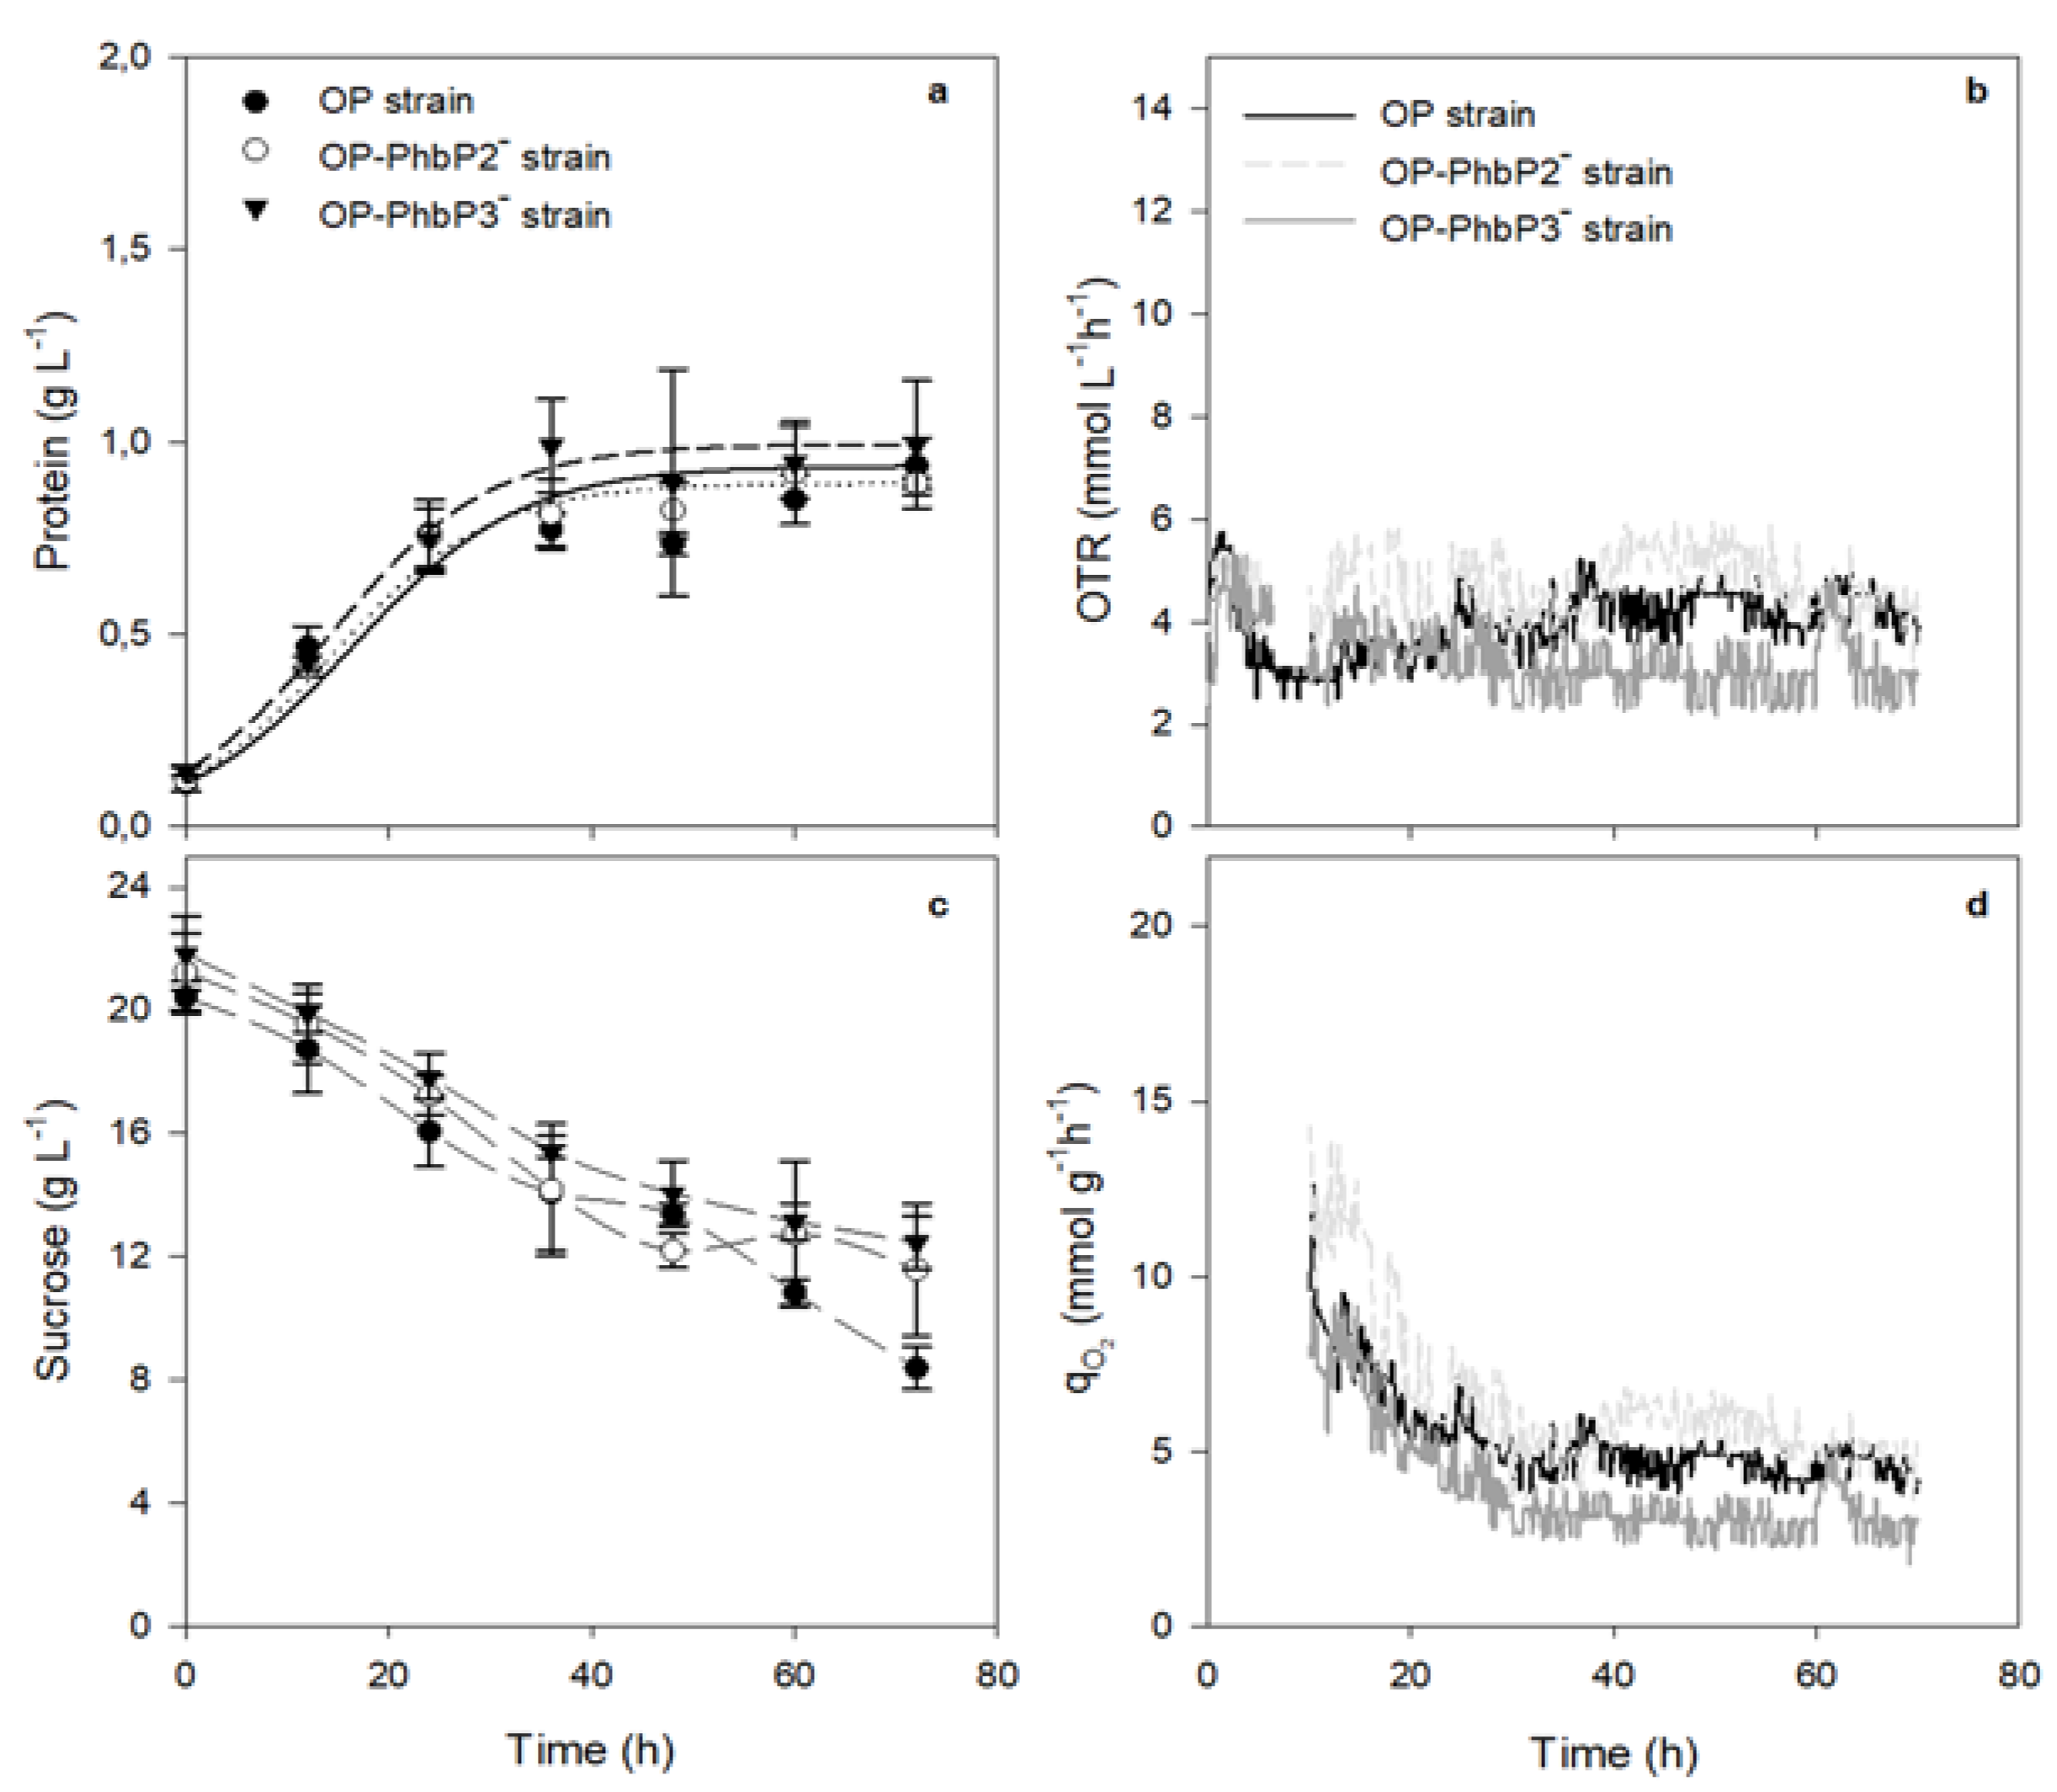
To test this hypothesis, cultures were carried out at low OTR (300 rpm). As it shown in
Figure 2a, there were no significant changes in the growth or the qO₂, being the case for the two mutant strains with respect to strain OP. The values of maximal protein concentration were in the range of 0.89 to 0.99 g L⁻¹, with m of 0.025 ± 0.001 h⁻¹ for OP and OP-PhbP2 ̄ and 0.027±0.001 h⁻¹ for OP-PhbP3 ̄. In the case of the qO, the values at 12 h of cultivation were in the range of 6.88 to 12.07 mmoL g⁻¹ h⁻¹ (
Table 1). Therefore, it is possible to consider that under conditions of high oxygen transfer, phasins could be involved in participating as chaperone-type proteins that help face a situation of oxidative stress in cells. However, more studies are necessary to elucidate the mechanisms involved.
It is known that the phasins exert a stress-reduction action, both in P3HB and non-P3HB synthesizing bacteria, decreasing the induction of heat shock-related genes in
E. coli [
22,
23] and promoting protein folding through a chaperone-like mechanism, which suggests an in vivo general protective role of this phasin [
24]. However, it is necessary to carry out more studies that help to discern if the suggested effect is carried out genetically or if it is through protein-protein interactions on the granule surface, since in some study models, it has been shown that phasins facilitate the anchoring of P3HB synthases on the surface [
24].
3.2. P3HB Production at 300 and 500 rpm Using the OP and Mutant Strains
The accumulation percentage of P3HB and its concentration were also quantified at the different culture times.
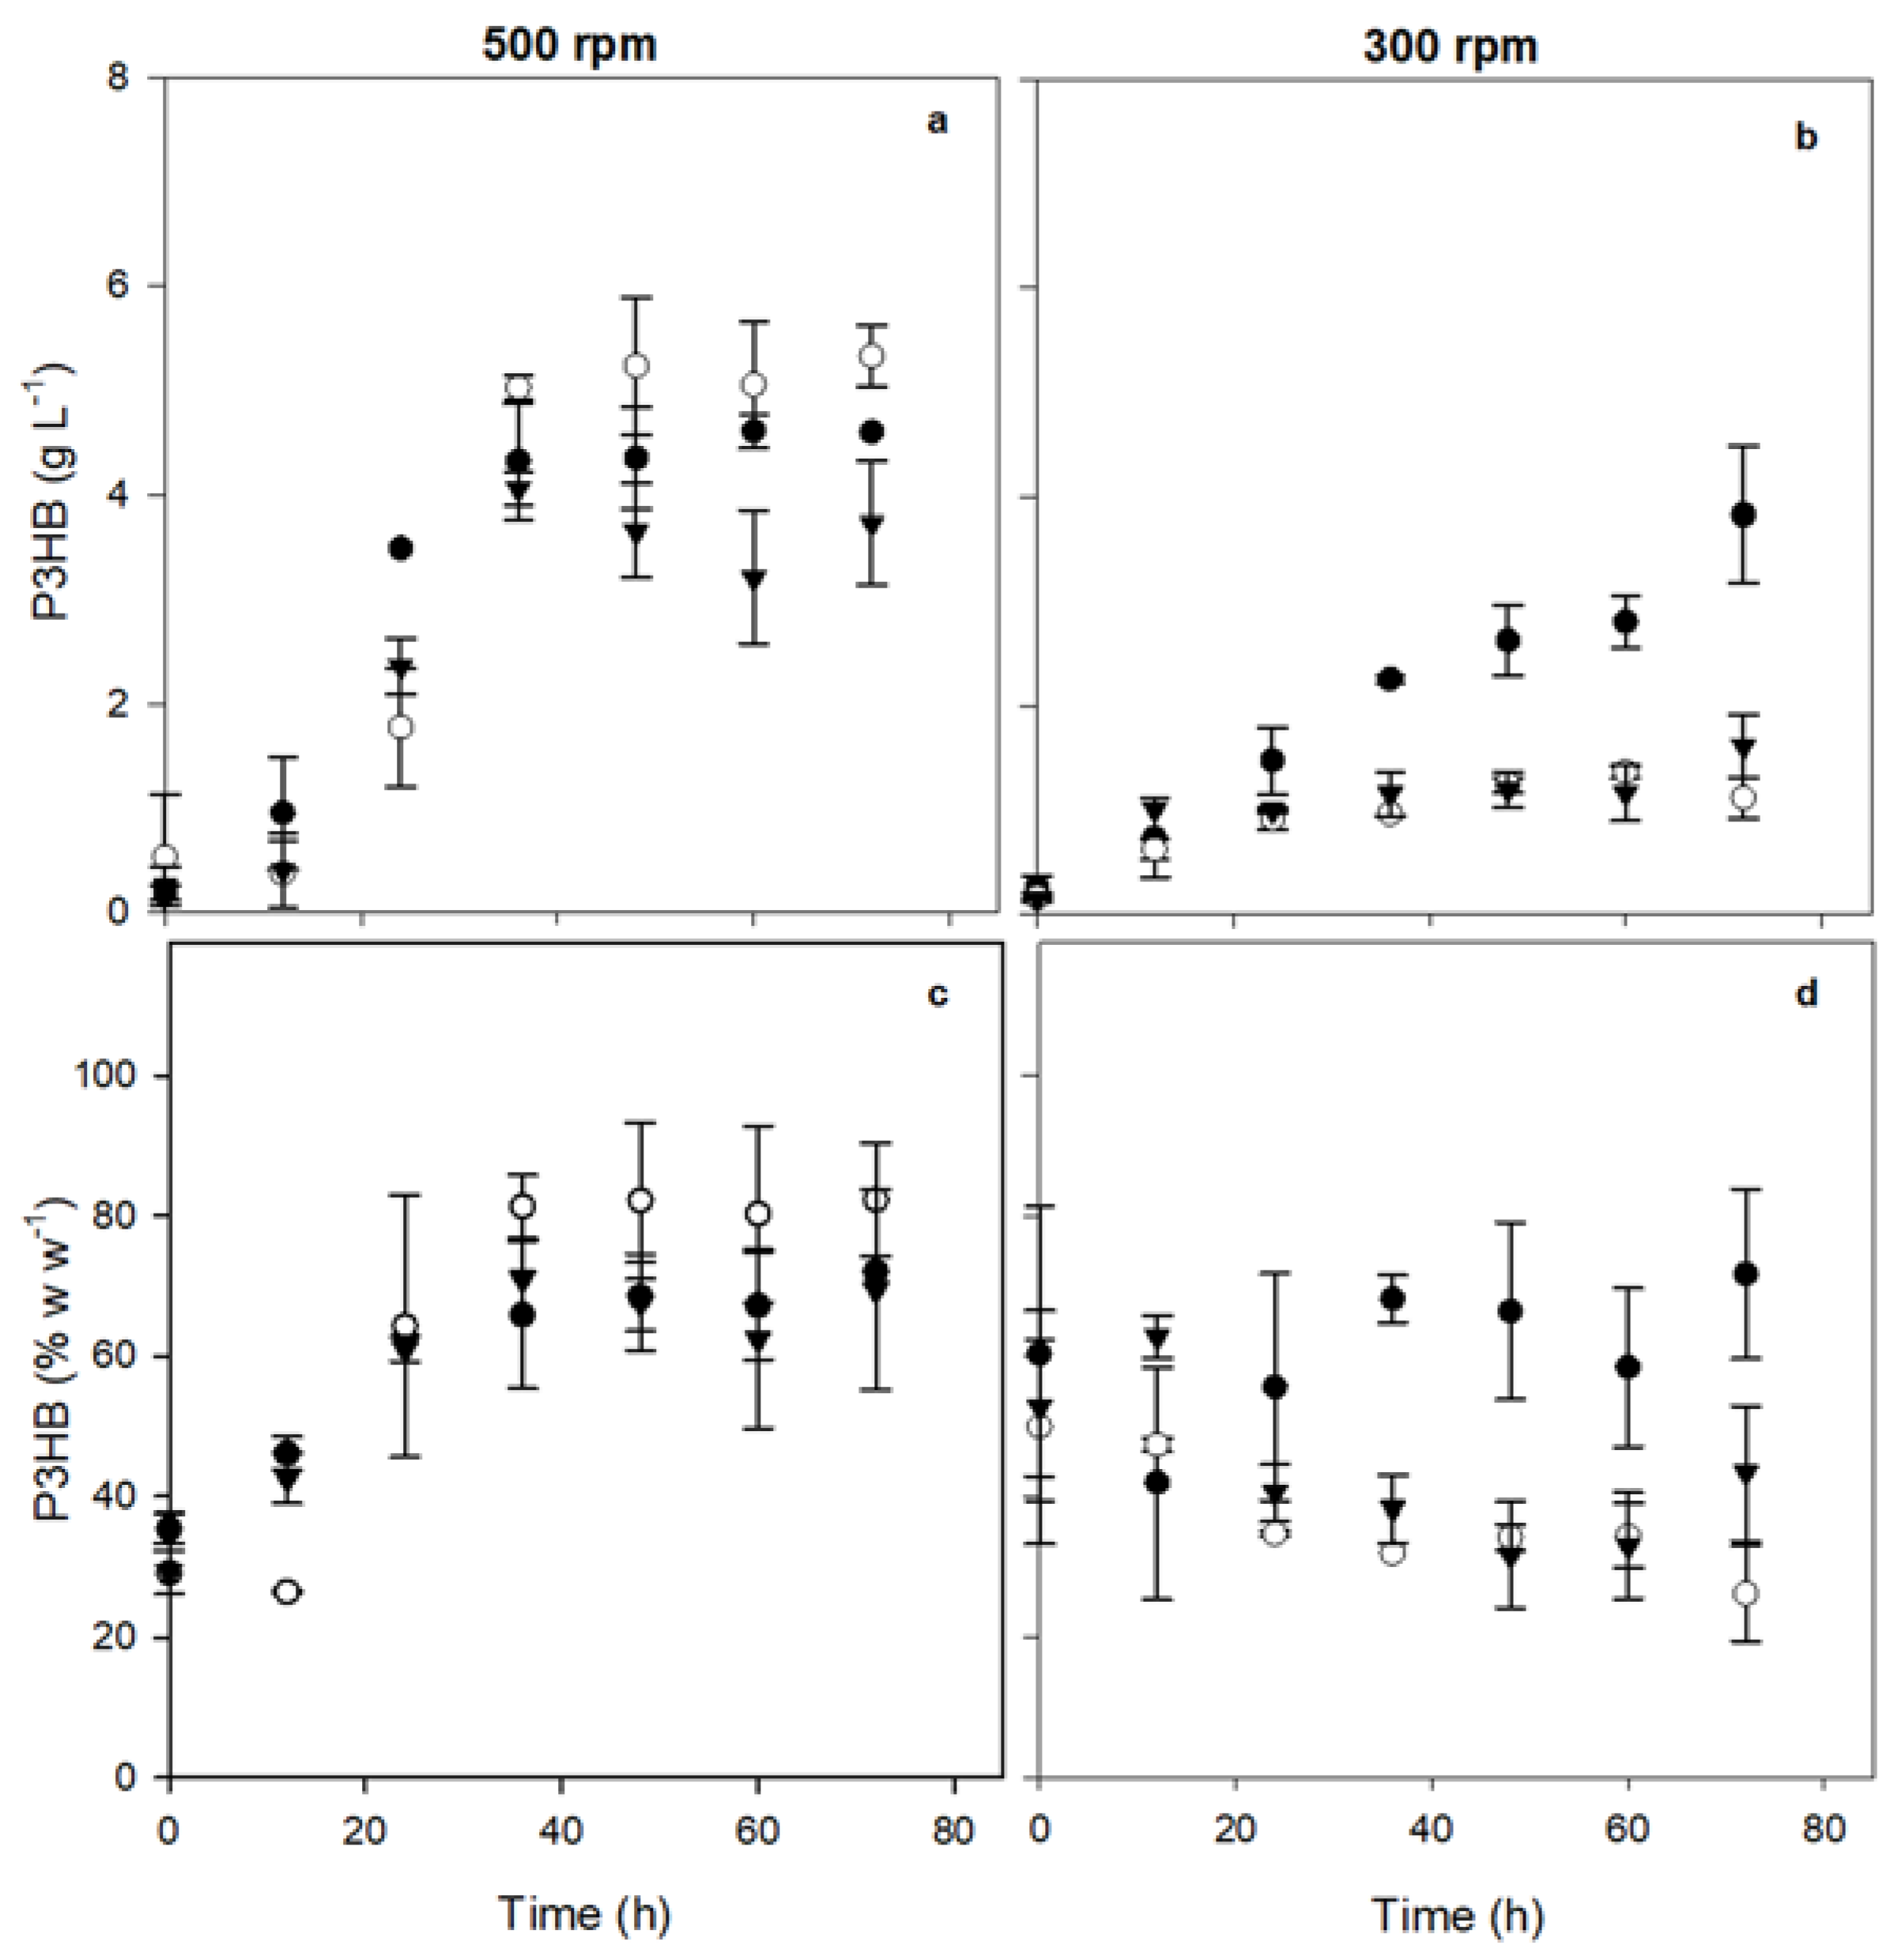
Figure 3a shows the kinetics of P3HB production of the three strains evaluated at 500 rpm. It was observed that the absence of phasin PhbP2 resulted in an increase in the production of P3HB; whereas, the absence of phasin PhbP3 resulted in a decrease in the production of the polymer. The maximal concentrations were 4.60 ± 0.77g L⁻¹ for the OP strain, 5.33 ± 0.30 g L⁻¹ for the OP-PhbP2⁻ strain, and 3.74 ± 0.59 g L
ֿ ¹ for the OP-PhbP3⁻ strain (
Table 2).
Figure 3c shows the accumulation percentage of PHB at 5000 rpm. The OP-PhbP2 ̄ strain showed very high levels of PHB accumulation, reaching values of 82.2 ± 8.1% based on the dry weight of the bacteria. On the other hand, in the cultures with the OP strain, the percentage was 71.0 ± 1.4 %, and 73.92 ± 4.17 % for the OP-PhbP3 ̄ strain (
Table 2).
It is important to point out that in the cultures at 300 rpm (OTR about 5 mmol L⁻¹ h⁻¹), both the concentration (
Figure 3b) and the percentage of polymer accumulation (
Figure 3d) were lower with the three strains evaluated than those obtained at 500 rpm. As it is shown in
Figure 3b, the highest production of P3HB was obtained in the cultures with the OP strain, reaching 3.83 ± 0.65 g L
ֿֿ ¹. In the case OP-PhbP3 ̄ mutant strain, the P3HB production was 1.62 ± 0.30 g L
ֿֿ¹ and for the OP-PhbP2 ̄ strain was 1.37 ± 0.06 g L
ֿֿ ¹. Similarly, the percentage of polymer accumulation was around 70 % with the OP strain and 47.25 ± 0.97 % and 67.1 ± 0.00 % with OP-PhbP2 ̄ and OP-PhbP3 ̄ respectively (
Figure 3d) (
Table 2).
These results contrast with previous reports by other authors, who found that under conditions of low oxygen transfer, such as those obtained at 300 rpm, the synthesis of PHB is favored, because the carbon source is channeled through the TCA cycle, and much of the carbon source is directed to P3HB production instead to bacterial growth. However, those studies were performed with a different strain (OPNA) that has inactivated the
rsmA and
ptsN genes that are involved in the regulation of PHB synthesis [
21].
More recent studies by Gómez-Hernández et al [
17], reported a behavior similar to that observed in this study. Those authors found that maximal production (4.2 ± 0.4 g L
ֿֿ ¹) and accumulation of P3HB (90 ± 4.6 % w w⁻¹) using the strain OP was reached in the cultures grown at 500 rpm (high OTR
max). On the contrary, the lowest P3HB production of approximately 1.6 ± 0.3 g L
ֿֿ ¹ (56.0 ± 2.2 % w w⁻¹) was obtained at 300 rpm (low OTR
max).
This increase in the production and accumulation of P3HB at high oxygen transfer may be due to the activation of a cell protection mechanism against oxidative stress, as previously was reported by García-Cabrera et al. [
16]. Those authors found that in cultures at high oxygen transfer (20.2 mmol L
ֿֿ ¹ h
ֿ ¹),
Rhizobium phaseoli increases the activity of catalase, an enzyme that acts on hydrogen peroxide, and the production of P3HB as a strategy to address with oxygen stress situations.
On the other hand, it was suggested that in
Curpriavidus necator, phasins modulate the activity of P3HB depolymerase Z1 and Z2, respectively [
24]. In the case of
Azotobacter sp. FA-8, PhaPAz is the most abundant P3HB granule-associated protein [
23,
25]. It has been found that this protein displays a growth-promoting effect, also enhancing the polymer production in recombinant P3HB-producing
Escherichia coli [
22].
3.3. Molecular Weight Distributions of Polymers Produced by the OP and Mutant Strains
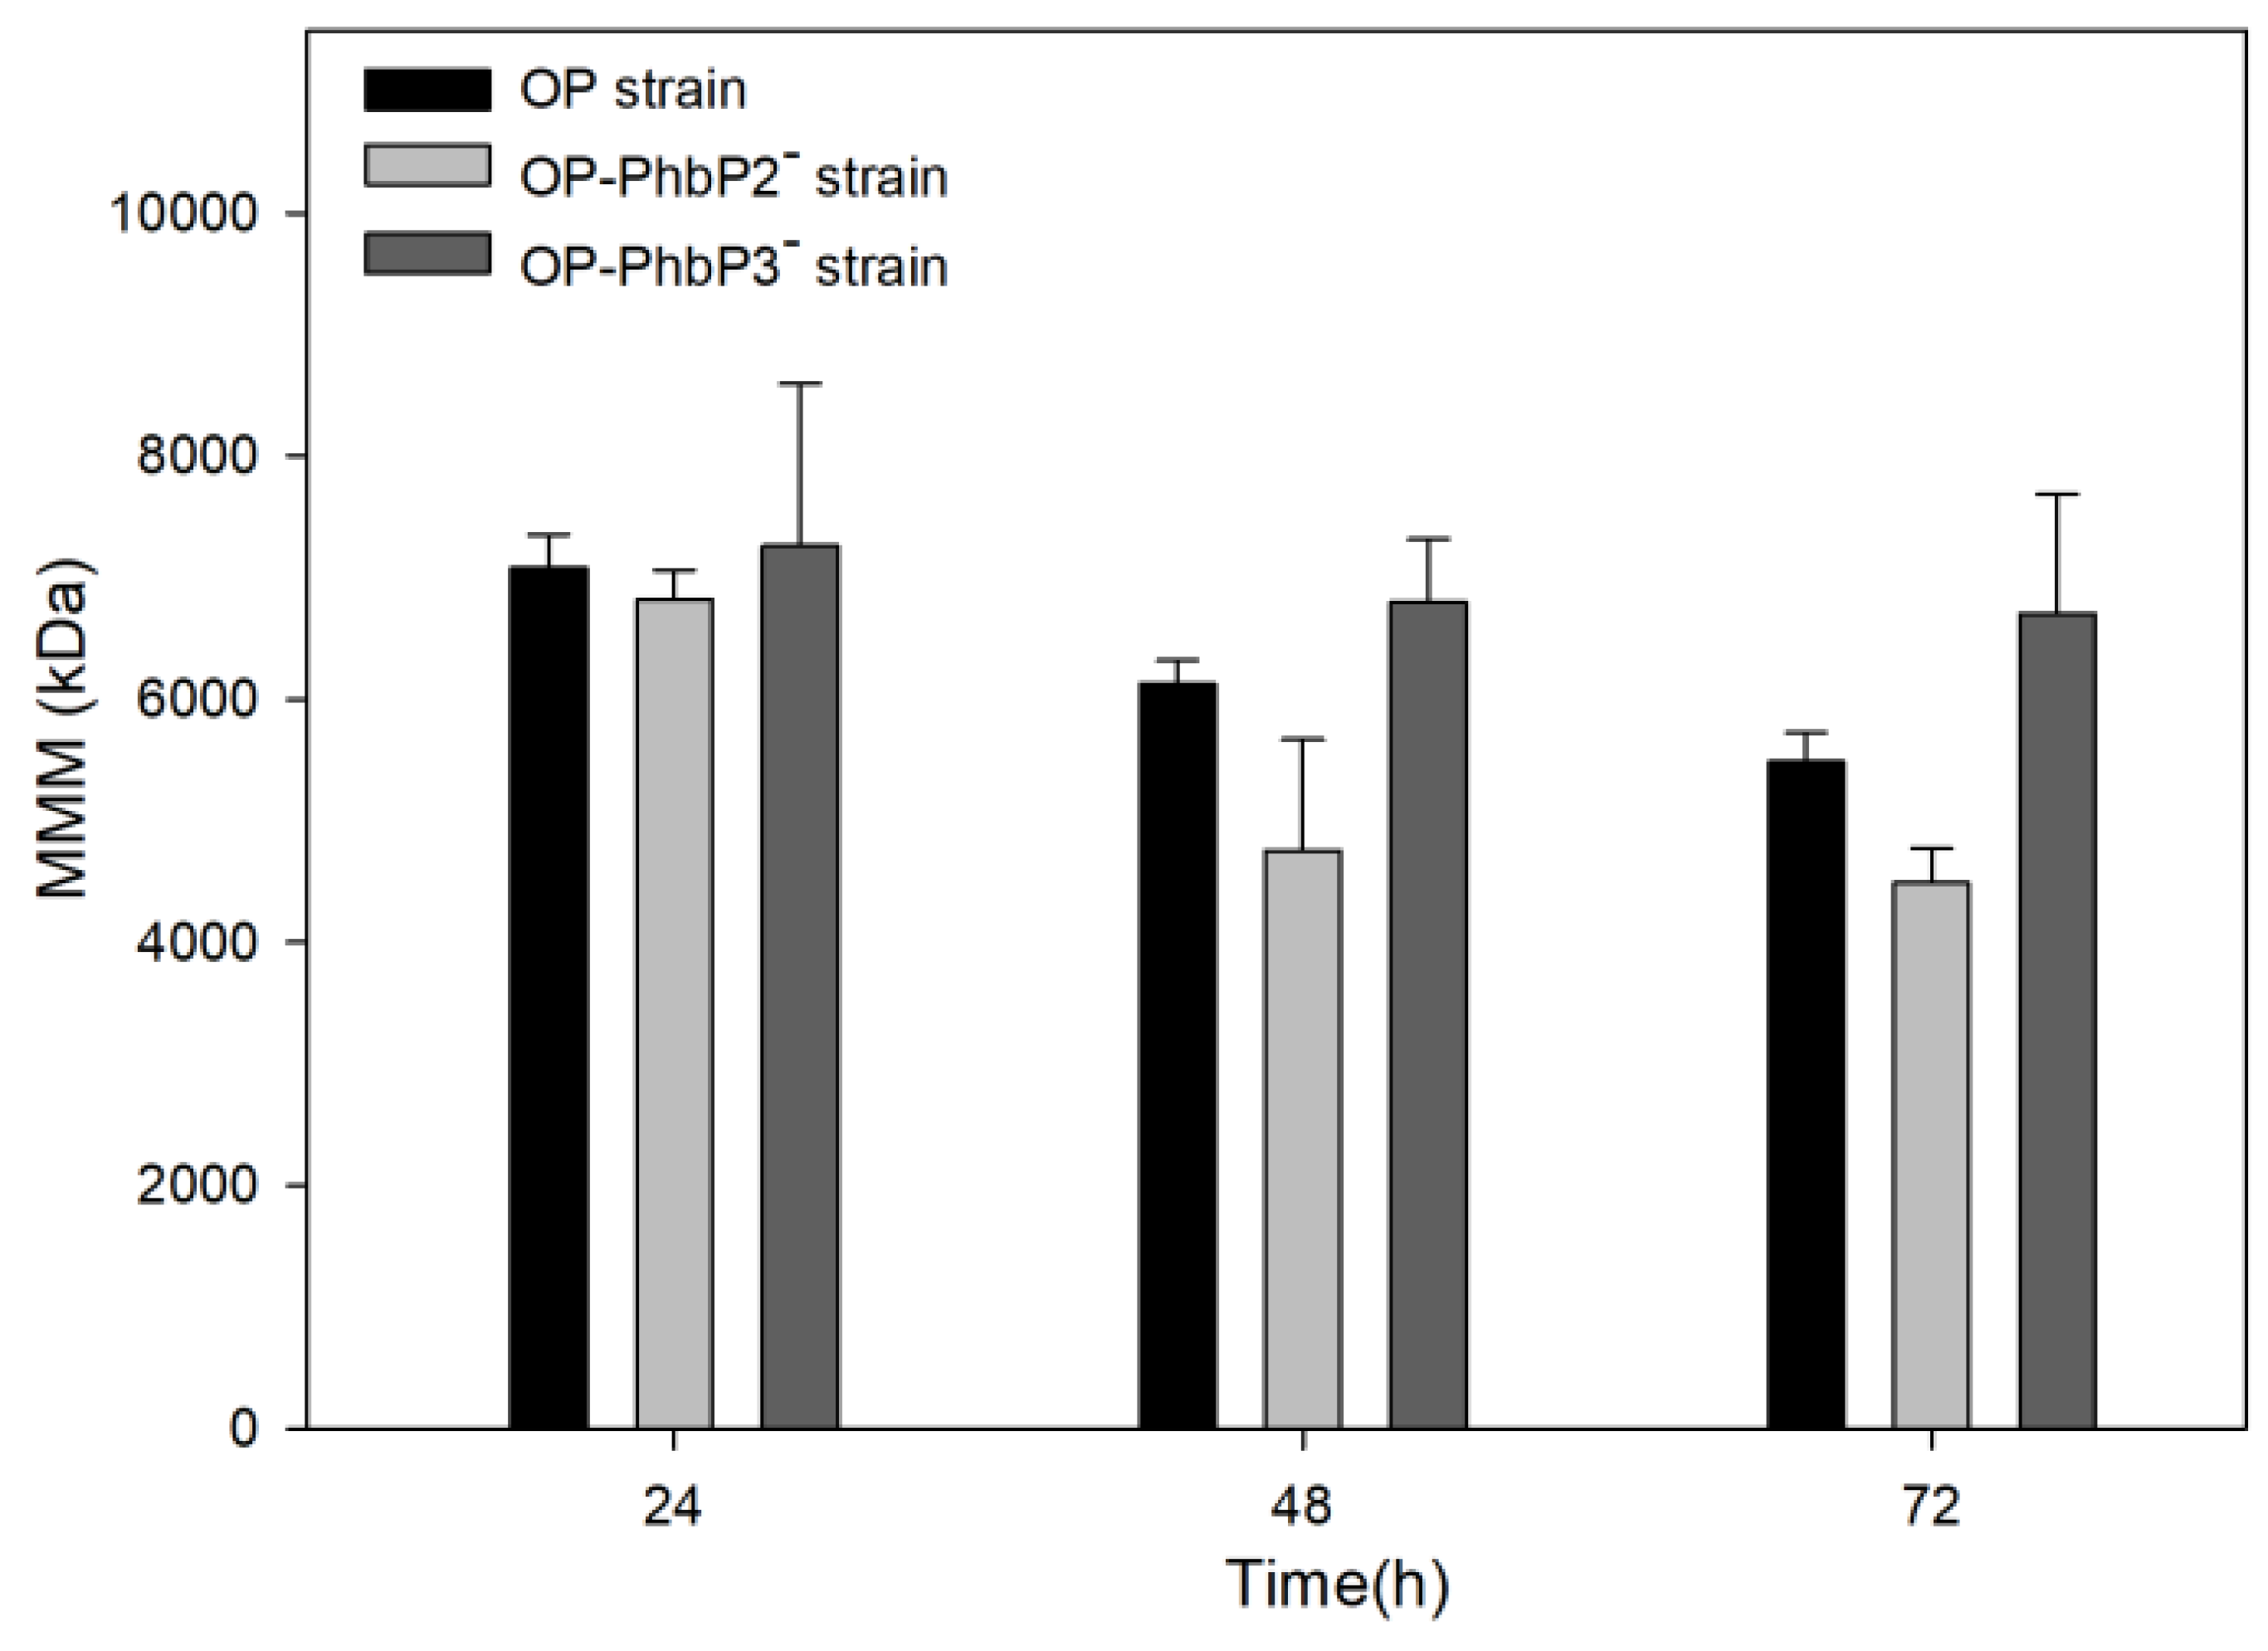
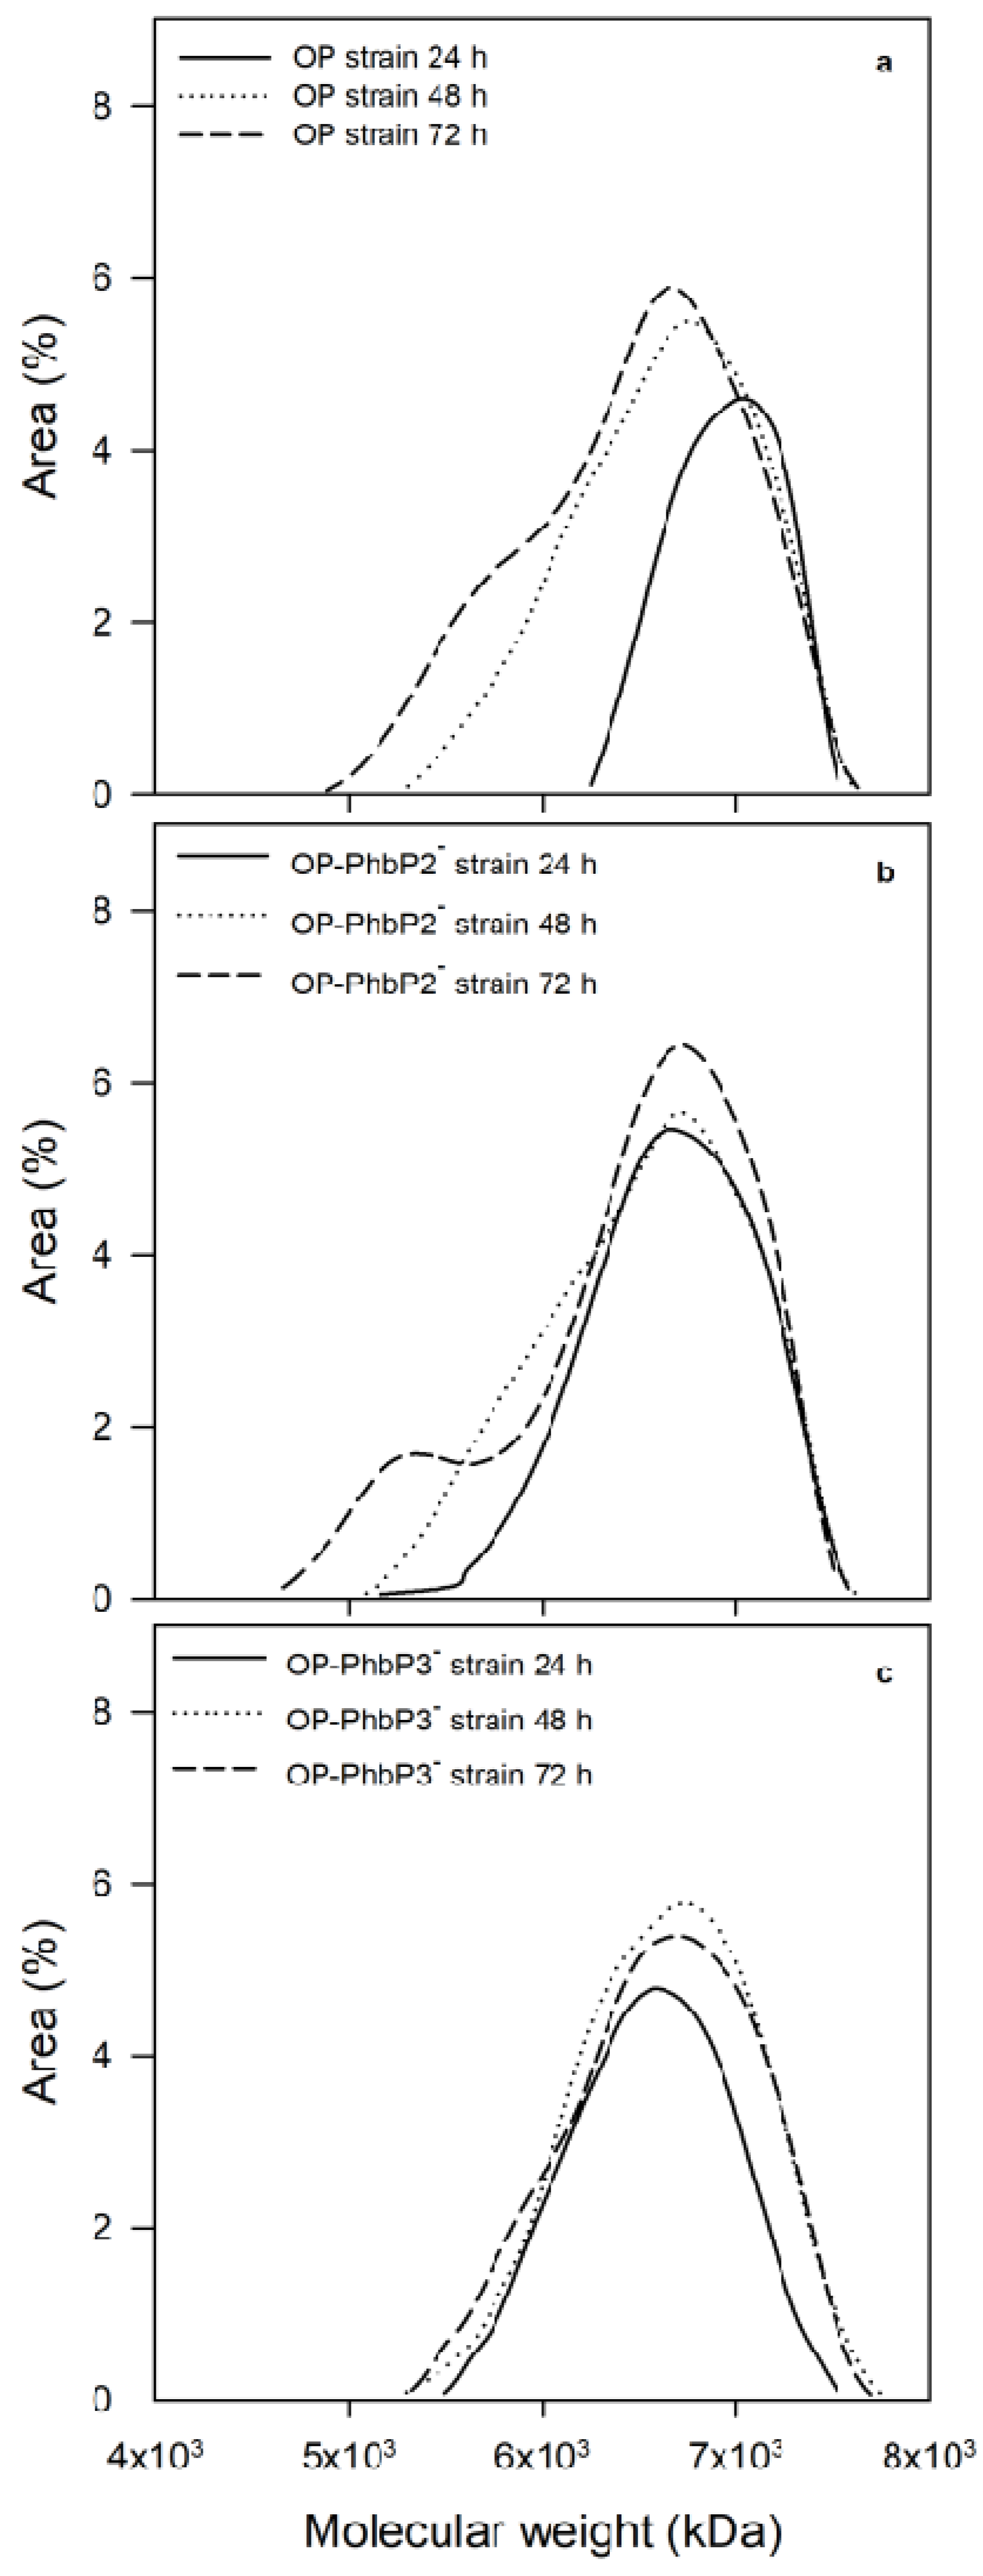
Figure 4 shows the mean molecular mass data of the three strains evaluated at 500 rpm. A maximal molecular mass of 7080 ± 273 kDa and 6820 ± 237 kDa were reached in the P3HB produced by the OP strain and the strain OP-PhbP2 ̄ at 24 h of cultivation. At the end of the culture (72 h), the mean molecular mass of the polymer decreased in both strains to values of 5480 ± 239 kDa and 4489 ± 281 kDa for the polymers produced respectively by the OP strain and OP-PhbP2 ̄ . It is interesting to note that in the case of the strain OP-PhbP3 ̄ , the mean molecular weight remains constant throughout the cultivation at a value of 7262 ± 1334 kDa at 24 h of cultivation and 6704 ± 981 kDa at 72 h.
To better understand the changes observed in the molecular weight of P3HB,
Figure 5 shows the molecular weight distribution of the P3HB accumulated at 24, 48 and 72 h for the three strains tested. It is clear from the figure that in the case of the OP strain, at 24 h, most of the P3HB fractions are in the range of 1000 to 10,000 kDa; whereas, at 48 and 72 h a significant change in the distribution is found, with a high percentage of molecules in the range of 100 to 1000 kDa. On the other hand, in the polymer synthesized by the OP-PhbP2 ̄ strain, a phenomenon similar to that identified in the OP strain is observed, especially at 72 h, where the percentage of molecules in the range of 100 to 1000 kDa increased significantly. In contrast, in the case of the OP-PhbP3 ̄ strain, no relevant changes were observed in the distribution of molecular weights as a function of culture time and most of the fractions are in the range of 1000 to 10000 kDa, independently of culture time. This behavior is reflected in the polydispersity index (PI) of the product, finding that in the polymer produced by the OP strain and OP-PhbP2 ̄ the values at the end of the culture are higher than 3 (3.01 ± 2.04 and 4.93 ± 0.88, respectively); whereas for the polymer synthesized by the strain OP-PhbP3 ̄ , the PI was of 1.27 ± 0.05.
The decrease in the molecular weight throughout the culture with the OP and OP-PhbP2 ̄ strains, could be related with the increase in the activity of depolymerases during the stationary stage of the culture. Previous studies with the OP strain [
27] have found an increase between 40 to 50 % in the activity of depolymerases at the end of the exponential growth phase and the stationary phase under oxygen transfer conditions similar to those used in the present study. In contrast, the P3HB synthase activity decreased about 50 % at the end of the stationary phase [
26].
Regarding the behavior observed in the P3HB synthesized by the OP-PhbP3 ̄ strain, there is no a complete explanation. It is possible to hypothesize that the phasin could activate the P3HB depolymerase Z1, which is known to cause a decrease in the molecular weight of the P3HB [
26,
27], and the absence of phasin PhbP3 would negatively affect the activity of depolymerase Z1, since it has been observed that the elimination of this depolymerase increases the MMM along the culture [
27].
There are some examples where changes in the expression of different phasins had effects on the molecular weight of the PHAs produced. For example, in
Aeromonas hydrophila, the over-expression of the phasin PhaPAh reduced the molecular weight of the PHA produced to approximately 50 % of that of the wild type strain. This phenotype was explained by the authors as a possible indirect effect through the PHA synthase, because over-expression of
phaPAh increased transcription of PhaCAh, and over-expression of
phaC also negatively affected the molecular weight [
29].
On the other hand, the phasin PhaPAh from
Aeromonas hydrophila seems to regulate phaCAh gene at the transcriptional level [
29]. If a similar regulation occurs in
A. vinelandii, the amount of PhbC would be affected in the phasin mutants, and a correlation between the active synthase concentration and the molecular weight of the PHA produced has been reported, where it was found that the lower the PhaC concentration, the higher the molecular weight of the polymer [
30].
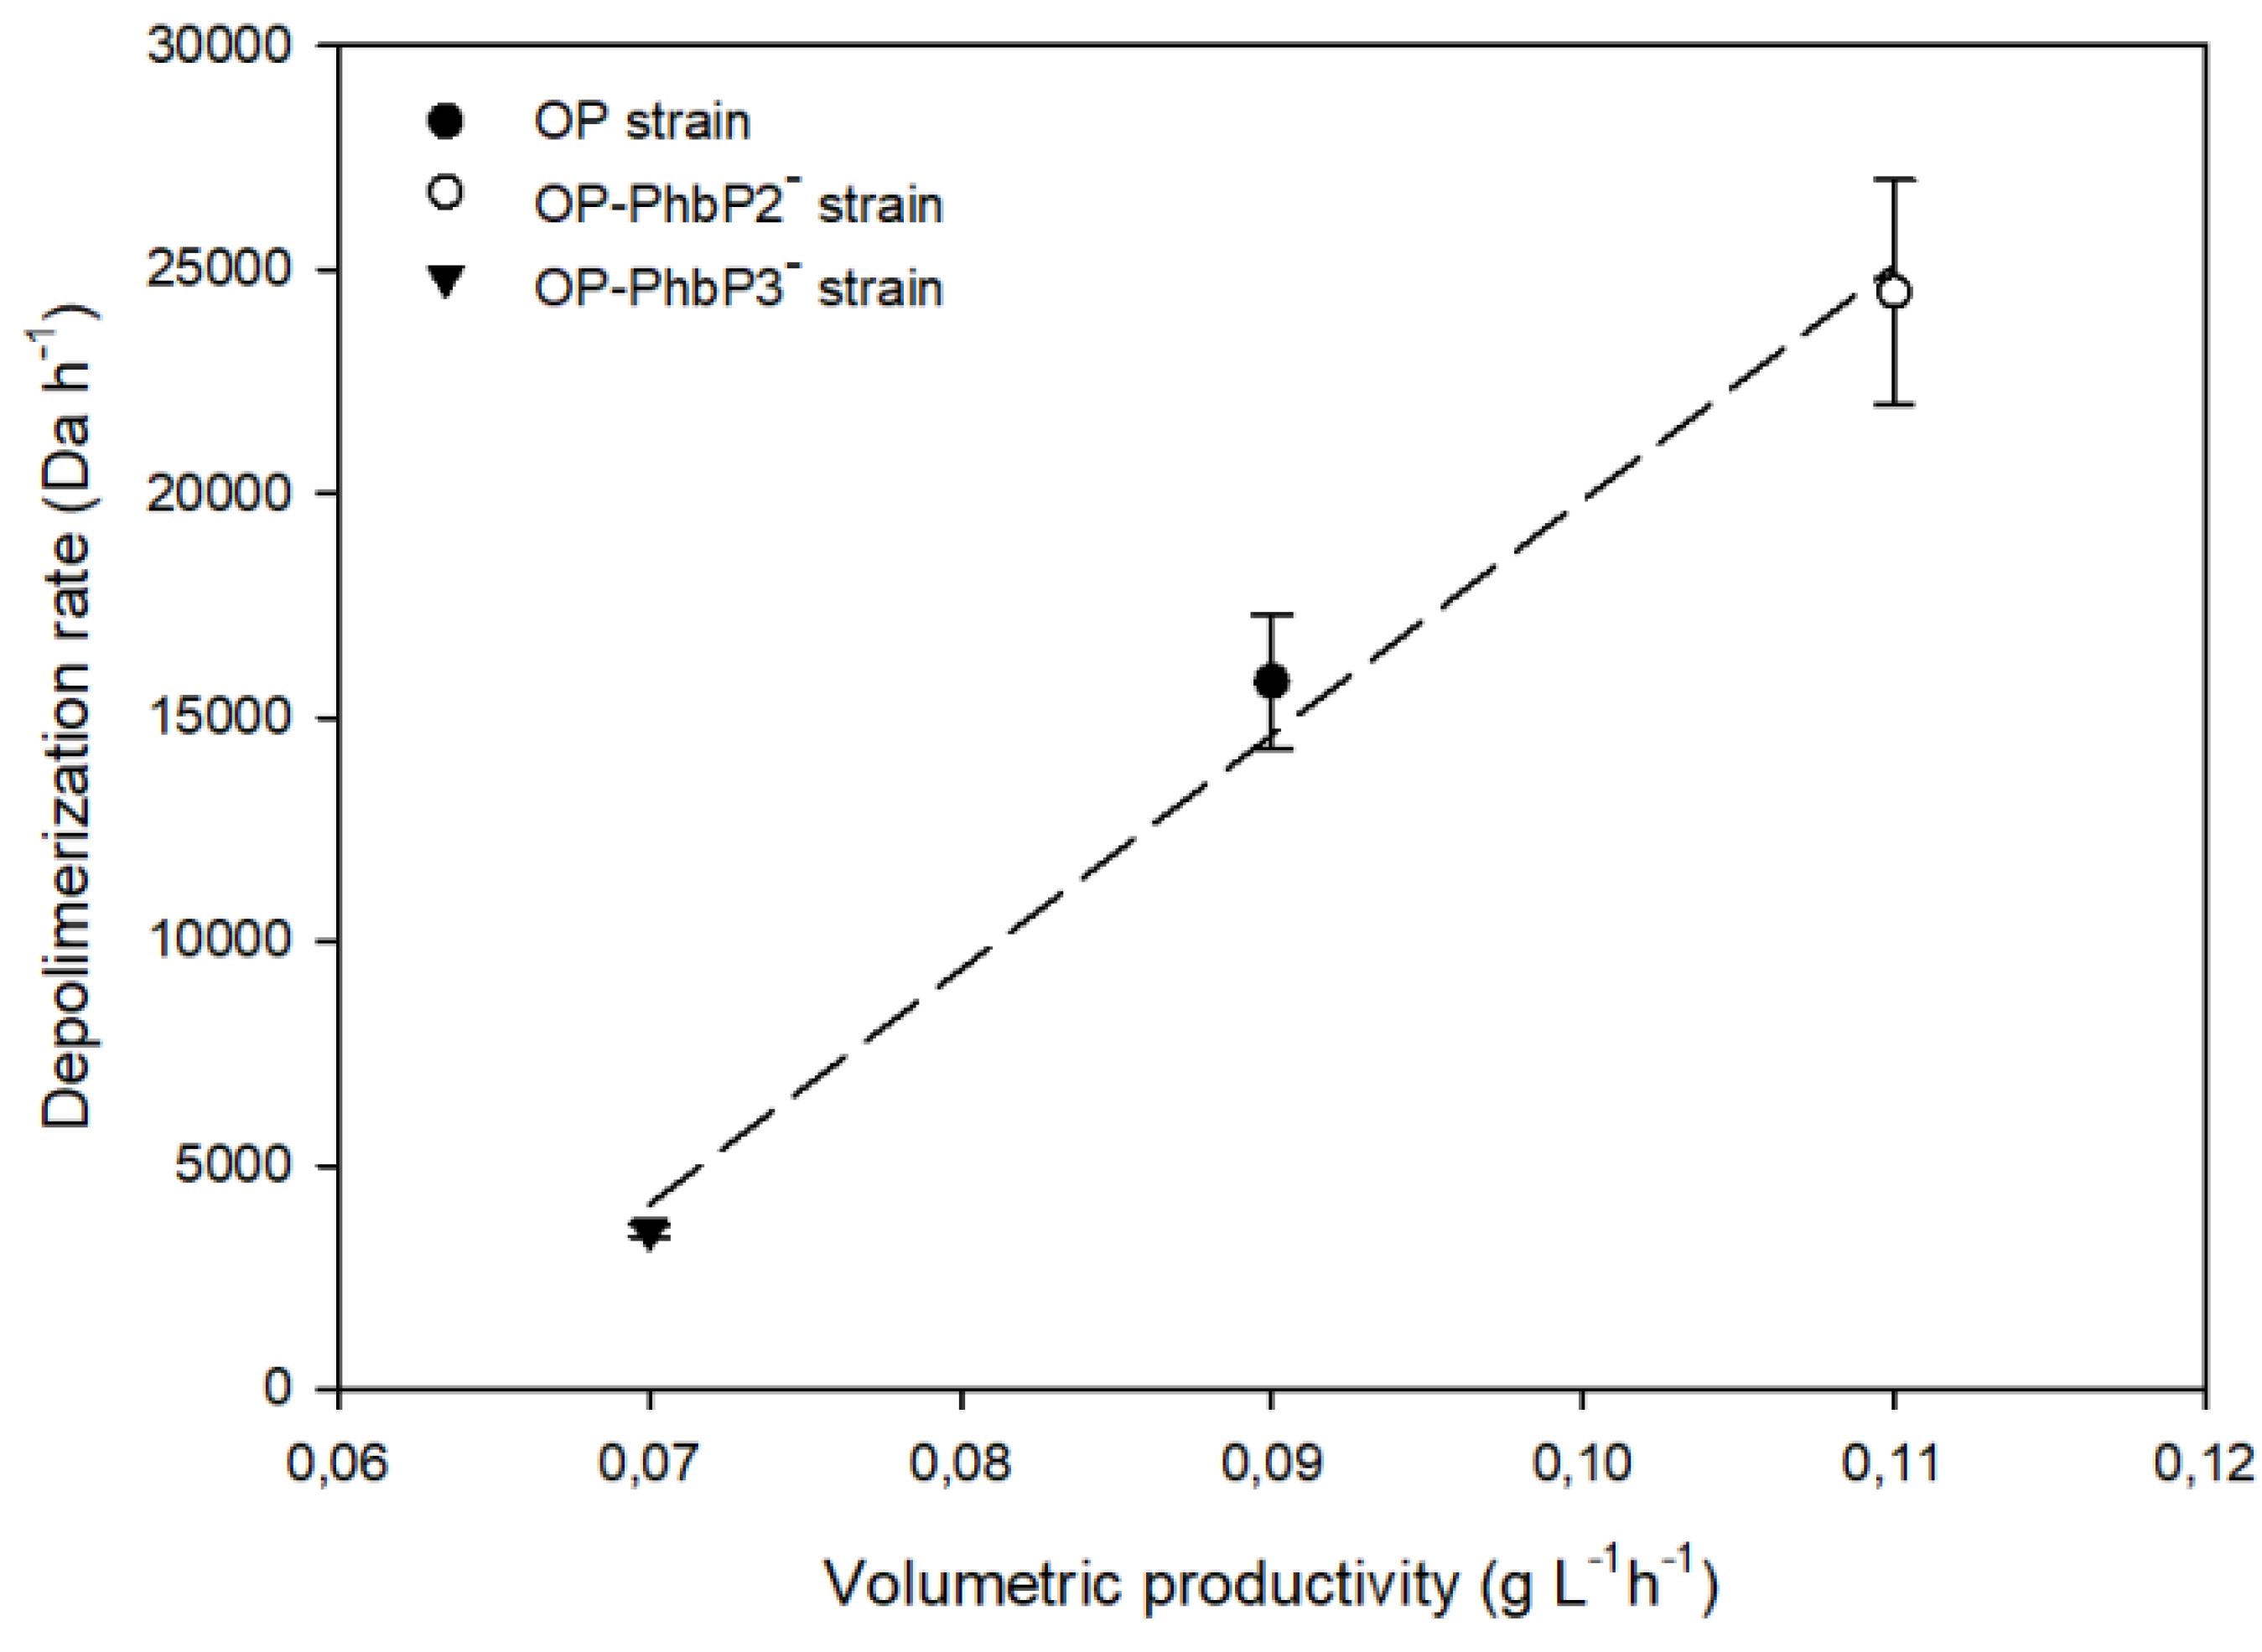
As shown in
Figure 6, a direct relationship between the depolymerization rate, determined in the range of 24 to 72 h of cultivation, and the synthesis rate of P3HB for the cultures developed with the different strains, was found. For the lowest QP3HB (0.075 ± 0.002 gP3HB L
ֿֿ ¹ h
ֿ ¹), obtained in the cultivations using the OP-PhbP3 ̄ mutant strain, a depolymerization rate of 3555 ± 136 Da h⁻¹ was reached. On the other hand, in the cultures with the OP strain the QP3HB was 0.09 ± 0.002 gP3HB L
ֿֿ ¹ h
ֿ ¹), with a depolymerization rate 5 times higher (15800 Da h⁻¹ ) than that with the OP-PhbP3 ̄ strain. The extreme condition occurs with the OP-PhbP2 ̄ strain, where the highest rate of P3HB synthesis was reached (0.11 gP3HB L
ֿֿ ¹ h
ֿ ¹ ), and a high rate of depolymerization (24500 Da h⁻¹ ).
This trend was previously reported by Millán et al [
26] who found a close relationship between the synthesis rate of PHB and the molecular weight of polymers. These authors reported that when the rate of PHB synthesis is increased, by manipulating the polymer content in the inoculum, a significant decrease in the molecular weight of the polymer was observed.
In addition, this behavior is similar to that observed in recombinant
E. coli and
Azohydromonas lata cultures, where an inverse relationship between the P3HB production rate and the molecular mass was reported [
31,
32,
33]. On the other hand, studies in our group [
26] have shown that in the case of the cultures developed using an inoculum with 50 % of P3HB the synthase activity was higher when the P3HB productivity is higher (growth exponential phase) and this activity decreases significantly during the stationary phase of growth, when the productivity of P3HB decreases [
28].
5. Conclusions
Overall, our results have demonstrated, for the first time, that the absence of phasin PhbP3 and PhbP2 causes a significant decrease in specific growth rate in cultures of the mutant strains conducted at high OTR. In contrast, the absence of phasin phbP2 favors the production of the polymer; however, a decrease in the MMM of the polymer was observed at the end of the culture, probably as a consequence of the depolymerase activity, regulated by the presence of this phasin; a behavior that was not observed in the polymer synthesized by the strain OP-phbP3 ̄ strain.
Author Contributions
Claudia Aguirre carried out the experimental work, the analysis of the results and the integration of the manuscript. Andrés Pérez helped in the elaboration of the figures and the integration of the manuscript. Daniel Segura, Alvaro Díaz y Enrique Galindo contributed to the formal analysis of results, as well as the review and editing and discussion and Carlos Peña contributed to the conceptualization and obtaining the resources to carry out the study. All authors have read and agreed to the published version of the manuscript.
Funding
This work was partially financed by Dirección General de Asuntos del Personal Académico National Autonomous University of Mexico (Grant IG200222).
Institutional Review Board Statement
Not applicable
Data Availability Statement
The data presented in this study are available on request from the corresponding author.
Acknowledgments
The authors thank to Celia Flores and Rosa Elia Quiroz for their technical support.
Conflicts of Interest
The authors declare no conflict of interest.
References
- Philip, S.; Keshavarz, T.; Roy, I. Polyhydroxyalkanoates: biodegradable polymers with a range of applications. J. Chem. Technol. Biotechnol. 2007, 82, 233–247. [Google Scholar] [CrossRef]
- Peña, C.; Castillo, T.; García, A.; Millán, M.; Segura, D. Biotechnological strategies to improve the production of microbial poly-(3-hydroxyburyrate): a review of recent research work. Microbiol Biotechnol. 2014, 7, 278–293. [Google Scholar] [CrossRef] [PubMed]
- Iwata, T. Strong fibers and films of microbial polyesters. Macromol Bios. 2005, 5, 689–701. [Google Scholar] [CrossRef] [PubMed]
- Magagula, S.I.; Mohapi, M.; Sefadi, J.S.; Mochane, M.J. The production and applications of microbial-derived polyhydroxybutyrates. In Microbial Polymers: Applications and Ecological Perspectives. Vaishnav & Choudhary (Eds); Springer Nature. Singapore, 2021, pp. 3-43.
- Andler, R.; Rojas, V.; Pino, V.; Castro, R. I.; Valdés, C.; Kumar, V.; Peña, C.; Díaz-Barrera, A. Efficient production of a polyhydroxyalkanoate by Azotobacter vinelandii OP using apple residues as promising feedstock. Int. J. Biol. Macromol. 2023, 242, 124626. [Google Scholar] [CrossRef] [PubMed]
- Jendrossek, D.; Pfeiffer, D. New insights in the formation of polyhydroxyalkanoate granules (carbonosomes) and novel functions of poly(3-hydroxybutyrate). Environ Microbiol. 2014, 16, 2357–2373. [Google Scholar] [CrossRef] [PubMed]
- Mezzina, M.; Pettinari, J. Phasins, multifaceted polyhydroxyalkanoate granule-associated proteins. Appl. Environ. Microbiol. 2016, 82, 5060–5067. [Google Scholar] [CrossRef]
- Soo-Lee, H.; Lee, H.; Kim, S.; Cho, J.; Suh, M.; Ham, S.; Bhatia, S.; Gurav, R.; Kim, Y.; Lee, E.; Yang, Y. Novel phasins from the arctic Pseudomonas sp. B14-6 enhances the production of polyhydroxybutyrate and increases inhibitor tolerance. Int. J. Biol. Macromol. 2021, 190, 722–729. [Google Scholar]
- Tang, R.; Peng, X.; Weng, C.; Han, Y. The overexpression of phasin and regulator genes promoting the synthesis of polyhydroxybutyrate in Cupriavidus necator H16 under nonstress conditions. Appl. Environ. Microbiol. 2022, 88, e01458–21. [Google Scholar] [CrossRef]
- Handrick, R.; Technow, U.; Reichart, T.; Reinhardt, S.; Sander, T.; Jendrossek, D. The activator of the Rhodospirillum rubrum PHB depolymerase is a polypeptide that is extremely resistant to high temperature (121°C) and other physical or chemical stresses. FEMS Microbiol. Lett. 2004, 230, 265–274. [Google Scholar] [CrossRef]
- Pötter, M.; Steinbüchel, A. Poly(3-hydroxybutyrate) granule-associated proteins: Impacts on poly(3-hydroxybutyrate) synthesis and degradation. Biomacromolecules. 2005, 6, 552–560. [Google Scholar] [CrossRef]
- de Almeida, A.; Nikel, P.I.; Giordano, A.M.; Pettinari, M.J. Effects of granule-associated protein PhaP on glycerol-dependent growth and polymer production in poly (3-hydroxybutyrate)-producing Escherichia coli. Appl. Environ. Microbiol. 2007, 73, 7912–7916. [Google Scholar] [CrossRef] [PubMed]
- Quiroz-Cardoso, R.; Castillo, T.; Galindo, E.; Ruíz Escobedo, J.; Segura, D.; Peña, C. Looking for improved strains of Azotobacter vineladii and favorable culture conditions yielding high molecular weight Poly-3-hydoxybutyrate (P3HB). J. Chem. Technol. Biotechnol. 2024. submitted. [Google Scholar]
- Díaz-Barrera, A.; Andler, R.; Martínez, I.; Peña, C. Poly-3-hydroxybutyrate production by Azotobacter vinelandii strains in batch cultures at different oxygen transfer rates. J. Chem. Technol. Biotechnol. 2016, 91, 1063–1071. [Google Scholar] [CrossRef]
- Díaz-Barrera, A.; Sanchez-Rosales, F.; Padilla-Córdova, C.; Andler, R.; Peña, C. Molecular weight and guluronic/mannuronic ratio of alginate produced by Azotobacter vinelandii at two bioreactor scales under diazotrophic conditions. Bioprocess Biosyst. Eng. 2021, 44, 1275–1287. [Google Scholar] [CrossRef]
- García-Cabrera, R. I.; Valdez-Cruz, N. A.; Blancas-Cabrera, A.; Trujillo-Roldán, M. A. Oxygen transfer rate affect polyhydroxybutyrate production and oxidative stress response in submerged cultures of Rhizobium phaseoli. Biochem. Eng. J. 2020, 162, 107721. [Google Scholar] [CrossRef]
- Gómez-Hernández, E.; Salgado-Lugo, H.; Segura, D.; García, A.; Díaz-Barrera, A.; Peña, C. Production of poly-3-hydroxybutyrate (P3HB) with ultra-high molecular weight (UHMW) by mutant strains of Azotobacter vinelandii under microaerophilic conditions. Appl. Biochem. Biotechnol. 2020, 193, 79–95. [Google Scholar] [CrossRef]
- Ruíz Escobedo, J. Estudio del papel de las proteínas Avin34710 y Avin34720 en el metabolismo de polihidroxibutirato (PHB) en la bacteria Azotobacter vinelandii. M. sC thesis, Universidad Nacional Autónoma de México, México, 2020.
- García, A.; Segura, D.; Espín, G.; Galindo, E.; Castillo, T.; Peña, C. High production of poly-β-hydroxybutyrate (PHB) by an Azotobacter vinelandii mutant altered in PHB regulation using a fed-batch fermentation process. Biochem. Eng. J. 2014, 82, 117–123. [Google Scholar] [CrossRef]
- Castillo, T.; Heinzle, E.; Peifer, S.; Schneider, K.; Peña, C. Oxygen supply strongly influences metabolic fluxes, the production of poly(3-hydroxybutyrate) and alginate, and the degree of acetylation of alginate in Azotobacter vinelandii. Proc. Biochem. 2013, 48, 995–1003. [Google Scholar] [CrossRef]
- García, A.; Ferrer, P.; Albiol, J.; Castillo, T.; Segura, D.; Peña, C. Metabolic flux analysis and the NAD(P)H/NAD(P)(+) ratios in chemostat cultures of Azotobacter vinelandii. Microb. Cell Fact. 2018, 17, 10. [Google Scholar] [CrossRef]
- de Almeida, A.; Catone, M. V.; Rhodius, V. A.; Gross, C. A.; Pettinari, M. J. Unexpected stress-reducing effect of PhaP, a poly(3- hydroxybutyrate) granule-associated protein, in Escherichia coli. Appl. Environ. Microbiol. 2011, 77, 6622–6629. [Google Scholar] [CrossRef]
- Mezzina, M.P.; Wetzler, D.E.; de Almeida, A.; Dinjaski, N.; Prieto, M.A.; Pettinari, M.J. A phasin with extra talents: a polyhydroxyalkanoate granule-associated protein has chaperone activity. Environ. Microbiol. 2015, 17, 1765–1776. [Google Scholar] [CrossRef] [PubMed]
- Bresan, S.; Sznajder, A.; Hauf, W.; Forchhammer, K.; Pfeiffer, D.; Jendrossek, D. Polyhydroxyalkanoate (PHA) granules have no phospholipids. Sci Rep. 2016, 6, 26612. [Google Scholar] [CrossRef]
- Pettinari, J.M.; Chaneton, L.; Vazquez, G.; Steinbuchel, A.; Mendez, B.S. Insertion sequence-like elements associated with putative polyhydroxybutyrate regulatory genes in Azotobacter sp. FA8. Plasmid. 2003, 50, 36–44. [Google Scholar] [CrossRef]
- Millán, M.; Segura, D.; Galindo, E.; Peña, C. Molecular mass of poly-3-hydroxybutyrate (P3HB) produced by Azotobacter vinelandii is determined by the ratio of synthesis and degradation under fixed dissolved oxygen tension. Process Biochem. 2016, 51, 950–958. [Google Scholar] [CrossRef]
- Adaya, L.; Millán, M.; Peña, C.; Jendrossek, D.; Espín, G.; Tinoco-Valencia, R.; Guzmán, J.; Pfeiffer, D.; Segura, D. Inactivation of an intracellular poly-3-hydroxybutyrate depolymerase of Azotobacter vinelandii allows to obtain a polymer of uniform high molecular mass. Appl. Microbiol. Biotechnol. 2018, 102, 2693–2707. [Google Scholar] [CrossRef]
- Millán, M.; Salazar, M.; Segura, D.; Castillo, T.; Díaz-Barrera, A.; Peña, C. Molecular mass of Poly-3-hydroxybutyrate (P3HB) produced by Azotobacter vinelandii is influenced by the polymer content in the inoculum. J. Biotechnol. 2017, 259, 50–55. [Google Scholar] [CrossRef] [PubMed]
- Tian, S.J.; Lai, W.J.; Zheng, Z.; Wang, H.X.; Chen, G.Q. Effect of over-expression of phasin gene from Aeromonas hydrophila on biosynthesis of copolyesters of 3- hydroxybutyrate and 3-hydroxyhexanoate. FEMS Microbiol. Lett. 2005, 244, 19–25. [Google Scholar] [CrossRef]
- Hiroe, A.; Ushimaru, K.; Tsuge, T. Characterization of polyhydroxyalkanoate (PHA) synthase derived from Delftia acidovorans DS-17 and the influence of PHA production in Escherichia coli. J. Biosci. Bioeng. 2013, 115, 633–638. [Google Scholar] [CrossRef]
- Kusaka, S.; Abe, H.; Lee, S.; Doi, Y. Molecular mass of poly [(R)-3-hydroxybutyric acid] produced in a recombinant Escherichia coli. Appl. Microbiol. Biotechnol. 1997, 47, 140–143. [Google Scholar] [CrossRef]
- Hiroe, A.; Tsuge, K.; Nomura, C. T.; Itaya, M.; Tsuge, T. Rearrangement of gene order in the phaCAB operon leads to effective production of ultrahigh-molecular-weight poly [(R)-3-hydroxybutyrate] in genetically engineered Escherichia coli. Appl. Microbiol. Biotechnol. 2012, 78, 3177–3184. [Google Scholar] [CrossRef]
- Penloglou, G.; Kretza, E.; Chatzidoukas, C.; Parouti, S.; Kiparissides, C. On the control of molecular weight distribution of polyhydroxybutyrate in Azohydromonas lata cultures. Biochem. Eng. J. 2012, 62, 39–47. [Google Scholar] [CrossRef]
|
Disclaimer/Publisher’s Note: The statements, opinions and data contained in all publications are solely those of the individual author(s) and contributor(s) and not of MDPI and/or the editor(s). MDPI and/or the editor(s) disclaim responsibility for any injury to people or property resulting from any ideas, methods, instructions or products referred to in the content. |
© 2024 by the authors. Licensee MDPI, Basel, Switzerland. This article is an open access article distributed under the terms and conditions of the Creative Commons Attribution (CC BY) license (http://creativecommons.org/licenses/by/4.0/).
