
Submitted:
27 August 2024
Posted:
28 August 2024
You are already at the latest version
Preprints on COVID-19 and SARS-CoV-2
Abstract
The risk of a fatal outcome was 41% in unvaccinated patients (p = 0.713), which increased by 2.66% with co-infection with two pathogens (p = 0.342) and by 26% with three pathogens (p = 0.005). Additionally, 50% of ICU patients had a triple infection, compared with only 1.3% in the inpatient unit (p = 0.0029). The risk of death and/or ICU admission was 12 times higher (p = 0.042) with an additional pathogen and increased by 95% (p = 0.003) with a third concomitant pathogen. Regular multiplex testing is important for prompt treatment and targeted antibiotic use.
Keywords:
SARS-CoV-2
; co-infection
; respiratory viruses
; Haemophilus influenzae
; RSV
1. Introduction
Globally, the COVID-19 pandemic has impacted the health and economic systems of every affected country. After the emergence of the first strain of SARS-CoV-2, and then Alpha, Delta, and Omicron, the virus gradually acquired a strong degree of spread with increased transmissibility and infectivity [1]. Pre-Omicron variants of SARS-CoV-2 were relatively more aggressive and overwhelmed the hospital system [2]. This resulted in the implementation of emergency non-pharmaceutical measures, isolation, and reduced travel to contain the spread of SARS-CoV-2. These measures have impacted the spread of other respiratory bacteria and viruses. During the winter seasons of 2020/2021 and 2021/2022, reduced or no spread of influenza viruses was reported worldwide [3,4,5]. Before the 2018–2020 COVID-19 pandemic, the average prevalence of respiratory viruses reported in studies ranged from 49.8% to 39%, while in the 2020–2021 pandemic, the prevalence was significantly reduced to 13.4% [6]. A low prevalence of respiratory viruses invariably reflects the level of evidence for respiratory co-infections. Before the pandemic, reported rates of mixed respiratory viral infections were in the order of 10% [7]. During the height of the pandemic in 2020, one study put the rate of SARS-negative patients at 4.3%, and that of positives was even lower, at 2.5% [8]. The data on the prevalence of co-infections associated with COVID-19 vary across studies: prevalences of 7% and 3% of bacterial and viral co-infections in hospitalized patients have been reported [9]. Another meta-analysis reported a 5% incidence of co-infections with SARS-CoV-2 and other respiratory viruses, noting that it was greater (approximately 9.4%) in pediatric patients than in adults (3.5%) [10]. Serious respiratory viral infections are worsened by bacterial co-infections and secondary infections, leading to higher rates of illness and death [11]. Some of the most commonly reported co-pathogens in hospitalized patients with COVID-19 are Mycoplasma pneumoniae (MP), Haemophilus influenza (HI), and Chlamydia pneumoniae (ChP) [12,13,14,15].
Several studies have confirmed that a large percentage of SARS-CoV-2 infections are asymptomatic [16,17]. However, such an asymptomatic or clinically manifested SARS-CoV-2 infection in combination with an infection caused by another respiratory virus or bacteria may worsen the clinical course of the disease. A previous study by this team reported a 25% increase in the probability of a fatal outcome in SARS-CoV-2-positive patients co-infected with another respiratory virus compared with mono-infected ones [18]. In that study, we did not simultaneously examine bacterial and viral co-infections. Our study addresses this gap by evaluating the clinical burden of bacterial and viral co-infections. Previous studies have given little or no attention to the impact of accumulating co-infections compared with dual infection. This study's uniqueness lies in evaluating the risk of concurrent infection with multiple co-pathogens compared with mixed infections with two co-pathogens.
Mixed infections can significantly weaken the body's immune system, worsening the disease. Bacteria and viruses have a symbiotic relationship that can lead to co-infections [19]. Bacteria can promote viral infection by altering the host's immune response, controlling surface adhesion proteins, and activating viral proteins [20]. Similarly, viruses can assist bacteria in causing secondary infections by compromising the host's immune response, disrupting the integrity of the epithelial barrier, and expressing surface receptors and adhesion proteins [21,22,23]. Patients with pneumonia caused by COVID-19 have a clinical and radiographic presentation similar to that of other viral, fungal, and bacterial pneumonia [24]. Therefore, it is difficult for diagnosticians to distinguish the causative agents of the respiratory infection. This delays treatment and makes it difficult to choose targeted antibiotic treatment and/or antiviral therapy [25]. Understanding these mechanisms is critical to the effective management of infectious diseases. In COVID-19 patients, it is crucial to differentiate between bacterial and viral co-pathogens to provide targeted treatment while minimizing antibiotic overuse [26]. This study aimed to determine the etiology and clinical manifestations of mixed infections with bacterial and viral co-pathogens.
2. Materials and Methods
2.1. Population Survey and Sampling
Between August 2021 and May 2022, nasopharyngeal samples were collected from 337 SARS-CoV-2-positive patients. The inclusion criterion was based on a positive test for SARS-CoV-2. Emergency department patients with milder symptoms as well as those hospitalized with severe and moderate COVID-19 were included. Patients admitted to intensive care units were also included in the study. The patient samples were collected from two different hospitals in Bulgaria: SBALPB "Prof. Ivan Kirov", Sofia, and UMBAL "Prof. Dr. Stoyan Kirkovich", Stara Zagora. All data on the studied patients were collected from the medical records at the hospitals. The data analyzed included symptoms, oxygen saturation, blood tests, antiviral and antibiotic use, other medications received, oxygen therapy required, the length of hospital stay, intensive care unit (ICU) admission, and fatal outcome.
Specimens for testing were collected using viral transport media from patients who visited the emergency department or were hospitalized within the first 24 hours of admission and up to 7 days after the onset of respiratory symptoms. The nasopharyngeal swabs were sent to the National Laboratory "Influenza and ARD" in refrigerated conditions at 4°C. Before shipping, the samples are stored at 4°C for a maximum of 72 hours. Upon arrival at the laboratory, the samples were processed on the same day or, if this was not possible, stored at -80°C until analysis.
2.2. Detection of Respiratory Co-Pathogens
2.2.1. Extraction
We used an automated extraction system with the Exi-Prep Dx Viral DNA/RNA kit from Bioneer, Daejeon, the Republic of Korea, to isolate viral and bacterial DNA/RNA. We utilized 400 µL of the primary clinical material, and it took 1 hour and 34 minutes to complete the process. The extraction system offered a choice of final volume ranging from 25 µL to 100 µL, and we selected the largest volume to avoid re-extraction.
2.2.2. Detection of Bacterial Co-Pathogens
For the simultaneous detection of three bacterial pathogens—Haemophilus influenzae (HI), Mycoplasma pneumoniae (MyPn), and Chlamydia pneumoniae (ChPn)—a multiplex PCR mixture was prepared using an AgPath-ID™ One-Step RT-PCR kit (Thermo Fisher Scientific, Waltham, MA, USA) and the set of primers indicated in supplementary Table S1 [27].
A CFX96 Touch PCR system (Bio-Rad Laboratories, Inc., Hercules, CA, USA) was used. The temperature conditions for the reaction are indicated in Table 1. The reaction lasted 1 hour and 10 minutes.
After DNA amplification, the resulting PCR products were separated using capillary electrophoresis with a QIAxcel Advanced Automated DNA Analysis System (Qiagen, Hilden, Germany).
The resulting bands were compared with a molecular marker and positive controls for the respective bacteria acquired and confirmed using the external quality control program INSTAND (Figure 1) (the control was carried out by the National Reference Laboratory for Molecular Microbiology, annually). The expected size of the PCR products (bp) for the individual bacteria is described in supplementary Table S1, indicating the primers used.
2.2.3. Detection of Viral Co-Pathogens
A total of 6 Multiplex Real-time PCR mixes were prepared for the simultaneous detection of 8 seasonal respiratory viruses—respiratory syncytial virus (RSV), human metapneumovirus (HMPV), parainfluenza virus (PIV) types 1/2/3, rhinovirus (RV), adenovirus (AdV), and bocavirus (BoV)—and 4 endemic human coronaviruses (HCoVs) (229E, NL63, OC43, and HKU1).
The working mixes had the following combinations:
- (1)
- AdV, RSV, and PIV1;
- (2)
- BoV, RV, and PIV2;
- (3)
- HMPV and PIV3;
- (4)
- HCoV-229E and HCoV-HKU-1;
- (5)
- HCoV-NL63 and HCoV-OC43;
- (6)
- SARS-CoV-2 and influenza A and B viruses (FluSC2).
The primer and probe combinations listed in supplementary Table S2 and by previous authors [28,29] were used to prepare the PCR mixes combined with the SuperScript™ III one-step RT-PCR system with Platinum™ Taq DNA polymerase (Thermo Fisher Scientific, Waltham, MA, USA). We used FluSC2 primers and probes donated by the CDC in Atlanta, GA, USA, together with an Applied Biosystems™ TaqMan™ Multiplex Master Mix PCR System supplied by Thermo Fisher Scientific (Waltham, Massachusetts, USA) for the detection of SARS-CoV-2 and influenza viruses A and B.
The following temperature conditions were used to detect SARS-CoV-2, influenza, and other respiratory viruses:
Reverse transcription: 25 °C for 2 min and then 50 °C for 15 min;
Initial denaturation: 95 °C for 2 min;
Amplification for 45 cycles: 95 °C for 15 seconds and then 55 °C for 30 seconds.
Samples with a cycle threshold (Ct) value of <38 were considered positive. Samples that tested positive for SARS-CoV-2 and other respiratory viruses with a Ct value below 31 were selected for NGS. The samples were re-extracted following a previously described protocol, and the Ct value was re-measured using real-time PCR.
2.3. Next-Generation Sequencing (NGS)
The ARTIC protocol was used to isolate the entire genome of SARS-CoV-2. NGS was performed using the Illumina MiSeq system with reagent kit v2 500 cycles (Illumina, San Diego, CA, USA). The genetic sequences were deposited in GISAID. Analysis to define SARS-CoV-2 variants was performed using the Pangolin COVID-19 Lineage Assigner v4.3 program. The quantification of the purified library pool was performed using the Qubit™ dsDNA HS Assay Kit (Thermo Fisher Scientific). The libraries underwent analysis to determine the distribution of fragment sizes using QIAxcel Advanced capillary electrophoresis (Qiagen, Hilden, Germany).
2.4. Definitions and Data
Pneumonia was determined using X-ray examination and the presence of pulmonary infiltrates. Acute respiratory distress was defined by the definition of Berlin [30].
The patient assessment used the following category scale (1-7) to evaluate their condition: 1—not hospitalized, with a resumption of normal activity; 2—not hospitalized, but cannot resume normal activities; 3—hospitalized, not requiring additional oxygen; 4—hospitalized, requiring additional oxygen; 5—hospitalized, requiring high-flow nasal oxygen therapy, non-invasive mechanical ventilation, or both; 6—hospitalized, requiring ECMO, invasive mechanical ventilation, or both; and 7—death.
Data from the discharge summary included demographic information, comorbidities, symptoms, lab results, and medication use. Pneumonia diagnosis was confirmed via X-ray, and acute respiratory distress syndrome was defined according to the Berlin criteria.
2.5. Statistical Analysis
Fisher's exact tests or chi-square tests were used to analyze the data for categorical variables. Continuous variables were compared using the Mann–Whitney U test, mediated via the OriginPro software and GraphPad (https://www.graphpad.com/quickcalcs/contingency1/). The Cox proportional hazards model was used to estimate risk, mediated via the DATAtab software (https://datatab.net/statistics-calculator/survival-analysis/cox-regression). Probabilities were two-tailed, and P-values of <0.05 were considered statistically significant.
3. Results
3.1. Population Characteristics
This retrospective study spanned ten months from 2021 to 2022 and included 337 patients who tested positive for SARS-CoV-2. Of these, 277 were hospitalized (73.5%) and 100 outpatients (26.5%) with confirmed SARS-CoV-2 infection. Patients ranged in age from 3 months to 92 years (mean age: 57.8 ± 25.7), with 55% being female and 45% male. The patients were categorized into four age groups: 0-5 years (n = 48; 14.3%), 6-16 years (n = 8; 4.8%), 17-64 years (n = 122; 19%), and 65 years and older (n = 159; 61.9%).
3.2. Detection of Co-Infections in COVID-19 Patients
In the group of SARS-CoV-2-positive patients, 42 (12.4%) had mixed infections. Bacterial co-infections were more common than viral ones, with 27 (8%) patients having bacterial co-infections compared with 19 (5.6%) having viral co-infections. Of the patients studied, 5 (1.4%) had triple infections combined with SARS-CoV-2, another respiratory virus, and a bacterial co-pathogen. H. influenzae was identified as the most common co-pathogen in mixed infections with SARS-CoV-2, present in 20 clinical samples (5.93%). RSV was the second most common co-pathogen, found in 4 cases (1.18%). Among the triple infections, the most common combination was SARS-CoV-2 + H. influenzae + RSV, found in 3 cases (0.9%).

Table 2.
Proven co-infections with SARS-CoV-2.
| Co-Infection | n | % |
|---|---|---|
| SARS-CoV-2+HI | 20 | 47,62% |
| SARS-CoV-2+RSV | 4 | 9,52% |
| SARS-CoV-2 +ChP | 3 | 7,14% |
| SARS-CoV-2+AdV | 3 | 7,14% |
| SARS-CoV-2+HI+RSV | 3 | 7,14% |
| SARS-CoV-2+BoV | 2 | 4,76% |
| SARS-CoV-2+RV | 1 | 2,38% |
| SARS-CoV-2+HMPV | 1 | 2,38% |
| SARS-CoV-2+PIV3 | 1 | 2,38% |
| SARS-CoV-2+НKU-1 | 1 | 2,38% |
| SARS-CoV-2+NL63 | 1 | 2,38% |
| SARS-CoV-2+HI+AdV | 1 | 2,38% |
| SARS-CoV-2+HI+PIV2 | 1 | 2,38% |
| SARS-CoV-2+MyPn | 0 | 0% |
| SARS-CoV-2+PIV1 | 0 | 0% |
| SARS-CoV-2+PIV2 | 0 | 0% |
| SARS-CoV-2+229E | 0 | 0% |
| SARS-CoV-2+OC43 | 0 | 0% |
| SARS-CoV-2+Influenza A | 0 | 0% |
| SARS-CoV-2+Influenza B | 0 | 0% |
Figure 2 shows the distribution of each proven double or triple mixed infection. PIV2, RSV, AdV, and H. influenzae were frequent participants in triple infections, at 100%, 42.9%, 25%, and 20%, respectively.
3.3. Viral Load of Respiratory Virus Co-Infections
In this study, the real-time PCR Ct value was taken as an indirect measure of viral load. We found that the viral load of SARS-CoV-2 in each case of co-infection with other respiratory viruses was significantly higher (Ct mean: 23.6 ± 3.8 vs. 36.6 ± 3; p < 0.001).
3.4. Distribution of SARS-CoV-2 Variants in Individual Proven Co-Infections
SARS-CoV-2 sequencing analysis was performed in 305 (90.5%) of the patients studied. The SARS-CoV-2 Omicron (n = 32; 17.2%) and Delta (n = 2; 1.7%) variants were detected in 34 of the 42 patient samples with proven co-infection. Patients infected with the SARS-CoV-2 Omicron variant had a higher percentage of co-infections than those infected with the Delta variant (p = 0.0001). H. influenzae was also found to be the most frequent co-pathogen in patients infected with the Omicron BA.2 variant of SARS-CoV-2 (n = 13; 38.2%). The data in Table 3 demonstrate that a co-pathogen of bacterial origin was more frequent than that of viral origin in patients infected with Omicron (n = 20 (62.5%) vs. n = 9 (28%); p = 0.0081). All three triple infections found in this study were of the Omicron BA.2 subvariant. Co-infections of bacterial origin were not detected in patients with the SARS-CoV-2 Delta variant.
3.5. Weekly and Seasonal Distribution of Confirmed Co-Infections
The study period spanned 28 weeks (August 2021–May 2022) (Figure 4). A high rate of mixed infections was evidenced in two periods in the fall of 2021 and the spring of 2022. The highest rate of co-infections was demonstrated during the 17 weeks of 2022 (April 25–May 1). This week also exhibited the greatest diversity in proven co-infections: SARS-CoV-2 + H. influenzae (n = 5), SARS-CoV-2 + RSV (n = 1), SARS-CoV-2 + H. influenzae + AdV (n = 1), and SARS-CoV-2 + H. influenzae + PIV2 (n = 1).
The patients with confirmed co-infections involving SARS-CoV-2 were categorized into four age groups to analyze their age distribution: 0-5, 6-16, 17-64, and 65 years and older (see Figure 5). The percentage of co-infections in children under 16 years old was 14.5%, while it was 8.2% in those over 16 years old (p = 0.6588). The highest proportion of mixed infections was observed among children aged 6-16 years (33.3%), followed by those under 5 years of age (20.8%). The greatest variety of viral and bacterial co-pathogens was observed in patients over 65 years of age.
3.6. Clinical Data of the Investigated Patients
Clinical data from 174/337 (51.6%) patients with COVID-19 were collected from their hospital records. The remaining patients were from emergency departments, and/or clinical data were missing. Patients most often showed symptoms of respiratory disease, such as fever (137 (78%)), fatigue (136 (78%)), cough (131 (75%)), and, less frequently, headache (44 (25%)) and rhinorrhea (59 (34%)). There were 27 (15%) patients with gastrointestinal symptoms, all of whom had diarrhea, and 104 (59.7) of the patients with clinical data had a complication such as pneumonia. The disease ended with a fatal outcome in 9.7% (17/174) of the examined patients, and 2.3% (4/174)were transferred to intensive care.
3.7. Age Characteristics of the Clinical Presentation of Respiratory Infection in Mono- and Co-Infected Patients
We examined the disease severity in patients testing positive for both SARS-CoV-2 and another respiratory infection in four age groups: 0-5, 6-16, 17-64, and over 65 (Table 4). Our findings revealed that patients aged 6-16 and over 65 showed the highest incidence of complications such as pneumonia (100% and 88%, respectively), and the mean CRP levels were increased in these two age groups (56% and 78%). Adults over 65 years of age had CRP levels that were approximately five times higher than those in children under 5 years of age (16.2 vs. 78.1; p = 0.033). Patients aged 65 and older had the lowest average oxygen saturation levels (below 90%) compared with the other age groups (Table 4). Patients older than 65 years also had a longer hospital stay than did those younger than 5 years (mean: 8.1 ± 3.7 days vs. 3.2 ± 2.2 days; p = 0.025).
Blood oxygen saturation levels were decreased in individuals in the 6-16, 17-64, and over-65 age groups co-infected with SARS-CoV-2 compared with those who were mono-infected. The mean SaO2% levels were 96% vs. 90.5% (p < 0.01), 93% vs. 91.7%, and 90.6 vs. 89.5% for each age group, respectively. We did not observe lower mean levels in co-infected individuals compared with mono-infected individuals among children under 5 years of age (mean SaO2 levels: 93.2% vs. 92.7%).
3.8. Vaccination Status
The later patients had received only one dose of the vaccine. Vaccination statuses were available for 155 patients. The age range of patients who received at least one dose of the SARS-CoV-2 vaccine was 37 to 92 years (mean age: 69.9 years ± 25.4). Of these patients, 27 (17.4%) were vaccinated. Among those vaccinated, 5 (18.5%) had received one dose, 14 (51.8%) had received two doses, and 8 (29.6%) had received three or more doses. The rate of proven co-infections was higher in vaccinated than unvaccinated individuals (29.6% vs. 15.6%, respectively). The mortality rate was higher in unvaccinated patients than in vaccinated patients (n = 2/16 (3.7%) vs. n = 14/128 (10.9%); p = 0.6926). Among patients with a fatal outcome, the percentage of vaccinated patients with co-infection was higher than that of non-vaccinated patients with co-infection (1/2 50% vs. 1/14 7%; p = 0.2417). In patients who did not survive, one vaccinated patient had a mixed infection with H. influenzae, and another vaccinated patient had both H. influenzae and RSV.
The Cox proportional hazards model (Figure 6) indicated that the risk of death was higher for individuals who were not vaccinated against SARS-CoV-2 and had mixed infections with two or three respiratory pathogens. The risk for unvaccinated patients was 41%, with a p-value of 0.713. The risk increased by 2.66 times with co-infection with two pathogens (p = 0.342) and by 26 times with three pathogens (p = 0.005).
3.9. Determining the Clinical Severity of COVID-19 in Mono- and Co-Infections with Bacterial and Viral Co-Pathogens: Treatment
The most frequently reported symptoms characteristic of SARS-CoV-2-positive patients, including fever, cough, fatigue, rhinitis, diarrhea, and headache, were tracked, as shown in Table 5. We found that patients with a positive SARS-CoV-2 test who were co-infected with a co-pathogen virus were more likely to experience headaches than those with a bacterial co-pathogen (44.4% vs. 5.3%; p = 0.03). The remaining symptoms showed no significant difference, as shown in Table 5. Regarding laboratory parameters, CRP levels were highest in patients co-infected with three pathogens, with mean levels above 100 mg/l. In addition, these patients also had the most critical blood oxygen saturation levels, with a mean of 87.8%.
Among patients with COVID-19 admitted to ICUs, a higher proportion had co-infection with another respiratory co-pathogen compared with patients with COVID-19 alone (9% vs. 0.7%; p = 0.0006). Furthermore, a significantly higher percentage of patients with triple infections were admitted to intensive care than those with double infections (40% vs. 5.3%; p = 0.05). The rate of H. influenzae-positive patients was significantly higher among those treated in intensive care units (75% (3/4)) compared with those treated in inpatient units (9% (14/153); p = 0.004). Furthermore, the rate of patients with triple infections was 50% (2/4) in the intensive care unit compared with 1.3% (2/153) in the inpatient unit (p = 0.0029).
The Cox proportional hazards model (Table 6) showed that the risk of death and/or ICU admission was 12 times higher (p = 0.042) for those who tested positive for SARS-CoV-2 and were infected with one co-pathogen, which increased by 95% with the appearance of a third (p = 0.003). Although result was not statistically significant, these two factors (occurrence of co-infection) were independently associated with a 29% increased risk of death, with increasing days from the first symptom to hospital admission (p = 0.131).
3.10. Treatment
Out of 174 patients, 119 (68%) were treated with antibiotics. In a subgroup of 24 patients diagnosed with bacterial infection, 66% received antibiotic treatment. Among the patients with SARS-CoV-2 and co-infection with another viral pathogen, 77% received antibiotic treatment out of a group of 9. Additionally, antiviral drugs were used in 9% of patients (n = 15), corticosteroids in 34% (n = 59), vasodilators in 6% (n = 11), heparin in 52% (n = 92), and oxygen therapy in 44% (n = 77).
4. Discussion
The COVID-19 pandemic has exposed the vulnerabilities in the health systems of several economically developed countries, including Bulgaria. Hospitals were severely overburdened during the peak spread of the SARS-CoV-2 Alpha and Delta variants [31]. In addition, the possibility of secondary or co-infection with a bacterial pathogen must be considered, which strains healthcare resources. Focusing solely on COVID-19 may cause serious bacterial infections to be overlooked [32]. Therefore, it is essential to identify co-infections in patients with COVID-19. The research shows an association between severe COVID-19, the need for intensive care, and mixed infections involving other respiratory pathogens [25,33,34]. Despite the available literature on such mixed infections, there are gaps in differentiating and comparing the severity of bacterial versus viral co-infections in patients with COVID-19. In addition, data on the clinical presentation of mixed infections with more than two pathogens, especially those involving SARS-CoV-2 and bacterial and other viral respiratory co-pathogens, are lacking or limited. Our study contributes to a better understanding of the clinical severity and etiology of mixed infections with bacterial and viral co-pathogens in SARS-CoV-2-positive patients.
Several studies have found a higher prevalence of bacterial co-infections than viral co-infections in patients testing positive for SARS-CoV-2 [35,36]. In this study, bacterial co-infections were more common than viral co-infections, with rates of 8% and 5.6%, respectively. These findings are consistent with another analysis that showed rates ranging from 3.0% to 9.7% for bacterial co-infections and from 5.4% to 6.6% for viral co-infections [35]. Several studies have shown that H. influenzae is the most common bacterial co-pathogen in SARS-CoV-2-positive patients. In our study, it was a common cause of multi-pathogenic co-infection (more than two co-pathogens), with a rate of 80% [37,38,39,40]. the most commonly reported viral co-pathogen with SARS-CoV-2 was RSV, consistent with the findings of this study [41,42]. In continuation of our previous study covering a consecutive period [18], here we also observed the same dependence in the measured Ct value, namely SARS-CoV-2 had significantly lower values than those of the other respiratory pathogens. Higher Ct values indirectly indicate a lower viral load or relatively attenuated infectivity in respiratory co-pathogens [43]. The results show that SARS-CoV-2 replicates to a greater extent than other respiratory viruses involved in co-infections. Some authors believe that SARS-CoV-2 may dominate over other respiratory viruses in a single-phase infection [44,45]. This may explain why co-infections are less common in patients with SARS-CoV-2. Another study by the team observed an increase in SARS-CoV-2 cases during the winter months of 2021 and spring 2022, with Omicron cases predominating [46].
The curve showing the prevalence of respiratory co-pathogens corresponds to the curve for mono-infections. Variations in this trend are influenced by seasonal and geographic factors and age-related patterns [47,48,49]. Asymptomatic infections with SARS-CoV-2 occur mainly in children [50]. The highest incidence of mixed infections with SARS-CoV-2 and respiratory pathogens was reported in children under 16 years of age (14.2%), as highlighted in a study from 2021 [51].
Co-infections are more common in children under 5 years of age [52], possibly due to the higher incidence of respiratory infections in this age group [53,54]. Several studies have indicated that SARS-CoV-2 infection is less common and less transmissible among children than adults [55,56]. Children who tested positive for SARS-CoV-2 were less likely to require respiratory support and intensive care and had shorter hospital stays than children with other respiratory viruses [57]. Clinical laboratory results show that SARS-CoV-2-positive and co-infected children under 5 years of age usually show mild elevations in CRP levels (mean: 16.2 mg/L), which is common in viral infections [58]. In addition, their average blood oxygen saturation levels are normal or near normal, with a mean of 93.2%. This differs from the usual signs of typical COVID-19 illness [59]. Conversely, these two parameters are typical for COVID-19 in co-infected patients aged over 65 years, showing low saturation (mean SpO2: 89.5%) and high mean CRP levels (mean CRP: 78.1mg/L). Adults aged ≥65 years remain at increased risk of severe illness from COVID-19 and have higher rates of COVID-19-related hospitalization than other age groups [60]. Additional co-infection can aggravate their condition and lead to a fatal outcome, so prevention of the disease is critical.
The results of this study demonstrate the effectiveness of the vaccine. Despite a higher rate of established co-infections with SARS-CoV-2 in vaccinated patients, their mortality was lower compared with non-vaccinated subjects with mixed infections involving a respiratory co-pathogen. It is important to highlight the likelihood of a high simultaneous prevalence of influenza and SARS-CoV-2 infections in the upcoming winter seasons as the spread curve of both viruses coincides with winter peak times [61]. Developing a combined influenza and SARS-CoV-2 vaccine would be beneficial in preventing deaths and reducing the risk of co-infection. Getting a flu shot can reduce the risk of hospitalization by 29% and the risk of overall death by 18% [62]. Vaccine effectiveness studies have convincingly demonstrated the benefits of COVID-19 vaccines in reducing individual symptomatic and severe illness, which helps lower hospitalizations and ICU admissions [63,64]. The importance of preventing COVID-19 is also highlighted by the significant difference between the percentage of ICU admissions with co-infection and those with mono-infection (9% vs. 0.7%; p = 0.0006). Our findings, like those from other studies, indicate that patients with co-infection with COVID-19 are more likely to require intensive care or experience fatality than those with mono-infection [10,65]. This study shows that COVID-19 patients with triple infections experience a more severe form of the disease compared with those with dual infections. The mean CRP levels in co-infections with the three pathogens were above 100 mg/l, and the mean saturation values were critically low at 87.8%. Meanwhile, these clinical indicators are also outside the limits in a mixed infection with two pathogens, but not in such critical limits. Research shows that high CRP levels combined with low saturation indicate a severe form of COVID-19 [66,67,68]. Furthermore, a higher percentage of patients with triple infections require intensive care compared with those with single or double infections. This highlights the importance of using multiplex diagnostics to detect a wider range of pathogens. Detecting co-infections is crucial for determining the cause of the disease and selecting the appropriate treatment [69]. Since symptoms and radiographic images are similar for both bacterial and viral respiratory infections, differentiating between the two can be challenging [70]. This is especially true in cases of co-infections with respiratory pathogens. As a result, the indiscriminate use of antibiotics is concerning, as evidenced by 68% of individuals receiving antibiotics, with only 66% and 77.8% being co-infected with a bacterial and viral co-pathogen, respectively. Implementing multiplex detection of respiratory pathogens in hospitals will likely reduce the emergence of resistant strains.
Despite its contribution to understanding the burden of mixed infections with bacterial and viral co-pathogens, this study had several limitations. The scope of this study was small because patient data were collected from only two hospitals. Clinical data on non-hospitalized patients are lacking, limiting the generalizability of the findings. Future studies should aim to collect data from a wider range of healthcare facilities to broaden the scope of this study. Furthermore, the Ct value is only an indirect method and does not account for the amplification efficiency of the primers for the different respiratory viruses.
5. Conclusions
In this study, mixed infections with SARS-CoV-2 were found to be relatively rare. Bacterial mixed infections are more common than viral ones. Patients with co-infections have a worse overall clinical condition than do those with a single infection, especially patients over 65 years of age. In addition, the presence of triple infection significantly worsens the condition of patients with COVID-19, leading to a greater need for intensive care and a higher risk of fatal outcomes compared with those infected with two pathogens. It is important to routinely perform multiplex testing of hospitalized patients with COVID-19 to ensure prompt treatment and targeted antibiotic use.
Supplementary Materials
The following supporting information can be downloaded at the website of this paper posted on Preprints.org.
Author Contributions
I.M. and I.T.: writing—review and editing, writing—original draft preparation, visualization, validation, supervision, software, resources, project administration, methodology, formal analysis, data curation, and conceptualization; N.K.: validation, resources, and data curation; V.L.: validation, resources, and formal analysis; P.V.: formal analysis, validation, and resources; S.V: formal analysis and validation; I.I.: formal analysis, validation, resources, and project administration; D. I. and R.Y.: formal analysis and validation; T.T.: resources and formal analysis; S.A.: resources, and formal analysis; I.C.: validation, investigation, and funding acquisition. All authors have read and agreed to the published version of this manuscript.
Funding
This study was supported by grants from the Ministry of Education and Science, Bulgaria 736 (contract: KП-06-H73/7-05.12.2023; contract: KП-06-H43/5-30.11.2020).
Institutional Review Board Statement
The study was conducted per the Declaration of Helsinki, and the protocol was approved by the Ethics Committee of 00006384 (SPREAD AND CLINICAL IMPACT OF MONO- AND CO-INFECTIONS WITH ENDEMIC CORONAVIRUS 229E, OC43, NL63 AND HKU1 DURING THE COVID-19 PANDEMIC).
Informed Consent Statement
All subjects gave their informed consent for inclusion before participating in this study.
Data Availability Statement
This manuscript utilized a database on the distribution of respiratory viruses in Bulgaria, accessible at https://grippe.gateway.bg/index.php.
Acknowledgments
A special thanks to the staff at the hospitals and laboratories who collected and sent the clinical samples to monitor the distribution and genetic evolution of SARS-CoV-2.
Conflicts of Interest
The authors declare no conflicts of interest.
References
- Principi, N.; Autore, G.; Ramundo, G.; Esposito, S. Epidemiology of respiratory infections during the COVID-19 pandemic. Viruses 2023, 15, 1160. [Google Scholar] [CrossRef] [PubMed]
- Greene, S.K.; Levin-Rector, A.; Kyaw, N.T.; Luoma, E.; Amin, H.; McGibbon, E. ..& Ahuja, S.D. Comparative hospitalization risk for SARS-CoV-2 Omicron and Delta variant infections, by variant predominance periods and patient-level sequencing results, New York City, August 2021–January 2022. Influenza and Other Respiratory Viruses 2023, 17, e13062. [Google Scholar]
- Olsen, S.J.; Azziz-Baumgartner, E.; Budd, A.P.; Brammer, L.; Sullivan, S.; Pineda, R.F. .. & Fry, A.M. Decreased influenza activity during the COVID-19 pandemic—United States, Australia, Chile, and South Africa, 2020. American Journal of Transplantation 2020, 20, 3681–3685. [Google Scholar]
- Groves, H.E.; Papenburg, J.; Mehta, K.; Bettinger, J.A.; Sadarangani, M.; Halperin, S.A. .. & Lefebvre, M.A. The effect of the COVID-19 pandemic on influenza-related hospitalization, intensive care admission and mortality in children in Canada: A population-based study. The Lancet Regional Health-Americas 2022, 7, 100132. [Google Scholar]
- Lu, Y.; Wang, Y.; Shen, C.; Luo, J.; Yu, W. Decreased Incidence of Influenza During the COVID-19 Pandemic. International Journal of General Medicine 2022, 15, 2957. [Google Scholar] [CrossRef]
- Avolio, M.; Venturini, S.; De Rosa, R.; Crapis, M.; Basaglia, G. Epidemiology of respiratory virus before and during COVID-19 pandemic. Le Infezioni in Medicina 2022, 30, 104. [Google Scholar]
- Mandelia, Y.; Procop, G.W.; Richter, S.S.; Worley, S.; Liu, W.; Esper, F. Dynamics and predisposition of respiratory viral co-infections in children and adults. Clinical Microbiology and Infection 2021, 27, 631–e1. [Google Scholar] [CrossRef] [PubMed]
- Peci, A.; Tran, V.; Guthrie, J.L.; Li, Y.; Nelson, P.; Schwartz, K.L. . & Gubbay, J.B. Prevalence of co-infections with respiratory viruses in individuals investigated for SARS-CoV-2 in Ontario, Canada. Viruses 2021, 13, 130. [Google Scholar] [PubMed]
- Lansbury, L.; Lim, B.; Baskaran, V.; Lim, W.S. Co-infections in people with COVID-19: a systematic review and meta-analysis. Journal of infection 2020, 81, 266–275. [Google Scholar] [CrossRef]
- Krumbein, H.; Kümmel, L.S.; Fragkou, P.C.; Thölken, C.; Hünerbein, B.L.; Reiter, R. .. & Skevaki, C. Respiratory viral co-infections in patients with COVID-19 and associated outcomes: A systematic review and meta-analysis. Reviews in Medical Virology 2023, 33, e2365. [Google Scholar] [PubMed]
- Bengoechea, J.A.; Bamford, C.G. SARS-CoV-2, bacterial co-infections, and AMR: the deadly trio in COVID-19? EMBO molecular medicine 2020, 12, e12560. [Google Scholar] [CrossRef] [PubMed]
- Hoque, M.N.; Chaudhury, A.; Akanda MA, M.; Hossain, M.A.; Islam, M.T. Genomic diversity and evolution, diagnosis, prevention, and therapeutics of the pandemic COVID-19 disease. PeerJ 2020, 8, e9689. [Google Scholar] [CrossRef]
- Langford, B.J.; So, M.; Raybardhan, S.; Leung, V.; Westwood, D.; MacFadden, D.R. .. & Daneman, N. Bacterial co-infection and secondary infection in patients with COVID-19: a living rapid review and meta-analysis. Clinical microbiology and infection 2020, 26, 1622–1629. [Google Scholar] [PubMed]
- Khatiwada, S.; Subedi, A. Lung microbiome and coronavirus disease 2019 (COVID-19): possible link and implications. Human microbiome journal 2020, 17, 100073. [Google Scholar] [CrossRef]
- Peddu, V.; Shean, R.C.; Xie, H.; Shrestha, L.; Perchetti, G.A.; Minot, S.S. . & Greninger, A.L. Metagenomic analysis reveals clinical SARS-CoV-2 infection and bacterial or viral superinfection and colonization. Clinical chemistry 2020, 66, 966–972. [Google Scholar] [PubMed]
- Nishiura, H.; Kobayashi, T.; Miyama, T.; Suzuki, A.; Jung, S.M.; Hayashi, K. .. & Linton, N.M. Estimation of the asymptomatic ratio of novel coronavirus infections (COVID-19). International journal of infectious diseases 2020, 94, 154–155. [Google Scholar]
- Yi, C.; Sun, X.; Ye, J.; Ding, L.; Liu, M.; Yang, Z. ;... & Sun, B. Key residues of the receptor binding motif in the spike protein of SARS-CoV-2 that interact with ACE2 and neutralizing antibodies. Cellular & molecular immunology.
- Trifonova, I.; Christova, I.; Madzharova, I.; Angelova, S.; Voleva, S.; Yordanova, R.; Tcherveniakova, T.; Krumova, S.; Korsun, N. Clinical significance and role of coinfections with respiratory pathogens among individuals with confirmed severe acute respiratory syndrome coronavirus-2 infection. Front Public Health. 2022, 10, 959319. [Google Scholar] [CrossRef]
- Bellinghausen, C.; Gulraiz, F.; Heinzmann, A.C.; Dentener, M.A.; Savelkoul, P.H.; Wouters, E.F.; Stassen, F.R. Exposure to common respiratory bacteria alters the airway epithelial response to subsequent viral infection. Respiratory research 2016, 17, 1–12. [Google Scholar] [CrossRef]
- Lalbiaktluangi, C.; Yadav, M.K.; Singh, P.K.; Singh, A.; Iyer, M.; Vellingiri, B.; Zomuansangi, R.; Zothanpuia Ram, H. A cooperativity between virus and bacteria during respiratory infections. Front Microbiol. 2023, 14, 1279159. [Google Scholar] [CrossRef]
- Ghoneim, H.E.; Thomas, G.; McCullers, J.A. Depletion of alveolar macrophages during influenza infection facilitates bacterial superinfections. J. Immunol. 2013, 191, 1250–1259. [Google Scholar] [CrossRef]
- Short, J.L.; Toffel, M.W.; Hugill, A.R. Monitoring global supply chains. Strategic Management Journal 2016, 37, 1878–1897. [Google Scholar] [CrossRef]
- Avadhanula, V.; Rodriguez, C.A.; DeVincenzo, J.P.; Wang, Y.; Webby, R.J.; Ulett, G.C.; et al. Respiratory viruses augment the adhesion of bacterial pathogens to respiratory epithelium in a viral species-and cell type-dependent manner. J. Virol. 2006, 80, 1629–1636. [Google Scholar] [CrossRef] [PubMed]
- Giannakis, A.; Móré, D; Erdmann, S.; Kintzelé, *!!! REPLACE !!!*; L, *!!! REPLACE !!!*; Fischer, R.M.; Vogel, M.N. .. & Hellbach, K. COVID-19 pneumonia and its lookalikes: How radiologists perform in differentiating atypical pneumonias. European Journal of Radiology 2021, 144, 110002. [Google Scholar] [PubMed]
- Chibabhai, V.; Duse, A.G.; Perovic, O.; Richards, G.A. Collateral damage of the COVID-19 pandemic: exacerbation of antimicrobial resistance and disruptions to antimicrobial stewardship programmes? SAMJ: South African Medical Journal 2020, 110, 1–2. [Google Scholar] [CrossRef] [PubMed]
- Feldman, C.; Anderson, R. The role of co-infections and secondary infections in patients with COVID-19. Pneumonia 2021, 13, 1–15. [Google Scholar] [CrossRef]
- Jayyosi, M.G.; Khuri-Bulos, N.A.; Halasa, N.B.; Faouri, S.; Shehabi, A.A. Rare occurrence of Bordetella pertussis among Jordanian children younger than two years old with respiratory tract infections. Journal of Pediatric Infectious Diseases 2015, 10, 053–056. [Google Scholar] [CrossRef]
- Kodani, M.; Yang, G.; Conklin, L.M.; Travis, T.C.; Whitney, C.G.; Anderson, L. J;... & Fields, B.S. Application of TaqMan low-density arrays for simultaneous detection of multiple respiratory pathogens. Journal of clinical microbiology 2011, 49, 2175–2182. [Google Scholar]
- Dare, R.K.; Fry, A.M.; Chittaganpitch, M.; Sawanpanyalert, P.; Olsen, S.J.; Erdman, D.D. Human coronavirus infections in rural Thailand: a comprehensive study using real-time reverse-transcription polymerase chain reaction assays. The Journal of infectious diseases 2007, 196, 1321–1328. [Google Scholar] [CrossRef] [PubMed]
- ARDS Definition Task Force; Ranieri VM, Rubenfeld GD, Thompson BT, Ferguson ND, Caldwell E, Fan E, Camporota L, Slutsky AS. Acute respiratory distress syndrome: the Berlin Definition. JAMA. 2012, 307, 2526–33. [Google Scholar] [CrossRef] [PubMed]
- Ferrara, N.; Campobasso, C.P.; Cocozza, S.; Conti, V.; Davinelli, S.; Costantino, M. . & Corbi, G. Relationship between COVID-19 mortality, hospital beds, and primary care by Italian regions: A lesson for the future. Journal of Clinical Medicine 2022, 11, 4196. [Google Scholar]
- Saeed, N.K.; Al-Khawaja, S.; Alsalman, J.; Almusawi, S.; Albalooshi, N.A.; Al-Biltagi, M. Bacterial co-infection in patients with SARS-CoV-2 in the Kingdom of Bahrain. World journal of virology 2021, 10, 168. [Google Scholar] [CrossRef]
- Sahu, C.; Singh, S.; Pathak, A.; Singh, S.; Patel, S.S.; Ghoshal, U.; Garg, A. Bacterial coinfections in COVID: Prevalence, antibiotic sensitivity patterns and clinical outcomes from a tertiary institute of Northern India. Journal of family medicine and primary care 2022, 11, 4473–4478. [Google Scholar] [CrossRef] [PubMed]
- Yan, X.; Li, K.; Lei, Z.; Luo, J.; Wang, Q.; Wei, S. Prevalence and associated outcomes of co-infection between SARS-CoV-2 and influenza: a systematic review and meta-analysis. International Journal of Infectious Diseases 2023. [Google Scholar] [CrossRef]
- Fan, H.; Zhou, L.; Lv, J.; Yang, S.; Chen, G.; Liu, X. . & Lan, K. Bacterial coinfections contribute to severe COVID-19 in winter. Cell Research 2023, 33, 562–564. [Google Scholar] [PubMed]
- Alhumaid, S.; Al Mutair, A.; Al Alawi, Z.; Alshawi, A.M.; Alomran, S.A.; Almuhanna, M.S. . & Al-Omari, A. Coinfections with bacteria, fungi, and respiratory viruses in patients with SARS-CoV-2: a systematic review and meta-analysis. Pathogens 2021, 10, 809. [Google Scholar]
- Singh, V.; Upadhyay, P.; Reddy, J.; Granger, J. SARS-CoV-2 respiratory co-infections: Incidence of viral and bacterial co-pathogens. International Journal of Infectious Diseases 2021, 105, 617–620. [Google Scholar] [CrossRef]
- Contou, D.; Claudinon, A.; Pajot, O.; Micaëlo, M.; Longuet Flandre, P.; Dubert, M. . & Plantefève, G. Bacterial and viral co-infections in patients with severe SARS-CoV-2 pneumonia admitted to a French ICU. Annals of intensive care 2020, 10, 1–9. [Google Scholar]
- Borkakoty, B.; Bali, N.K. Haemophilus influenzae and SARS-CoV-2: Is there a role for investigation? Indian Journal of Medical Microbiology 2021, 39, 240–244. [Google Scholar] [CrossRef]
- Davies-Bolorunduro, O.F.; Fowora, M.A.; Amoo, O.S.; Adeniji, E.; Osuolale, K.A.; Oladele, O. .. & Salako, B. L. Evaluation of respiratory tract bacterial co-infections in SARS-CoV-2 patients with mild or asymptomatic infection in Lagos, Nigeria. Bulletin of the National Research Centre 2022, 46, 115. [Google Scholar]
- Swets, M.C.; Russell, C.D.; Harrison, E.M.; Docherty, A.B.; Lone, N.; Girvan, M. .. & Baillie, J. K. SARS-CoV-2 co-infection with influenza viruses, respiratory syncytial virus, or adenoviruses. The Lancet 2022, 399, 1463–1464. [Google Scholar]
- Kim, D.; Quinn, J.; Pinsky, B.; Shah, N.H.; Brown, I. Rates of co-infection between SARS-CoV-2 and other respiratory pathogens. Jama 2020, 323, 2085–2086. [Google Scholar] [CrossRef] [PubMed]
- Salvatore, P.P.; Dawson, P.; Wadhwa, A.; Rabold, E.M.; Buono, S.; Dietrich, E.A. .. & Kirking, H. L. Epidemiological correlates of polymerase chain reaction cycle threshold values in the detection of severe acute respiratory syndrome coronavirus 2 (SARS-CoV-2). Clinical Infectious Diseases 2021, 72, e761–e767. [Google Scholar] [PubMed]
- Nowak, M.D.; Sordillo, E.M.; Gitman, M.R.; Mondolfi, A.E.P. Coinfection in SARS-CoV-2 infected patients: where are influenza virus and rhinovirus/enterovirus? Journal of medical virology 2020, 92, 1699. [Google Scholar] [CrossRef]
- Wade, S.F.; Diouara AA, M.; Ngom, B.; Thiam, F.; Dia, N. SARS-CoV-2 and Other Respiratory Viruses in Human Olfactory Pathophysiology. Microorganisms 2024, 12, 540. [Google Scholar] [CrossRef]
- Trifonova, I.; Korsun, N.; Madzharova, I.; Alexiev, I.; Ivanov, I.; Levterova, V. .. & Christova, I. Epidemiological and Genetic Characteristics of Respiratory Viral Coinfections with Different Variants of Severe Acute Respiratory Syndrome Coronavirus 2 (SARS-CoV-2). Viruses 2024, 16, 958. [Google Scholar] [PubMed]
- Babawale, P.I.; Guerrero-Plata, A. Respiratory Viral Coinfections: Insights into Epidemiology, Immune Response, Pathology, and Clinical Outcomes. Pathogens 2024, 13, 316. [Google Scholar] [CrossRef]
- AlBahrani, S.; AlZahrani, S.J.; Al-Maqati, T.N.; Almehbash, A.; Alshammari, A.; Bujlai, R. ;... & Al-Tawfiq, J.A. Dynamic Patterns and Predominance of Respiratory Pathogens Post-COVID-19: Insights from a Two-Year Analysis. Journal of Epidemiology and Global Health.
- Pattemore, P.K.; Jennings, L.C. Epidemiology of respiratory infections. Pediatric respiratory medicine 2008, 435. [Google Scholar]
- Felsenstein, S.; Hedrich, C.M. SARS-CoV-2 infections in children and young people. Clinical immunology 2020, 220, 108588. [Google Scholar] [CrossRef]
- Li, Y.; Wang, H.; Wang, F.; Lu, X.; Du, H.; Xu, J. . & Zhang, M. Co-infections of SARS-CoV-2 with multiple common respiratory pathogens in infected children: A retrospective study. Medicine 2021, 100, e24315. [Google Scholar]
- Karaaslan, A.; Çetin, C.; Akın, Y.; Tekol, S.D.; Söbü, E.; Demirhan, R. Coinfection in SARS-CoV-2 infected children patients. The Journal of Infection in Developing Countries 2021, 15, 761–765. [Google Scholar] [CrossRef]
- Nieto-Rivera, B.; Saldaña-Ahuactzi, Z.; Parra-Ortega, I.; Flores-Alanis, A.; Carbajal-Franco, E.; Cruz-Rangel, A. .. & Luna-Pineda, V. M. Frequency of respiratory virus-associated infection among children and adolescents from a tertiary-care hospital in Mexico City. Scientific Reports 2023, 13, 19763. [Google Scholar]
- El-Koofy, N. M. , El-Shabrawi, M. H., Abd El-alim, B. A., Zein, M. M., & Badawi, N. E. Patterns of respiratory tract infections in children under 5 years of age in a low–middle-income country. Journal of the Egyptian Public Health Association 2022, 97, 22. [Google Scholar] [PubMed]
- Solito, C.; Hernández-García, M.; Casamayor, N.A.; Ortiz, A.P.; Pino, R.; Alsina, L.; & de Sevilla, M.F.; & de Sevilla, M. F. COVID-19 admissions: Trying to define the real impact of infection in hospitalized patients. Anales de Pediatría (English Edition) 2024, 100, 342–351. [Google Scholar] [CrossRef]
- Kuchar, E.; Załęski, A.; Wronowski, M.; Krankowska, D.; Podsiadły, E.; Brodaczewska, K. . & Kubiak, J. Z. Children were less frequently infected with SARS-CoV-2 than adults during 2020 COVID-19 pandemic in Warsaw, Poland. European Journal of Clinical Microbiology & Infectious Diseases 2021, 40, 541–547. [Google Scholar]
- Latouche, M.; Ouafi, M.; Engelmann, I.; Becquart, A.; Alidjinou, E.K.; Mitha, A.; Dubos, F. Frequency and burden of disease for SARS-CoV-2 and other viral respiratory tract infections in children under the age of 2 months. Pediatric Pulmonology 2024, 59, 101–110. [Google Scholar] [CrossRef] [PubMed]
- Luan, Y.Y.; Yin, C.H.; Yao, Y.M. Update advances on C-reactive protein in COVID-19 and other viral infections. Frontiers in immunology 2021, 12, 720363. [Google Scholar] [CrossRef]
- Ali, N. Elevated level of C-reactive protein may be an early marker to predict risk for severity of COVID-19. Journal of medical virology 2020, 92, 2409. [Google Scholar] [CrossRef]
- Taylor, C.A. COVID-19–Associated Hospitalizations Among US Adults Aged≥ 65 Years—COVID-NET, 13 States, January–August 2023. MMWR. Morbidity and Mortality Weekly Report 2023, 72. [Google Scholar] [CrossRef] [PubMed]
- Inaida, S.; Paul, R.E.; Matsuno, S. Viral transmissibility of SARS-CoV-2 accelerates in the winter, similarly to influenza epidemics. American Journal of Infection Control 2022, 50, 1070–1076. [Google Scholar] [CrossRef]
- Rezaei-Tavabe, N.; Kheiri, S.; Mousavi, M.S.; Mohammadian-Hafshejani, A. The Effect of Monovalent Influenza Vaccine on the Risk of Hospitalization and All-Cause Mortality According to the Results of Randomized Clinical Trials: A Systematic Review and Meta-Analysis. Iranian Journal of Public Health 2023, 52, 924. [Google Scholar]
- Thompson, M.G.; Stenehjem, E.; Grannis, S.; Ball, S.W.; Naleway, A.L.; Ong, T.C. . & Klein, N. P. Effectiveness of Covid-19 vaccines in ambulatory and inpatient care settings. New England Journal of Medicine 2021, 385, 1355–1371. [Google Scholar] [PubMed]
- Franco-Paredes, C. Transmissibility of SARS-CoV-2 among fully vaccinated individuals. The Lancet. Infectious diseases 2022, 22, 16. [Google Scholar] [CrossRef] [PubMed]
- Yan, X.; Li, K.; Lei, Z.; Luo, J.; Wang, Q.; Wei, S. Prevalence and associated outcomes of co-infection between SARS-CoV-2 and influenza: a systematic review and meta-analysis. International Journal of Infectious Diseases 2023. [Google Scholar] [CrossRef]
- Ali, N. Elevated level of C-reactive protein may be an early marker to predict risk for severity of COVID-19. Journal of medical virology 2020, 92, 2409. [Google Scholar] [CrossRef]
- Sadeghi-Haddad-Zavareh, M.; Bayani, M.; Shokri, M.; Ebrahimpour, S.; Babazadeh, A.; Mehraeen, R. . & Javanian, M. C-reactive protein as a prognostic indicator in COVID-19 patients. Interdisciplinary perspectives on infectious diseases 2021, 2021, 5557582. [Google Scholar]
- Mphekgwana, P.M.; Sono-Setati, M.E.; Maluleke, A.F.; Matlala, S.F. Low Oxygen Saturation of COVID-19 in Patient Case Fatalities, Limpopo Province, South Africa. Journal of Respiration 2022, 2, 77–86. [Google Scholar] [CrossRef]
- Wu, H.; Zhou, H.Y.; Zheng, H.; Wu, A. Towards Understanding and Identification of Human Viral Co-Infections. Viruses 2024, 16, 673. [Google Scholar] [CrossRef]
- Stefanidis, K.; Konstantelou, E.; Yusuf, G.T.; Oikonomou, A.; Tavernaraki, K.; Karakitsos, D. .. & Vlahos, I. Radiological, epidemiological and clinical patterns of pulmonary viral infections. European Journal of Radiology 2021, 136, 109548. [Google Scholar]
Figure 1.
Visualization from automated electrophoretic analysis. (F1—positive control for HI; F2—positive control for MP; F3—positive control for ChPn; E11—negative control (water); E12—molecular marker (50-800 bp); E4, E7, E9, F4, F5, F7, F8, and F10—positive patient samples).
Figure 1.
Visualization from automated electrophoretic analysis. (F1—positive control for HI; F2—positive control for MP; F3—positive control for ChPn; E11—negative control (water); E12—molecular marker (50-800 bp); E4, E7, E9, F4, F5, F7, F8, and F10—positive patient samples).
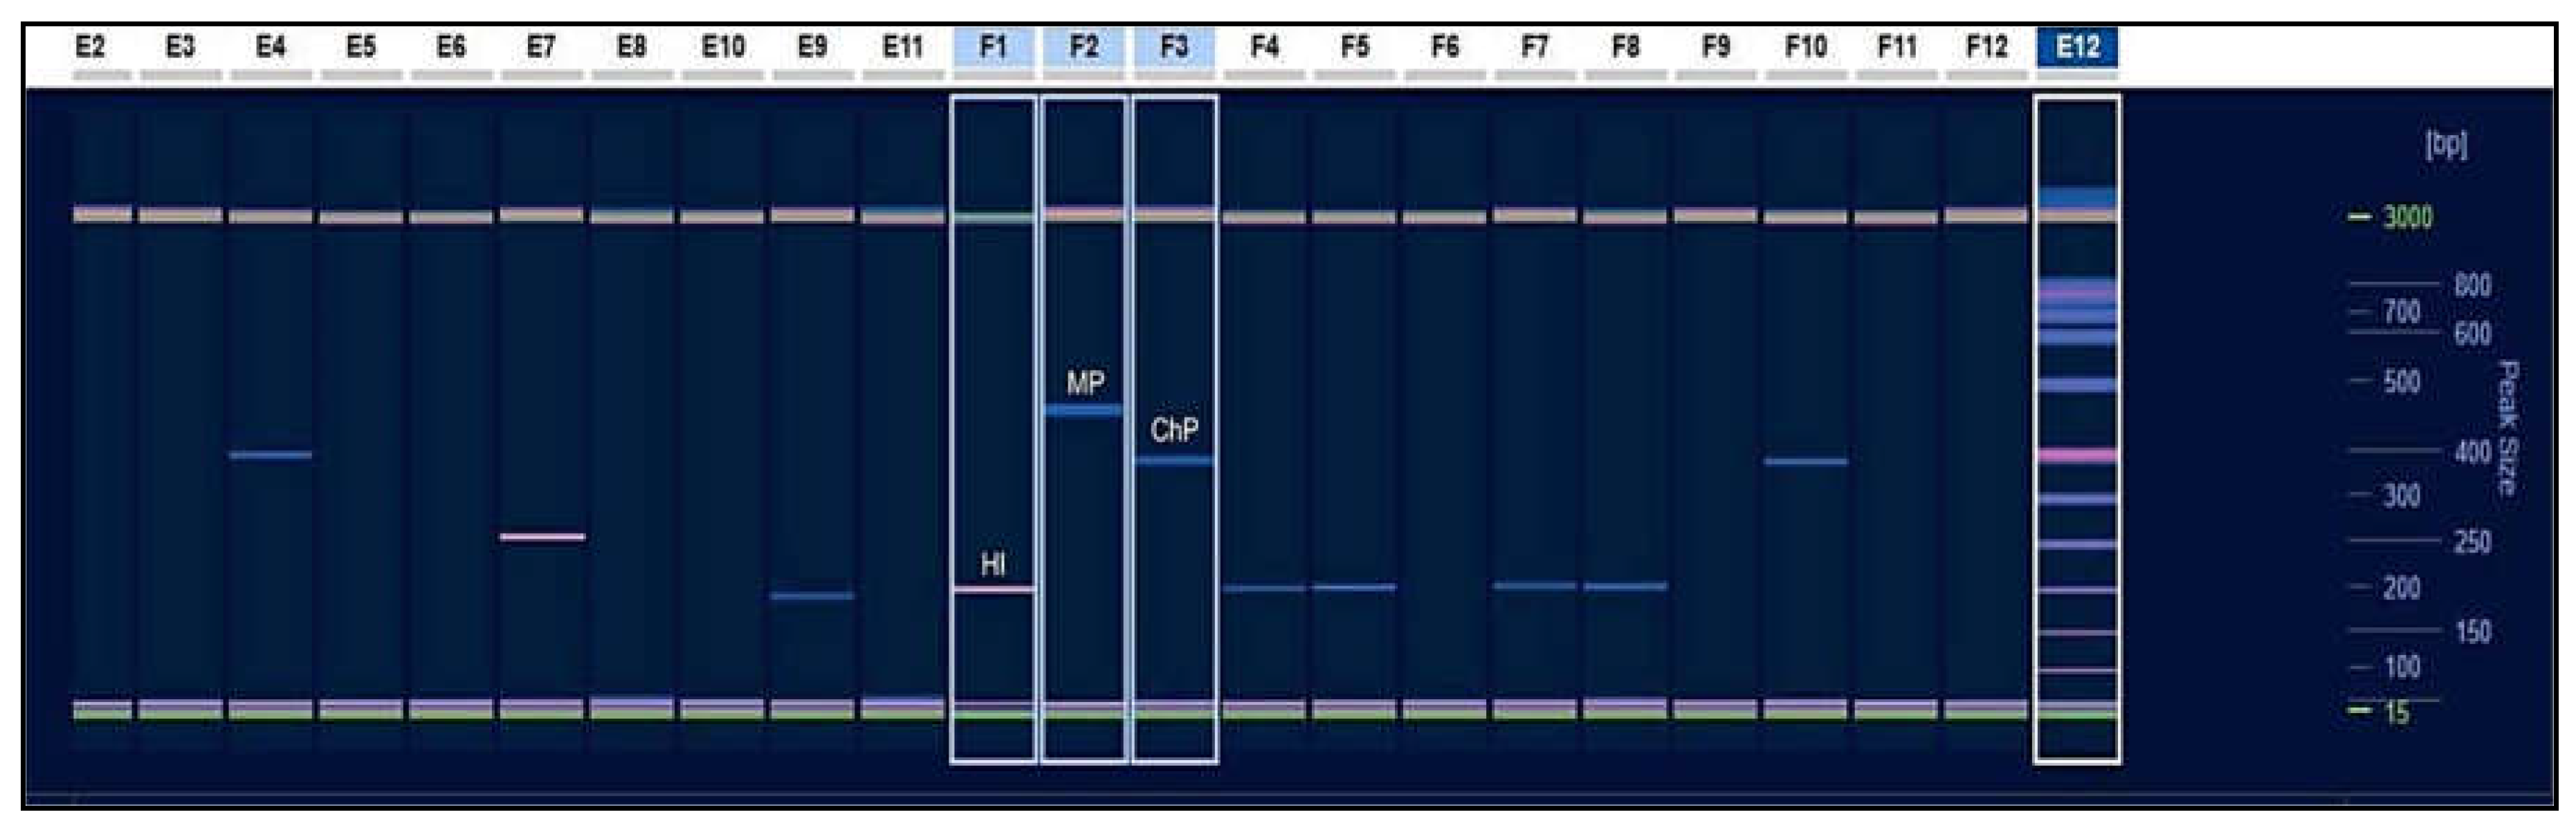
Figure 2.
Percentage involvement of individual respiratory pathogens in combinations of double and triple infections.
Figure 2.
Percentage involvement of individual respiratory pathogens in combinations of double and triple infections.
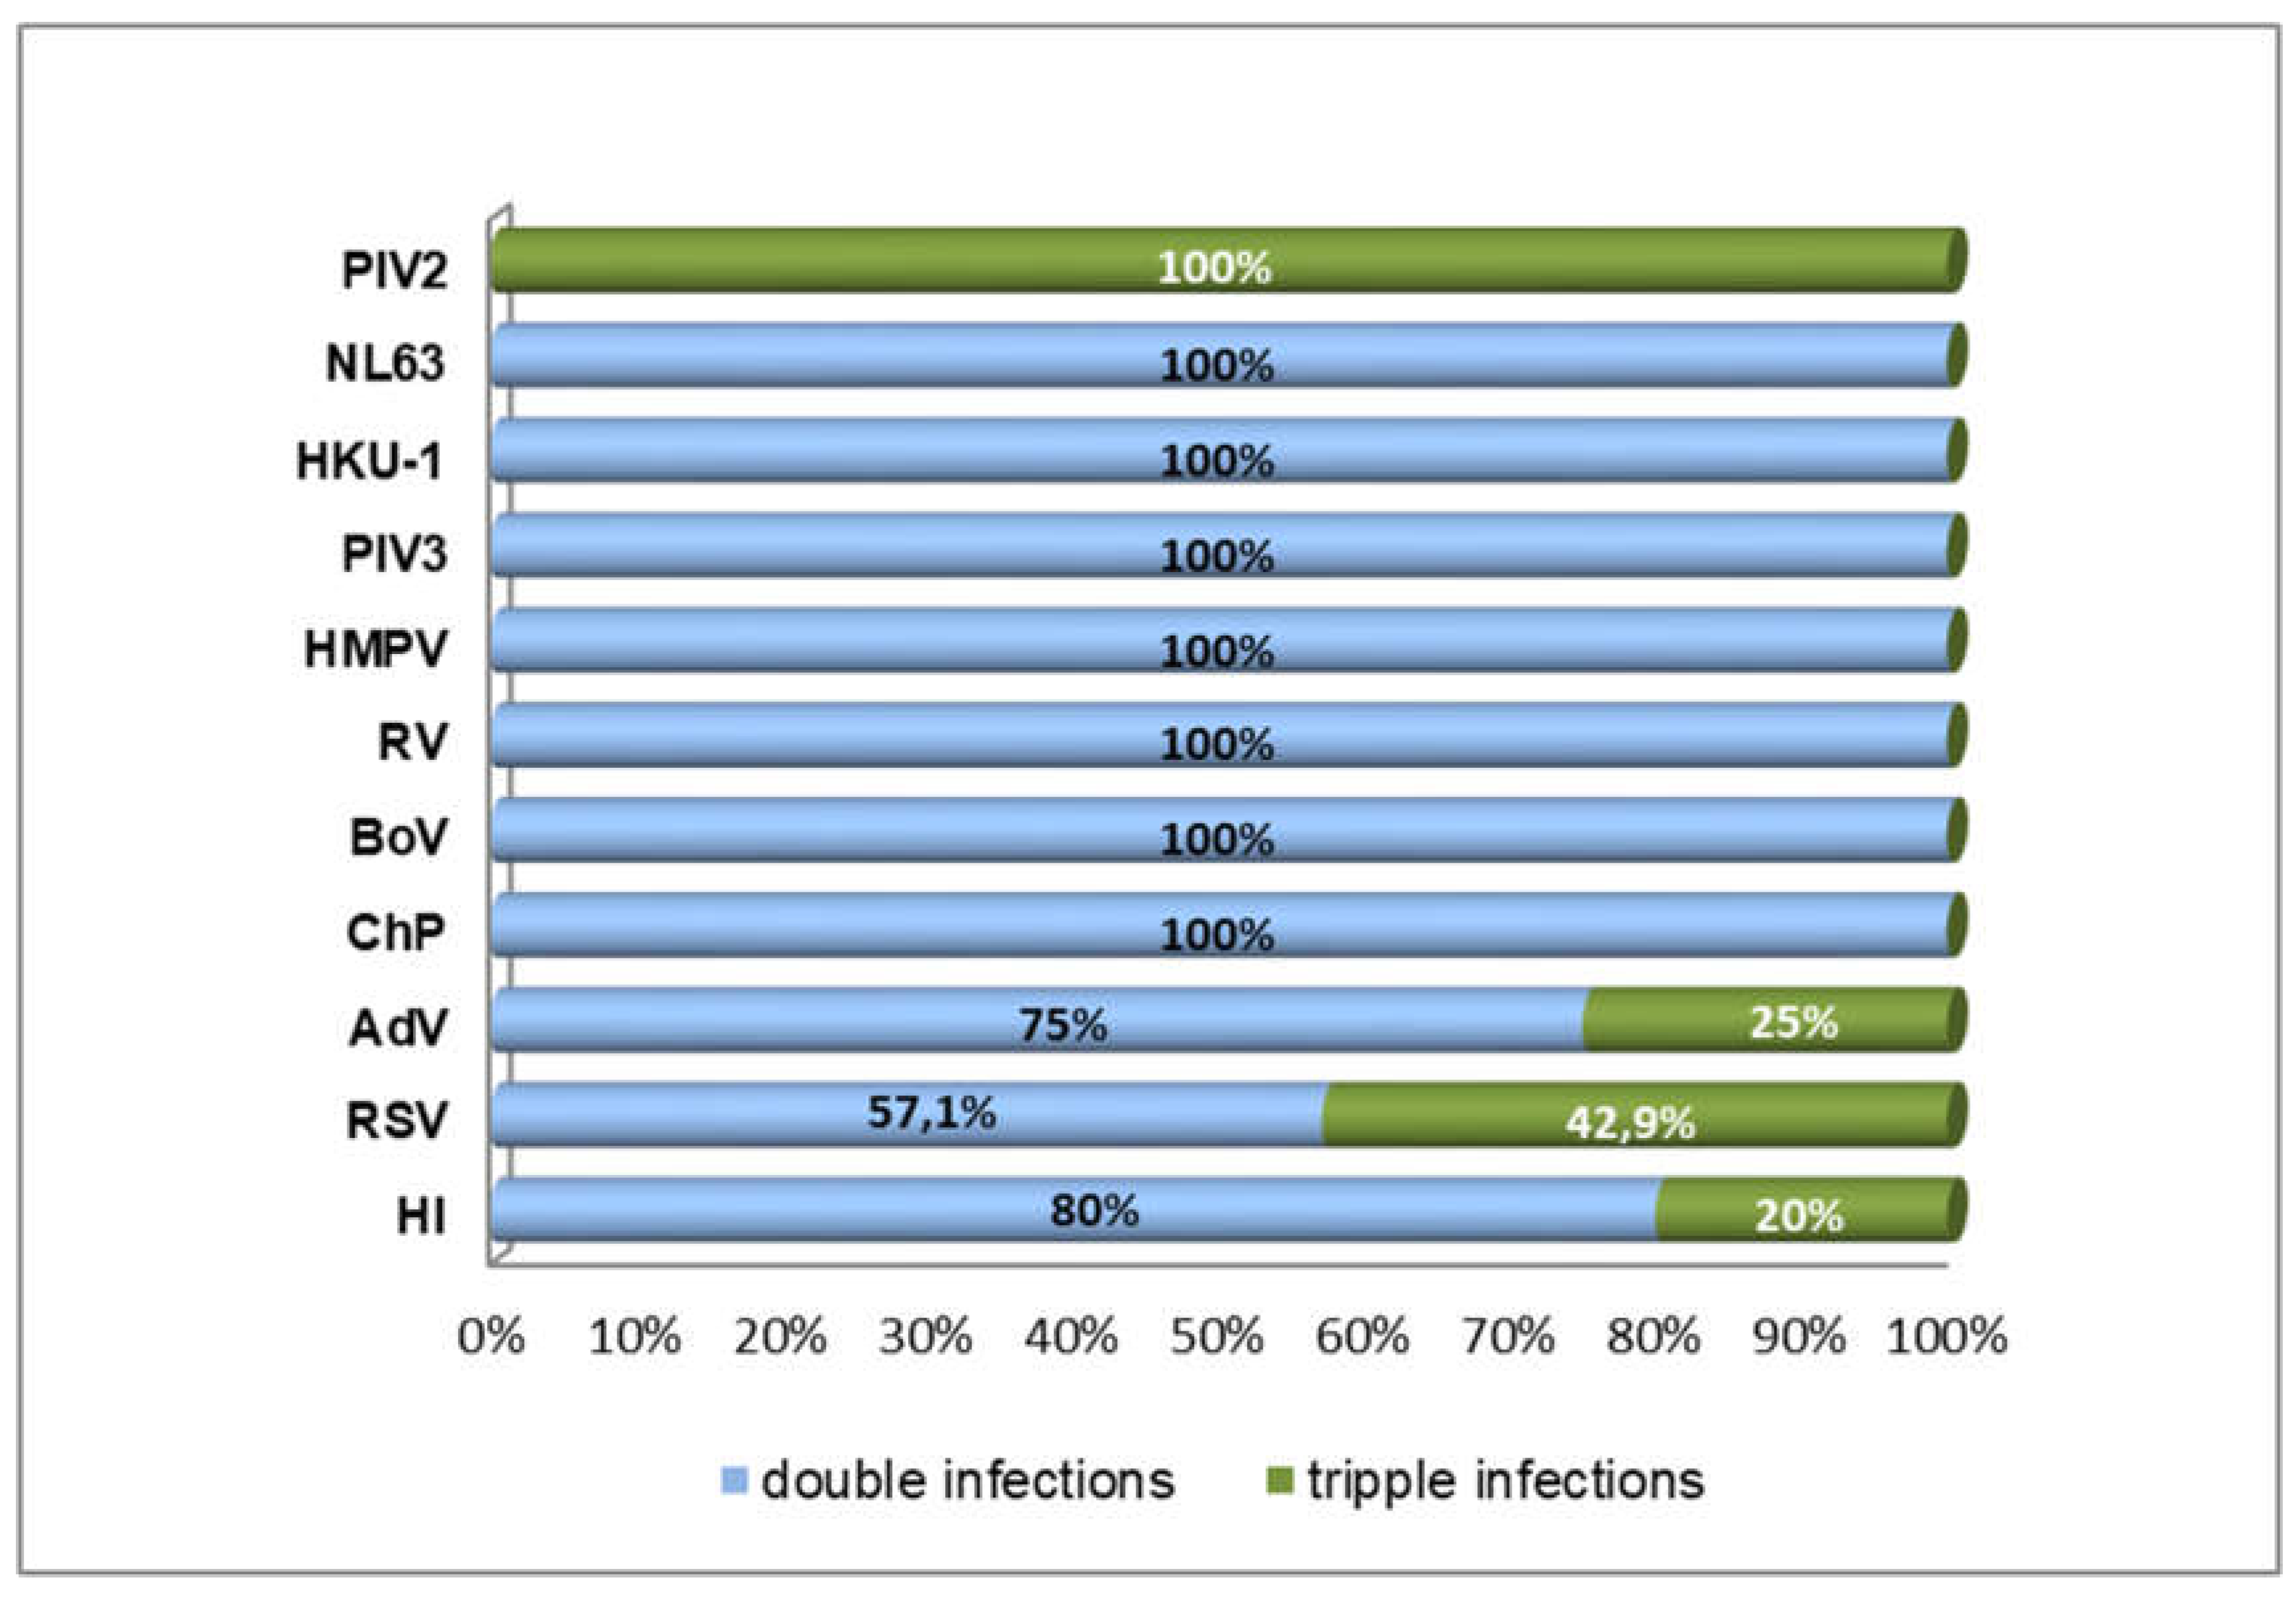
Figure 3.
Ct value comparison of viruses in combined infections.
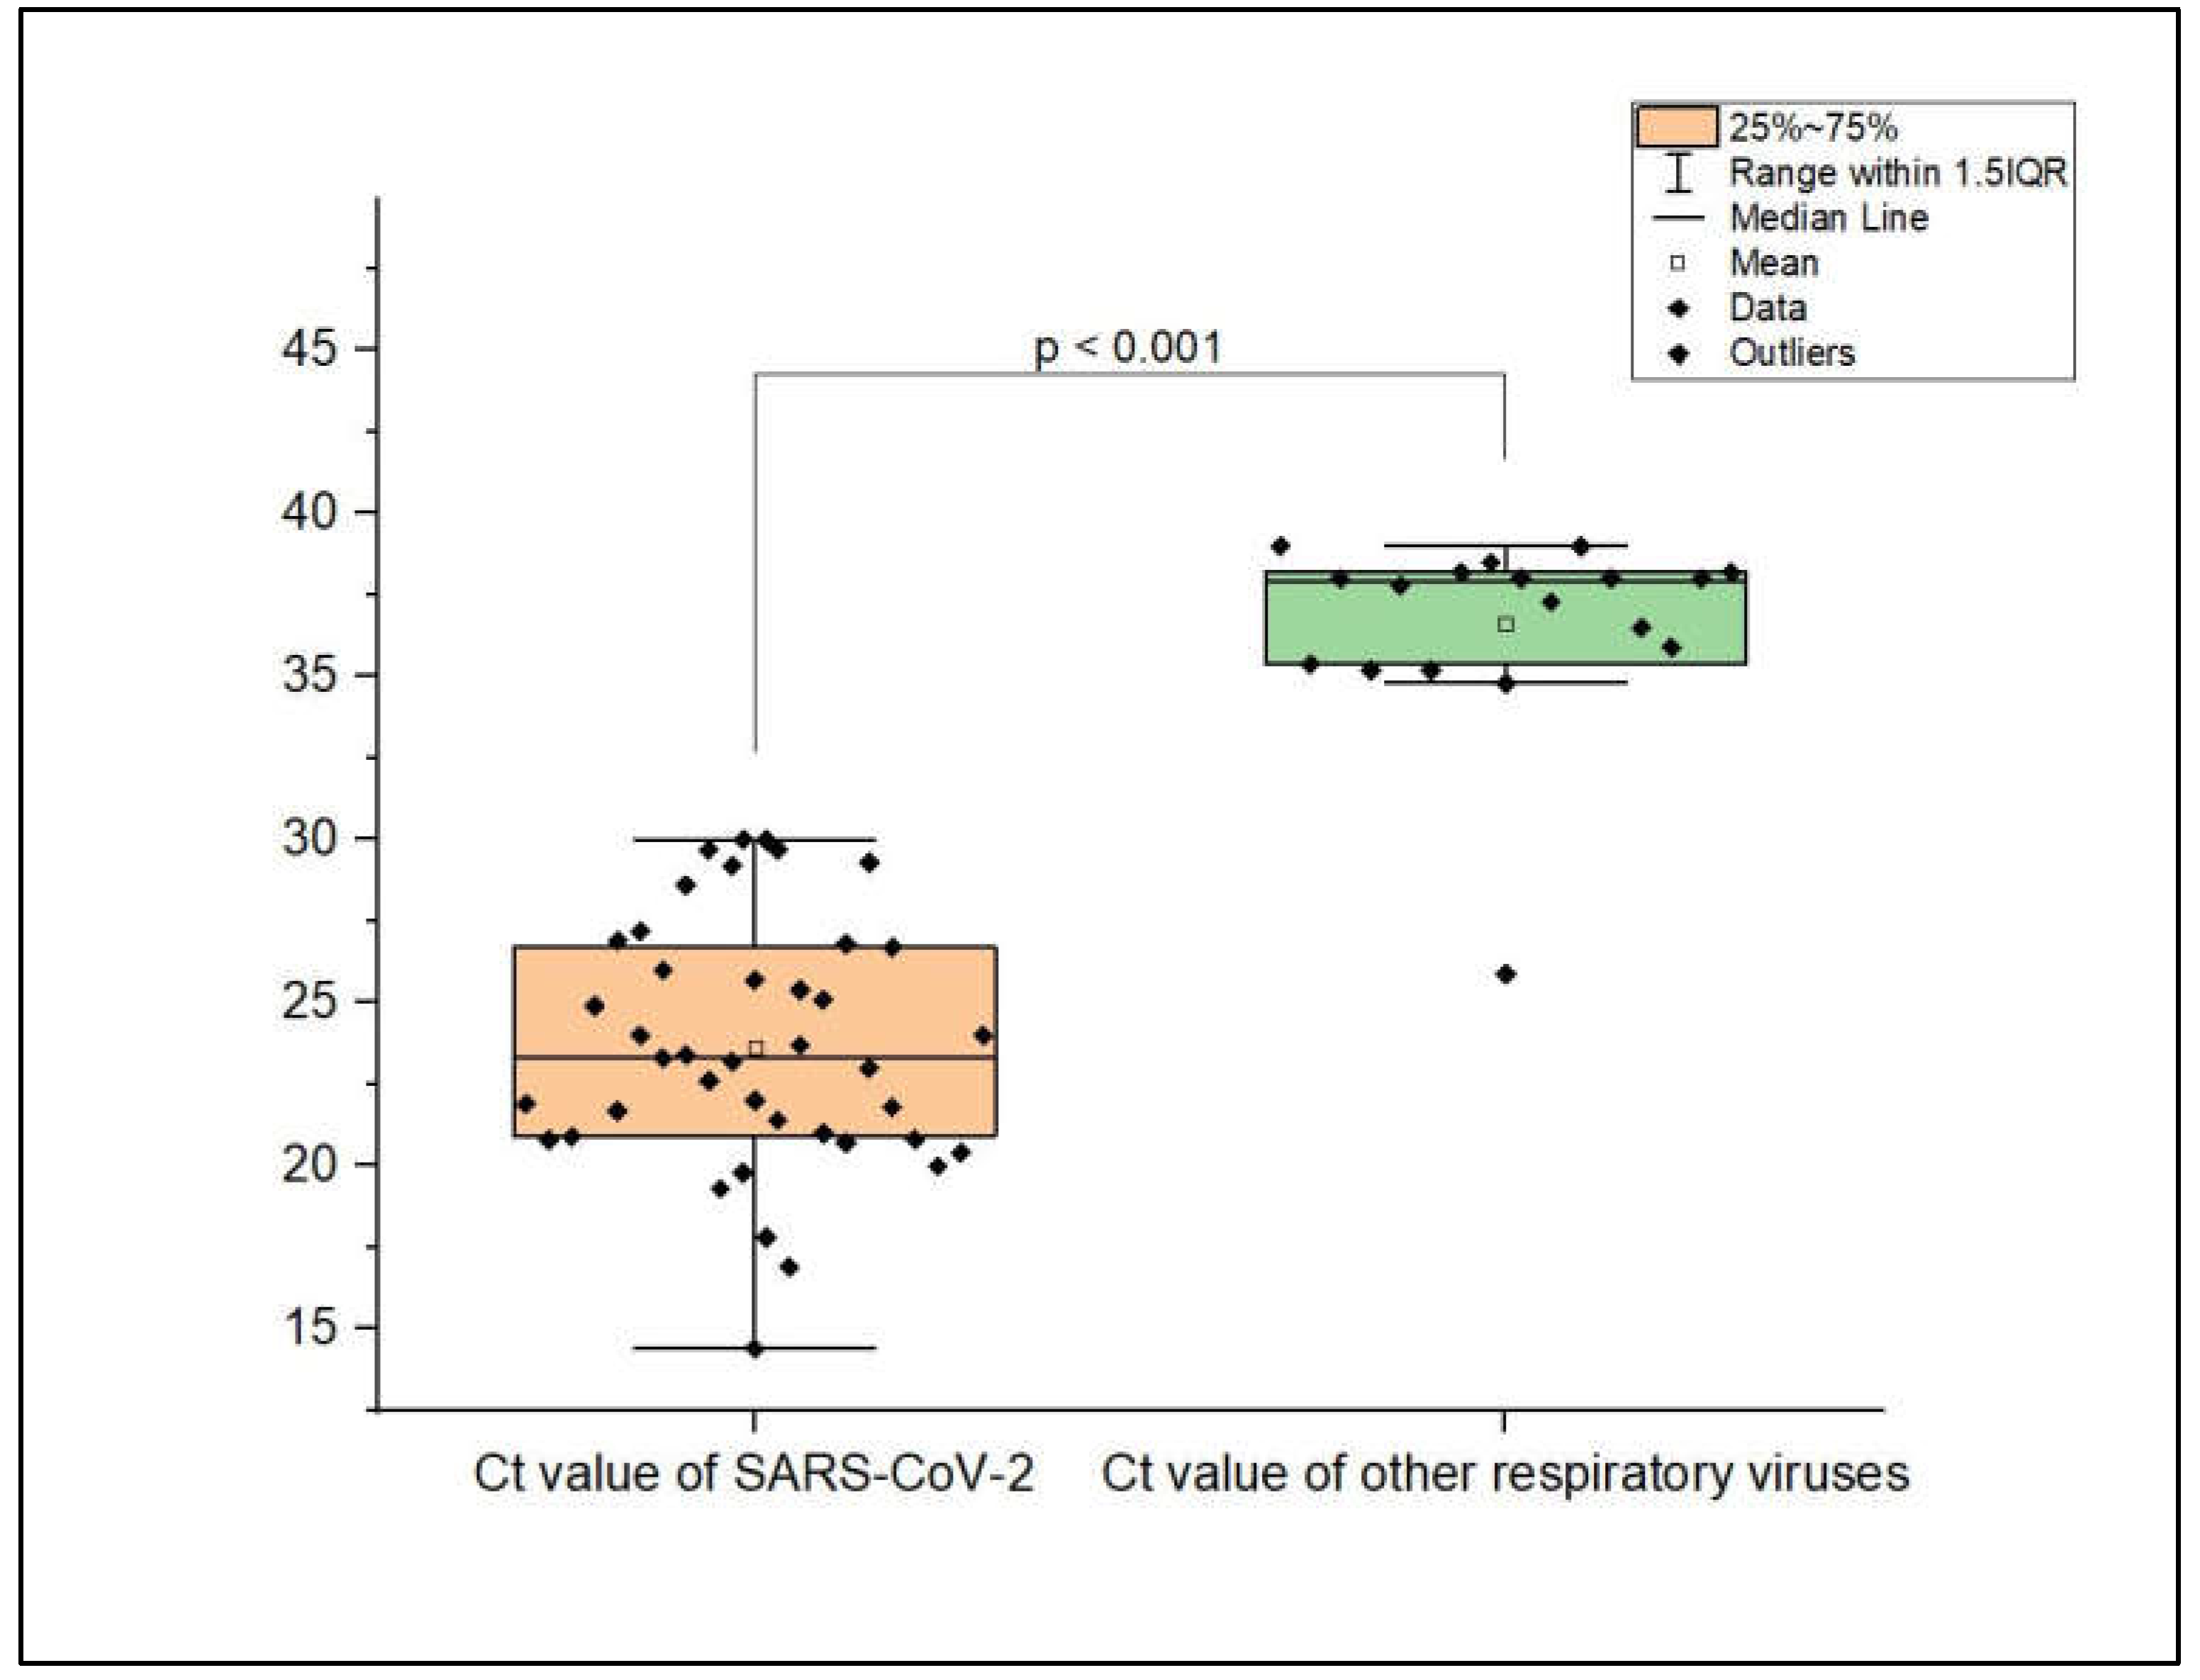
Figure 4.
Weekly distribution of proven co-infections.
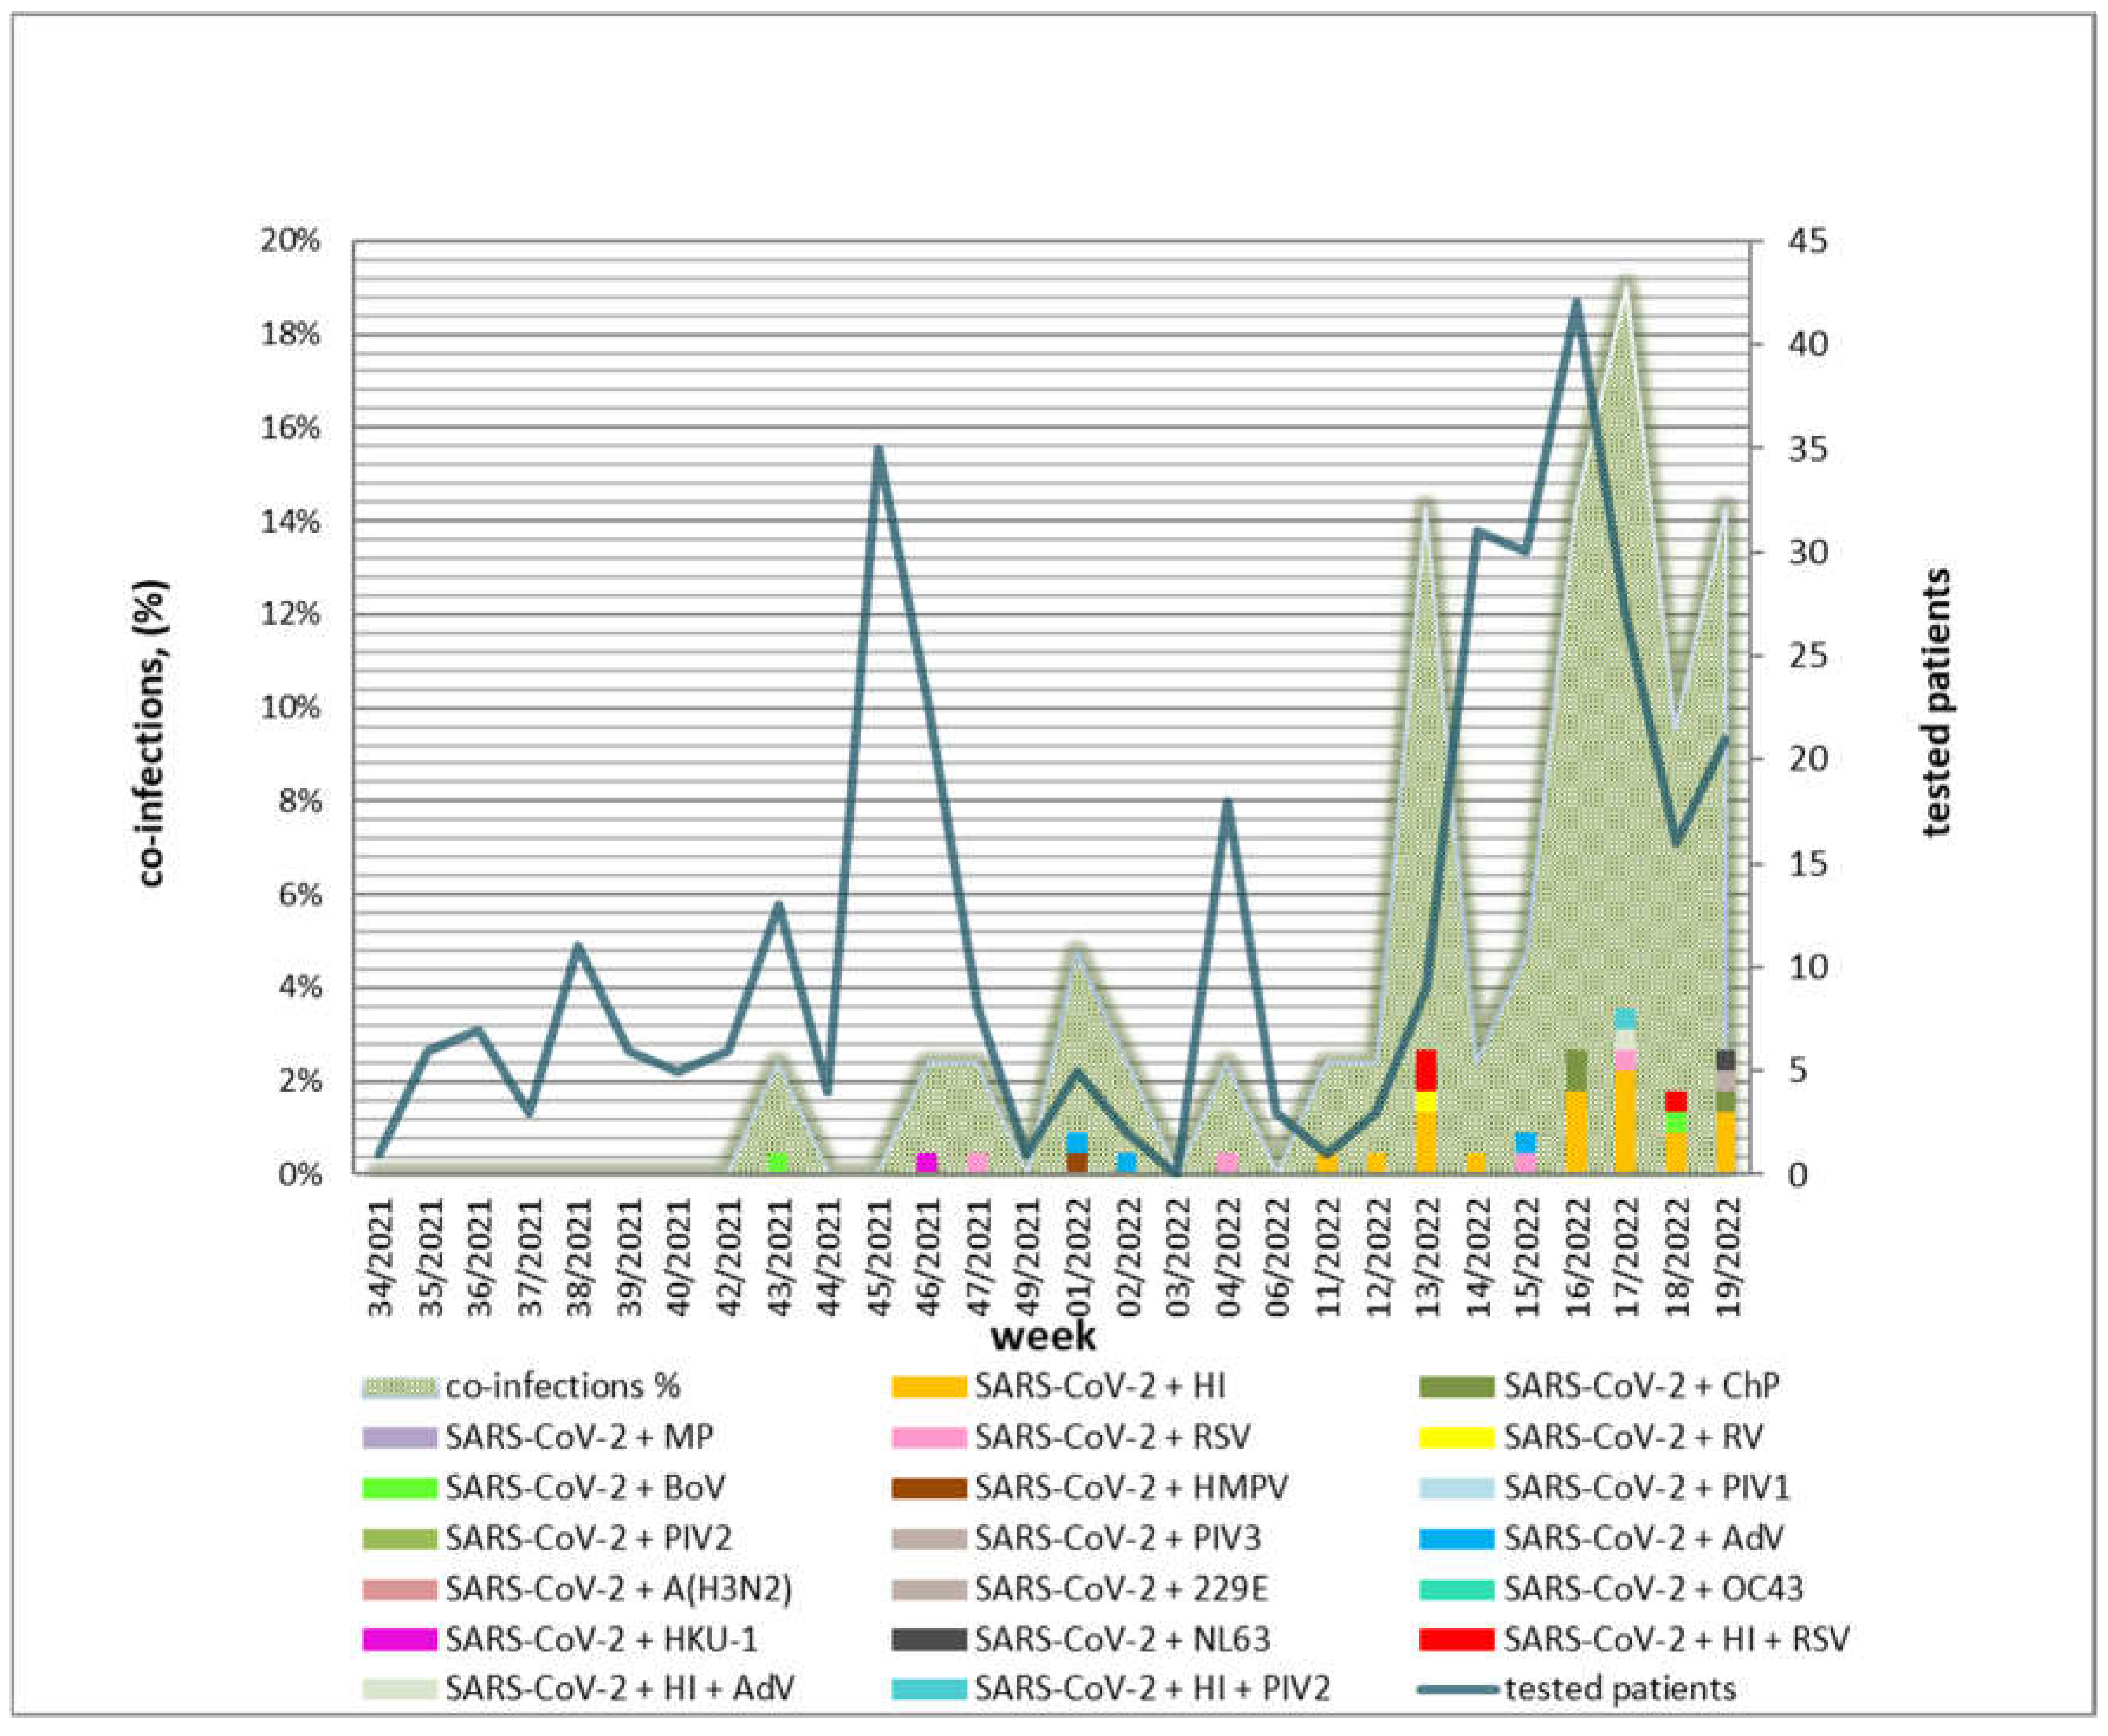
Figure 5.
Percentage distributions of mono-infections and co-infections in different age groups.
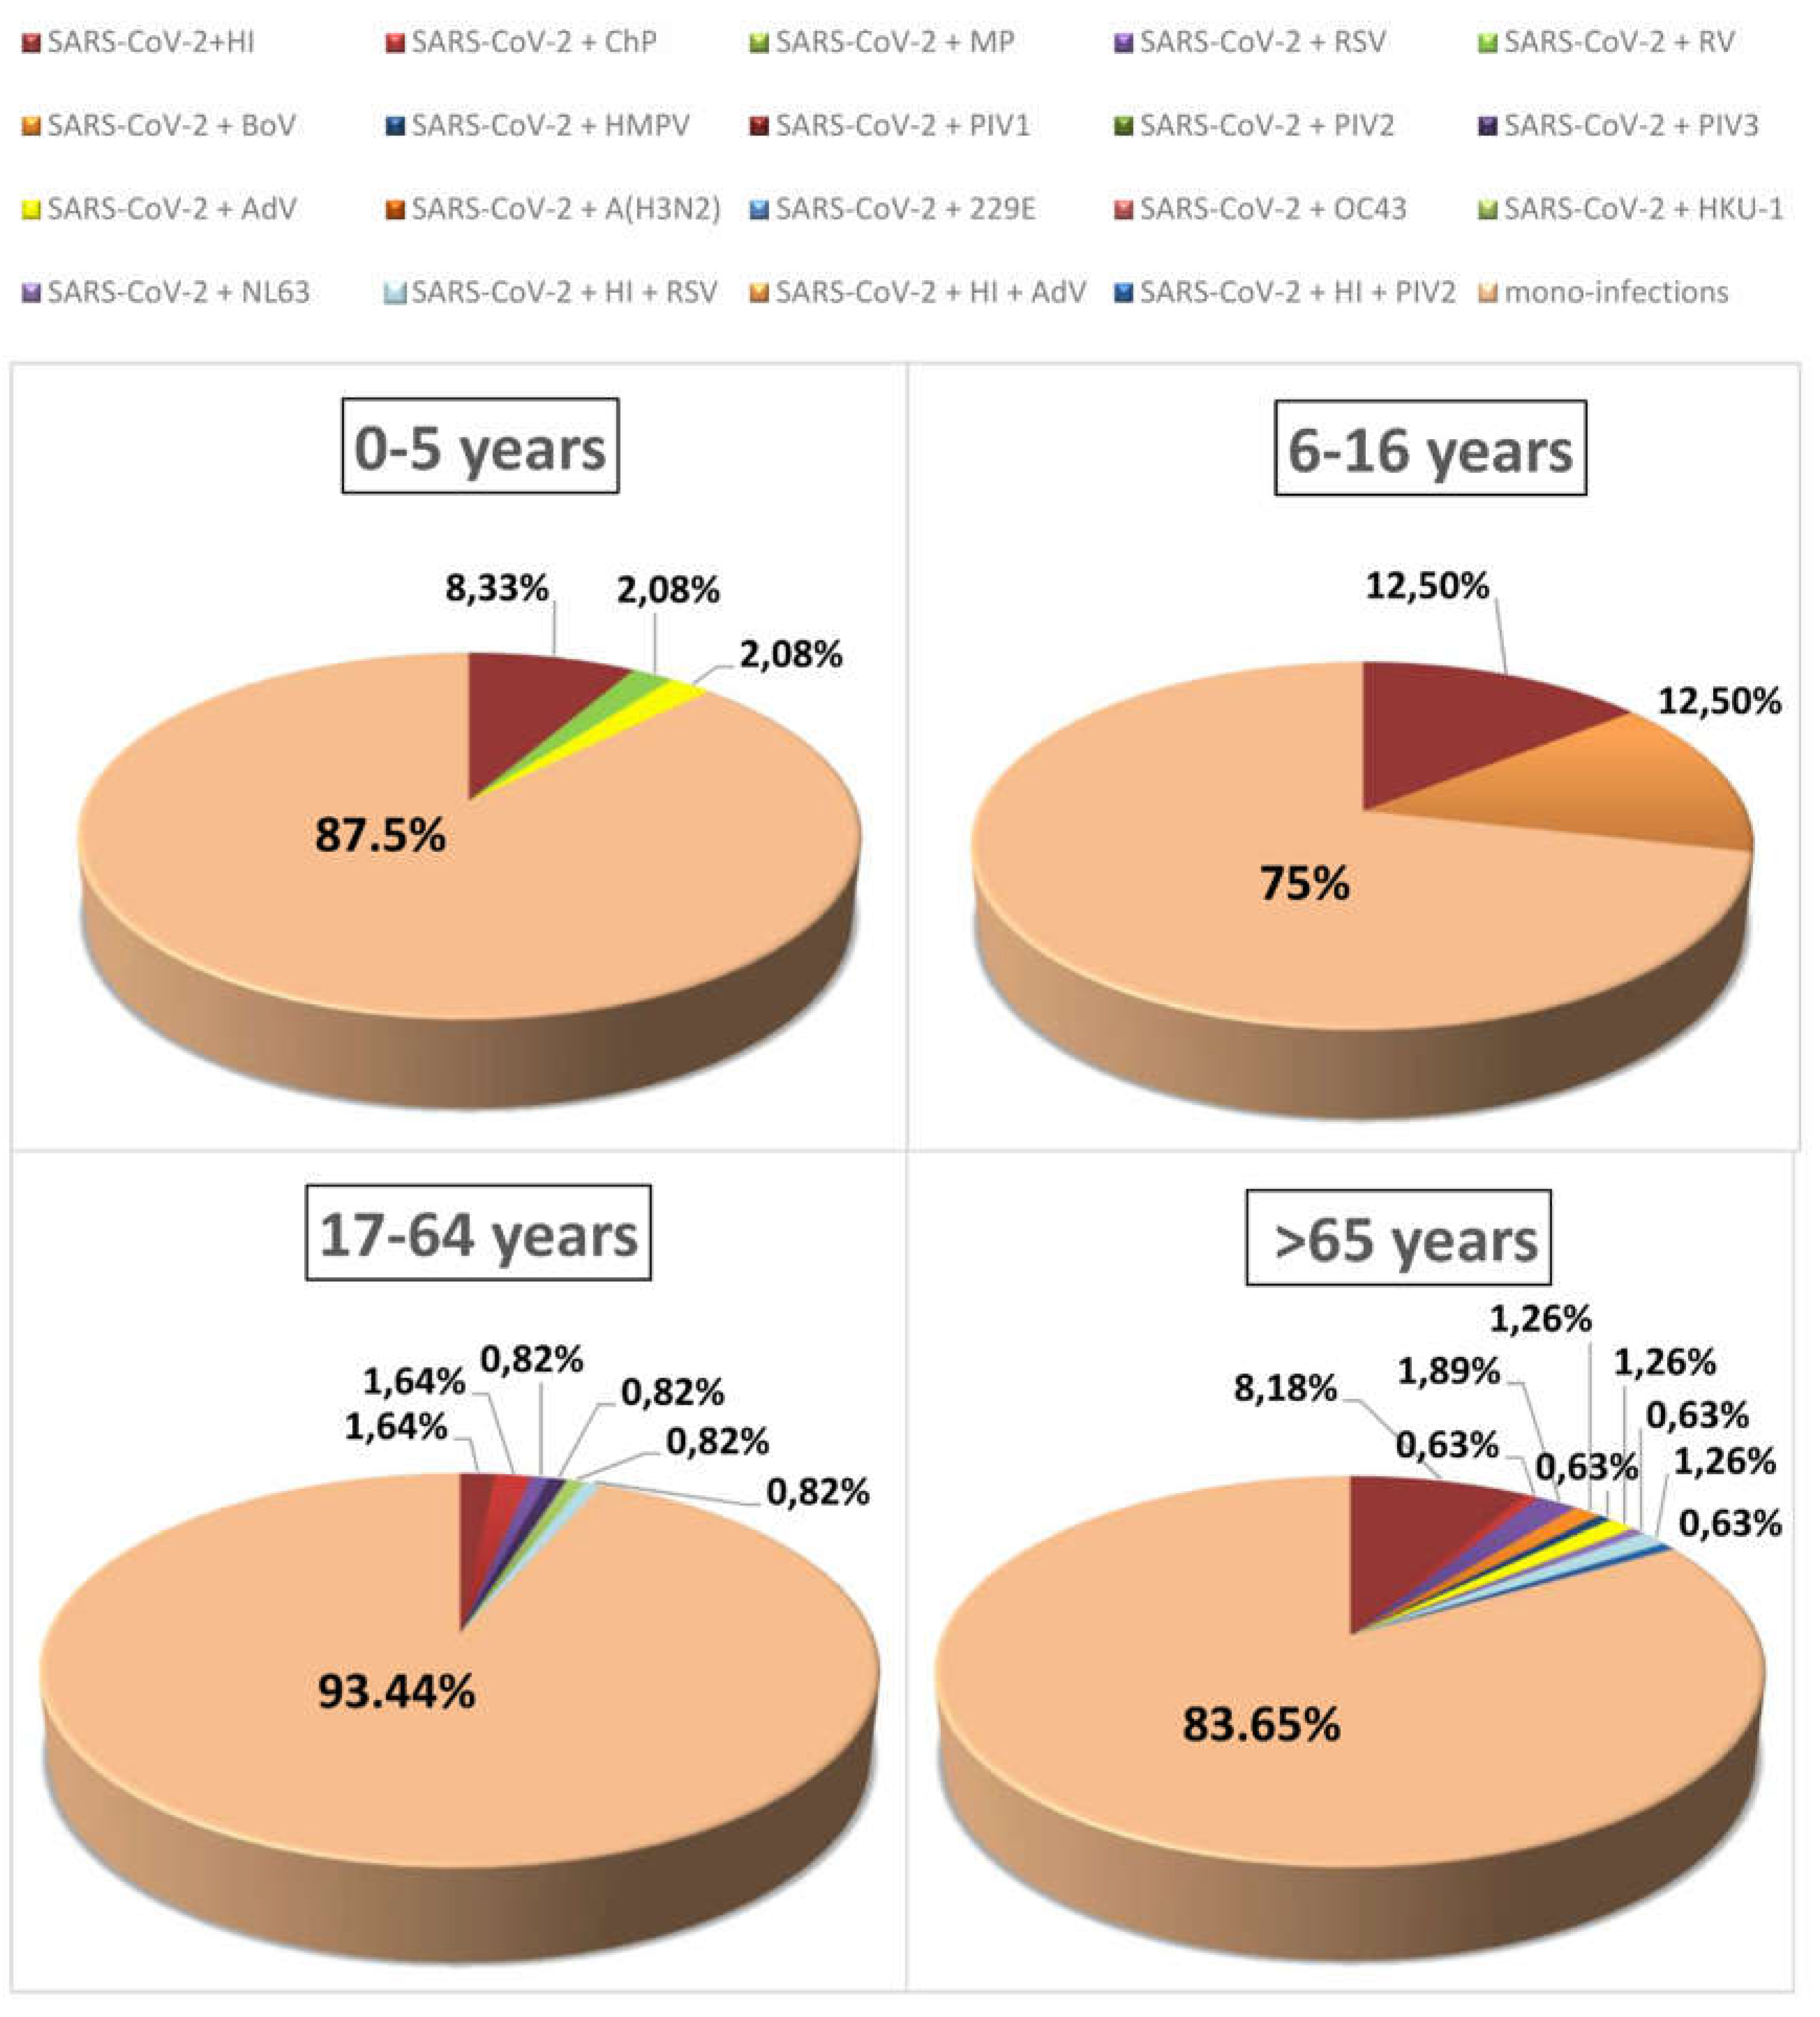
Figure 6.
Cox proportional hazards model estimating the risk of mortality in SARS-CoV-2 vaccine recipients compared with unvaccinated subjects, given the presence of co-infection with two or three other respiratory pathogens. Survivor function for groups: A) 1 (red line)—mono-infected, 2 (turquoise line), and 3 (green line); B) 1 (red line)—mono-infected unvaccinated and 2 (turquoise line)—vaccinated.
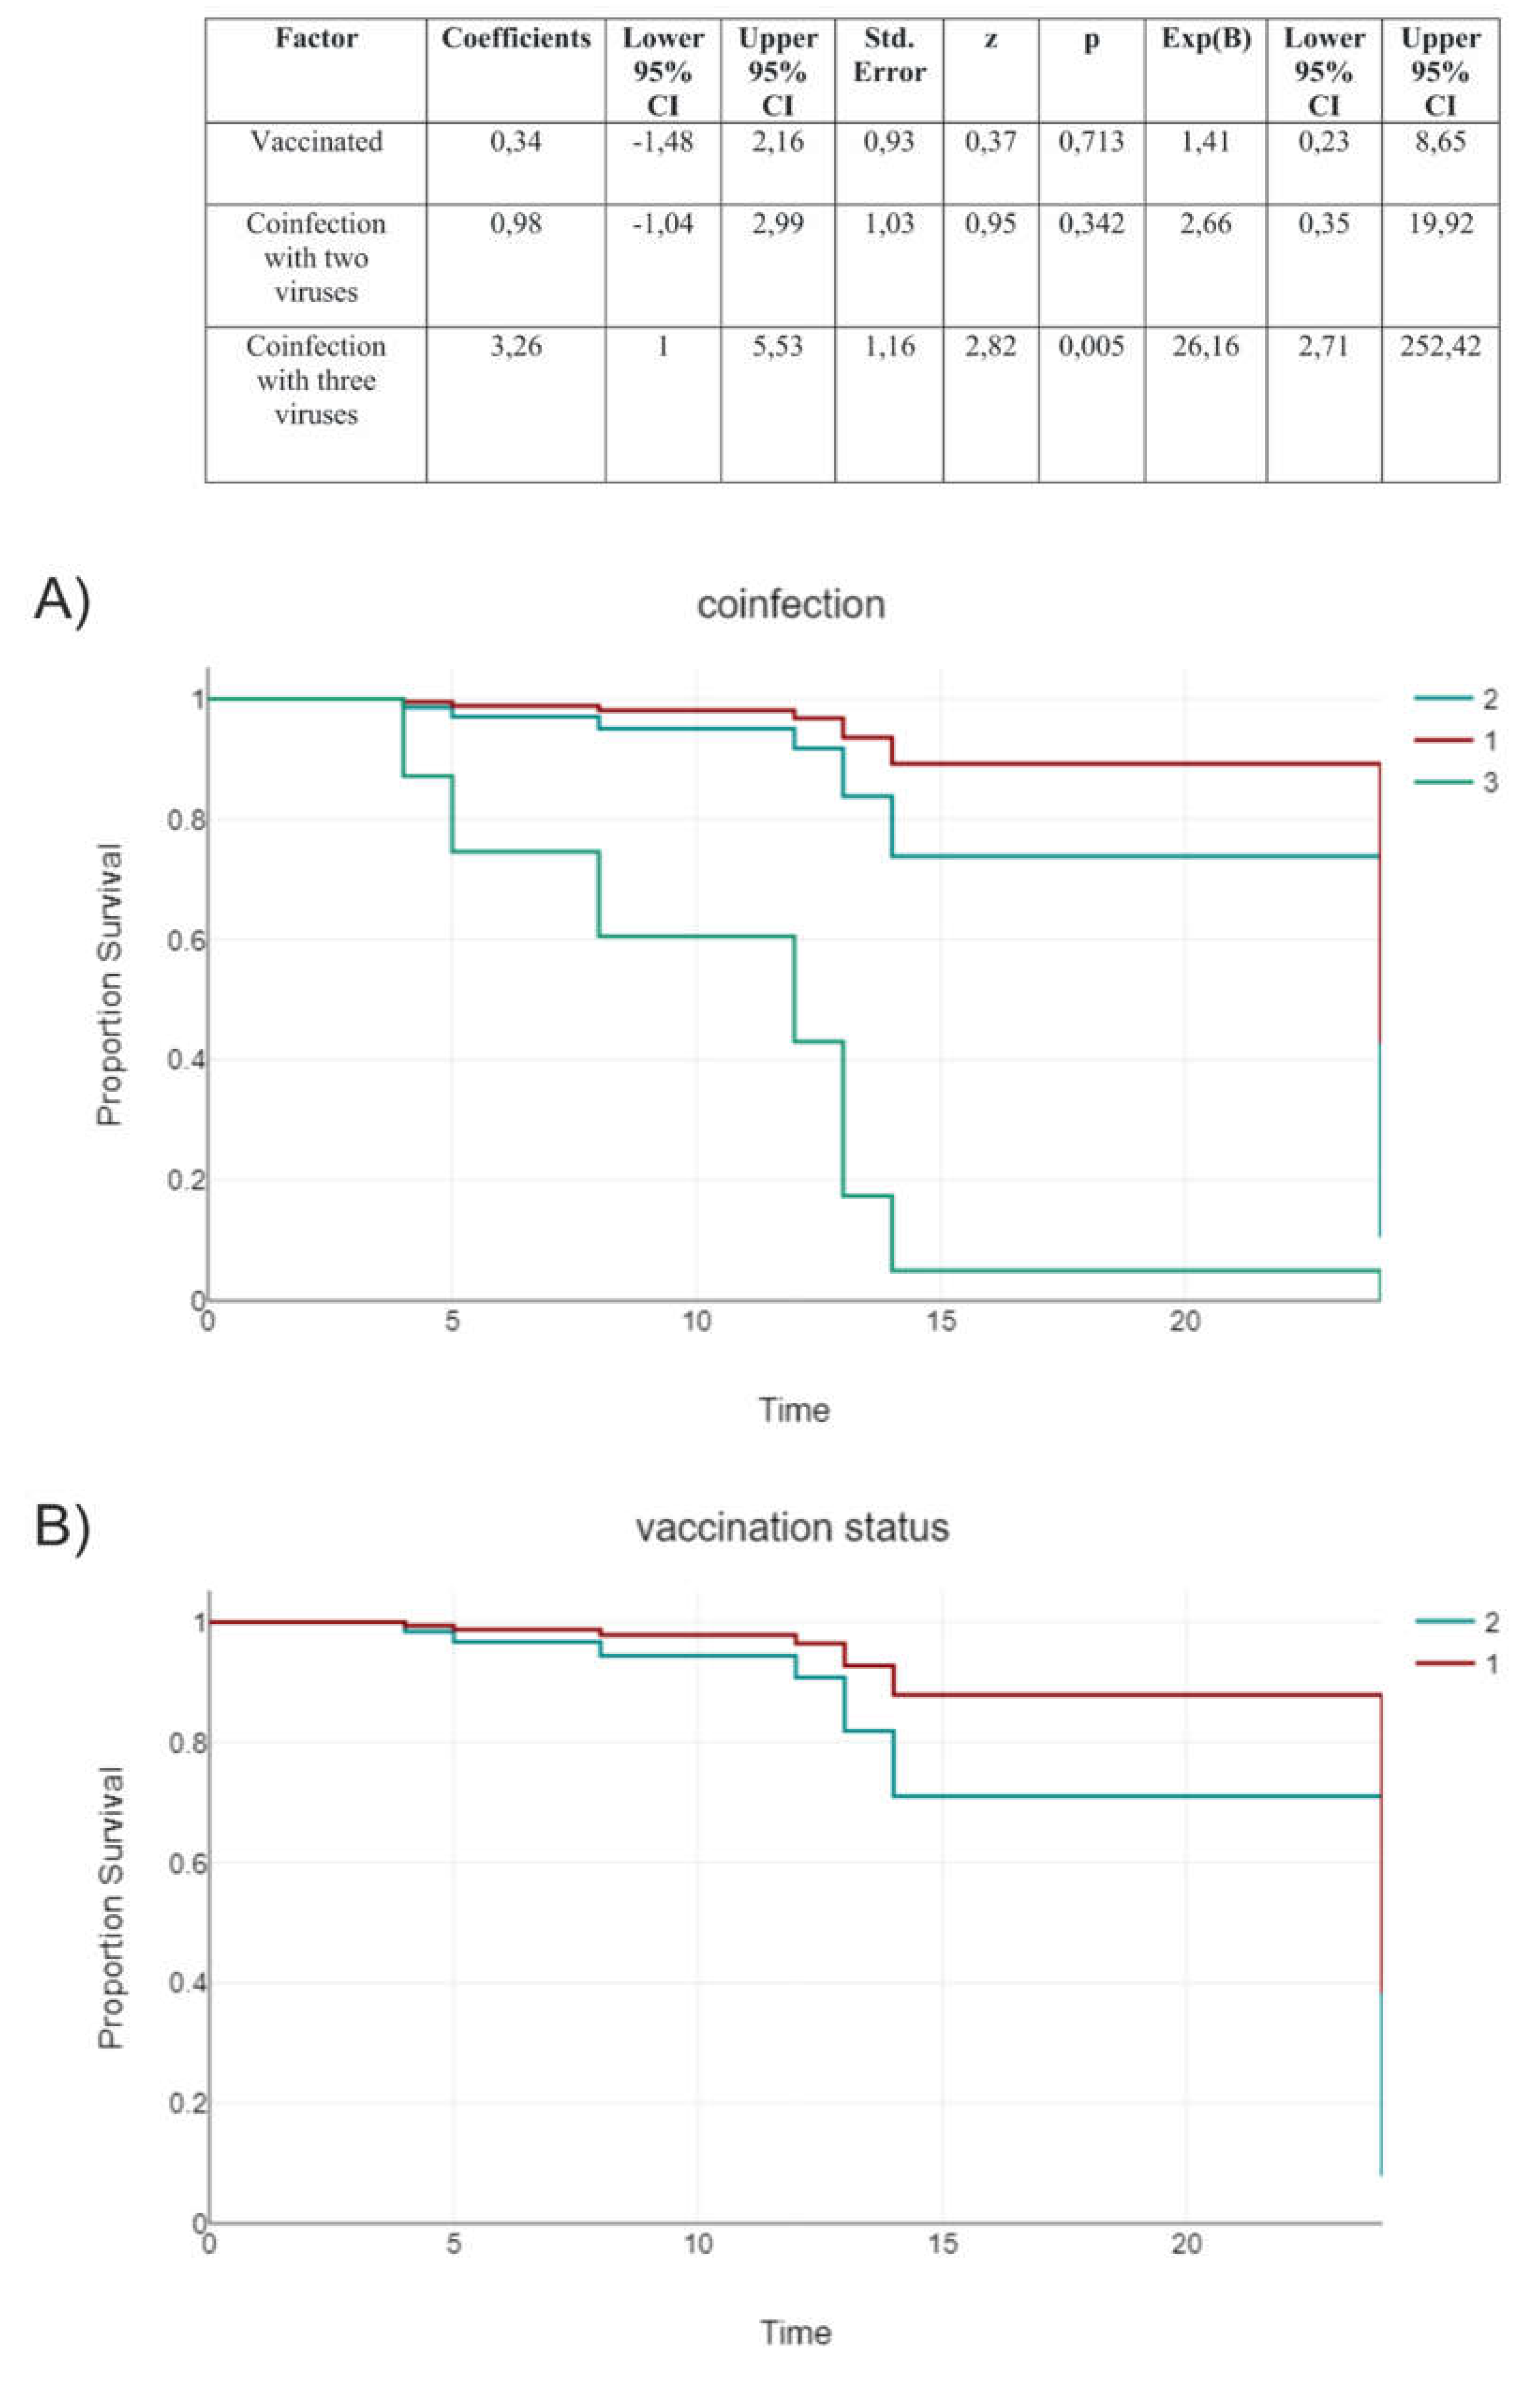
Table 1.
Conventional PCR conditions.
| PCR Conditions | |||
|---|---|---|---|
| Step | Cycles | Temperature | Time |
| 1. Initial denaturation | 1 | 94°С | 3 min. |
| 2.1 Denaturation 2.2 Annealing 2.3 Extension |
35 |
1) 94°С 2) 61°С 3) 72°С |
30 sec. 30 sec. 45 sec. |
| 3. Final extension | 1 | 72°С | 7 min. |
Table 3.
Distribution according to the SARS-CoV-2 sub-variant among confirmed co-infections.
| Delta | ||
| Tested: 119 | ||
| Co-infections: 2 | ||
| Positive rate: 1.7% | ||
| AY.75.1 | + BoV | n=1 |
| AY.4.4 | + RSV | n=1 |
| Omicron | ||
| Tested: 186 | ||
| Co-infections: 32 (29 + 3 triple) | ||
| Positive rate: 17.2% | ||
| BA.1 | + AdV | n=1 |
| + RSV | n=1 | |
| BA.1.1 | + HI | n=2 |
| BA.2 | + HI | n=13 |
| + HI + RSV | n=1 | |
| + HI +PIV2 | n=1 | |
| + HI + AdV | n=1 | |
| + ChP | n=2 | |
| + RSV | n=1 | |
| + BoV | n=1 | |
| + PIV3 | n=1 | |
| + NL63 | n=1 | |
| + AdV | n=2 | |
| BA.2.12 | + RV | n=1 |
| BA.2.9 | + HI | n=2 |
| + ChP | n=1 | |
Table 4.
Distribution of clinical parameters, such as symptoms, laboratory results, length of hospitalization, and clinical outcome, according to age in patients co-infected with SARS-CoV-2 and other respiratory viruses.
Table 4.
Distribution of clinical parameters, such as symptoms, laboratory results, length of hospitalization, and clinical outcome, according to age in patients co-infected with SARS-CoV-2 and other respiratory viruses.
| Age Group (Years Old) | 0-5 | 6-16 | 17-64 | >65 |
|---|---|---|---|---|
| Co-infected* (n) | 5 | 2 | 7 | 17 |
| Symptom | ||||
| Fever, n (%) | 4 (80) | 1 (50) | 7 (100) | 13 (76.5) |
| Fatigue, n (%) | 4 (80) | 2 (100) | 7 (100) | 11 (64.7) |
| Cough, n (%) | 2 (40) | 0 (0) | 7 (100) | 14 (82.4) |
| Diarrhea, n (%) | 1 (20) | 1 (50) | 2 (28,6) | 0 (0) |
| Headache, n (%) | 0 (0) | 0 (0) | 0 (0) | 3 (17.6) |
| Rheum, n (%) | 3 (60) | 1 (50) | 2 (28,6) | 4 (23.5) |
| Pneumonia, n (%) | 2 (40) | 2 (100) | 5 (71,4) | 15 (88.2) |
| Laboratory results | ||||
| Oxygen saturation, mean % | 93.2 | 90.5 | 91.7 | 89.5 |
| Lym, mean x10⁹/L | 2.73 | 2.1 | 2.10 | 2.32 |
| WBC, mean x10⁹/L | 5.12 | 9.75 | 4.94 | 5.48 |
| CRP, mean mg/L | 16.2 | 56.0 | 42.9 | 78.1 |
| Hospital stay, mean (days) | 3.1 | 6 | 5.2 | 8.12 |
| Clinical outcome | ||||
| ICU stay, n (%) | 1 (20) | 0 (0) | 1 (14.3) | 1 (20) |
| Fatal outcome, n (%) | 0 | 0 | 1 (14.3) | 2 (11.8) |
*With clinical data.
Table 5.
Clinical and laboratory data on patients infected with SARS-CoV-2 and other respiratory viruses and/or bacterial pathogens.
Table 5.
Clinical and laboratory data on patients infected with SARS-CoV-2 and other respiratory viruses and/or bacterial pathogens.
| SARS-CoV-2 Mono-Infection | Viral SARS-CoV-2 Co-Infection | Bacterial SARS-CoV-2 Co-Infection | SARS-CoV-2 Triple Infection | p-Value: Viral vs. Bacterial Co-Infection | p-Value: Co- vs. Triple Infection | p-Value: Mono- vs. Co- Infection | p-Value: Mono- vs. Triple Infection | |
|---|---|---|---|---|---|---|---|---|
| Distribution, n (%) | 295 (87.5) | 14 (4.2) | 23 (6.8) | 5 (1.5) | – | – | – | – |
| With clinical data, n | 141 | 9 | 19 | 5 | – | – | – | – |
| Symptoms, n (%) | ||||||||
| Fever | 110 (78) | 8 (88.9) | 15 (78.9) | 4 (80) | 1 | 1 | 0.8138 | 1 |
| Fatigue | 111 (78.8) | 7 (77.8) | 14 (73.7) | 4 (80) | 1 | 1 | 0.8151 | 1 |
| Cough | 107 (75.9) | 7 (77.8) | 14 (73.7) | 3 (60) | 1 | 0.5971 | 0.8228 | 0.5971 |
| Diarrhea | 22 (15.6) | 1 (11.7) | 2 (10.5) | 2 (40) | 1 | 0.1546 | 1 | 0.1895 |
| Headache | 39 (27.7) | 4 (44.4) | 1 (5.3) | – | 0.0256 | 0.5686 | 0.1825 | 0.3247 |
| Rheum | 50 (35.5) | 3 (33.3) | 4 (21.1) | 2 (40) | 0.6465 | 0.5971 | 0.4198 | 1 |
| Pneumonia | 83 (58.9) | 6 (66.7) | 12 (63.2) | 3 (60) | 1 | 1 | 0.6955 | 1 |
| Laboratory results, mean | ||||||||
| Oxygen saturation (%) | 91.8 | 93.4 | 90.4 | 87.8 | n.s* | n.s | n.s | n.s |
| Lym, (x10⁹/L) | 1.76 | 0.88 | 3.1 | 1.5 | n.s | n.s | n.s | n.s |
| WBC, (x10⁹/L) | 6.9 | 5.4 | 5.4 | 8.7 | n.s | 0.02 | n.s | n.s |
| CRP, (mg/L) | 65.5 | 86.7 | 48.3 | 109.6 | n.s | n.s | n.s | n.s |
| Treatment, n (%) | ||||||||
| Antibiotics | 96 (68.1) | 7 (77.8) | 12 (63.2) | 4 (80) | 0.67 | 1 | 1 | 1 |
| Antiviral drugs | 14 (9.9) | – | 1 (5.3) | – | 1 | 1 | 0.3086 | 1 |
| Corticosteroids | 44 (31.2) | 3 (33.3) | 9 (47.4) | 3 (60) | 0.687 | 0.639 | 0.1525 | 0.3283 |
| Vasodilators | 10 (7.1) | – | 1 (5.3) | – | 1 | 1 | 0.6925 | 1 |
| Heparin | 73 (51.8) | 6 (66.7) | 11 (57.9) | 2 (40) | 1 | 0.6285 | 0.5658 | 0.3595 |
| Oxygen therapy | 60 (42.6) | 3 (33.3) | 10 (52.3) | 4 (80) | 0.4348 | 0.3353 | 0.4367 | 0.1687 |
| Clinical outcome | ||||||||
| Hospital stay, mean (days) | 6.1 | 7.8 | 5.3 | 6.3 | n.s | n.s | n.s | n.s |
| ICU stay, n (%) | 1 (0.7) | – | 1 (5.3) | 2 (40) | 1 | 0.0501 | 0.3129 | 0.0028 |
| Fatal outcome, n (%) | 14 (9.9) | – | 2 (10.5) | 1 (20) | 1 | 0.3996 | 1 | 0.4493 |
n.s*—non-significant.
Table 6.
The Cox proportional hazards model estimated the risk of mortality and ICU admission in SARS-CoV-2 patients, considering co-infection with two or three pathogens and the associated hazard of increasing days from the first symptom to hospital admission.
Table 6.
The Cox proportional hazards model estimated the risk of mortality and ICU admission in SARS-CoV-2 patients, considering co-infection with two or three pathogens and the associated hazard of increasing days from the first symptom to hospital admission.
| Factor | Coefficients | Lower 95% CI | Upper 95% CI | Std. Error | z | p | Exp(B) | Lower 95% CI | Upper 95% CI |
|---|---|---|---|---|---|---|---|---|---|
| Co-infection with two viruses | 2,5 | 0,09 | 4,9 | 1,23 | 2,04 | 0,042 | 12,14 | 1,1 | 134,26 |
| Co-infection with three viruses | 4,55 | 1,51 | 7,58 | 1,55 | 2,94 | 0,003 | 94,5 | 4,54 | 1967,29 |
| Days from the onset of symptoms before hospitalization | 0,25 | -0,08 | 0,58 | 0,17 | 1,51 | 0,131 | 1,29 | 0,93 | 1,79 |
Disclaimer/Publisher’s Note: The statements, opinions and data contained in all publications are solely those of the individual author(s) and contributor(s) and not of MDPI and/or the editor(s). MDPI and/or the editor(s) disclaim responsibility for any injury to people or property resulting from any ideas, methods, instructions or products referred to in the content. |
© 2024 by the authors. Licensee MDPI, Basel, Switzerland. This article is an open access article distributed under the terms and conditions of the Creative Commons Attribution (CC BY) license (http://creativecommons.org/licenses/by/4.0/).
Copyright: This open access article is published under a Creative Commons CC BY 4.0 license, which permit the free download, distribution, and reuse, provided that the author and preprint are cited in any reuse.


