Submitted:
27 August 2024
Posted:
28 August 2024
You are already at the latest version
Abstract
Keywords:
1. Introduction
2. Materials and Methods
2.1. Literature Search Strategy
2.2. Eligibility Criteria and Study Selection
- (a)
- Non-original studies (reviews, meta-analyses)
- (b)
- Case series with <10 PD patients or <10 control subjects and case reports
- (c)
- Abstracts in conferences, congresses of other scientific meetings
- (d)
- Studies implementing seeding assays for CSF a-synuclein (PMCA: protein misfolding cyclic amplification; RTQuIC: real-time quaking-induced conversion)
2.3. Data Extraction
2.4. Summary Measures
2.5. Quality Evaluation
2.6. Statistical Analysis
2.7. Subgroup Analysis
2.8. Meta-Regression
3. Results
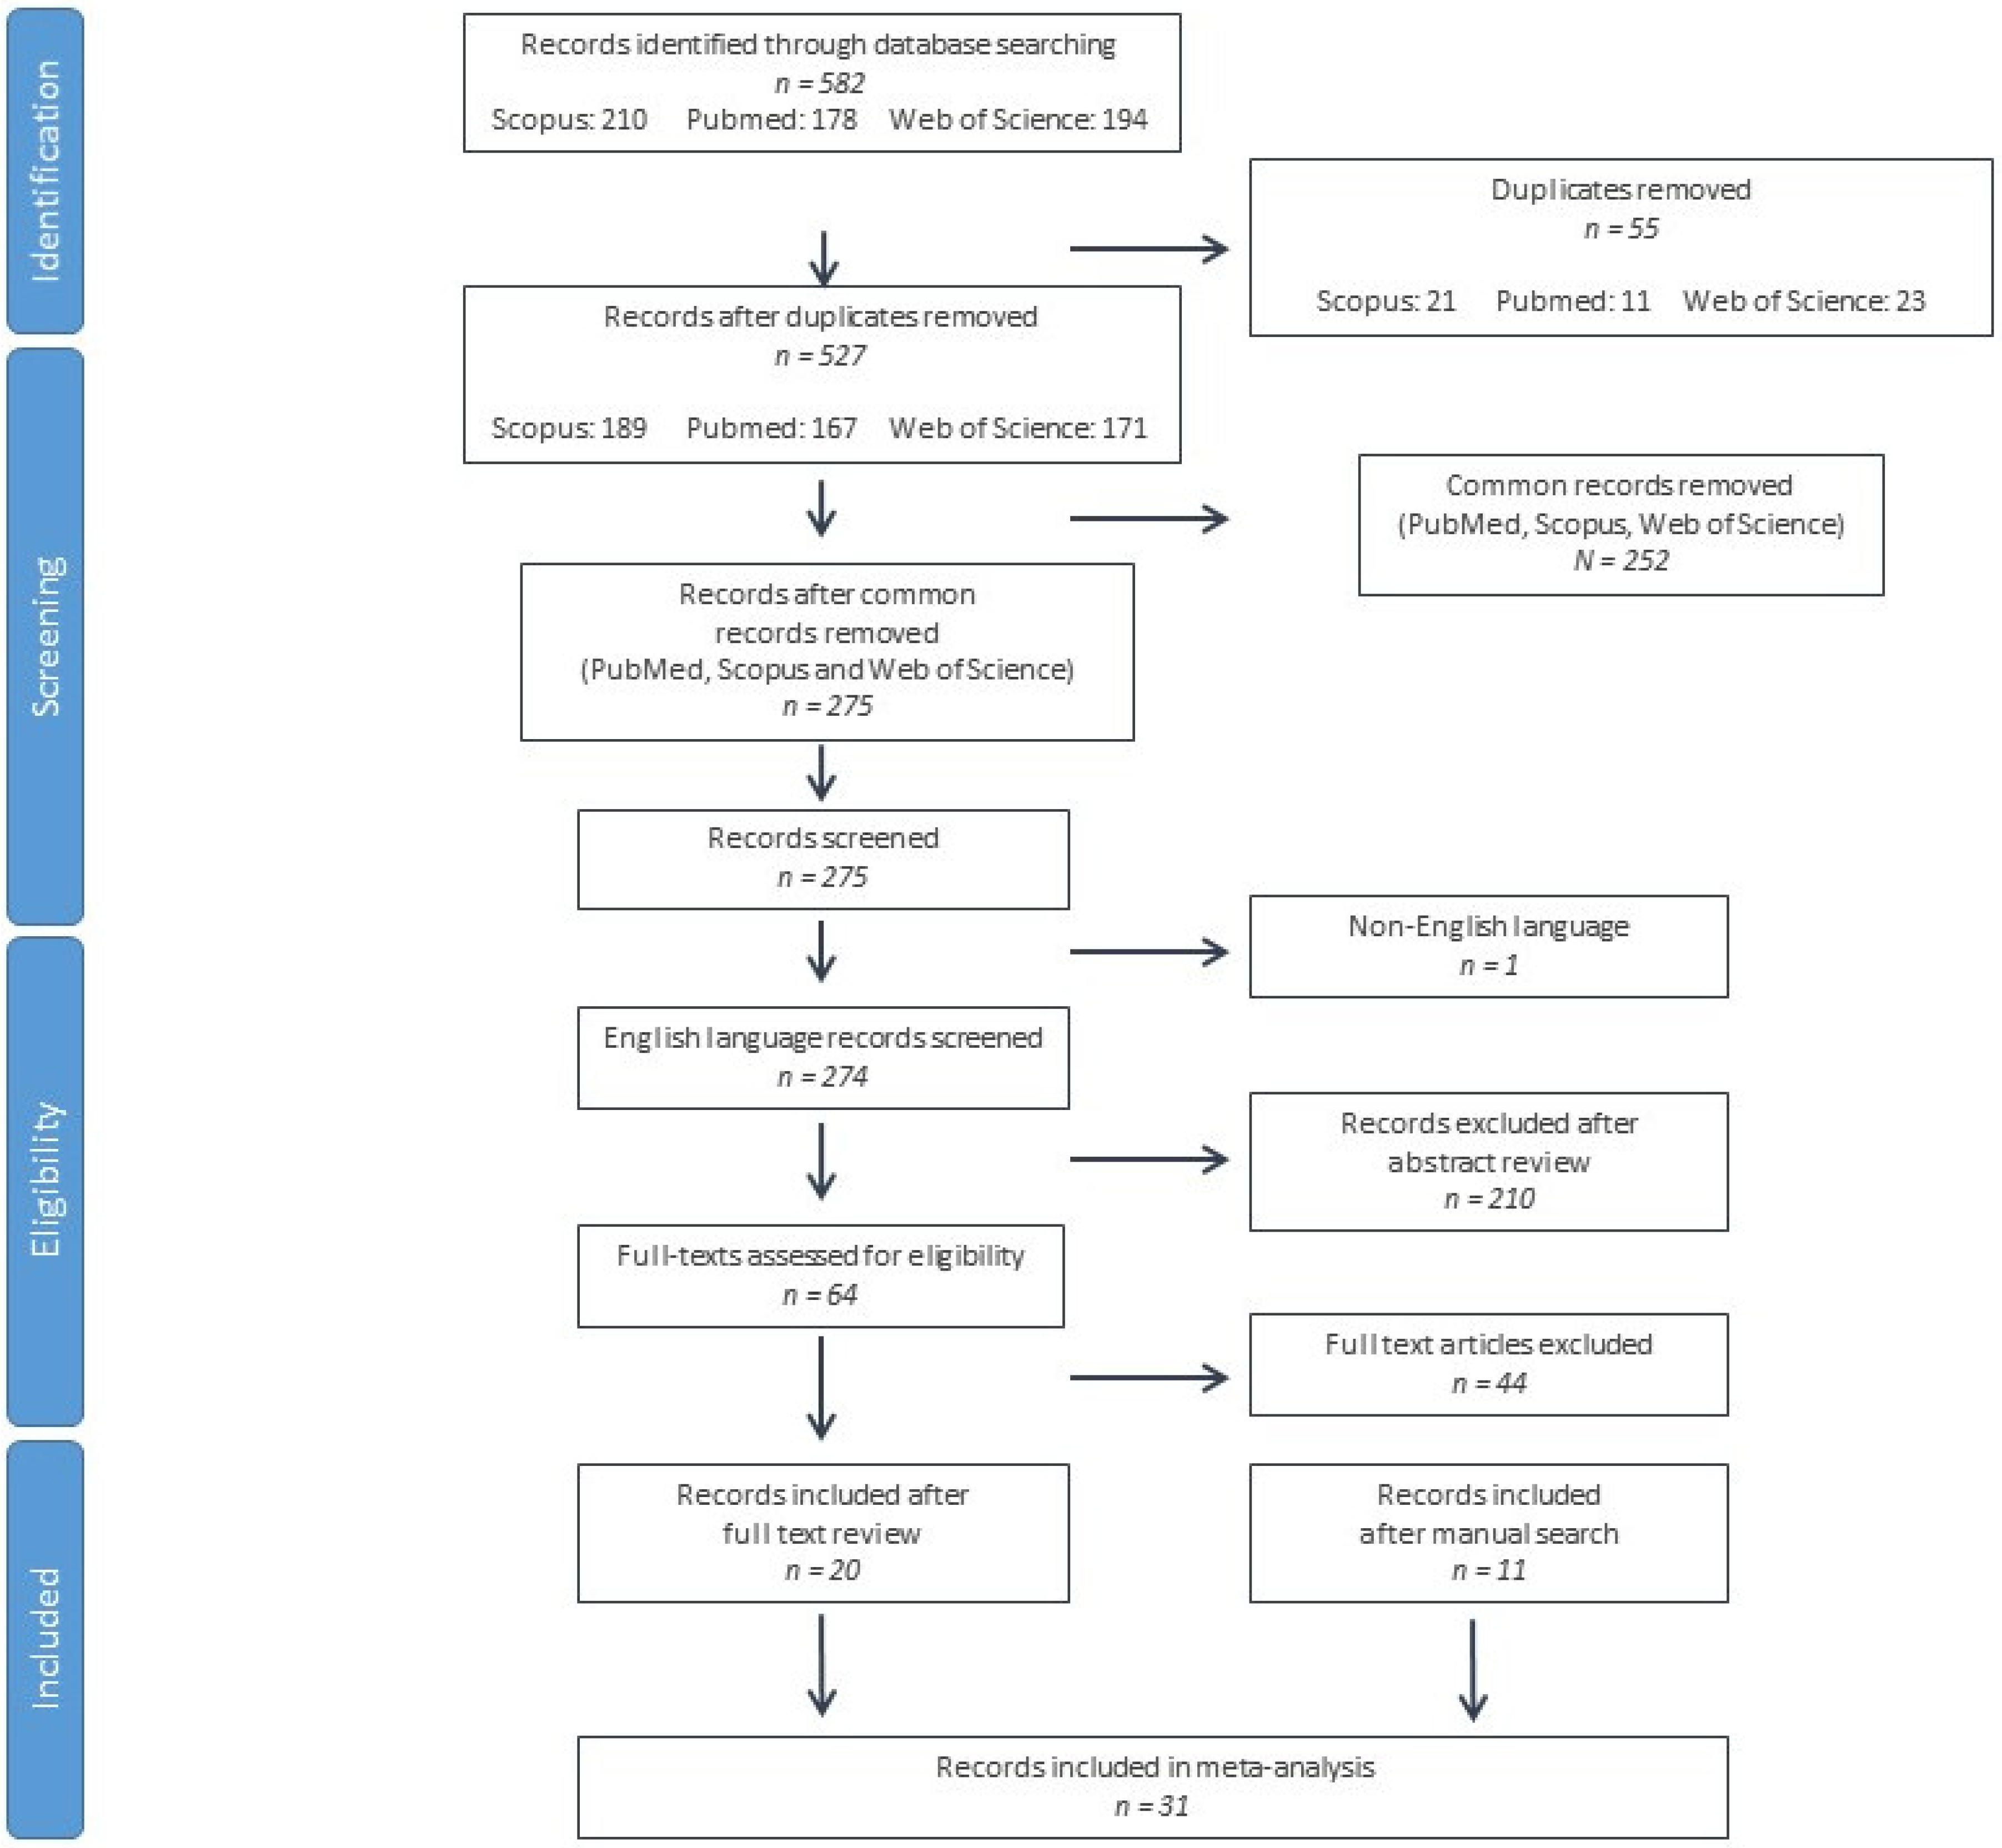
3.1. Literature Search and Screening Results
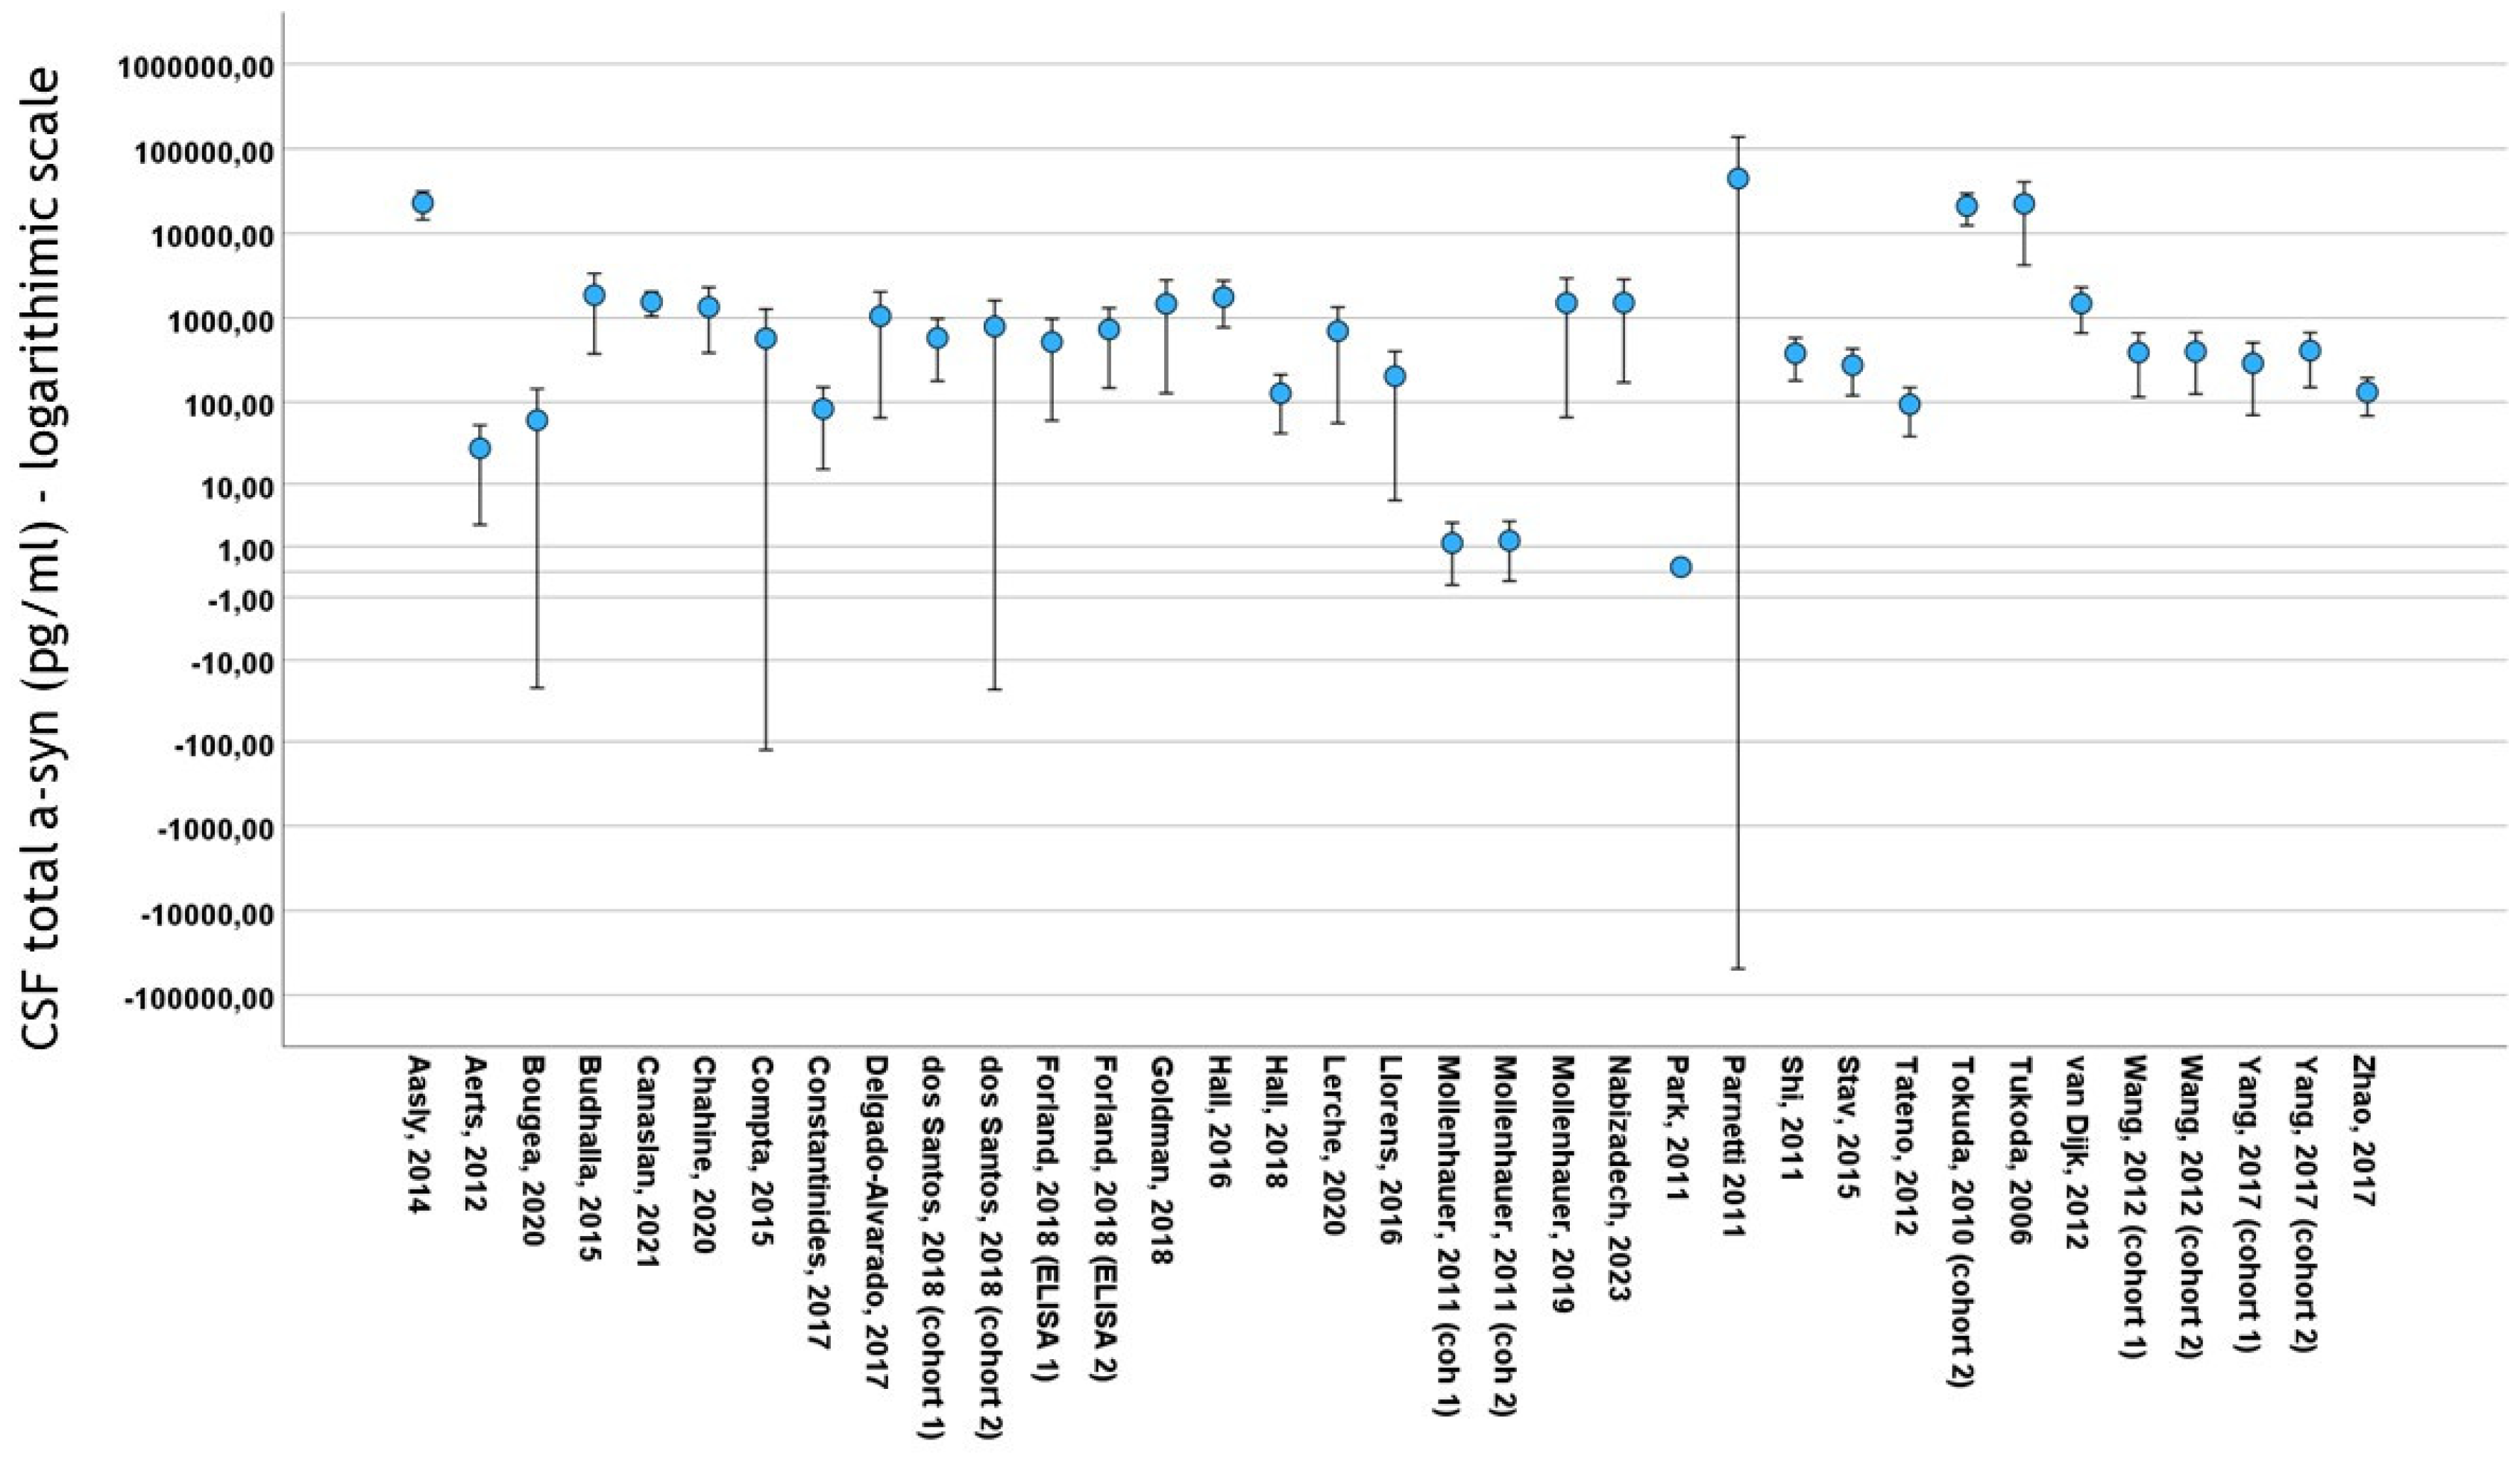
3.2. Basic Features included in the Study
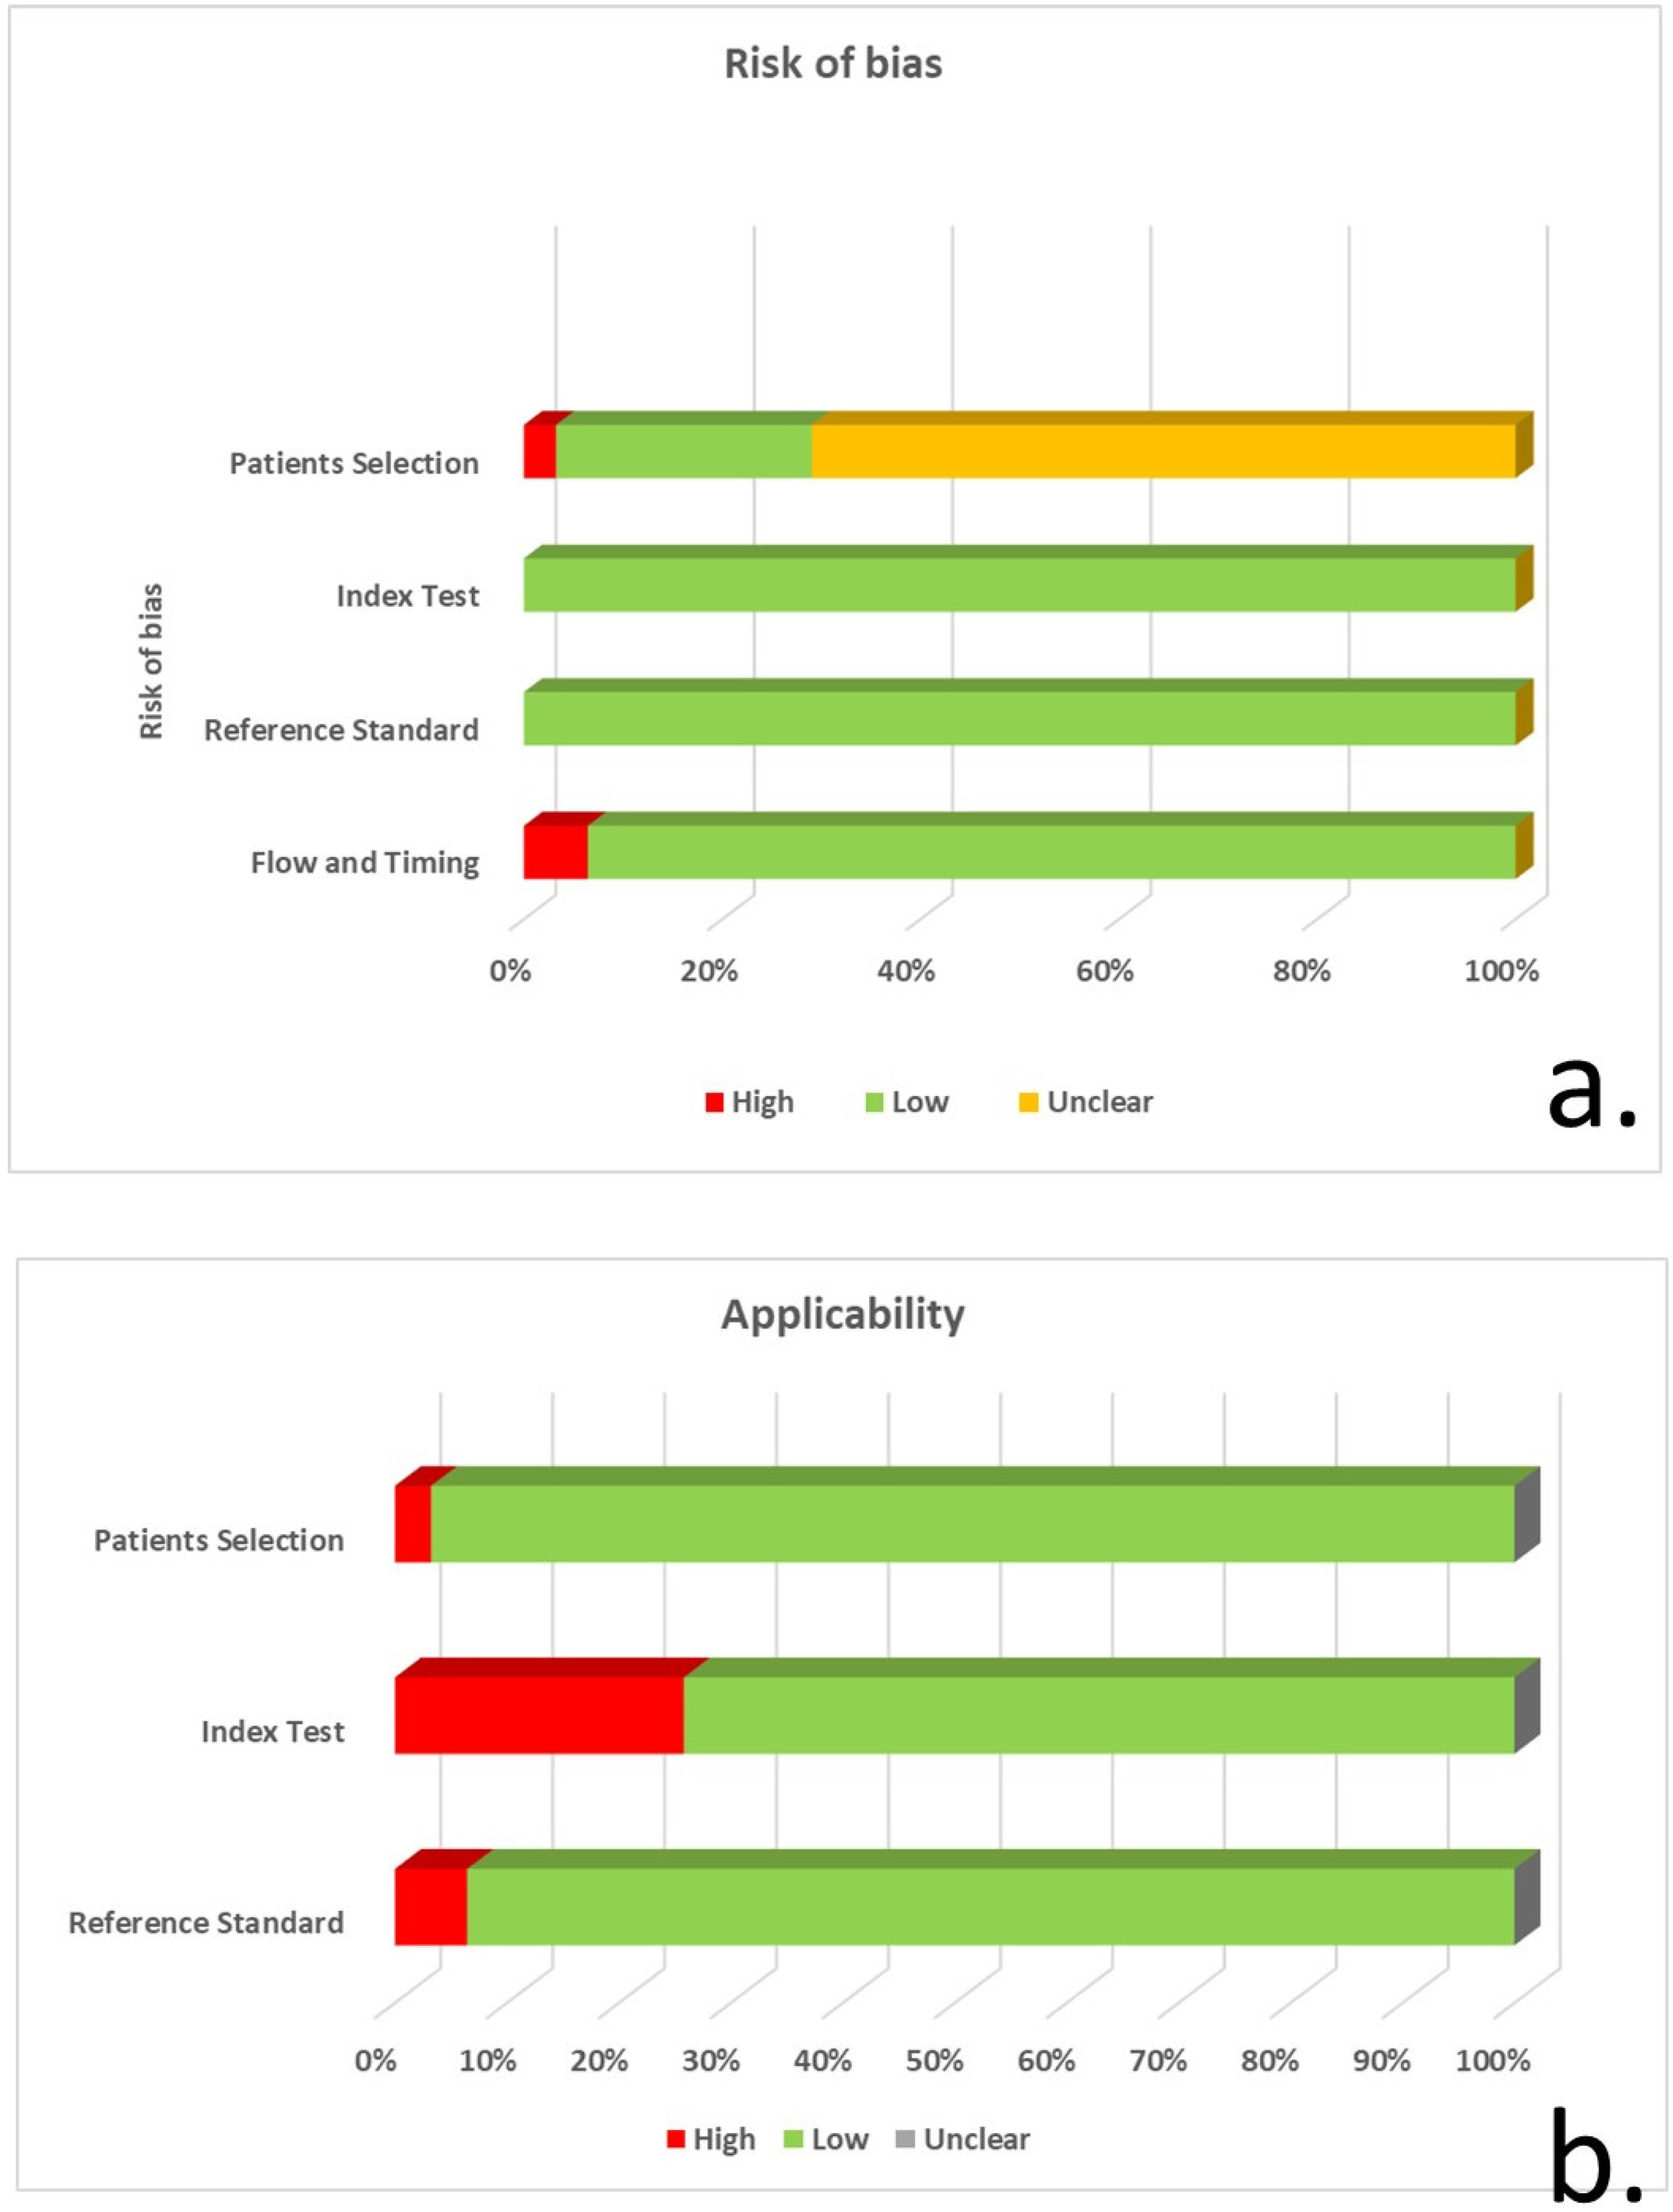
3.3. Quality Evaluation of included Studies
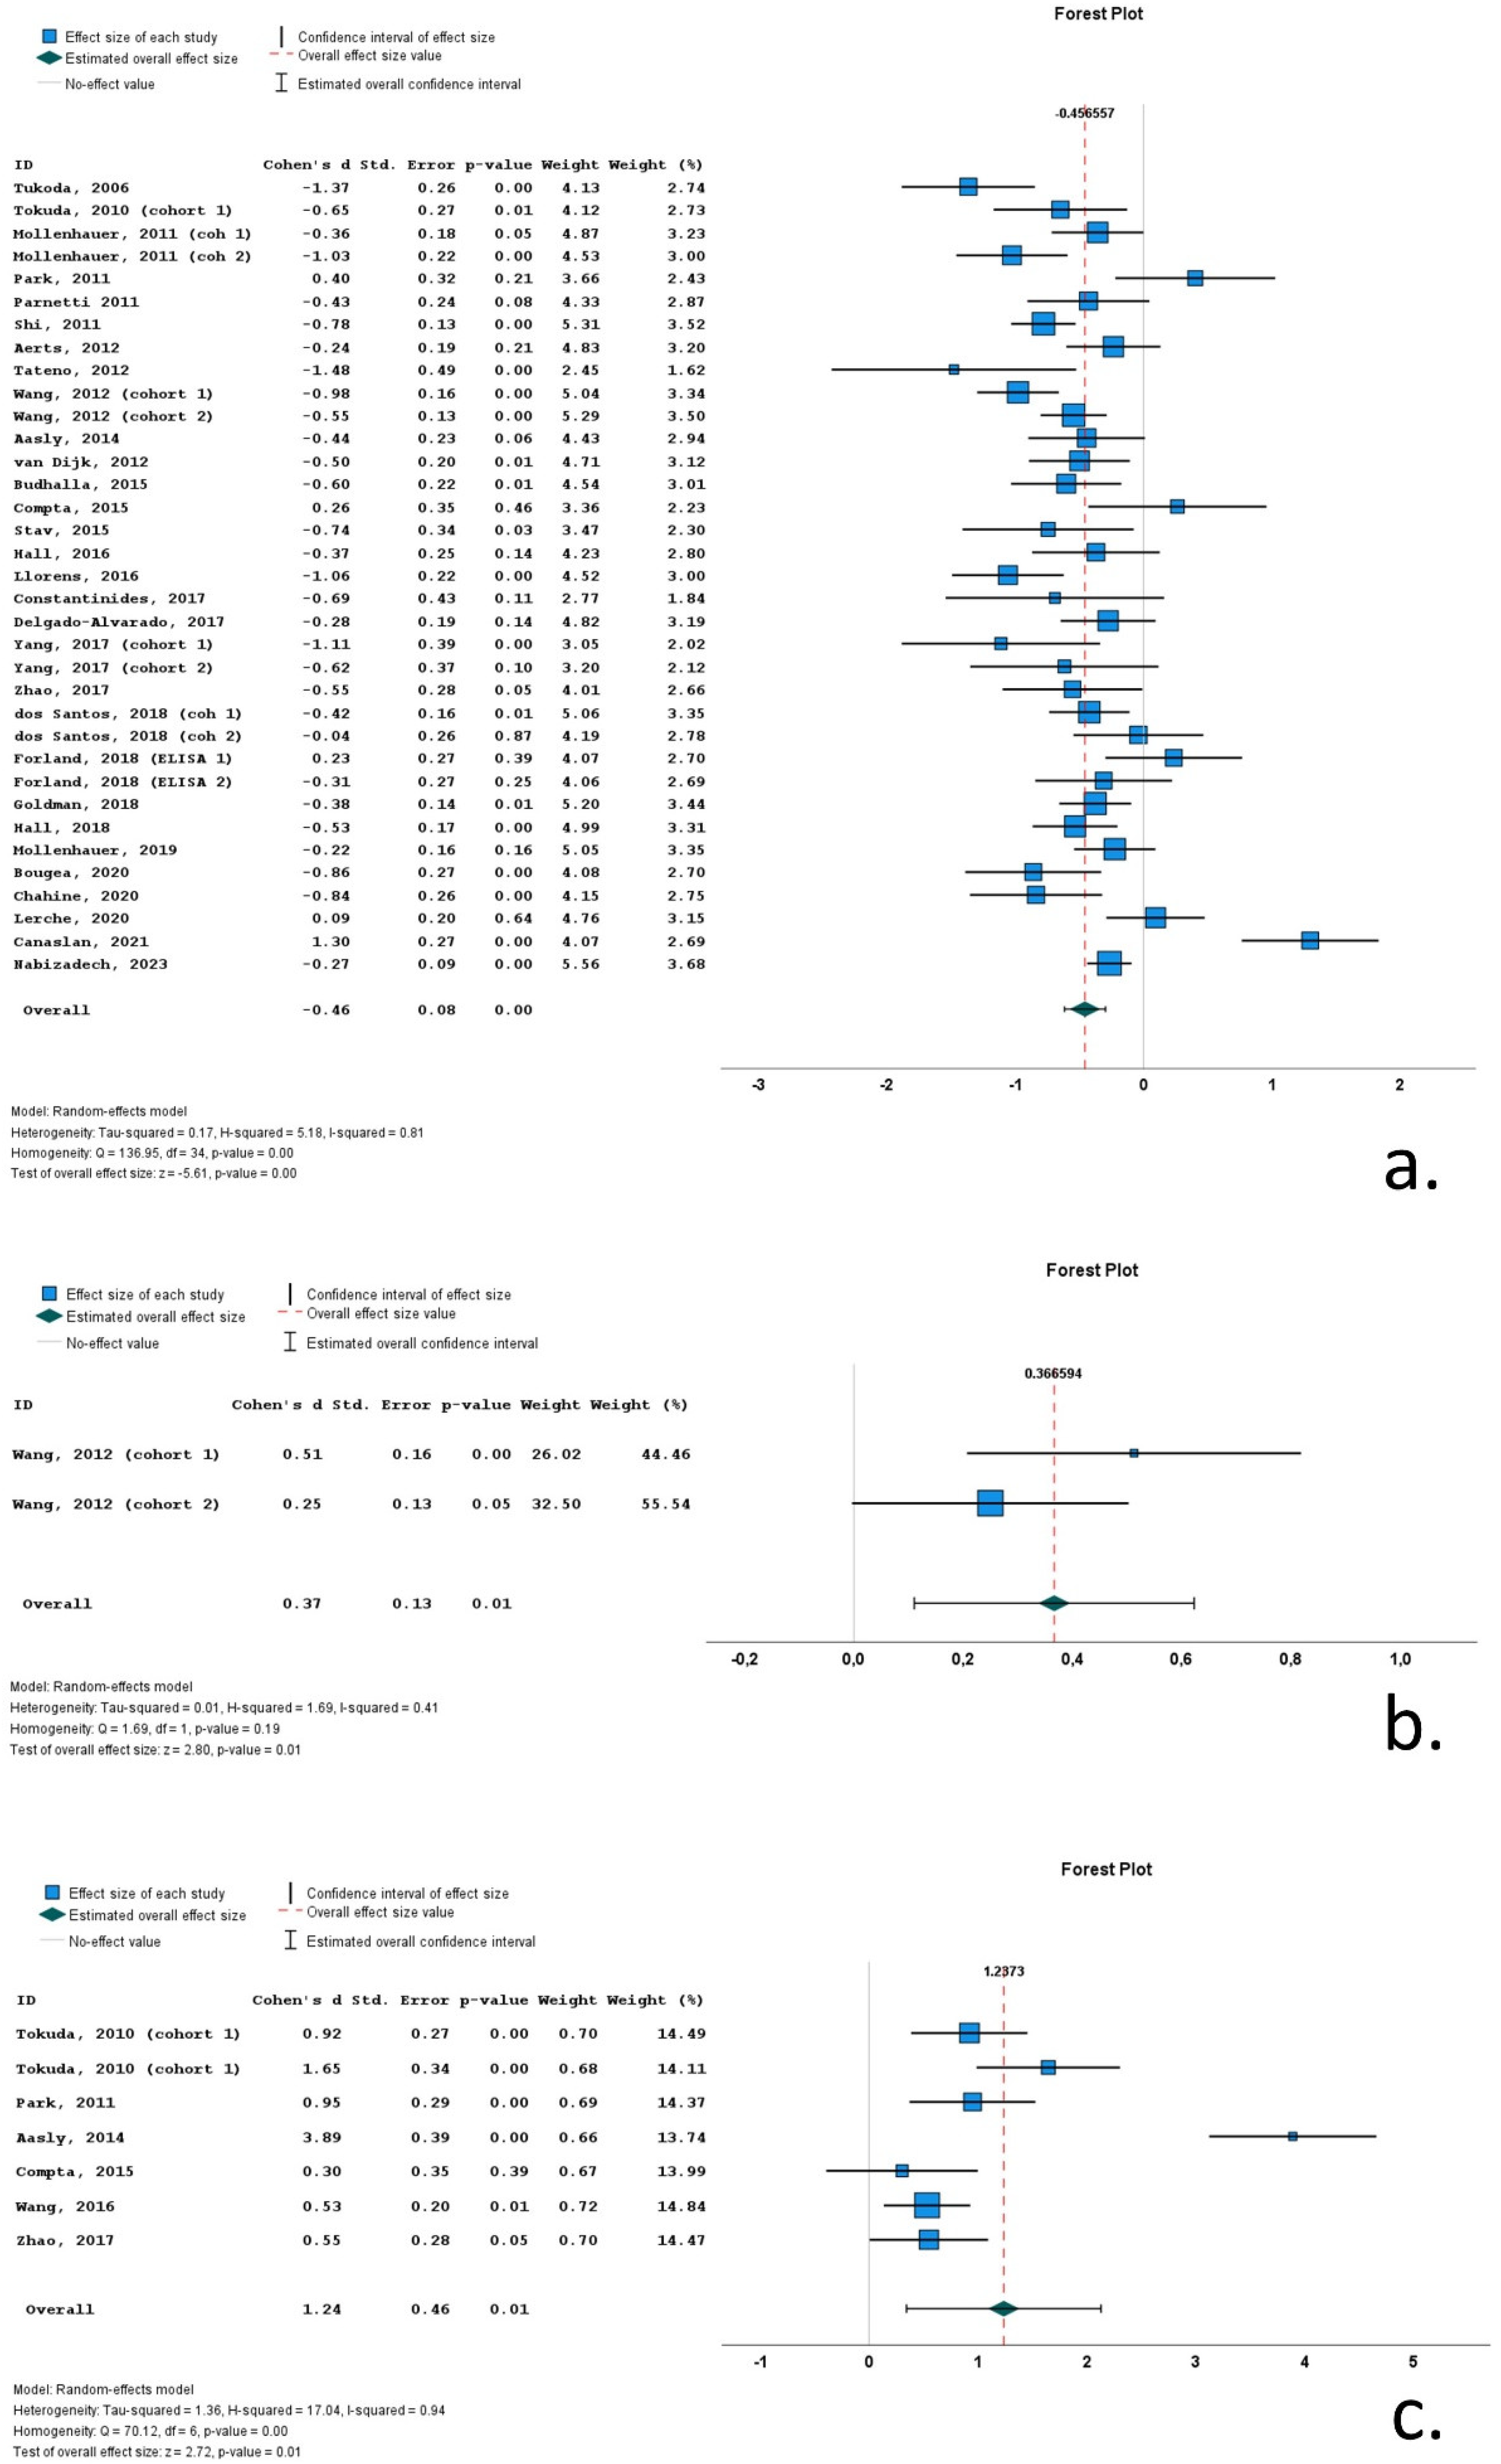
3.4. Results of Meta-Analysis
3.5. Heterogeneity
3.6. Subgroup Analyses
3.7. Meta-Regression
3.8. Publication Bias
4. Discussion
Supplementary Materials
 : low;
  : high; ?: unclear
Author Contributions
Funding
Institutional Review Board Statement
Informed Consent Statement
Data Availability Statement
Acknowledgments
Conflicts of Interest
References
- Twelves, D.; Perkins, K.S.; Counsell, C. Systematic review of incidence studies of Parkinson's disease. Mov Disord 2003, 18, 19–31. [Google Scholar] [CrossRef] [PubMed]
- Postuma, R.B.; Berg, D.; Stern, M.; Poewe, W.; Olanow, C.W.; Oertel, W.; Obeso, J.; Marek, K.; Litvan, I.; Lang, A.E.; et al. MDS clinical diagnostic criteria for Parkinson's disease. Mov Disord 2015, 30, 1591–1601. [Google Scholar] [CrossRef]
- Spillantini, M.G.; Schmidt, M.L.; Lee, V.M.; Trojanowski, J.Q.; Jakes, R.; Goedert, M. Alpha-synuclein in Lewy bodies. Nature 1997, 388, 839–840. [Google Scholar] [CrossRef]
- Schlossmacher, M.G.; Mollenhauer, B. Biomarker research in Parkinson's disease: objective measures needed for patient stratification in future cause-directed trials. Biomark Med 2010, 4, 647–650. [Google Scholar] [CrossRef] [PubMed]
- Jack, C.R.; Bennett, D.A.; Blennow, K.; Carrillo, M.C.; Dunn, B.; Haeberlein, S.B.; Holtzman, D.M.; Jagust, W.; Jessen, F.; Karlawish, J.; et al. NIA-AA Research Framework: Toward a biological definition of Alzheimer's disease. Alzheimers Dement 2018, 14, 535–562. [Google Scholar] [CrossRef] [PubMed]
- Eusebi, P.; Giannandrea, D.; Biscetti, L.; Abraha, I.; Chiasserini, D.; Orso, M.; Calabresi, P.; Parnetti, L. Diagnostic Utility of Cerebrospinal Fluid α-Synuclein in Parkinson's Disease: A Systematic Review and Meta-Analysis. Movement Disorders 2017, 32, 1389–1400. [Google Scholar] [CrossRef]
- Xiang, C.; Cong, S.; Tan, X.; Ma, S.; Liu, Y.; Wang, H.; Cong, S. A meta-analysis of the diagnostic utility of biomarkers in cerebrospinal fluid in Parkinson's disease. NPJ Parkinsons Dis 2022, 8, 165. [Google Scholar] [CrossRef]
- Page, M.J.; McKenzie, J.E.; Bossuyt, P.M.; Boutron, I.; Hoffmann, T.C.; Mulrow, C.D.; Shamseer, L.; Tetzlaff, J.M.; Akl, E.A.; Brennan, S.E.; et al. The PRISMA 2020 statement: an updated guideline for reporting systematic reviews. BMJ 2021, 372, n71. [Google Scholar] [CrossRef]
- Wood, J.A. Methodology for Dealing With Duplicate Study Effects in a Meta-Analysis. Organizational Research Methods 2008, 11, 79–95. [Google Scholar] [CrossRef]
- Sawilowsky, S.S. New Effect Size Rules of Thumb. Journal of Modern Applied Statistical Methods 2009, 8, 597–599. [Google Scholar] [CrossRef]
- Whiting, P.F.; Rutjes, A.W.; Westwood, M.E.; Mallett, S.; Deeks, J.J.; Reitsma, J.B.; Leeflang, M.M.; Sterne, J.A.; Bossuyt, P.M.; Group, Q.-. . QUADAS-2: a revised tool for the quality assessment of diagnostic accuracy studies. Ann Intern Med 2011, 155, 529–536. [Google Scholar] [CrossRef] [PubMed]
- Tokuda, T.; Salem, S.A.; Allsop, D.; Mizuno, T.; Nakagawa, M.; Qureshi, M.M.; Locascio, J.J.; Schlossmacher, M.G.; El-Agnaf, O.M. Decreased alpha-synuclein in cerebrospinal fluid of aged individuals and subjects with Parkinson's disease. Biochem Biophys Res Commun 2006, 349, 162–166. [Google Scholar] [CrossRef] [PubMed]
- Tokuda, T.; Qureshi, M.M.; Ardah, M.T.; Varghese, S.; Shehab, S.A.; Kasai, T.; Ishigami, N.; Tamaoka, A.; Nakagawa, M.; El-Agnaf, O.M. Detection of elevated levels of alpha-synuclein oligomers in CSF from patients with Parkinson disease. Neurology 2010, 75, 1766–1772. [Google Scholar] [CrossRef] [PubMed]
- Mollenhauer, B.; Locascio, J.J.; Schulz-Schaeffer, W.; Sixel-Doring, F.; Trenkwalder, C.; Schlossmacher, M.G. alpha-Synuclein and tau concentrations in cerebrospinal fluid of patients presenting with parkinsonism: a cohort study. Lancet Neurol 2011, 10, 230–240. [Google Scholar] [CrossRef] [PubMed]
- Park, M.J.; Cheon, S.M.; Bee, H.R.; Kim, S.H.; Kim, J.W. Elevated Levels of α-Synuclein Oligomer in the Cerebrospinal Fluid of Drug-Naive Patients with Parkinson's Disease. Journal of Clinical Neurology 2011, 7, 215–222. [Google Scholar] [CrossRef]
- Parnetti, L.; Chiasserini, D.; Bellomo, G.; Giannandrea, D.; De Carlo, C.; Qureshi, M.M.; Ardah, M.T.; Varghese, S.; Bonanni, L.; Borroni, B.; et al. Cerebrospinal fluid Tau/alpha-synuclein ratio in Parkinson's disease and degenerative dementias. Mov Disord 2011, 26, 1428–1435. [Google Scholar] [CrossRef]
- Shi, M.; Bradner, J.; Hancock, A.M.; Chung, K.A.; Quinn, J.F.; Peskind, E.R.; Galasko, D.; Jankovic, J.; Zabetian, C.P.; Kim, H.M.; et al. Cerebrospinal fluid biomarkers for Parkinson disease diagnosis and progression. Ann Neurol 2011, 69, 570–580. [Google Scholar] [CrossRef]
- Aerts, M.B.; Esselink, R.A.; Abdo, W.F.; Bloem, B.R.; Verbeek, M.M. CSF alpha-synuclein does not differentiate between parkinsonian disorders. Neurobiol Aging 2012, 33, 430–e431. [Google Scholar] [CrossRef]
- Tateno, F.; Sakakibara, R.; Kawai, T.; Kishi, M.; Murano, T. Alpha-synuclein in the cerebrospinal fluid differentiates synucleinopathies (Parkinson Disease, dementia with Lewy bodies, multiple system atrophy) from Alzheimer disease. Alzheimer Dis Assoc Disord 2012, 26, 213–216. [Google Scholar] [CrossRef]
- van Dijk, K.D.; Bidinosti, M.; Weiss, A.; Raijmakers, P.; Berendse, H.W.; van de Berg, W.D. Reduced alpha-synuclein levels in cerebrospinal fluid in Parkinson's disease are unrelated to clinical and imaging measures of disease severity. Eur J Neurol 2014, 21, 388–394. [Google Scholar] [CrossRef]
- Buddhala, C.; Campbell, M.C.; Perlmutter, J.S.; Kotzbauer, P.T. Correlation between decreased CSF α-synuclein and Aβ1-42 in Parkinson disease. Neurobiology of Aging 2015, 36, 476–484. [Google Scholar] [CrossRef] [PubMed]
- Compta, Y.; Valente, T.; Saura, J.; Segura, B.; Iranzo, A.; Serradell, M.; Junqué, C.; Tolosa, E.; Valldeoriola, F.; Muñoz, E.; et al. Correlates of cerebrospinal fluid levels of oligomeric- and total-α-synuclein in premotor, motor and dementia stages of Parkinson's disease. Journal of Neurology 2015, 262, 294–306. [Google Scholar] [CrossRef]
- Stav, A.L.; Aarsland, D.; Johansen, K.K.; Hessen, E.; Auning, E.; Fladby, T. Amyloid-β and α-synuclein cerebrospinal fluid biomarkers andcognition in early Parkinson's disease. Parkinsonism and Related Disorders 2015, 21, 758–764. [Google Scholar] [CrossRef] [PubMed]
- Hall, S.; Surova, Y.; Öhrfelt, A.; Blennow, K.; Zetterberg, H.; Hansson, O.; Study, S.B. Longitudinal Measurements of Cerebrospinal Fluid Biomarkers in Parkinson's Disease. Movement Disorders 2016, 31, 898–905. [Google Scholar] [CrossRef] [PubMed]
- Constantinides, V.C.; Paraskevas, G.P.; Emmanouilidou, E.; Petropoulou, O.; Bougea, A.; Vekrellis, K.; Evdokimidis, I.; Stamboulis, E.; Kapaki, E. CSF biomarkers beta-amyloid, tau proteins and a-synuclein in the differential diagnosis of Parkinson-plus syndromes. J Neurol Sci 2017, 382, 91–95. [Google Scholar] [CrossRef]
- Zhao, H.L.; Zhao, J.; Hou, J.P.; Wang, S.Q.; Ding, Y.; Lu, B.X.; Wang, J. AlphaLISA detection of alpha-synuclein in the cerebrospinal fluid and its potential application in Parkinson's disease diagnosis. Protein & Cell 2017, 8, 696–700. [Google Scholar] [CrossRef]
- Dos Santos, M.C.T.; Scheller, D.; Schulte, C.; Mesa, I.R.; Colman, P.; Bujac, S.R.; Bell, R.; Berteau, C.; Perez, L.T.; Lachmann, I.; et al. Evaluation of cerebrospinal fluid proteins as potential biomarkers for early stage Parkinson's disease diagnosis. PLoS One 2018, 13, e0206536. [Google Scholar] [CrossRef]
- Forland, M.G.; Öhrfelt, A.; Dalen, I.; Tysnes, O.B.; Blennow, K.; Zetterberg, H.; Pedersen, K.F.; Alves, G.; Lange, J. Evolution of cerebrospinal fluid total α-synuclein in Parkinson's disease. Parkinsonism & Related Disorders 2018, 49, 4–8. [Google Scholar] [CrossRef]
- Goldman, J.G.; Andrews, H.; Amara, A.; Naito, A.; Alcalay, R.N.; Shaw, L.M.; Taylor, P.; Xie, T.; Tuite, P.; Henchcliffe, C.; et al. Cerebrospinal fluid, plasma, and saliva in the BioFIND study: Relationships among biomarkers and Parkinson's disease Features. Mov Disord 2018, 33, 282–288. [Google Scholar] [CrossRef]
- Lerche, S.; Wurster, I.; Roeben, B.; Zimmermann, M.; Riebenbauer, B.; Deuschle, C.; Hauser, A.K.; Schulte, C.; Berg, D.; Maetzler, W.; et al. Parkinson's Disease: Glucocerebrosidase 1 Mutation Severity Is Associated with CSF Alpha-Synuclein Profiles. Mov Disord 2020, 35, 495–499. [Google Scholar] [CrossRef]
- Nabizadeh, F.; Pirahesh, K.; Ramezannezhad, E. Longitudinal striatal dopamine transporter binding and cerebrospinal fluid alpha-synuclein, amyloid beta, total tau, and phosphorylated tau in Parkinson's disease. Neurol Sci 2023, 44, 573–585. [Google Scholar] [CrossRef] [PubMed]
- Aasly, J.O.; Johansen, K.K.; Bronstad, G.; Waro, B.J.; Majbour, N.K.; Varghese, S.; Alzahmi, F.; Paleologou, K.E.; Amer, D.A.; Al-Hayani, A.; et al. Elevated levels of cerebrospinal fluid alpha-synuclein oligomers in healthy asymptomatic LRRK2 mutation carriers. Frontiers in aging neuroscience 2014, 6, 248. [Google Scholar] [CrossRef] [PubMed]
- Llorens, F.; Schmitz, M.; Varges, D.; Kruse, N.; Gotzmann, N.; Gmitterova, K.; Mollenhauer, B.; Zerr, I. Cerebrospinal alpha-synuclein in alpha-synuclein aggregation disorders: tau/alpha-synuclein ratio as potential biomarker for dementia with Lewy bodies. J Neurol 2016, 263, 2271–2277. [Google Scholar] [CrossRef] [PubMed]
- Wang, F.; Yu, S.Y.; Zuo, L.J.; Cao, C.J.; Hu, Y.; Chen, Z.J.; Piao, Y.S.; Wang, Y.J.; Wang, X.M.; Chen, S.D.; et al. Excessive Iron and alpha-Synuclein Oligomer in Brain are Relevant to Pure Apathy in Parkinson Disease. J Geriatr Psychiatry Neurol 2016, 29, 187–194. [Google Scholar] [CrossRef]
- Delgado-Alvarado, M.; Gago, B.; Gorostidi, A.; Jimenez-Urbieta, H.; Dacosta-Aguayo, R.; Navalpotro-Gomez, I.; Ruiz-Martinez, J.; Bergareche, A.; Marti-Masso, J.F.; Martinez-Lage, P.; et al. Tau/alpha-synuclein ratio and inflammatory proteins in Parkinson's disease: An exploratory study. Mov Disord 2017, 32, 1066–1073. [Google Scholar] [CrossRef] [PubMed]
- Bougea, A.; Stefanis, L.; Emmanouilidou, E.; Vekrelis, K.; Kapaki, E. High discriminatory ability of peripheral and CFSF biomarkers in Lewy body diseases. J Neural Transm (Vienna) 2020, 127, 311–322. [Google Scholar] [CrossRef]
- Chahine, L.M.; Beach, T.G.; Brumm, M.C.; Adler, C.H.; Coffey, C.S.; Mosovsky, S.; Caspell-Garcia, C.; Serrano, G.E.; Munoz, D.G.; White, C.L., 3rd; et al. In vivo distribution of alpha-synuclein in multiple tissues and biofluids in Parkinson disease. Neurology 2020, 95, e1267–e1284. [Google Scholar] [CrossRef]
- Wang, Y.; Shi, M.; Chung, K.A.; Zabetian, C.P.; Leverenz, J.B.; Berg, D.; Srulijes, K.; Trojanowski, J.Q.; Lee, V.M.; Siderowf, A.D.; et al. Phosphorylated alpha-synuclein in Parkinson's disease. Sci Transl Med 2012, 4, 121ra120. [Google Scholar] [CrossRef]
- Yang, L.; Stewart, T.; Shi, M.; Pottiez, G.; Dator, R.; Wu, R.; Aro, P.; Schuster, R.J.; Ginghina, C.; Pan, C.; et al. An alpha-synuclein MRM assay with diagnostic potential for Parkinson's disease and monitoring disease progression. Proteom Clin Appl 2017, 11, ARTN 1700045. [Google Scholar] [CrossRef]
- Hall, S.; Janelidze, S.; Surova, Y.; Widner, H.; Zetterberg, H.; Hansson, O. Cerebrospinal fluid concentrations of inflammatory markers in Parkinson's disease and atypical parkinsonian disorders. Sci Rep 2018, 8, 13276. [Google Scholar] [CrossRef]
- Mollenhauer, B.; Zimmermann, J.; Sixel-Doring, F.; Focke, N.K.; Wicke, T.; Ebentheuer, J.; Schaumburg, M.; Lang, E.; Friede, T.; Trenkwalder, C.; et al. Baseline predictors for progression 4 years after Parkinson's disease diagnosis in the De Novo Parkinson Cohort (DeNoPa). Mov Disord 2019, 34, 67–77. [Google Scholar] [CrossRef] [PubMed]
- Canaslan, S.; Schmitz, M.; Villar-Pique, A.; Maass, F.; Gmitterova, K.; Varges, D.; Lingor, P.; Llorens, F.; Hermann, P.; Zerr, I. Detection of Cerebrospinal Fluid Neurofilament Light Chain as a Marker for Alpha-Synucleinopathies. Front Aging Neurosci 2021, 13, 717930. [Google Scholar] [CrossRef] [PubMed]
- Hoglinger, G.U.; Respondek, G.; Stamelou, M.; Kurz, C.; Josephs, K.A.; Lang, A.E.; Mollenhauer, B.; Muller, U.; Nilsson, C.; Whitwell, J.L.; et al. Clinical diagnosis of progressive supranuclear palsy: The movement disorder society criteria. Mov Disord 2017, 32, 853–864. [Google Scholar] [CrossRef]
- Wenning, G.K.; Stankovic, I.; Vignatelli, L.; Fanciulli, A.; Calandra-Buonaura, G.; Seppi, K.; Palma, J.A.; Meissner, W.G.; Krismer, F.; Berg, D.; et al. The Movement Disorder Society Criteria for the Diagnosis of Multiple System Atrophy. Mov Disord 2022. [Google Scholar] [CrossRef] [PubMed]
- Hughes, A.J.; Daniel, S.E.; Ben-Shlomo, Y.; Lees, A.J. The accuracy of diagnosis of parkinsonian syndromes in a specialist movement disorder service. Brain 2002, 125, 861–870. [Google Scholar] [CrossRef]
- Hughes, A.J.; Daniel, S.E.; Kilford, L.; Lees, A.J. Accuracy of clinical diagnosis of idiopathic Parkinson's disease: a clinico-pathological study of 100 cases. J Neurol Neurosurg Psychiatry 1992, 55, 181–184. [Google Scholar] [CrossRef]
- Shin, J.H.; Lee, J.Y.; Kim, Y.K.; Shin, S.A.; Kim, H.; Nam, H.; Jeon, B. Longitudinal change in dopamine transporter availability in idiopathic REM sleep behavior disorder. Neurology 2020, 95, e3081–e3092. [Google Scholar] [CrossRef]
- Polymeropoulos, M.H.; Lavedan, C.; Leroy, E.; Ide, S.E.; Dehejia, A.; Dutra, A.; Pike, B.; Root, H.; Rubenstein, J.; Boyer, R.; et al. Mutation in the alpha-synuclein gene identified in families with Parkinson's disease. Science 1997, 276, 2045–2047. [Google Scholar] [CrossRef]
- Constantinides, V.C.; Majbour, N.K.; Paraskevas, G.P.; Abdi, I.; Safieh-Garabedian, B.; Stefanis, L.; El-Agnaf, O.M.; Kapaki, E. Cerebrospinal Fluid a-synuclein species in cognitive and movement disorders. Brain Sci 2021, 11. [Google Scholar] [CrossRef]
- Anagnostou, D.; Sfakianaki, G.; Melachroinou, K.; Soutos, M.; Constantinides, V.; Vaikath, N.; Tsantzali, I.; Paraskevas, G.P.; Agnaf, O.E.; Vekrellis, K.; et al. Assessment of Aggregated and Exosome-Associated alpha-Synuclein in Brain Tissue and Cerebrospinal Fluid Using Specific Immunoassays. Diagnostics (Basel) 2023, 13. [Google Scholar] [CrossRef]
- Li, X.Y.; Yang, W.; Li, X.; Li, X.R.; Li, W.; Song, Q.; Sun, L.; Lin, F.; Chen, Z.; Wang, C.; et al. Phosphorylated Alpha-Synuclein in Red Blood Cells as a Potential Diagnostic Biomarker for Multiple System Atrophy: A Pilot Study. Parkinsons Dis 2020, 2020, 8740419. [Google Scholar] [CrossRef] [PubMed]
- del Campo, M.; Mollenhauer, B.; Bertolotto, A.; Engelborghs, S.; Hampel, H.; Simonsen, A.H.; Kapaki, E.; Kruse, N.; Le Bastard, N.; Lehmann, S.; et al. Recommendations to standardize preanalytical confounding factors in Alzheimer's and Parkinson's disease cerebrospinal fluid biomarkers: an update. Biomark Med 2012, 6, 419–430. [Google Scholar] [CrossRef] [PubMed]
- Paraskevas, G.P.; Bougea, A.; Constantinides, V.C.; Bourbouli, M.; Petropoulou, O.; Kapaki, E. In vivo Prevalence of Alzheimer Biomarkers in Dementia with Lewy Bodies. Dement Geriatr Cogn Disord 2019, 47, 289–296. [Google Scholar] [CrossRef] [PubMed]
- Constantinides, V.C.; Boufidou, F.; Bourbouli, M.; Pyrgelis, E.S.; Ghika, A.; Koros, C.; Liakakis, G.; Papageorgiou, S.; Stefanis, L.; Paraskevas, G.P.; et al. Application of the AT(N) and Other CSF Classification Systems in Behavioral Variant Frontotemporal Dementia. Diagnostics (Basel) 2023, 13. [Google Scholar] [CrossRef]
- Bellomo, G.; De Luca, C.M.G.; Paoletti, F.P.; Gaetani, L.; Moda, F.; Parnetti, L. alpha-Synuclein Seed Amplification Assays for Diagnosing Synucleinopathies: The Way Forward. Neurology 2022, 99, 195–205. [Google Scholar] [CrossRef] [PubMed]
- Yoo, D.; Bang, J.I.; Ahn, C.; Nyaga, V.N.; Kim, Y.E.; Kang, M.J.; Ahn, T.B. Diagnostic value of alpha-synuclein seeding amplification assays in alpha-synucleinopathies: A systematic review and meta-analysis. Parkinsonism Relat Disord 2022, 104, 99–109. [Google Scholar] [CrossRef] [PubMed]
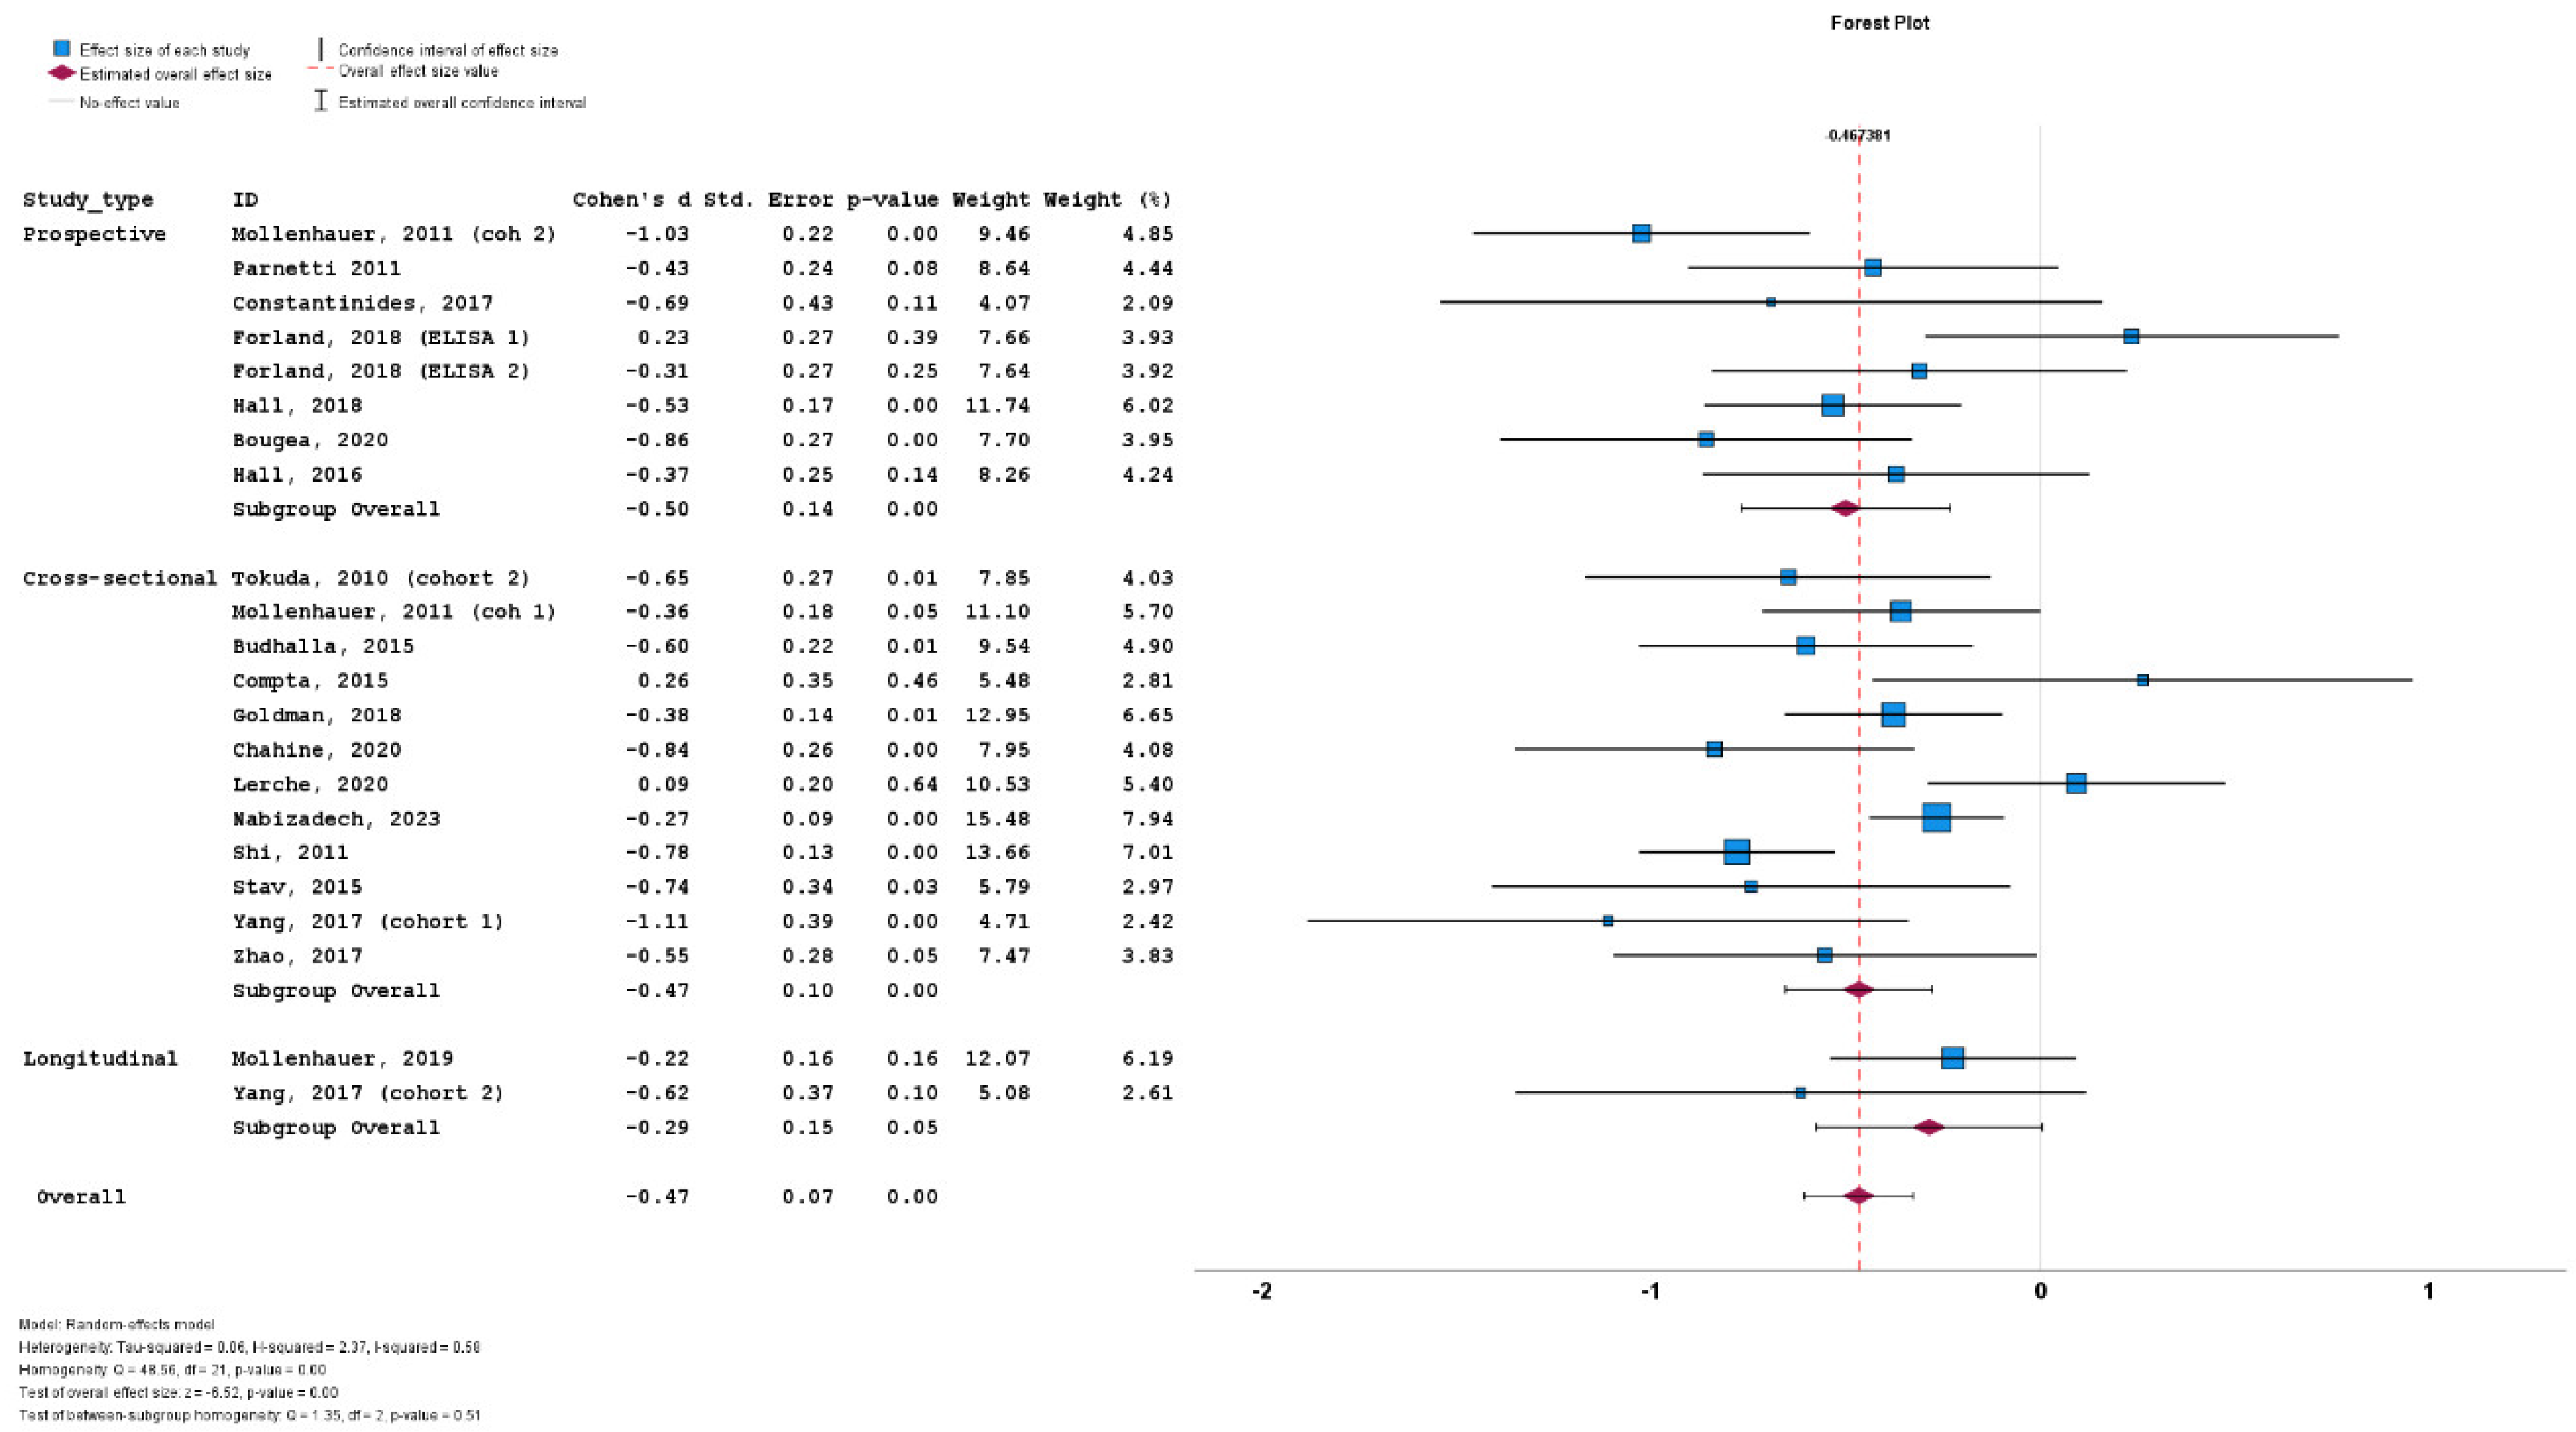
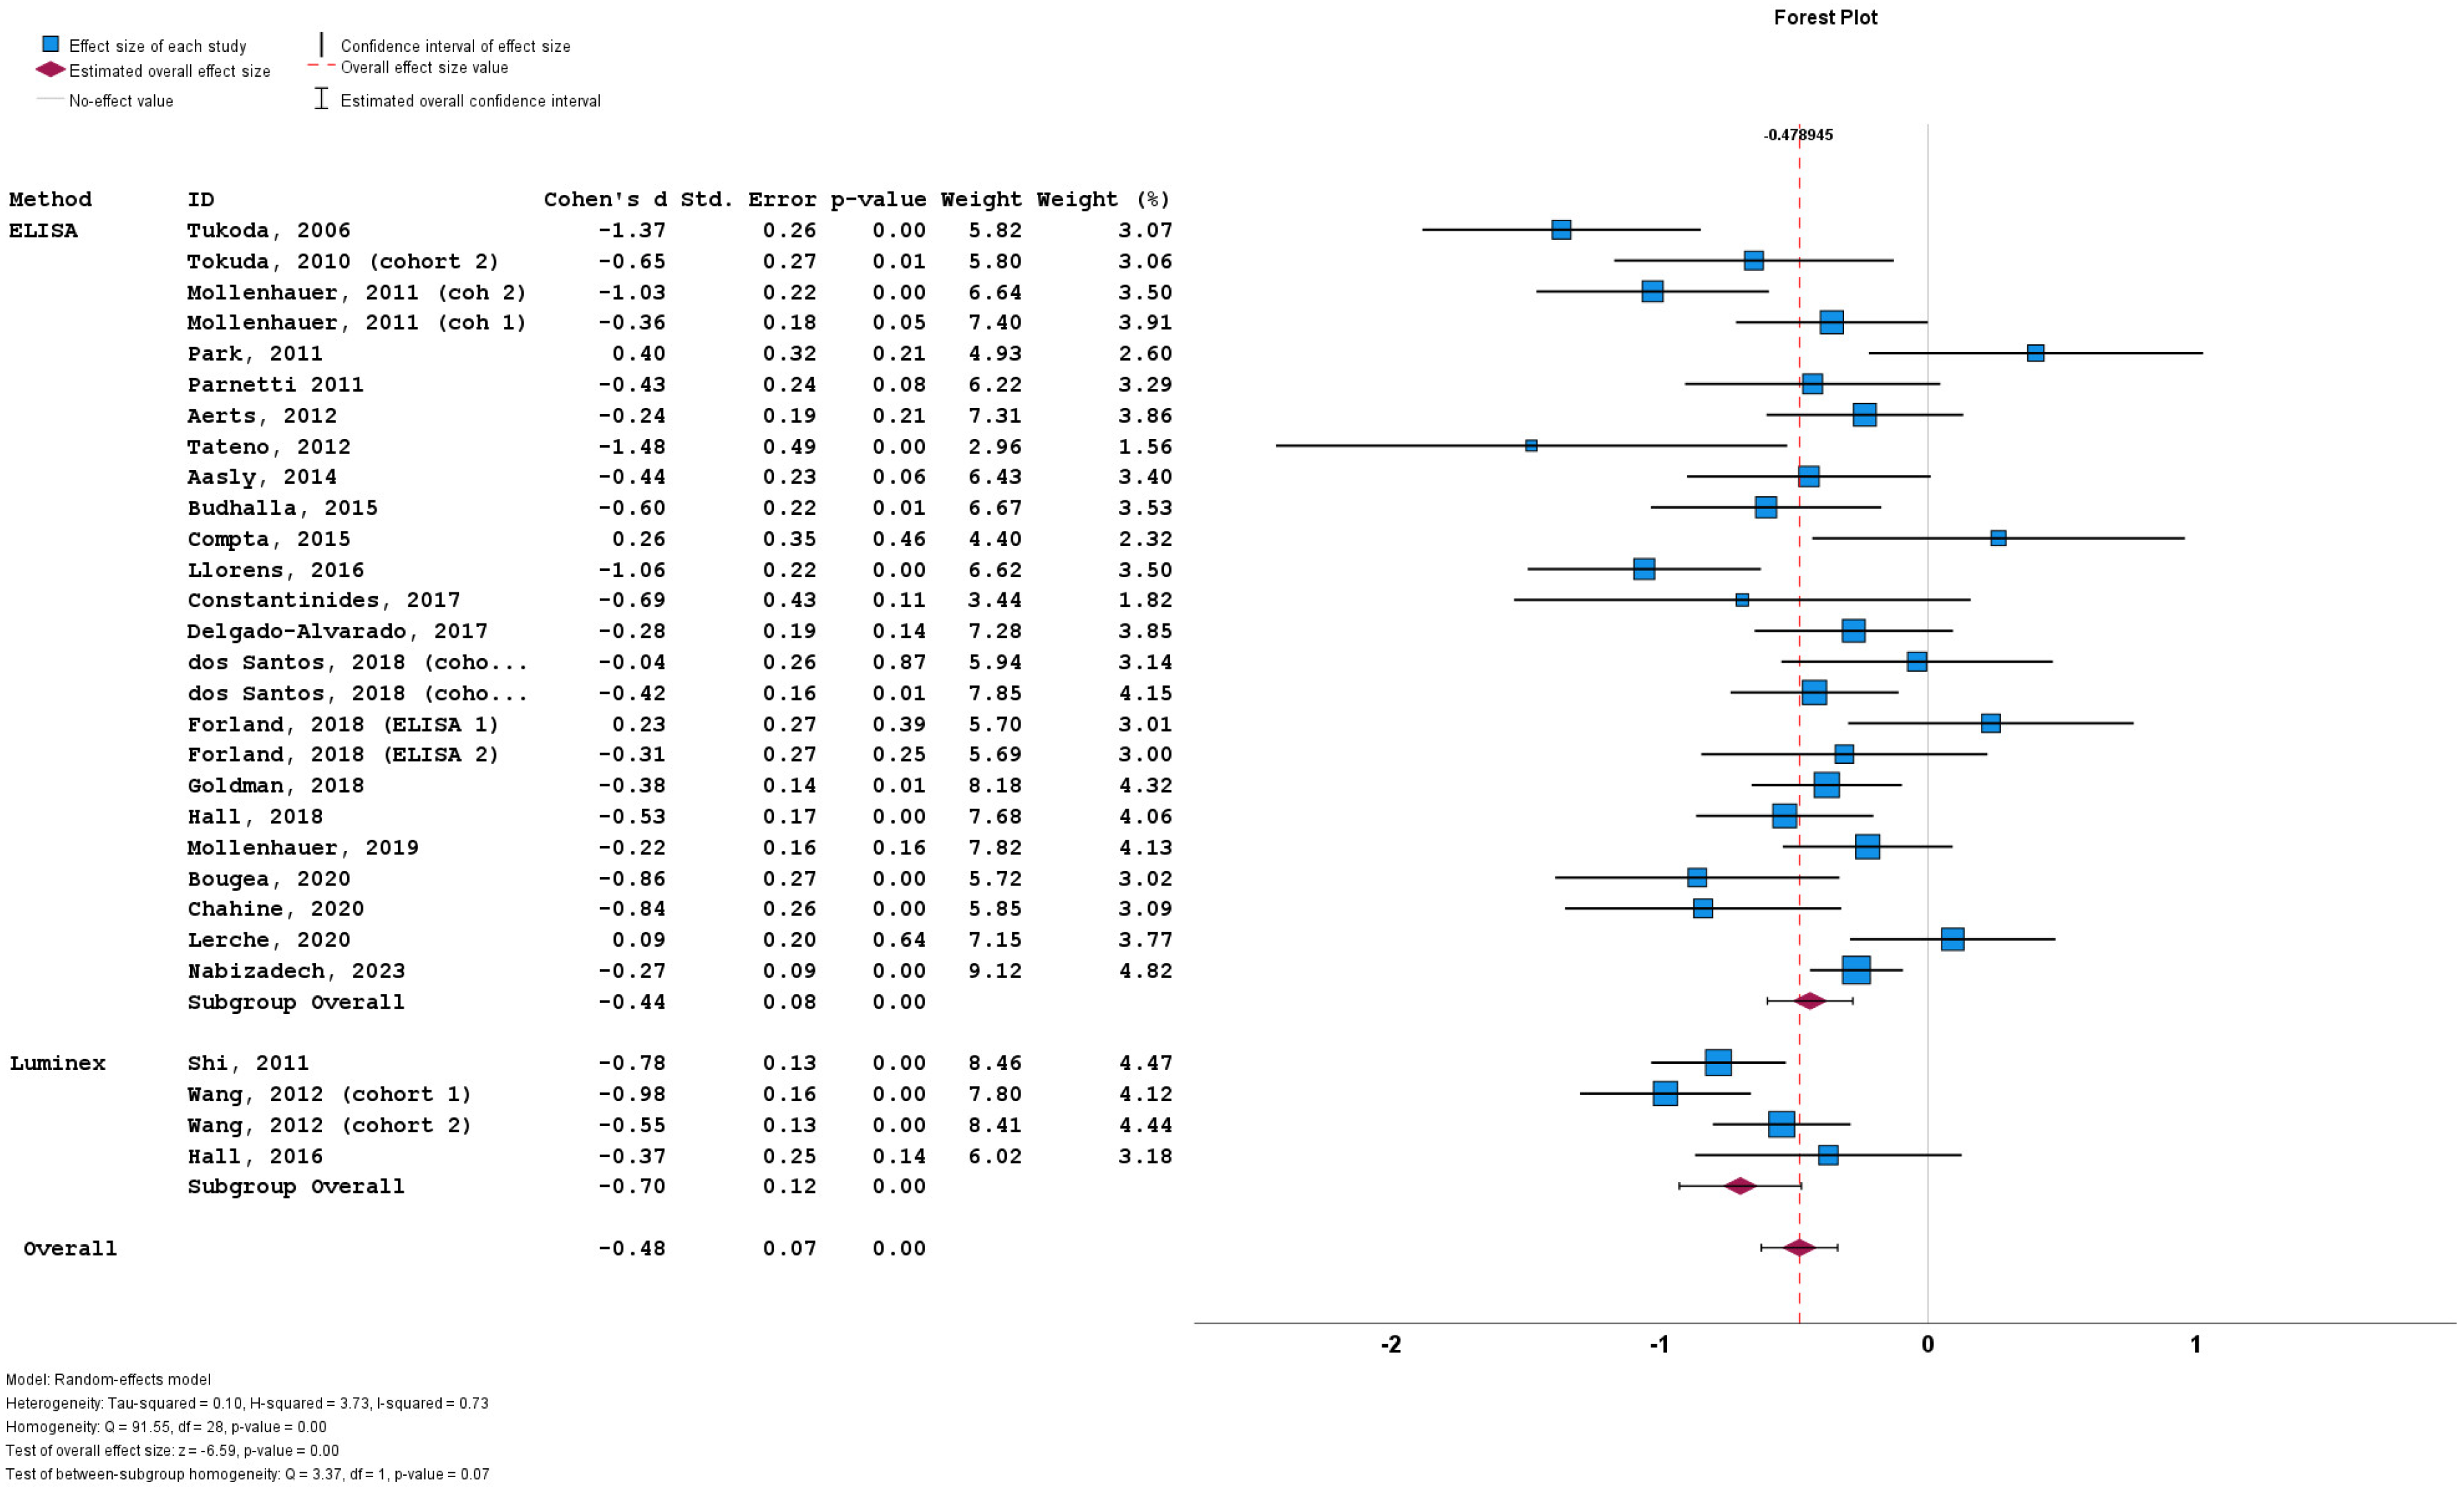
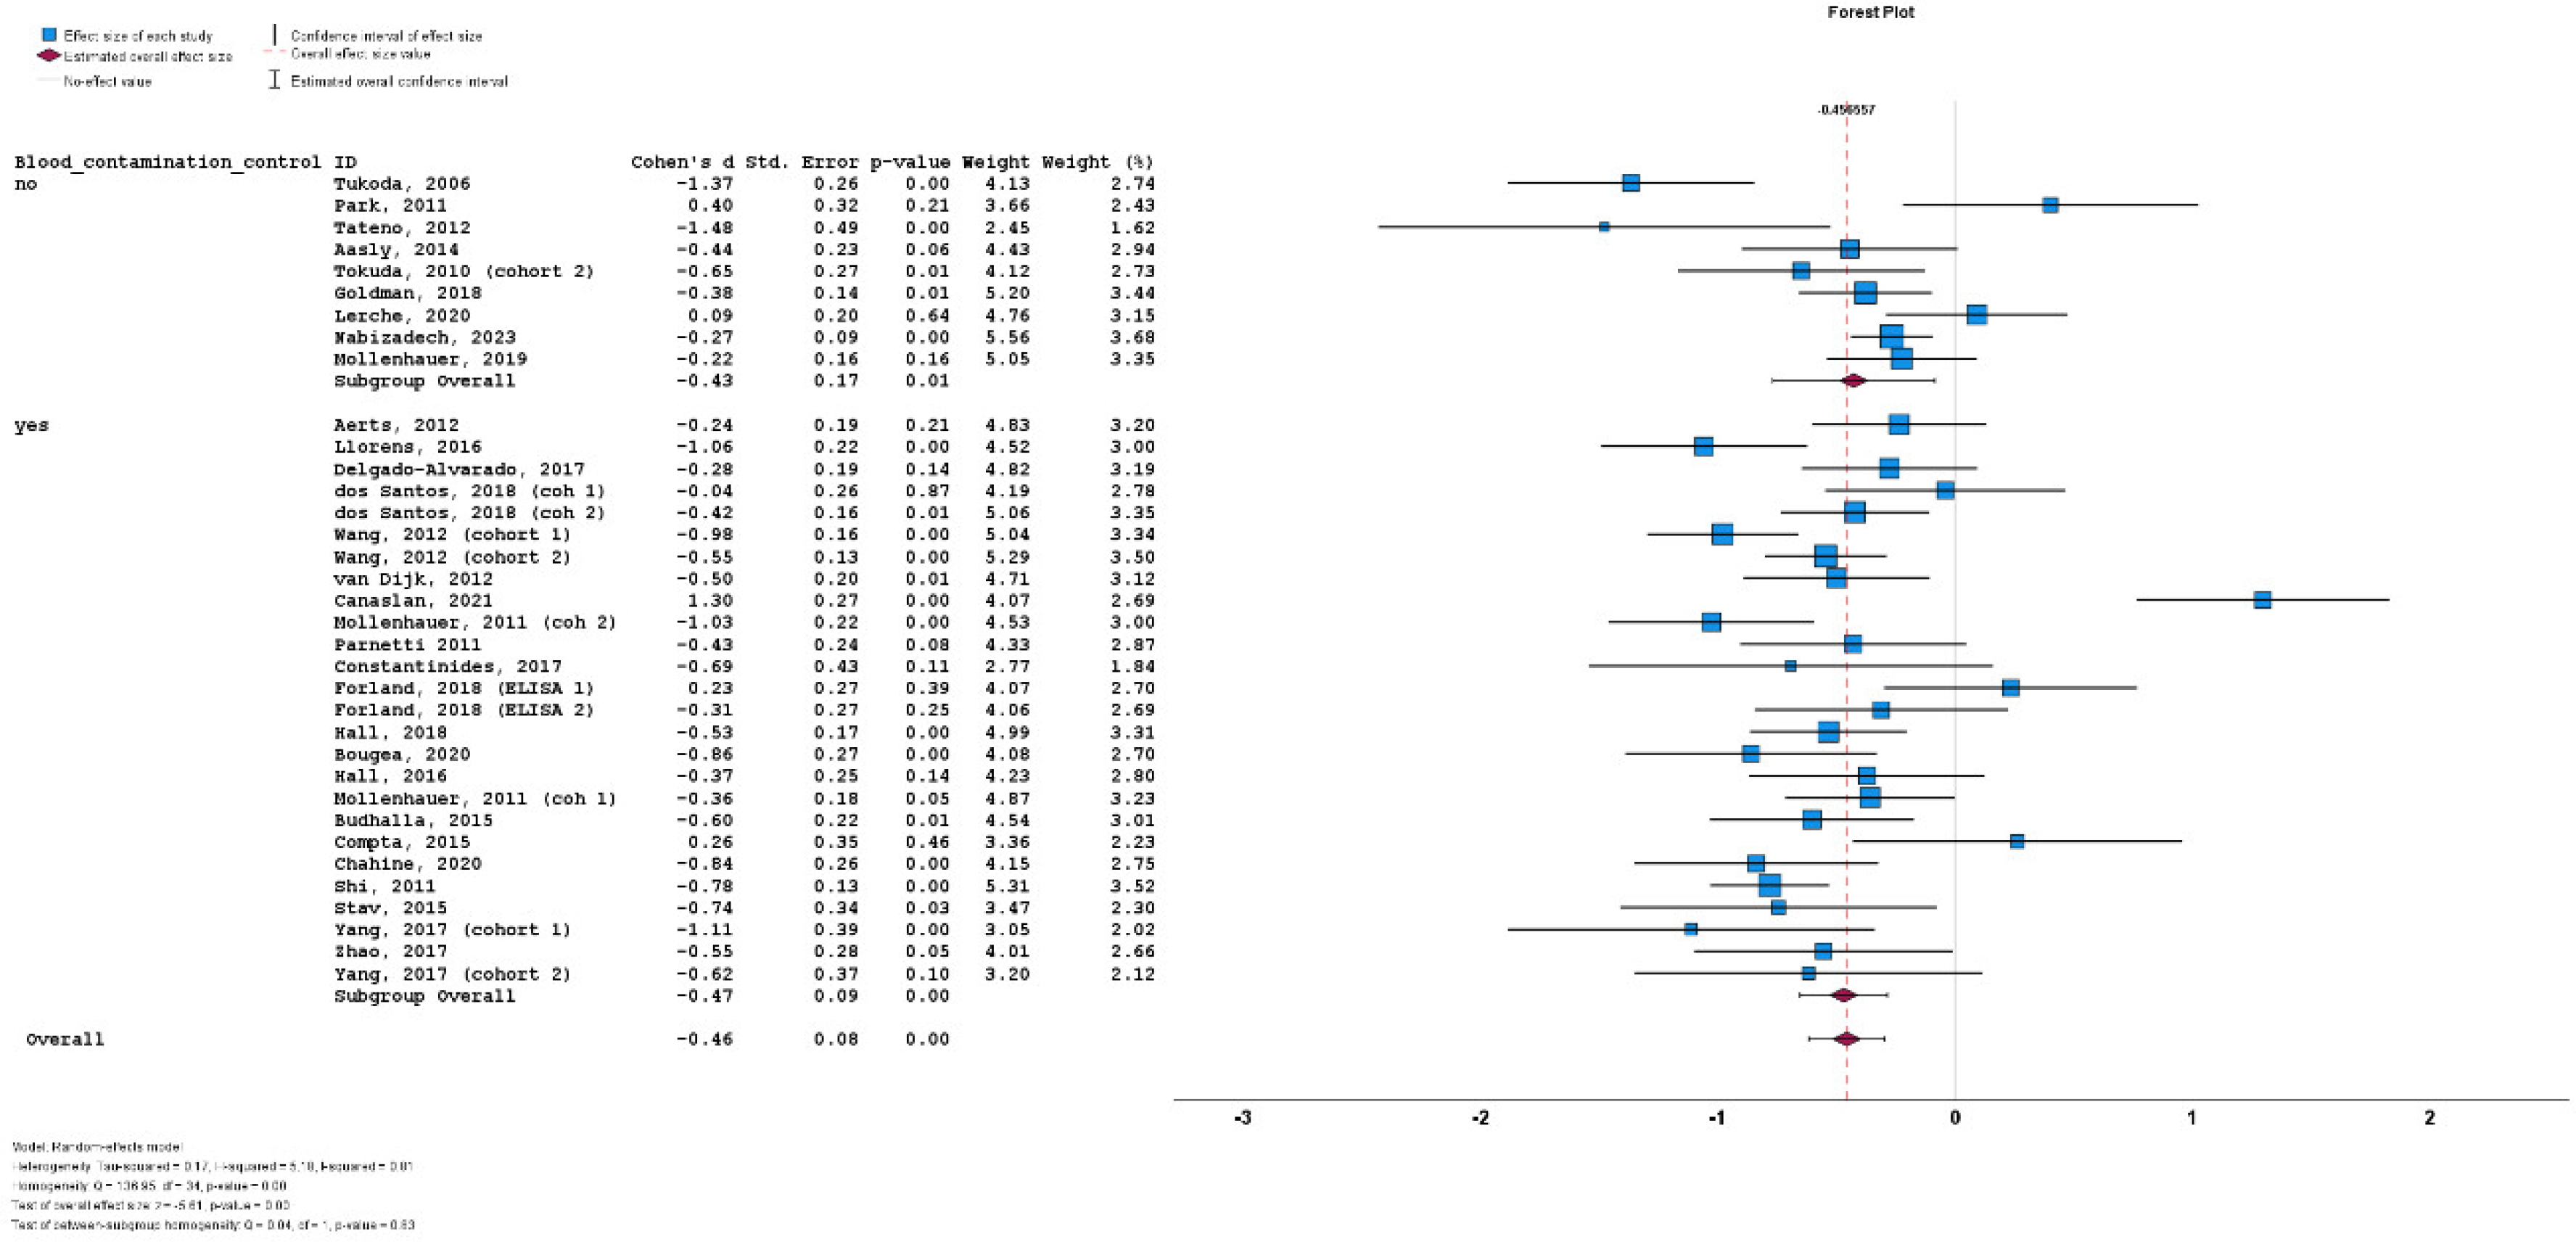
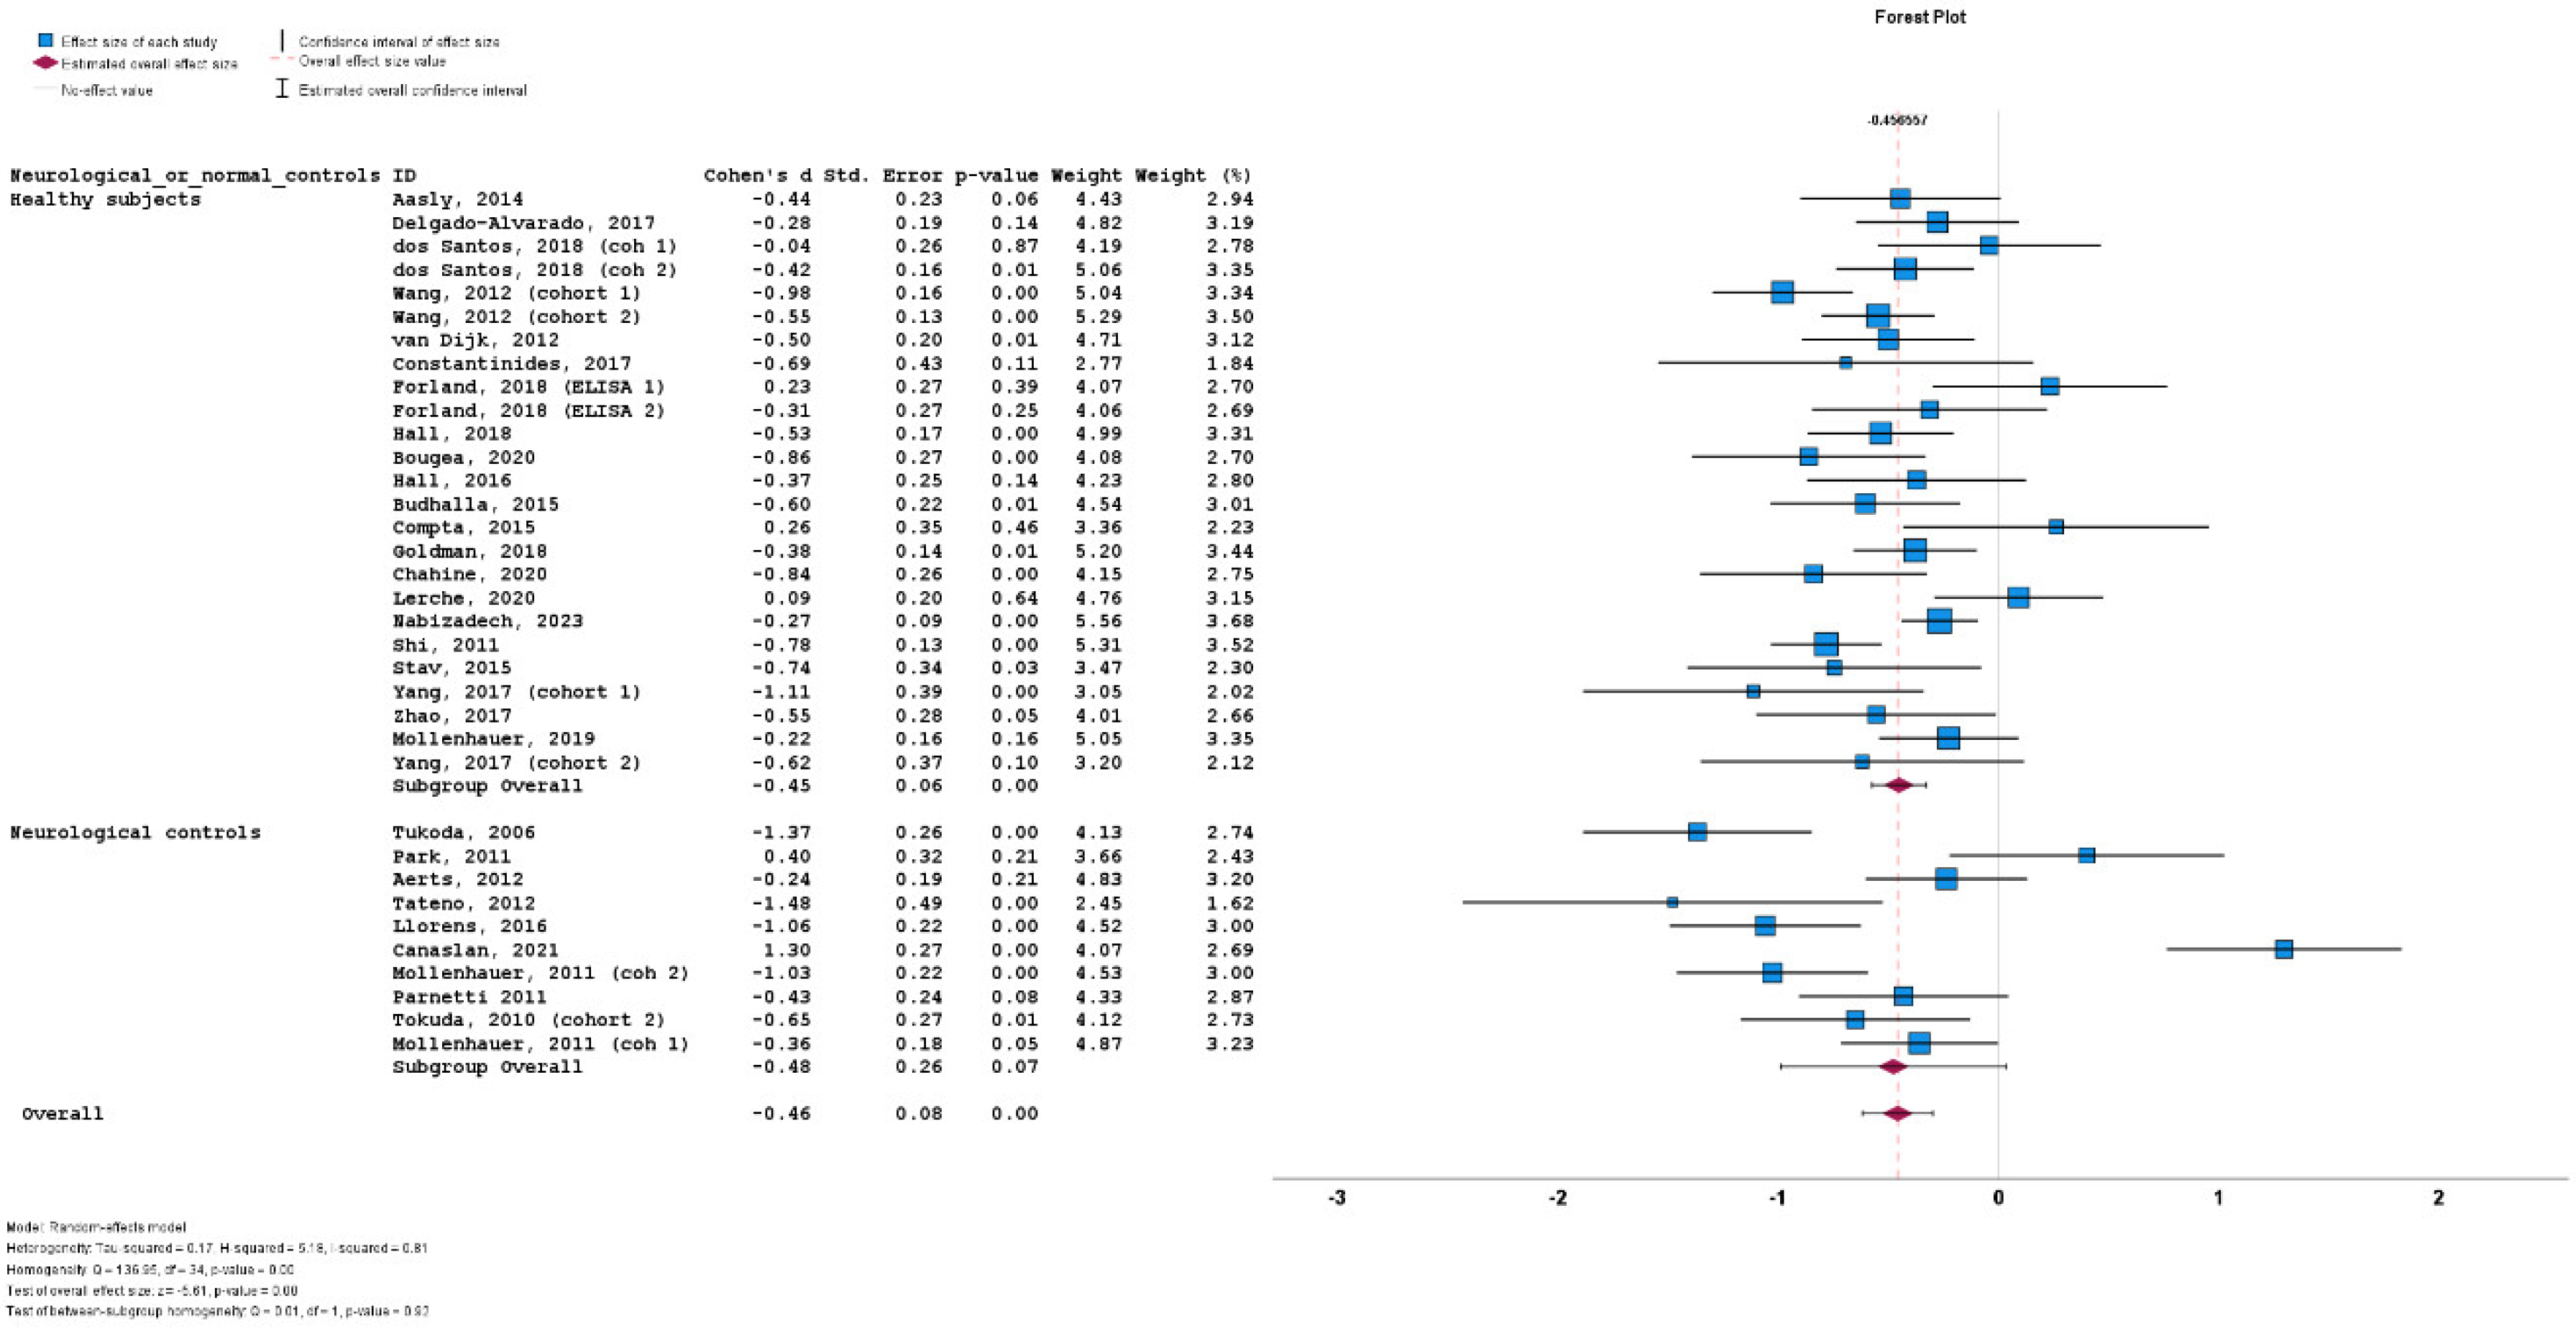
| Study Num | Study | Study design | Period recruit. | Study origin | Method a-syn |
CSF blood contam. | Available data | Main findings |
|---|---|---|---|---|---|---|---|---|
| 1 | Tukoda, 2006 [12] | U | Japan | ELISA | no | total | t-a-syn PD < ctrl (AUC:0.815) | |
| 2 | Tokuda, 2010 [13] | C | Japan | ELISA | no | total, oligomeric | o-a-syn PD > ctlrs (sens: 75%; spec: 87.5%) o-a-syn/t-a-syn PD > ctrls (sens: 89.3%; spec: 90.6%) |
|
| 3 | Mollenhauer, 2011 [14] | C & P 2 cohorts |
2003-2006 | Two centers (Germany; USA) |
ELISA | yes | total | t-a-syn PD < ctrl (sens:70.7%; spec: 52.8%) |
| 4 | Park, 2011 [15] | U | Korea | ELISA | no | total, oligomeric | o-a-syn PD > controls | |
| 5 | Parnetti, 2011 [16] | P | 2005-2009 | Italy | ELISA | yes | total | t-a-syn PD < controls (sens: 94%; spec: 25%) |
| 6 | Shi, 2011 [17] | C | Multicenter | Luminex | yes | total | t-a-syn PD < ctrls (sens: 92%; spec: 38%) |
|
| 7 | Aerts, 2012 [18] | U | 2003-2006 | Netherlands | ELISA | yes | total | t-a-syn PD ≈ ctrls |
| 8 | Tateno, 2012 [19] | U | Japan | ELISA | no | total | t-a-syn PD ≈ ctrls | |
| 9 | Wang, 2012 [38] | U | Multicenter | Luminex | yes | total, phosphorylated | t-a-syn PD < ctrls (sens: 82%; spec: 63%) ph-a-syn > ctrls (sens: 86%; spec: 30%) |
|
| 10 | Aasly, 2014 [32] | U | Norway | ELISA | no | total, oligomeric | o-a-syn > controls (sens: 65%; spec: 83%) |
|
| 11 | van Dijk, 2014 [20] | U | 2008-2011 | Norway | TR-FRET immunoassay | yes | total | t-a-syn PD < ctrls (sens: 56%; spec: 74%) |
| 12 | Budhalla, 2015 [21] | C | 2011-2014 | USA | ELISA | yes | total | t-a-syn PD < ctrls |
| 13 | Compta, 2015 [22] | C | Spain | ELISA | yes | total, oligomeric | t-a-syn PD ≈ ctrls | |
| 14 | Stav, 2015 [23] | C | 2011-2014 | Norway | electrochemiluminescence | yes | total | t-a-syn PD < ctrls |
| 15 | Hall, 2016 [24] | P | Sweden | ELISA | yes | total | No data | |
| 16 | Llorens, 2016 [33] | U | Germany | ELISA | yes | total | t-a-syn PD < ctrls (sens: 67%; spec: 98%) |
|
| 17 | Wang, 2016 [34] | R | 2013-2014 | China | ELISA | no | oligomeric | o-a-syn PD > ctrls |
| 18 | Constantinides, 2017 [25] | P | Greece | ELISA | yes | total | t-a-syn PD ≈ ctrls | |
| 19 | Delgado-Alvarado, 2017 [35] | U | Spain | ELISA | yes | total | t-a-syn PD < ctrls AUC: 0.685 |
|
| 20 | Yang, 2017 [39] | C & L 2 cohorts |
Multicenter | Luminex | yes | total | No data | |
| 21 | Zhao, 2017 [26] | C | China | AlphaLISA | yes | total, oligomeric | t-a-syn PD ≈ ctrls o-a-syn PD ≈ ctrls |
|
| 22 | dos Santos, 2018 [27] | U | Germany | ELISA | yes | total | t-a-syn PD < ctrls (cohort 1), t-a-syn PD ≈ ctrls (cohort 2) |
|
| 23 | Forland, 2018 [28] | P | Norway | ELISA | yes | total | t-a-syn PD ≈ ctrls | |
| 24 | Goldman, 2018 [29] | C | Multicenter | ELISA | no | total | t-a-syn PD < ctrls | |
| 25 | Hall, 2018 [40] | P | Sweden | ELISA | yes | total | t-a-syn PD ≈ ctrls | |
| 26 | Mollenhauer, 2019 [41] | L | 2009-2012 | Germany | ELISA | no | total | t-a-syn PD ≈ ctrls |
| 27 | Bougea, 2020 [36] | P | 2013-2016 | Greece | ELISA | yes | total | t-a-syn PD < ctrls (sens: 78%; spec: 57%) |
| 28 | Chahine, 2020 [37] | C | 2015-2017 | Multicenter | ELISA | yes | total | t-a-syn PD < ctrls (sens: 87%; spec: 63.2%) |
| 29 | Lerche, 2020 [30] | C | 2005-2008 | Germany | ELISA | no | total | t-a-syn PD ≈ ctrls |
| 30 | Canaslan, 2021 [42] | U | Multicentre | SIMOA | yes | total | t-a-syn PD ≈ ctrls | |
| 31 | Nabizadeh, 2023 [31] | C | Multicentre | ELISA | no | total | t-a-syn PD < ctrls |
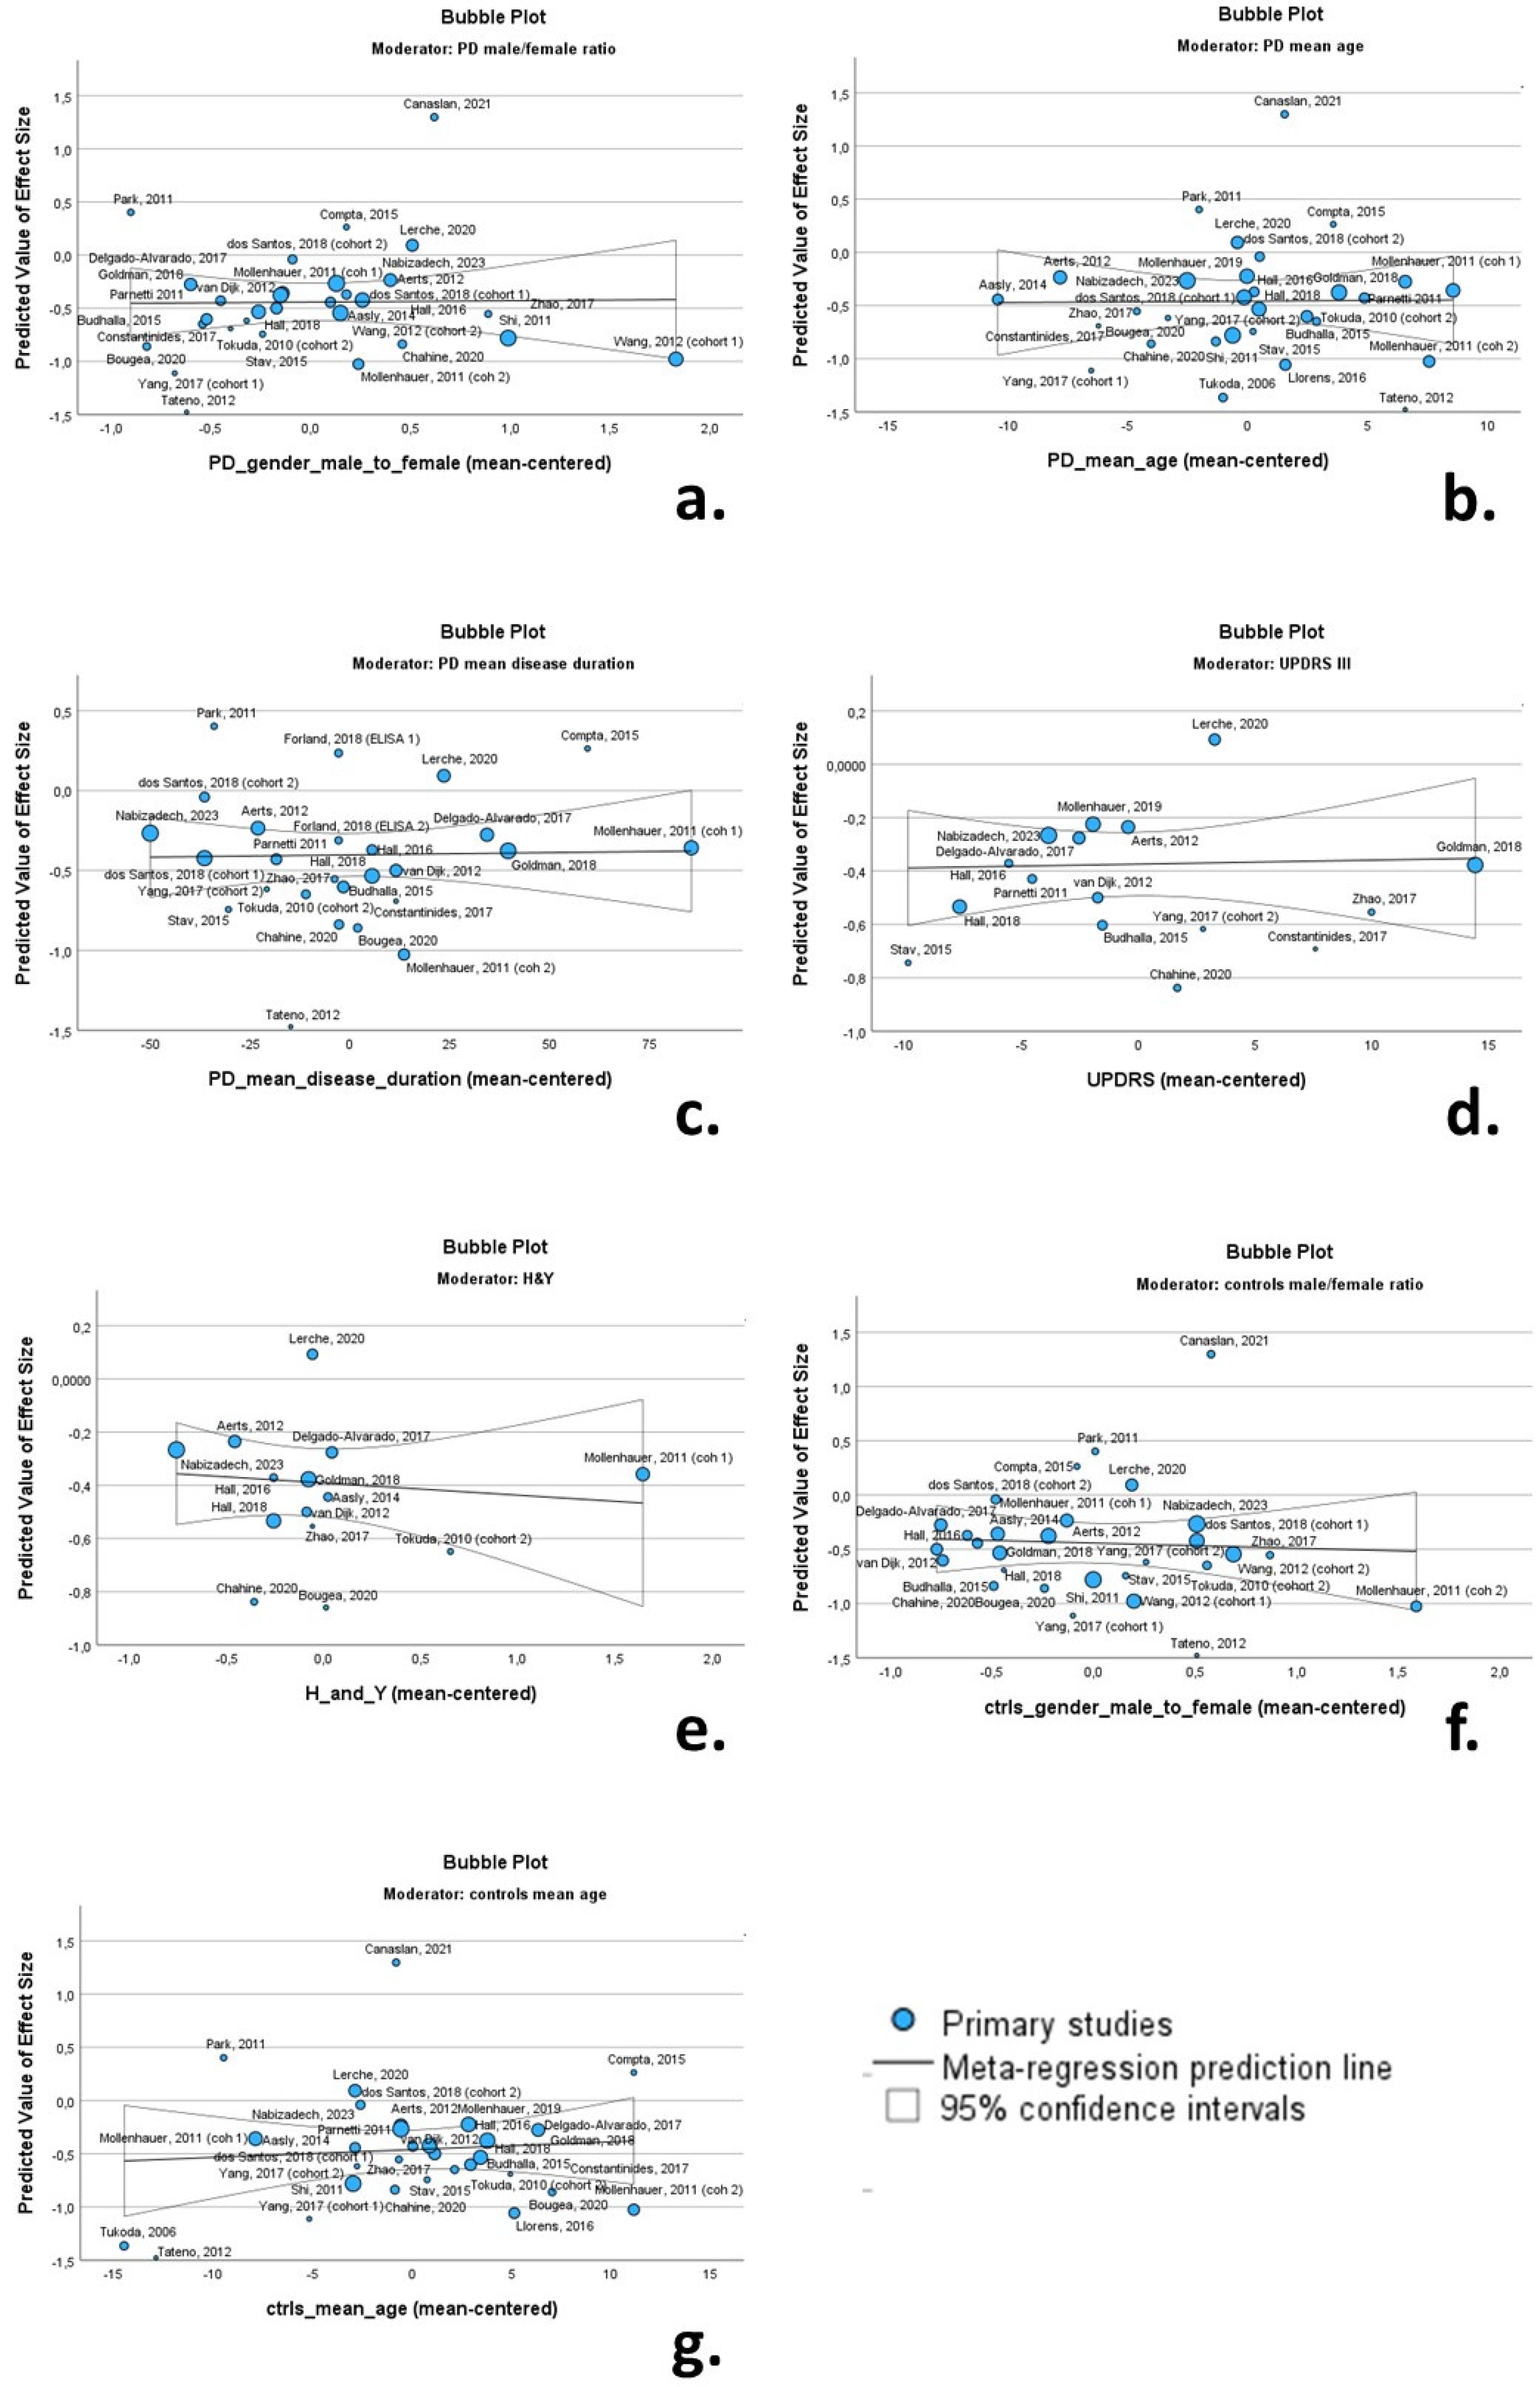
| n | β | SE | p value | 95% confidence interval | Q | I2 | ||
| Lower bound | Upper bound | |||||||
| PD characteristics | ||||||||
| male/female ratio | 30 | 0.013 | 0.145 | 0.931 | -0.285 | 0.310 | 105.4 | 80.0 |
| mean age | 30 | 0.001 | 0.021 | 0.951 | -0.042 | 0.045 | 118.9 | 82.2 |
| mean disease duration | 26 | 0.000 | 0.002 | 0.892 | -0.004 | 0.004 | 50.2 | 52.6 |
| UPDRS III | 16 | 0.001 | 0.009 | 0.867 | -0.017 | 0.020 | 16.8 | 18.8 |
| H&Y | 14 | -0.046 | 0.098 | 0.647 | -0.259 | 0.167 | 16.6 | 22.6 |
| Control group characteristics | ||||||||
| male/female ratio | 29 | -0.048 | 0.158 | 0.762 | -0.371 | 0.275 | 109.1 | 80.8 |
| mean age | 31 | 0.007 | 0.016 | 0.656 | -0.026 | 0.041 | 119.4 | 81.6 |
Disclaimer/Publisher’s Note: The statements, opinions and data contained in all publications are solely those of the individual author(s) and contributor(s) and not of MDPI and/or the editor(s). MDPI and/or the editor(s) disclaim responsibility for any injury to people or property resulting from any ideas, methods, instructions or products referred to in the content. |
© 2024 by the authors. Licensee MDPI, Basel, Switzerland. This article is an open access article distributed under the terms and conditions of the Creative Commons Attribution (CC BY) license (http://creativecommons.org/licenses/by/4.0/).


