1. Introduction
In the past few years, there has been a notable rise in the advancement of commercial aerospace, resulting in an increasing emphasis on micro-nano synthetic aperture radar (SAR) satellite constellations among prominent aerospace powers. Currently, numerous large-scale micro-nano SAR satellite constellations have been deployed worldwide [
1,
2,
3,
4]. These constellations, characterized by high temporal and spatial resolution capabilities, are poised to revolutionize the future of microwave remote sensing applications. Micro-nano satellite SAR satellite constellations offer several advantages, including low cost, rapid development cycles, quick response times, near real-time observation capabilities, and promising potential for civil and commercial applications.
There are two common micro-nano SAR satellite technology systems: phased array antenna system and reflector antenna system [
5,
6,
7]. Spaceborne SAR with reflector antenna system offers the advantages of a large antenna area, high resolution, light weight, and low cost. However, it also presents challenges such as inflexible beam scanning, as seen in systems like Capella constellation [
8,
9,
10,
11] and Umbra constellation [
12,
13,
14] in the United States. Phased array spaceborne SAR, on the other hand, boasts flexible beam scanning and high antenna efficiency, albeit at a relatively higher cost. Examples of typical systems include the ICEYE constellation in Finland [
15,
16,
17].
The current large phased array SAR systems exhibit high performance, boasting resolutions better than 0.5 meters and offering a variety of operational modes. However, their weight typically exceeds 1 ton, necessitating the use of large launch vehicles such as the German TerraSAR-X satellite [
18,
19,
20] and the Italian CSG satellite constellation [
21,
22,
23]. In the past few years, there has been significant progress in the advancement of micro-nano phased array SAR satellites, which have a weight of under 100kg. Despite this progress, these satellites face limitations in terms of their range of incidence angles, which usually do not exceed 35°, and their system sensitivity is only -15dB. This falls short of meeting the application requirements, with the ICEYE constellation being a typical example.
Taijing-4(03) is a high-resolution flat-panel SAR imaging satellite developed based on the MN200S platform by Beijing Minospace technology company. It is also the world’s first Ku-band phased array radar imaging satellite. The SAR payload of the satellite features a highly integrated design, weighing less than 80kg, with a peak transmission power exceeding 4000W, achieving a resolution better than 1m, and a system sensitivity of -18dB. The satellite was successfully launched on January 23, 2024 as part of a mission involving five satellites. Following deployment in orbit, the satellite captured a series of high-quality SAR images that have been instrumental in diverse applications such as emergency disaster relief, ecological conservation, sea ice monitoring, and target recognition.
Section 2 contains the work modes and system design of the Ku-band SAR for Taijing-4(03).
Section 3 describes the antenna model of SAR payload, followed by the SAR on-orbit performance and application in
Section 4. Conclusion is given in
Section 5.
2. Sar Payload Design
2.1. Overview
A Ku-band SAR payload has been designed based on the resolution and swath requirements. The key parameters of the SAR payload are outlined in
Table 1.
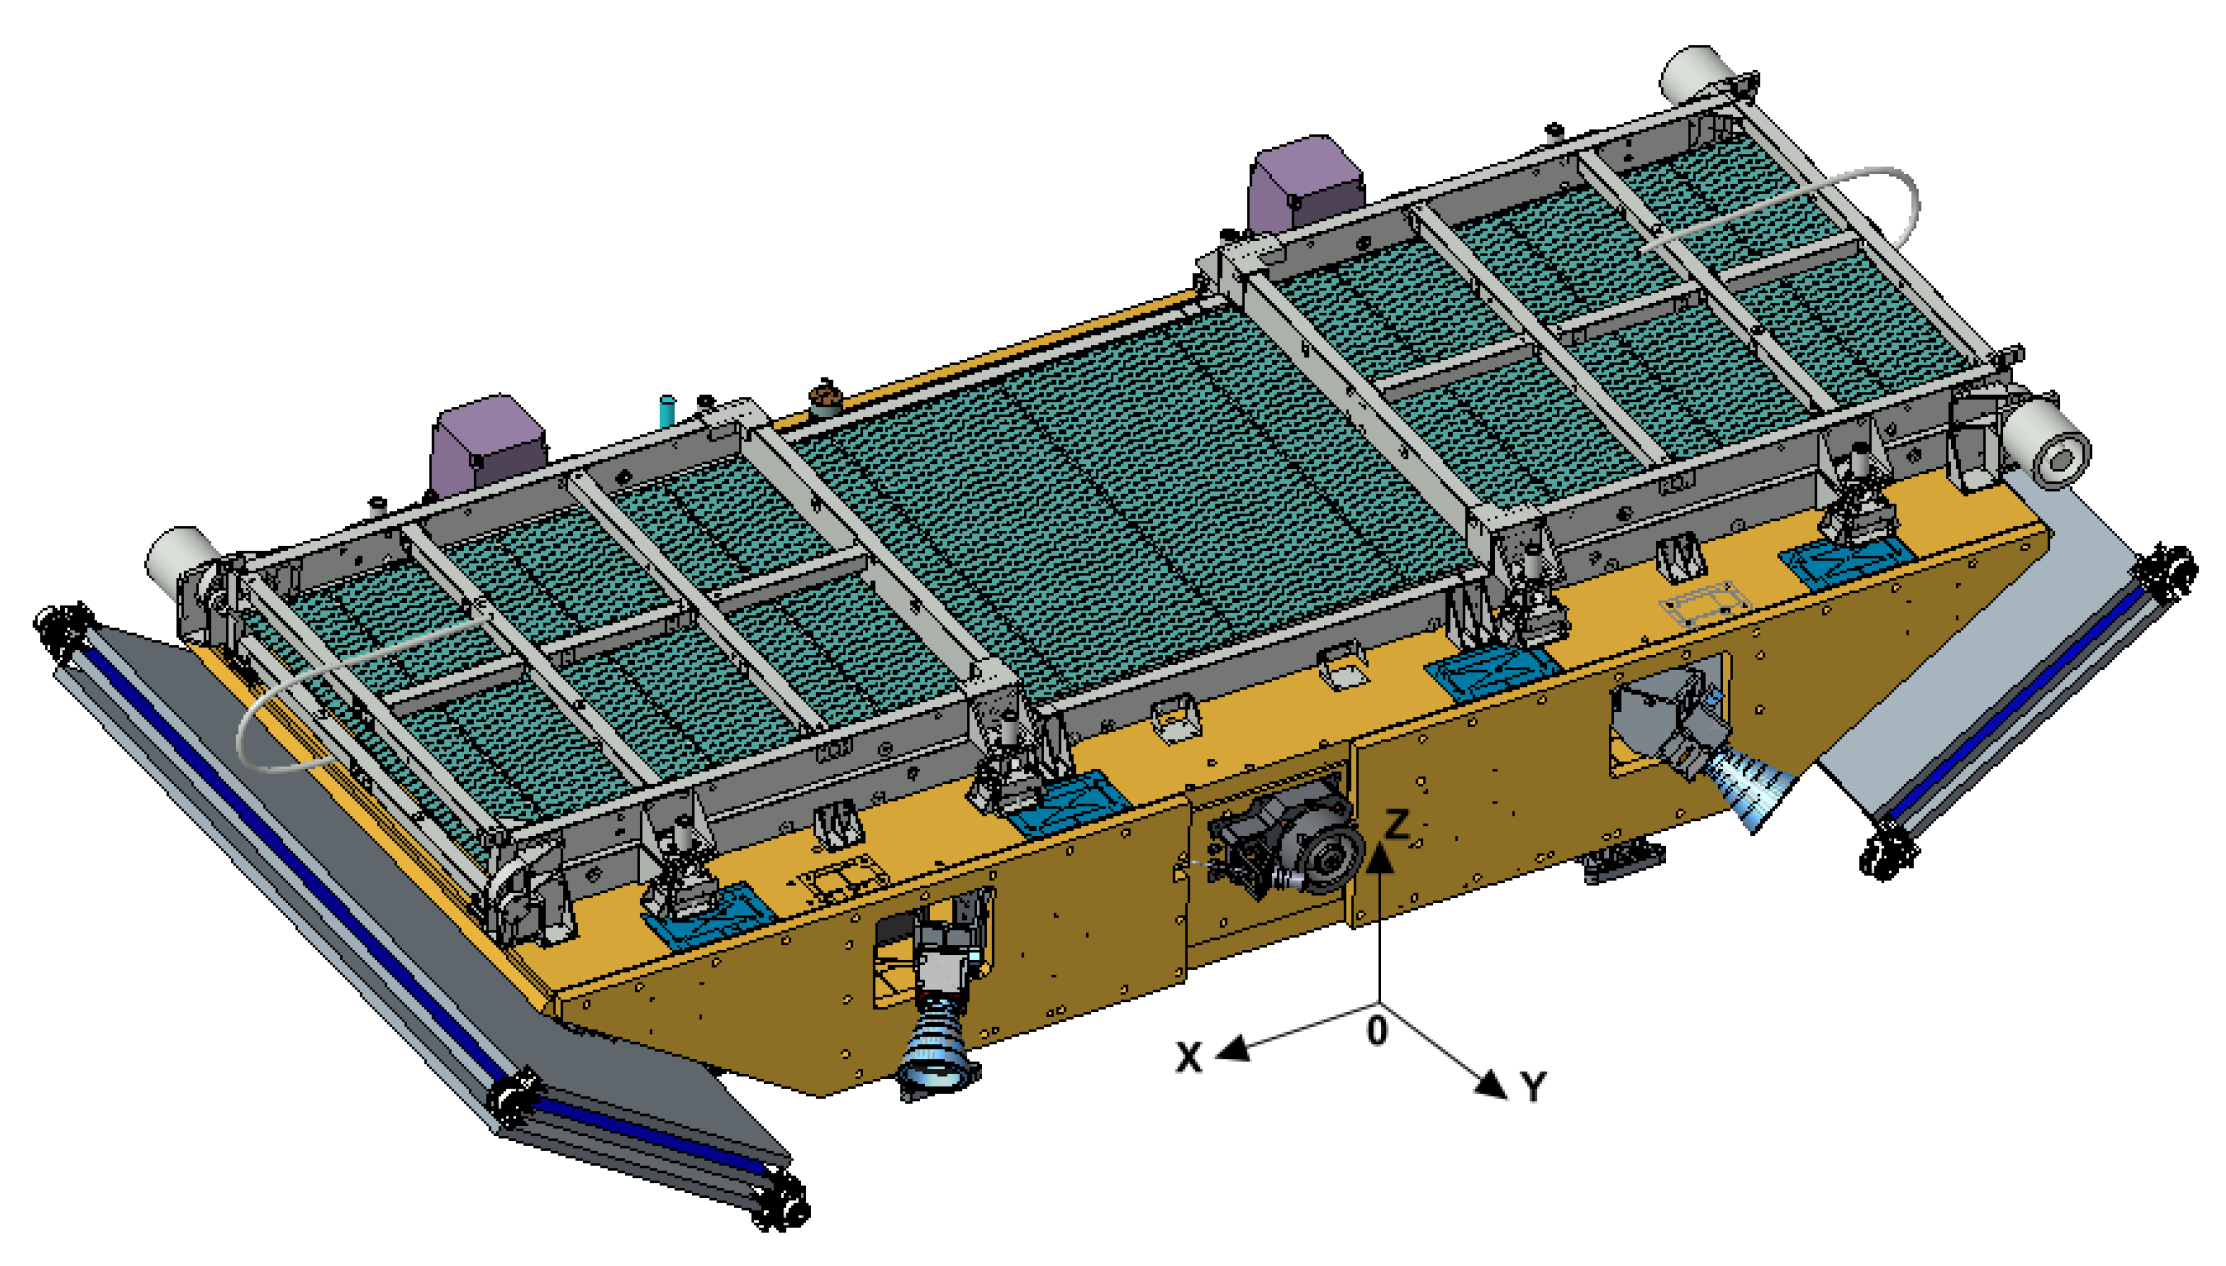
The Ku-band SAR antenna is divided into five panels, each panel is 0.72 m × 0.6 m in size. The central three panels are installed on the satellite body. In order to realize the plate-shaped design of the whole satellite, the left and right panels of the antenna are folded above the central panel respectively, as shown in
Figure 1.
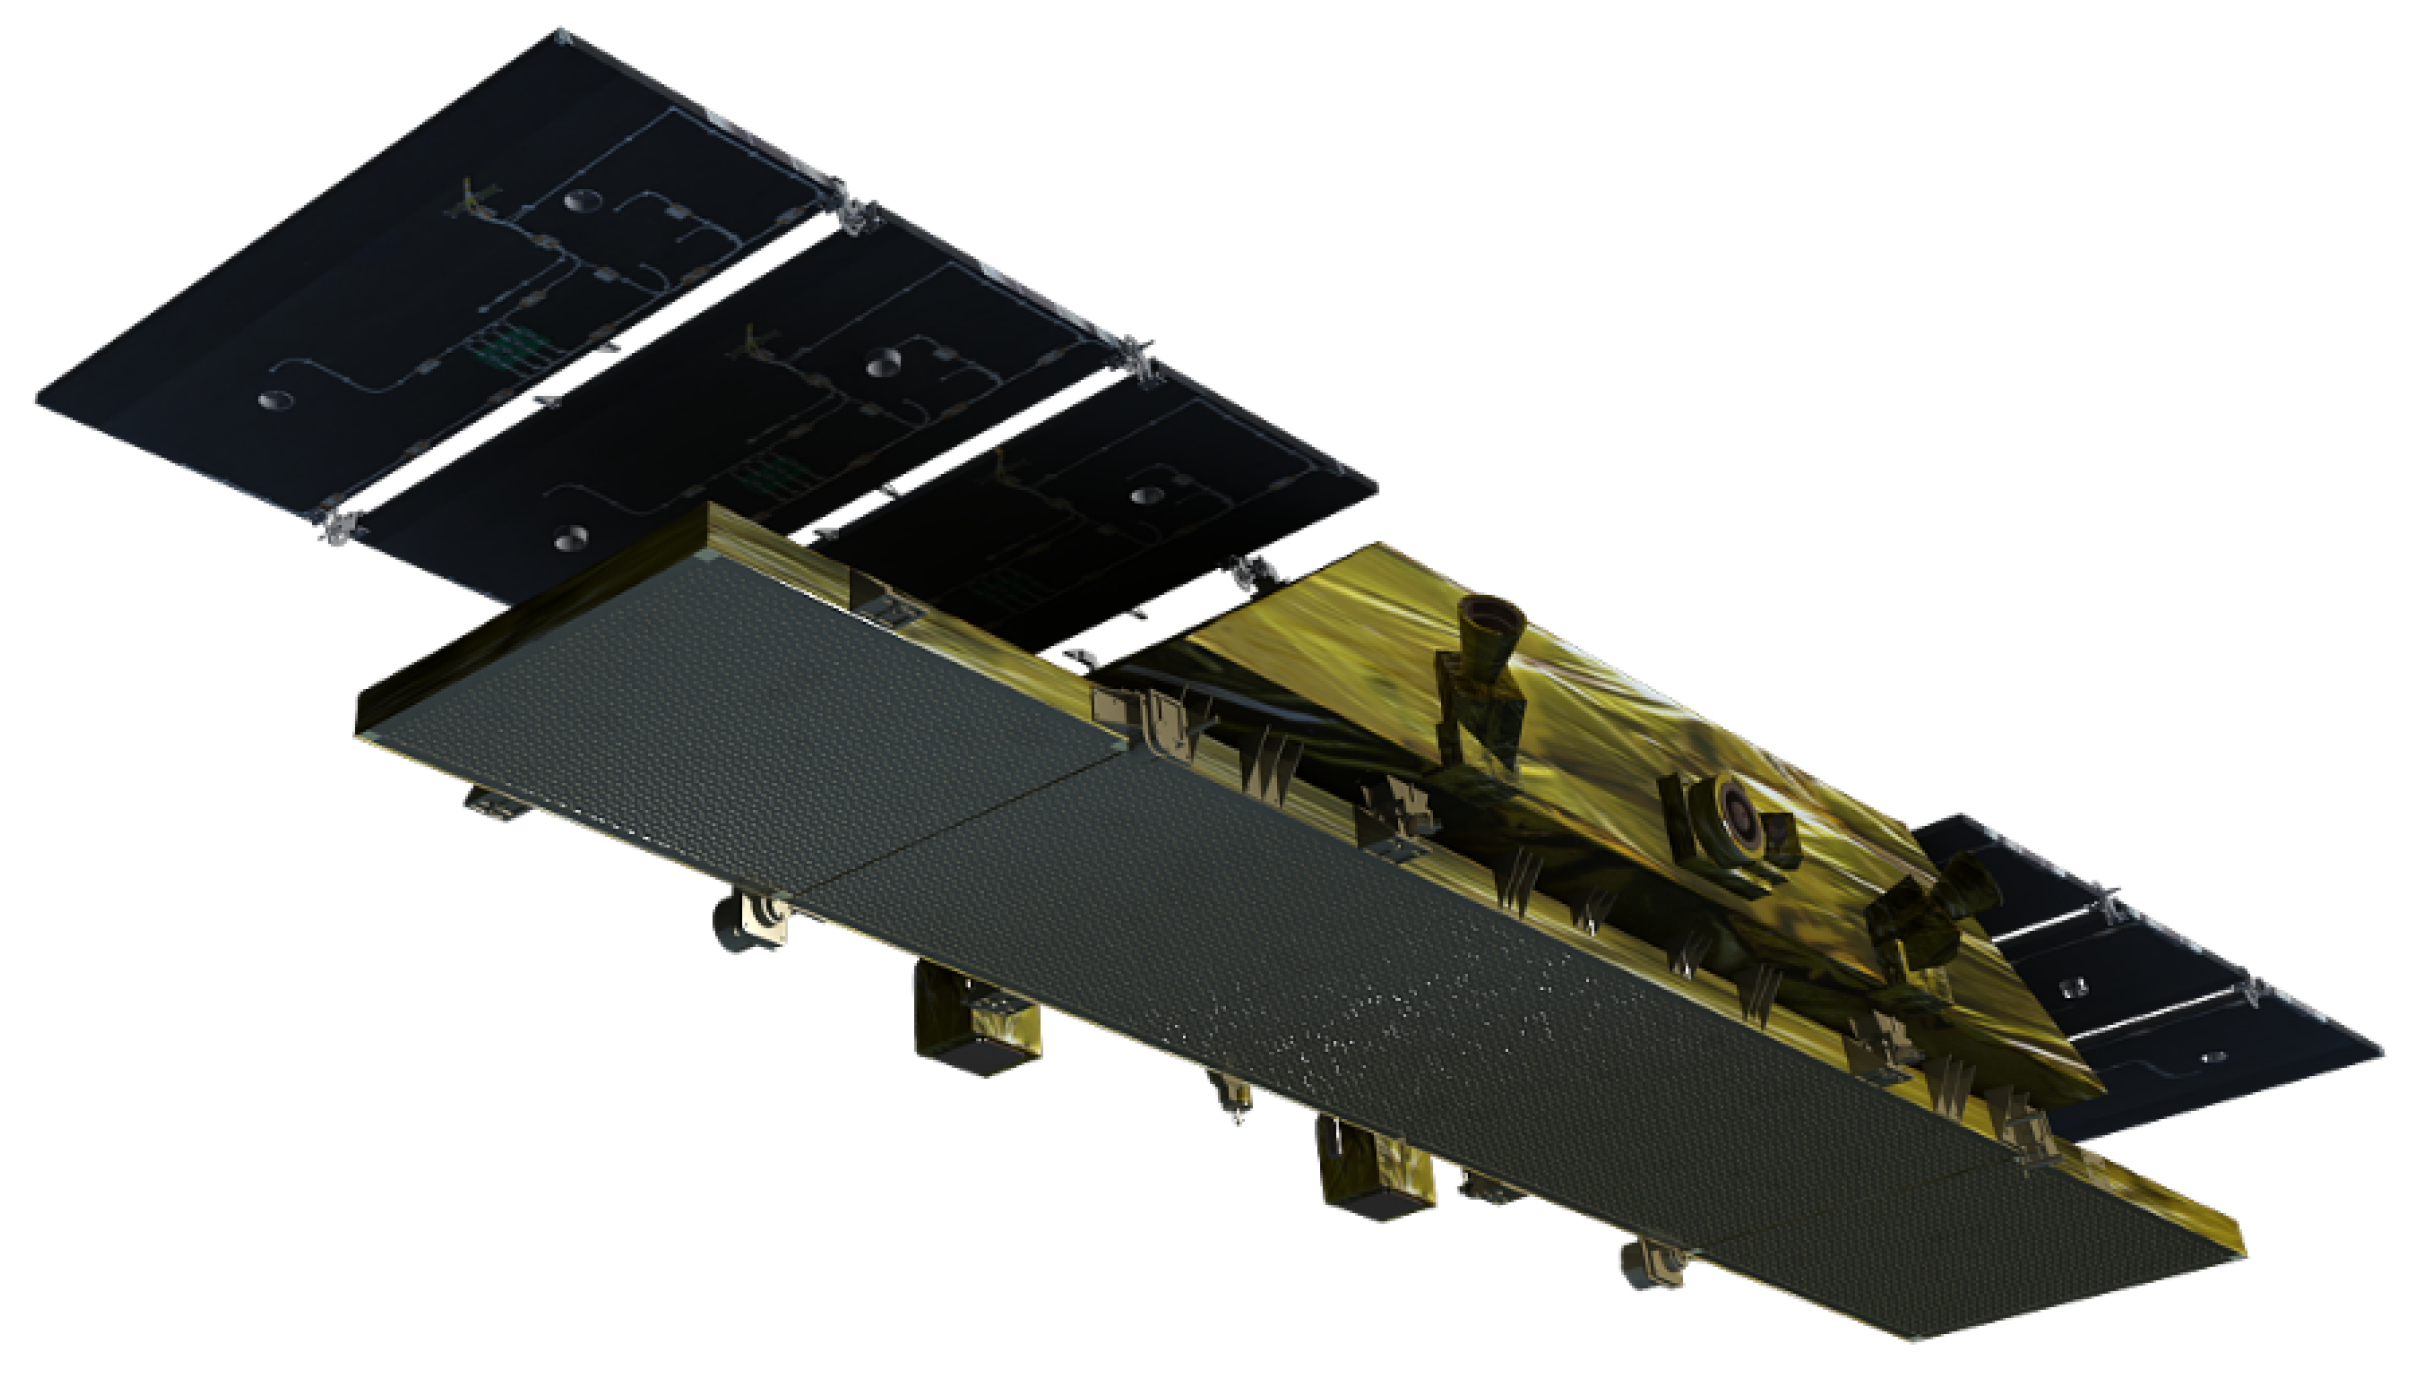
The panels on both sides of the antenna are deployed after being in orbit, and the satellite configuration after deployment is shown in
Figure 2. Considering that the antenna works in a 10:30 Am orbit at the descending node time, the external heat flow of the space environment changes violently, so the antenna adopts intelligent temperature control measures to ensure the stability of the antenna’s on-orbit temperature.
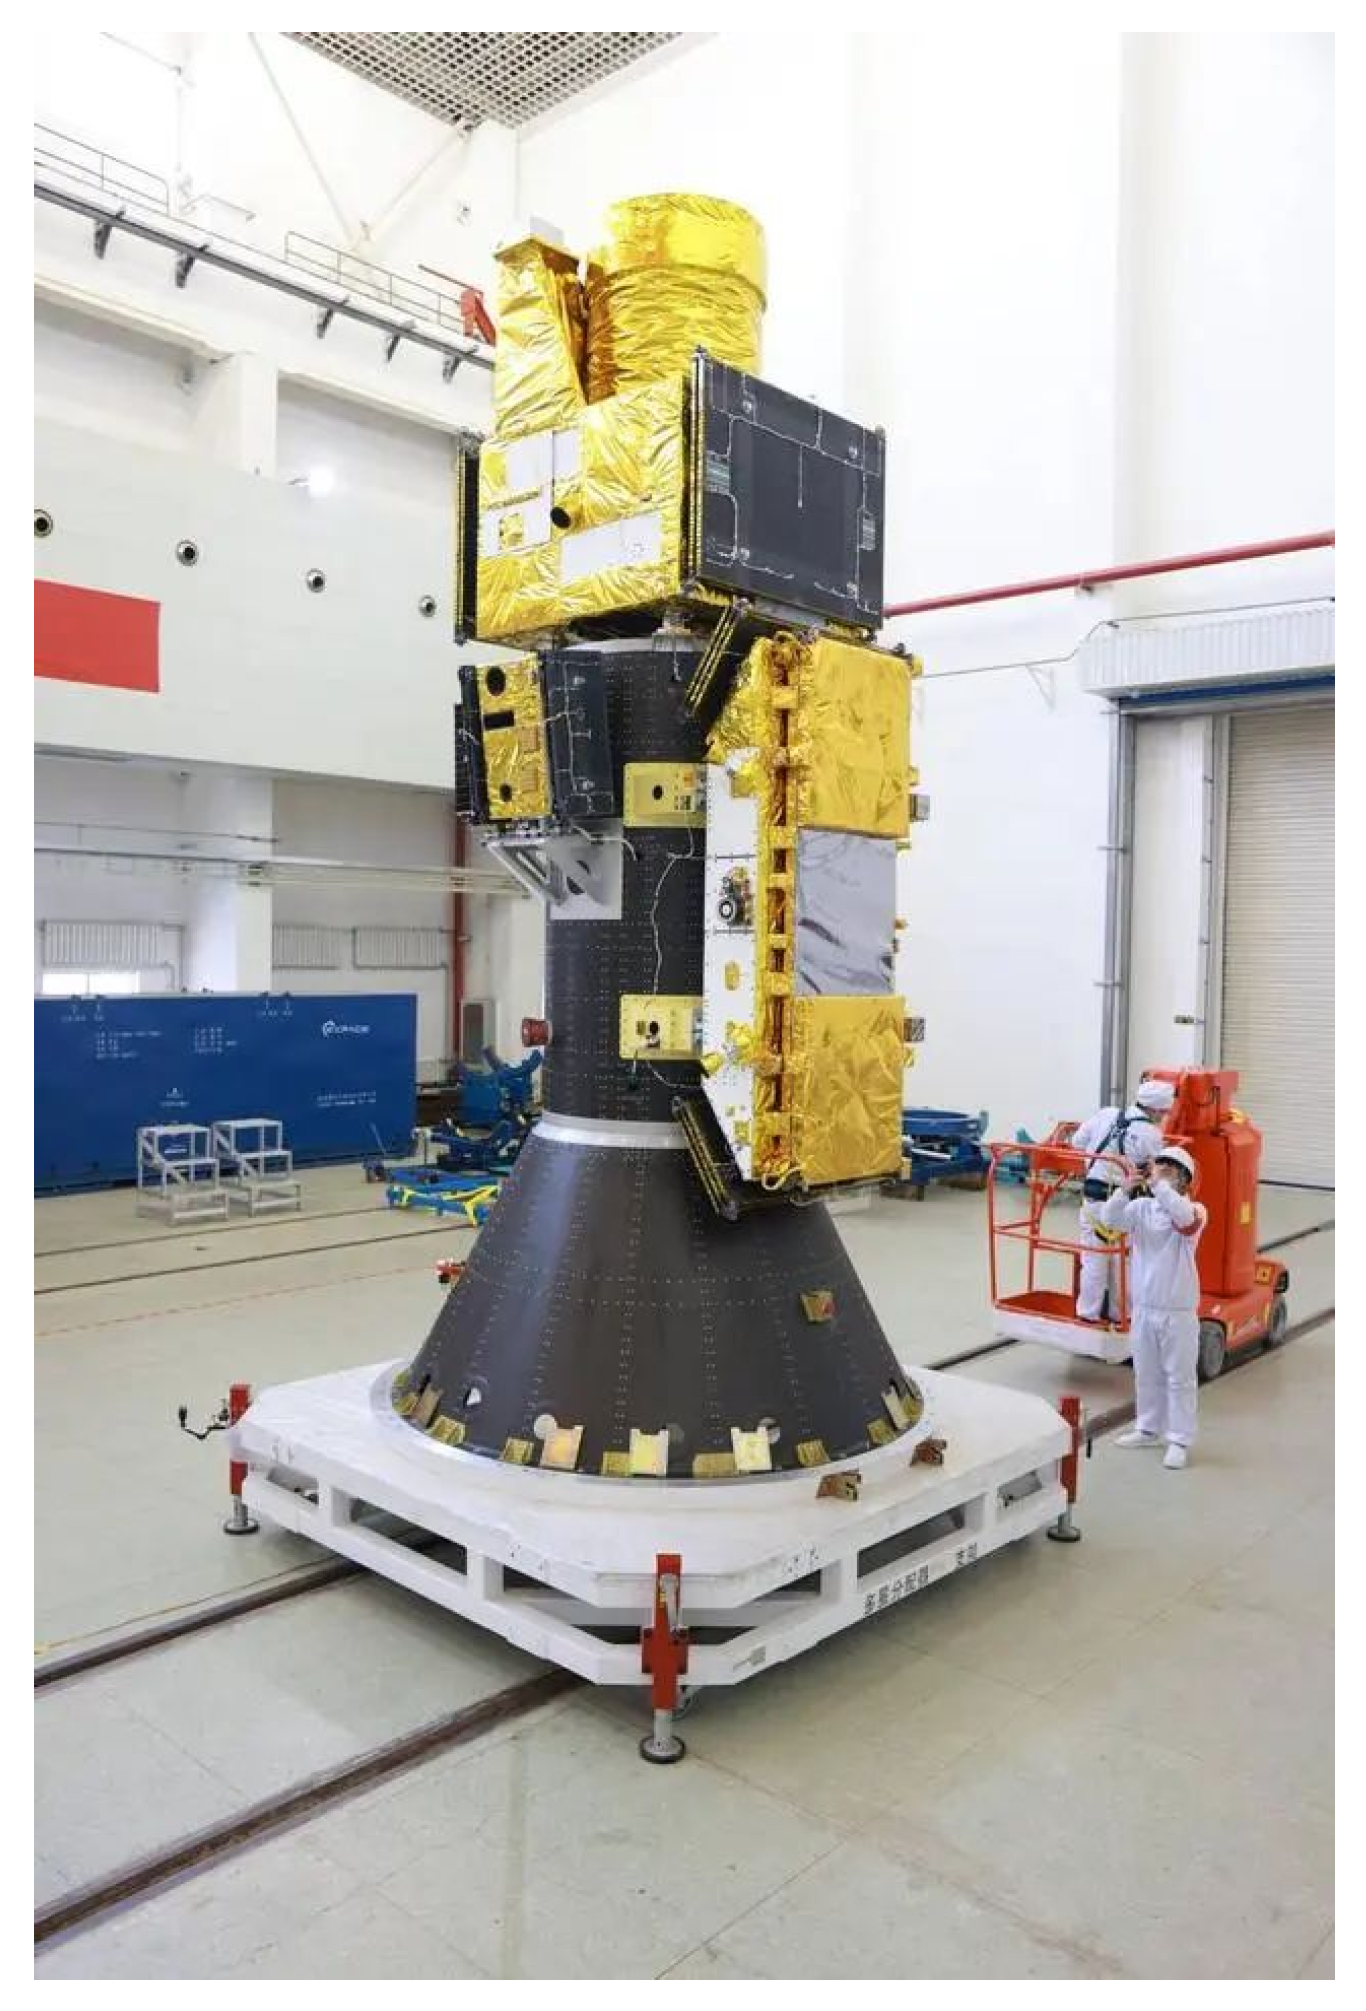
The Taijing-4(03) satellite was launched on January 23, 2024, as part of a single rocket carrying five satellites aboard the Lijian-1 Yao-3 rocket. The satellite utilizes a side-hung configuration for docking with the rocket, depicted in
Figure 3. The Lijian-1 rocket, with dimensions of 30 meters in length, 2.65 meters in diameter, and a liftoff weight of 135 metric tons, showcases impressive engineering capabilities. Particularly noteworthy is its proficiency in payload delivery, capable of transporting multiple SAR satellites totaling up to 1.5 tons to a sun-synchronous orbit situated approximately 500 kilometers above Earth.
2.2. Working Modes
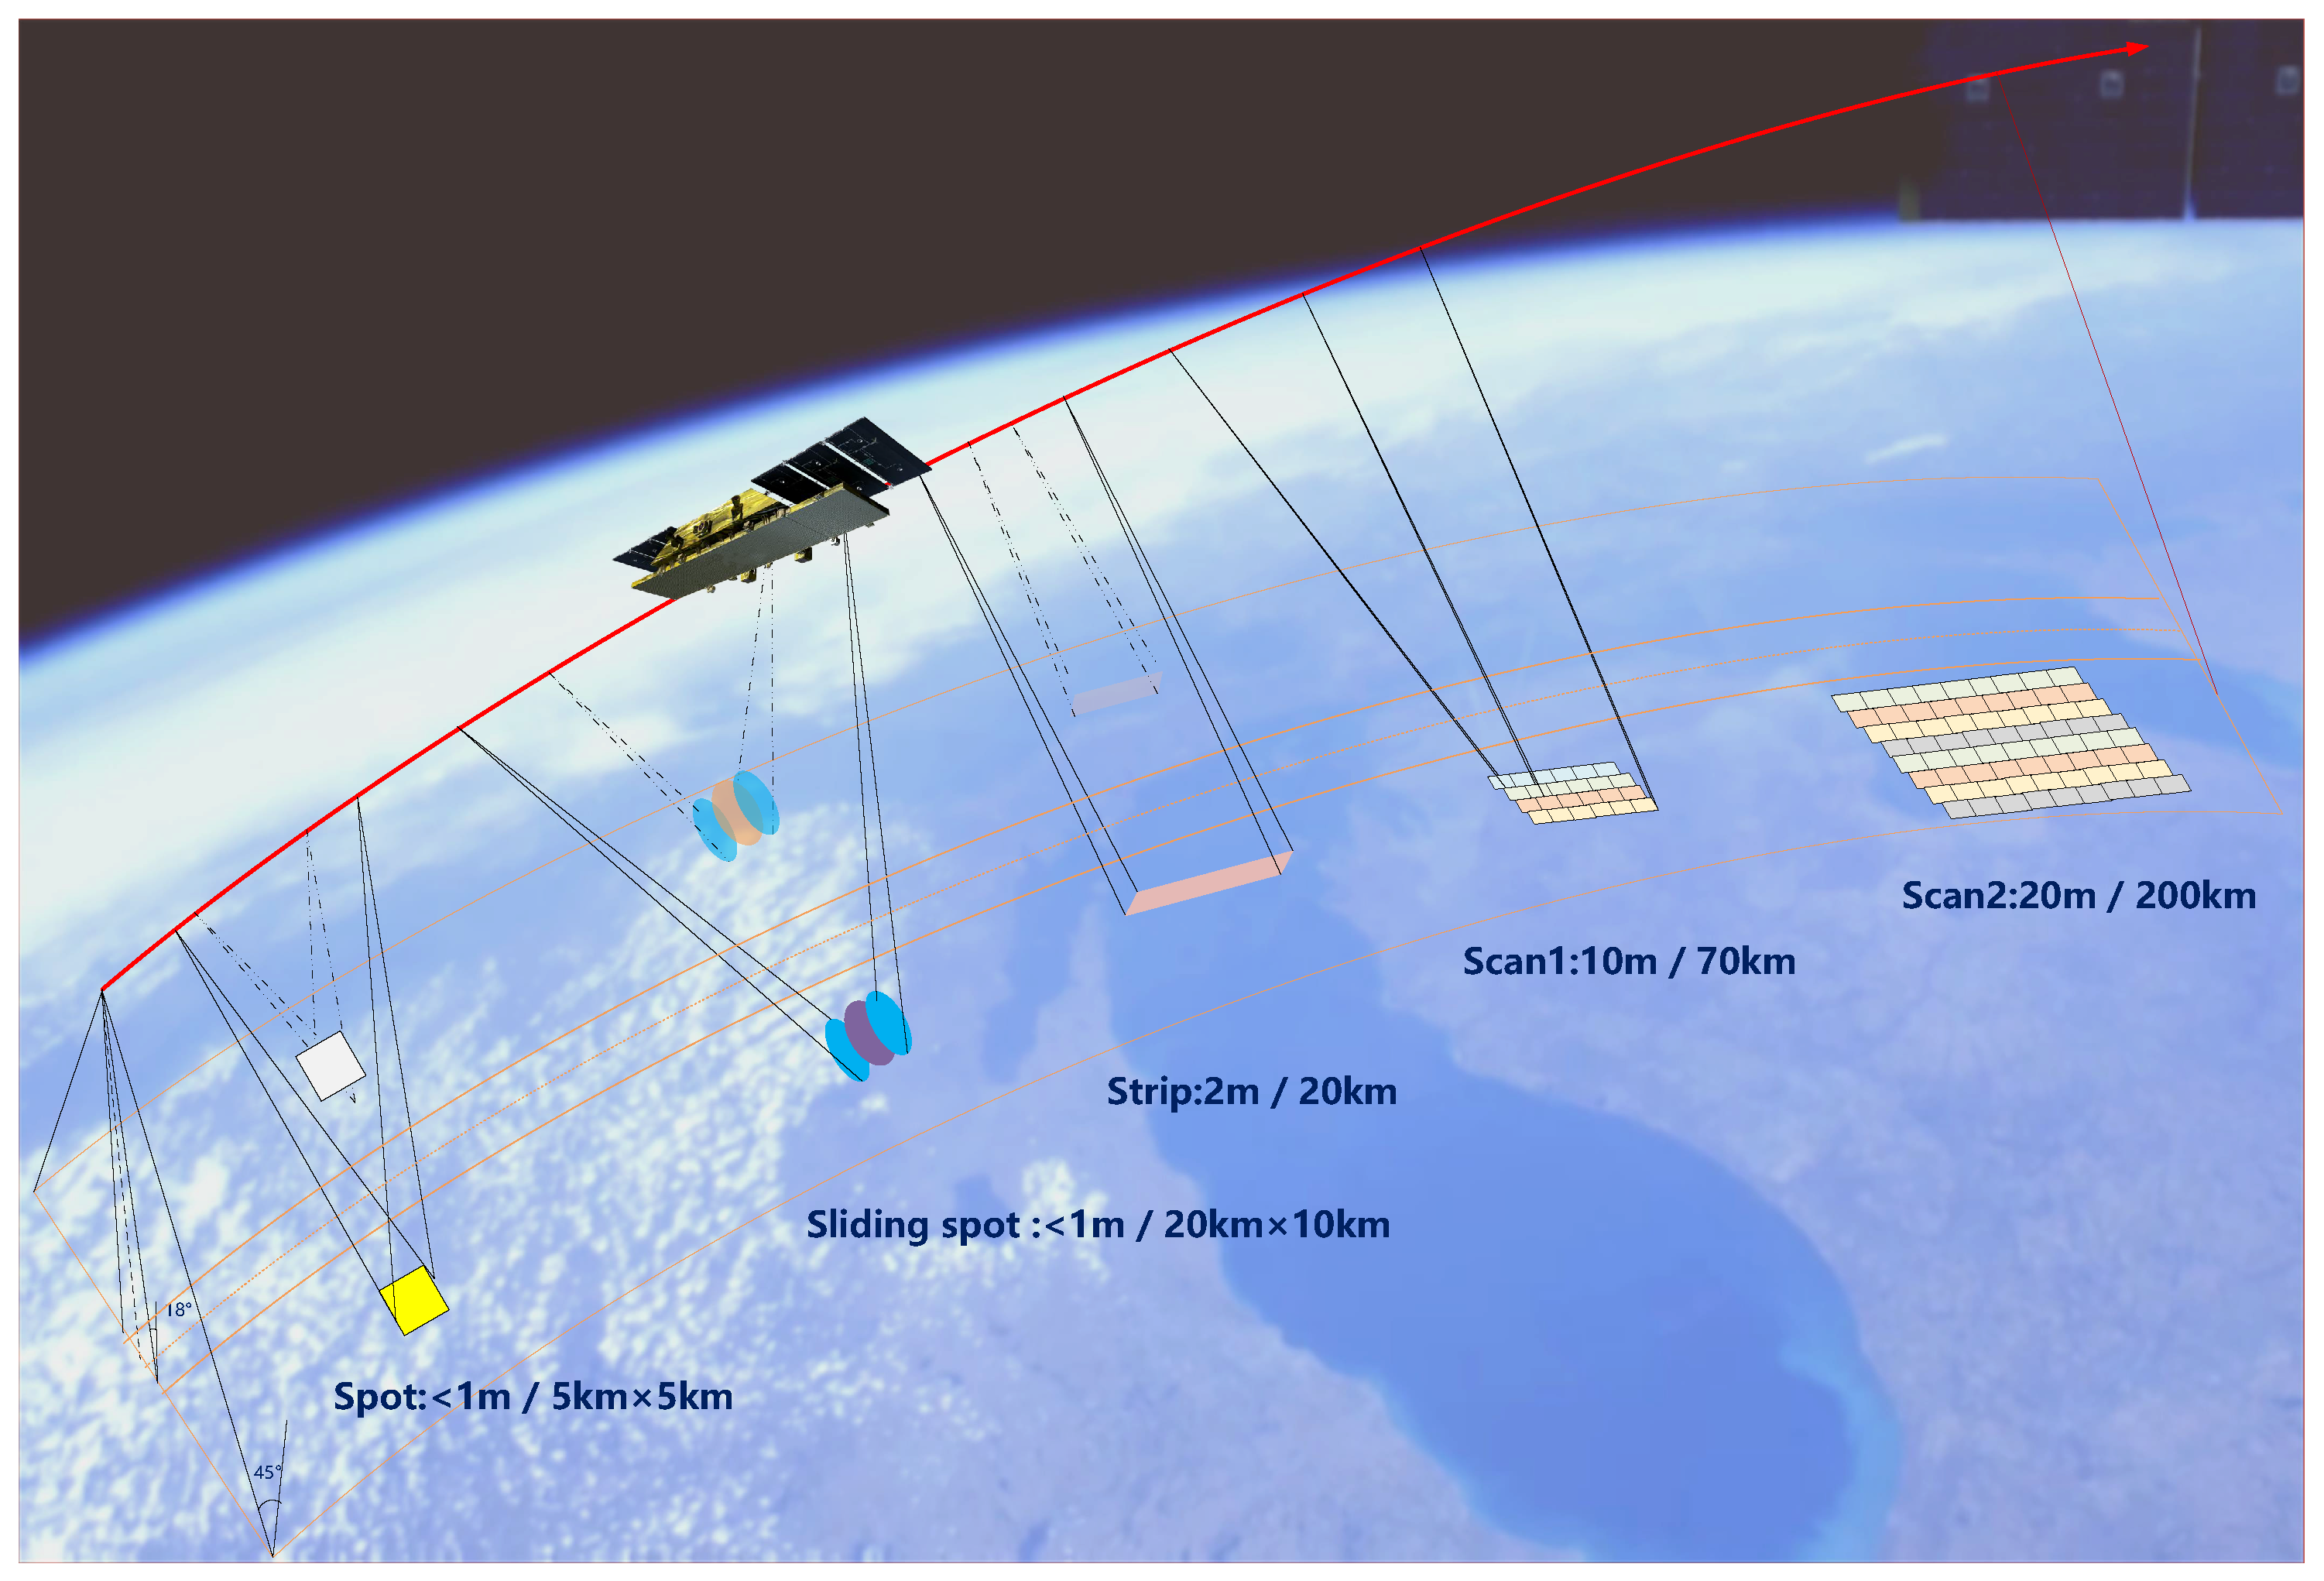
There are five main operating modes for the Ku-band SAR payload, including spot mode, sliding spot mode, strip mode, scan 1 mode and scan 2 mode, as shown in
Figure 4.
Spot mode and sliding spot mode can achieve high azimuth spatial resolution through antenna scanning in azimuth, but it will cause discontinuity in azimuth width, for example, the azimuth width of spotlight mode is only 5km. This mode is realized by transmitting a wideband signal in the range direction, and the maximum bandwidth of the range direction signal is 600MHz. In the striped mode, the system can achieve the target of 2m resolution and 20km width, and the maximum range signal bandwidth is 240MHz. In Scan2 modes, the system can achieve the target of 20m resolution and 200km width, and the maximum range signal bandwidth is 40MHz.
2.3. System Design
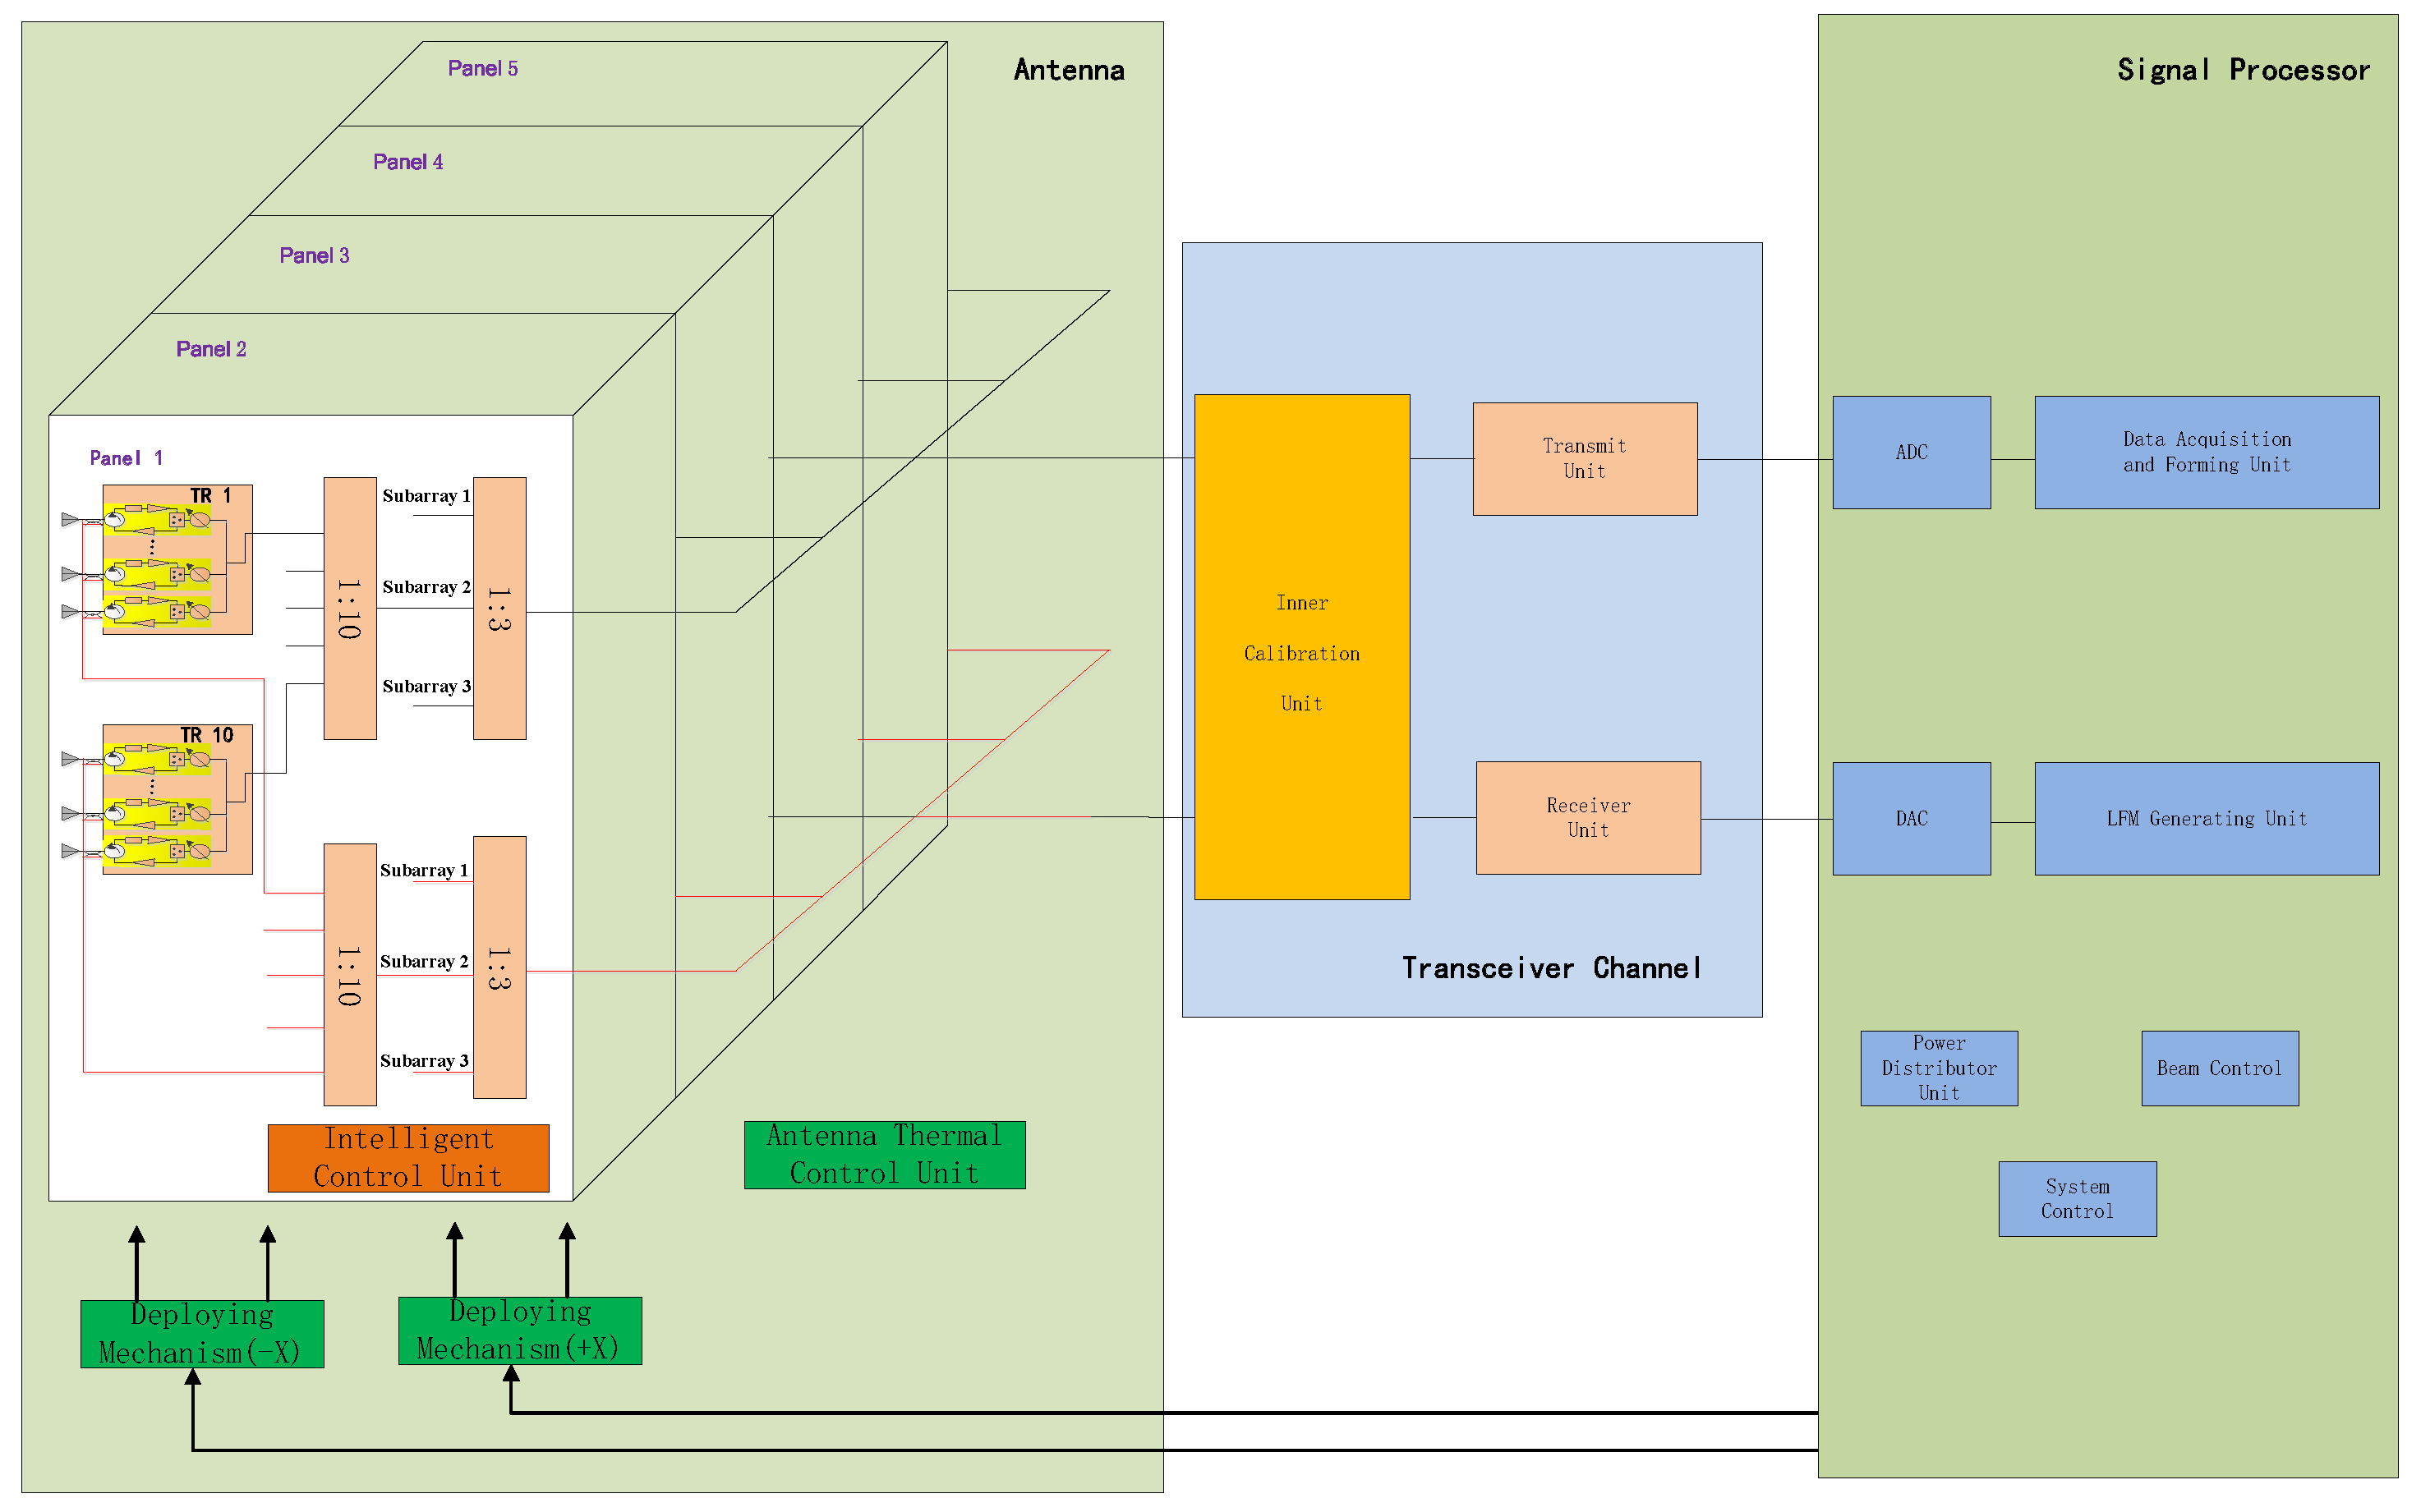
Ku-band SAR is composed of three parts: signal processor, transceiver channel and phased array antenna, as shown in
Figure 5. Considering the lightweight requirements of the satellite platform for the payload, the SAR payload is designed with high integration. The waveguide slot array of SAR phased array antenna adopts a thin-walled structure design, and combined with a carbon fiber structure frame, the antenna surface density is greatly reduced. The transceiver channel has the functions of transmitting channel, receiving channel and internal scaler at the same time, and is packaged in a single machine, which improves the integration level. The signal processor adopts a system-on-a-chip (SOC) structure, and integrates chips such as ADC and DAC, which effectively improves the ability of signal generation, acquisition and processing.
The SAR payload utilizes a retractable flat active phased array antenna measuring 3.6 meters in width by 0.6 meters in height. The antenna comprises of 600 Transmit-Receive (TR) channels, arranged into 15 vertical columns and 40 horizontal rows in a configuration spanning across five panels. The antenna has two-dimensional beam scanning capability, and the scanning angle range in the azimuth direction is ± 1.5 °, and the scanning angle range in the pitch direction is ± 15 °, which can meet the needs of antenna beam scanning in different SAR operating modes. The antenna contains a total of 150 TR modules, each TR module contains four channels, and the peak transmit power of each channel is greater than 6.8 W, so the total system transmit peak power is greater than 4000W.
After launching and orbit adjusting, a deployable mechanism deploys the panels from a stowed launch configuration into its deployed in-orbit configuration. Before SAR operation, the antenna has to point to -32° (right-looking) or +32° (left-looking) relying on the roll steering of the satellite platform. This dual-side looking capacity is valuable in reducing the revisit interval time. Zero Doppler steering, which employs yaw and pitch steering to eliminate doppler center frequency shift, was introduced to satellite.
3. Antenna Model
3.1. Array Synthetic Pattern Model
The antenna can be segmented into multiple subarrays, with each subarray linked to a single TR element. The antenna consists of TR elements, where M signifies the quantity of elements in the elevation dimension, and N indicates the azimuth dimension.
The spatial distribution of radiation pattern from a satellite-based phased array antenna is determined by
the structure involves the angle of elevation
and azimuth
, as well as the subarray configuration
. The numerical order of subarrays in both the vertical and horizontal directions are indicated by sequence numbers
m and
n. The spacing between subarrays in terms of height
and horizontal distance
is also measured. The operative wavelength is denoted as
.
The configuration consists of the angle of elevation , as well as the azimuth angle , and the subarray design . The numerical order of the subarrays in both the vertical and horizontal directions are given by sequence numbers m and n. The distances between the subarrays in the vertical and horizontal directions are denoted as and , respectively. The operational wavelength is .
The stimulation factors of the phased array antenna are computed as [
24]
where the weight of amplitude is
and phase is
.
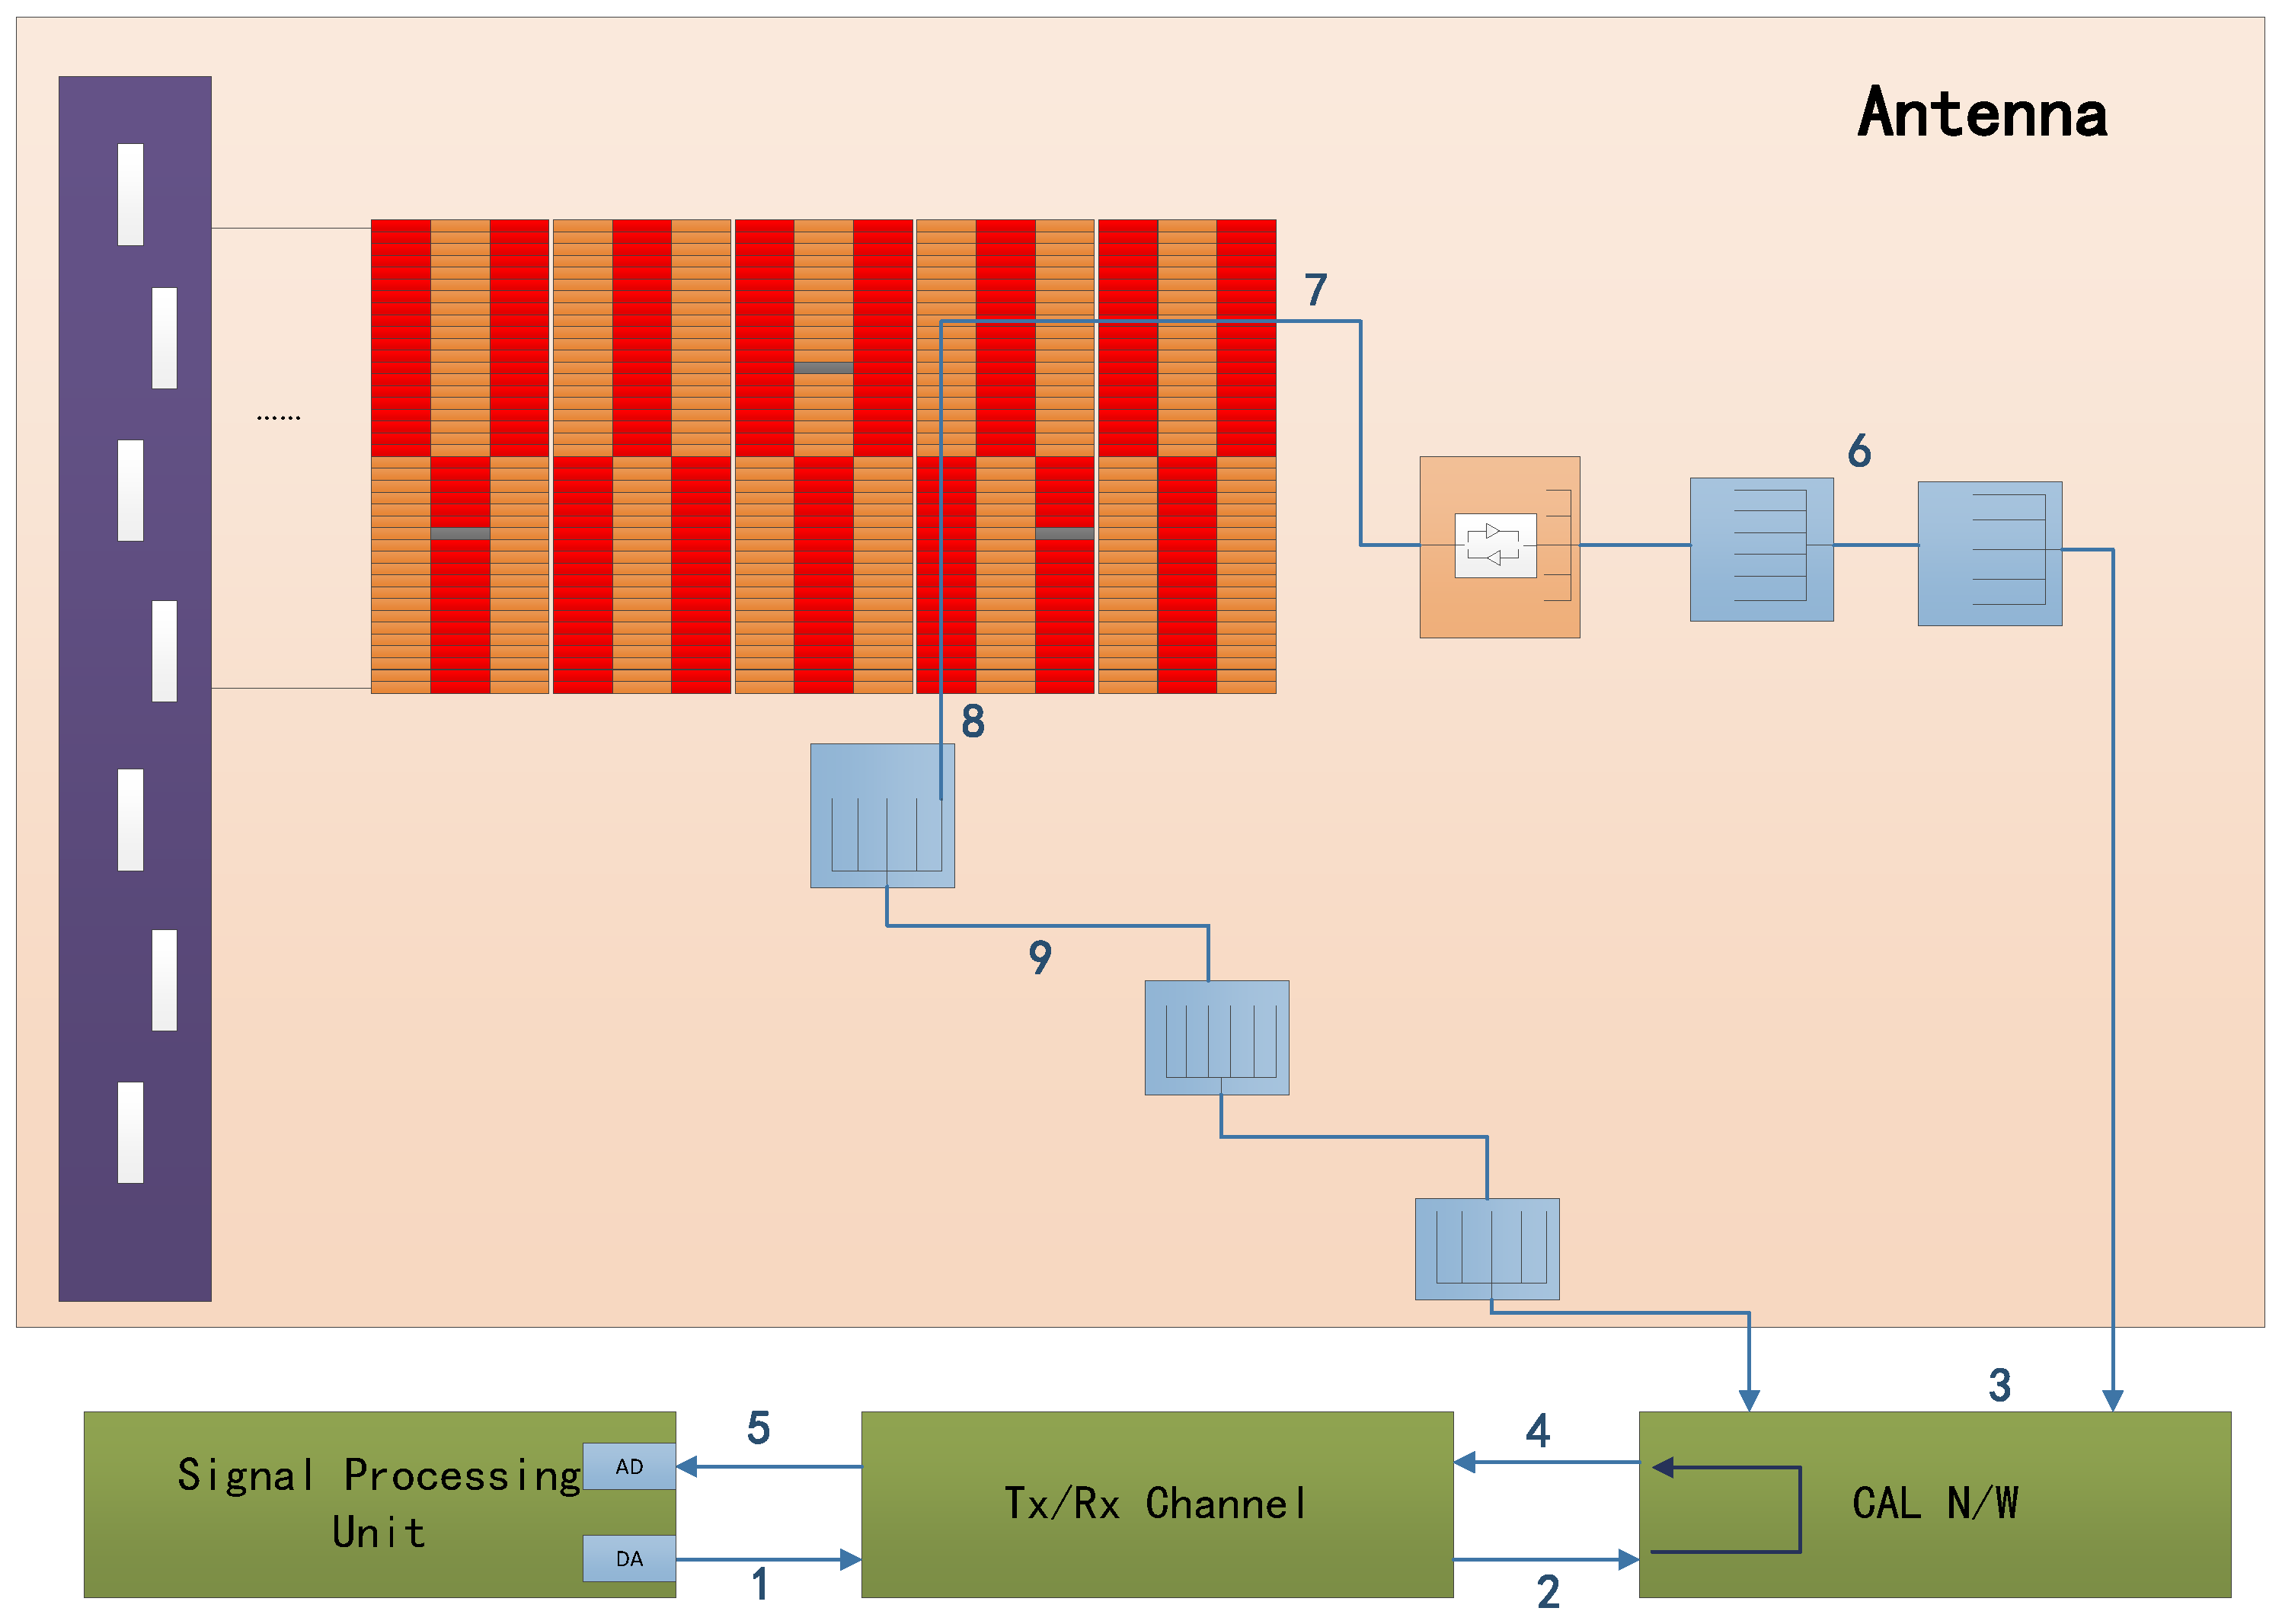
The coefficients for error calculation
can be derived from the computed antenna network, as depicted in
Figure 6.
The core of optimizing antenna patterns involves fine-tuning the excitation coefficients for the TR component of the antenna. When broadening the antenna beam, the antenna’s gain diminishes, resulting in distortion of the antenna pattern and consequently impacting the SAR system’s performance. Hence, optimizing the antenna pattern alongside the SAR system is crucial for determining the best weight value.
The precise electrical model of the antenna offers benefits not only for beam optimization but also for reducing the testing time of the antenna patterns, considering the large number of beams resulting from the 5 observing modes. It would be advantageous to conduct some experiment modes in orbit in the future. The performance of experiment modes can be evaluated using this antenna model. Given the strong consistency, antenna pattern simulation and configuration code generation can be performed on the ground as the antenna patterns cannot be practically tested post-satellite launch.
3.2. Beam Optimization Technique
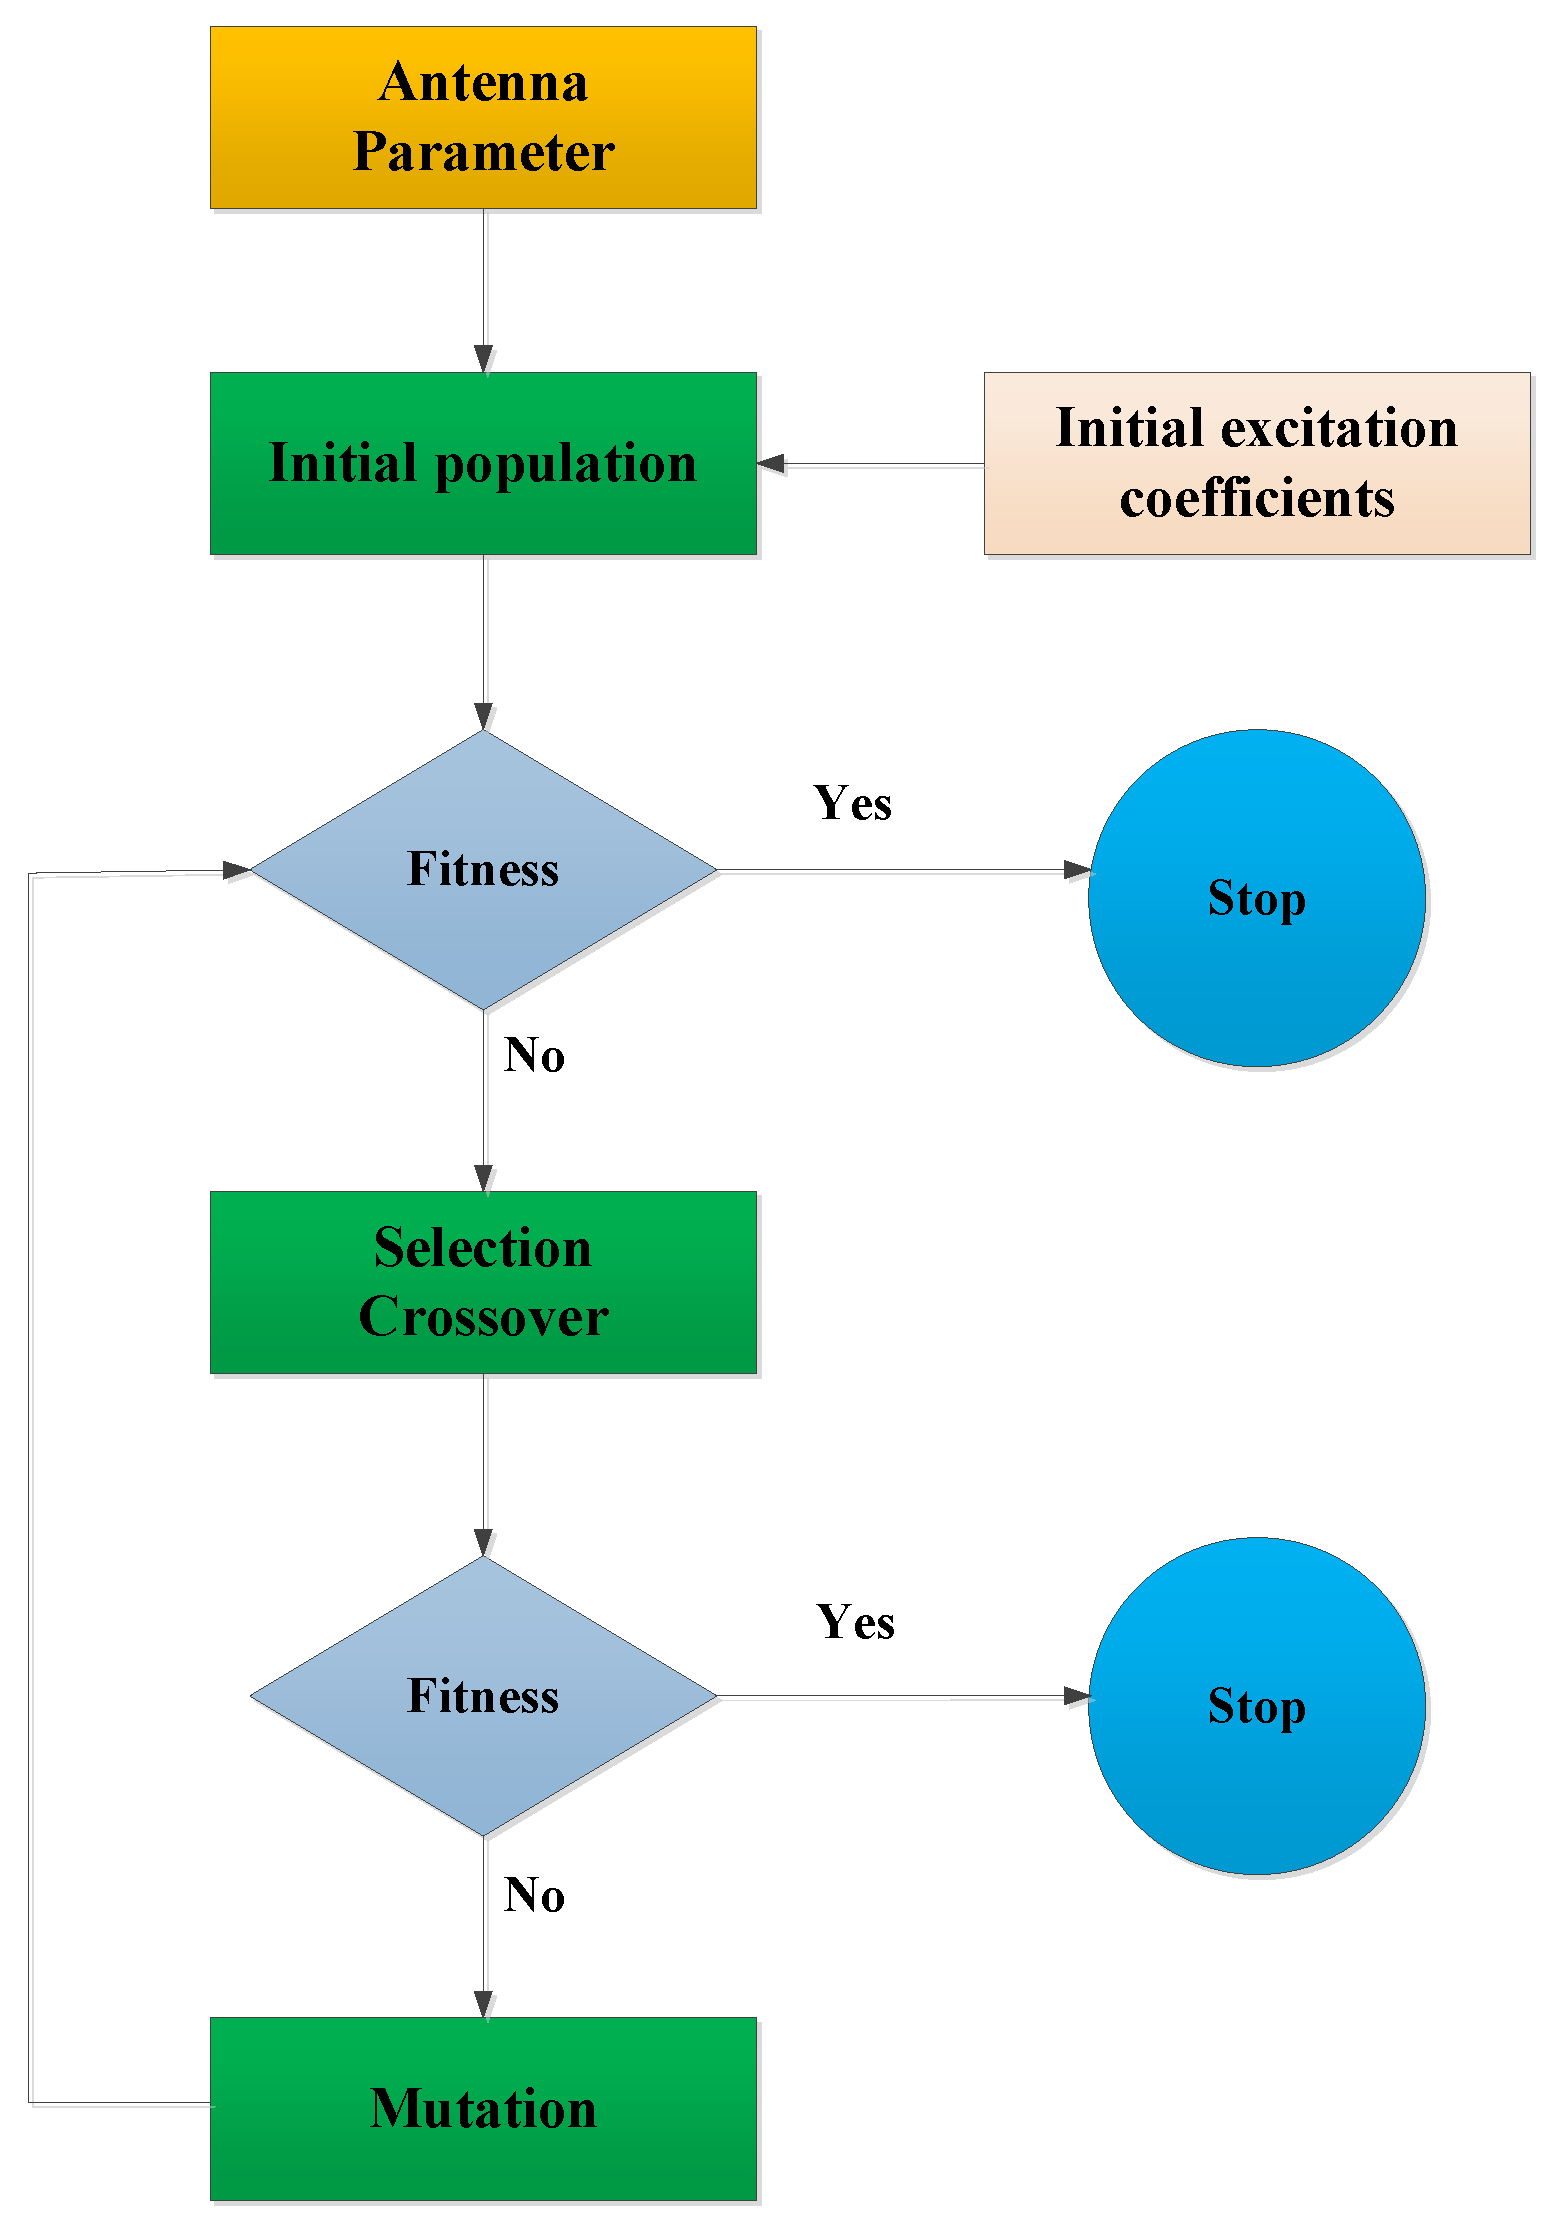
The technique for beampattern optimization is illustrated in
Figure 7. This method is centered around two key components: enhancing the effectiveness factor of the antenna and fine-tuning the initial weight of the antenna. Instead of relying on random amplitude and phase weights, the initial weight of the antenna is determined by a set of weights derived from the anticipated pattern of the antenna, facilitating a quicker convergence rate.
The evaluation criteria for the antenna pattern can be categorized into the primary lobe region and secondary lobe region. In the primary lobe area, the evaluation criteria consist of system sensitivity (NESZ) and uniformity. As for the secondary lobe area, the evaluation criteria include system azimuth ambiguity (AASR) and range ambiguity (RASR).
All the aforementioned objective evaluation criteria utilize a non-linear exponential format, meaning that a lower calculated value of the criteria indicates a more favorable outcome. The evaluation criteria are comprised of three components, which can be represented as
In this system, the optimized antenna pattern is denoted as
, while the anticipated antenna pattern is referred to as
. Antenna pattern is measured in decibels (dB), and the system’s weight is denoted as
w.
The system’s fitness function can be represented as:
The fitness functions are influenced by NESZ and flatness, while the fitness functions are impacted by system azimuth ambiguity
and range ambiguity
.
Given that the anticipated trend follows pattern
, spatial sampling for various antenna azimuth and elevation angles can be conducted using the following equation
The original weight of every individual TR component of the antenna is
. The expected pattern can be reversed by carrying out the necessary actions at the designated sampling locations
The initial weight of each TR can be determined using the formula
7.
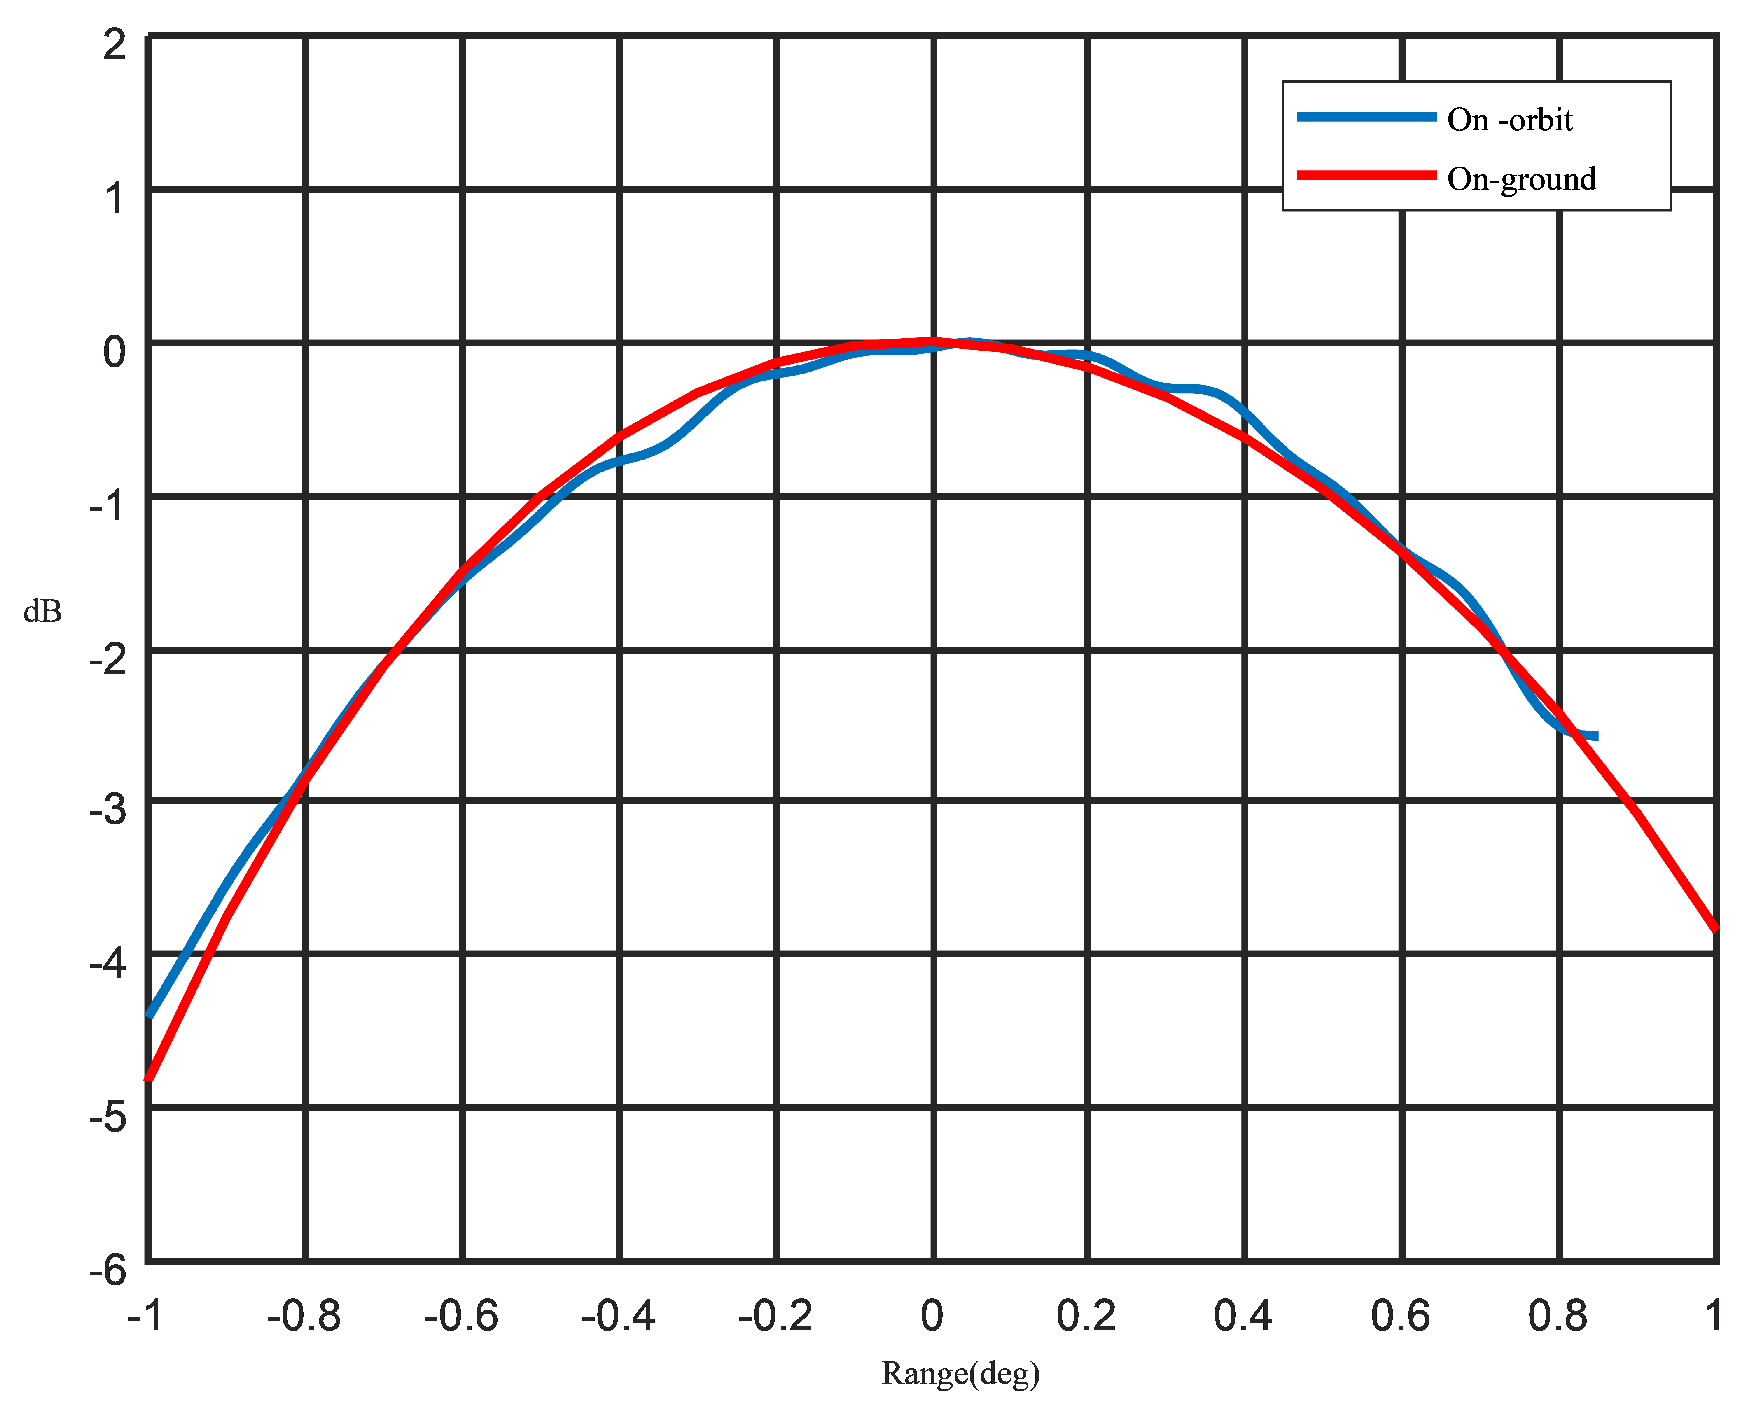
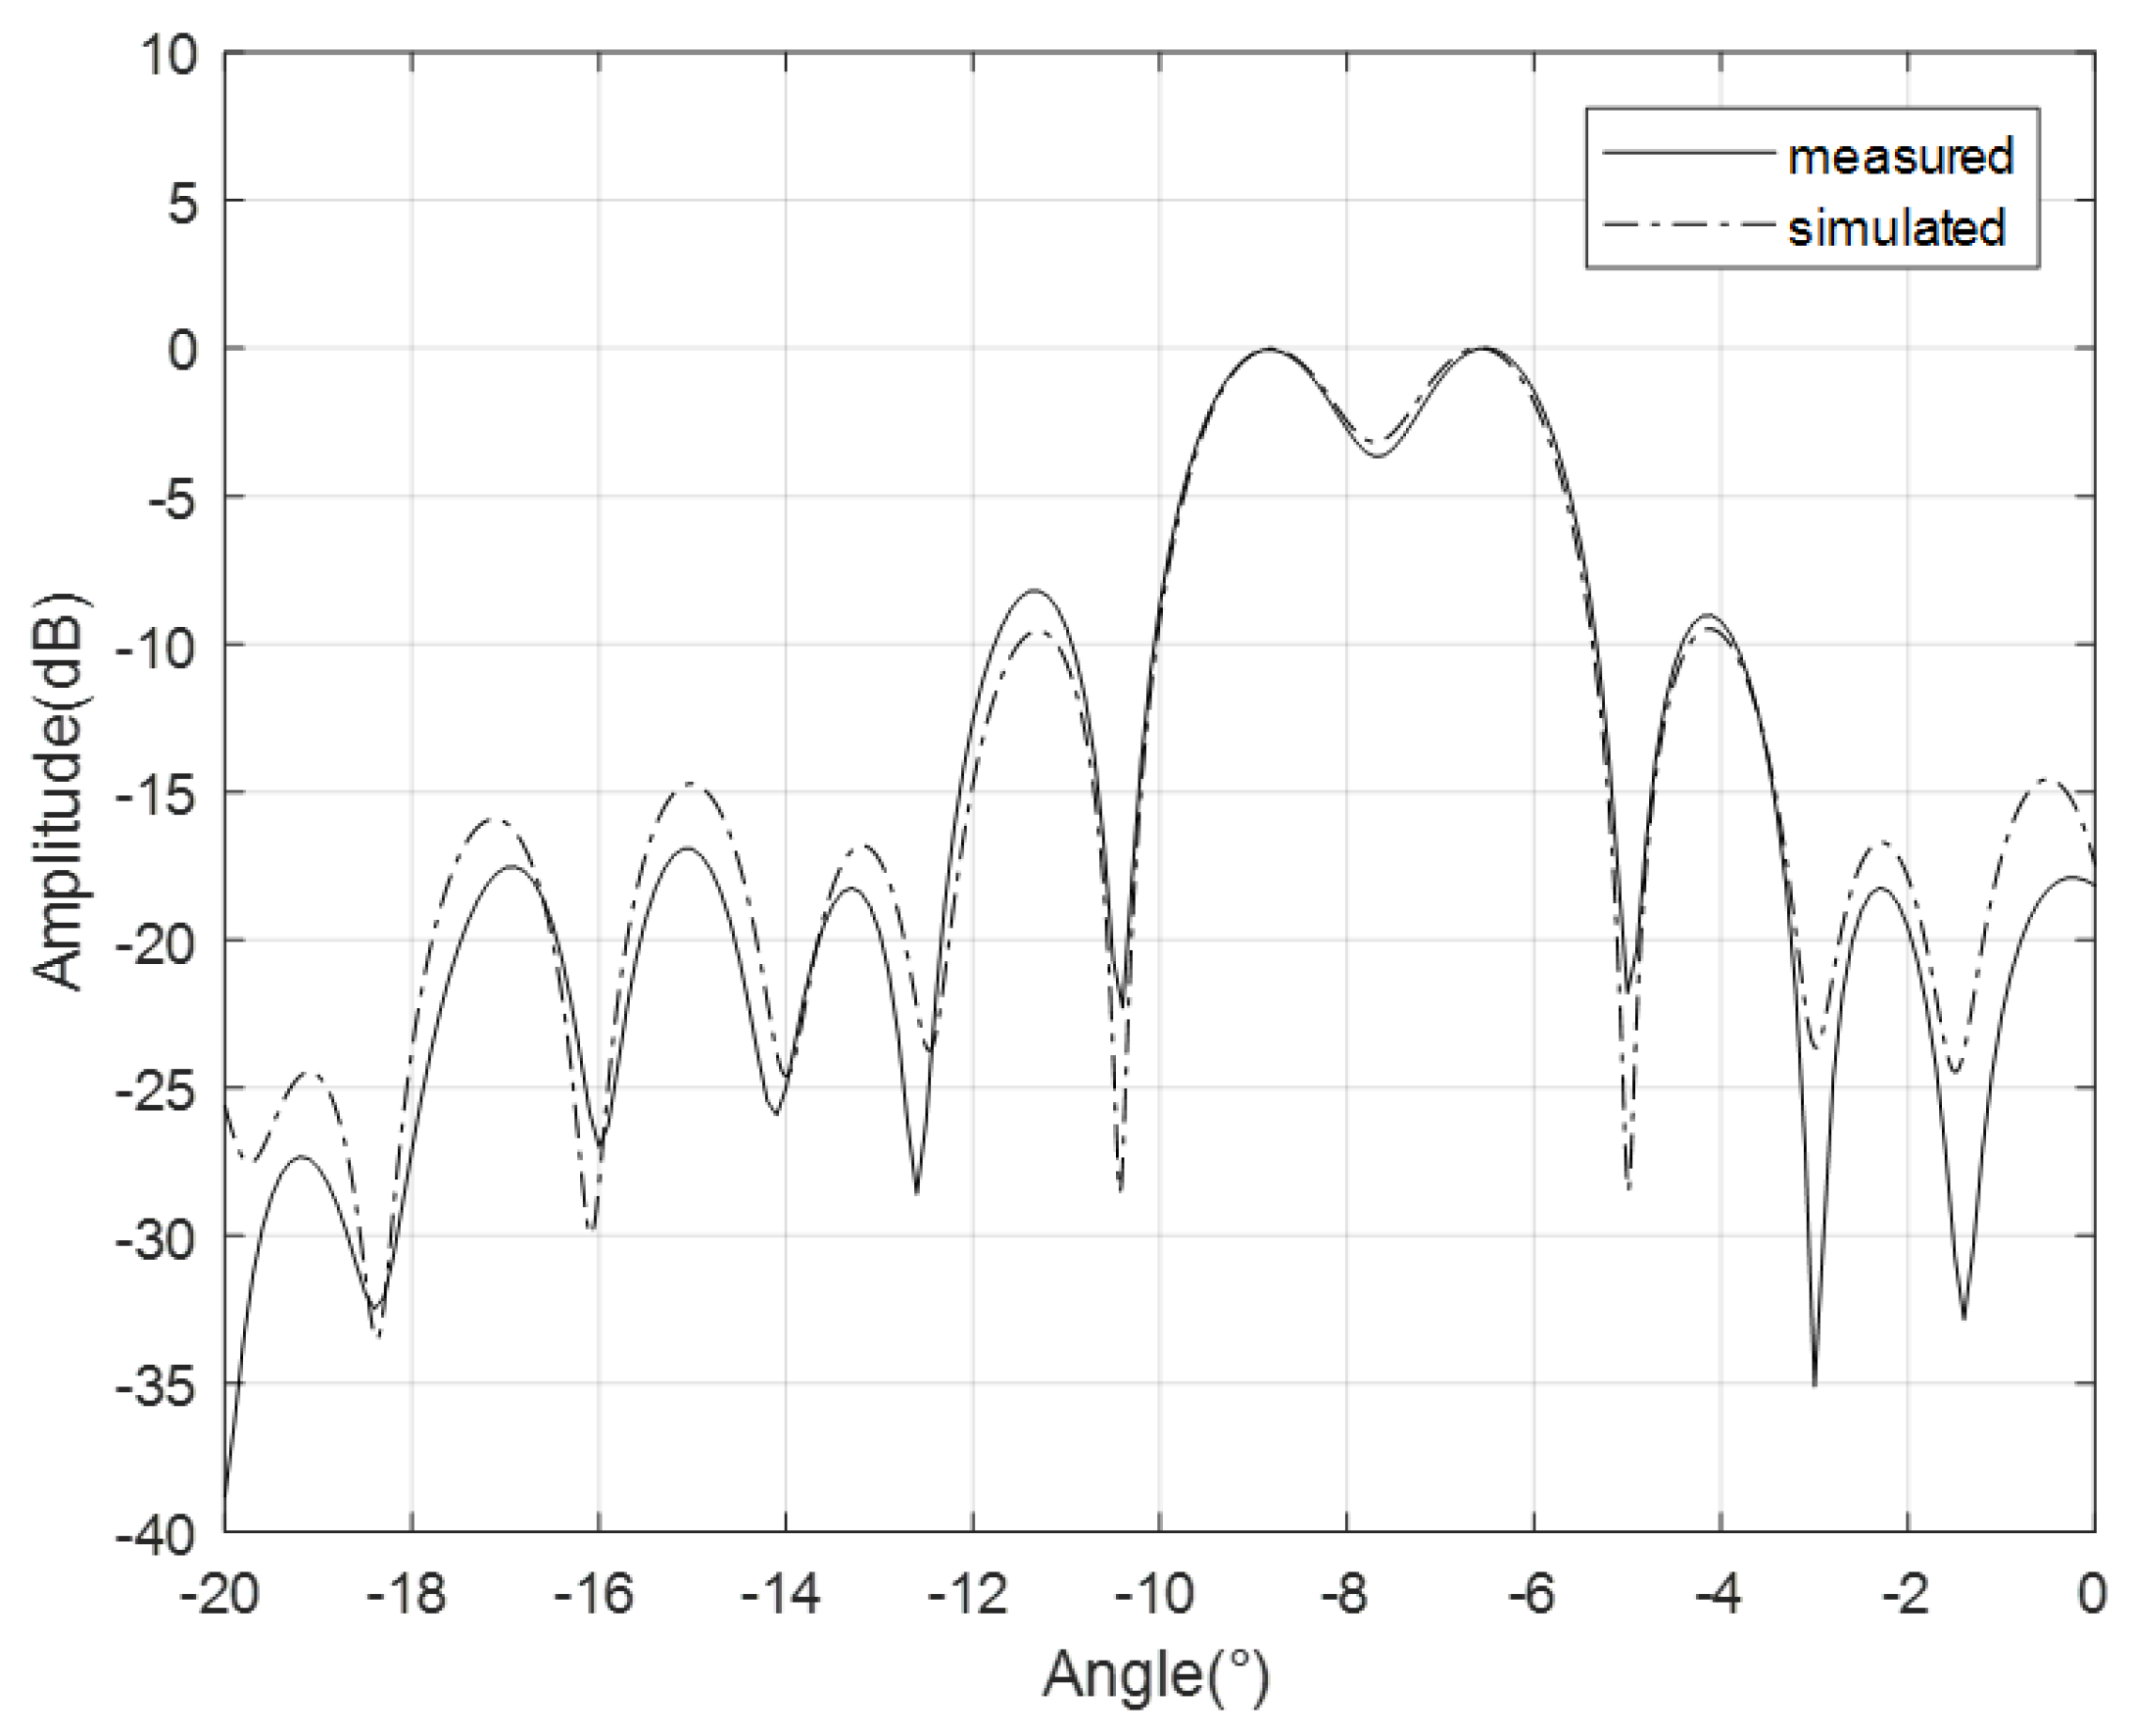
In space-based SAR systems, maintaining uniformity in coverage area requires widening the beam when facing a narrow incident angle, with a magnification factor of 2 times the initial width. The design of the antenna’s beam optimization was implemented utilizing the methodology detailed in this paper, and the antenna’s radiation pattern was simulated and validated, as depicted in
Figure 8.
Based on the comparison between simulated and actual data, the alignment of antenna patterns is fairly strong, with the main lobe experiencing an error of less than 0.5dB, thus meeting the specifications of the SAR system.
4. Sar On-Orbit Performance
4.1. SAR Performance
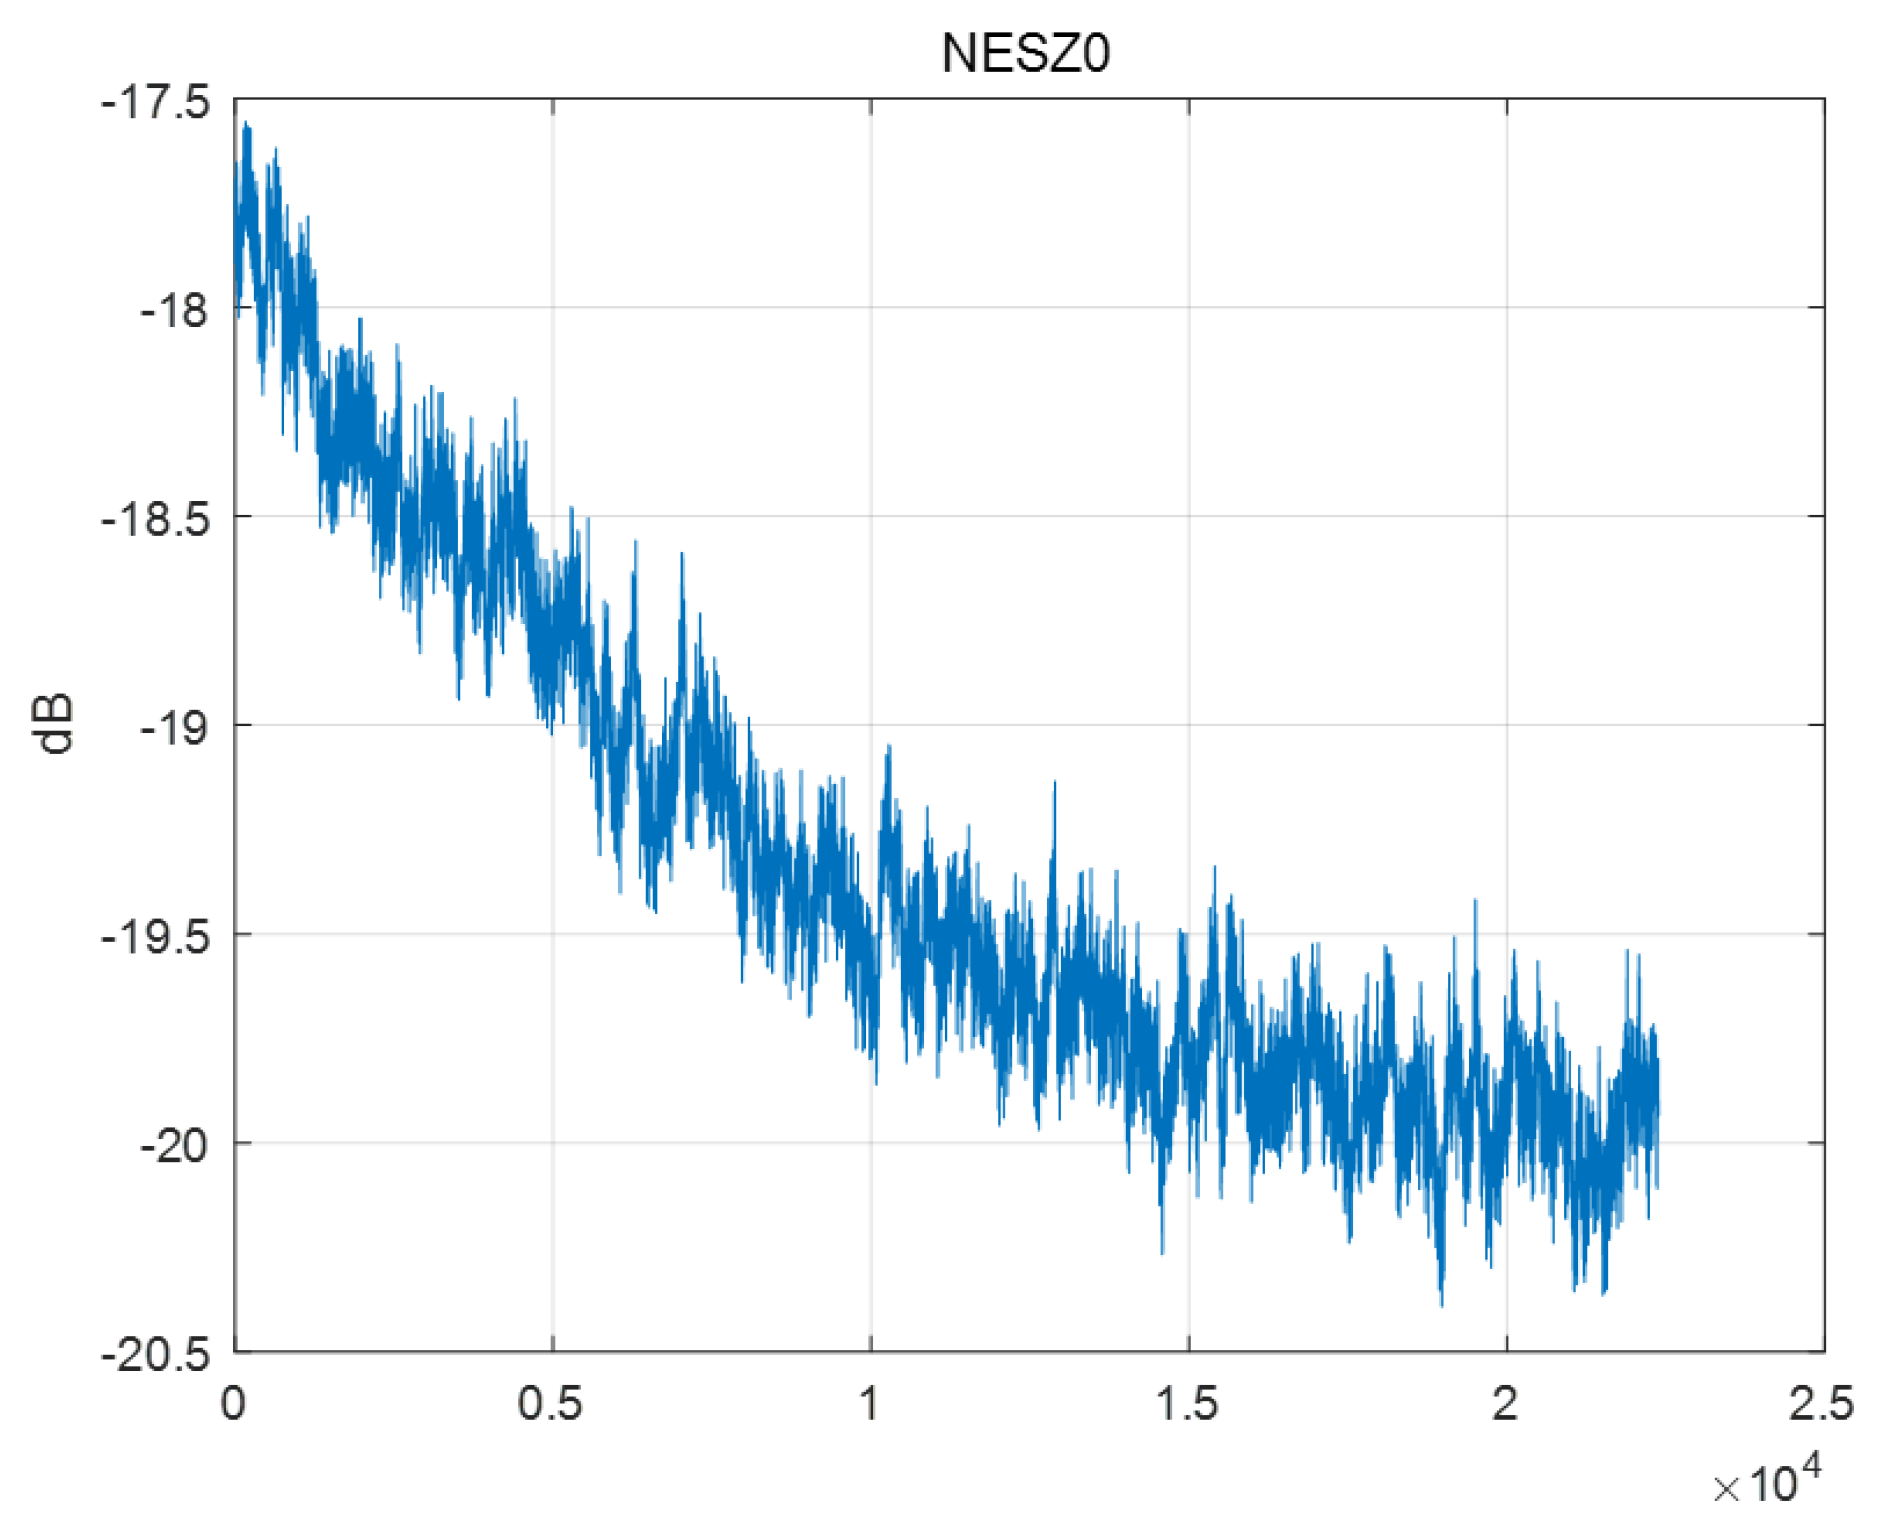
After the SAR payload is in orbit, the antenna pattern and system sensitivity are evaluated. Antenna patterns are mainly evaluated using the Amazon rainforest. The evaluation results of the system sensitivity are shown in the
Figure 7. According to the evaluation results, the sensitivity of the system at the center of the antenna beam reaches -20.0 dB, which meets the design requirements of the system. Considering that the on-orbit test was carried out in the early stage of the on-orbit, the antenna beam pointing is biased and has not been corrected, so there is an asymmetry in the figure, but it does not affect the evaluation of system sensitivity.
Figure 9.
NESZ as assessed from the Amazon rainforest.
Figure 9.
NESZ as assessed from the Amazon rainforest.
Antenna patterns are mainly evaluated using the Amazon rainforest. The payload evaluates the antenna pattern based on the results of satellite imaging by irradiating the Amazon rainforest with different beams. Considering that there are more than 5,000 beams on board the satellite, only some antenna beams were evaluated during the on-orbit test. The result of the antenna pattern is shown in
Figure 8. According to the results in the figure, the antenna pattern of the satellite in orbit is consistent with the ground test results, and the error is less than 0.5 db. Considering that all beams cannot be tested after the satellite is in orbit, it is necessary to evaluate all beams of the antenna according to the on-orbit test results of the wavelength division beam and combined with a high-precision antenna model.
Figure 10.
Antenna pattern as assessed from the Amazon rainforest.
Figure 10.
Antenna pattern as assessed from the Amazon rainforest.
4.2. On-Orbit Image
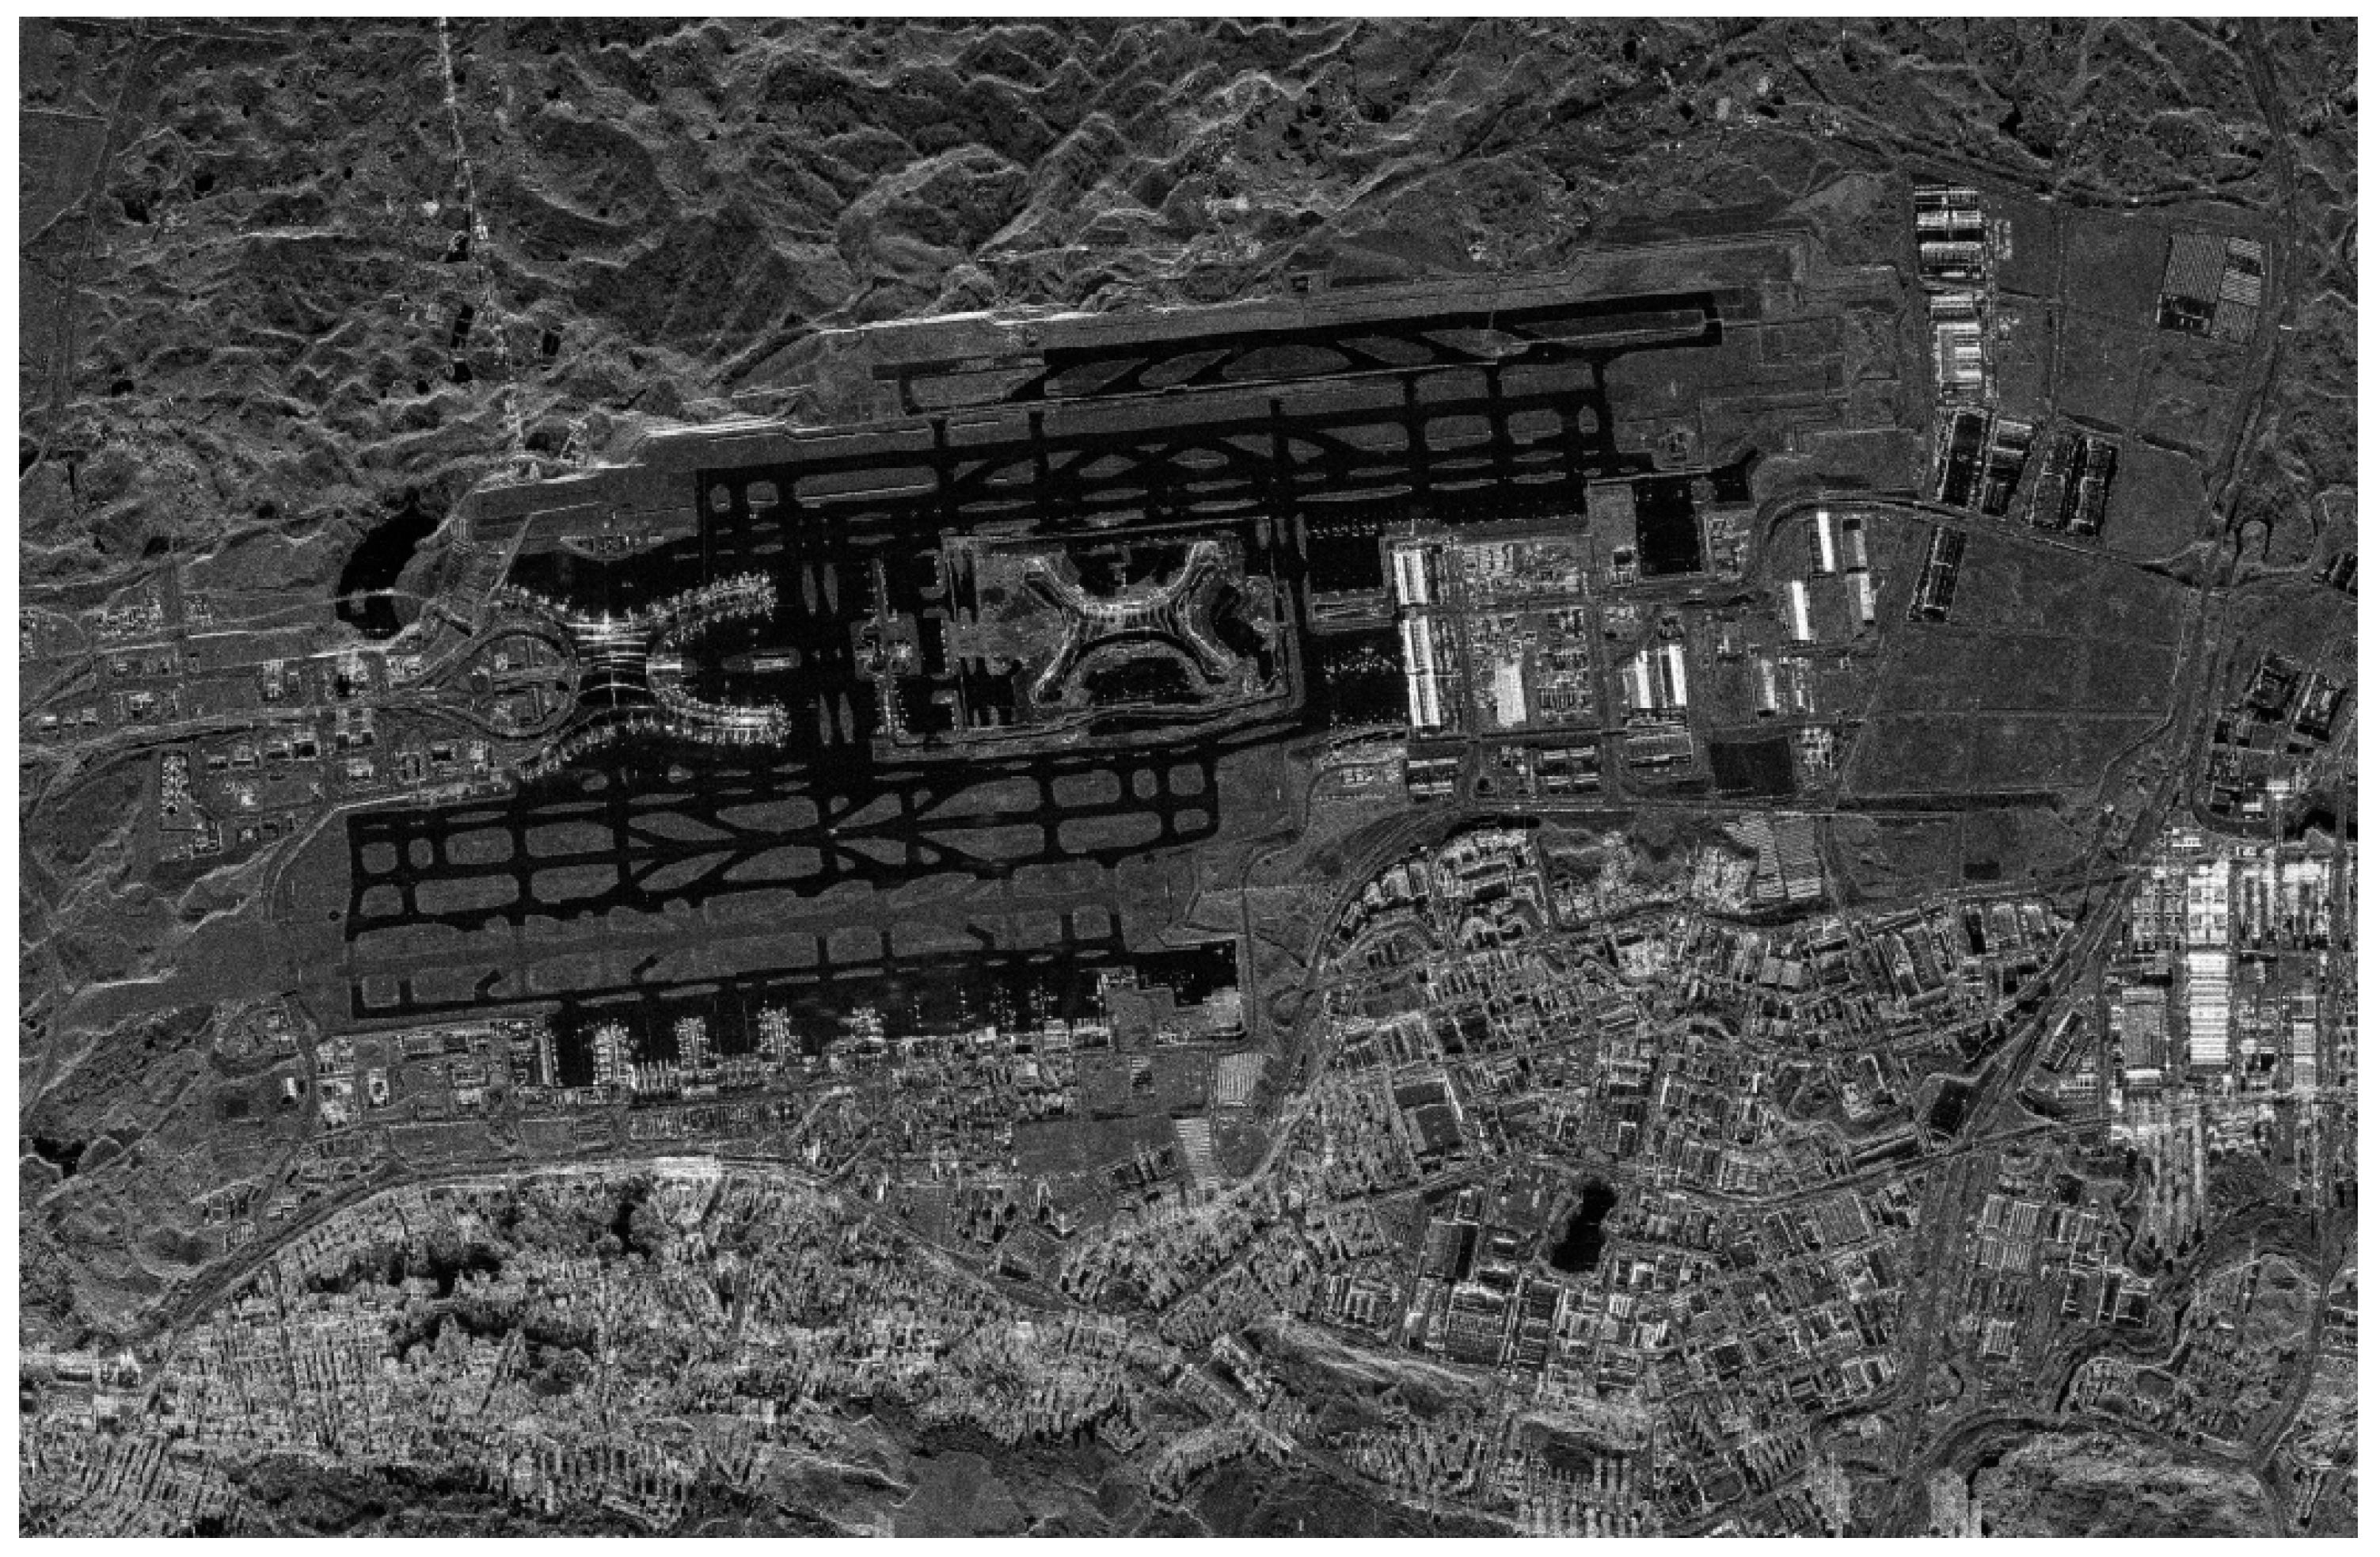
The Taijing-4(03) satellite was launched on January 23, 2024. The first Synthetic Aperture Radar (SAR) observation took place on January 27, 2024, as shown is
Figure 11. Following this, in-orbit performance evaluation and product application tests were conducted incrementally. Taijing-4(03) has been officially operational since April 2024.
The system is capable of achieving azimuth continuous imaging with 2m resolution in strip mode, with a range width of up to 20km. This allows for medium and high-resolution imaging of global land. The imaging results from strip mode show well-defined features such as runways and covered bridges at airport, urban buildings, water bodies, mountains, crops, and forests, with clear structures. These results suggest that the model holds great potential for the aforementioned applications.
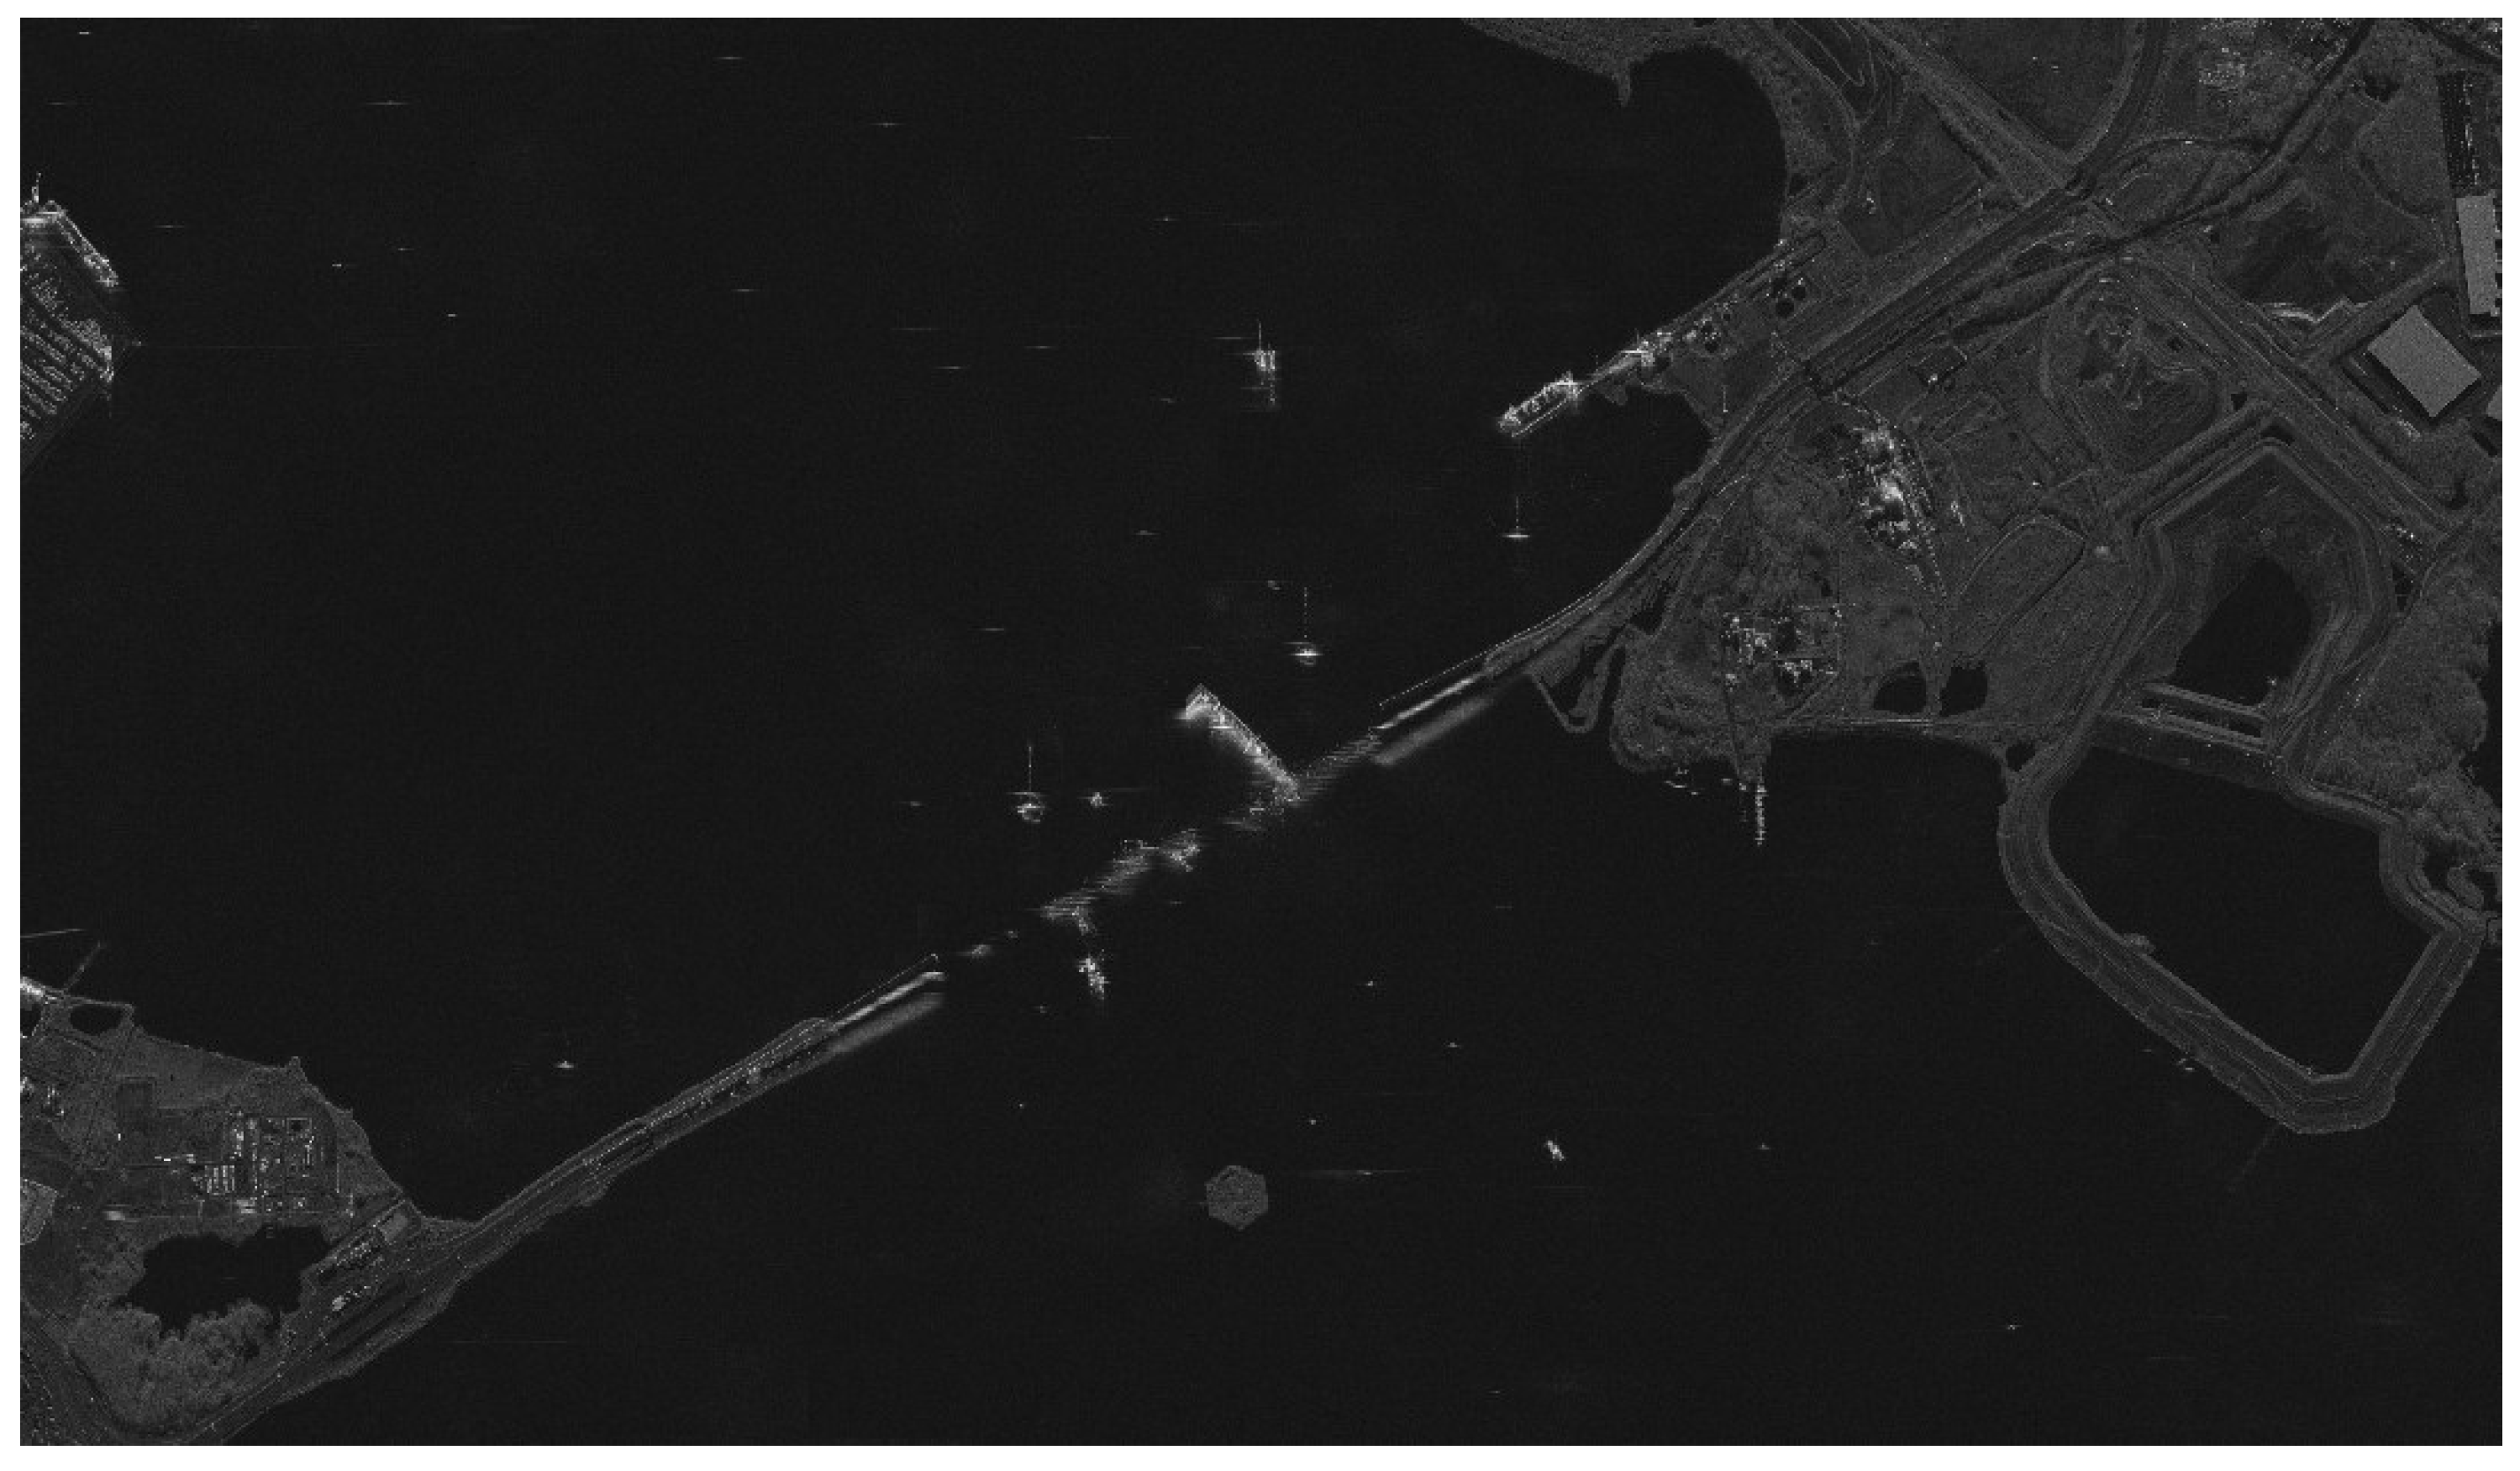
The SAR system can achieve better than 1m resolution imaging in the sliding spotlight mode, and the range width is 10km, and the azimuth width is 20km. It can be used for high-resolution imaging of local areas. The Francis Scott Key Bridge was a steel arch-shaped continuous truss bridge, the second-longest in the United States and third-longest in the world. On March 26, 2024, at 05:28 UTC, the main spans of the bridge collapsed due to a collision caused by the loss of power of the Singapore-registered container ship MV Dali, which struck the southwest supporting pier of the main truss section. The SAR image is photographed at 16:19 on Mar. 30, 2024, as shown in
Figure 12. According to SAR images, the bridge was crashed into four sections, and a large number of ships were rescuing and repairing around it.
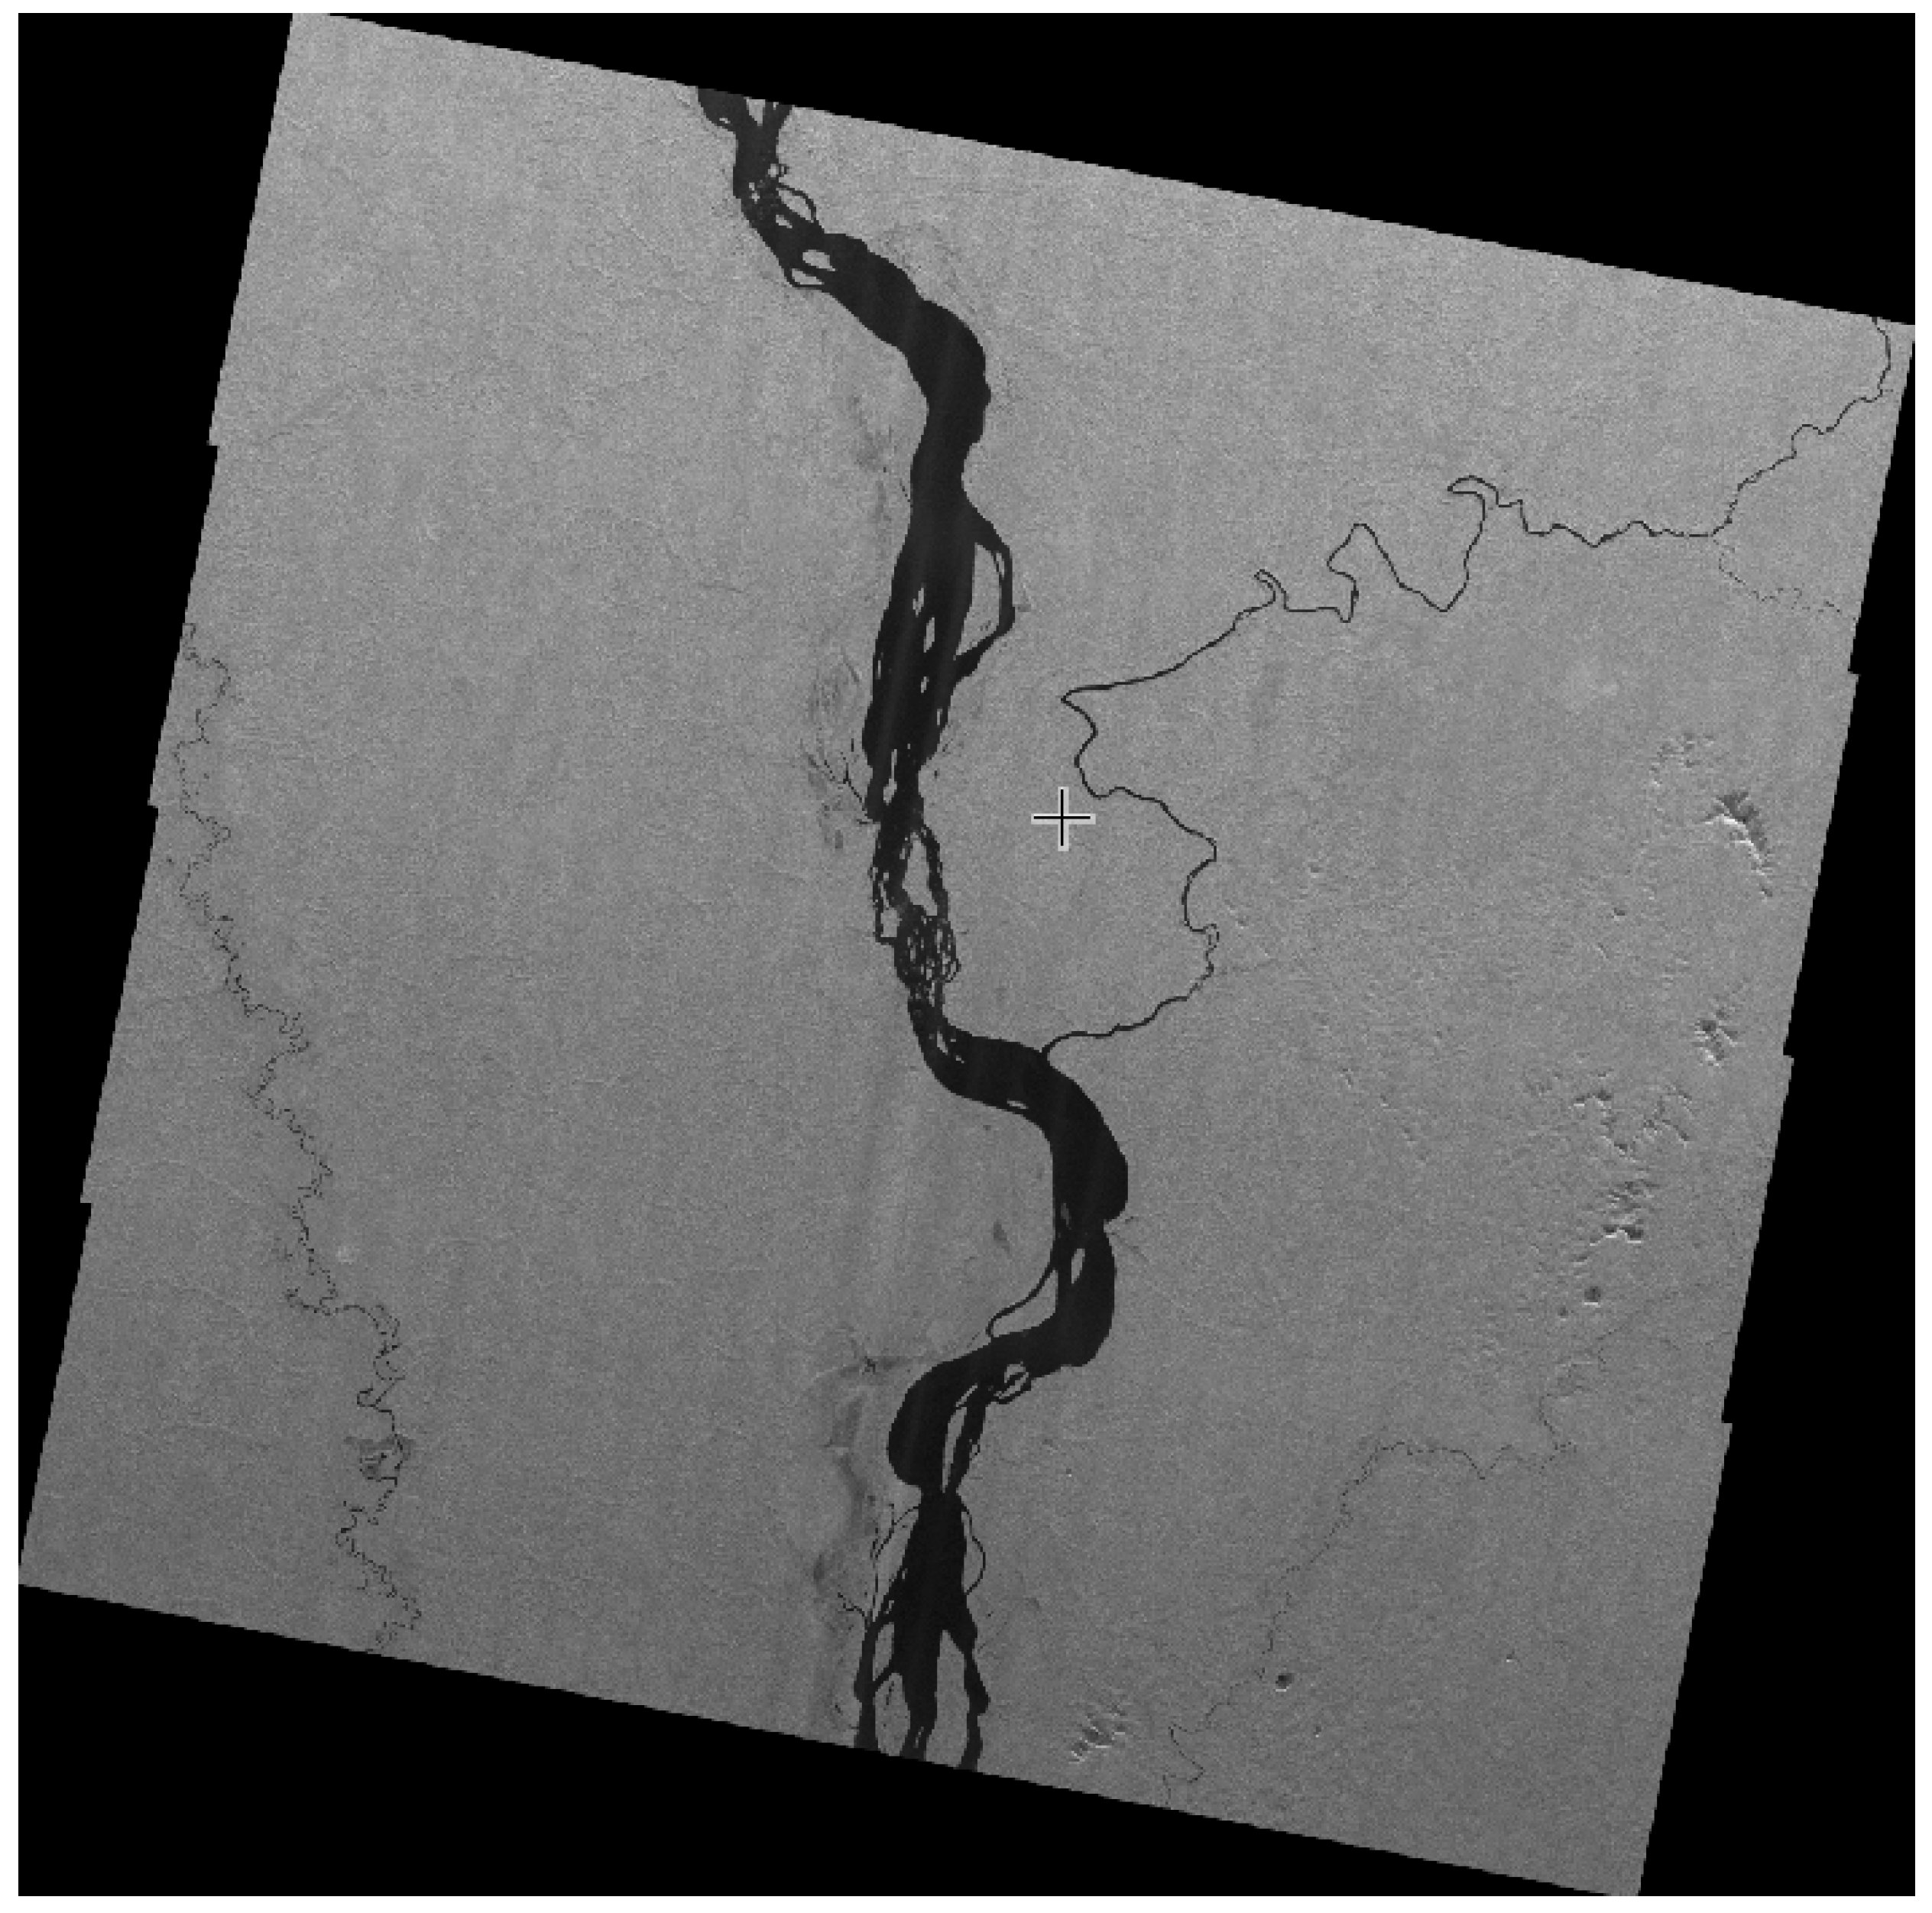
SAR payload can be designed with Scan 1 mode and Scan 2 mode in order to meet the user’s needs for low resolution and wide mapping band, among which Scan 1 mode can achieve 10m resolution and 70km width. Scanning 2 mode can achieve 20m resolution and 200km width. The payload was imaged of the Amazon rainforest using the Scanning 1 mode, as shown in
Figure 13. This imaging mode can be used for normalized monitoring of the Amazon rainforest, for monitoring applications such as deforestation and forest fires.
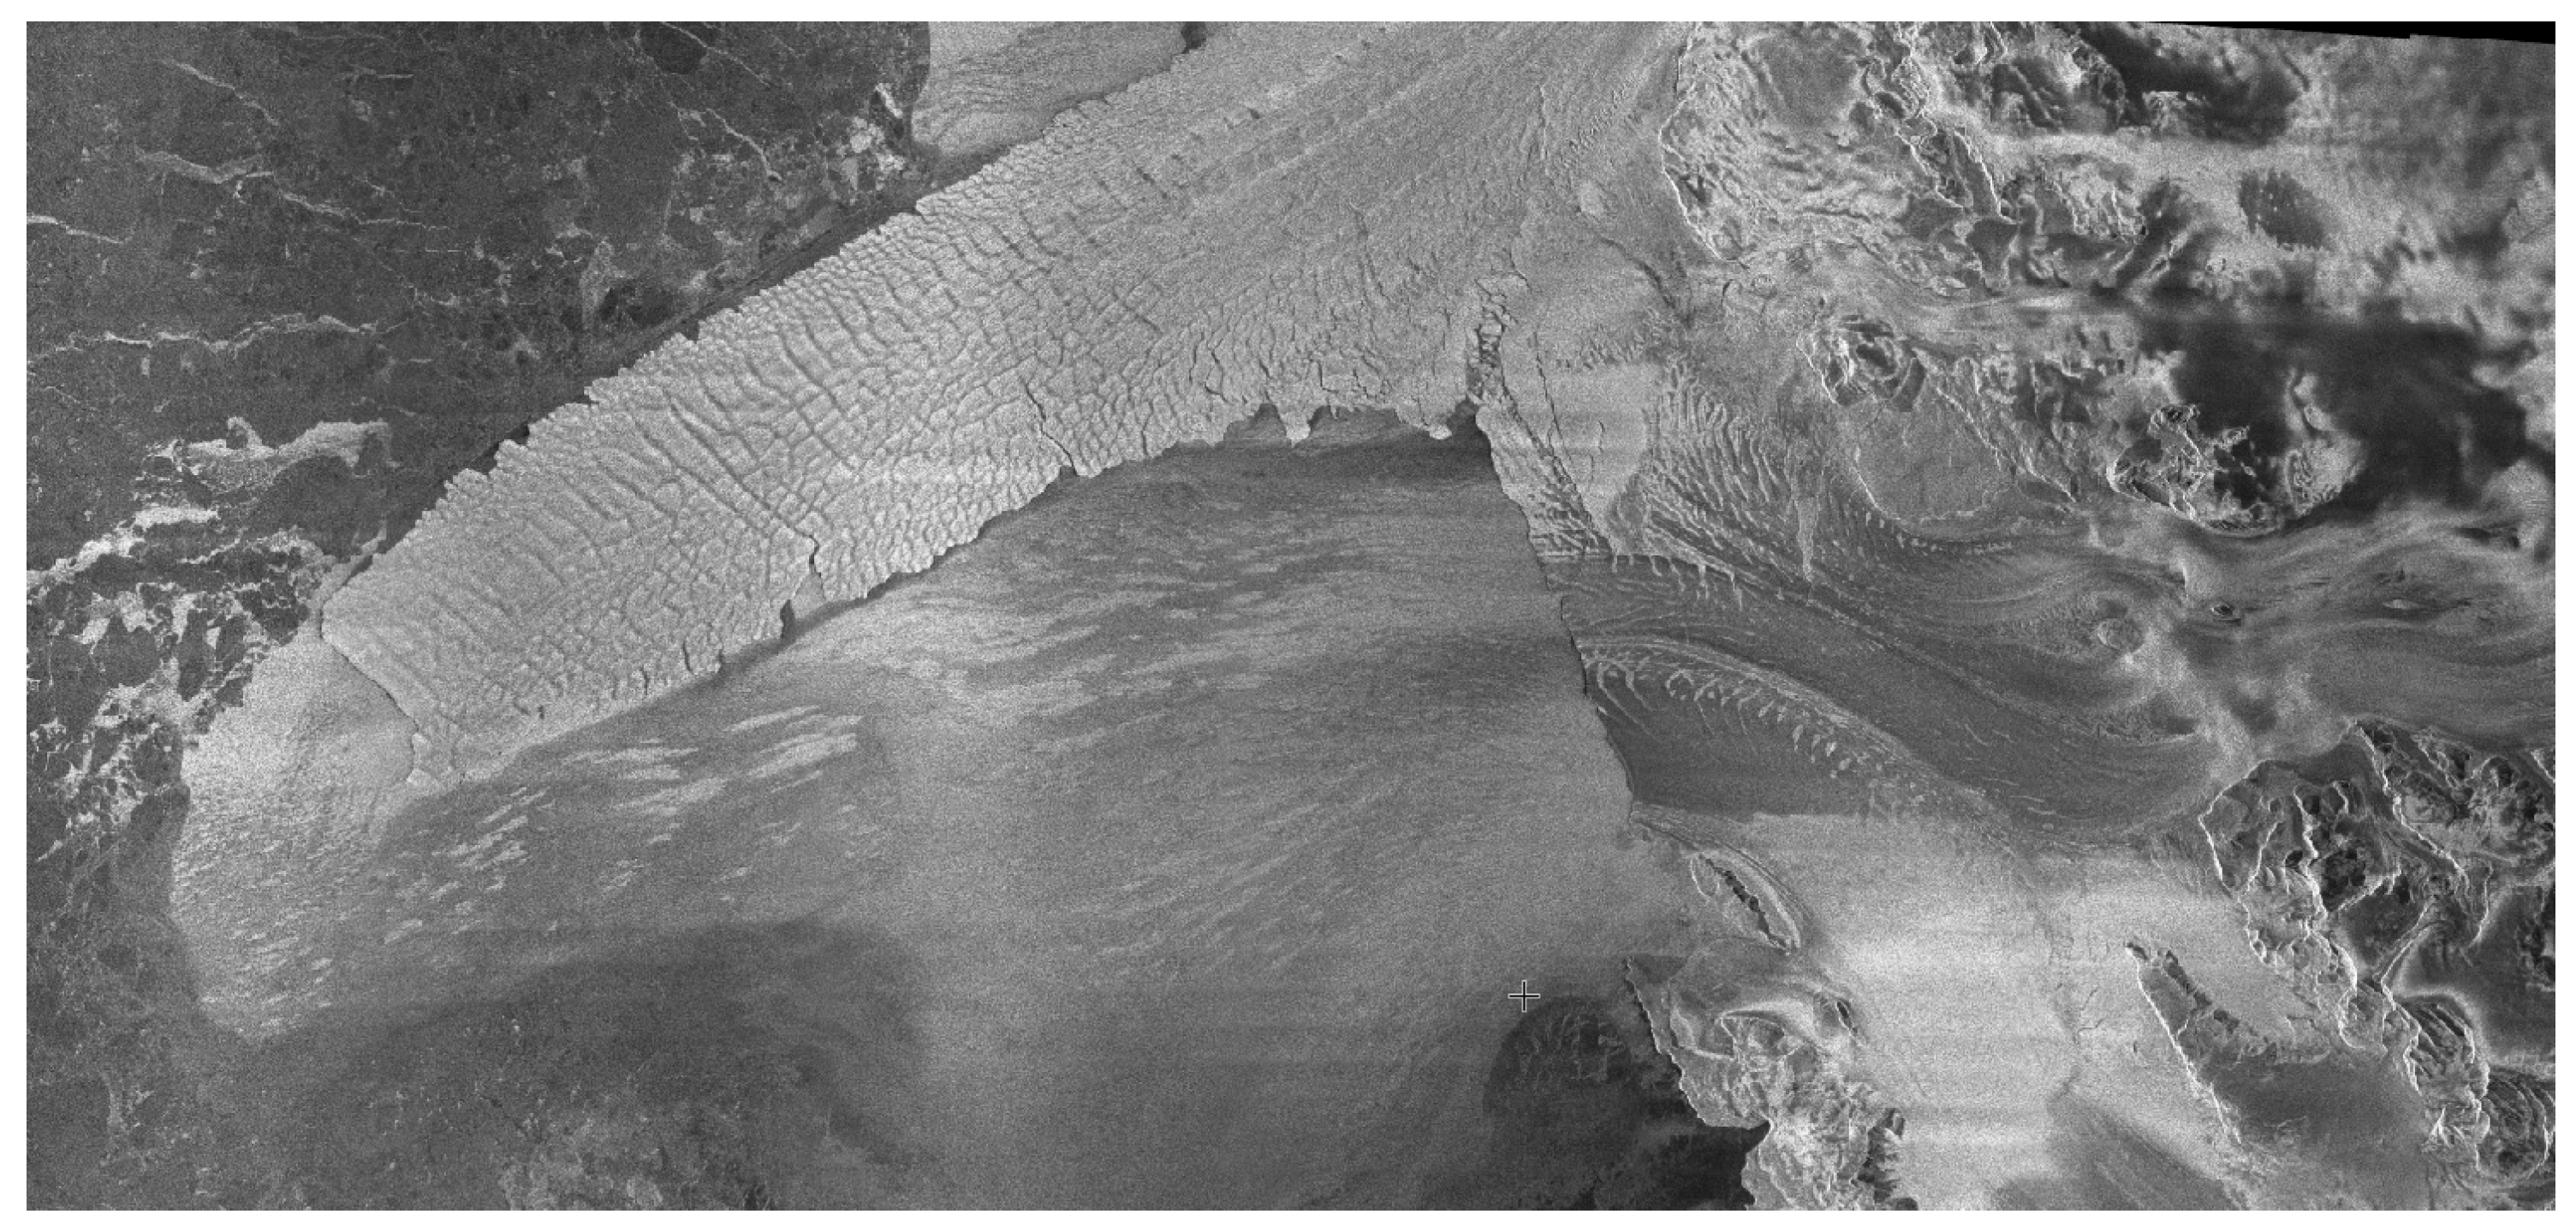
The depletion of the Antarctic ice sheet, a significant source of Earth’s freshwater, contributes directly to the increase in global sea levels and the freshening of the Southern Ocean. Research using observations and simulations has shown that the melting of ice shelves at their base, caused by the penetration of warm water onto the continental shelf of Antarctica, has a crucial impact on the overall mass equilibrium of the ice sheet. Antarctic glacial tongue is observed by SAR system at March, 2024. With a width of 350km x 200km, the scene can completely cover the Antarctic ice tongue. From the results in the figure, we can see the shape of the ice tongue, which can further study the melting state of Antarctic ice and snow.
5. Conclusions
In this study, a Ku-band spaceborne Synthetic Aperture Radar payload is proposed for the first time in the world. The payload weighs less than 80kg and features a flat low-profile design integrated with the Taijing-4 03 satellite. This design allows for the potential establishment of a future constellation where multiple satellites can be launched simultaneously. The payload offers light weight, low profile, high resolution, and various operation modes, making it highly promising for applications. The Taijing-4 03 satellite was successfully launched on January 23, 2024, equipped with the Ku-band SAR payload. In orbit, the SAR system has captured a large number of high-quality images with a resolution exceeding 1m and a coverage width of up to 200km. Its capabilities extend to high-resolution emergency observation of hot spots as well as wide-area information acquisition in areas such as forests, oceans, and polar regions.
Acknowledgments
This work was supported by the National Key Research and Development Program of China (2018YFB202202503), the Shenzhen Science and Technology Plan Project of China (JSGG20190823094603691).
References
- Moreira, A.; Prats-Iraola, P.; Younis, M.; Krieger, G.; Hajnsek, I.; Papathanassiou, K.P. A tutorial on synthetic aperture radar. IEEE Geoscience and remote sensing magazine 2013, 1, 6–43. [Google Scholar] [CrossRef]
- Deng, Y.; Zhang, H.; Fan, H.; others. Forthcoming development trend of spaceborne SAR technology for earth environment monitoring. Chinese Space Science and Technology 2023, 43, 32–46. [Google Scholar]
- Li, D.; Wang, M.; Guo, H.; Jin, W. On China’s earth observation system: mission, vision and application. Geo-spatial Information Science 2024, 1–19. [Google Scholar] [CrossRef]
- WEi, Y.; Xigang, L.; Hongxing, Dang ang Jiang, W.; Baohua, S.; Yanming, L. High precision INSAR system design for tethered satellite system. Space Electronic Technology 2023, 20, 99–104. [Google Scholar]
- Younis, M.; Huber, S.; Patyuchenko, A.; Bordoni, F.; Krieger, G. Performance comparison of reflector-and planar-antenna based digital beam-forming SAR. International Journal of Antennas and Propagation 2009, 2009, 614931. [Google Scholar] [CrossRef]
- Patyuchenko, A.; Younis, M.; Huber, S.; Krieger, G. Optimization aspects of the reflector antenna for the digital beam-forming SAR system. 8th European Conference on Synthetic Aperture Radar. VDE, 2010, pp. 1–4.
- Wei, Y.; Xu, Y.; Jia, S.; Fan, F.; Hongxing, D.; Xiaomin, T. An airborne demonstration for high-resolution wide-swath spaceborne reflector SAR systems. 2017 2nd International Conference on Frontiers of Sensors Technologies (ICFST). IEEE, 2017, pp. 350–353.
- Castelletti, D.; Farquharson, G.; Stringham, C.; Duersch, M.; Eddy, D. Capella space first operational SAR satellite. 2021 IEEE International Geoscience and Remote Sensing Symposium IGARSS. IEEE, 2021, pp. 1483–1486.
- Stringham, C.; Farquharson, G.; Castelletti, D.; Quist, E.; Riggi, L.; Eddy, D.; Soenen, S. The capella X-band SAR constellation for rapid imaging. IGARSS 2019-2019 IEEE International Geoscience and Remote Sensing Symposium. IEEE, 2019, pp. 9248–9251.
- Castelletti, D.; Farquharson, G.; Brown, J.; De, S.; Yague-Martinez, N.; Stringham, C.; Yalla, G.; Villarreal, A. Capella space VHR SAR constellation: advanced tasking patterns and future capabilities. IGARSS 2022-2022 IEEE International Geoscience and Remote Sensing Symposium. IEEE, 2022, pp. 4137–4140.
- Cazcarra-Bes, V.; Busquier, M.; Lopez-Sanchez, J.M.; Duersch, M.; De, S.; Stringham, C.; Castelleti, D. Assessment of Multi-Temporal Capella SAR Data for Change Detection and Crop Monitoring. IGARSS 2023-2023 IEEE International Geoscience and Remote Sensing Symposium. IEEE, 2023, pp. 3410–3413.
- Patel, N. Open Source Data Programs From Low-Earth Orbit Synthetic Aperture Radar Companies: Questions and answers [Industry Profiles and Activities]. IEEE Geoscience and Remote Sensing Magazine 2023, 11, 171–C3. [Google Scholar] [CrossRef]
- Arai, K.; Nakaoka, Y.; Okumura, H. Method for Disaster Area Detection with Just One SAR Data Acquired on the Day After Earthquake Based on YOLOv8. International Journal of Advanced Computer Science & Applications 2024, 15. [Google Scholar]
- Xiong, Y.; Hu, W.; Liu, M.; Yao, W.; Wang, G.; Ge, R. Design and Analysis of an Umbrella Deployable Antenna for Space-Borne SAR. 2023 4th China International SAR Symposium (CISS). IEEE, 2023, pp. 1–7.
- Muff, D.; Ignatenko, V.; Dogan, O.; Lamentowski, L.; Leprovost, P.; Nottingham, M.; Radius, A.; Seilonen, T.; Tolpekin, V. The ICEYE constellation-some new achievements. 2022 IEEE Radar Conference (RadarConf22). IEEE, 2022, pp. 1–4.
- Ignatenko, V.; Nottingham, M.; Radius, A.; Lamentowski, L.; Muff, D. Iceye microsatellite sar constellation status update: Long dwell spotlight and wide swath imaging modes. 2021 IEEE International Geoscience and Remote Sensing Symposium IGARSS. IEEE, 2021, pp. 1493–1496.
- Ignatenko, V.; Dogan, O.; Muff, D.; Lamentowski, L.; Radius, A.; Nottingham, M.; Leprovost, P.; Seilonen, T. ICEYE microsatellite SAR constellation status update: spotlight extended area mode, daily coherent ground tracks and waveform diversity. IGARSS 2022-2022 IEEE International Geoscience and Remote Sensing Symposium. IEEE, 2022, pp. 4145–4148.
- Kim, B.K.; Kim, W.; Lee, C.; Yoo, M.; Lee, I. Validating Railway Infrastructure Deformation Monitoring: A Comparative Analysis of Field Data and TerraSAR-X PS-InSAR Results. KSCE Journal of Civil Engineering 2024, 28, 1777–1786. [Google Scholar] [CrossRef]
- Bachmann, M.; Bojarski, A.; Böer, J.; Buckreuss, S.; Grigorov, C.; Hajnsek, I.; Kahle, R.; Kraus, T.; Klenk, P.; Müller, K.; others. TerraSAR-X and TanDEM-X After 13 Years of Joint SAR and DEM Mission. IGARSS 2023-2023 IEEE International Geoscience and Remote Sensing Symposium. IEEE, 2023, pp. 1325–1328.
- Schandri, M.; Kraus, T.; Al-Hourani, A.; Hendy, N.; Kurnia, F.; Bachmann, M. Analysis of Radio Frequency Interferences in TerraSAR-X Products. Proceedings of the European Conference on Synthetic Aperture Radar, EUSAR, 2024.
- D’Errico, M.; Graziano, M.D. Observation Frequency Analysis for Multiconstellation Radar Systems over the Mediterranean Sea. International Journal of Aerospace Engineering 2023, 2023, 3209006. [Google Scholar] [CrossRef]
- Nunziata, F.; Inserra, G.; Buono, A.; Marino, A.; Virelli, M.; Migliaccio, M. Analysis of Full-Polarimetric SAR Measurements Collected in the Intertidal Area of Solway Firth by Cosmo-Skymed 2nd Generation Mission. IGARSS 2023-2023 IEEE International Geoscience and Remote Sensing Symposium. IEEE, 2023, pp. 1293–1296.
- Virelli, M.; Coletta, A.; Tapete, D.; Cigna, F. COSMO-SkyMed: A satellite tool for monitoring cultural heritage. The International Archives of the Photogrammetry, Remote Sensing and Spatial Information Sciences 2023, 48, 1621–1627. [Google Scholar] [CrossRef]
- Wei, Y.; Hongxing, D.; Xiaomin, T. A Beam Optimization Technique for Space-borne Phased Array SAR. 2023 16th UK-Europe-China Workshop on Millimetre Waves and Terahertz Technologies (UCMMT). IEEE, 2023, Vol. 1, pp. 1–3.
|
Disclaimer/Publisher’s Note: The statements, opinions and data contained in all publications are solely those of the individual author(s) and contributor(s) and not of MDPI and/or the editor(s). MDPI and/or the editor(s) disclaim responsibility for any injury to people or property resulting from any ideas, methods, instructions or products referred to in the content. |
© 2024 by the authors. Licensee MDPI, Basel, Switzerland. This article is an open access article distributed under the terms and conditions of the Creative Commons Attribution (CC BY) license (http://creativecommons.org/licenses/by/4.0/).
