Preprint
Article

Identification of Reliable Reference Genes for Use in Gene Expression Studies in Rat Febrile Seizure Model

Altmetrics

Downloads

99

Views

48

Comments

0

A peer-reviewed article of this preprint also exists.

  † These authors contributed equally to this work.

This version is not peer-reviewed

Submitted:

28 August 2024

Posted:

29 August 2024

You are already at the latest version

Alerts
Abstract
The study of the pathogenesis of febrile seizures and their consequences frequently necessitates gene expression analysis. The primary methodology employed for such analysis is reverse transcription with quantitative polymerase chain reaction (RT-qPCR). To guarantee the accuracy of data obtained by RT-qPCR, it is crucial to utilize stably expressed reference genes. The objective of this study was to identify the most suitable reference genes for use in the analysis of mRNA production in various brain regions of rats following prolonged neonatal febrile seizures. The expression stability of eight housekeeping genes was evaluated using the online tool RefFinder in the dorsal and ventral hippocampal regions and in the temporal and medial prefrontal cortex of the brain. The Ppia gene exhibited the greatest stability of expression. Conversely, the genes with the least stable expression level are Actb and Ywhaz; thus, it is not recommended to use them for normalization in a febrile seizure model. Additionally, the majority of housekeeping genes demonstrate age-related, region-specific fluctuations. Therefore, it is crucial to employ the appropriate housekeeping genes for each brain structure under investigation when examining the expression dynamics of genes of interest in a febrile seizure model.
Keywords: 
Subject: Biology and Life Sciences  -   Neuroscience and Neurology

1. Introduction

Febrile seizures represent the most prevalent form of childhood seizure, occurring between the ages of six months and five years [1]. Approximately 30% of seizures are prolonged, lasting more than 15 minutes. Such seizures have the potential to induce irreversible alterations in the developing brain, thereby elevating the probability of developing temporal lobe epilepsy in adulthood [2,3]. In addition to the epileptic process occurring in the brain, febrile seizures have been linked to the onset of subsequent neuropsychiatric disorders and cognitive impairment [4]. Nevertheless, the underlying mechanisms of pathological changes resulting from febrile seizures remain poorly understood.
A variety of experimental models have been employed to examine the pathogenesis of febrile seizures, the subsequent development of epilepsy and the potential for neuropsychiatric complications. One validated model of febrile convulsions is the heating of 10-11-day-old rats with warm air [5]. In this model, animals develop a prolonged convulsive seizure, which can lead to alterations in the expression of a number of genes. Reverse transcription followed by quantitative polymerase chain reaction (RT-qPCR) is a widely employed methodology for the analysis of gene expression in a range of experimental models. The accurate normalization of data is essential for the successful implementation of a qualitative gene expression analysis, and this process requires the application of stably expressed reference genes [6]. The use of unstable housekeeping genes as reference genes may impact the precision of the relative expression estimation of the genes of interest, potentially leading to erroneous and inconsistent results [7,8,9,10,11]. The stability of expression of commonly used housekeeping genes may vary considerably depending on the experimental model, therefore it is desirable to ascertain the stability of reference genes for specific experimental conditions. In order to ensure the reliability of the results, it is essential that the set of housekeeping genes included in the test comprises a minimum of eight genes. [12]. In the present study, eight housekeeping genes that are most commonly employed as reference genes were selected for analysis [6]: Actb (beta-actin), Gapdh (glyceraldehyde-3-phosphate dehydrogenase), B2m (beta-2 microglobulin), Rpl13a (ribosomal protein L13A), Ppia (peptidylprolyl isomerase A), Hprt1 (hypoxanthine phosphoribosyltransferase 1), Pgk1 (phosphoglycerate kinase 1), Ywhaz (tyrosine-3-monooxygenase/tryptophan-5-monooxygenase activation protein).
The expression of housekeeping genes can be modified in response to alterations in experimental conditions [13]. Furthermore, the onset of febrile seizures occurs at an early developmental stage when the brain is still undergoing maturation [14]. The expression of housekeeping genes may also change with advancing age; however, the age-related dynamics of their expression have not been previously investigated. This study aimed to assess the stability of gene expression in a panel of housekeeping genes across various brain regions in rats following prolonged neonatal febrile seizures. It is known that specific regions of the brain are more susceptible to damage than others in the event of a seizure. In particular, vulnerable structures include the dorsal and ventral hippocampus, as well as the temporal and medial prefrontal cortex [15,16,17]. The present study investigated the aforementioned brain regions.

2. Results

2.1. Time-Dependent Stability of Reference Gene Expression in Intact Rats

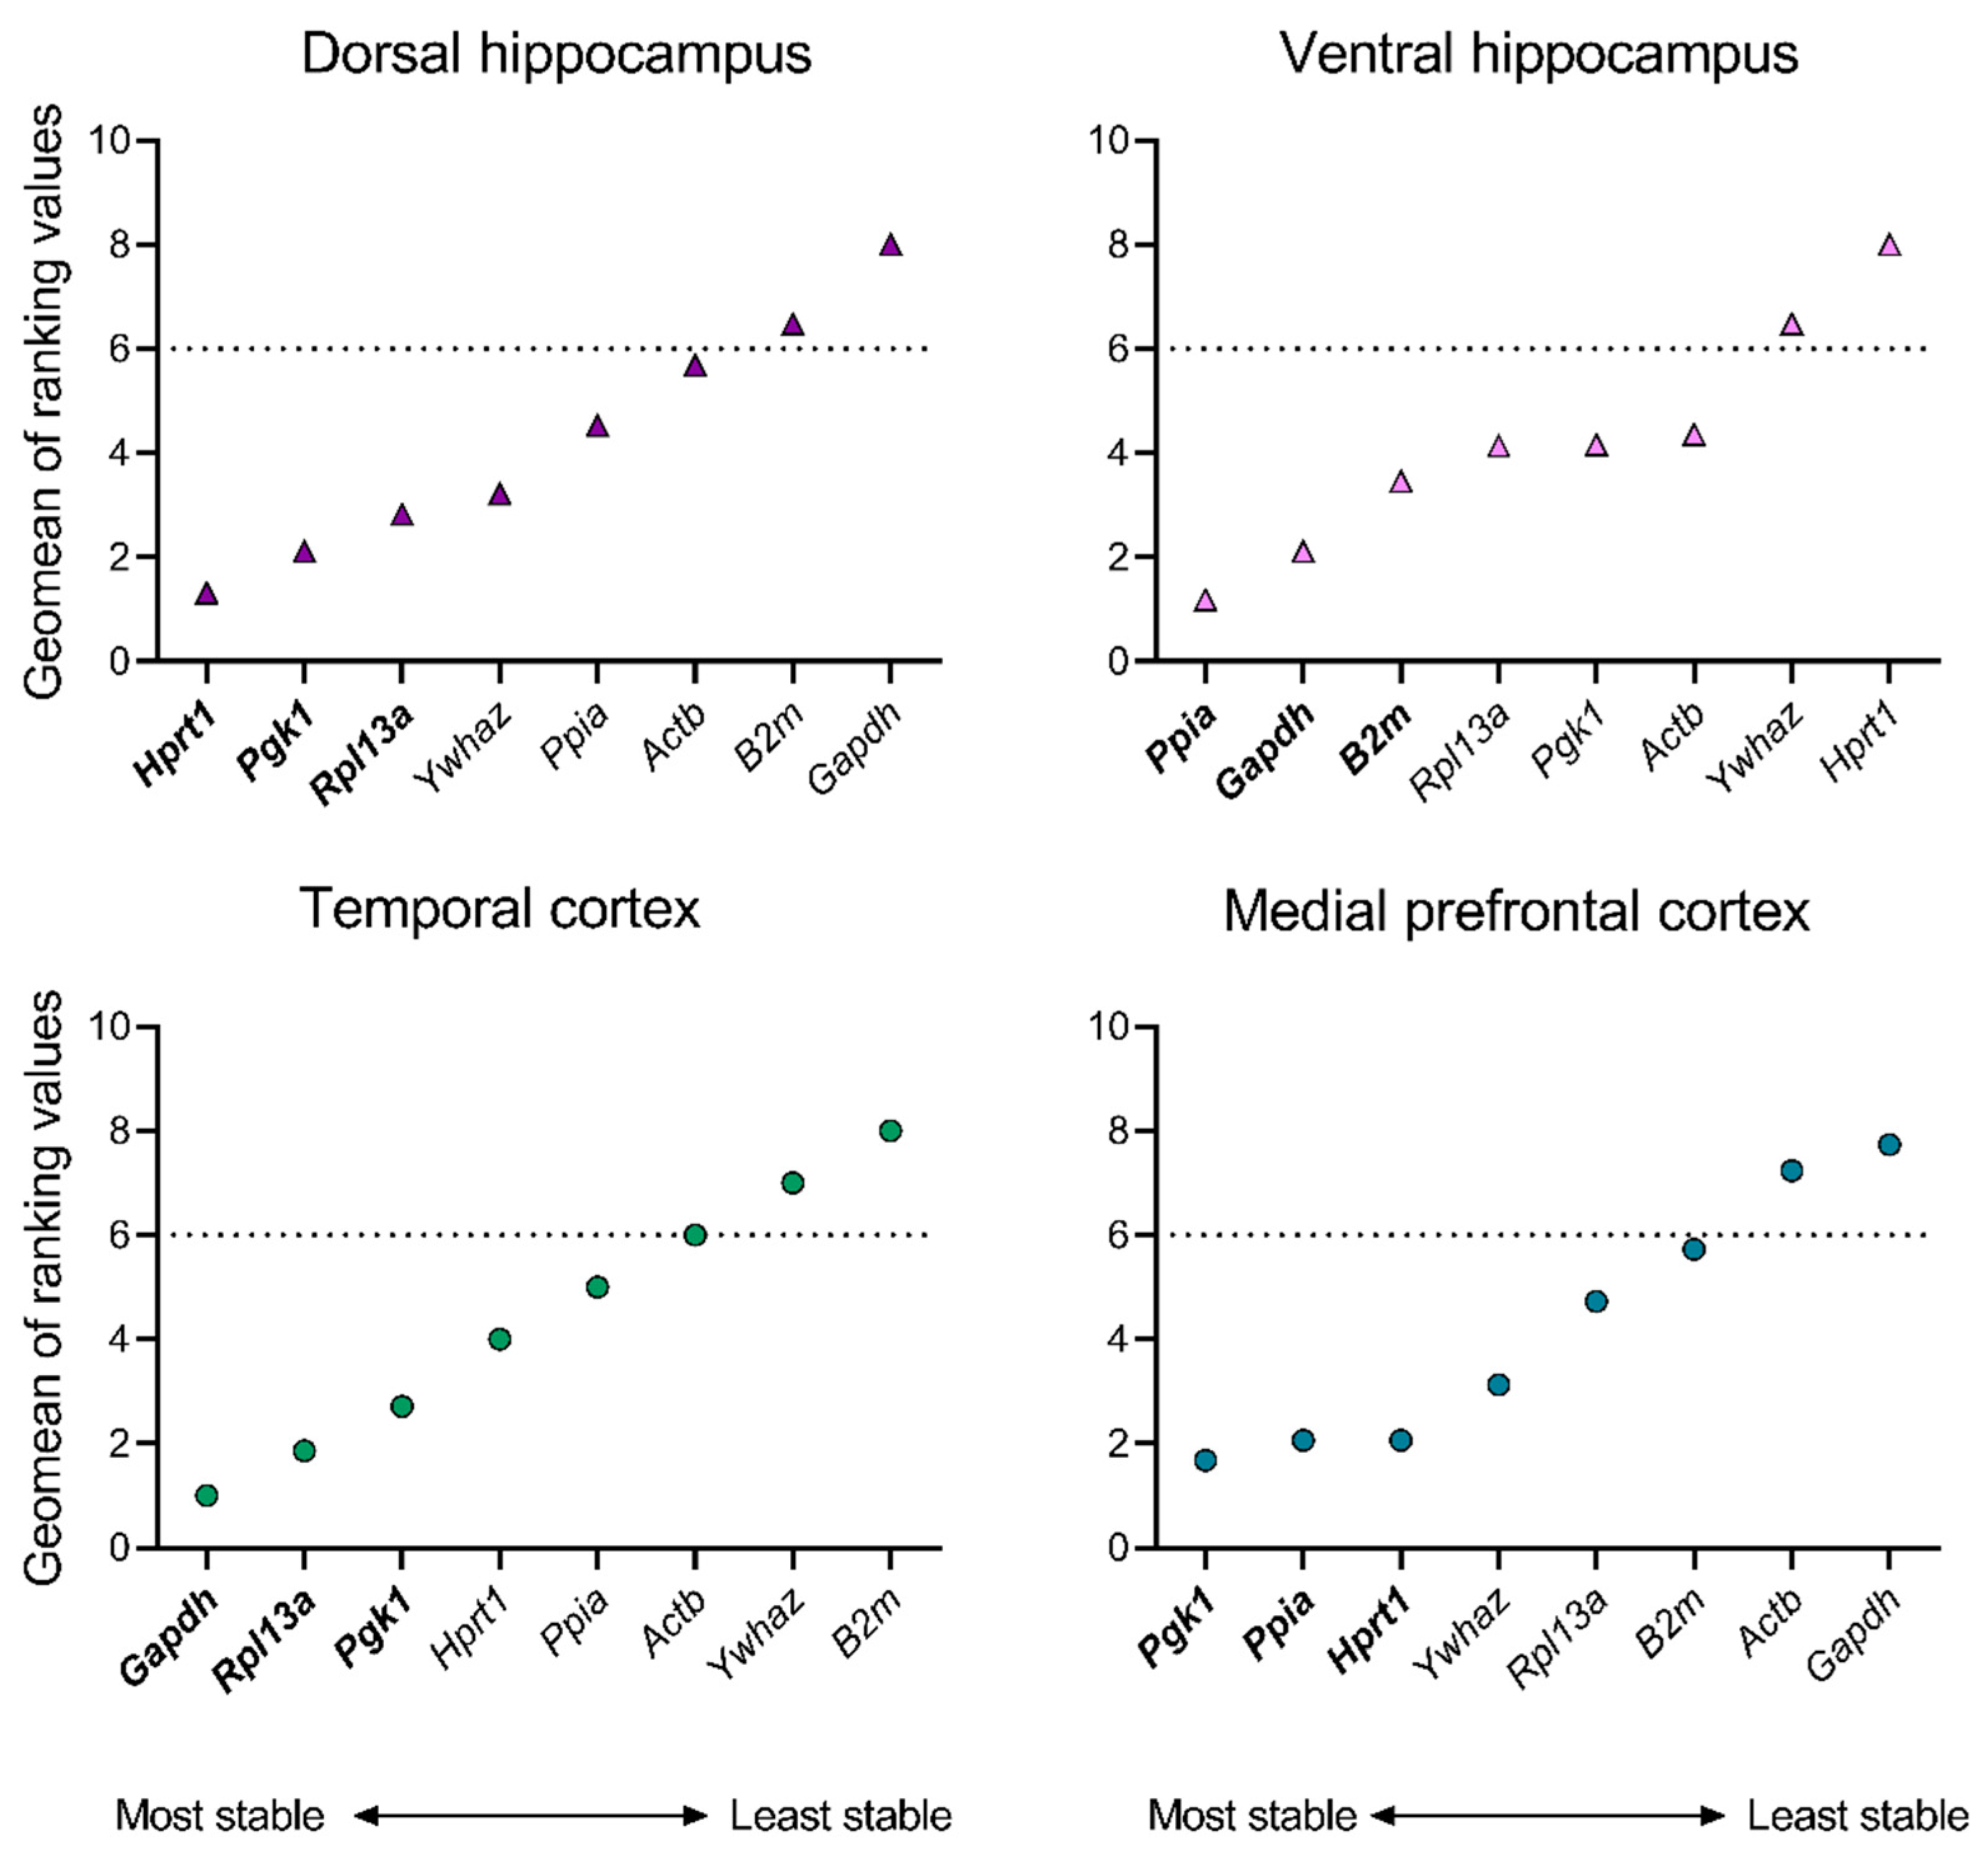
Firstly, the expression stability of eight housekeeping genes was evaluated in the brains of intact rats to eliminate the potential influence of age on the mRNA production stability of the reference genes. Analysis was performed in four brain structures of rats at P14, P21, and P50. The RefFinder® comprehensive ranking, which is based on the calculation of stability indices using four mathematical algorithms, revealed a disparate distribution of housekeeping genes with regard to their expression stability across different structures (Figure 1). Thus, the most stable genes in the dorsal hippocampus were Hprt1, Pgk1, and Rpl13a, in the ventral hippocampal region – Ppia, Gapdh, and B2m, in the temporal cortex – Gapdh, Rpl13a, and Pgk1, and in the medial prefrontal cortex – Pgk1, Ppia, and Hprt1 (Appendix A Table A1, Table A2, Table A3 and Table A4).
As a subsequent step, in order to exclude genes with less stable expression patterns with age from further analysis, we selected a threshold of a sufficient stability index, representing at least 75% of the maximum value of the geometric mean of the ranking. In this case, this value corresponds to index 6. Therefore, the gene expression data for the following genes were excluded from subsequent analyses: B2m and Gapdh (dorsal hippocampus), Ywhaz and Hprt1 (ventral hippocampus), Ywhaz and B2m (temporal cortex), and Actb and Gapdh (medial prefrontal cortex).

2.2. Determination of Reference Gene Expression Stability in Different Regions of the Rat Brain in the Febrile Seizure Model

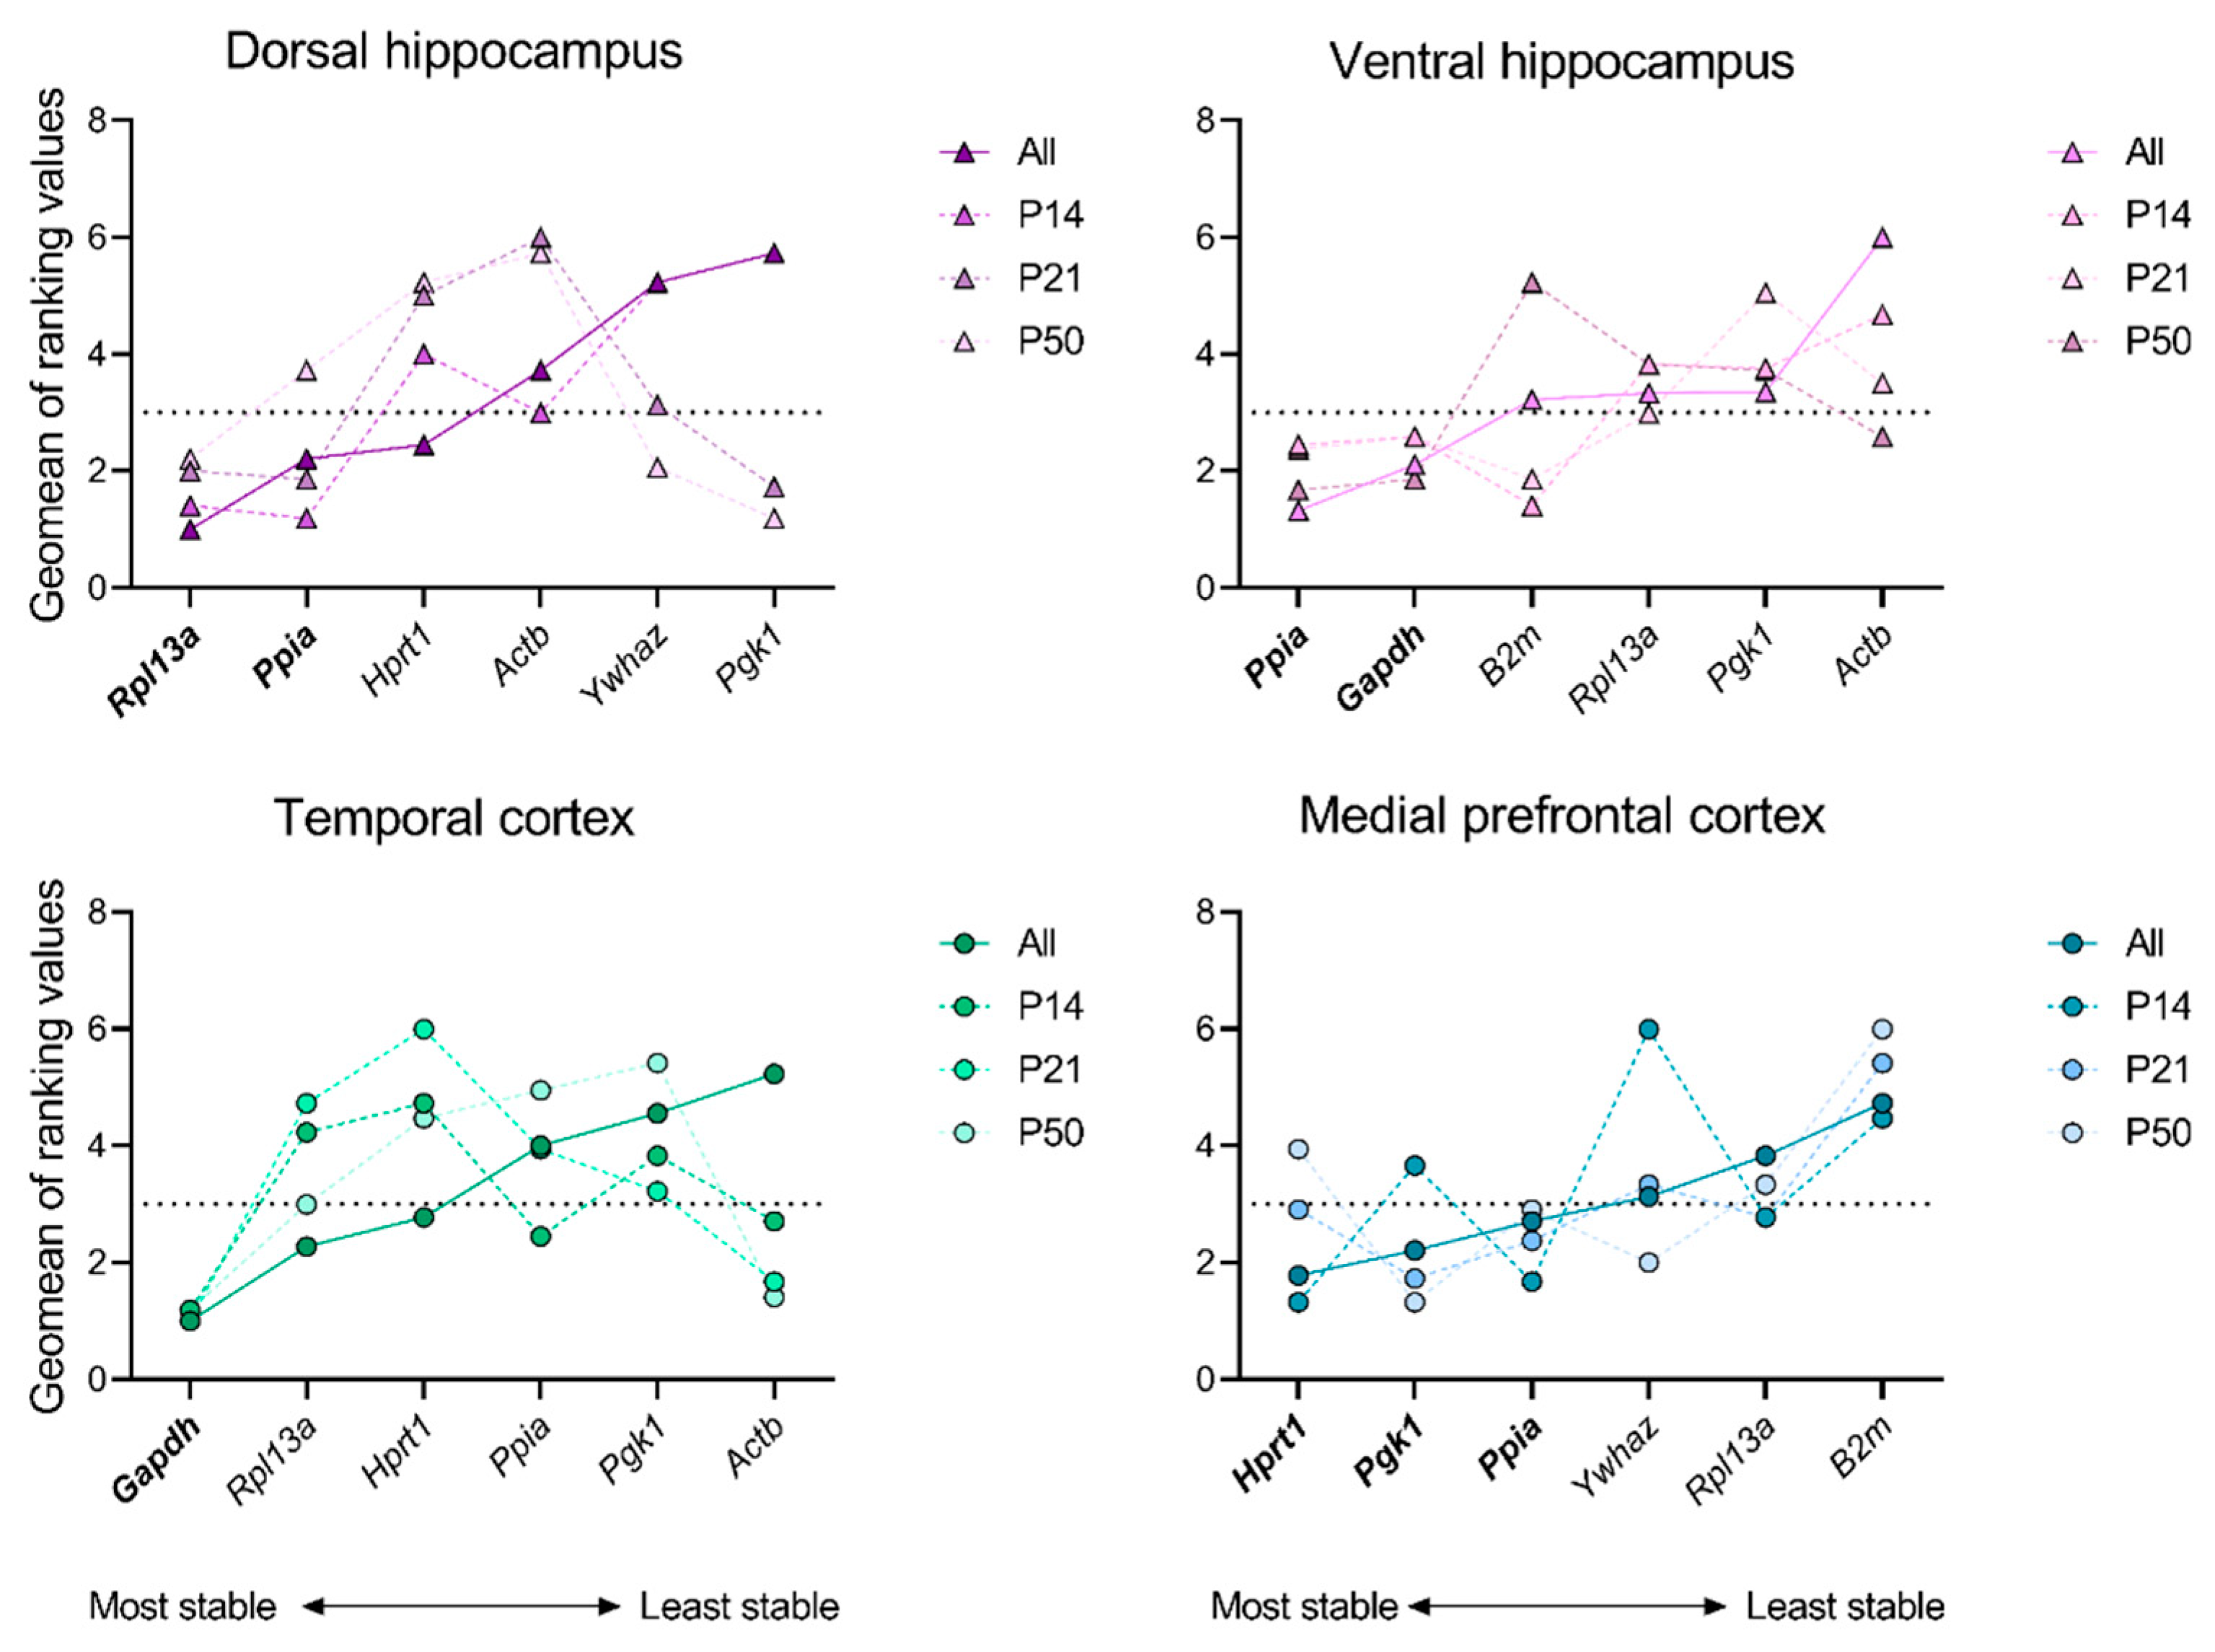
In the next phase of the study, we conducted analyses on each individual rat brain structure at ages P14, P21 and P50 in the febrile seizure model, as well as on all ages simultaneously. In this step, to select the most stable gene, we chose an index equal to 3 as the maximum allowable geometric mean of the ranking. Furthermore, in order to ascertain the stability of mRNA production in the model, it is essential that the index value for each gene in a minimum of three instances of the analysis is found to be below the acceptable threshold. Therefore, the set and number of stably expressed genes differed between the regions under investigation (Figure 2; Appendix A Table A5, Table A6, Table A7 and Table A8). The medial prefrontal cortex was found to exhibit the stable expression of three genes (Hprt1, Pgk1, Ppia); two stable genes were identified in the dorsal and ventral hippocampus (Rpl13a, Ppia and Ppia, Gapdh, respectively), while only one stable gene (Gapdh) was detected in the temporal cortex. The Ppia gene was found to be the most stable in three of the four examined structures: the medial prefrontal cortex, the dorsal and ventral hippocampus. However, in the temporal cortex, it was identified as one of the least stable genes.

2.3. Alterations in the Expression of Unstably Expressed Housekeeping Genes in the Febrile Seizure Model

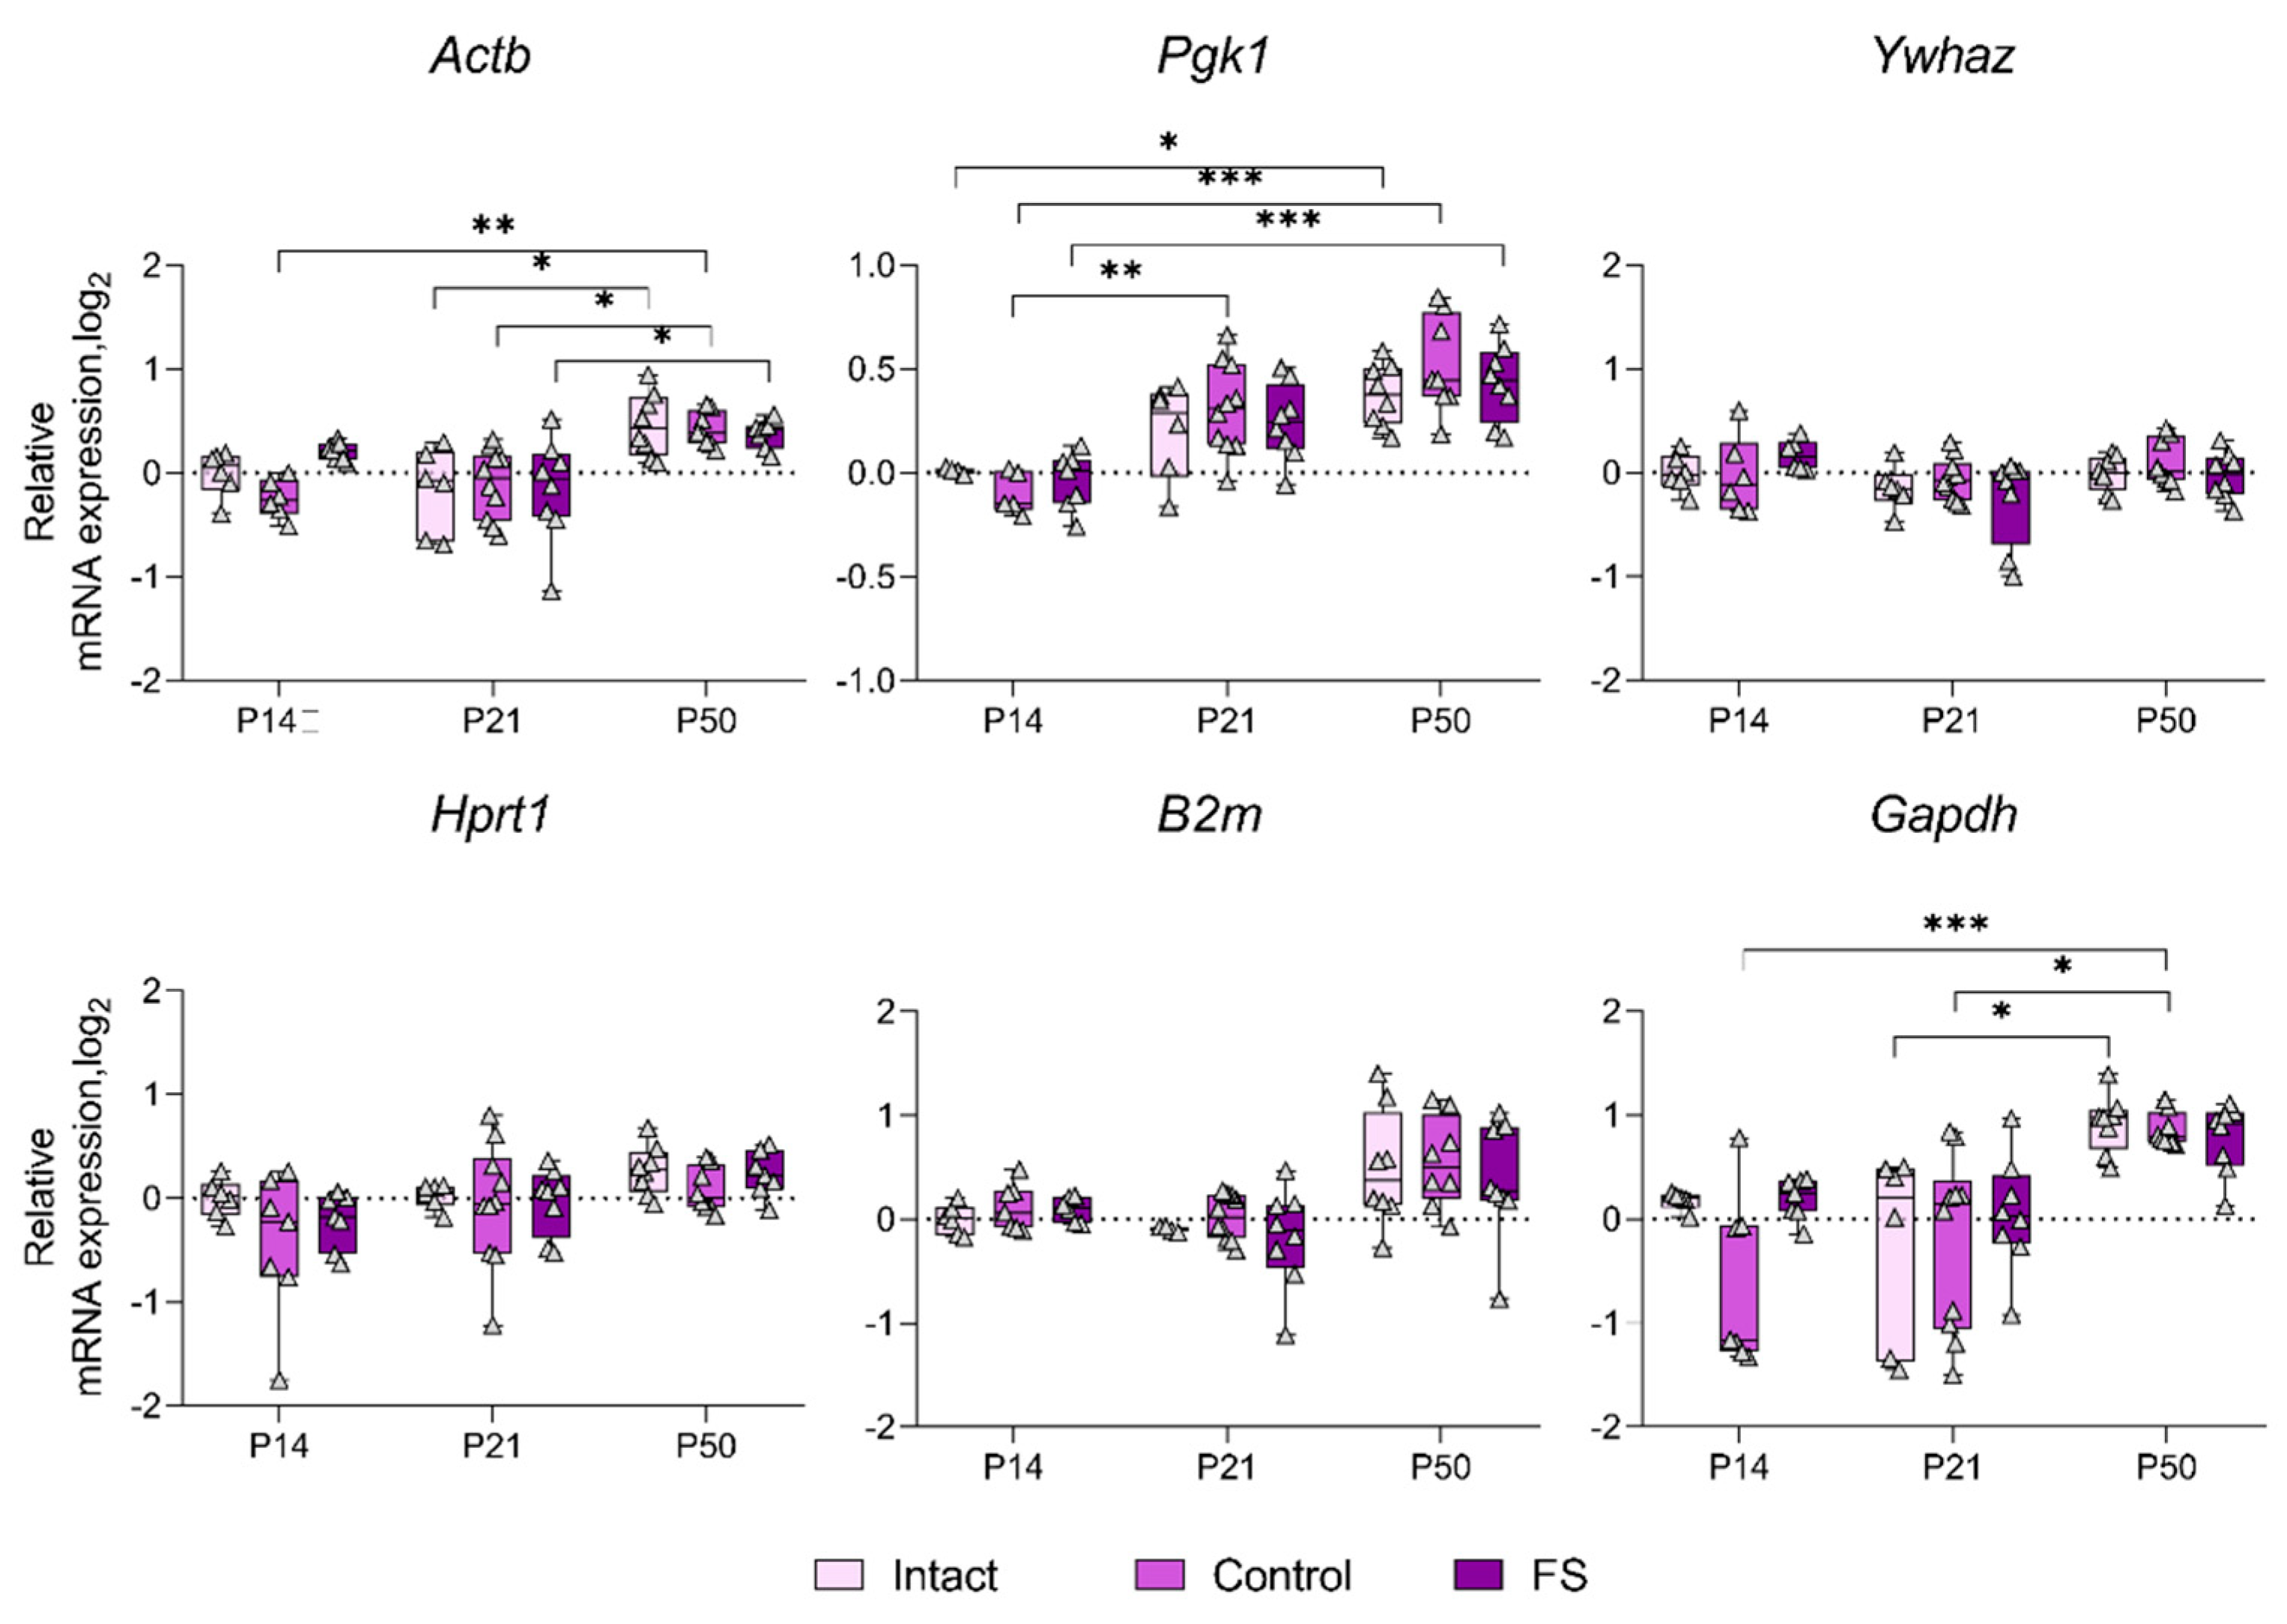
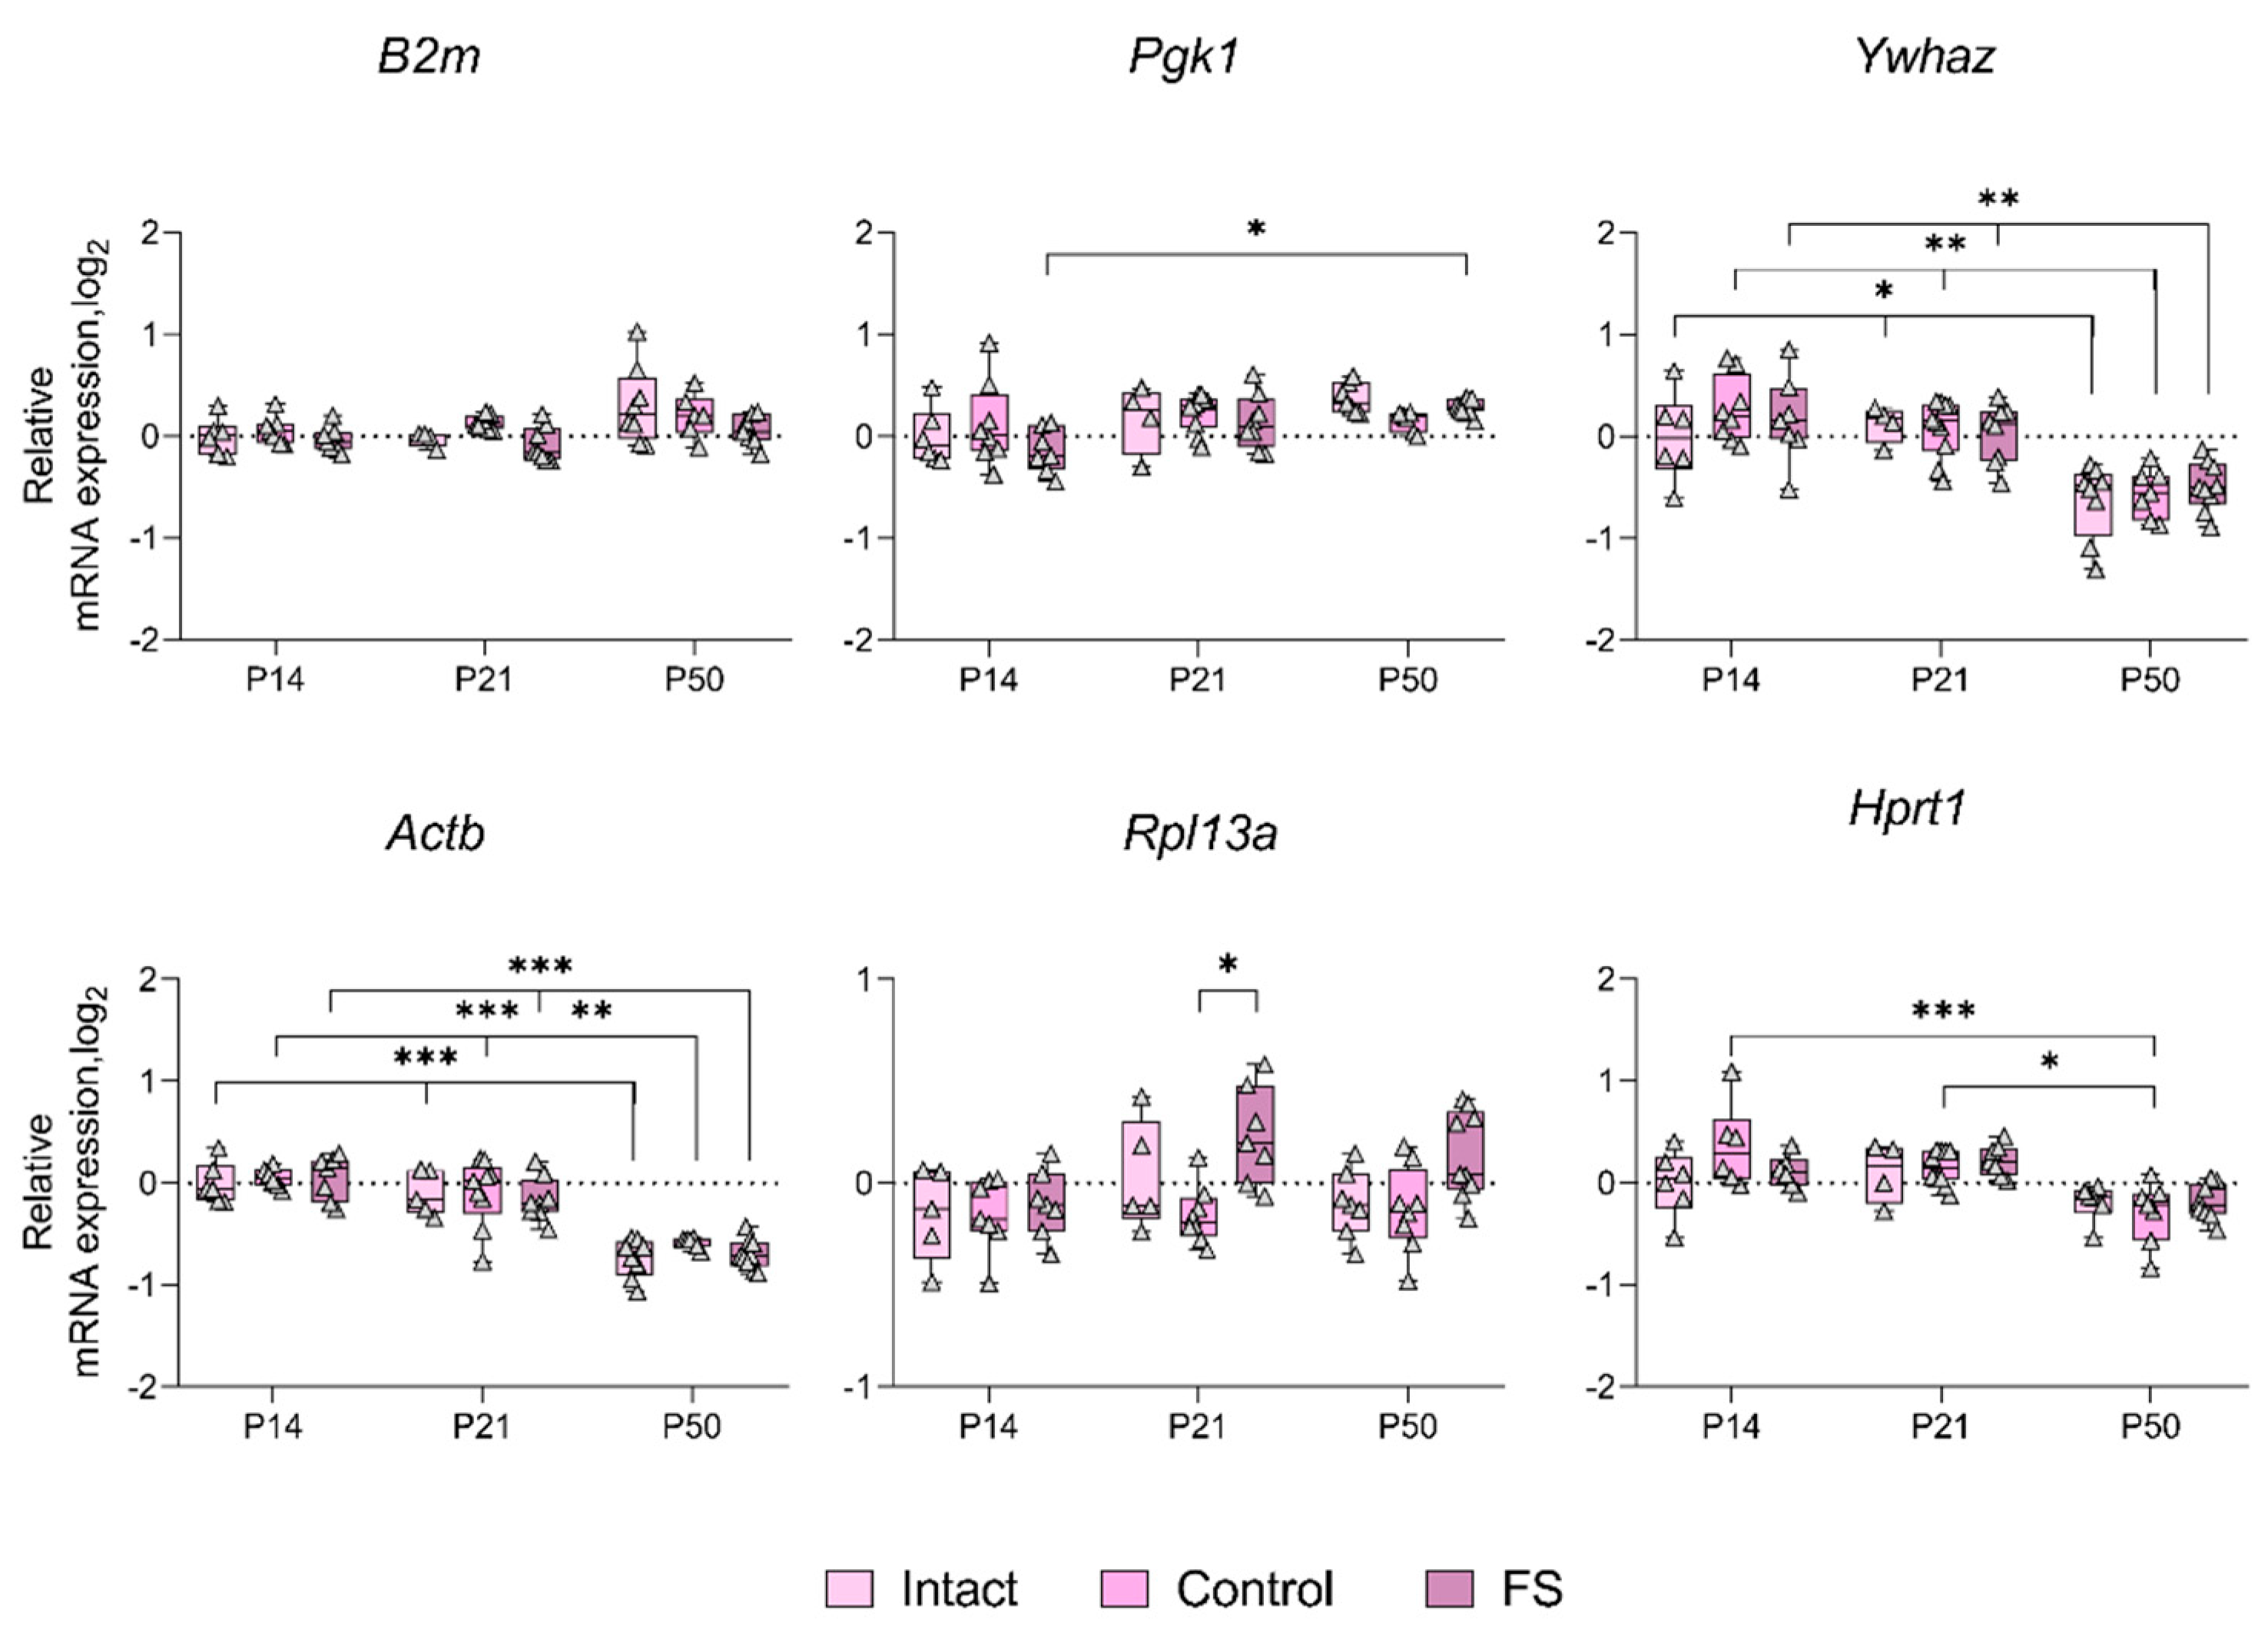
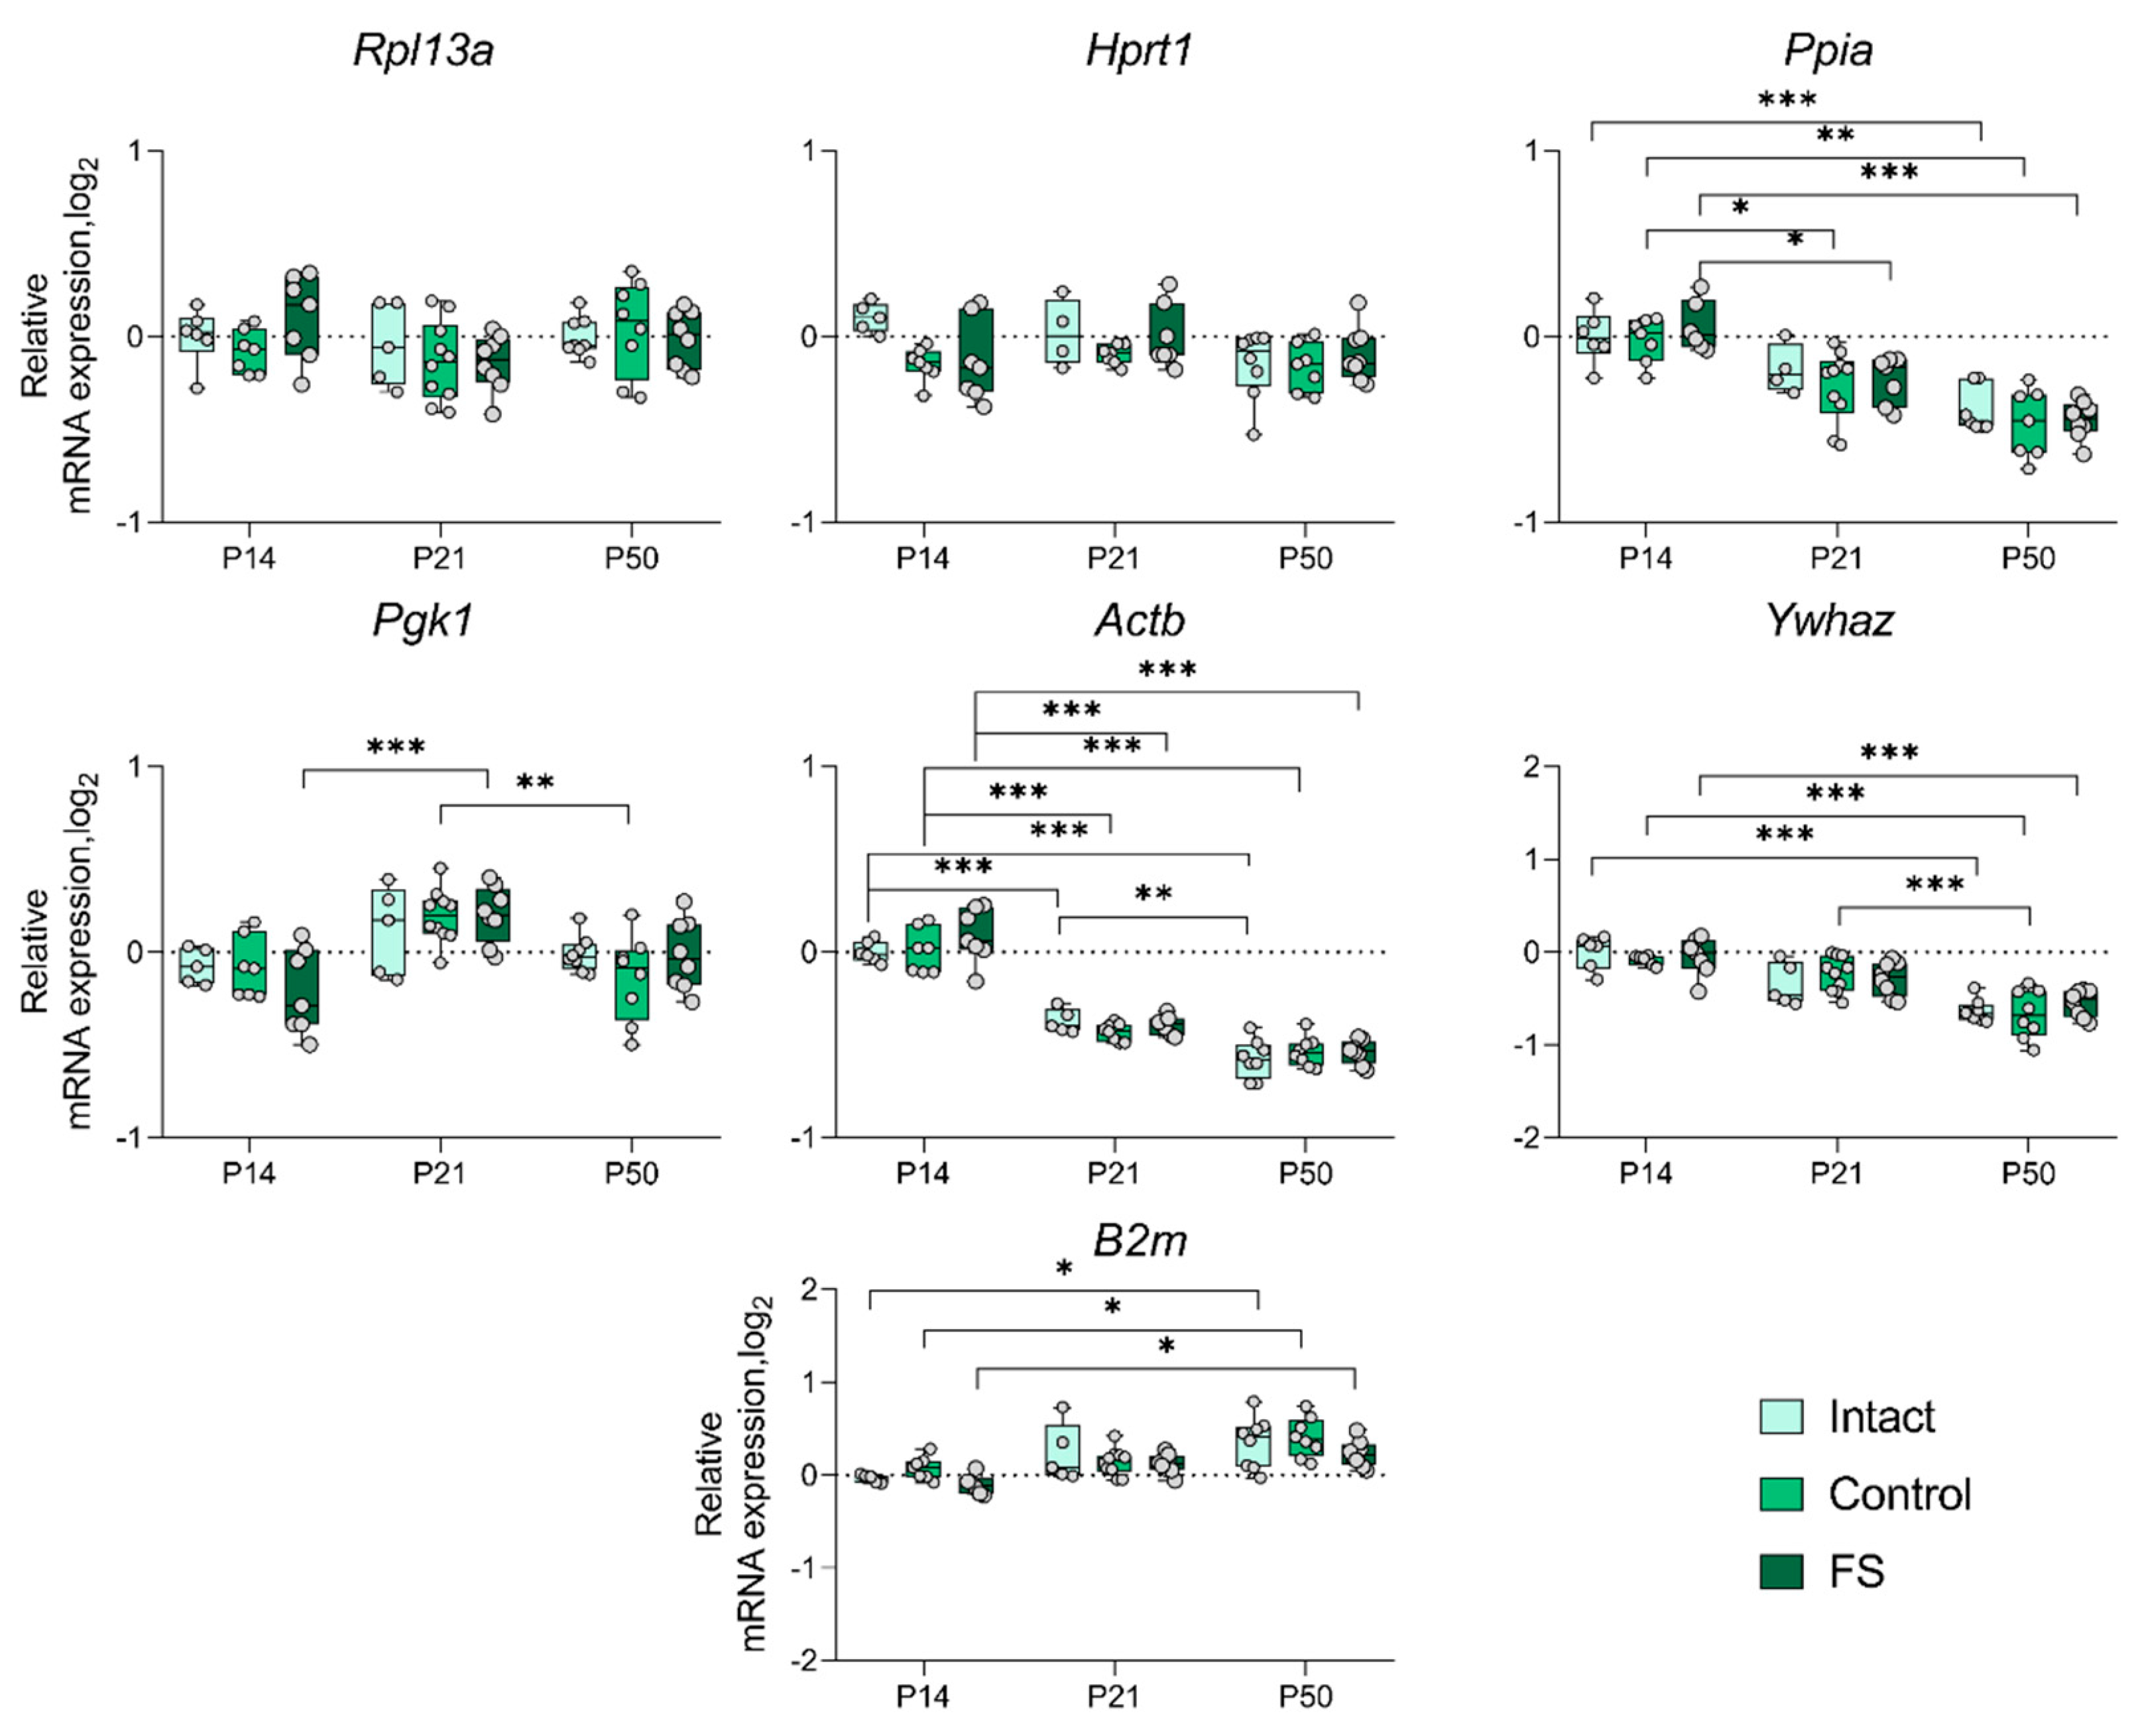
We proceeded to ascertain whether there was a statistically significant alteration in the expression of genes whose production was most unstable in individual brain structures in the febrile seizure model (Figure 3, Figure 4, Figure 5 and Figure 6). The Rpl13a gene was found to be overexpressed in rats with febrile seizures only in the ventral hippocampus and medial prefrontal cortex (Figure 4 and Figure 6). Given these findings, it is not advisable to use this gene to study these brain regions in a febrile seizure model.
Age-related changes in mRNA production of various genes to P50 were detected in all structures examined. In particular, decreased Ywhaz expression was revealed in the ventral hippocampus, temporal and medial prefrontal cortex (Figure 5 and Figure 6). The alterations in Actb mRNA production exhibited multidirectional patterns across different structures. Notably, we found elevated expression of this gene in dorsal hippocampus and diminished expression in ventral hippocampus, temporal, and medial prefrontal cortex (Figure 3, Figure 4, Figure 5 and Figure 6). An increase in Pgk1 gene expression was observed in the dorsal and ventral hippocampus (Figure 3 and Figure 4). B2m mRNA production was elevated in the temporal and medial prefrontal cortex (Figure 5 and Figure 6). In addition, the following changes were revealed: increased mRNA production of Gapdh in the dorsal hippocampus and Rpl13a in the medial prefrontal cortex; decreased expression of the Ppia gene in the temporal cortex.
The results demonstrate that the Actb and Ywhaz genes exhibit the most variable expression with age. Therefore, it is not appropriate to utilize these genes as reference genes in the experiment investigating age dynamics.

2.4. The Results of S100b Gene Expression Dynamics Analysis Depend on the Selection of Reference Genes

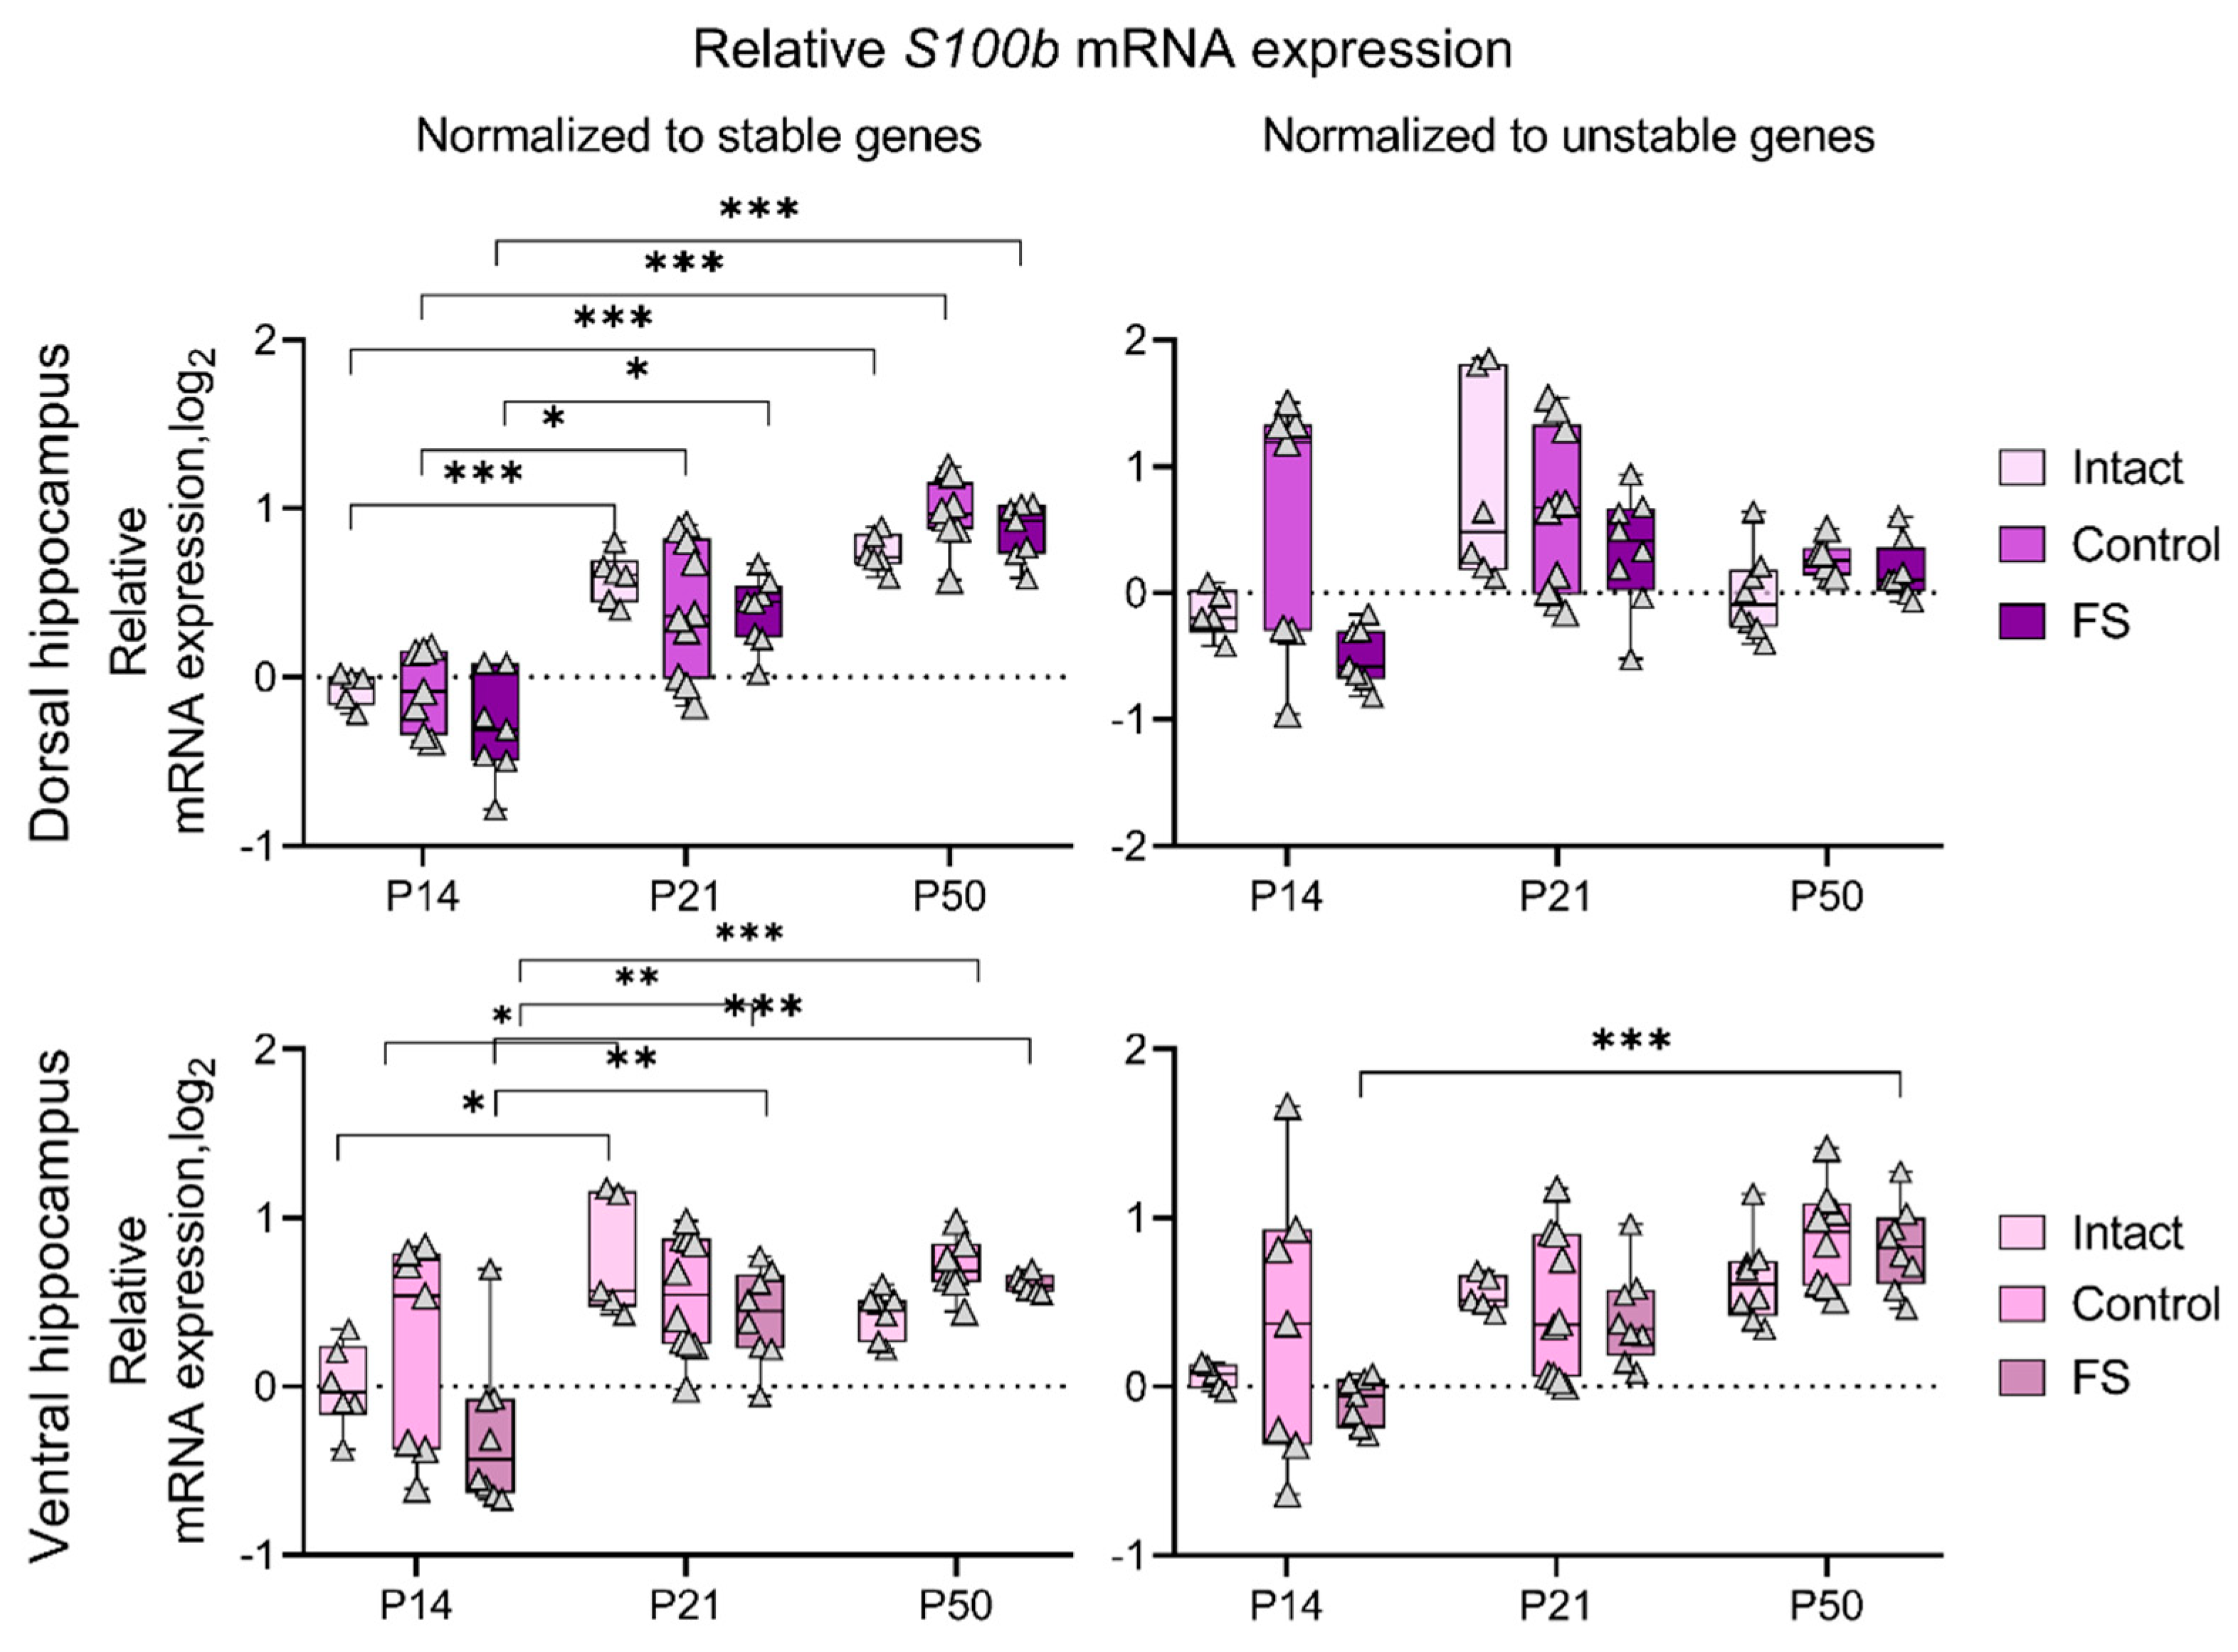
The use of genes that undergo alteration in their expression levels as a reference may potentially result in the generation of erroneous outcomes. We analyzed the dynamics of S100b gene expression using a different set of reference genes in the dorsal and ventral hippocampus of rats (Figure 7). Normalization of the data for sets of stably expressed genes (obtained and described above) revealed an increase in S100b expression by P21 in the dorsal and ventral hippocampus, which was maintained at P50. However, when Gapdh in the dorsal hippocampus and Hprt1 in the ventral hippocampus, which are the most unstable genes for these structures, are used as reference genes, no noticeable age-related dynamics, especially in the dorsal hippocampal region, are observed.

3. Discussion

In the present study, we analyzed the stability of expression of eight reference genes (Actb, Gapdh, B2m, Rpl13a, Ppia, Hprt1, Pgk1, Ywhaz) in the dorsal and ventral areas of hippocampus, temporal and medial prefrontal cortex of rats that had suffered prolonged febrile seizures at an early age. Furthermore, the age-dependent expression dynamics of selected genes were investigated.
The gene with the most stable expression was identified as Ppia. The stable genes for each brain region differed; however, Ppia demonstrated high stability in the medial prefrontal cortex and both the dorsal and ventral hippocampus. Similarly, Swijsen and colleagues (2012) demonstrated that Rpl13a, Ppia, and Tbp exhibited the greatest stability of expression in the dentate gyrus of the hippocampus using a febrile seizure model [18]. These findings are in accordance with our results, which indicate that in the dorsal region of the hippocampus, Rpl13a and Ppia exhibited the greatest stability. Additionally, these genes demonstrated high stability in the rat hippocampus, as reported by Bonefeld and colleagues [19]. As previously demonstrated, the Ppia gene exhibited considerable stability following pentylenetetrazole-induced seizures in different rat brain regions [17]. A lithium-pilocarpine model of epilepsy also demonstrated that Ppia, but not Rpl13a, exhibited consistent expression in the dorsal and ventral regions of the hippocampus [13]. However, in an experiment utilizing the same model but with antioxidant and anti-inflammatory therapy, the Ppia gene demonstrated instability in expression in the dorsal hippocampus [20]. This discrepancy is likely due to the influence of the pharmacological agents administered to the experimental animals, underscoring the importance of selecting optimal reference genes for specific experimental conditions.
The expression of Hprt1 and Pgk1 genes was stable only in the medial prefrontal cortex of rats after febrile seizures, whereas we have previously shown that in other seizure models the mRNA expression of these genes is quite stable [13,17]. The fact that febrile seizures are induced at an earlier age may underlie this discrepancy.
Development of the central nervous system is known to continue into the postnatal period [21,22]. Early adverse effects, such as seizures, can disrupt normal brain development and lead to severe consequences in adulthood [23]. Differential gene expression is characteristic of both normal brain development and pathological conditions [24]. Therefore, it is important to consider that housekeeping gene expression patterns may also change during ontogeny when studying gene expression. The analysis of the expression dynamics of unstably expressed genes performed in this study showed that the mRNA production of many housekeeping genes changes with age in the brain regions studied (Figure 3, Figure 4, Figure 5 and Figure 6). This is the first time such an analysis has been performed in rats of different ages. These changes in housekeeping gene expression are a key factor to consider when assessing the expression of genes of interest in the dynamics of this model. For example, the Gapdh gene, which is often used as a reference [6], showed high stability in the temporal cortex and ventral, but not dorsal, hippocampus. In the dorsal hippocampal region (Figure 3), an increase in expression of this gene was detected by postnatal day 50, which may be one of the reasons for the very low stability of Gapdh expression. Similar data have been obtained in mice, where the level of Gapdh gene expression in the brain varies with age [24].
We found that febrile seizures led to increased expression of the Rpl13a gene in the medial prefrontal cortex of rats on postnatal day 14 (Figure 6) and in the ventral hippocampus on postnatal day 21 (Figure 4). This gene encodes the ribosomal protein L13a [18], and the increase in its expression may be an indication of an intensification of protein synthesis. This alteration is also characteristic of the latent phase of the lithium-pilocarpine model of epilepsy [13] and, according to proteomic data, is observed in human epileptic brain tissue [25]. However, in the pentylenetetrazole single seizure model, the Rpl13a gene is highly stable in different brain regions [17]. This may suggest that increased Rpl13a mRNA expression may be a characteristic feature of chronic epileptic processes in the brain. Probably the medial prefrontal cortex and the ventral hippocampus are more vulnerable in febrile seizures, whereas in the dorsal hippocampus Rpl13a is one of the most stably expressed genes. The mRNA expression of the other housekeeping genes examined did not change in the brain of rats exposed to febrile seizures.
When working with RT-qPCR data, it is important to consider that normalization for unstable genes may lead to erroneous results. We demonstrated this with the example of the expression of the astrocyte marker gene S100b (Figure 7). It is known that in rats, mRNA expression of this gene increases by the third week of life and is maintained at this level throughout adult life [26]. In our work, this is confirmed: when normalized to the most stably expressed genes for the dorsal and ventral hippocampus, there is an increase in S100b expression at P21, which is maintained at P50. However, when normalized to Gapdh in the dorsal hippocampus and Hprt1 in the ventral hippocampus, which are the most unstable for these regions, no clear age-related changes are observed.

4. Materials and Methods

4.1. Animals

The study was conducted on 70 male Wistar rats in accordance with the Rules of Animal Care and Use Committee of the Sechenov Institute of Evolutionary Physiology and Biochemistry of the RAS and the EU Directive 2010/63/EU. The animals were maintained in standard conditions with unrestricted access to water and feed. The rats were randomly assigned to groups.

4.2. Febrile Seizure Model

Febrile seizures were induced on postnatal day 11 (P11) (Figure 8). The rats were placed at the bottom of a glass chamber, the temperature of the air within which was maintained at 45–46 °C. The rectal temperature of the animals was also monitored at the same time. Prior to the commencement of the experiment, the mean temperature of the rats was recorded at 31–33 °C. At the onset of the seizures, the temperature was observed to have risen to 38–39 °C. Following the onset of seizures, the temperature was monitored at two-minute intervals to prevent it from exceeding 41 °C [27]. In the event of a rise in temperature above this threshold, the rats were removed from the chamber and relocated to a cooler surface until their body temperature returned to 38 °C, then they were returned to the chamber. The experiment lasted 30 minutes, during which the total duration of the seizures was a minimum of 15 minutes. To serve as a control, rats from the same litter that remained intact and rats that were weaned from the female and littermates for a similar period (30 minutes) but not heated were included in the study.
The brains were isolated for subsequent biochemical analysis on the 14th, 21st and 50th day of the rat’s life. According to the rat brain atlas [28] the following brain structures were obtained using an OTF5000 microtome-cryostat (Bright Instrument, Luton, UK): the dorsal and ventral hippocampus, medial prefrontal and temporal cortex.

4.3. Reverse Transcription

Total RNA was extracted using the ExtractRNA reagent (Evrogen, Moscow, Russia) in accordance with the manufacturer’s instructions. The resulting RNA precipitate was stored in 75% ethanol at a temperature of -20°C.
The potential genomic DNA contamination was eliminated from the samples through the use of RQ1 DNAase (Promega, Madison, WI, USA; 1 unit per sample). The RNA was resuspended in an 8 M LiCl solution for a period of 24 hours at -20 °C. Subsequently, the sample tubes were subjected to centrifugation, after which the RNA precipitate was washed on two occasions with 75% ethanol.
The precipitates were dissolved in 15 µl of water for injection. The concentration and purity of RNA in the solution were evaluated using a NanoDrop Lite spectrophotometer (Thermo Fisher Scientific, Waltham, MA, USA). Absorbance at 260 nm wavelength was used to determine the concentration, while the absorbance ratio at 260/280 nm wavelengths was employed to assess the purity.
Reverse transcription was performed according to the manufacturer’s protocol in a total volume of 20 µl containing 1 µg of total RNA, 0.5 µg of oligo-dT primers, 0.25 µg of 9-mer random primers (DNA-Synthesis, Moscow, Russia) and 100 units of M-MLV reverse transcriptase (Promega). The cDNA solution was then diluted 10-fold and stored at -20 °C until the real-time PCR was initiated.

4.4. Real-Time Polymerase Chain Reaction

Real-time PCR was performed in a total volume of 6 µl containing 0.8 µl of cDNA, 0.5 units of TaqM polymerase (Alkor Bio, Saint Petersburg, Russia) and 3.5 mM MgCl2. The primer and probe sequences have been previously described in our research [17,29]. The primers and probe for the S100b gene were also sourced from our previous work [30]. The reactions were performed in quadruplicate.
PCR was conducted on a CFX384 Real-Time System amplifier (Bio-Rad, Hercules, CA, USA) employing the following programme: ‘hot start’ at 95°C for 15 minutes to activate the polymerase, followed by 45 to 50 cycles comprising 5 seconds at 95°C (DNA matrix denaturation) and 10 seconds at 60 to 62°C (primer annealing and elongation) with fluorescence recording.

4.5. Analysis of Gene Expression Stability

PCR data were analyzed using CFX Manager software (Bio-Rad). The cycles of quantification (Cq) were determined through the application of regression. Samples with standard deviations of Cq greater than 0.35 were excluded from further analysis. The unprocessed mean Cqs were imported into the web interface of the RefFinder® online tool (https://blooge.cn/RefFinder/ (accessed on 27 May 2024)). The RefFinder® [31] generates a stability ranking based on the geometric mean of the stability ranks obtained by four widely used algorithms: NormFinder [32], comparative deltaCt [33], GeNorm [12], and BestKeeper [34].

4.6. Relative Gene Expression Analysis

Relative gene expression was calculated using the 2−ΔΔCt method [35]. The data were normalized against a single stable gene or the geometric mean for the few most stable reference genes, which were determined for each individual structure.

4.7. Relative Gene Expression Analysis

The data were processed using GraphPad Prism 8.0.1 (GraphPad Software, San Diego, CA, USA) and IBM SPSS Statistics 23 (IBM, Armonk, NY, USA). The normality of the data distribution was evaluated through the implementation of the Shapiro-Wilk test. The equality of variance was checked using the Leven’s test. The exclusion of outliers was conducted through the implementation of the quartile method. Data were analyzed using two-way ANOVA with Sidak’s post hoc test. The level of significance was set at p ≤ 0.05.

5. Conclusions

When studying the expression dynamics of genes of interest in a febrile seizure model, it is critical to use appropriate housekeeping genes for each brain region examined. Hprt1, Pgk1, and Ppia are stably expressed in the medial prefrontal cortex, Rpl13a, Ppia, Ppia, and Gapdh in the dorsal and ventral hippocampus, respectively, and Gapdh is most stable in the temporal cortex. The expression of most of the housekeeping genes that showed low stability changed with age. Actb and Ywhaz genes have the most variable expression with age and are therefore not recommended for normalization in experiments studying age dynamics.

Author Contributions

Conceptualization, A.P.S. and A.V.Z.; methodology, O.E.Z., A.A.K., and A.P.S.; formal analysis, M.V.Z.; investigation, A.A.K., M.V.Z., and O.E.Z.; writing—original draft preparation, A.A.K., M.V.Z., and A.P.S.; writing—review and editing, A.V.Z.; supervision, A.V.Z. All authors have read and agreed to the published version of the manuscript.

Funding

This research was funded by Russian Science Foundation, grant number 23-25-00242.

Institutional Review Board Statement

The study was conducted according to the EU Directive. 2010/63/EU for animal experiments and approved by the Ethics Committee of the Sechenov Institute of Evolutionary Physiology and Biochemistry of the Russian Academy of Sciences (ethical permit number 1-17, 26 January 2023).

Informed Consent Statement

Not applicable.

Conflicts of Interest

The authors declare no conflicts of interest.

Appendix A

Table A1. Reference gene stability values within the dorsal hippocampus of intact rats obtained by four algorithms with the RefFinder online tool.
Dorsal Hippocampus
Delta CT BestKeeper NormFinder GeNorm Comprehensive Ranking
Rank Gene Average of STDV Gene Std Dev Gene Stability Value Gene Stability Value Gene Geomean of Ranking Values
1 Hprt1 0.3 Rpl13a 1.12 Hprt1 0.055 Pgk1 | Hprt1 0.169 Hprt1 1.32
2 Pgk1 0.32 Ppia 1.13 Pgk1 0.114 Pgk1 2.11
3 Ywhaz 0.33 Hprt1 1.15 Ywhaz 0.162 Ywhaz 0.182 Rpl13a 2.83
4 Rpl13a 0.35 Pgk1 1.17 Rpl13a 0.224 Rpl13a 0.204 Ywhaz 3.22
5 Actb 0.38 Ywhaz 1.17 Actb 0.233 Ppia 0.233 Ppia 4.53
6 Ppia 0.43 B2m 1.23 B2m 0.32 Actb 0.286 Actb 5.69
7 B2m 0.43 Actb 1.26 Ppia 0.368 B2m 0.316 B2m 6.48
8 Gapdh 0.63 Gapdh 1.47 Gapdh 0.595 Gapdh 0.393 Gapdh 8
Table A2. Reference gene stability values within the ventral hippocampus of intact rats obtained by four algorithms with the RefFinder online tool.
Ventral Hippocampus
Delta CT BestKeeper NormFinder GeNorm Comprehensive Ranking
Rank Gene Average of STDV Gene Std Dev Gene Stability Value Gene Stability Value Gene Geomean of Ranking Values
1 Ppia 0.5 Rpl13a 1.23 Ppia 0.182 Gapdh | Ppia 0.306 Ppia 1.19
2 Gapdh 0.53 Ppia 1.4 Gapdh 0.239 Gapdh 2.11
3 B2m 0.57 B2m 1.47 Actb 0.338 B2m 0.331 B2m 3.46
4 Actb 0.58 Pgk1 1.47 B2m 0.351 Pgk1 0.388 Rpl13a 4.14
5 Pgk1 0.59 Gapdh 1.56 Pgk1 0.354 Actb 0.435 Pgk1 4.16
6 Ywhaz 0.68 Actb 1.73 Ywhaz 0.515 Rpl13a 0.489 Actb 4.36
7 Rpl13a 0.74 Ywhaz 1.82 Rpl13a 0.628 Ywhaz 0.538 Ywhaz 6.48
8 Hprt1 0.96 Hprt1 2 Hprt1 0.881 Hprt1 0.644 Hprt1 8
Table A3. Reference gene stability values within the temporal cortex of intact rats obtained by four algorithms with the RefFinder online tool.
Temporal cortex
Delta CT BestKeeper NormFinder GeNorm Comprehensive Ranking
Rank Gene Average of STDV Gene Std Dev Gene Stability Value Gene Stability Value Gene Geomean of Ranking Values
1 Gapdh 0.24 Gapdh 1.1 Gapdh 0.098 Gapdh | Rpl13a 0.148 Gapdh 1
2 Rpl13a 0.25 Pgk1 1.1 Rpl13a 0.14 Rpl13a 1.86
3 Pgk1 0.25 Rpl13a 1.11 Pgk1 0.144 Pgk1 0.177 Pgk1 2.71
4 Hprt1 0.26 Hprt1 1.13 Hprt1 0.158 Hprt1 0.192 Hprt1 4
5 Ppia 0.28 Ppia 1.14 Ppia 0.205 Ppia 0.215 Ppia 5
6 Actb 0.29 Actb 1.15 Actb 0.213 Actb 0.237 Actb 6
7 Ywhaz 0.3 Ywhaz 1.17 Ywhaz 0.238 Ywhaz 0.245 Ywhaz 7
8 B2m 0.4 B2m 1.2 B2m 0.371 B2m 0.284 B2m 8
Table A4. Reference gene stability values within the medial prefrontal cortex of intact rats obtained by four algorithms with the RefFinder online tool.
Medial prefrontal cortex
Delta CT BestKeeper NormFinder GeNorm Comprehensive Ranking
Rank Gene Average of STDV Gene Std Dev Gene Stability Value Gene Stability Value Gene Geomean of Ranking Values
1 Pgk1 0.45 Ppia 1.21 Pgk1 0.245 Hprt1 | Ywhaz 0.203 Pgk1 1.68
2 Hprt1 0.45 Pgk1 1.25 Ppia 0.262 Ppia 2.06
3 Ppia 0.46 Rpl13a 1.26 Hprt1 0.279 Ppia 0.274 Hprt1 2.06
4 Ywhaz 0.48 Hprt1 1.26 Ywhaz 0.33 Pgk1 0.329 Ywhaz 3.13
5 Rpl13a 0.53 B2m 1.29 Rpl13a 0.388 Rpl13a 0.392 Rpl13a 4.73
6 B2m 0.56 Ywhaz 1.32 B2m 0.431 B2m 0.424 B2m 5.73
7 Actb 0.57 Gapdh 1.34 Actb 0.435 Actb 0.472 Actb 7.24
8 Gapdh 0.68 Actb 1.41 Gapdh 0.592 Gapdh 0.523 Gapdh 7.74
Table A5. Reference gene stability values within the dorsal hippocampus of intact, control, and experimental rats obtained by four algorithms with the RefFinder online tool.
Dorsal Hippocampus
Delta CT BestKeeper NormFinder GeNorm Comprehensive Ranking
Rank Gene Average of STDV Gene Std Dev Gene Stability Value Gene Stability Value Gene Geomean of Ranking Values
1 Rpl13a 0.57 Rpl13a 1.13 Rpl13a 0.33 Rpl13a | Ppia 0.239 Rpl13a 1.00
2 Hprt1 0.61 Ppia 1.16 Hprt1 0.40 Ppia 2.21
3 Ppia 0.61 Hprt1 1.29 Actb 0.41 Hprt1 0.368 Hprt1 2.45
4 Actb 0.62 Actb 1.34 Ppia 0.423 Actb 0.403 Actb 3.72
5 Ywhaz 0.76 Pgk1 1.34 Ywhaz 0.644 Ywhaz 0.595 Ywhaz 5.23
6 Pgk1 0.80 Ywhaz 1.35 Pgk1 0.705 Pgk1 0.662 Pgk1 5.73
Table A6. Reference gene stability values within the ventral hippocampus of intact, control, and experimental rats obtained by four algorithms with the RefFinder online tool.
Ventral Hippocampus
Delta CT BestKeeper NormFinder GeNorm Comprehensive Ranking
Rank Gene Average of STDV Gene Std Dev Gene Stability Value Gene Stability Value Gene Geomean of Ranking Values
1 Ppia 0.35 Rpl13a 1.24 Ppia 0.132 Gapdh | Ppia 0.301 Ppia 1.32
2 Gapdh 0.36 Pgk1 1.33 Gapdh 0.167 Gapdh 2.11
3 B2m 0.39 Ppia 1.36 B2m 0.241 B2m 0.313 B2m 3.22
4 Pgk1 0.43 B2m 1.39 Pgk1 0.311 Pgk1 0.34 Rpl13a 3.34
5 Rpl13a 0.47 Gapdh 1.42 Rpl13a 0.388 Rpl13a 0.371 Pgk1 3.36
6 Actb 0.51 Actb 1.68 Actb 0.451 Actb 0.418 Actb 6
Table A7. Reference gene stability values within the temporal cortex of intact, control, and experimental rats obtained by four algorithms with the RefFinder online tool.
Temporal cortex
Delta CT BestKeeper NormFinder GeNorm Comprehensive Ranking
Rank Gene Average of STDV Gene Std Dev Gene Stability Value Gene Stability Value Gene Geomean of Ranking Values
1 Gapdh 0.23 Gapdh 1.13 Gapdh 0.1 Gapdh | Rpl13a 0.19 Gapdh 1
2 Hprt1 0.27 Rpl13a 1.16 Hprt1 0.182 Rpl13a 2.28
3 Rpl13a 0.27 Pgk1 1.16 Rpl13a 0.186 Hprt1 0.224 Hprt1 2.78
4 Ppia 0.28 Actb 1.17 Ppia 0.194 Ppia 0.248 Ppia 4
5 Actb 0.3 Ppia 1.17 Actb 0.24 Actb 0.26 Pgk1 4.56
6 Pgk1 0.3 Hprt1 1.17 Pgk1 0.245 Pgk1 0.274 Actb 5.23
Table A8. Reference gene stability values within the medial prefrontal cortex of intact, control, and experimental rats obtained by four algorithms with the RefFinder online tool.
Medial prefrontal cortex
Delta CT BestKeeper NormFinder GeNorm Comprehensive Ranking
Rank Gene Average of STDV Gene Std Dev Gene Stability Value Gene Stability Value Gene Geomean of Ranking Values
1 Hprt1 0.43 Rpl13a 1.24 Pgk1 0.215 Hprt1 | Ywhaz 0.23 Hprt1 1.78
2 Pgk1 0.43 Ppia 1.25 Hprt1 0.268 Pgk1 2.21
3 Ppia 0.45 Pgk1 1.25 Ppia 0.279 Ppia 0.309 Ppia 2.71
4 Ywhaz 0.48 B2m 1.28 Ywhaz 0.37 Pgk1 0.362 Ywhaz 3.13
5 B2m 0.56 Hprt1 1.3 B2m 0.453 B2m 0.446 Rpl13a 3.83
6 Rpl13a 0.56 Ywhaz 1.33 Rpl13a 0.468 Rpl13a 0.486 B2m 4.73

References

  1. Feng, B.; Chen, Z. Generation of Febrile Seizures and Subsequent Epileptogenesis. Neurosci. Bull. 2016, 32, 481–492. [Google Scholar] [CrossRef] [PubMed]
  2. Mewasingh, L.D.; Chin, R.F.M.; Scott, R.C. Current understanding of febrile seizures and their long-term outcomes. Dev. Med. Child Neurol. 2020, 62, 1245–1249. [Google Scholar] [CrossRef] [PubMed]
  3. Dubé, C.M.; Ravizza, T.; Hamamura, M.; Zha, Q.; Keebaugh, A.; Fok, K.; Andres, A.L.; Nalcioglu, O.; Obenaus, A.; Vezzani, A.; et al. Epileptogenesis provoked by prolonged experimental febrile seizures: mechanisms and biomarkers. J. Neurosci. 2010, 30, 7484–7494. [Google Scholar] [CrossRef] [PubMed]
  4. Notenboom, R.G.E.; Ramakers, G.M.J.; Kamal, A.; Spruijt, B.M.; De Graan, P.N.E. Long-lasting modulation of synaptic plasticity in rat hippocampus after early-life complex febrile seizures. Eur. J. Neurosci. 2010, 32. [Google Scholar] [CrossRef]
  5. Baram, T.Z.; Gerth, A.; Schultz, L. Febrile seizures: an appropriate-aged model suitable for long-term studies. Dev. Brain Res. 1997, 98, 265–270. [Google Scholar] [CrossRef] [PubMed]
  6. Chapman, J.R.; Waldenström, J. With Reference to Reference Genes: A Systematic Review of Endogenous Controls in Gene Expression Studies. PLoS One 2015, 10, e0141853. [Google Scholar] [CrossRef]
  7. Zhou, J.; Zhang, X.; Ren, J.; Wang, P.; Zhang, J.; Wei, Z.; Tian, Y. Validation of reference genes for quantitative real-time PCR in valproic acid rat models of autism. Mol. Biol. Rep. 2016, 43, 837–847. [Google Scholar] [CrossRef]
  8. Cook, N.L.; Vink, R.; Donkin, J.J.; van den Heuvel, C. Validation of reference genes for normalization of real-time quantitative RT-PCR data in traumatic brain injury. J. Neurosci. Res. 2009, 87, 34–41. [Google Scholar] [CrossRef]
  9. Nair, A.R.; Smeets, K.; Keunen, E.; Lee, W.-K.; Thévenod, F.; Van Kerkhove, E.; Cuypers, A. Renal cells exposed to cadmium in vitro and in vivo: normalizing gene expression data. J. Appl. Toxicol. 2015, 35, 478–484. [Google Scholar] [CrossRef]
  10. Crans, R.A.J.; Janssens, J.; Daelemans, S.; Wouters, E.; Raedt, R.; Van Dam, D.; De Deyn, P.P.; Van Craenenbroeck, K.; Stove, C.P. The validation of Short Interspersed Nuclear Elements (SINEs) as a RT-qPCR normalization strategy in a rodent model for temporal lobe epilepsy. PLoS One 2019, 14, e0210567. [Google Scholar] [CrossRef]
  11. Santos, B.P. Dos; da Costa Diesel, L.F.; da Silva Meirelles, L.; Nardi, N.B.; Camassola, M. Identification of suitable reference genes for quantitative gene expression analysis in rat adipose stromal cells induced to trilineage differentiation. Gene 2016, 594, 211–219. [Google Scholar] [CrossRef] [PubMed]
  12. Vandesompele, J.; De Preter, K.; Pattyn, F.; Poppe, B.; Van Roy, N.; De Paepe, A.; Speleman, F. Accurate normalization of real-time quantitative RT-PCR data by geometric averaging of multiple internal control genes. Genome Biol. 2002, 3, research0034.1. [Google Scholar] [CrossRef] [PubMed]
  13. Schwarz, A.P.; Zakharova, M. V.; Kovalenko, A.A.; Dyomina, A. V.; Zubareva, O.E.; Zaitsev, A. V. Time- and Region-Specific Selection of Reference Genes in the Rat Brain in the Lithium–Pilocarpine Model of Acquired Temporal Lobe Epilepsy. Biomedicines 2024, 12, 1100. [Google Scholar] [CrossRef]
  14. Bockhorst, K.H.; Narayana, P.A.; Liu, R.; Ahobila-Vijjula, P.; Ramu, J.; Kamel, M.; Wosik, J.; Bockhorst, T.; Hahn, K.; Hasan, K.M.; et al. Early postnatal development of rat brain: In vivo diffusion tensor imaging. J. Neurosci. Res. 2008, 86, 1520–1528. [Google Scholar] [CrossRef] [PubMed]
  15. Curia, G.; Longo, D.; Biagini, G.; Jones, R.S.G.; Avoli, M. The pilocarpine model of temporal lobe epilepsy. J. Neurosci. Methods 2008, 172, 143–157. [Google Scholar] [CrossRef]
  16. Isaeva, E.; Romanov, A.; Holmes, G.L.; Isaev, D. Status epilepticus results in region-specific alterations in seizure susceptibility along the hippocampal longitudinal axis. Epilepsy Res. 2015, 110, 166–170. [Google Scholar] [CrossRef] [PubMed]
  17. Schwarz, A.P.; Kovalenko, A.A.; Malygina, D.A.; Postnikova, T.Y.; Zubareva, O.E.; Zaitsev, A. V. Reference gene validation in the brain regions of young rats after pentylenetetrazole-induced seizures. Biomedicines 2020, 8. [Google Scholar] [CrossRef] [PubMed]
  18. Swijsen, A.; Nelissen, K.; Janssen, D.; Rigo, J.-M.; Hoogland, G. Validation of reference genes for quantitative real-time PCR studies in the dentate gyrus after experimental febrile seizures. BMC Res. Notes 2012, 5, 685. [Google Scholar] [CrossRef]
  19. Bonefeld, B.E.; Elfving, B.; Wegener, G. Reference genes for normalization: A study of rat brain tissue. Synapse 2008, 62, 302–309. [Google Scholar] [CrossRef]
  20. Schwarz, A.P.; Dyomina, A. V; Zakharova, M. V; Kovalenko, A.A.; Gryaznova, M.O.; Ischenko, A.M.; Zaitsev, A. V The Reference Gene Validation in the Brain of Rats during Antioxidant and Anti-Inflammatory Treatment in the Lithium-Pilocarpine Model of Temporal Epilepsy. J. Evol. Biochem. Physiol. 2022, 58, 930–940. [Google Scholar] [CrossRef]
  21. Teplyashina, E.A.; Gorina, Y. V.; Khilazheva, E.D.; Boytsova, E.B.; Mosyagina, A.I.; Malinovskaya, N.A.; Komleva, Y.K.; Morgun, A. V.; Uspenskaya, Y.A.; Shuvaev, A.N.; et al. Cells of Cerebrovascular Endothelium and Perivascular Astroglia in the Regulation of Neurogenesis. J. Evol. Biochem. Physiol. 2022, 58, 728–741. [Google Scholar] [CrossRef]
  22. Wasterlain, C.G.; Shirasaka, Y. Seizures, brain damage and brain development. Brain Dev. 1994, 16, 279–295. [Google Scholar] [CrossRef]
  23. Ismail, F.Y.; Fatemi, A.; Johnston, M. V Cerebral plasticity: Windows of opportunity in the developing brain. Eur. J. Paediatr. Neurol. EJPN Off. J. Eur. Paediatr. Neurol. Soc. 2017, 21, 23–48. [Google Scholar] [CrossRef]
  24. Xu, D.; Liu, A.; Wang, X.; Zhang, M.; Zhang, Z.; Tan, Z.; Qiu, M. Identifying suitable reference genes for developing and injured mouse CNS tissues. Dev. Neurobiol. 2018, 78, 39–50. [Google Scholar] [CrossRef]
  25. Pires, G.; Leitner, D.; Drummond, E.; Kanshin, E.; Nayak, S.; Askenazi, M.; Faustin, A.; Friedman, D.; Debure, L.; Ueberheide, B.; et al. Proteomic differences in the hippocampus and cortex of epilepsy brain tissue. Brain Commun. 2021, 3. [Google Scholar] [CrossRef]
  26. Hernández-Ortega, K.; Canul-Euan, A.A.; Solis-Paredes, J.M.; Borboa-Olivares, H.; Reyes-Muñoz, E.; Estrada-Gutierrez, G.; Camacho-Arroyo, I. S100B actions on glial and neuronal cells in the developing brain: an overview. Front. Neurosci. 2024, 18, 1425525. [Google Scholar] [CrossRef] [PubMed]
  27. Dubé, C.; Brunson, K.L.; Eghbal-Ahmadi, M.; Gonzalez-Vega, R.; Baram, T.Z. Endogenous neuropeptide Y prevents recurrence of experimental febrile seizures by increasing seizure threshold. J. Mol. Neurosci. 2005, 25, 275–284. [Google Scholar] [CrossRef] [PubMed]
  28. Paxinos, G.; Watson, C. The rat brain in stereotaxic coordinates: hard cover edition; Elsevier: Amsterdam, The Netherlands, 2006; ISBN 9780080475134. [Google Scholar]
  29. Schwarz, A.P.; Malygina, D.A.; Kovalenko, A.A.; Trofimov, A.N.; Zaitsev, A. V. Multiplex qPCR assay for assessment of reference gene expression stability in rat tissues/samples. Mol. Cell. Probes 2020, 53. [Google Scholar] [CrossRef]
  30. Zakharova, M. V; Dyomina, A. V; Kovalenko, A.A.; Zubareva, O.E.; Ischenko, A.M.; Zaitsev, A. V Anakinra Promotes M2 Microglia Activation during the Latent Phase of the Lithium-Pilocarpine Model of Temporal Lobe Epilepsy. J. Evol. Biochem. Physiol. 2024, 60, 672–689. [Google Scholar] [CrossRef]
  31. Xie, F.; Wang, J.; Zhang, B. RefFinder: a web-based tool for comprehensively analyzing and identifying reference genes. Funct. Integr. Genomics 2023, 23. [Google Scholar] [CrossRef]
  32. Andersen, C.L.; Jensen, J.L.; Ørntoft, T.F. Normalization of real-time quantitative reverse transcription-PCR data: A model-based variance estimation approach to identify genes suited for normalization, applied to bladder and colon cancer data sets. Cancer Res. 2004, 64, 5245–5250. [Google Scholar] [CrossRef] [PubMed]
  33. Silver, N.; Best, S.; Jiang, J.; Thein, S.L. human reticulocytes using real-time PCR. 2006, 9, 1–9. [CrossRef]
  34. Pfaffl, M.W.; Tichopad, A.; Prgomet, C.; Neuvians, T.P. Determination of stable housekeeping genes, differentially regulated target genes and sample integrity: BestKeeper – Excel-based tool using pair-wise correlations. Biotechnol. Lett. 2004, 26, 509–515. [Google Scholar] [CrossRef] [PubMed]
  35. Livak, K.J.; Schmittgen, T.D. Analysis of Relative Gene Expression Data Using Real-Time Quantitative PCR and the 2−ΔΔCT Method. Methods 2001, 25, 402–408. [Google Scholar] [CrossRef] [PubMed]
Figure 1. Geometric means of ranking values of reference genes in dorsal and ventral hippocampus, temporal and medial prefrontal cortex of rats. The stability of mRNA production in all samples of intact animals at P14, P21, and P50 was evaluated using the online tool RefFinder (https://blooge.cn/RefFinder/ (accessed on 27 May 2024)). The dashed line corresponds to a sufficient stability index.
Preprints 116535 g001
Figure 2. Ranking values of reference genes in dorsal and ventral hippocampus, temporal and medial prefrontal cortex of rats after febrile seizures. The stability of mRNA production in all intact, control and experimental samples at P14, P21, P50 and at all ages was evaluated using the online tool RefFinder (https://blooge.cn/RefFinder/ (accessed on 27 May 2024)). The dashed line corresponds to a sufficient stability index.
Preprints 116535 g002
Figure 3. Expression dynamics of unstable genes in the rat dorsal hippocampus in a febrile seizure model at P14, P21, and P50. The Rpl13a and Ppia genes were used to data normalization. Intact: intact group; Control: control group; FS: experimental group. *, **, *** – p < 0.05, p < 0.01 or p < 0.001, respectively (two-way ANOVA followed by Sidak post hoc test). The results are presented in the form of boxes, which include the median, the first and third quartiles, and individual values (triangles) with minimum and maximum values.
Preprints 116535 g003
Figure 4. Expression dynamics of unstable genes in the rat ventral hippocampus in a febrile seizure model at P14, P21, and P50. The Ppia and Gapdh genes were used to data normalization. Intact: intact group; Control: control group; FS: experimental group. *, **, *** – p < 0.05, p < 0.01 or p < 0.001, respectively (two-way ANOVA followed by Sidak post hoc test). The results are presented in the form of boxes, which include the median, the first and third quartiles, and individual values (triangles) with minimum and maximum values.
Preprints 116535 g004
Figure 5. Expression dynamics of unstable genes in the rat temporal cortex in a febrile seizure model at P14, P21, and P50. The Gapdh gene was used to data normalization. Intact: intact group; Control: control group; FS: experimental group. *, **, *** – p < 0.05, p < 0.01 or p < 0.001, respectively (two-way ANOVA followed by Sidak post hoc test). The results are presented in the form of boxes, which include the median, the first and third quartiles, and individual values (circles) with minimum and maximum values.
Preprints 116535 g005
Figure 6. Expression dynamics of unstable genes in the rat medial prefrontal cortex in a febrile seizure model at P14, P21, and P50. The Hprt1, Pgk1, and Ppia gene were used to data normalization. Intact: intact group; Control: control group; FS: experimental group. *, **, *** – p < 0.05, p < 0.01 or p < 0.001, respectively (two-way ANOVA followed by Sidak post hoc test). The results are presented in the form of boxes, which include the median, the first and third quartiles, and individual values (circles) with minimum and maximum values.
Preprints 116535 g006
Figure 7. Dynamics of S100b mRNA production in the dorsal and ventral hippocampus of rats in a febrile seizure model at P14, P21, and P50. Intact: intact group; Control: control group; FS: experimental group. *, **, *** – p < 0.05, p < 0.01 or p < 0.001, respectively (two-way ANOVA followed by Sidak post hoc test). The results are presented in the form of boxes, which include the median, the first and third quartiles, and individual values (triangles) with minimum and maximum values.
Preprints 116535 g007
Figure 8. The number of animals in different groups. Intact: completely intact rats; Control: littermate animals that were weaned from the female at P11 but were not subjected to hyperthermia; FS: littermate animals that were induced with prolonged febrile seizures (>15 minutes) at P11.
Preprints 116535 g008
Disclaimer/Publisher’s Note: The statements, opinions and data contained in all publications are solely those of the individual author(s) and contributor(s) and not of MDPI and/or the editor(s). MDPI and/or the editor(s) disclaim responsibility for any injury to people or property resulting from any ideas, methods, instructions or products referred to in the content.
Copyright: This open access article is published under a Creative Commons CC BY 4.0 license, which permit the free download, distribution, and reuse, provided that the author and preprint are cited in any reuse.
Prerpints.org logo

Preprints.org is a free preprint server supported by MDPI in Basel, Switzerland.

Subscribe

© 2024 MDPI (Basel, Switzerland) unless otherwise stated