1. Introduction
Cancer is a large group of diseases that starts in almost any organ or tissue of the body, and the key to improving cancer outcomes and cancer survival is early detection [
1,
2]. Various methods have been evaluated as cancer screening tools. Among these, medical imaging technology occupies an important place [
3,
4,
5,
6,
7]. However, different imaging methods are appropriate for different medical needs. X-ray computed tomography (CT) is mature and widely used, but its ionizing radiation makes it unsuitable for broad screening and frequent use [
8,
9]. Magnetic resonance imaging (MRI) is non-ionizing and obtains clearer images of soft tissues such as the brain, ovary, and liver. However, it is time-consuming and expensive, which brings limitations to routine cancer screening [
10,
11]. Ultrasound imaging (UT) is one of the conventional medical examination methods in present hospitals [
12,
13]. It is non-ionizing, has a low cost, and has a high resolution. However, it does not apply to tumor cell detection when the acoustic impedance difference between a tumor and the surrounding tissue is small, such as the tumor in the brain and breast. Microwave imaging (MWT) is an emerging research field that avoids using ionizing radiation and would be inexpensive, quick, and comfortable for patients [
14,
15]. When the human body is illuminated with microwave radiation, tumors, and the surrounding tissues induce different reflections and scatterings due to the differences in dielectric properties [
16]. However, two main challenges of low resolution and difficulty in identifying received signals from same-frequency transmitted signals have limited its use.
Based on the interdisciplinary research of electromagnetics, acoustics, biology, and medical science, microwave-induced thermoacoustic tomography (MITAT) has become another potential alternative technique for medical imaging [
17,
18,
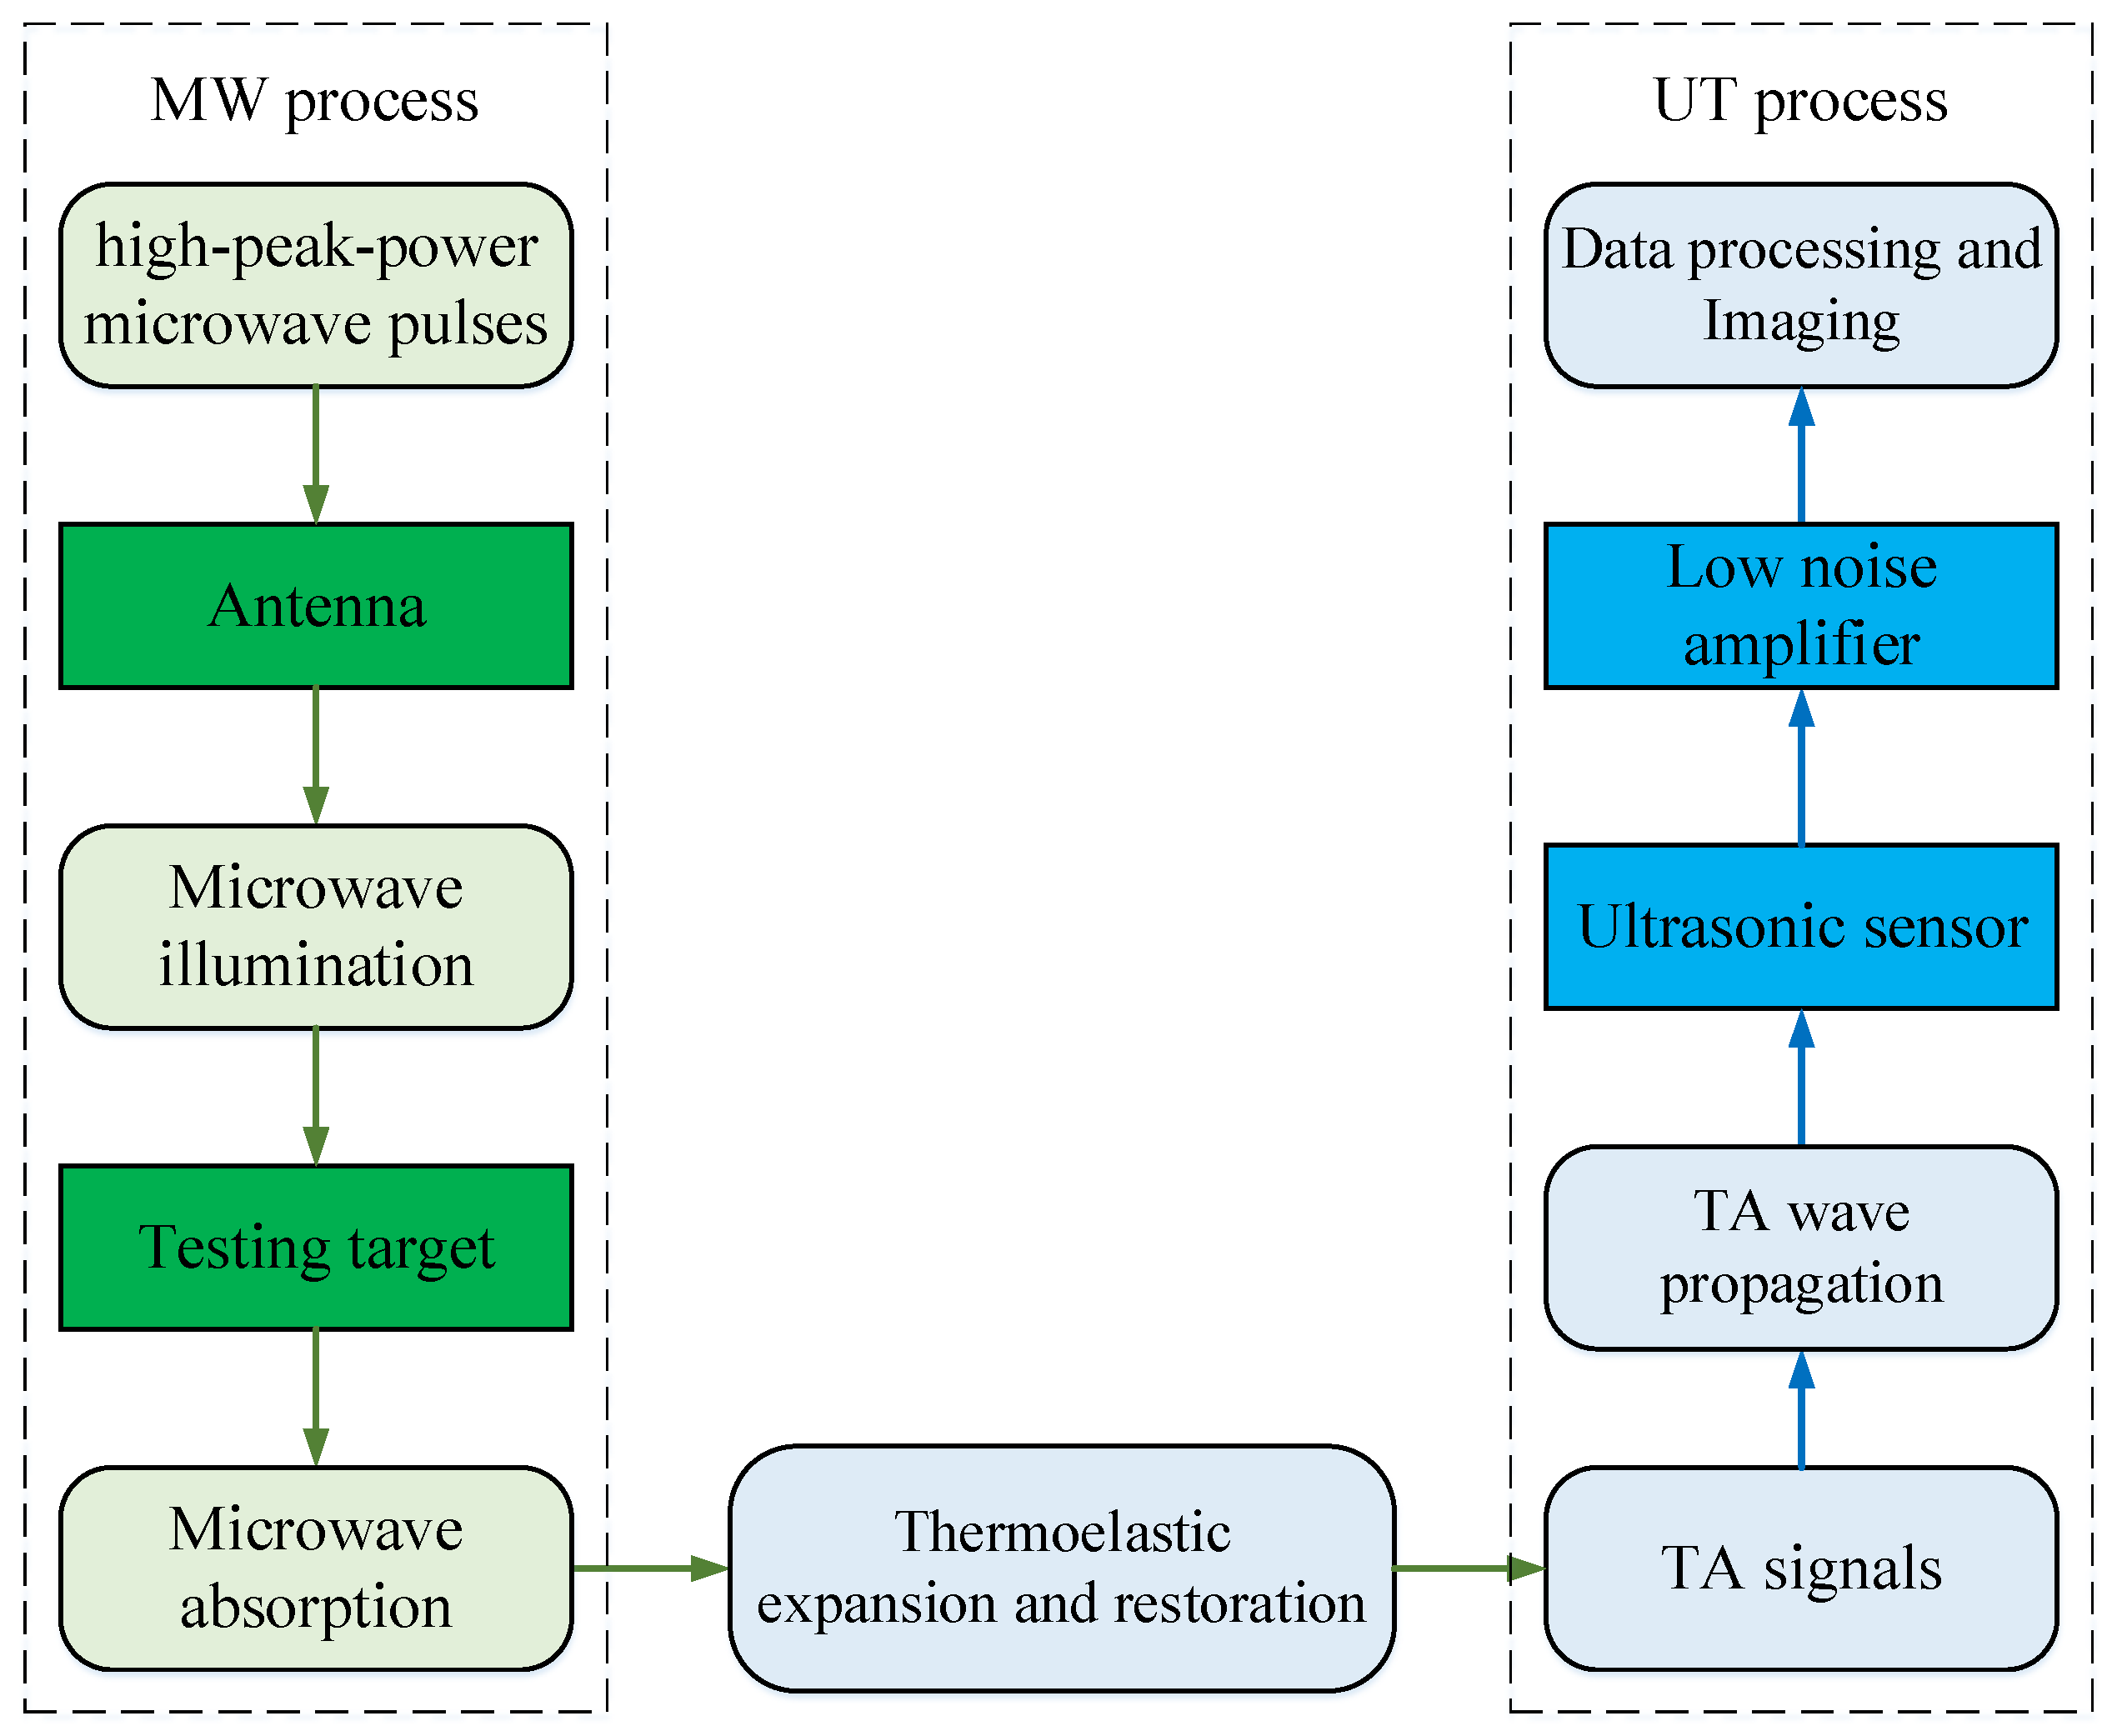
19]. The physical mechanism is based on the thermoacoustic phenomenon. When the tissue is illuminated by high-peak-power microwave pulses, it absorbs microwave energy and generates microwave-induced thermoacoustic signals (TA signals) due to thermoelastic expansion. The TA pressure amplitude PMIT is proportional to the quantity of the absorbed microwave power PMW, and PMW has a functional relationship with the electrical property of the tissue. The relationship between PMIT and PMW is shown in Equation (1), α is the attenuation coefficient. When the testing target contains different kinds of tissues, such as tumors and the surrounding healthy tissues, it generates different values of PMIT. After that, an ultrasonic sensor runs a full scan of electric machinery and transmits the data to the computer to complete data processing; then, the microwave power absorption distribution map is reconstructed, which is the image of the testing target. The detection of ultrasonic signals is also run by a sensor array [
20].
The block diagram of the whole process of the MITAT system is shown in
Figure 1. The system is divided into two parts: the MW process and the UT process. The former contributes similar high contrast with MWT due to the large difference in dielectric conductivity between a tumor and the surrounding tissue, the latter contributes high resolution with UT. The integration of the advantages of MWT and UT extends the application range of MITAT.
The data source of computer processing and imaging is obtained from ultrasonic sensor detection, whose accuracy and reliability determine the image quality [
21]. One of the solutions to obtain satisfied sensor detection results is to improve the accuracy of the microwave power absorption condition of the target, which is closely related to the microwave illumination from the antenna.
In this work, in order to meet the requirements mentioned above, the following three issues are concerned with the design of the proposed antenna. Firstly, the core circuits are designed using microstrip lines with the advantages of low profile, low fabrication cost, high radiation efficiency, and ease of manufacturing. Secondly, the antenna is circularly polarized. A common problem in the MITAT is the nonuniform microwave power absorption resulting from the inhomogeneous microwave illumination [
22,
23,
24]. Using a circularly polarized antenna has been demonstrated to be useful in achieving more uniform microwave power absorption in tumors by Yu He et al. [
25], thereby reducing the adverse effect of inhomogeneous illumination. Lastly, the antenna is operating underwater. As shown in
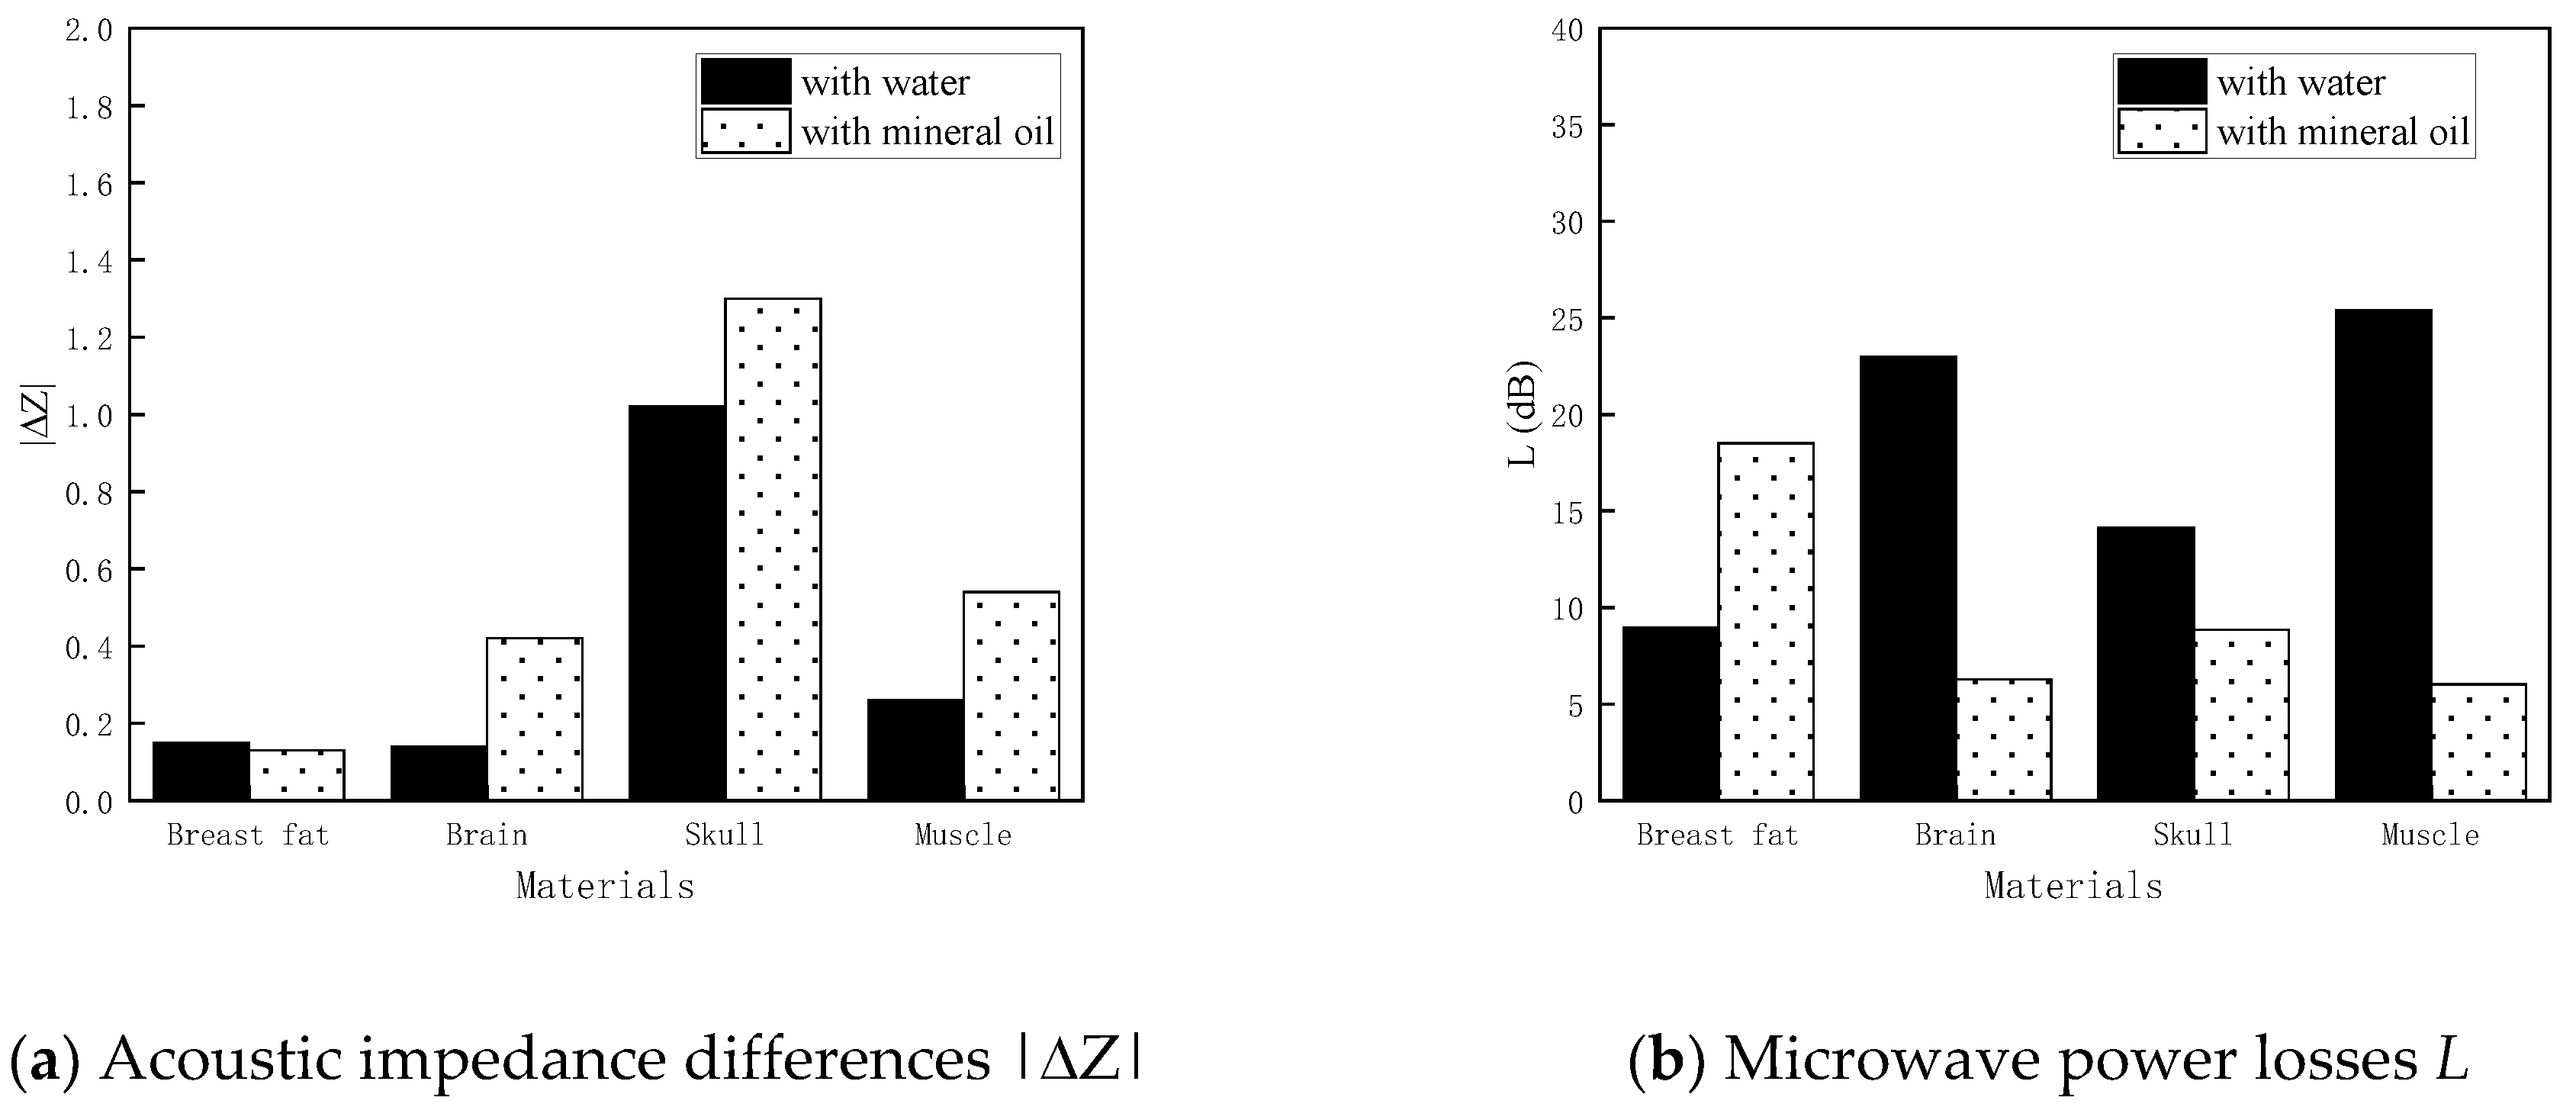
Figure 1, microwave and ultrasonic waves flow in the system simultaneously, and water is the conditioner that decreases the power propagation losses and return losses of both. Other materials may also be used as the background medium, but water has the advantage of lower power loss and is readily available.
In recent years, underwater wireless communication has drawn the attention of the research community due to its broad applications, including underwater wireless sensor networks [
26], remote-operated vehicles, and diver-to-diver communications. To develop reliable and efficient underwater communication, significant effort has been devoted to the designing of water immersion antennas [
27,
28,
29,
30]. Most of the reported antennas are electrically small, which either have low radiation efficiency due to high ohmic loss or use inefficient nonresonant size that leads to huge power consumption [
31,
32,
33]. The magnetoelectric antennas that radiate electromagnetic waves by physically moving, rotating, or oscillating the electric charges or magnetic dipole moments have provided a possible way to miniaturize the antenna[
34,
35,
36,
37], but the problems of power inefficient and not easily packaged in water could not meet the challenge of high peak power radiation in the MITAT system [
38,
39,
40,
41].
Evangelia A. Karagianni proposed a bow-tie microstrip antenna for a wireless sensor network (WSN) that is used to monitor environmental or physical phenomena of the sea and cooperatively disseminate the data through the network of sensors to a shore access point [
42]. The antenna is omnidirectional with a gain of 1.2 dBi. The input reflection coefficients under seawater are -12 dB and -16 dB at the S and C bands, respectively. Majid Ostadrahimi et al. made an array that contains 24 dipole elements for microwave imaging [
43]. The impedance matching condition is optimized by adjusting the salinity of the background medium. David Gibbins et al. proposed a wide-slot UWB antenna for an MWT system [
44], of which the background medium is specially prepared and has similar dielectric properties with human breast tissue in order to reduce reflections by eliminating the air/skin interface. However, this leads to additional preparation for experiments and limits the application of the system.
This article proposed a water immersion antenna for the MITAT system that features a simple structure, small size, easy fabrication, ultra-wide bandwidth, and circular polarization.
3. Antenna Design
3.1. Antenna Structure
The overall structure and the perspective view of the proposed antenna are shown in
Figure 3. Viewing from the outside, it is a cube with a coaxial port at the bottom. The dimensions of the cube are 55 mm◊55 mm◊60 mm. The antenna is made up of four parts: the radiating element, the balun, the shelter, and the reflector.
The reflector is a copper-clad board that is the same size as the radiating element. It reflects the radiation side lobes of the radiating element to concentrate the radiation beams, and improves the directivity.
The shelter is a dielectric cavity that wraps up the balun between the radiating element and the reflector. It keeps the balun and the inner sides of the radiating element and the reflector free of water to avoid electric leakage and rust. Its dielectric constant is 6, which is close to the substrates of the microstrip circuits. Without the shelter, the electric conduction of water may cause higher power loss, and the great difference in dielectric constant between water and the substrate brings more difficulties to the work of impedance matching.
Both of the radiating element and the balun are designed with microstrip lines on the substrate with permittivity of 4 and thickness of 1.6 mm. The specific design processes are described in the following sections.
3.2. Radiating Element Design
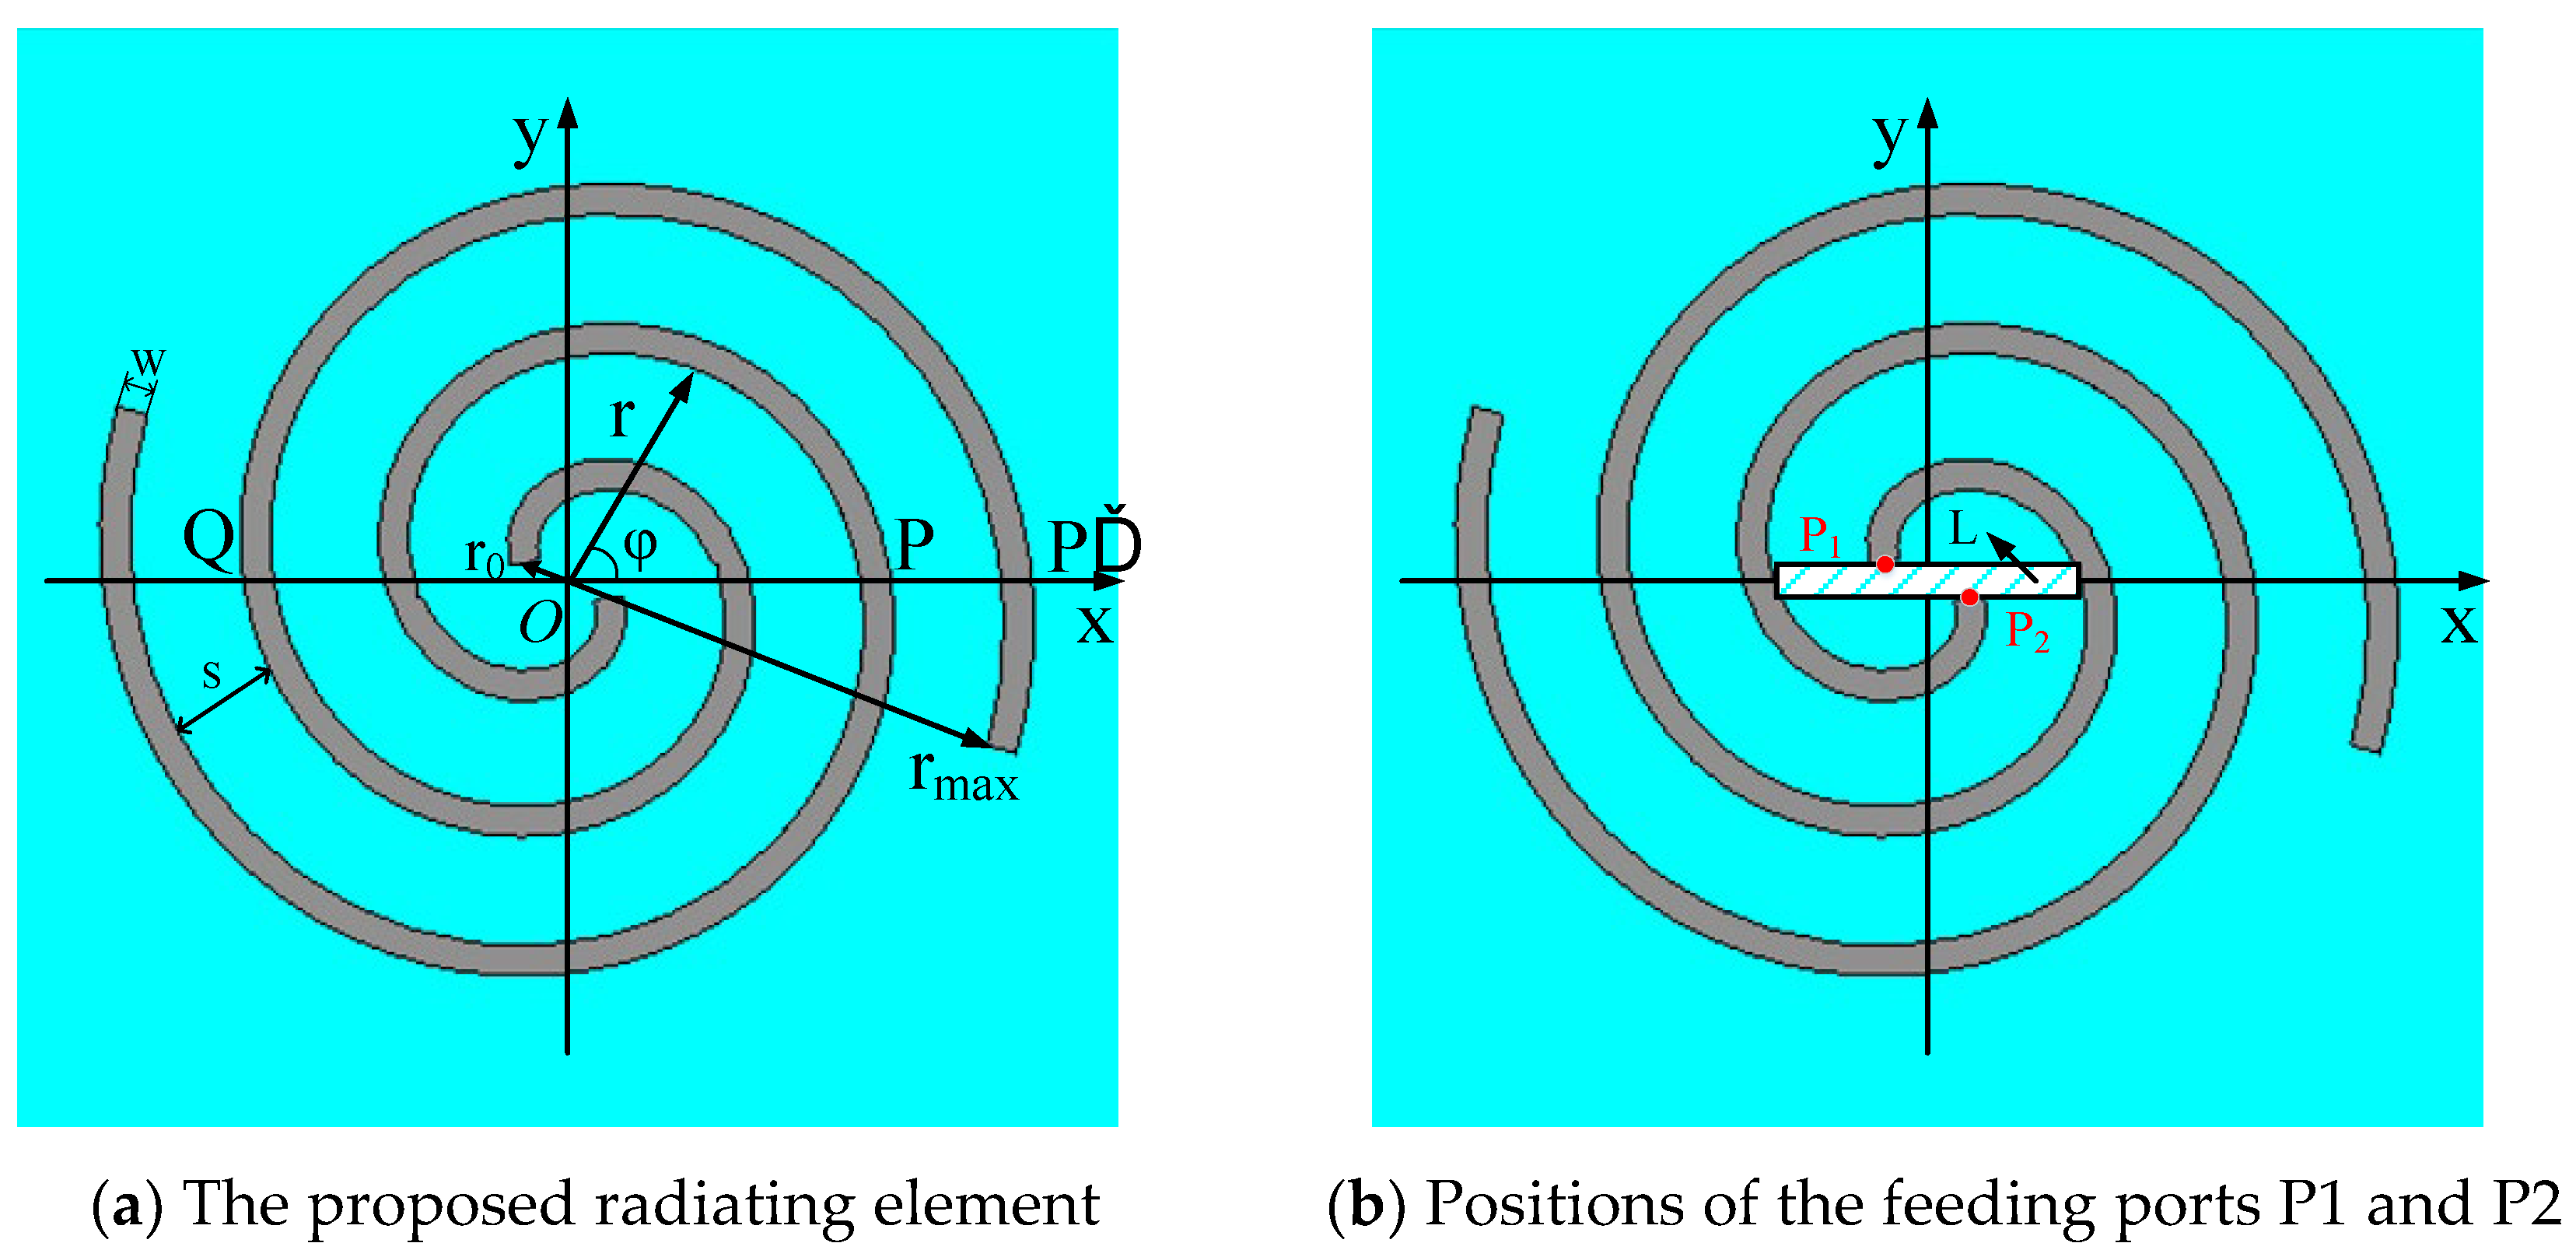
The front view of the proposed radiating element is shown in
Figure 4(a), while there is no metal layer coated on the other side of the substrate.
The two spirals constitute one kind of bifilar Archimedean spiral antenna, which is obtained by rotating the two arms of a dipole in the same direction under the equation of the Archimedean spiral, as shown in Equation (12).
Referring to
Figure 4(a), r is the distance from center point O to an arbitrary point at the spiral, r
0 is the distance from point O to the starting point of either arm,
φ is the azimuth angle,
φ0 is the starting angle, k is the growth rate of the spiral. The key to efficient radiation is to make currents on the two arms in-phase stack. In order to achieve this, r should be λ/2π, and λ is the wavelength. Points P and Q are two symmetrical points on the two spiral lines, respectively, and
. The input currents at the starting points of the two arms are equal and opposite, namely, the phase difference between point P and Q is π. The current path from point Q to P’ is approximately equal to a semicircle arc with a radius of r. As a result, the current phase difference between point P and P’ is
Δϕ=
π+(2
π/
λ)
πr. When
Δϕ=2
π, namely,
r=
λ/2
π, the radiations of the two arms realize an in-phase stack.
Above all, the main radiating area is the spiral ring with radius r=λ/2π. Since λ is inversely proportional to frequency f, the range of r corresponds to the range of working frequency. For the proposed antenna, r ranges from r0 to rmax which is 2 to 21 mm, which corresponds to a theoretical frequency range of 0.26 to 2.71 GHz. The relationship between λ and f is shown in Equation (13), in which c is the light speed in the vacuum.
The growth rate k determines the value of r and thereby influences the radiation condition. Taking one spiral as an example, when the total length is a constant, k is negatively correlated with the number of spiral rings. A small k indicates more rings in the main radiation area, which leads to stronger radiation capacity and a smooth radiation pattern. However, this causes additional transmission loss and lower gain. On the other hand, large k means lower radiation capacity, which leads to an increase of terminal reflection at the end of the spiral and a deterioration of the circular polarization characteristic of the antenna. In this work k is 0.022.
The arm width W and arm spacing S are related to the input impedance of the proposed radiating element. Normally, more stable impedance matching conditions are achieved by making the values of W and S, and they are usually to be set between 0.007
λ to 0.01
λ if they radiate in the air as common applications. However, the wavelength underwater is shorter, and the calculated values of W and S are too small, which may cause more insertion loss and difficulties in fabrication. The wavelength underwater is calculated by Equations (14) and (15).
β is the phase constant. In this work, W is 1.5 mm, and S is 5.5 mm.
The relative position of the starting points P1 and P2 of the two spiral arms has a significant influence on the impedance matching condition, as shown in
Figure 4(b). The rectangle L is a section of the balun, and its dimensions are 15 mm by 1.6 mm. P1 and P2 are connected to the balun and are symmetrically located on the two sides of L. The distance in the x direction between them is 4 mm.
3.3. Balun Design
The proposed spiral radiating element is a balanced structure and wants equal currents along the two arms. However, the fed-coaxial cable does not necessarily meet the requirement directly since some of the current may travel down the outside of the outer coax and lead to unbalanced operation. The balun is designed to solve this problem and achieve impedance matching simultaneously.
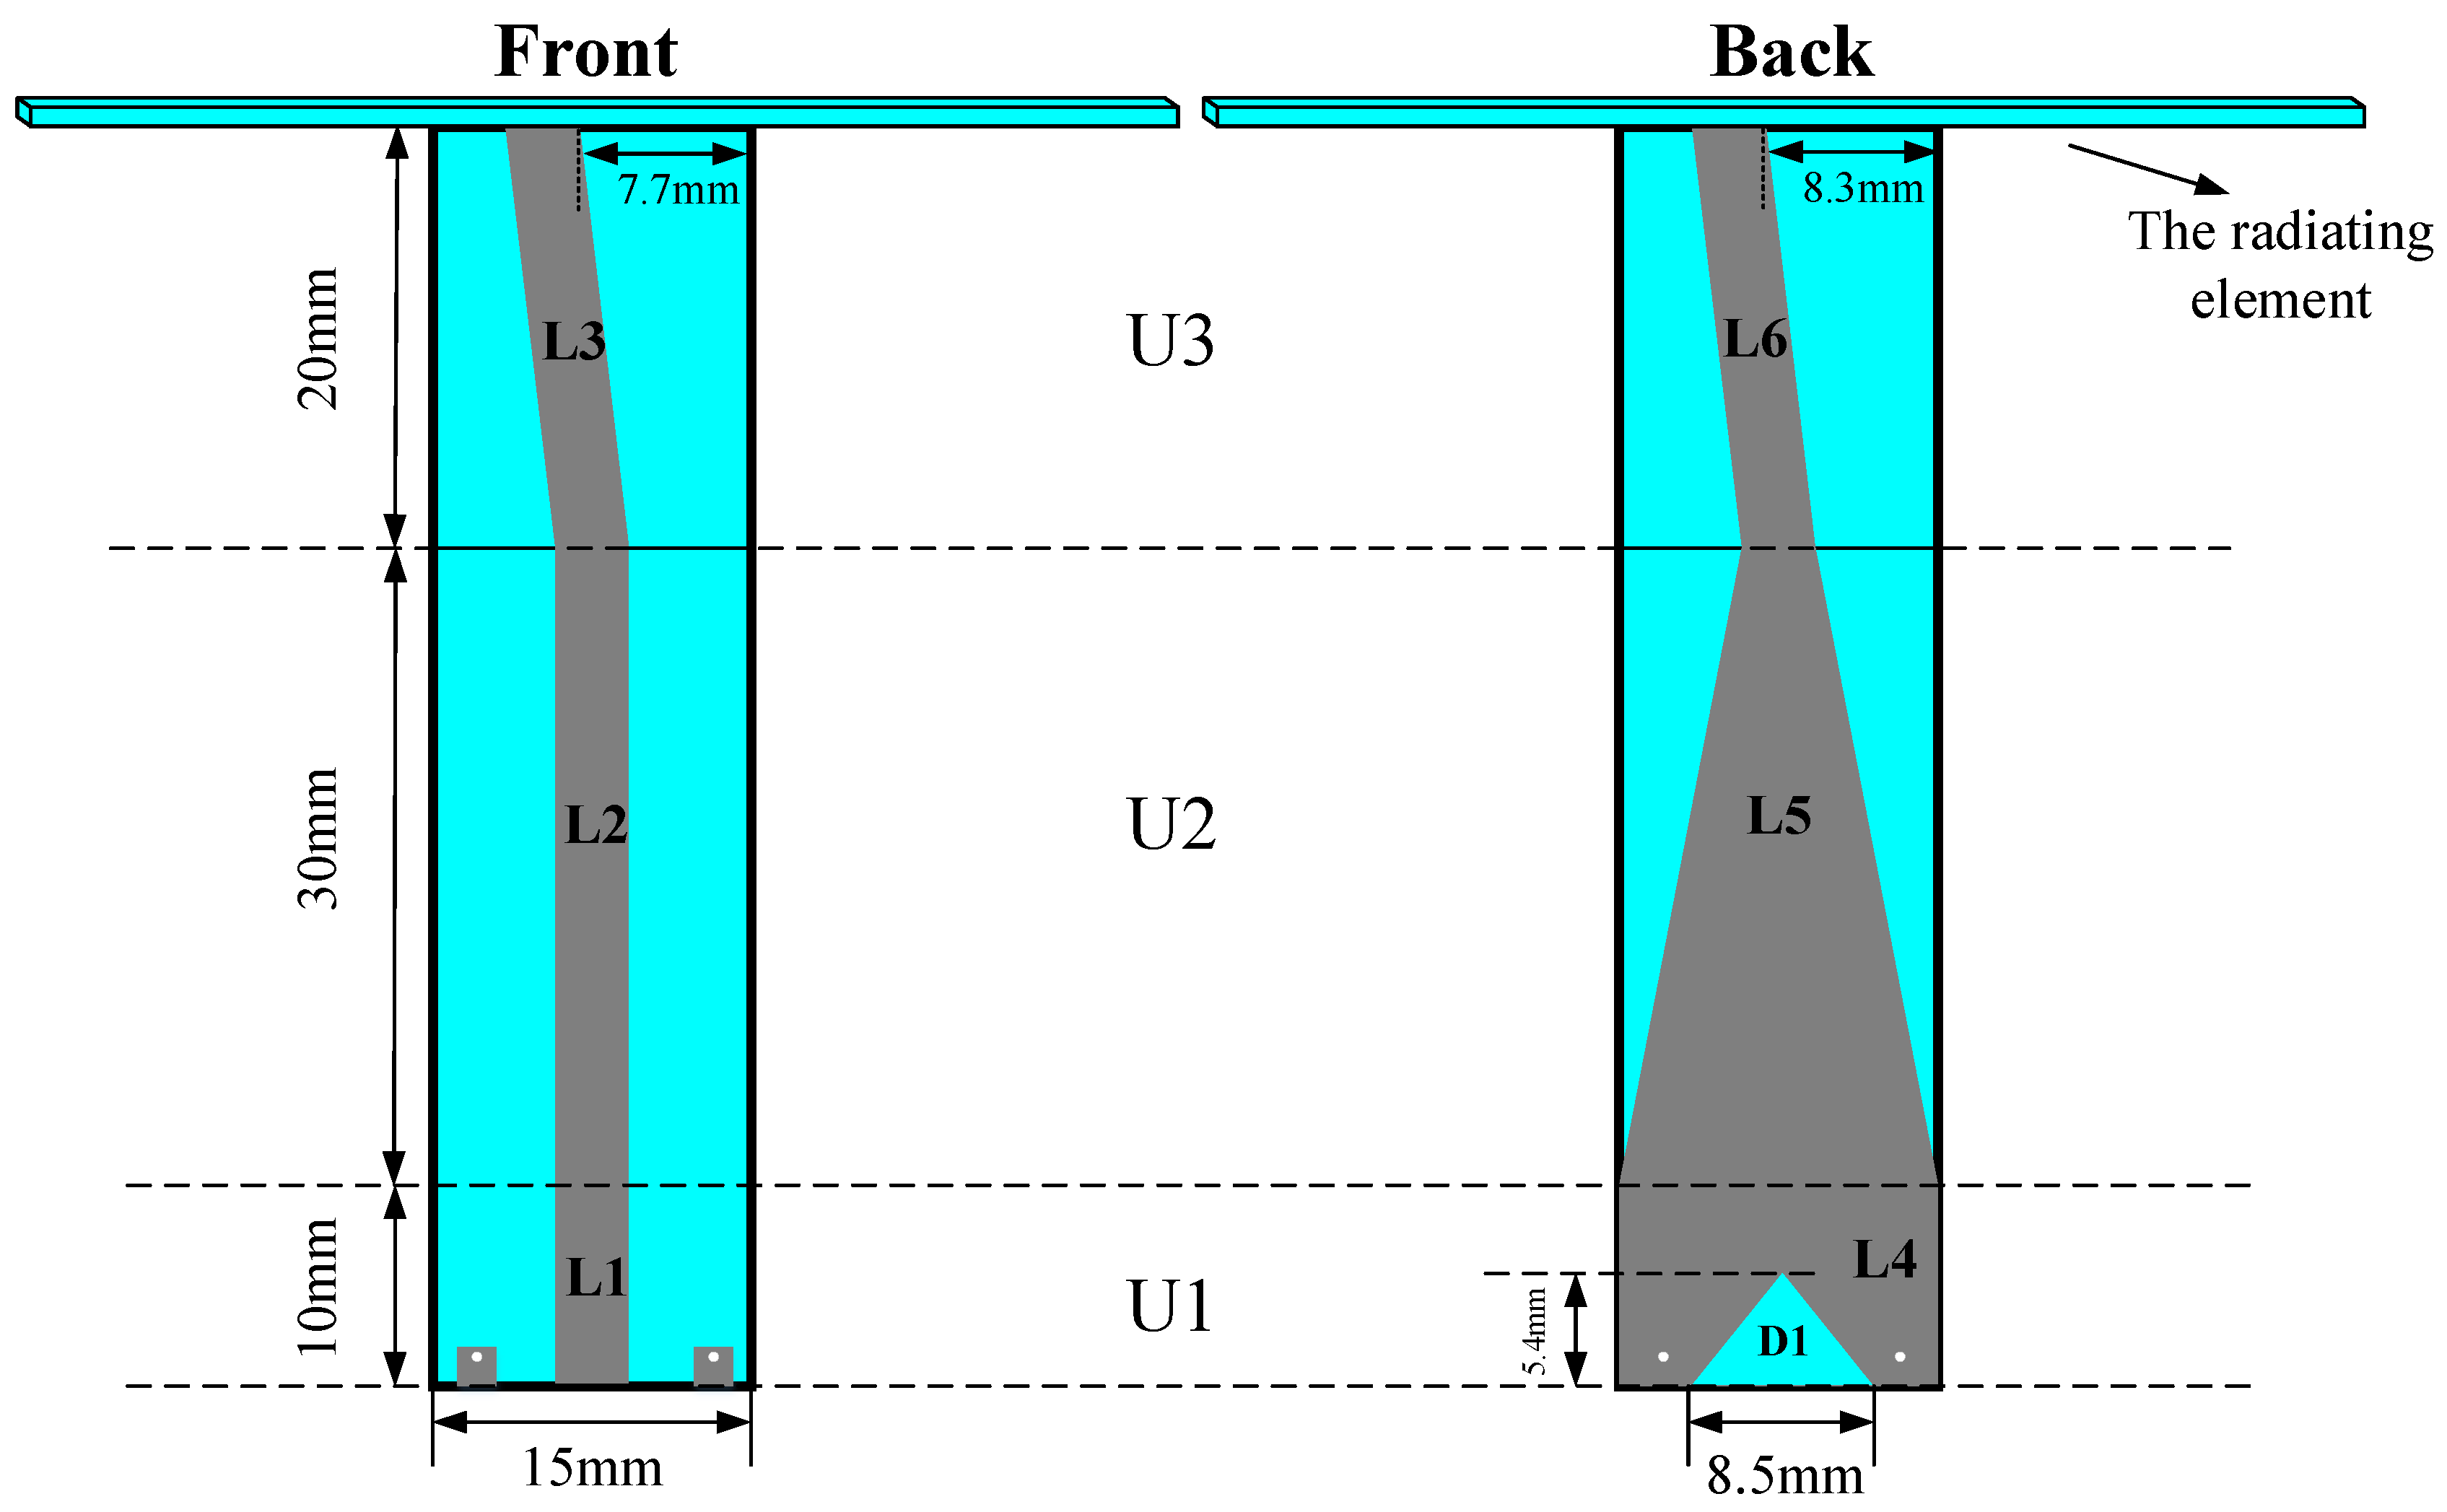
The proposed balun and the dimensional information are shown in
Figure 5. The width of L1, L2, and L6 is 3 mm. The shape of L3 is a trapezoid, and the top and bottom lengths are 3.6 mm and 3 mm, respectively. The gap D1 under L4 is an isosceles trapezoid, and the upper length is 0.2 mm.
The theoretical total length of the balun is a quarter wavelength of 1.1 GHz, while there is a small amount of change in simulation and optimization. According to Equation (16), the input impedance Z
IN of a quarter wavelength microstrip line is defined by the characteristic impedance Z
0 and the load Z
L. Z
0 is closely related to the microstrip line width. Therefore, the input impedance of the balun is optimized mainly by changing the line widths.
The proposed balun comprises three units: U
1, U
2 and U
3. U
1 is the microwave input unit and is designed to be a coplanar waveguide, which is balanced by nature and can force the unbalanced fed-coaxial line to be balanced. The source power is input from L
1, and the two metal squares on both sides of L
1 at the bottom are connected to the ground by two vials coated with a metal conductor. To achieve good grounding conditions, the metal area of L
4 on the other side of the substrate is larger. The gap D
1 under L
4 helps to add more variables for easy optimization. U
2 is the transition unit, which contains L
2 and L
5. L
5 is a tapered line that is introduced to gradually convert L
4 to L
6 in case the impedance mismatch problem is caused by the large width difference between the two lines. U
3 is the linking-up unit that connects the balun with the spiral radiating element. The upper ends of L
3 and L
6 tilt to the left to connect with points P
1 and P
2 in
Figure 4(b).
5. Microwave Power Absorption Under the Illumination of the Proposed Antenna
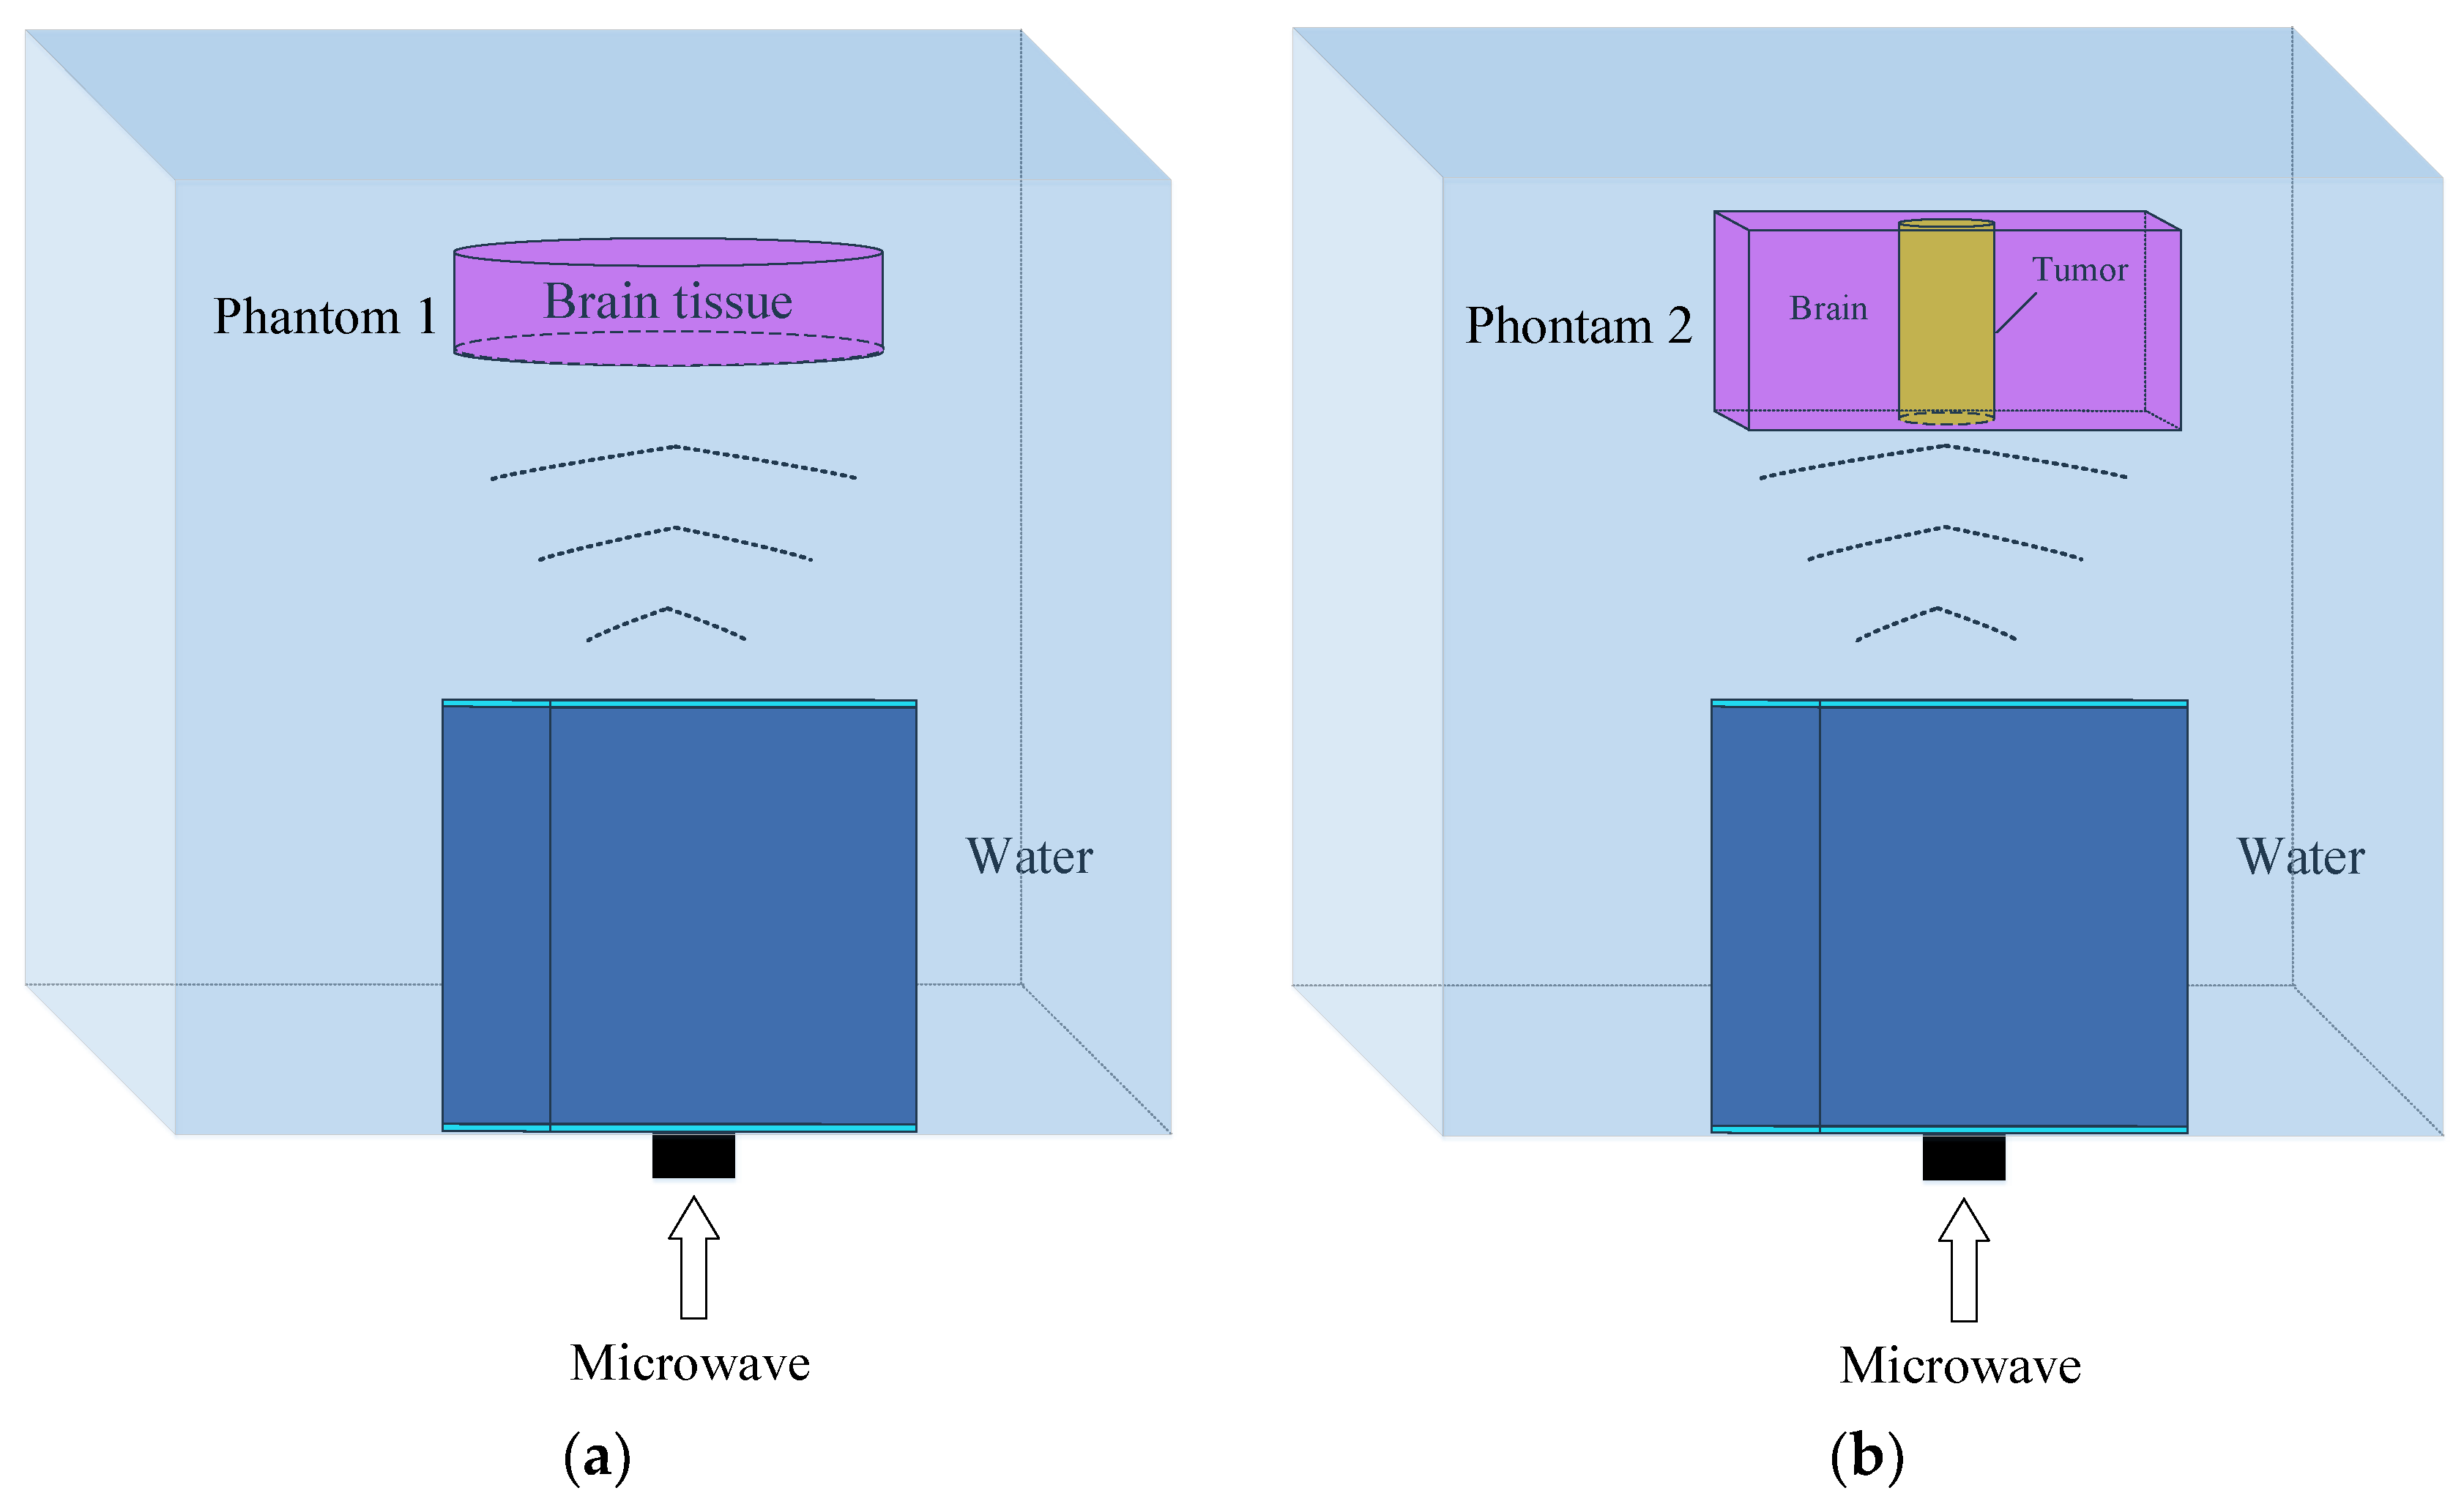
As described in the introduction, the microwave power absorption distribution reflects the substance distribution of the testing target. The high degree of conformity between the two implies good microwave illumination from the antenna. In this study, we build models to simulate the microwave power absorptions of two tissue phantoms under illumination from the proposed antenna. The models and phantoms are shown in
Figure 11.
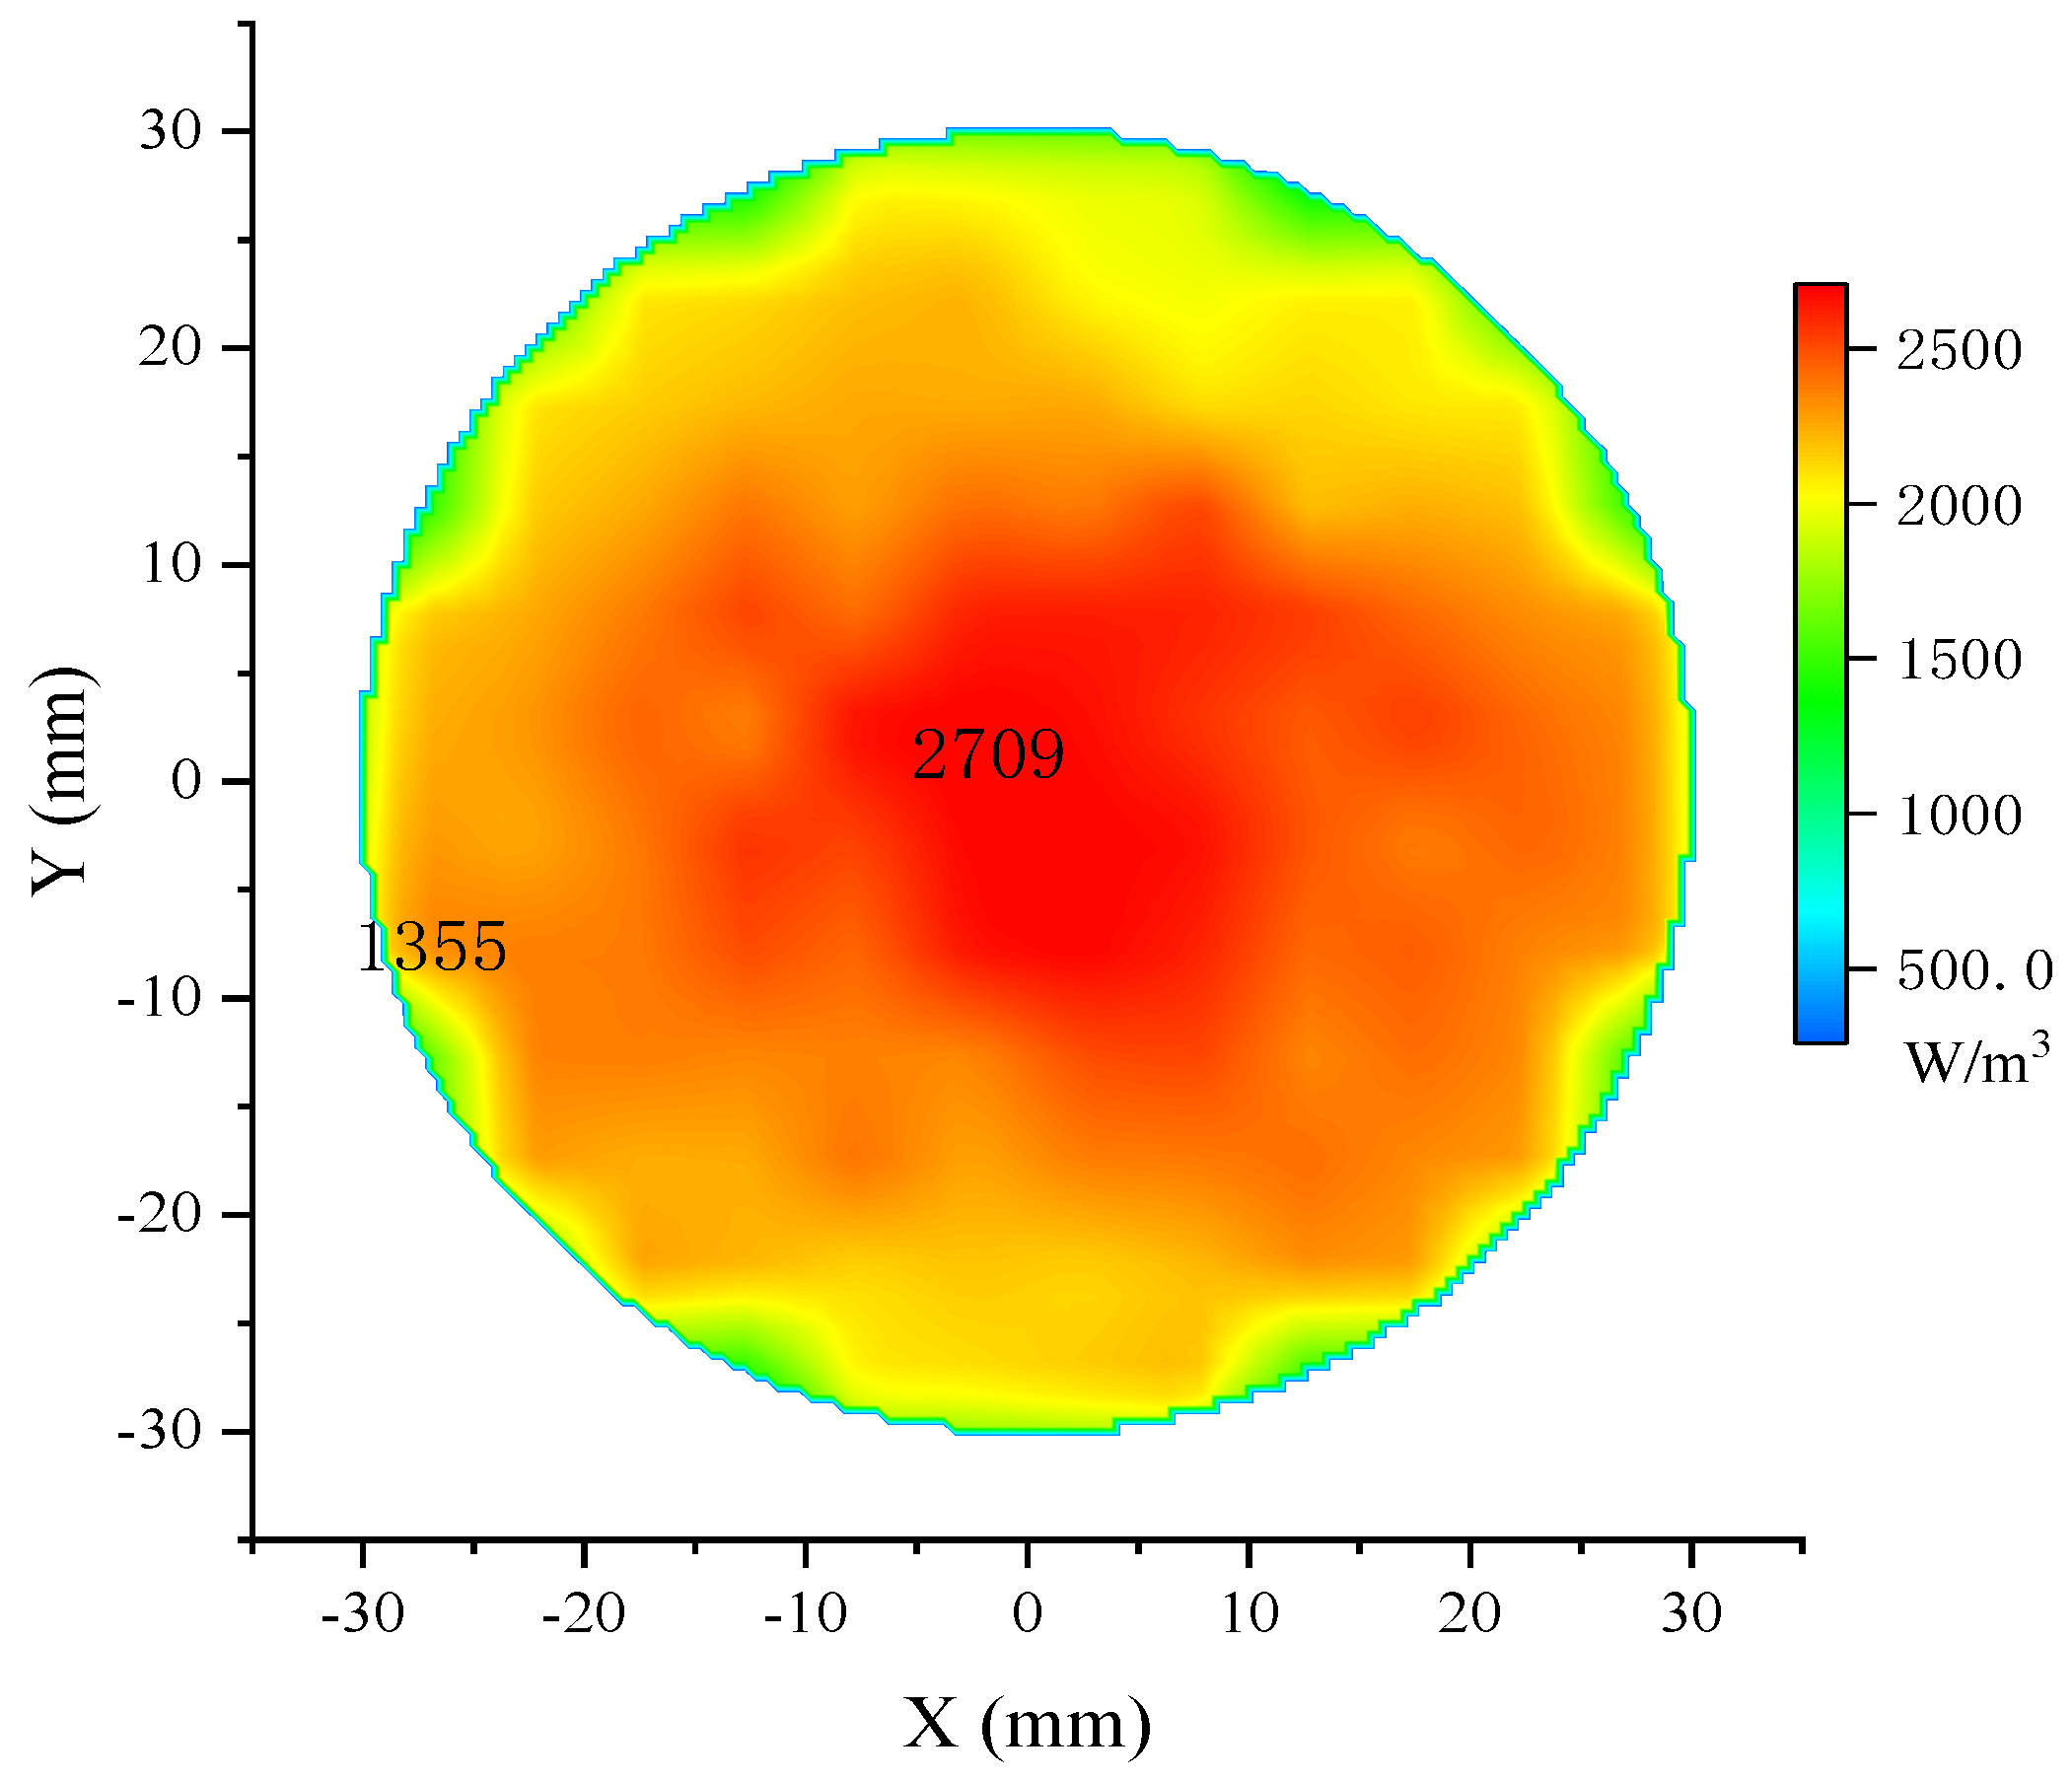
The input microwave power is 50 kW at 1.1 GHz. The pulse frequency is 10 Hz with a pulse width of 0.5 μs. The distance between the antenna and the phantom is 100 mm. Theoretically, the 3 dB power beam of the proposed antenna covers a circular area of 82.8 mm in diameter at this distance. Phantom 1 is the model of the cylindrical brain tissue; the diameter is 60 mm, and the height is 2 mm; the electrical parameters are listed in
Table 1. The 2-dimensional bird’s eye view of the microwave absorption distribution is shown in
Figure 12, and the energy value per cubic meter is represented in different colors.
The maximum amount of absorbed power is in the center and gradually decreases to half at the edge of the phantom, as shown in the two markers in
Figure 12. This distribution pattern conforms to the radiation pattern of the proposed antenna, and the resulting uneven molecular thermal motions further induce the mild uneven distribution on the same radius. Besides, the reflections at the boundaries cause more apparent fluctuations near the phantom edge. However, highly uneven distribution will decrease the accuracy of the blur identification and the quality of the restored image. According to
Figure 12, the effective microwave absorption area of phantom 1 is defined as a circle 40 mm in diameter.
Phantom 2 in
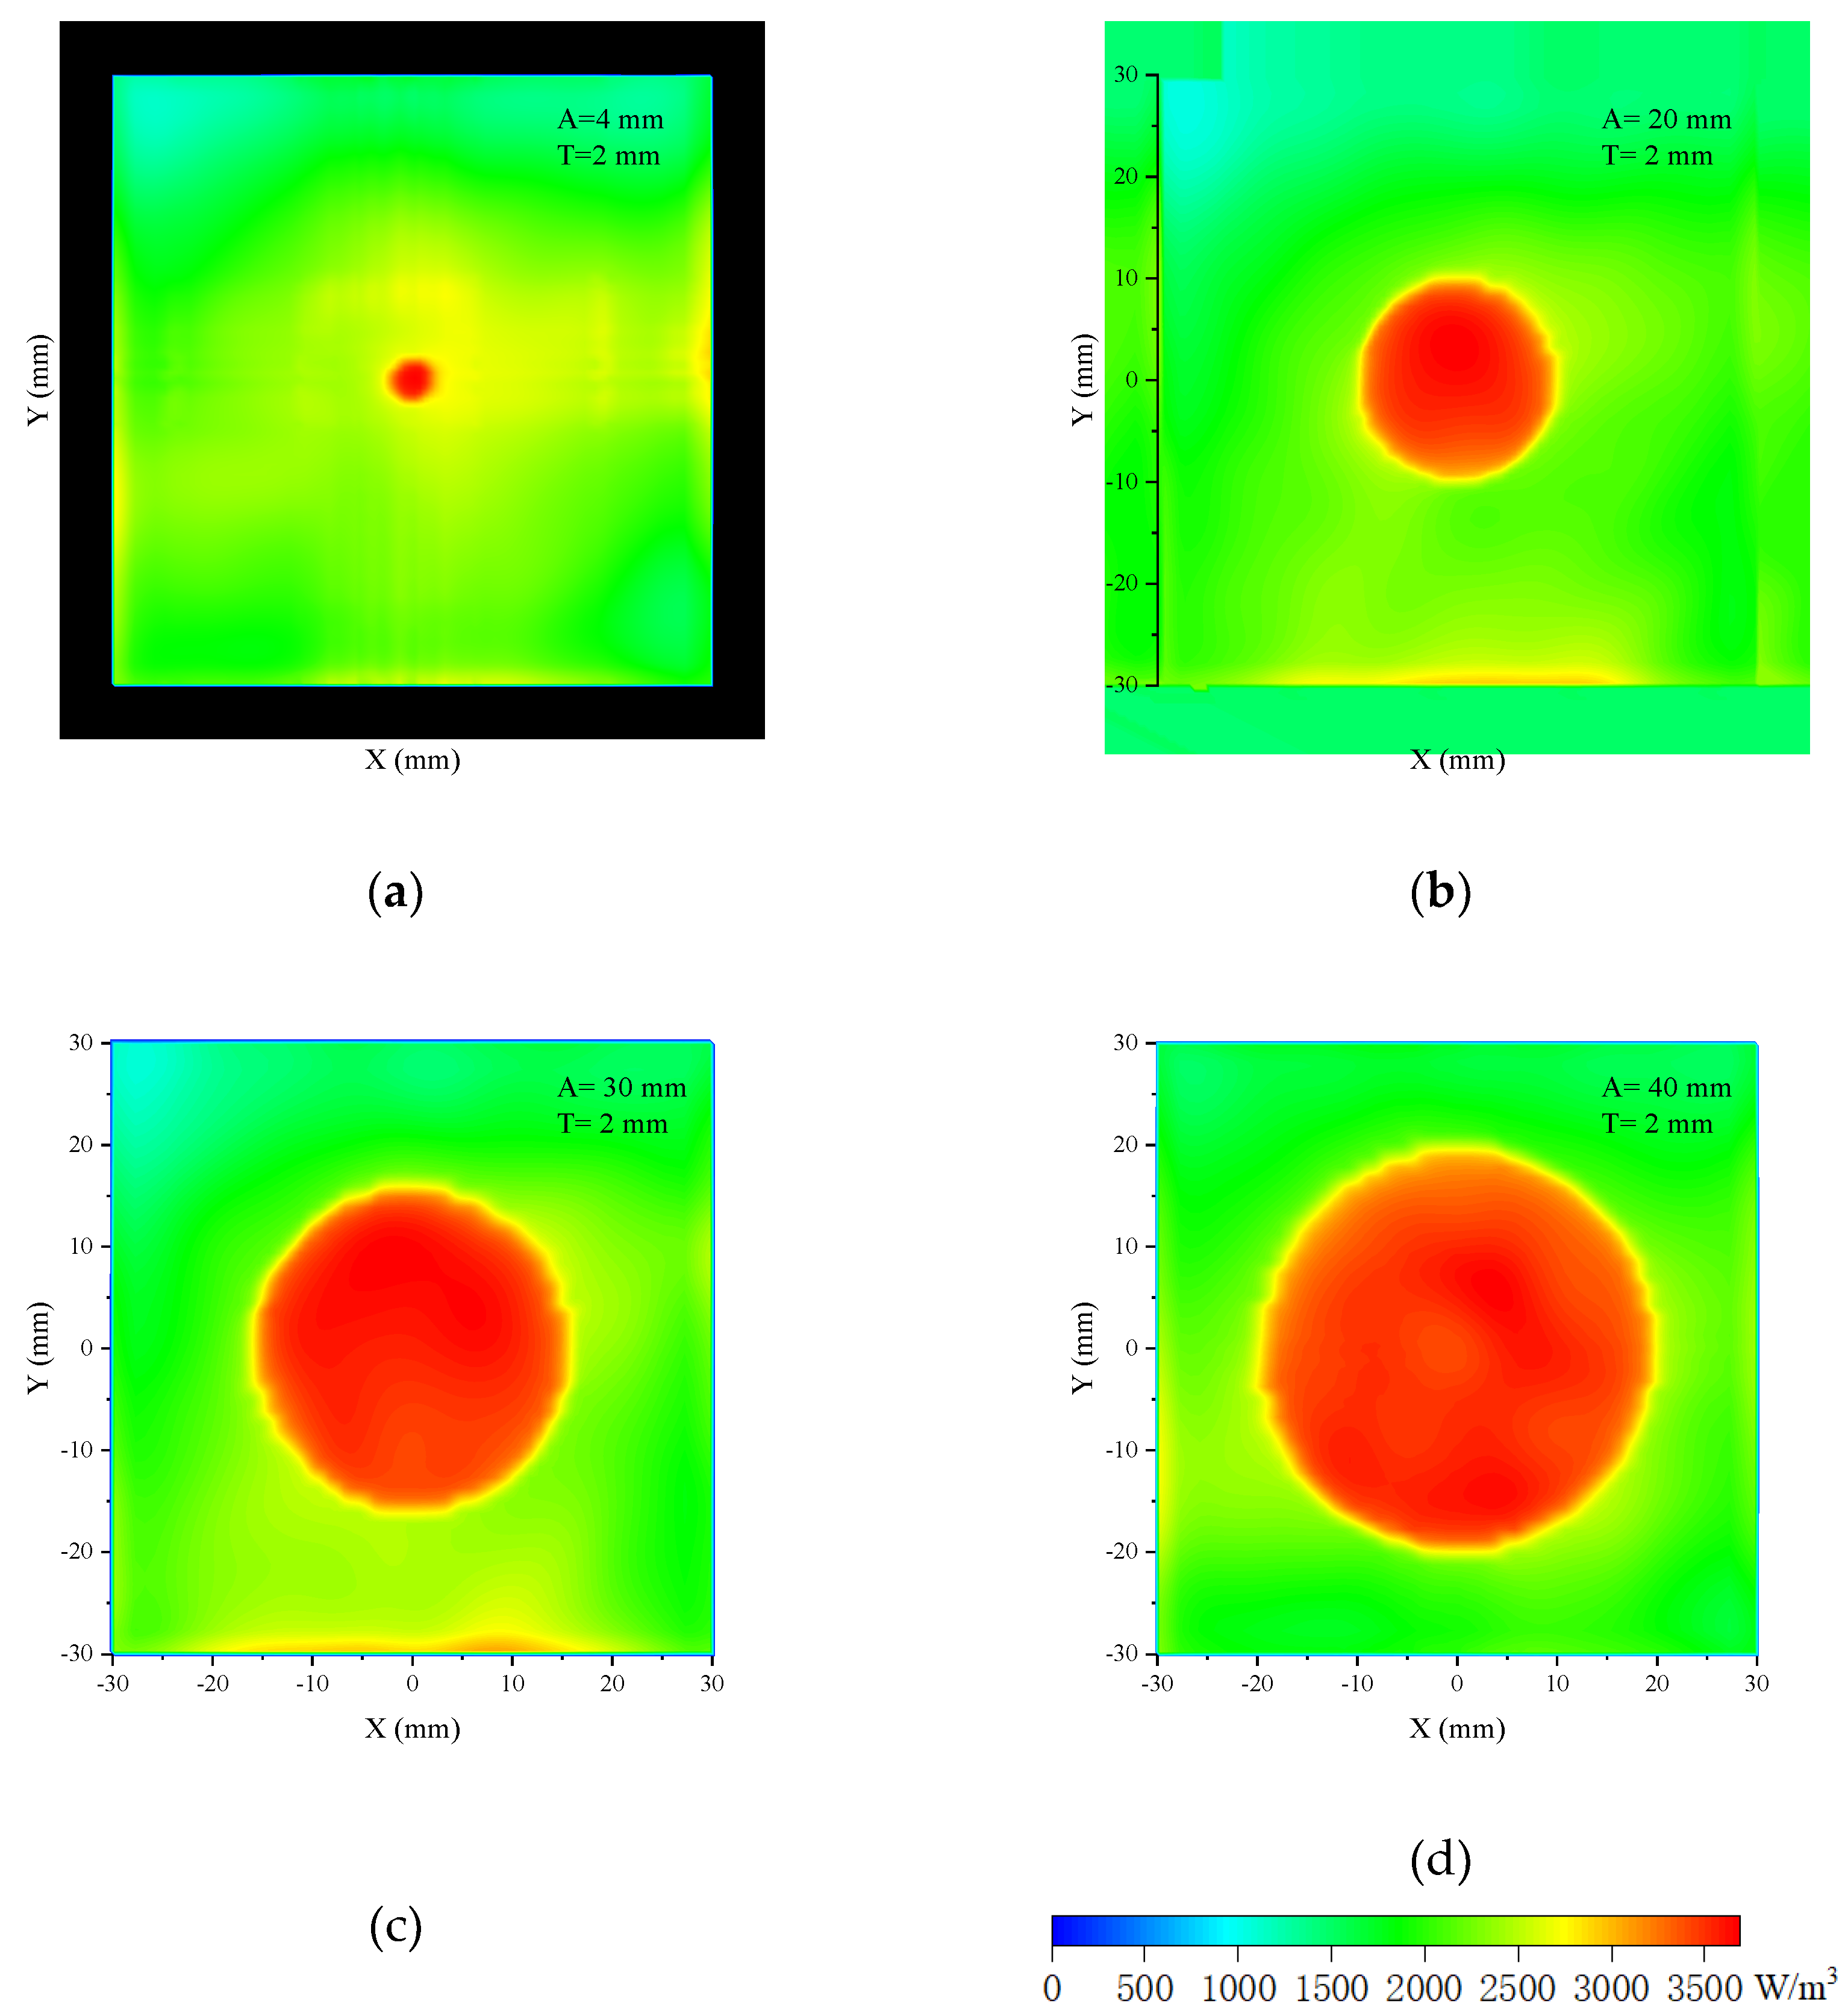
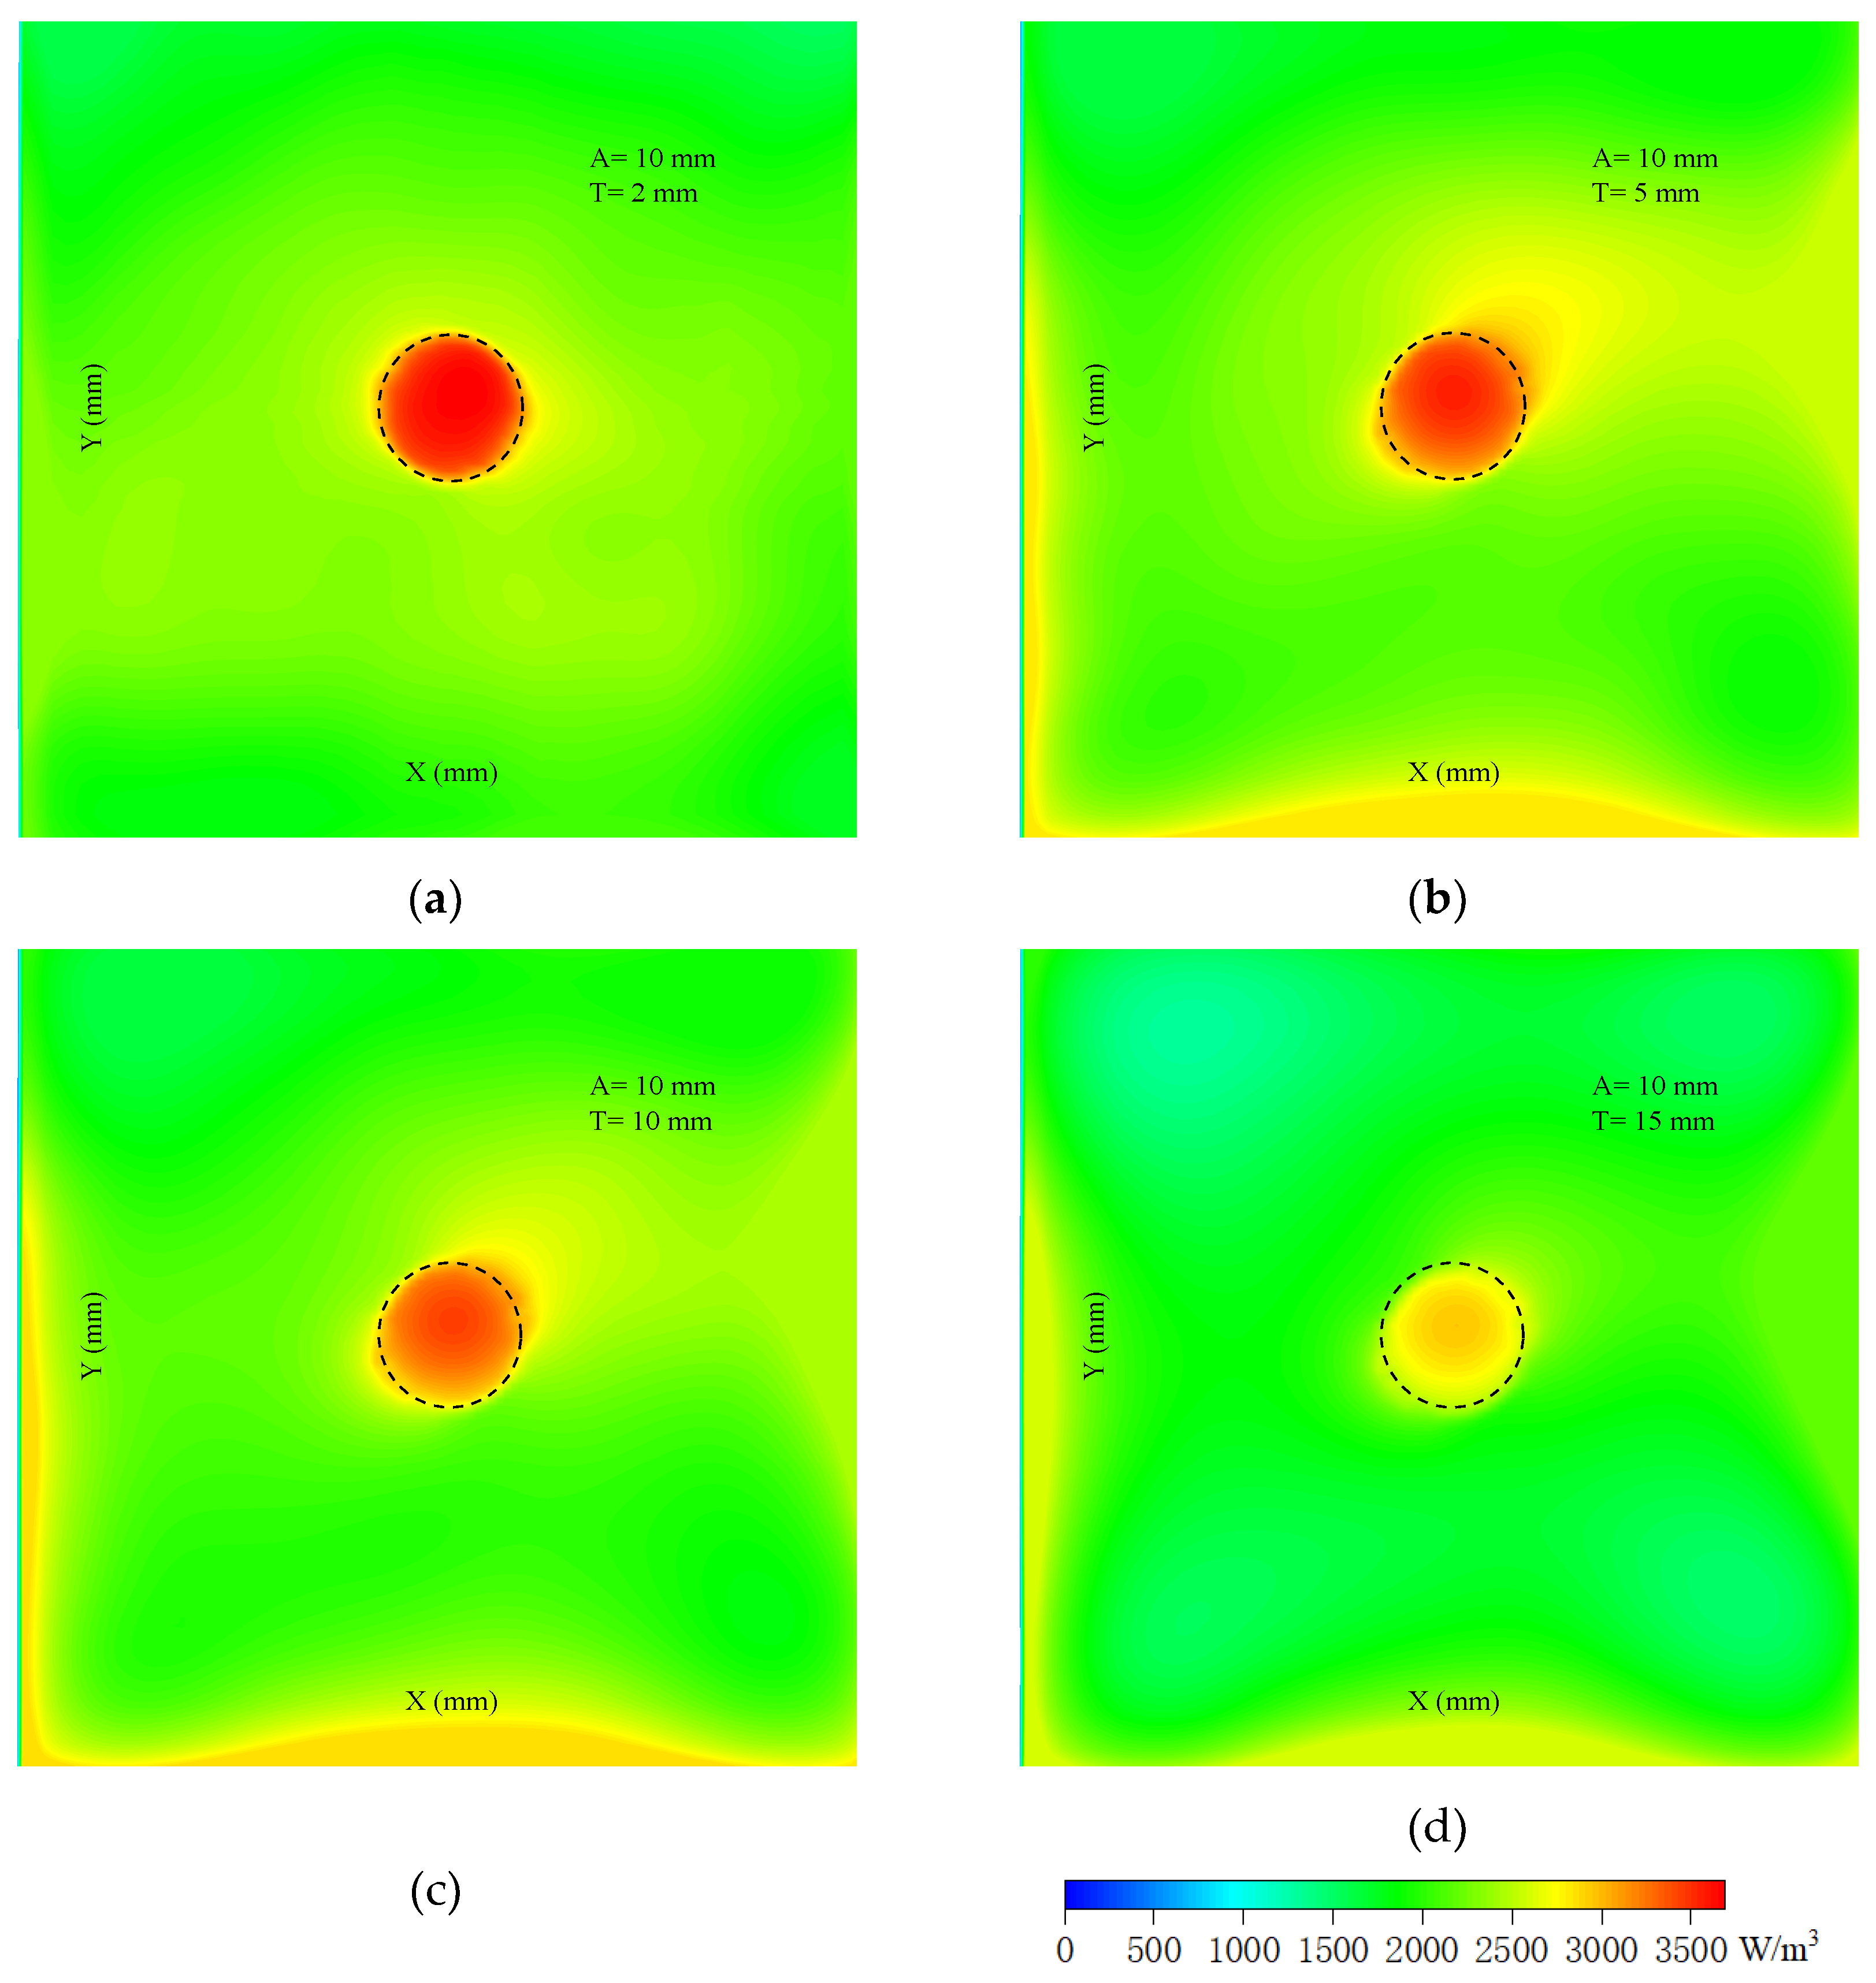
Figure 11(b) is the model in which a cylindrical tumor is inserted in the cubic brain tissue. The dimensions of the cross section of the cubic are 30 mm◊30 mm, and the height varies with that of the cylinder. The relative permittivity of the tumor is close to the muscle and is set to be 70; the conductivity is 2 S/m. Set the phantom height to 2 mm and change the tumor diameter from 4 mm, 10 mm, 20 mm, and 30 mm to 40 mm; the related 2-dimensional bird’s eye views of the microwave absorption distributions are shown in
Figure 13 and
Figure 14. When the tumor diameter is 4 mm, the outline of the tumor has a slight deformation, and the microwave absorption distribution of the brain tissue near the tumor is nonuniform. When the tumor diameter is larger, the outline of the tumor is clear and smooth, with almost no deformation. Moreover, the power absorption distribution inside the tumor is uniform. In this case, the contrast of the tumor and brain tissue is significant. The minor fluctuations near the edge of the brain tissue are caused by the boundary effect and the slight inhomogeneous illumination of the antenna. This only appears at the boundary, and the power intensity is much less than in the tumor; therefore, it makes no difference to the tumor image identification.
The imaging depth is also studied. Theoretically, the microwave penetrating depth D is calculated by Equation (18) [
47],
ω is the angular frequency,
μ is magnetic permeability,
ε is the dielectric constant,
σ is conductivity. Therefore, the calculated microwave penetrating depth D in the tumor is 32 mm. Due to the difference in dielectric properties between the tumor and the surrounding healthy tissue and the stray loss, the effective penetrating depth for a high-quality image should be less than the calculated value. The simulated results are shown in
Figure 14. The diameter of the phantom is 10 mm. When the height is 2 mm, the tumor outline is clear, and the energy distribution inside the tumor is uniform. When the height exceeds 5 mm, more energy gathers in the middle, and two small sidelobes appear at the edge of the tumor. Further increasing the height, the sidelobes become bigger, and the total amount of microwave absorption decreases. When the height comes to 10 mm, the absorbed energy at the center of the tumor is less by a third compared with the 2 mm case. It is even worse for the 15 mm case; though the tumor is still recognizable, the contrast becomes very low.
Above all, under the microwave illumination provided by the proposed antenna under water, brain tissue and tumors within the dimensions of 5 mm in thickness and 40 mm in diameter absorb microwave power sufficiently and uniformly, which induces strong ultrasonic signals. When the tumor is inside brain tissue, there is a huge difference in absorbed microwave power between both, and the microwave absorption distribution map is in high contrast and accurately reflects the fact. Assuming the ultrasonic part of the MITAT system is ideal, the final images should have no difference from the microwave absorption distribution map, indicating the availability and potentiality of the proposed antenna in brain tumor detection.
6. Conclusion
In this article, an ultra-wideband water immersion antenna for underwater thermoacoustic sensing in biomedical imaging applications has been designed. The power losses of microwave and ultrasonic waves in water and mineral oil of the MITAT system have been analyzed and compared. Theoretical analysis, simulations, and experiments have been made to analyze and verify the good working performance of the proposed antenna. As a result, it has ultra-wide bandwidth in impedance matching, axial ratio, and radiation pattern, indicating stability, flexibility, and reliability in biomedical applications. The simulations on microwave absorption distribution of brain tissue and tumor have been made; the results indicate that the proposed antenna provides satisfactory illumination and thereby achieve uniform microwave absorption distribution inside the tumor and high contrast between the tumor and the surrounding healthy brain tissues. In general, this work proves the proposed antenna has the advantages of ultra-wideband, stable performance, lightweight, antirust, and low cost, which work cooperatively with the ultrasonic sensor to make the MITAT efficient in biomedical imaging. This work would also provide a basis for further development and optimization of water immersion antennas for various applications, such as underwater sensor networks and underwater communications.
Author Contributions
Conceptualization, F. T.; data curation, F. T.; Formal analysis, investigation, F. T.; methodology, F. T.; software, F. T.; validation, F. T.; visualization, F. T.; writing-original draft, F. T.; writing-review & editing, F. T.; Funding acquisition, F. T. and H. W.; project administration, F. T. and H. W.; resources, F. T. and H. W.; supervision, F. T. and H. W. All authors have read and agreed to the published version of the manuscript.”
Figure 1.
Block diagram of the process of MITAT.
Figure 1.
Block diagram of the process of MITAT.
Figure 2.
Histograms of acoustic impedance differences and microwave power losses when the four tissues are illuminated in mineral oil and water, respectively.
Figure 2.
Histograms of acoustic impedance differences and microwave power losses when the four tissues are illuminated in mineral oil and water, respectively.
Figure 3.
Schema of the decomposed structures for the proposed antenna.
Figure 3.
Schema of the decomposed structures for the proposed antenna.
Figure 4.
Front views of the proposed radiating element.
Figure 4.
Front views of the proposed radiating element.
Figure 5.
Front and back views of the proposed balun.
Figure 5.
Front and back views of the proposed balun.
Figure 6.
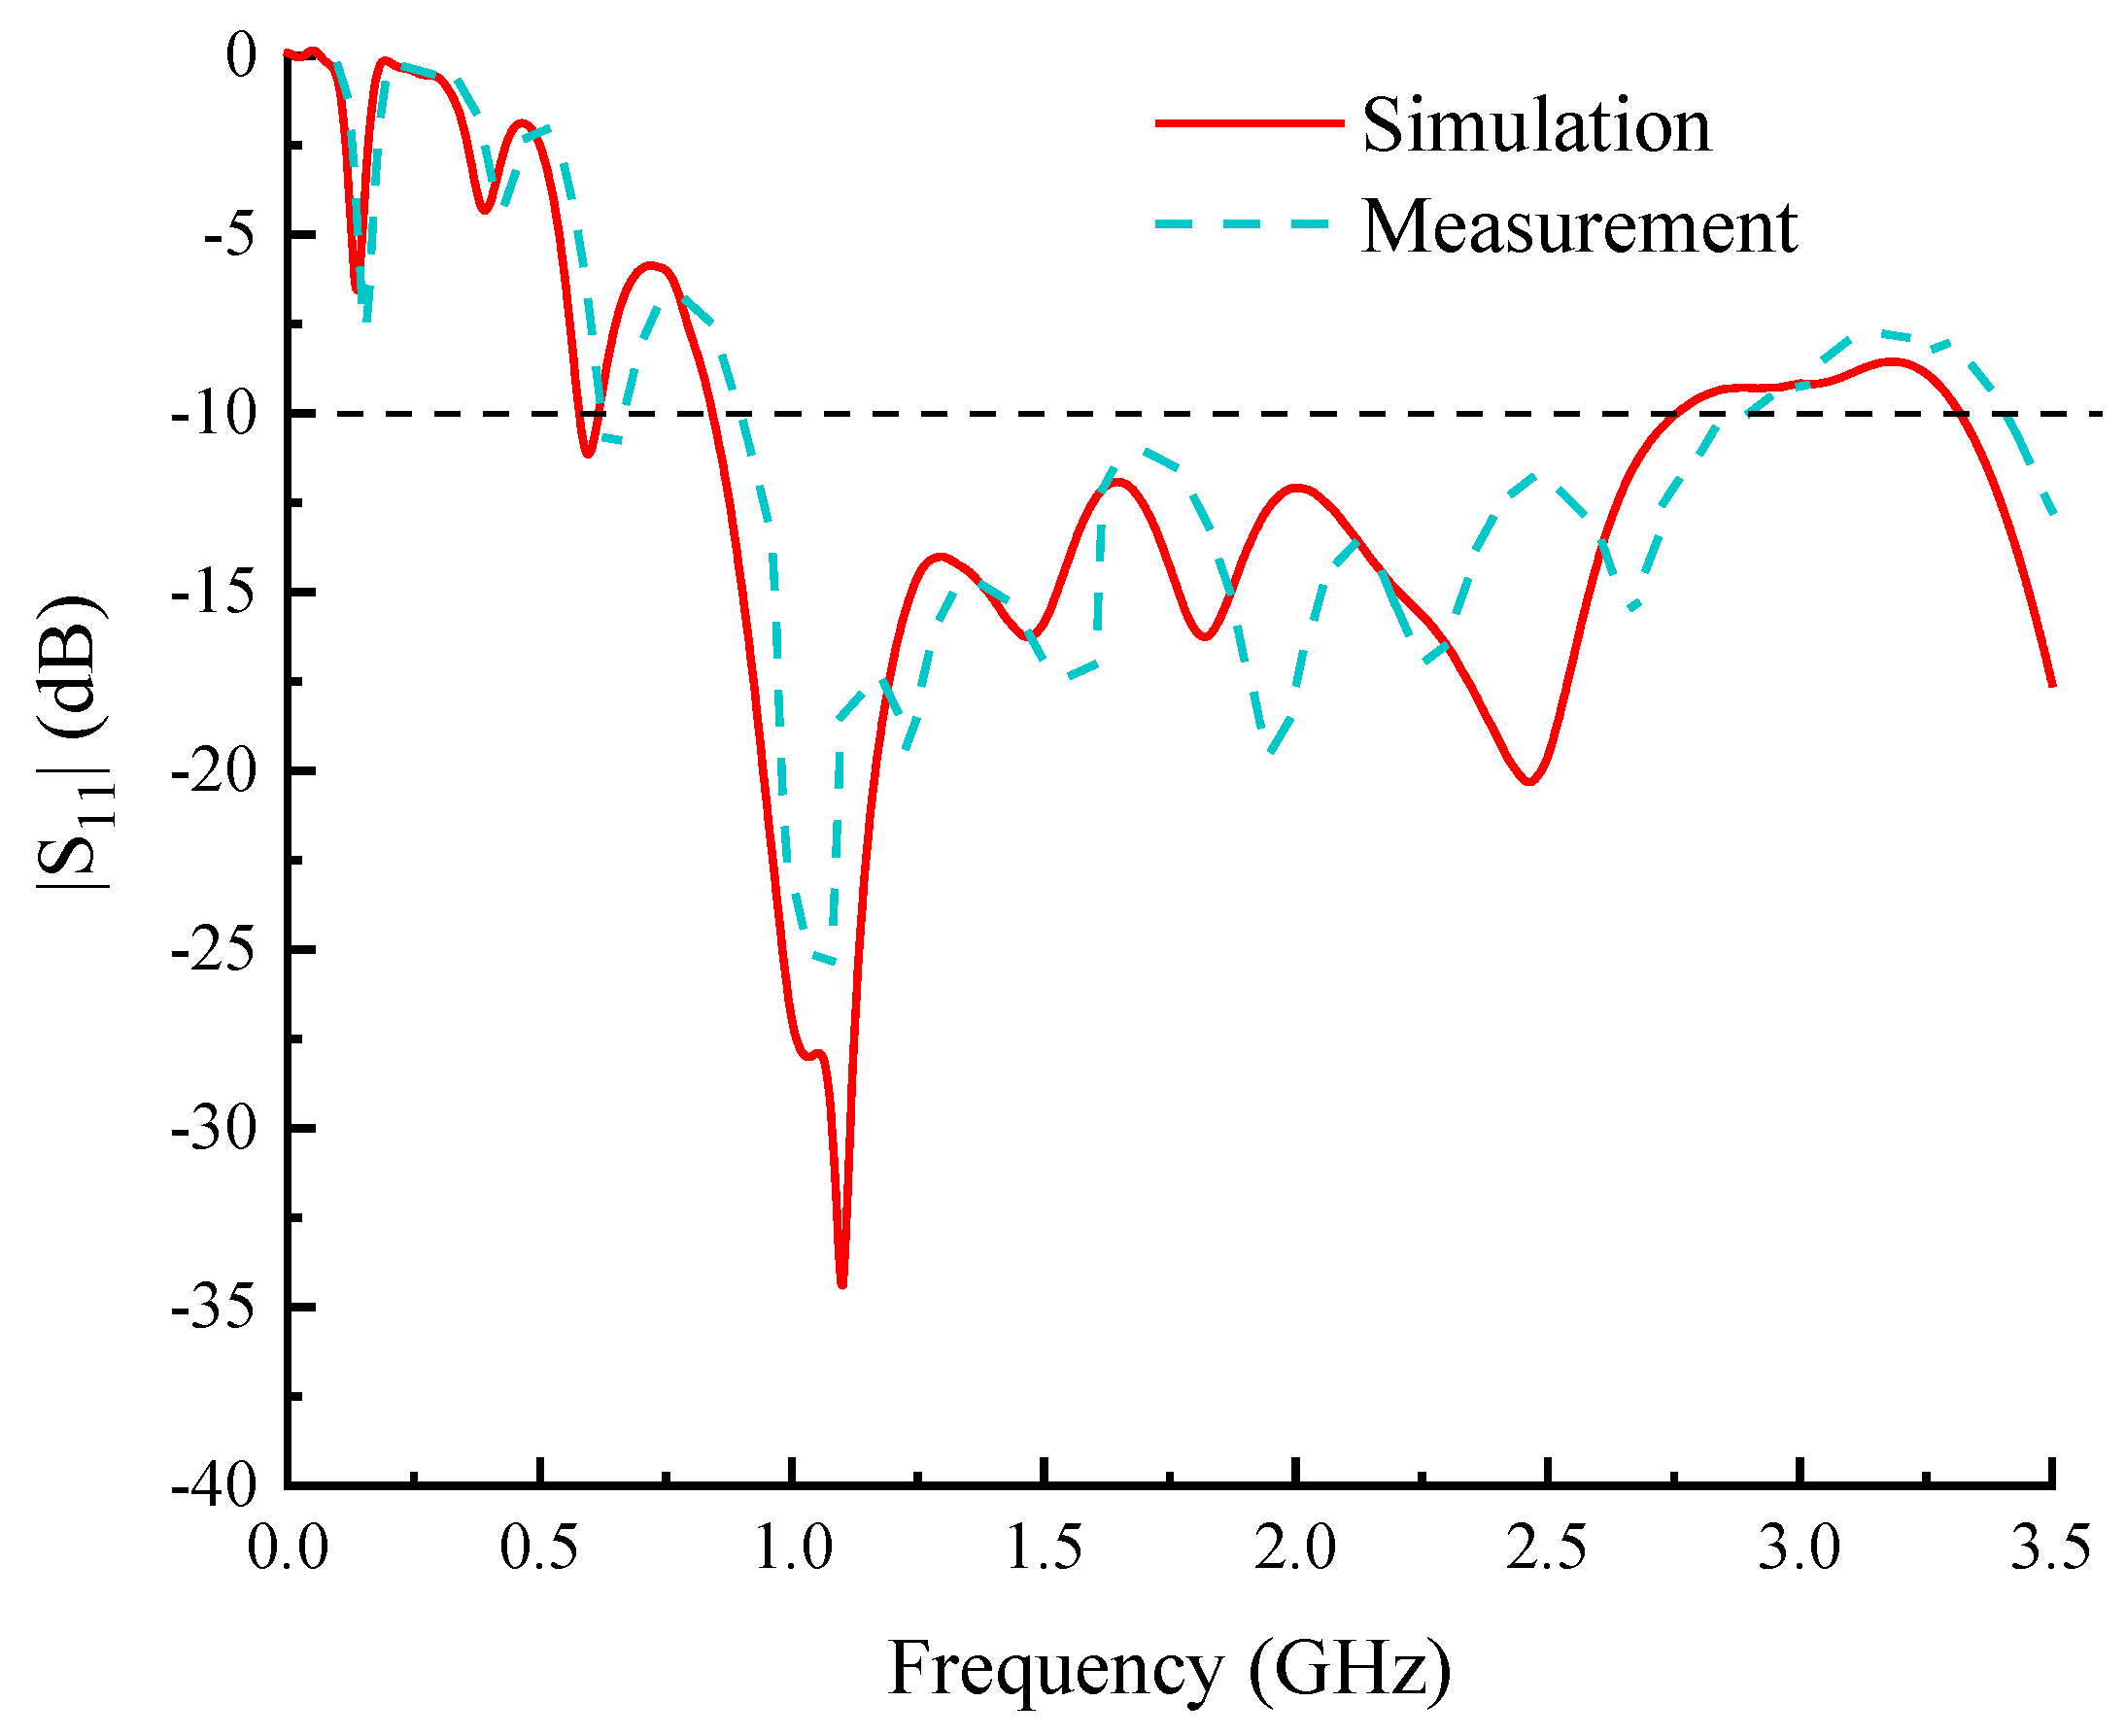
S parameters of the proposed antenna.
Figure 6.
S parameters of the proposed antenna.
Figure 7.
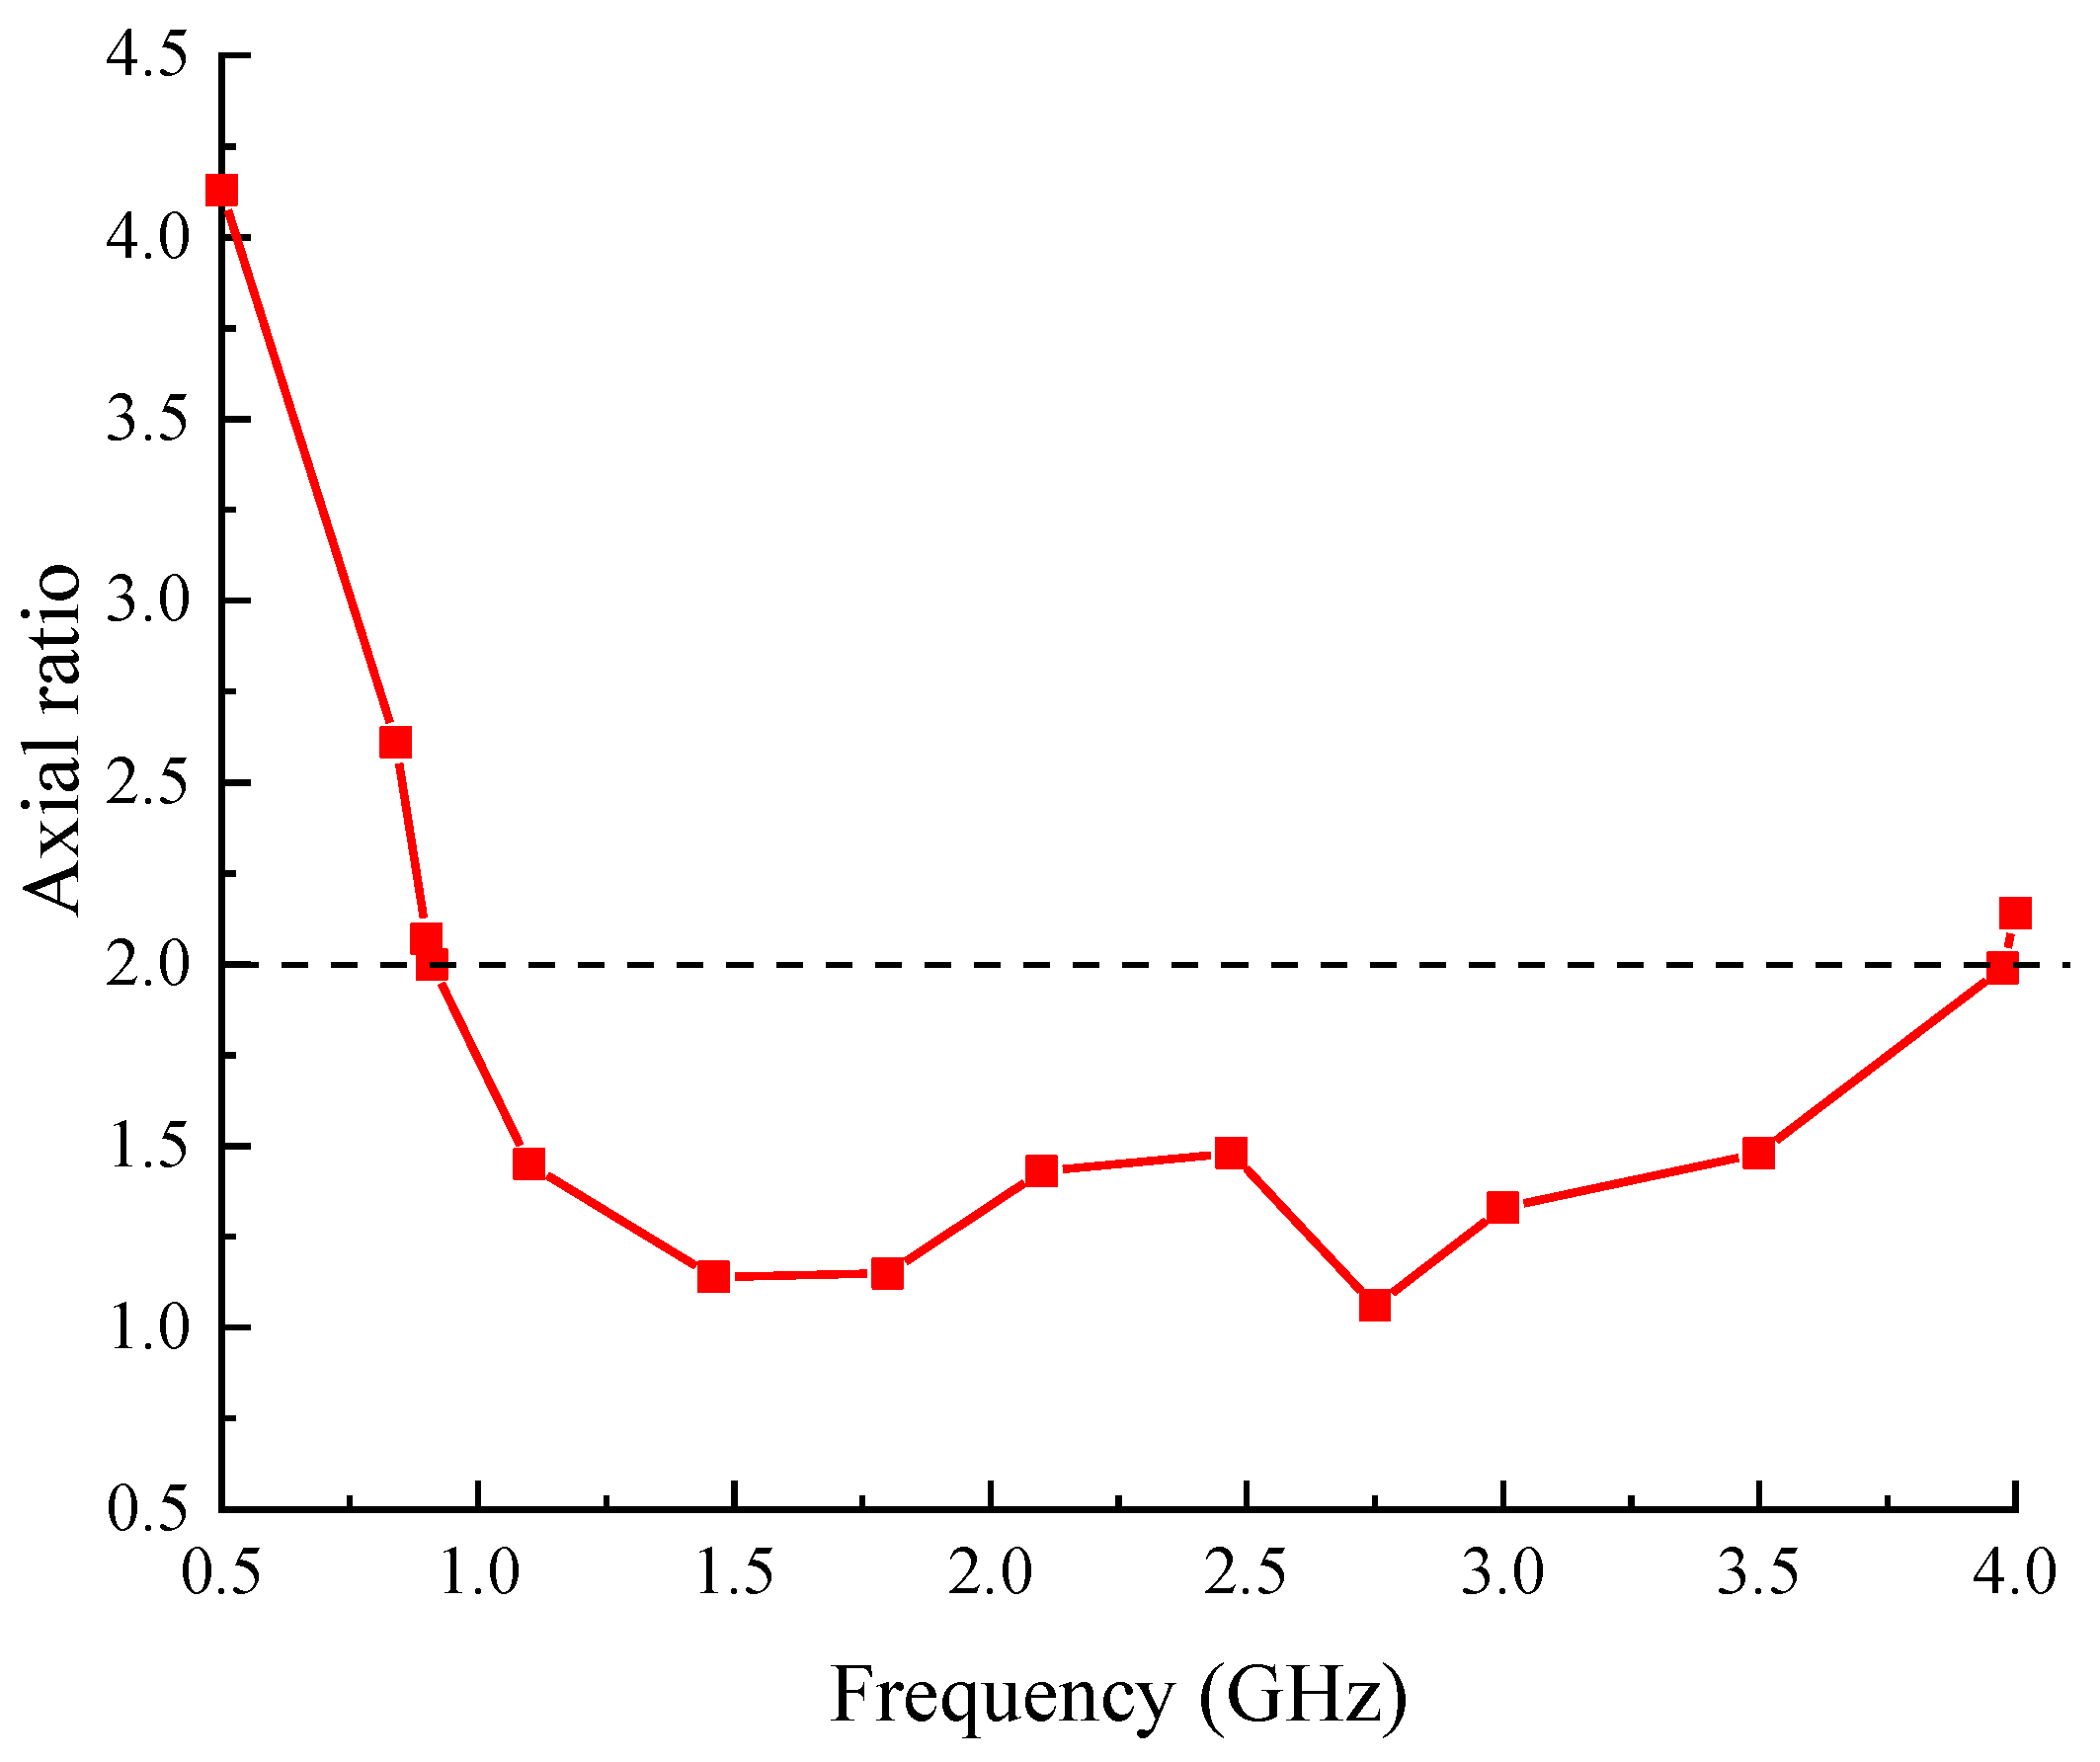
Axial ratios of the proposed antenna.
Figure 7.
Axial ratios of the proposed antenna.
Figure 8.
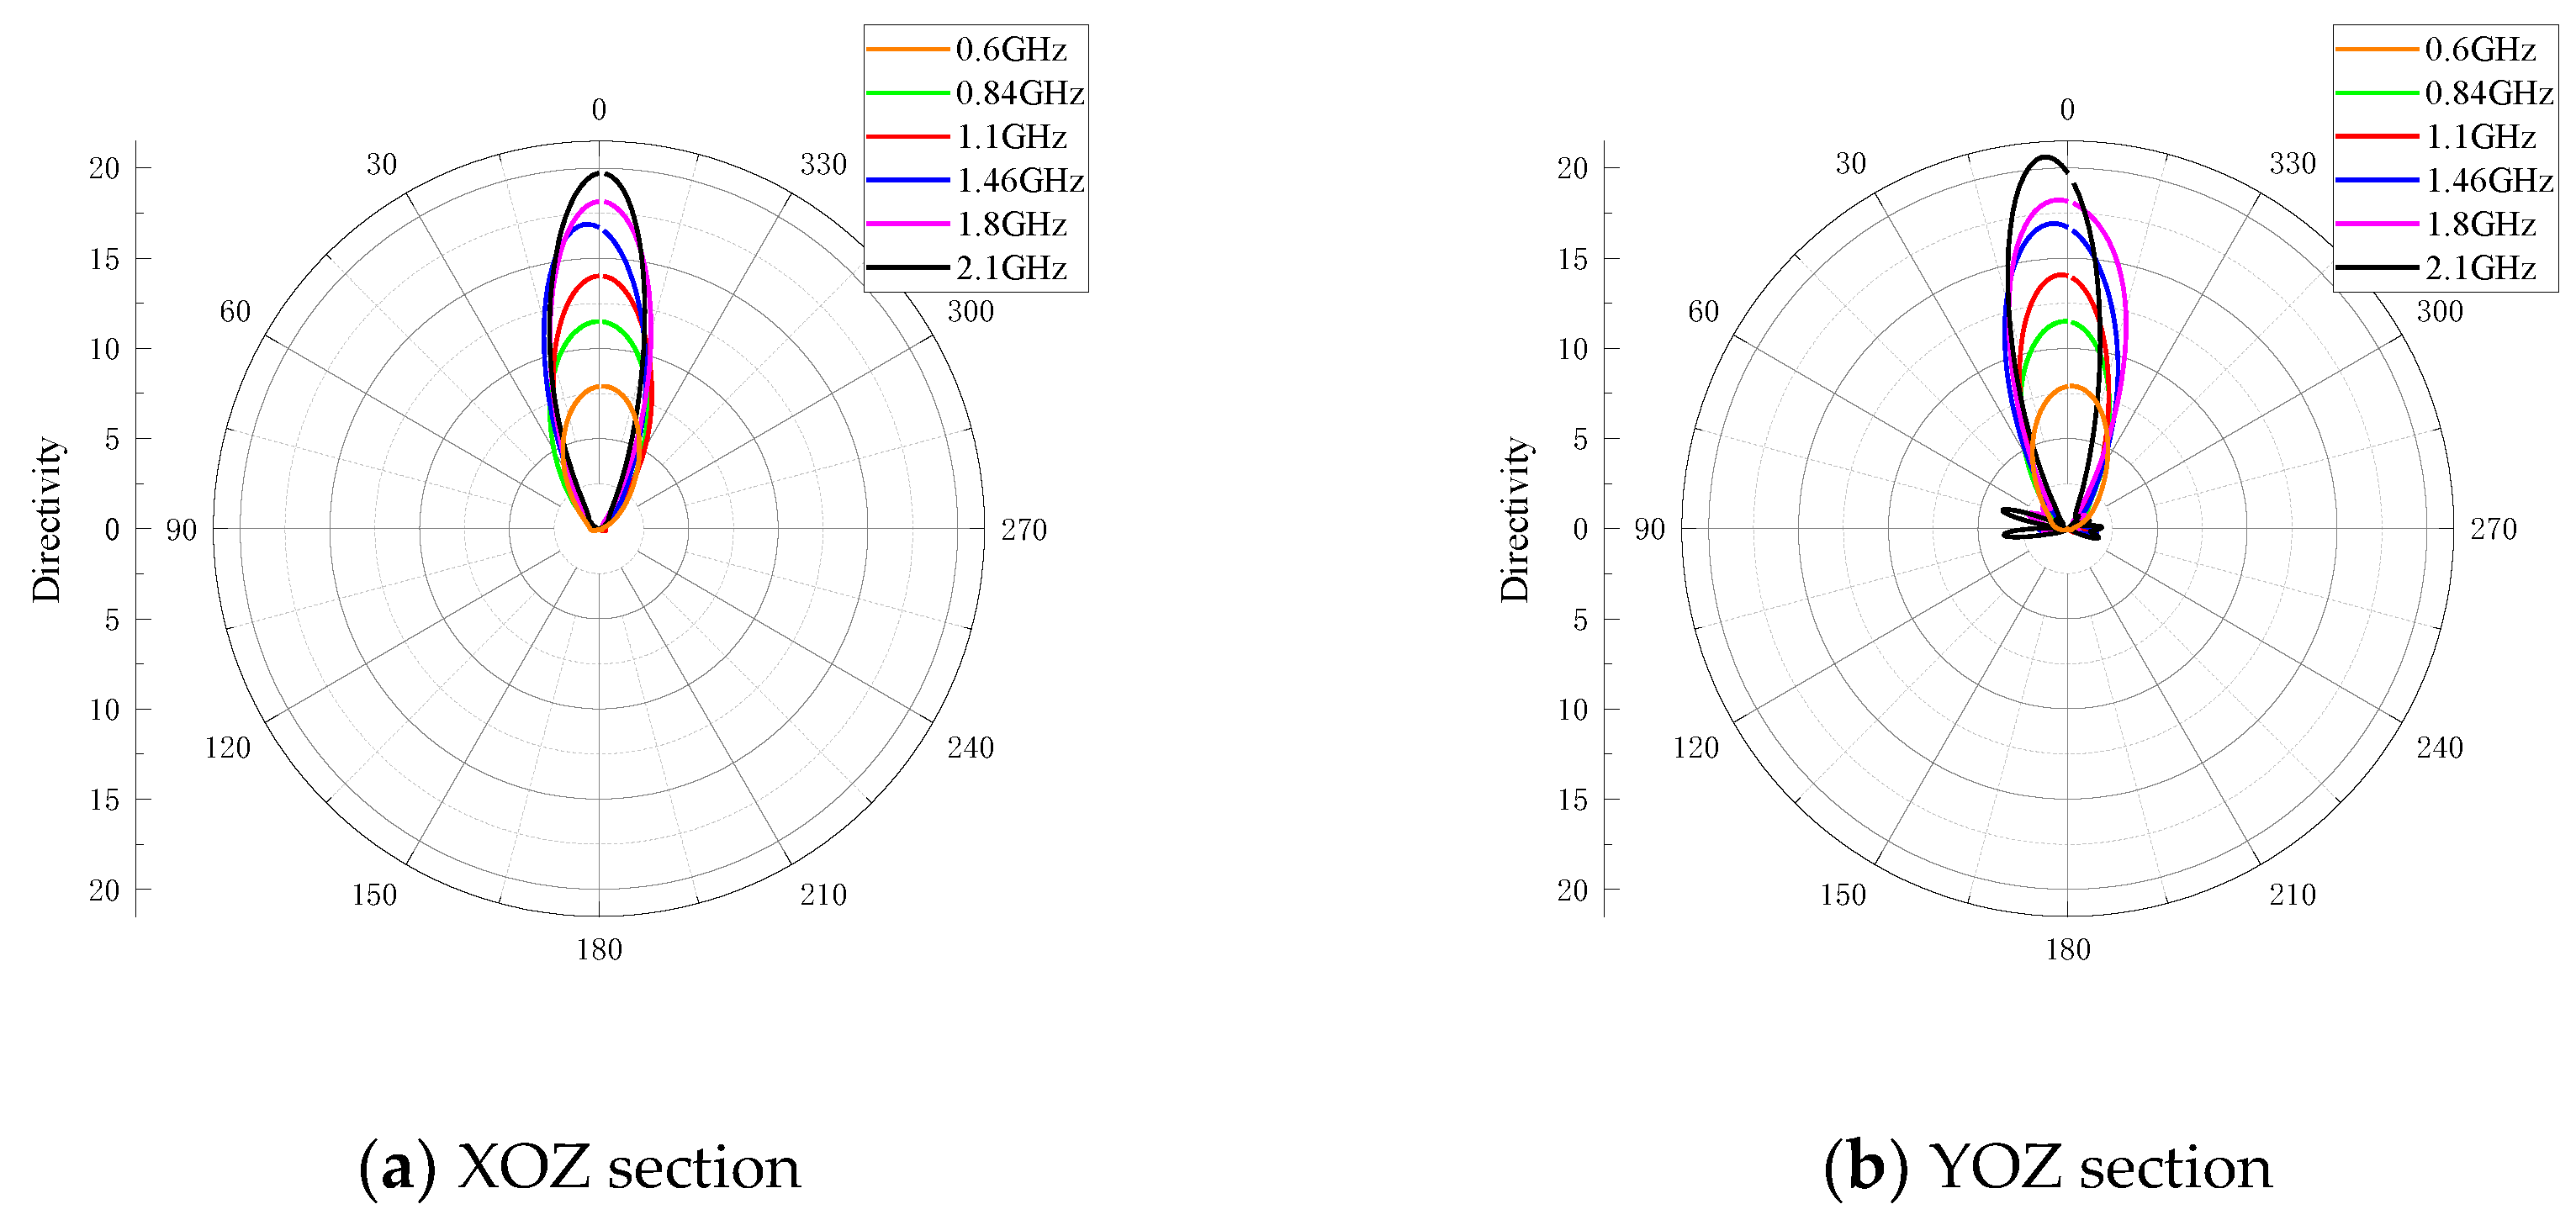
Radiation patterns of XOZ and YOZ sections of the proposed antenna.
Figure 8.
Radiation patterns of XOZ and YOZ sections of the proposed antenna.
Figure 9.
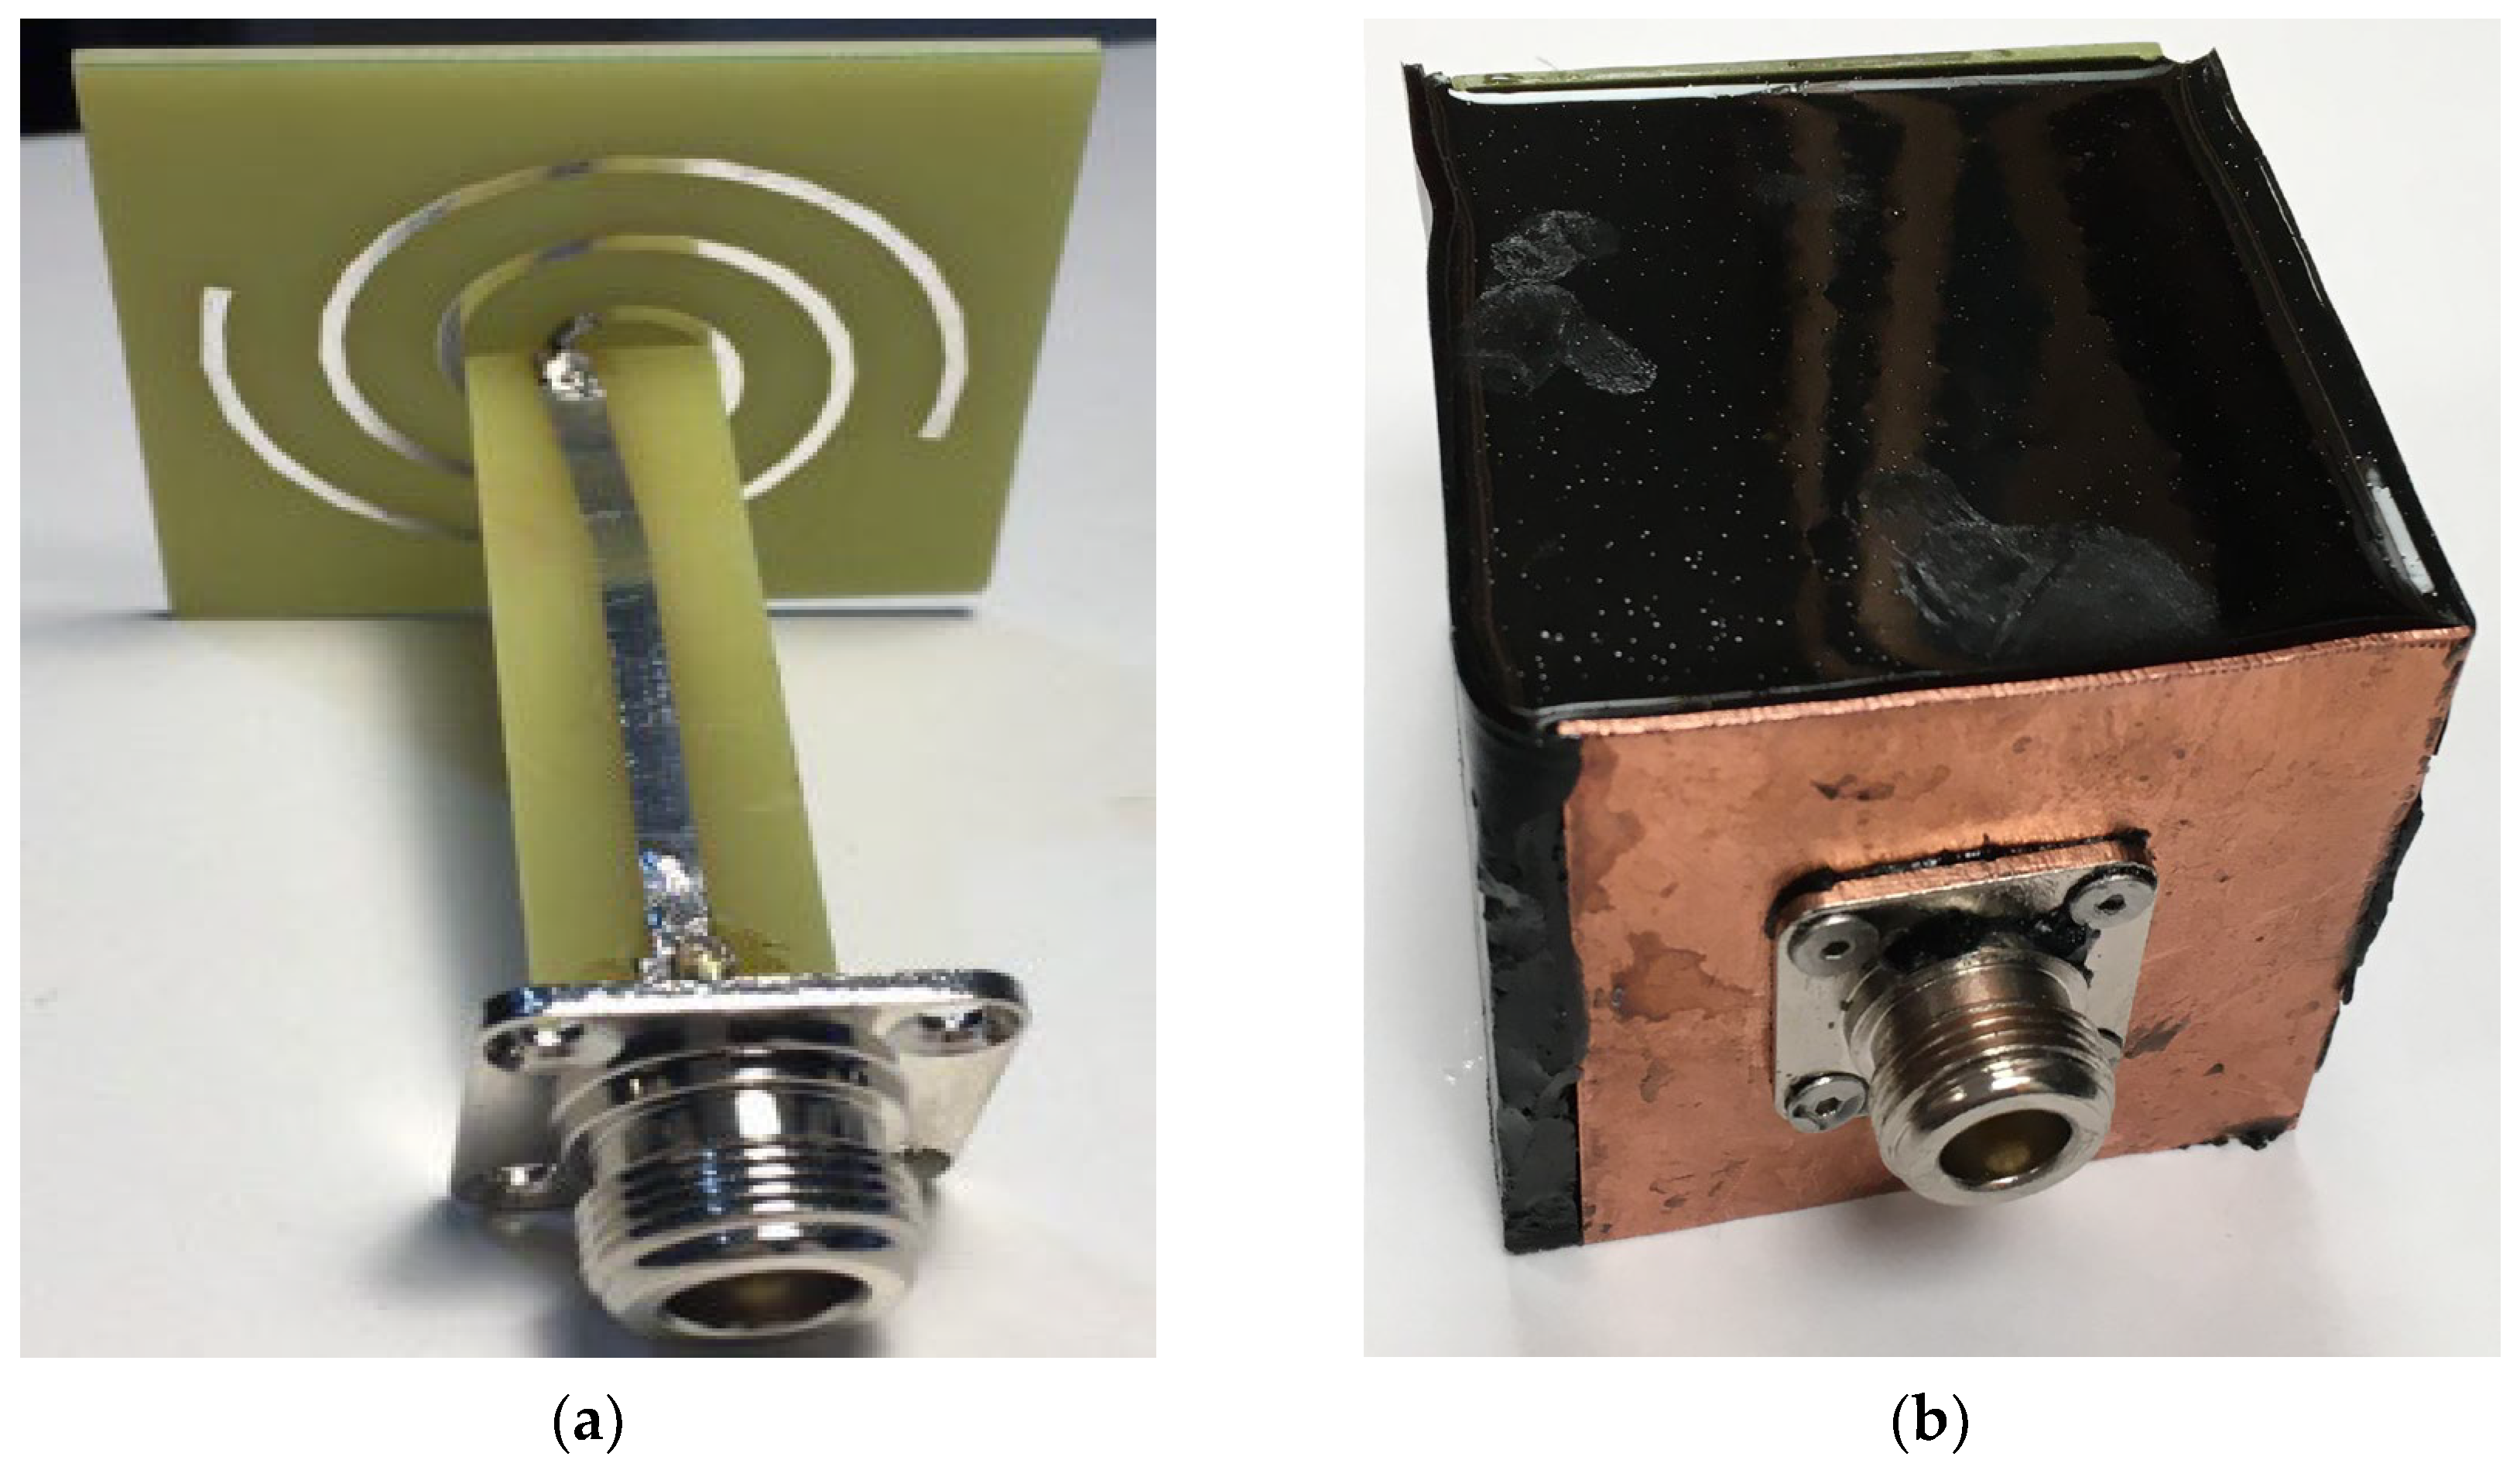
Photographs of the proposed antenna. (a) is the inner circuits that contains the fabricated radiation element and balun, (b) is the full view of the fabricated antenna, the black object is the shelter.
Figure 9.
Photographs of the proposed antenna. (a) is the inner circuits that contains the fabricated radiation element and balun, (b) is the full view of the fabricated antenna, the black object is the shelter.
Figure 10.
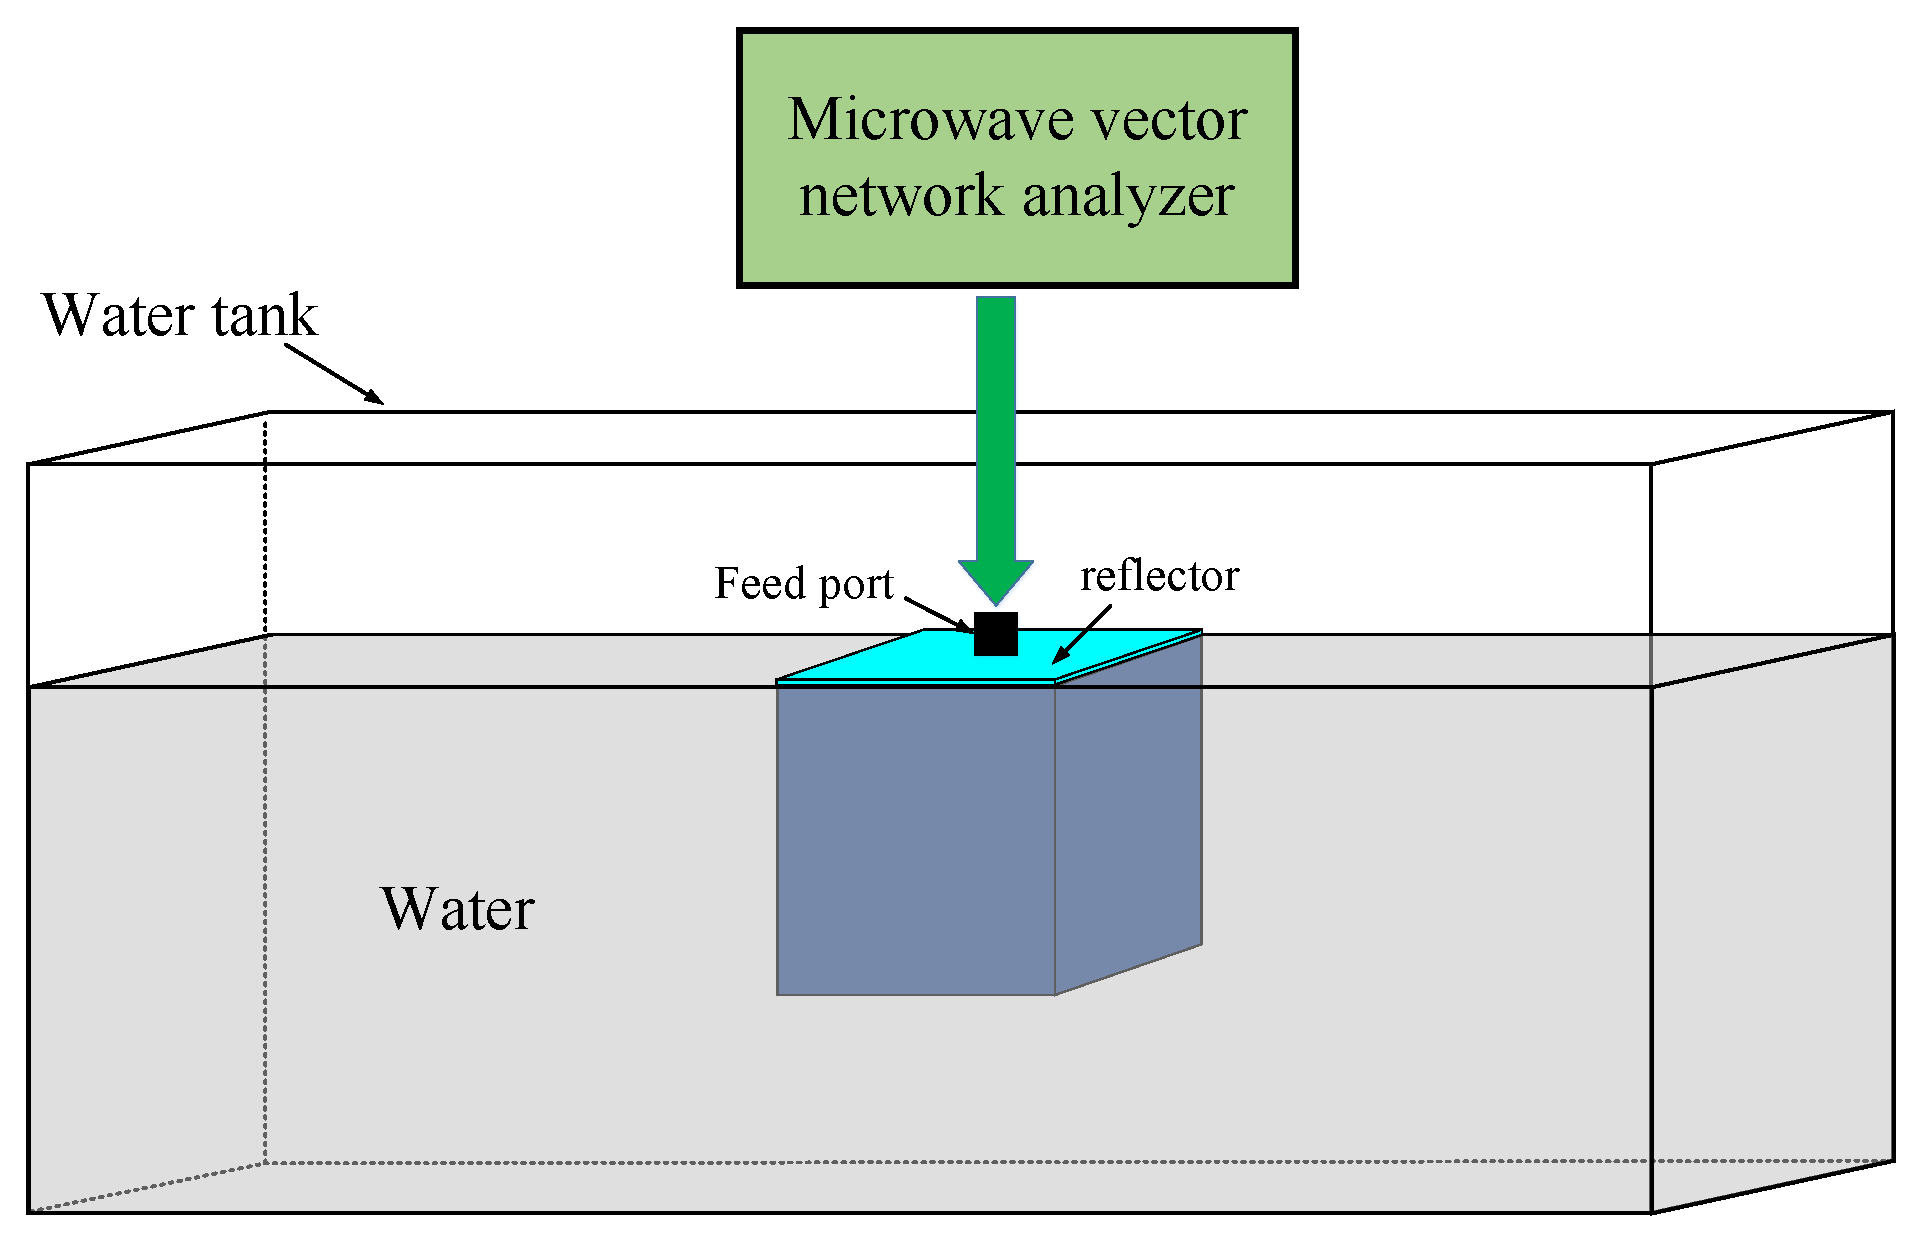
Diagram of the testing system.
Figure 10.
Diagram of the testing system.
Figure 11.
Diagrams of the microwave absorption simulation models of the phantoms.
Figure 11.
Diagrams of the microwave absorption simulation models of the phantoms.
Figure 12.
Microwave absorption distribution map of phantom 1.
Figure 12.
Microwave absorption distribution map of phantom 1.
Figure 13.
The microwave absorption distribution maps of phantom 2 with different tumor diameters. A is tumor diameter, and T is phantom height.
Figure 13.
The microwave absorption distribution maps of phantom 2 with different tumor diameters. A is tumor diameter, and T is phantom height.
Figure 14.
The microwave power absorption distribution maps of phantom 2 with different phantom heights. A is the tumor diameter, and T is the phantom height.
Figure 14.
The microwave power absorption distribution maps of phantom 2 with different phantom heights. A is the tumor diameter, and T is the phantom height.
Table 1.
Acoustic and electric parameters of different materials [
45,
46].
Table 1.
Acoustic and electric parameters of different materials [
45,
46].
| Category |
Material |
Density
kg/m3
|
Sound speed
m/s |
Acoustic
impedance
106kg/m2⋅s |
αu *
Np/m |
εr * |
σ *
S/m |
| Background medium |
Air |
1 |
330 |
0.00033 |
13.81 |
1 |
0 |
| Mineral oil |
825 |
1440 |
1.19 |
3.63 |
3 |
0.02 |
| Water |
994 |
1480 |
1.47 |
0.02 |
78 |
0.23 |
Target
tissue |
Breast fat |
911 |
1450 |
1.32 |
4.36 |
5.41 |
0.1 |
| Skull cancellous |
1178 |
2117 |
2.49 |
47 |
20.6 |
0.364 |
| Brain |
1046 |
1540 |
1.61 |
10.36 |
48.9 |
1.31 |
| muscle |
1090 |
1590 |
1.73 |
7.11 |
54.8 |
0.978 |
Table 2.
Directivity and 3dB angular width at different frequencies.
Table 2.
Directivity and 3dB angular width at different frequencies.
Frequency
(GHz) |
Directivity
(dBi) |
3dB Angular width
(degree) |
| 0.6 |
8.98 |
62.3 |
| 0.84 |
10.6 |
53.9 |
| 0.9 |
11 |
51.3 |
| 0.91 |
11 |
50.8 |
| 1.1 |
11.5 |
45 |
| 1.46 |
12.3 |
37.9 |
| 1.8 |
12.6 |
34.8 |
Table 3.
The bandwidths of impedance, axial ratio, and radiation pattern of the proposed antenna.
Table 3.
The bandwidths of impedance, axial ratio, and radiation pattern of the proposed antenna.
| Category |
Absolute
Bandwidth
(GHz) |
Relative
Bandwidth |
Center
Frequency
(GHz) |
| Impedance |
1.91 |
106.4% |
1.795 |
| Axial ratio |
3.06 |
125.4% |
2.44 |
| Radiation pattern |
1.2 |
100% |
1.2 |
