Submitted:
29 August 2024
Posted:
29 August 2024
You are already at the latest version
Abstract
Keywords:
Introduction
Materials and Methods
1.1. Animals and Irradiation
2.2. Behavioural Studies
2.2.1. Open Field (Locomotor) Test
2.2.2. Light Dark Box
2.2.3. Elevated Plus Maze
2.2.4. Tail Suspension Test
2.2.5. Forced Swim Test
2.3. Sample Collection
2.4. Immunohistochemical Staining
2.5. RNA Extraction from the Hippocampus and Whole Blood
2.5. Systematic miRNA Sequencing (miRSeq) and mRNA Sequencing Analysis
2.5. Real-Time Quantitative Reverse Transcription PCR (qRT-PCR) Analysis of miRNA
2.5. Real Time RT-PCR Analysis for mRNA
2.5. Statistical Analyses
Results
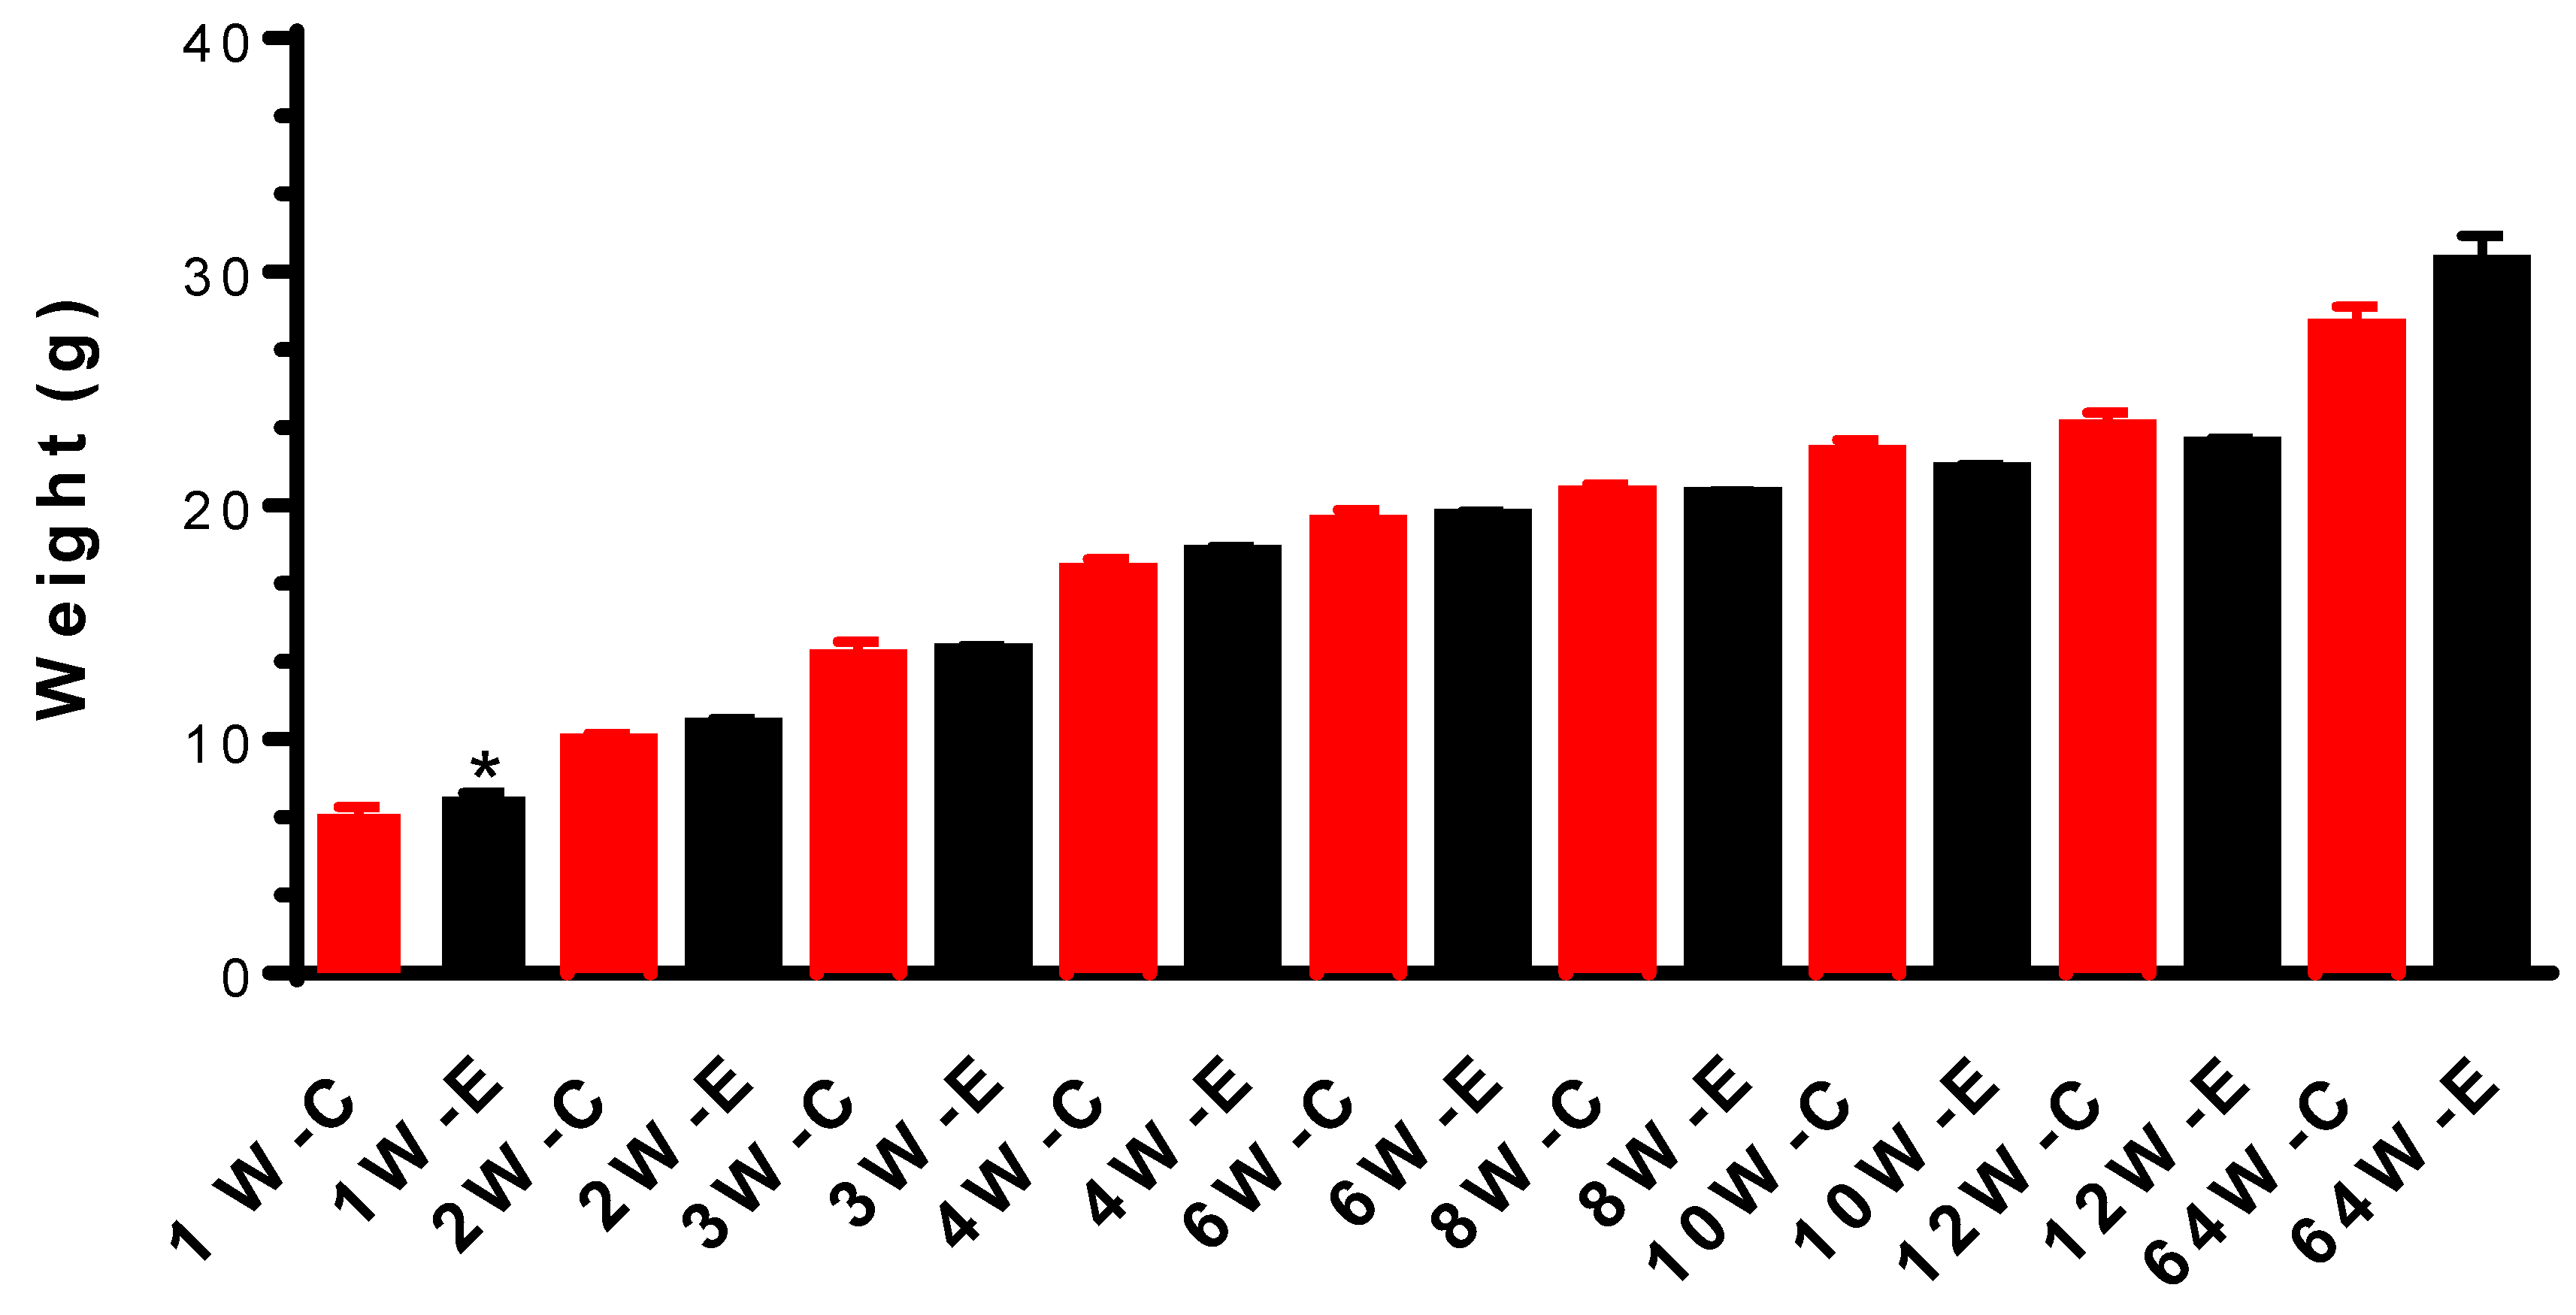
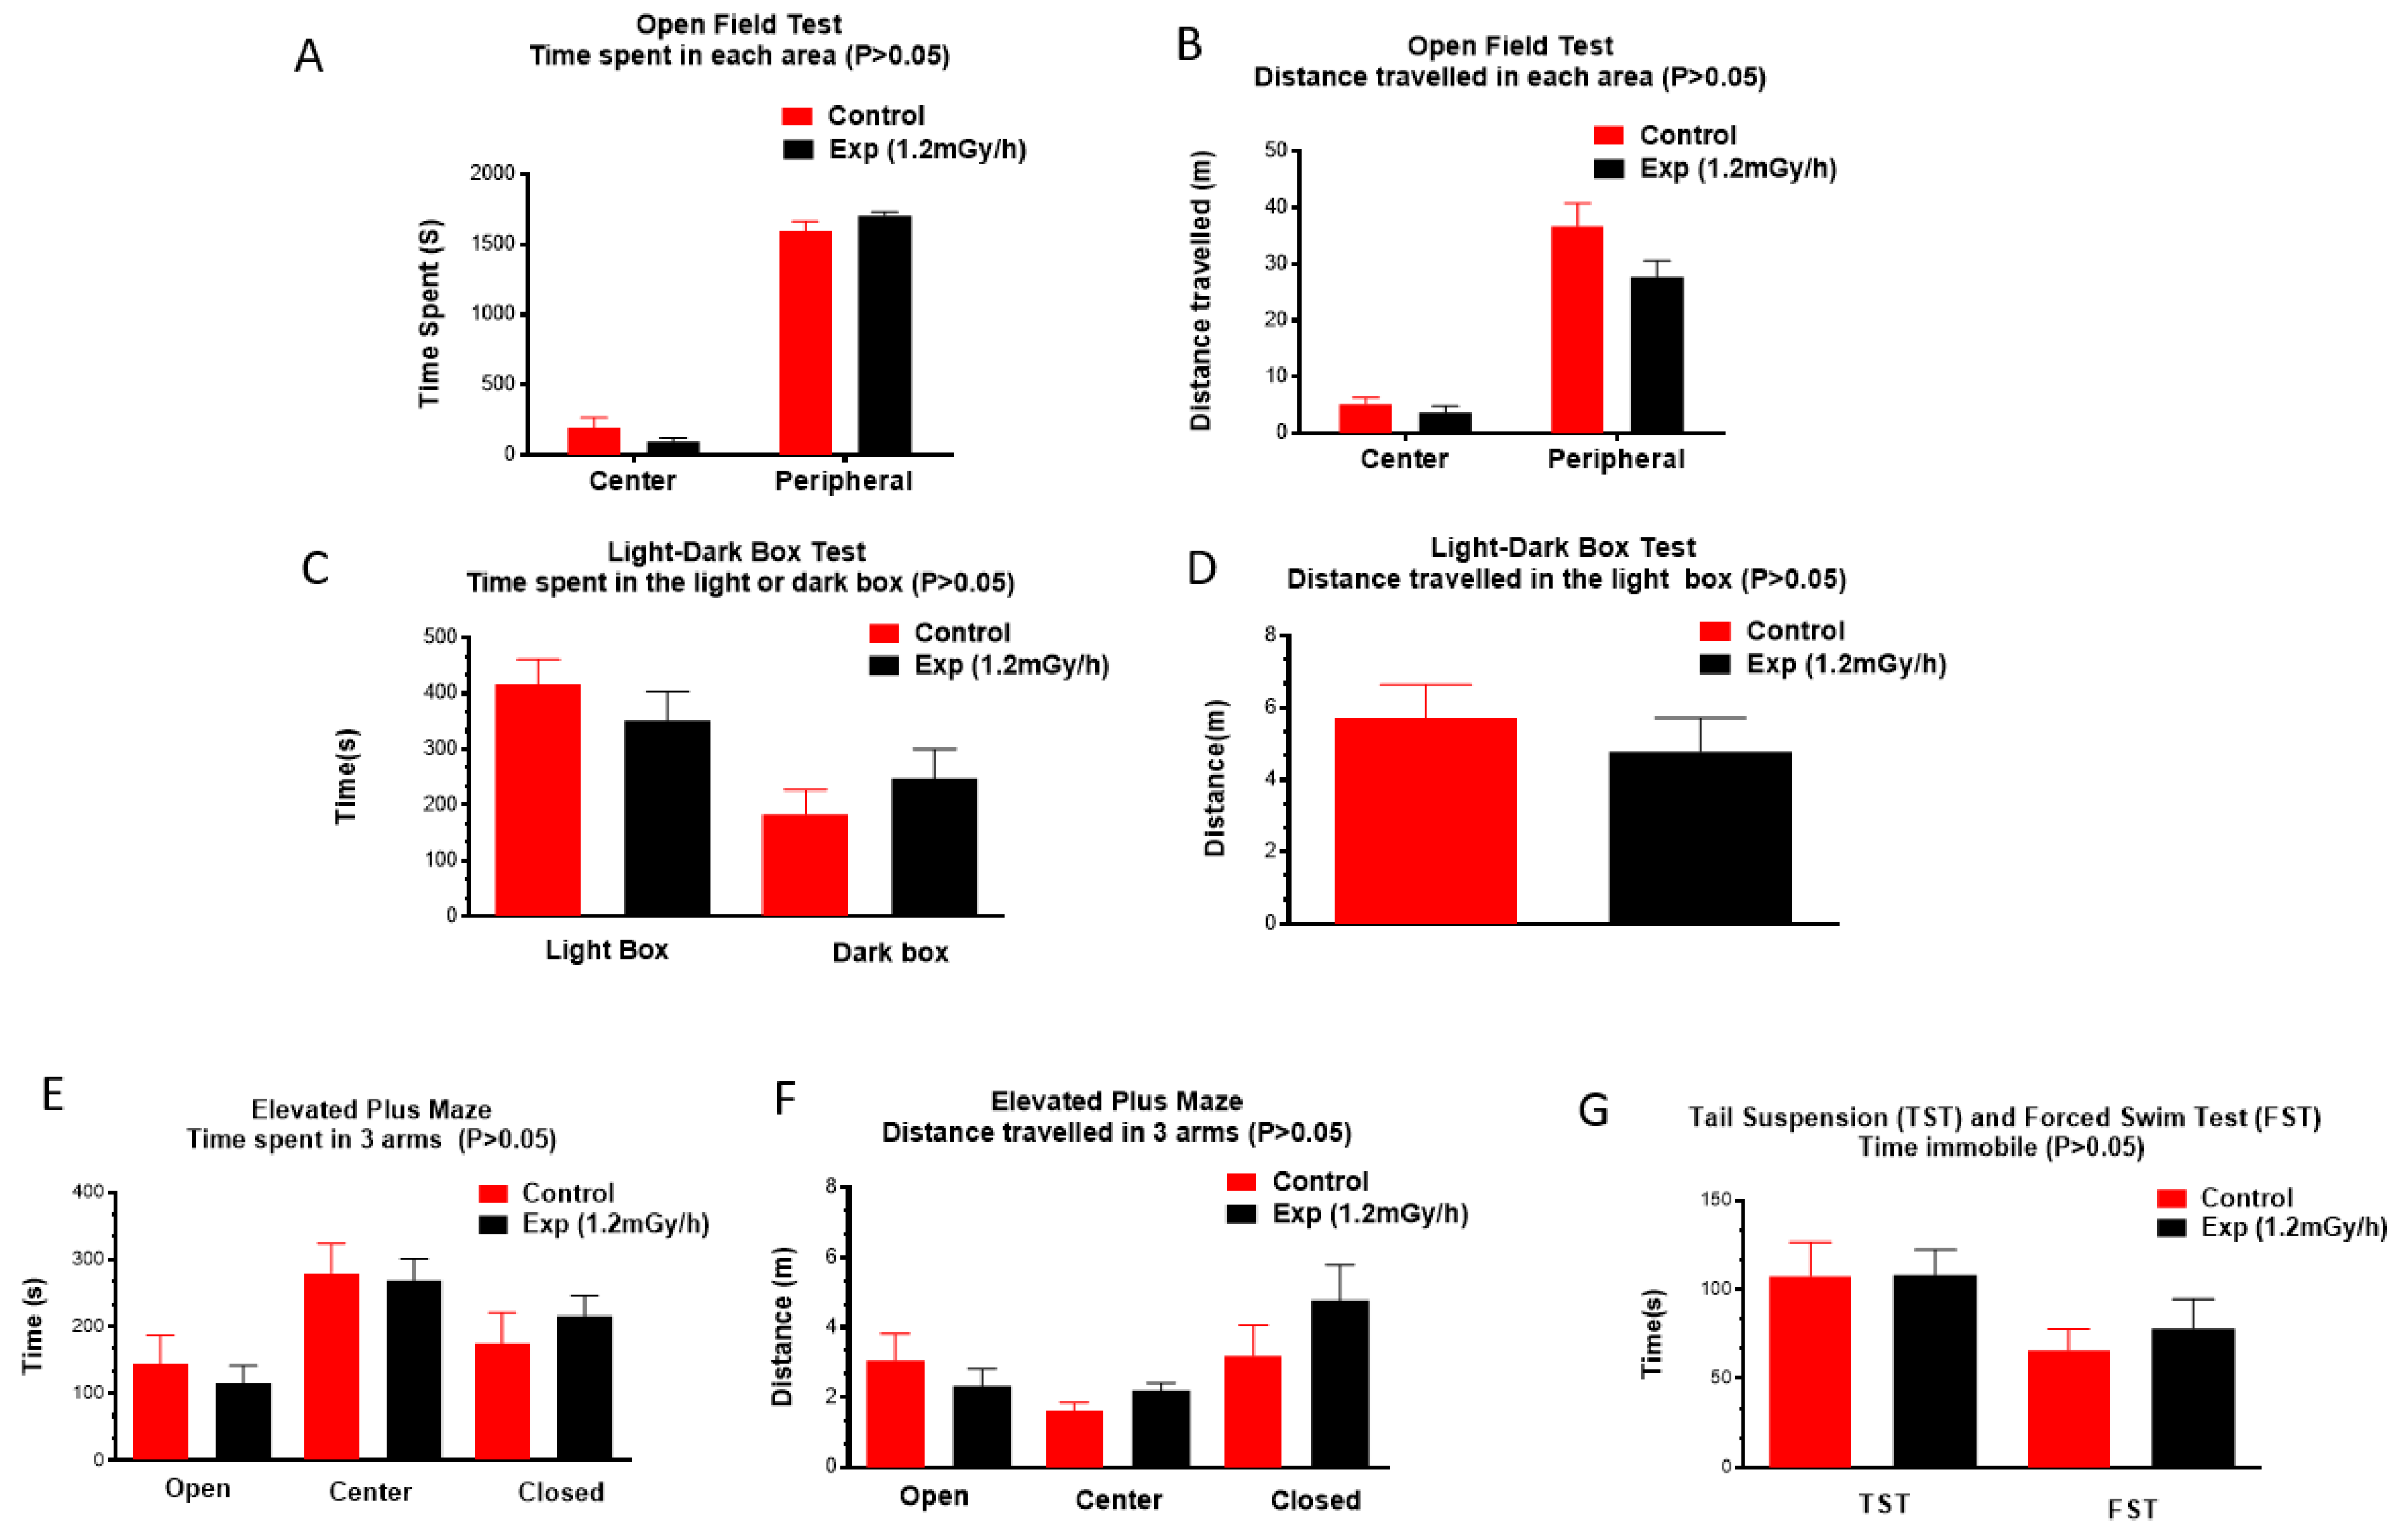
3.1. Body Weight and Behavioural Changes
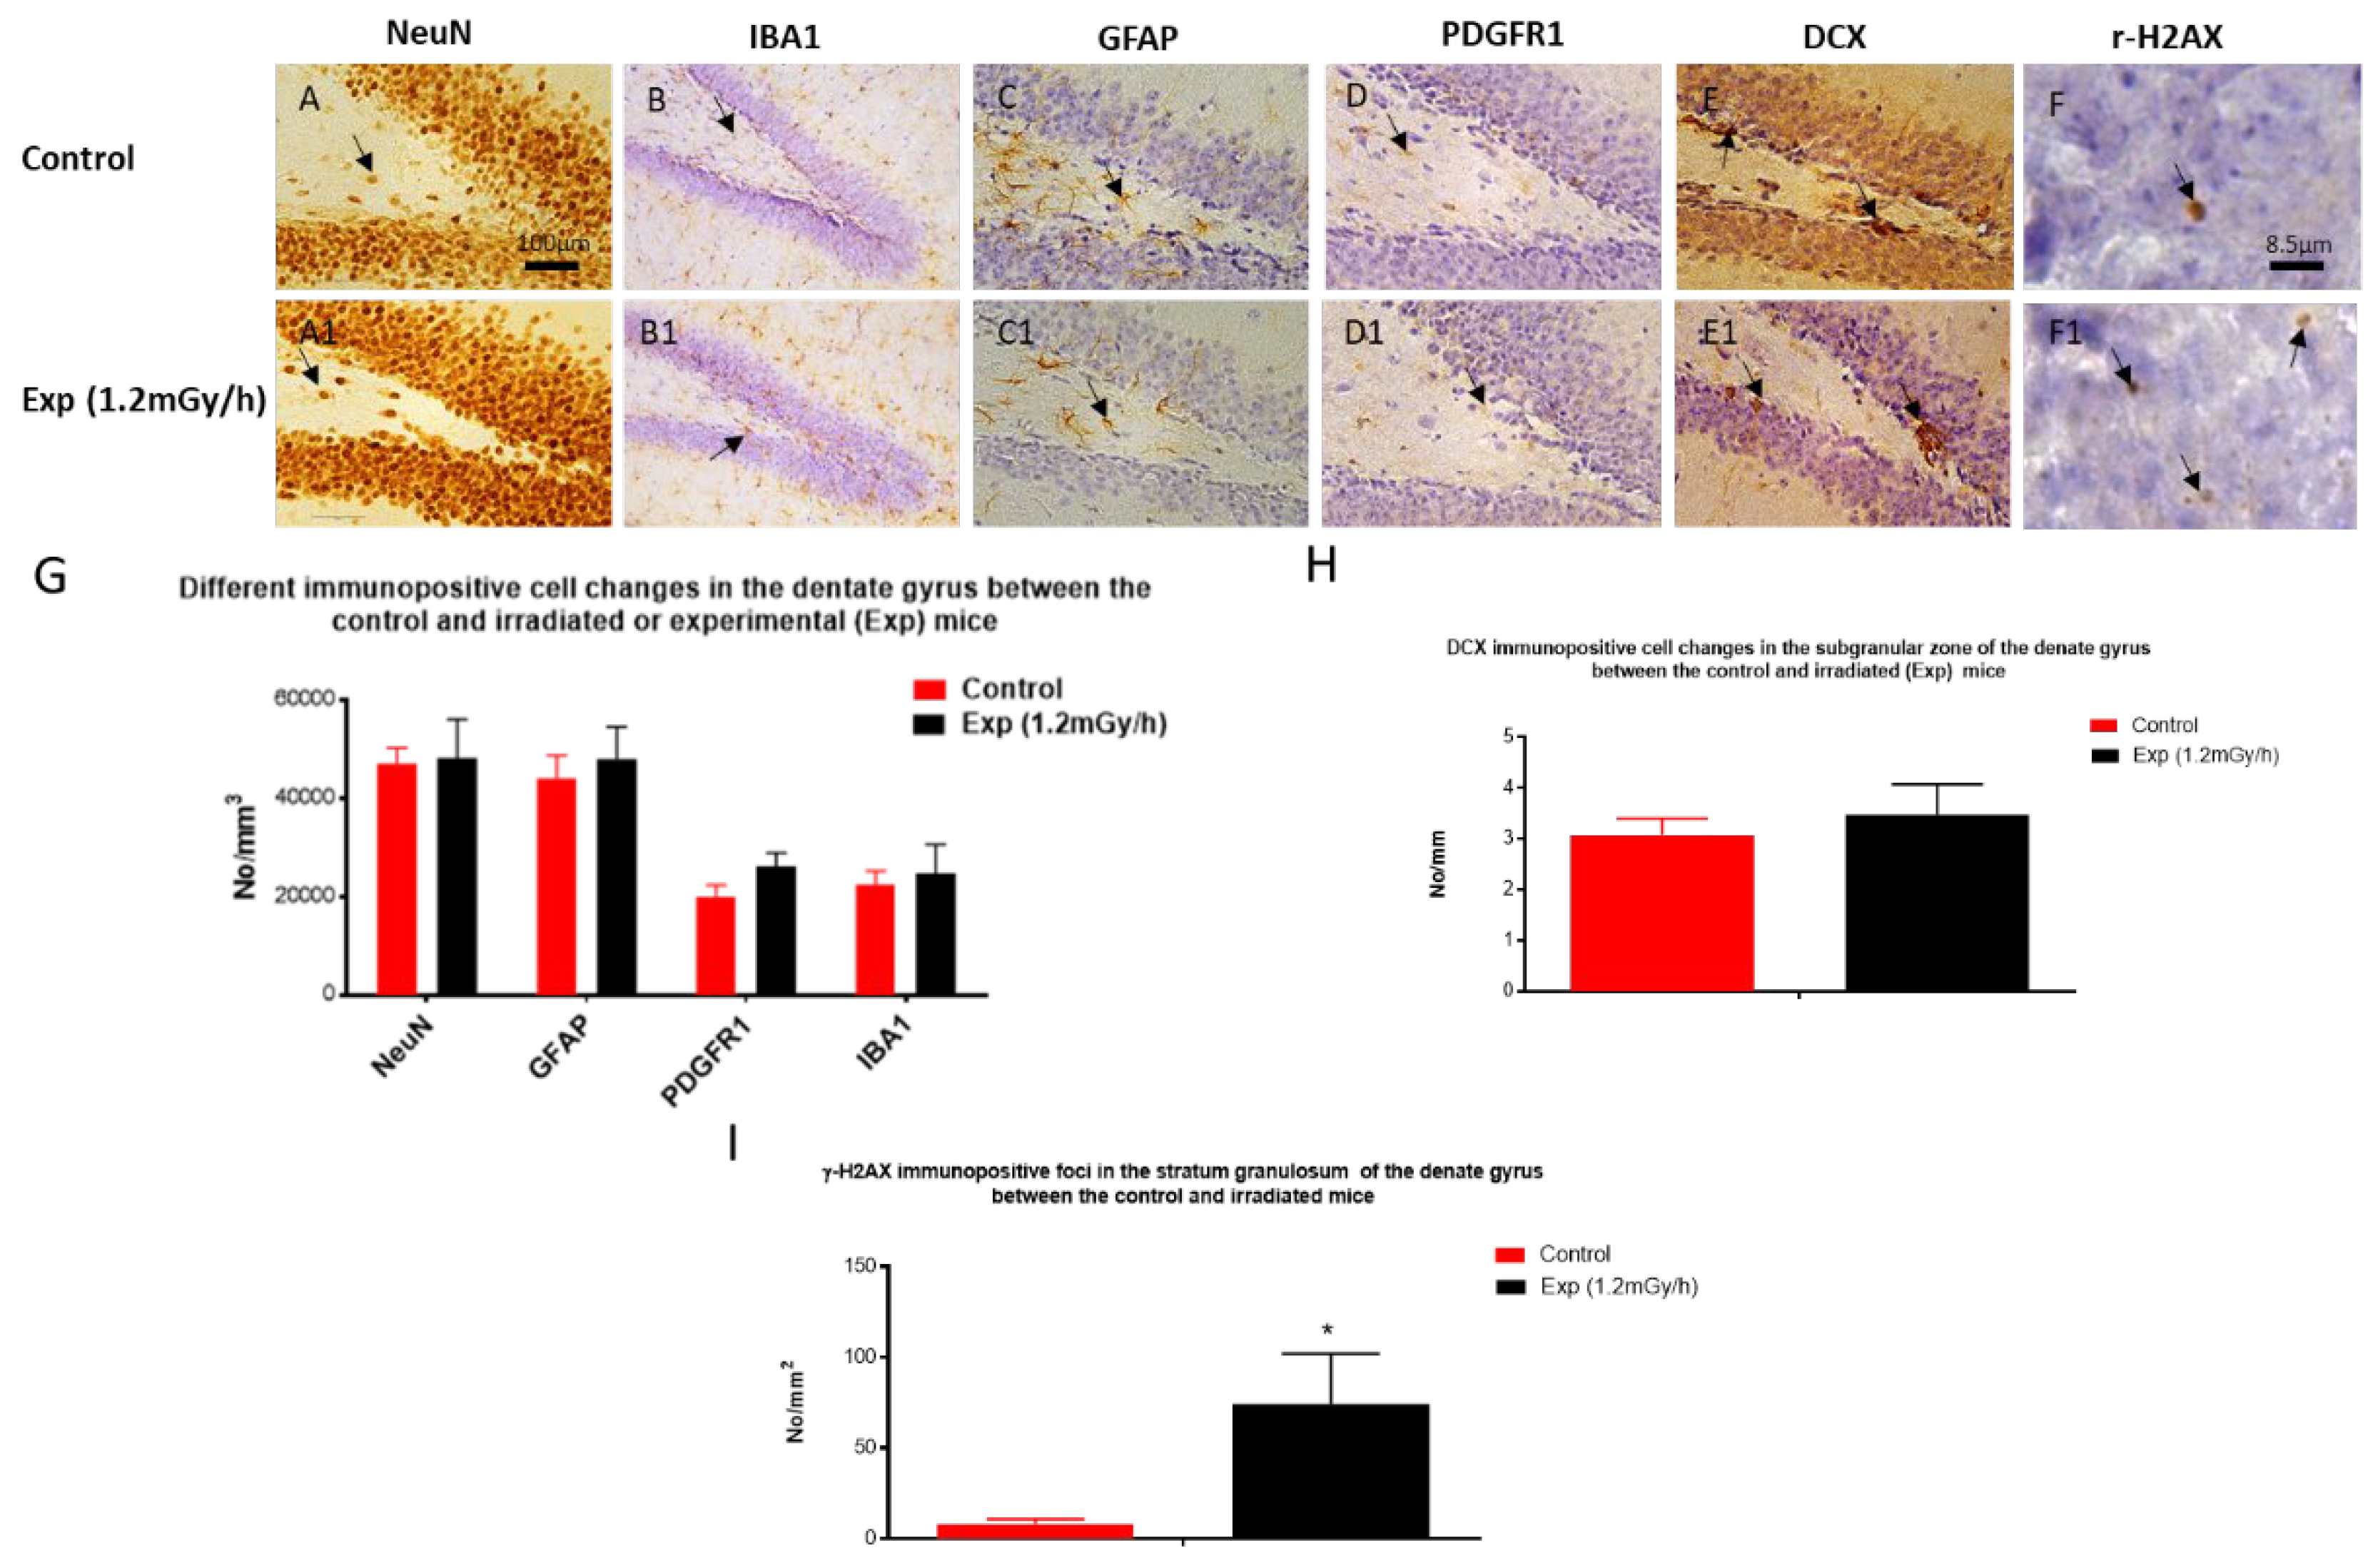
3.2. Immunohistochemistry Examination
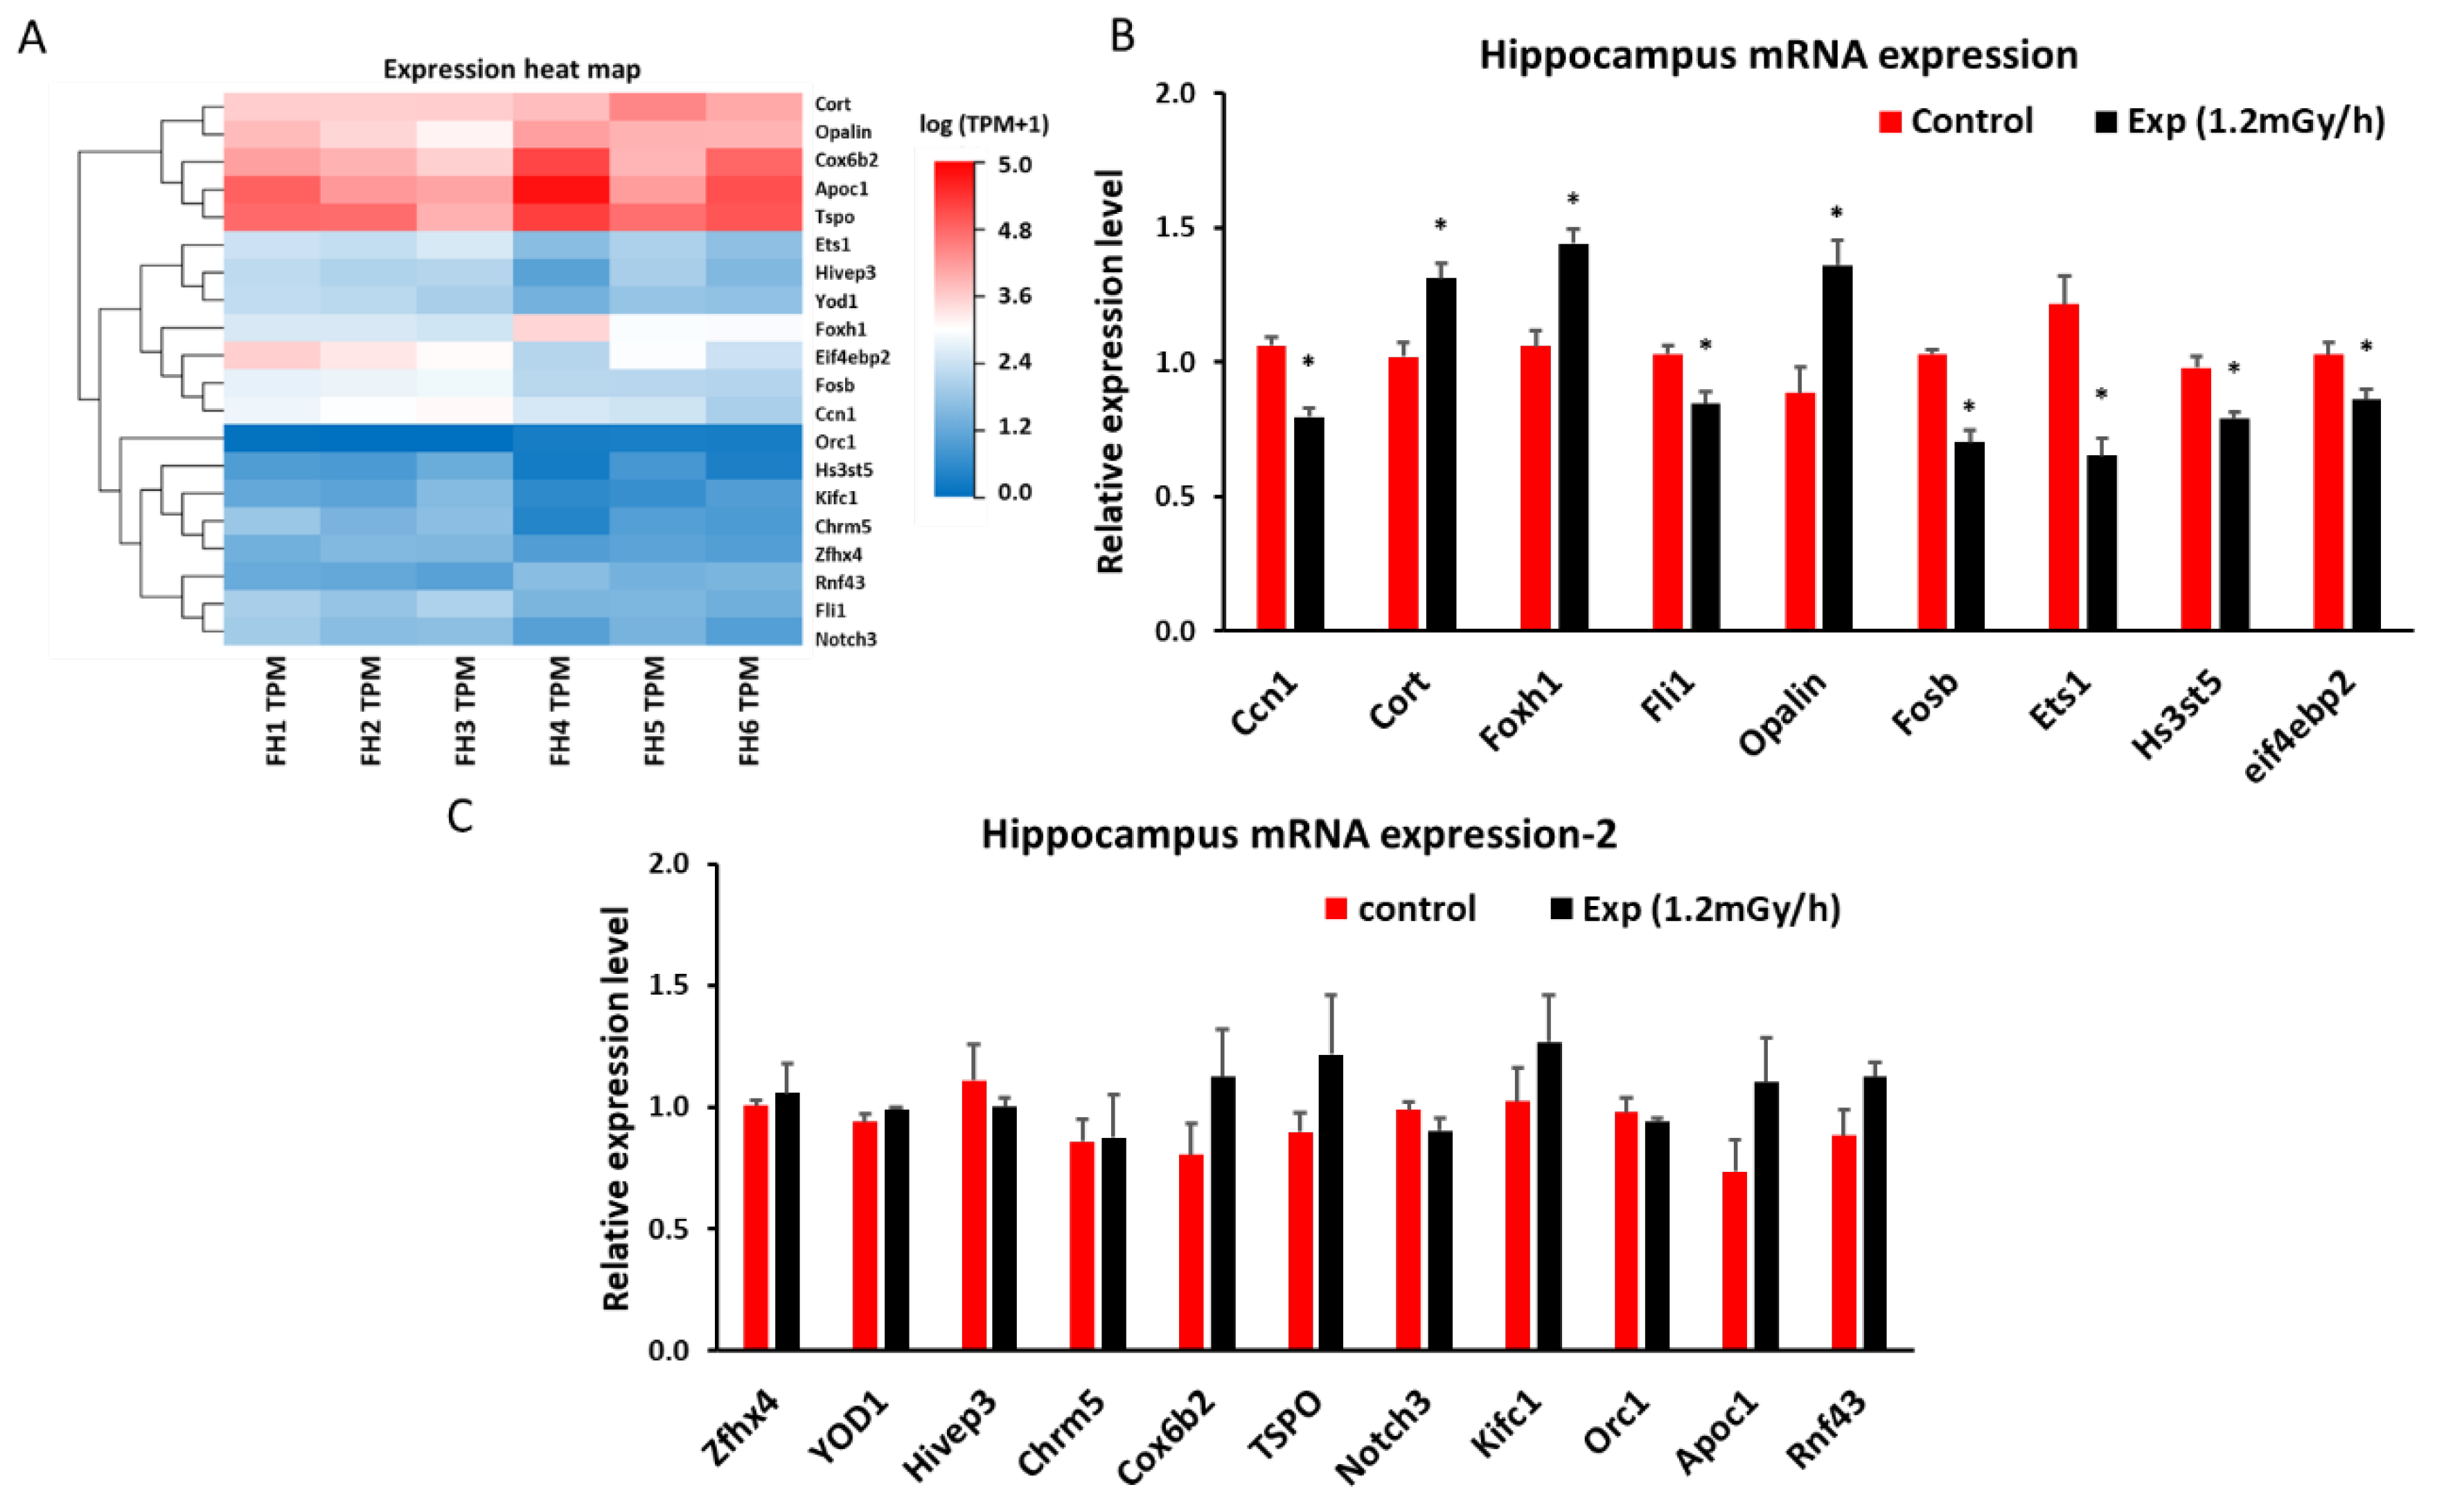
3.3. mRNA Sequencing and qRT-PCR in the Hippocampus
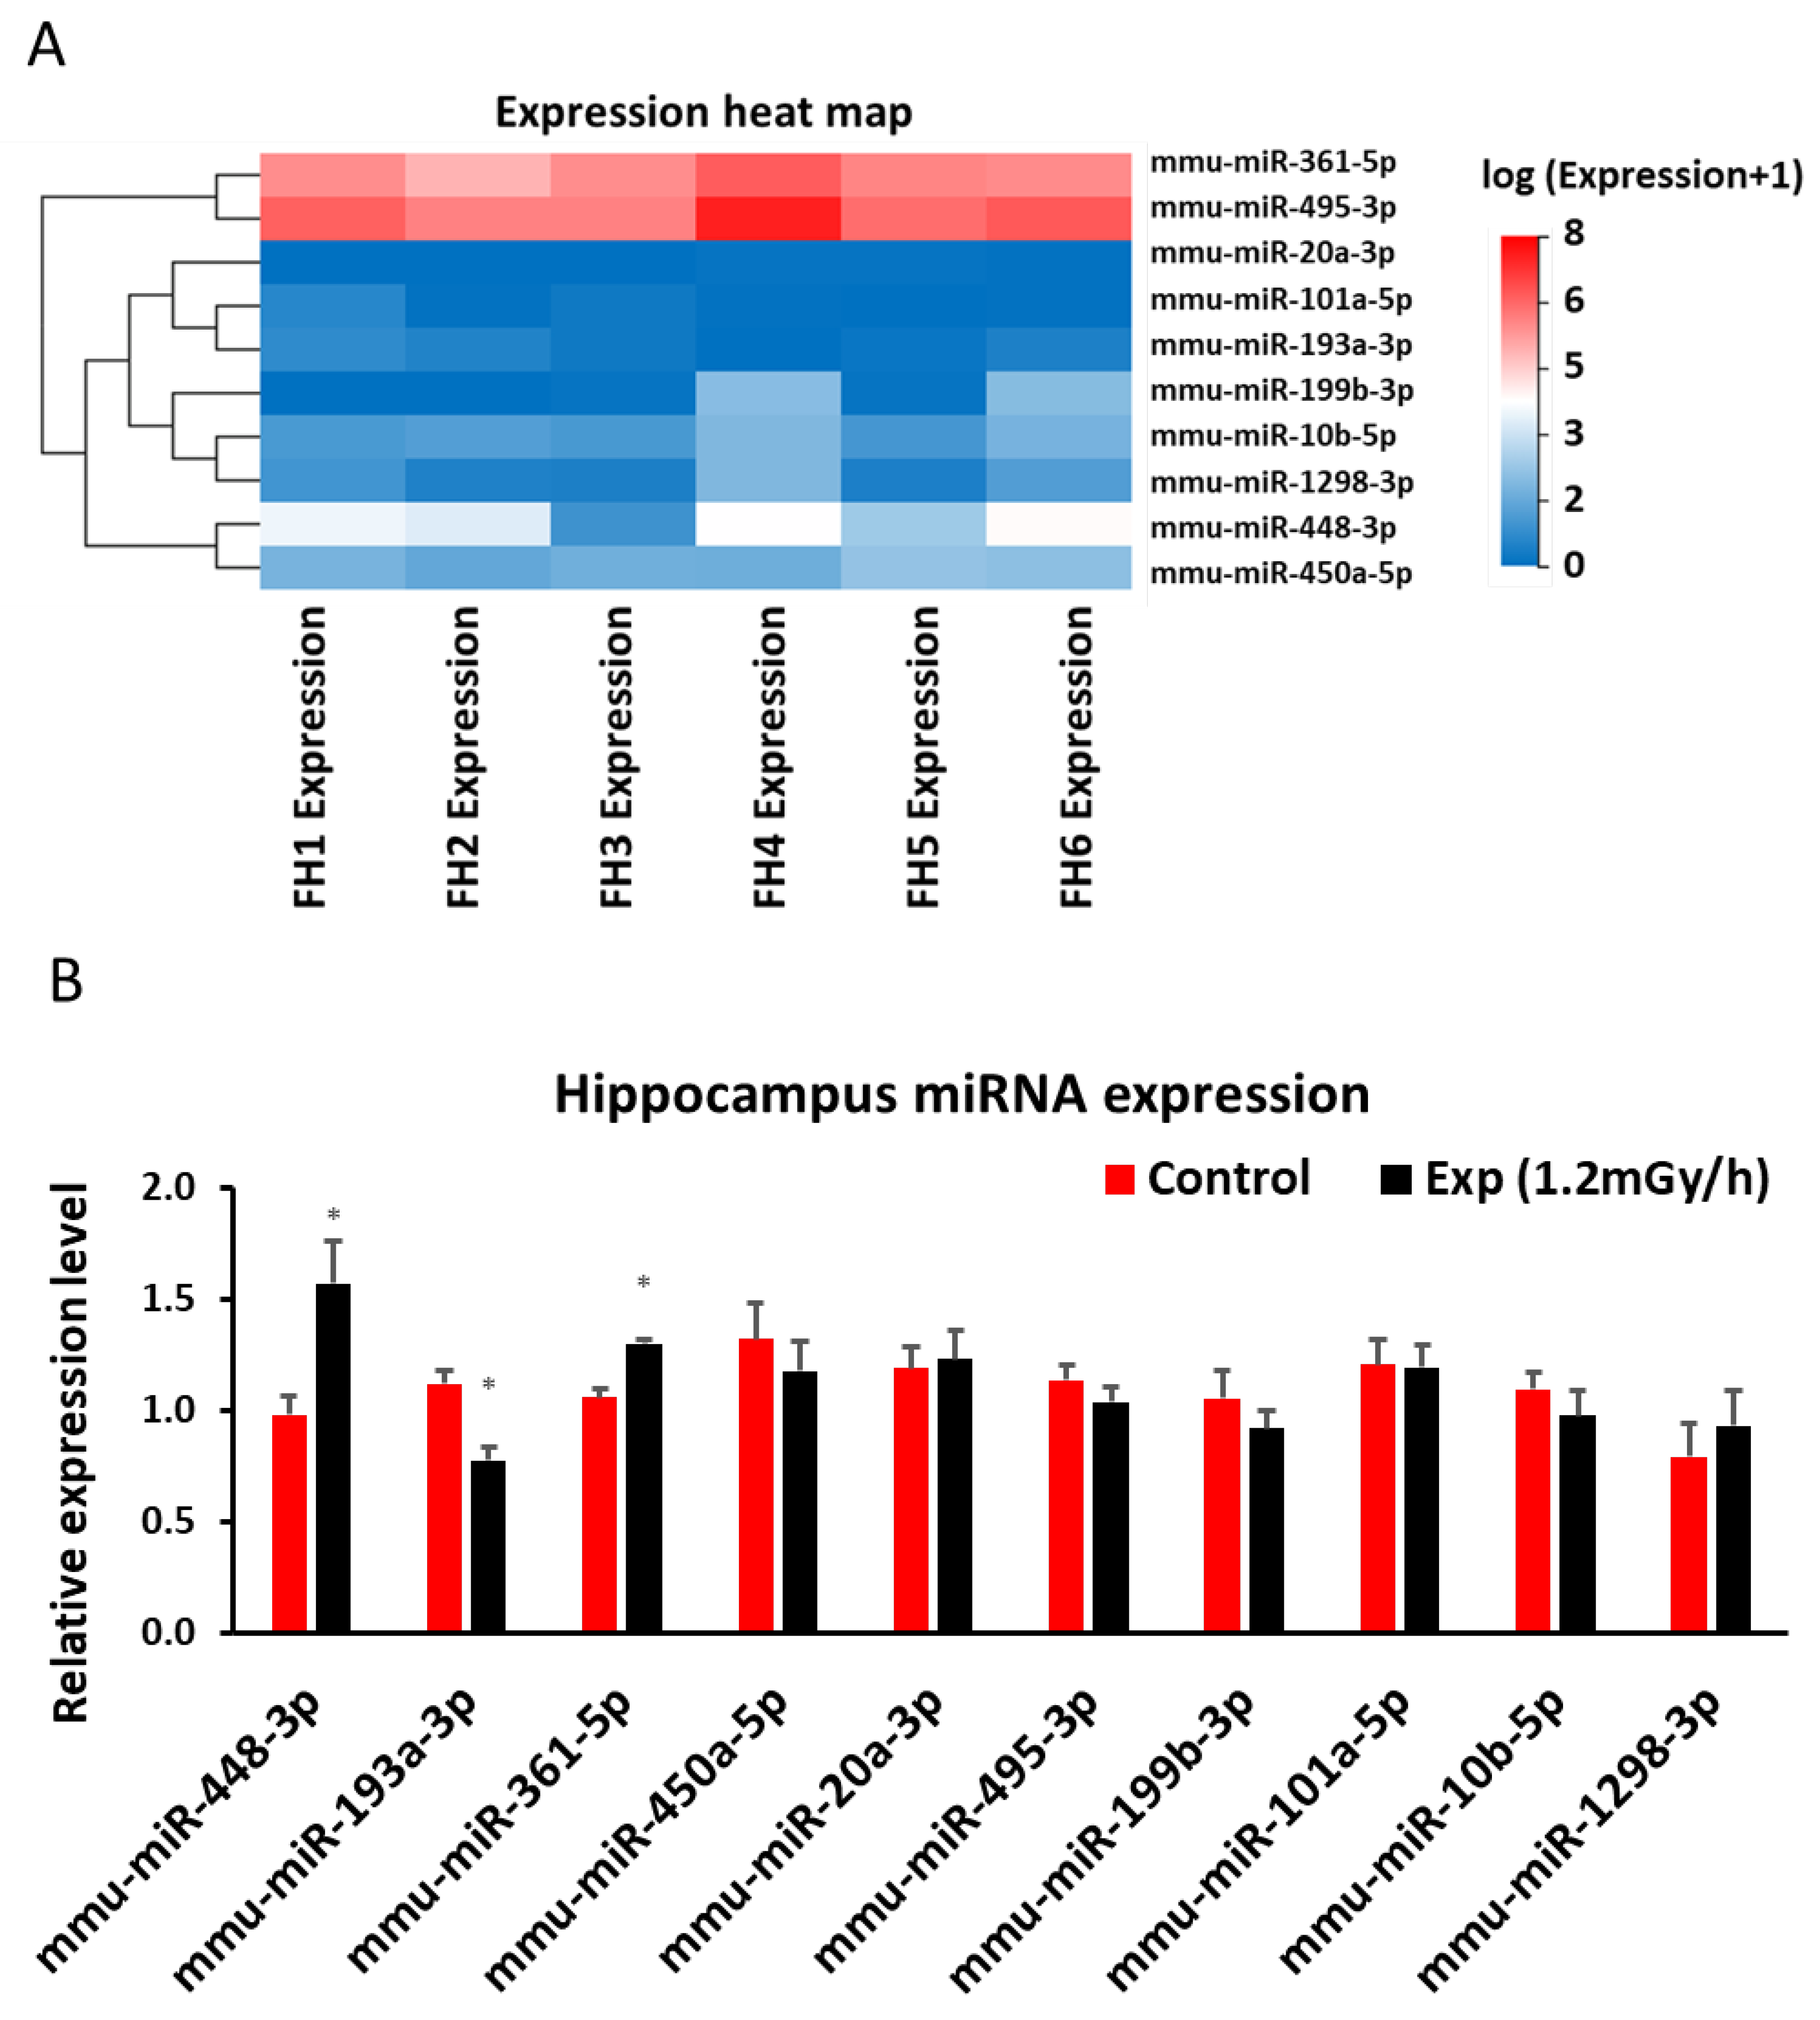
3.4. miRNA Sequencing and qRT-PCR in the Hippocampus
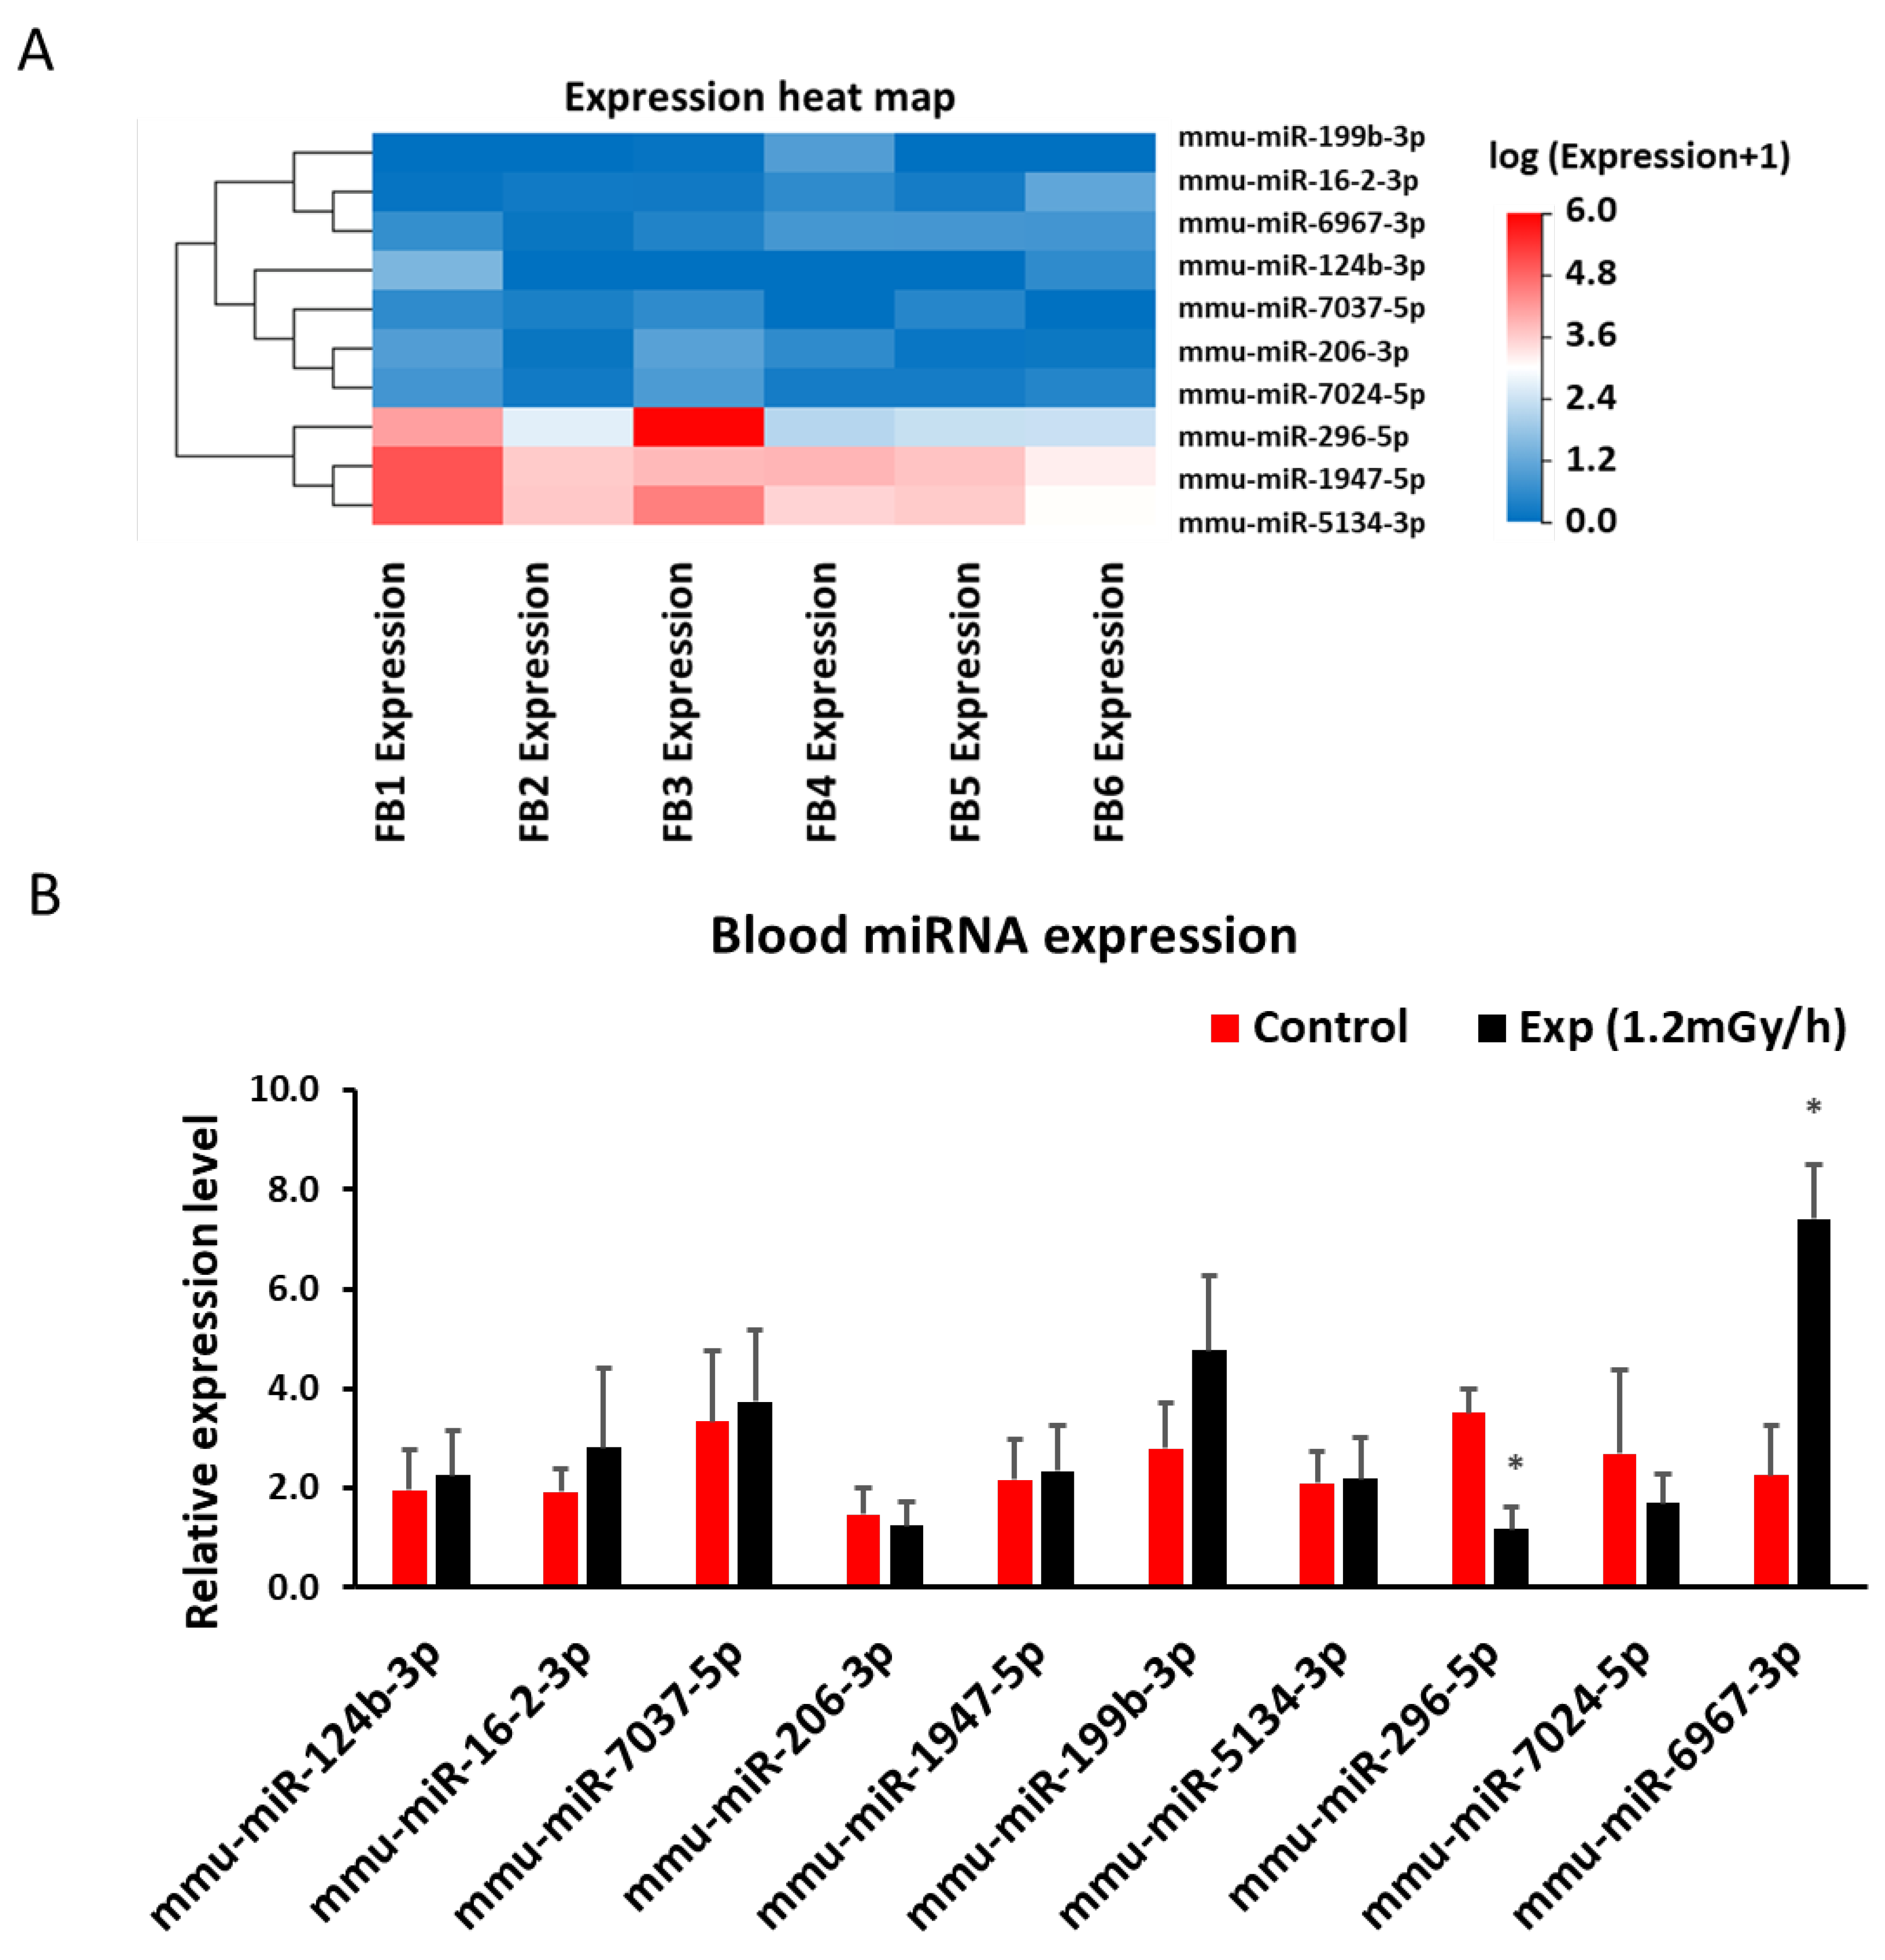
2.5. miRNA Sequencing and qRT-PCR in Blood
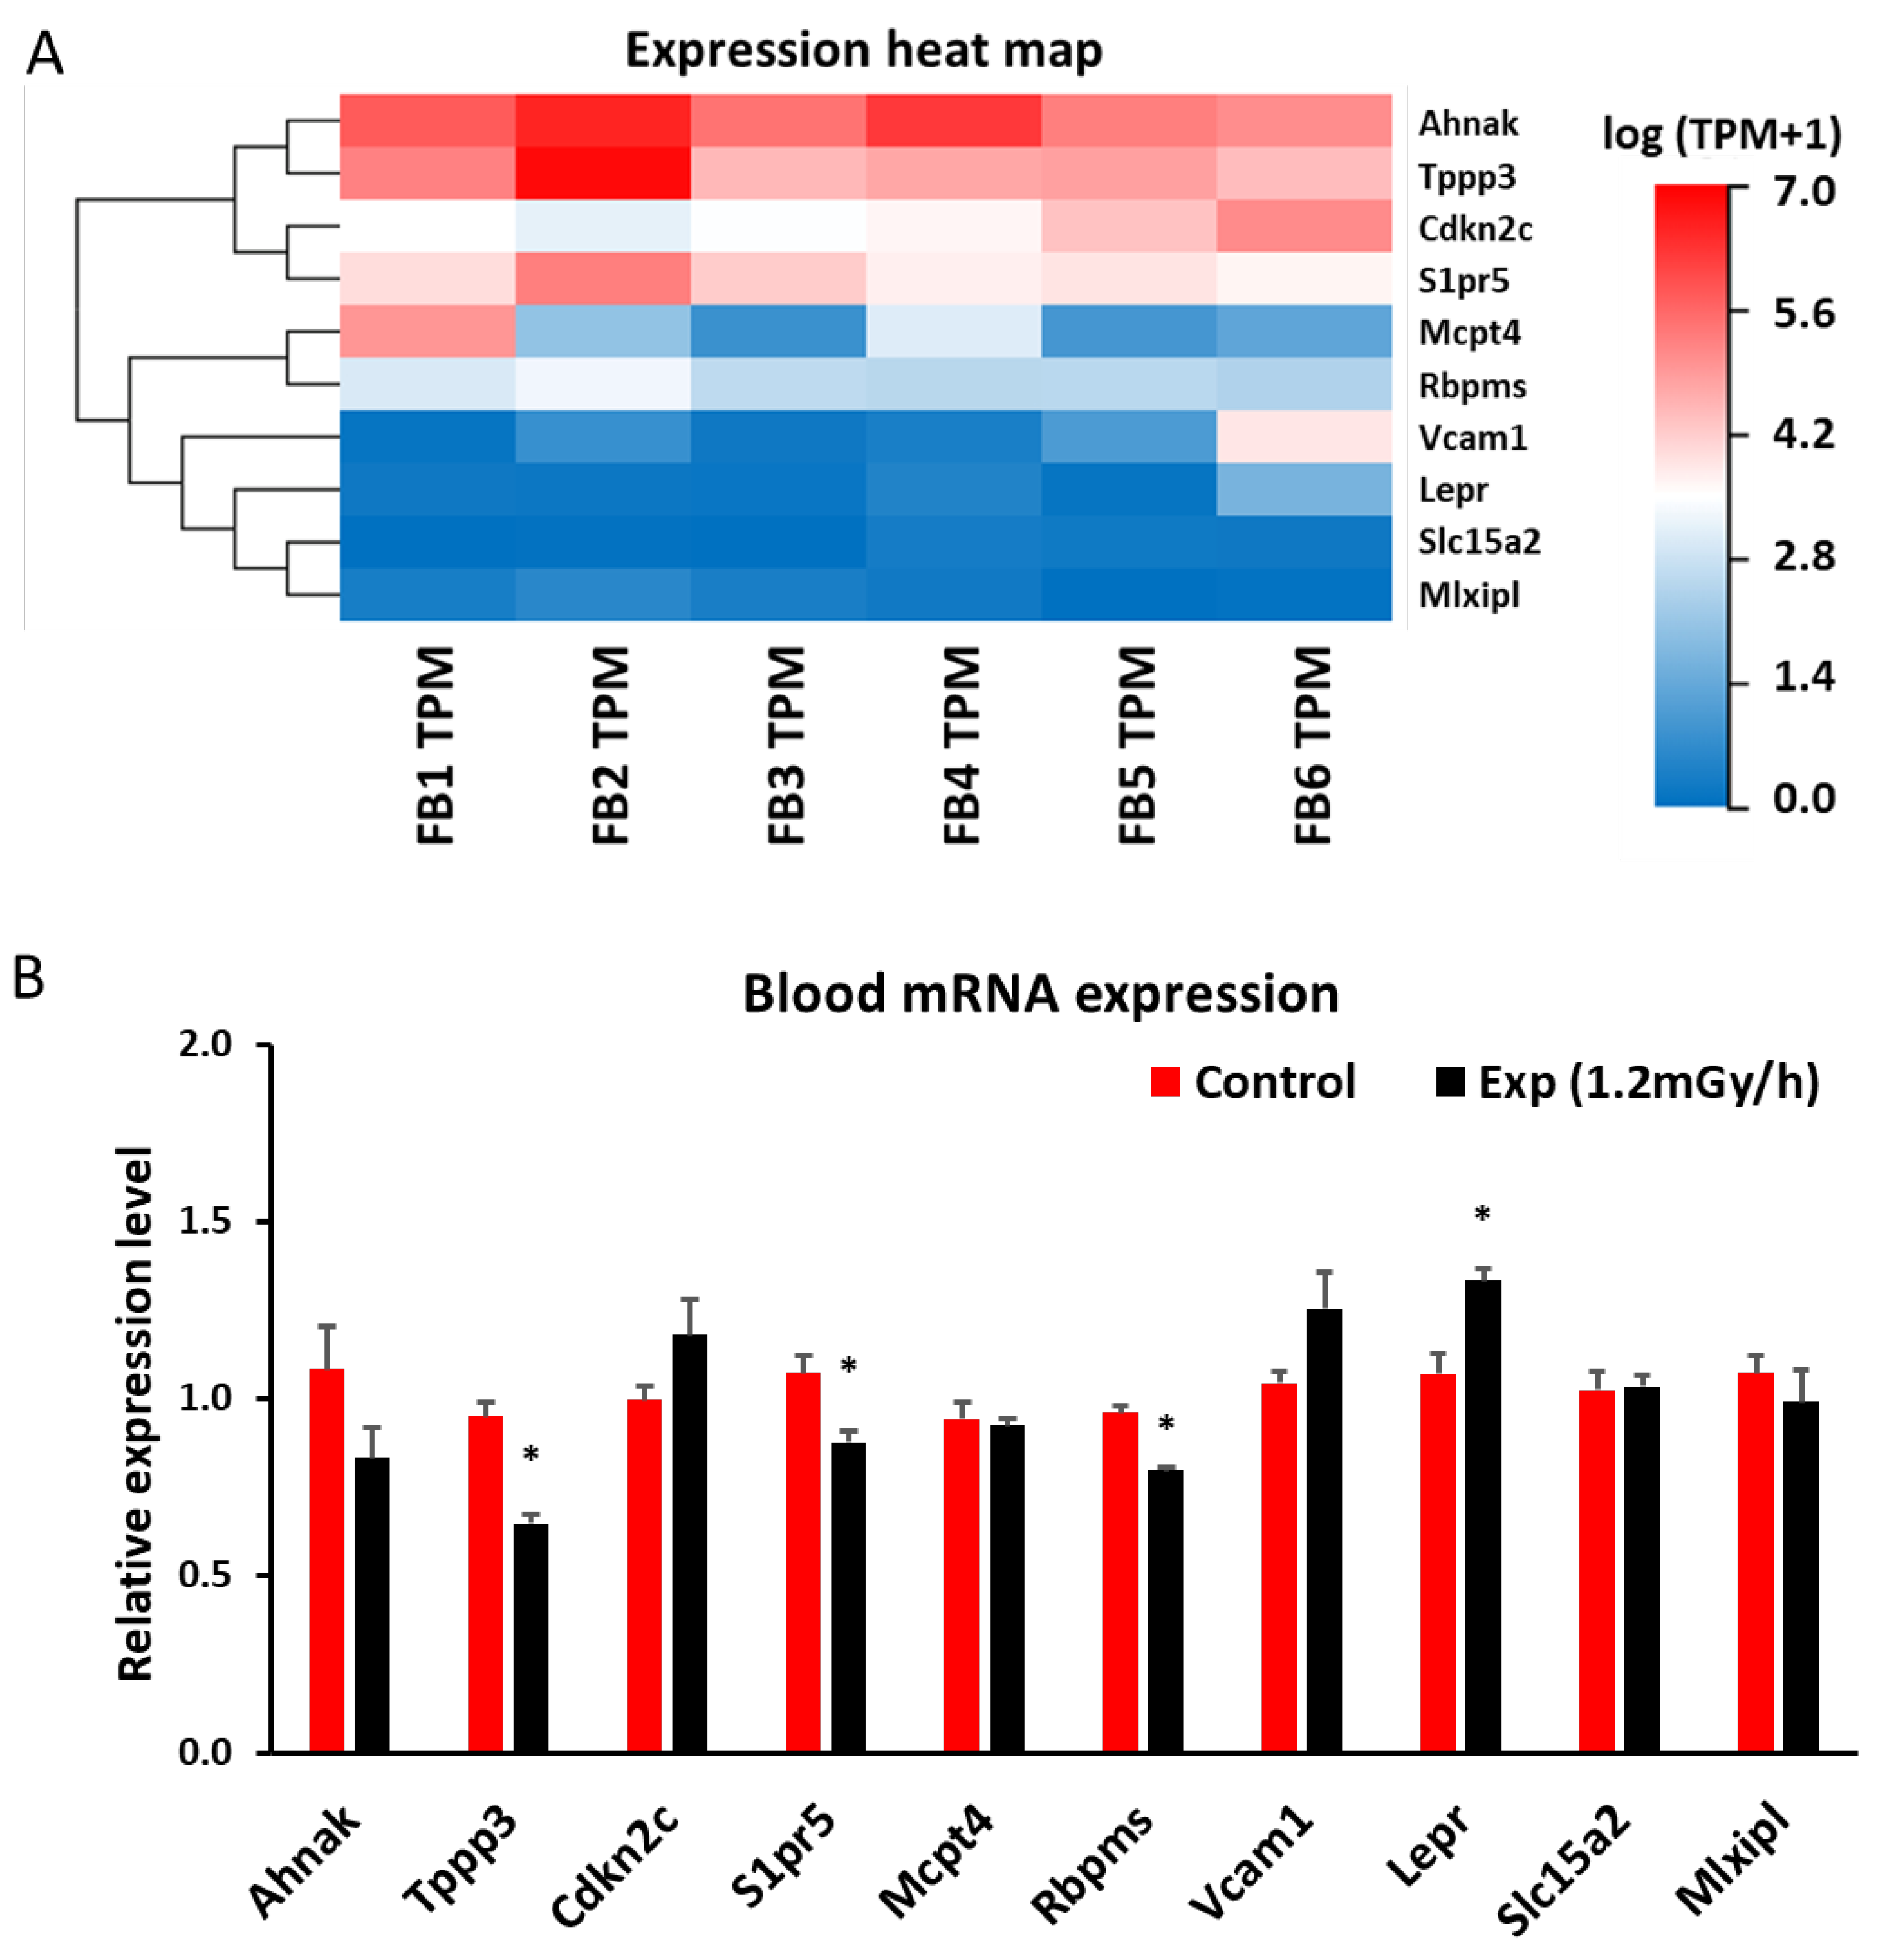
2.5. mRNA Sequencing and qRT-PCR in Blood
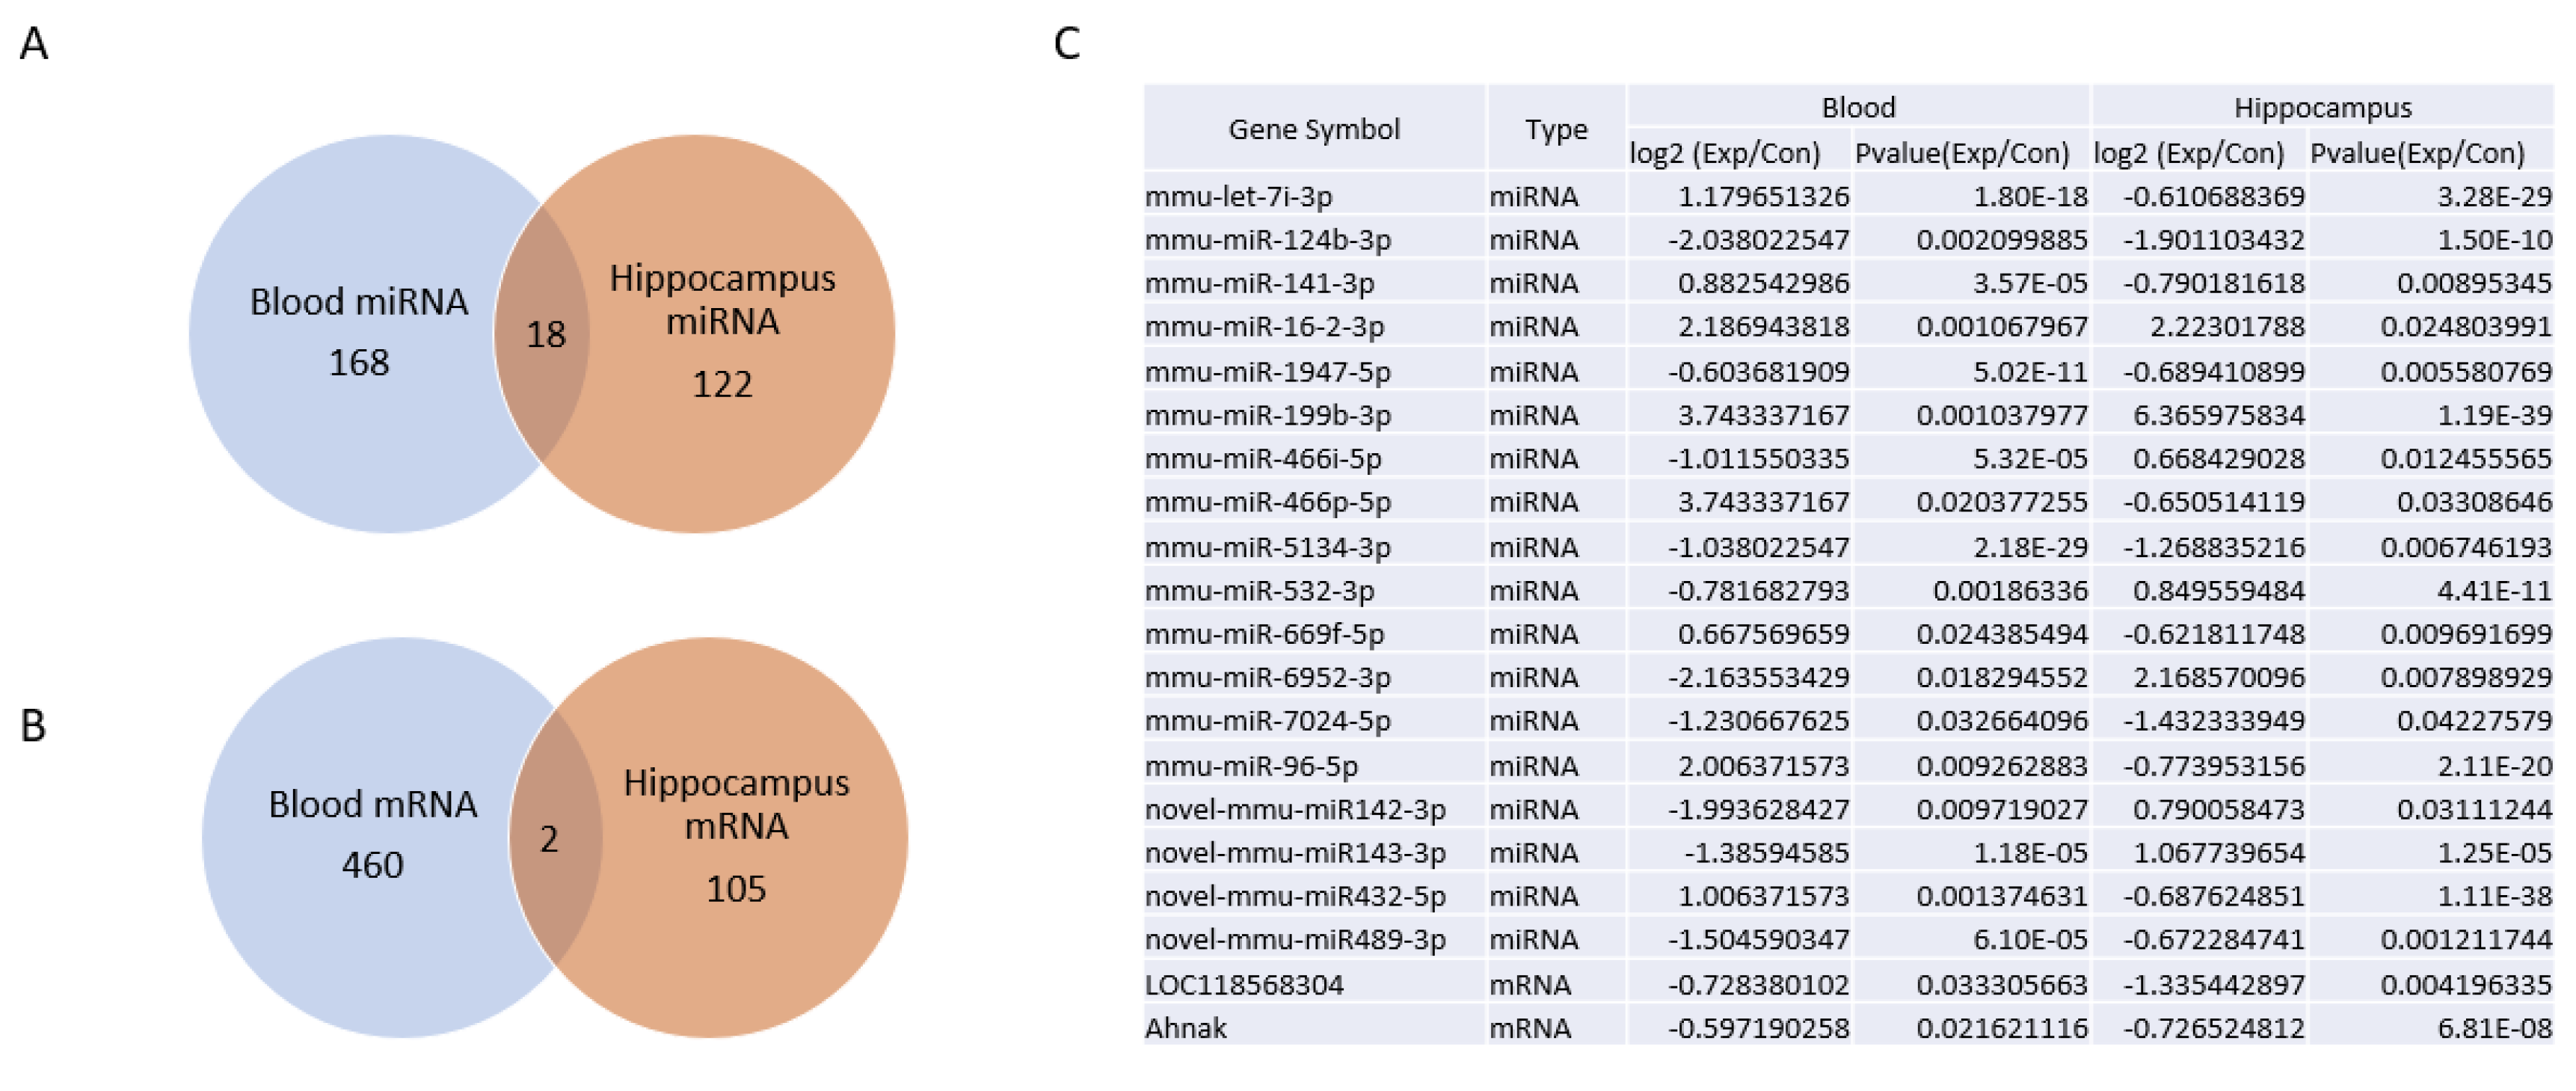
2.5. Venn Diagram Analysis of Differentially Expressed mRNA and miRNAs between Blood and Hippocampus
Discussion
4.1. Main Findings
4.2. Chronic Low Dose Rate Irradiation Did Not Induce Abnormal Cellular Changes in the Dentate Gyrus of the Hippocampus and Neuropsychiatric Abnormality
4.3. Chronic Low Dose Rate Irradiation Induced Persistent DNA Damage Foci
2.5. Chronic Low Dose Rate Irradiation Induced miRNA and mRNA Changes in the Hippocampus
4.6. Chronic Low Dose Rate Irradiation Induced miRNA and mRNA Changes in the Blood
Author Contributions
Funding
Institutional Review Board Statement
Informed Consent Statement
Data Availability Statement
Acknowledgments
Conflicts of Interest
References
- Kimler, B. Prenatal irradiation: a major concern for the developing brain. International Journal of Radiation Biology 1998, 73, 423–434. [Google Scholar] [CrossRef]
- Setkowicz, Z.; Janeczko, K. A strong epileptogenic effect of mechanical injury can be reduced in the dysplastic rat brain: Long-term consequences of early prenatal gamma-irradiation. Epilepsy Research 2005, 66, 165–172. [Google Scholar] [CrossRef] [PubMed]
- Setkowicz, Z.; et al. Brain dysplasia evoked by gamma irradiation at different stages of prenatal development leads to different tonic and clonic seizure reactivity. Epilepsy Research 2014, 108, 66–80. [Google Scholar] [CrossRef] [PubMed]
- Nakahira, R.; et al. Effects of Continuous In Utero Low- and Medium-Dose-Rate Gamma-Ray Exposure on Fetal Germ Cells. Radiat Res 2021, 195, 235–243. [Google Scholar] [CrossRef] [PubMed]
- Tang, F.; et al. Effects of Continuous Prenatal Low Dose Rate Irradiation on Neurobehavior, Hippocampal Cellularity, mRNA and miRNA Expression on B6C3F1 Mice. Preprints 2024. [Google Scholar] [CrossRef]
- Otake, M. Threshold for radiation-related severe mental retardation in prenatally exposed A-bomb survivors: a re-analysis. International Journal of Radiation Biology 1996, 70, 755–763. [Google Scholar] [CrossRef] [PubMed]
- Otake, M.; Schull, W.J. In utero exposure to A-bomb radiation and mental retardation; a reassessment. The British Journal of Radiology 1984, 57, 409–414. [Google Scholar] [CrossRef]
- Fushiki, S. Radiation hazards in children–lessons from Chernobyl, Three Mile Island and Fukushima. Brain and Development 2013, 35, 220–227. [Google Scholar] [CrossRef]
- Palgi, Y.; et al. Mental health and disaster related attitudes among Japanese after the 2011 Fukushima nuclear disaster. 2012. [Google Scholar]
- Stepanova, E.I.; ZhA, M.; VIu, V. [Long-term cytogenetic effects in children prenatally-exposed to radiation as a result of the accident at the Chernobyl Atomic Energy Station]. Radiats Biol Radioecol 2002, 42, 700–703. [Google Scholar]
- Geets, W. Possible influence of pre-natal irradiation on the development of cerebral electrical activity in man. Electroencephalogr Clin Neurophysiol 1968, 25, 417. [Google Scholar] [CrossRef]
- Wang, H.; et al. Early Life Irradiation-Induced Hypoplasia and Impairment of Neurogenesis in the Dentate Gyrus and Adult Depression Are Mediated by MicroRNA-34a-5p/T-Cell Intracytoplasmic Antigen-1 Pathway. Cells 2021, 10, 2476. [Google Scholar] [CrossRef] [PubMed]
- Atamanyuk, N.I.; et al. The Dose-Dependent Effect of Fractionated γ-Radiation on Anxiety-Like Behavior in Neonatal Mice. Bull Exp Biol Med 2024, 176, 727–730. [Google Scholar] [CrossRef] [PubMed]
- Tanaka, S.; et al. No lengthening of life span in mice continuously exposed to gamma rays at very low dose rates. Radiat Res 2003, 160, 376–379. [Google Scholar] [CrossRef] [PubMed]
- Tanaka, I.B., 3rd; et al. Cause of death and neoplasia in mice continuously exposed to very low dose rates of gamma rays. Radiat Res 2007, 167, 417–437. [Google Scholar] [CrossRef] [PubMed]
- Liu, Y.; et al. Neonatal exposure to low-dose X-ray causes behavioral defects and abnormal hippocampal development in mice. IUBMB Life 2023, 75, 530–547. [Google Scholar] [CrossRef]
- Tang, F.R.; et al. Spatiotemporal dynamics of γH2AX in the mouse brain after acute irradiation at different postnatal days with special reference to the dentate gyrus of the hippocampus. Aging 2021, 13, 15815–15832. [Google Scholar] [CrossRef]
- Ren, B.X.; et al. Early postnatal irradiation-induced age-dependent changes in adult mouse brain: MRI based characterization. BMC Neurosci 2021, 22, 28. [Google Scholar] [CrossRef] [PubMed]
- Wang, H.; et al. Dual Effects of miR-181b-2-3p/SOX21 Interaction on Microglia and Neural Stem Cells after Gamma Irradiation. Cells 2023, 12, 649. [Google Scholar] [CrossRef] [PubMed]
- Nakada, T.; et al. The Effects of Low-Dose-Rate γ-irradiation on Forced Swim Test-Induced Immobility and Oxidative Stress in Mice. Acta Med Okayama 2021, 75, 169–175. [Google Scholar] [CrossRef]
- Ma, T.; et al. Low-dose-rate induces more severe cognitive impairment than high-dose-rate in rats exposed to chronic low-dose γ-radiation. Front Public Health 2024, 12, 1387330. [Google Scholar] [CrossRef] [PubMed]
- Schmitz, C.; et al. Prenatal protracted irradiation at very low dose rate induces severe neuronal loss in rat hippocampus and cerebellum. Neuroscience 2005, 130, 935–948. [Google Scholar] [CrossRef] [PubMed]
- Rothkamm, K.; Horn, S. gamma-H2AX as protein biomarker for radiation exposure. Ann Ist Super Sanita 2009, 45, 265–271. [Google Scholar] [PubMed]
- Ramadhani, D.; et al. γ-H2AX and phospho-ATM enzyme-linked immunosorbent assays as biodosimetry methods for radiation exposure assessment: a pilot study. Radiat Prot Dosimetry 2023, 199, 2383–2390. [Google Scholar] [CrossRef] [PubMed]
- Podhorecka, M.; Skladanowski, A.; Bozko, P. H2AX Phosphorylation: Its Role in DNA Damage Response and Cancer Therapy. J Nucleic Acids 2010, 2010. [Google Scholar] [CrossRef]
- Raavi, V.; Perumal, V.; Paul, S.F. Potential application of γ-H2AX as a biodosimetry tool for radiation triage. Mutat Res Rev Mutat Res 2021, 787, 108350. [Google Scholar] [CrossRef] [PubMed]
- Chen, Z.; et al. Radiation exposure lymphocyte damage assessed by γ-H2AX level using flow cytometry. Sci Rep 2024, 14, 4339. [Google Scholar] [CrossRef]
- Zhao, H.; et al. An estimate assay for low-level exposure to ionizing radiation based on mass spectrometry quantification of γ-H2AX in human peripheral blood lymphocytes. Front Public Health 2022, 10, 1031743. [Google Scholar] [CrossRef]
- Moroni, M.; et al. Evaluation of the gamma-H2AX assay for radiation biodosimetry in a swine model. Int J Mol Sci 2013, 14, 14119–14135. [Google Scholar] [CrossRef]
- Fardid, R.; et al. Evaluation of the relationship between γ-H2AX biomarker levels and dose received after radiation exposure in abdominal-pelvic and chest CT scans. J Cancer Res Ther 2023, 19, 1392–1397. [Google Scholar] [CrossRef]
- Redon, C.E.; et al. The use of gamma-H2AX as a biodosimeter for total-body radiation exposure in non-human primates. PLoS One 2010, 5, e15544. [Google Scholar] [CrossRef]
- Segaran, R.C.; et al. Neuronal Development-Related miRNAs as Biomarkers for Alzheimer’s Disease, Depression, Schizophrenia and Ionizing Radiation Exposure. Curr Med Chem 2021, 28, 19–52. [Google Scholar] [CrossRef]
- Zhang, J.Z.; et al. miR-448-3p controls intracranial aneurysm by regulating KLF5 expression. Biochem Biophys Res Commun 2018, 505, 1211–1215. [Google Scholar] [CrossRef] [PubMed]
- Boga, Z.; et al. The Role of miR-26a, miR-29a and miR-448-3p in the Development of Cerebral Aneurysm. Turk Neurosurg 2023, 33, 423–430. [Google Scholar] [CrossRef] [PubMed]
- Xu, M.; et al. Inhibition of miR-448-3p Attenuates Cerebral Ischemic Injury by Upregulating Nuclear Factor Erythroid 2-Related Factor 2 (Nrf2). Neuropsychiatr Dis Treat 2021, 17, 3147–3158. [Google Scholar] [CrossRef] [PubMed]
- Zeng, T.; et al. MiR-361-5p promotes oxygen-glucose deprivation/re-oxygenation induced neuronal injury by negatively regulating SQSTM1 in vitro. Metab Brain Dis 2021, 36, 2359–2368. [Google Scholar] [CrossRef]
- Tommasi, S.; et al. miR-151-5p, targeting chromatin remodeler SMARCA5, as a marker for the BRCAness phenotype. Oncotarget 2016, 7, 80363–80372. [Google Scholar] [CrossRef]
- Jia, J.; et al. MicroRNA-361-5p slows down gliomas development through regulating UBR5 to elevate ATMIN protein expression. Cell Death Dis 2021, 12, 746. [Google Scholar] [CrossRef]
- Li, C.G.; et al. PPARγ Interaction with UBR5/ATMIN Promotes DNA Repair to Maintain Endothelial Homeostasis. Cell Rep 2019, 26, 1333–1343.e7. [Google Scholar] [CrossRef]
- Huang, Y.; et al. Transcriptome Sequencing Reveals Tgf-β-Mediated Noncoding RNA Regulatory Mechanisms Involved in DNA Damage in the 661W Photoreceptor Cell Line. Genes 2022, 13, 2140. [Google Scholar] [CrossRef]
- Kwon, J.E.; et al. Ionizing radiation-inducible microRNA miR-193a-3p induces apoptosis by directly targeting Mcl-1. Apoptosis 2013, 18, 896–909. [Google Scholar] [CrossRef]
- Meng, F.; et al. miR-193a-3p regulation of chemoradiation resistance in oesophageal cancer cells via the PSEN1 gene. Gene 2016, 579, 139–145. [Google Scholar] [CrossRef]
- Ben-David, Y.; Giddens, E.B.; Bernstein, A. Identification and mapping of a common proviral integration site Fli-1 in erythroleukemia cells induced by Friend murine leukemia virus. Proc Natl Acad Sci U S A 1990, 87, 1332–1336. [Google Scholar] [CrossRef] [PubMed]
- Bonetti, P.; et al. Deregulation of ETS1 and FLI1 contributes to the pathogenesis of diffuse large B-cell lymphoma. Blood 2013, 122, 2233–2241. [Google Scholar] [CrossRef] [PubMed]
- Li, Y.; et al. The ets transcription factor Fli-1 in development, cancer and disease. Oncogene 2015, 34, 2022–2031. [Google Scholar] [CrossRef]
- Ma, Y.; et al. Fli-1 Activation through Targeted Promoter Activity Regulation Using a Novel 3’, 5’-diprenylated Chalcone Inhibits Growth and Metastasis of Prostate Cancer Cells. Int J Mol Sci 2020, 21, 2216. [Google Scholar] [CrossRef] [PubMed]
- Chen, E.; et al. FLI1 regulates radiotherapy resistance in nasopharyngeal carcinoma through TIE1-mediated PI3K/AKT signaling pathway. J Transl Med 2023, 21, 134. [Google Scholar] [CrossRef]
- Rajesh, Y.; et al. Transcriptional regulation of HSPB1 by Friend leukemia integration-1 factor modulates radiation and temozolomide resistance in glioblastoma. Oncotarget 2020, 11, 1097–1108. [Google Scholar] [CrossRef]
- Sizemore, G.M.; et al. The ETS family of oncogenic transcription factors in solid tumours. Nat Rev Cancer 2017, 17, 337–351. [Google Scholar] [CrossRef] [PubMed]
- Ota, H.; Nishihara, S. Regulation of 3-O-Sulfation of Heparan Sulfate During Transition from the Naïve to the Primed State in Mouse Embryonic Stem Cells. Methods Mol Biol 2022, 2303, 443–452. [Google Scholar] [CrossRef]
- Wainberg, M.; Andrews, S.J.; Tripathy, S.J. Shared genetic risk loci between Alzheimer’s disease and related dementias, Parkinson’s disease, and amyotrophic lateral sclerosis. Alzheimers Res Ther 2023, 15, 113. [Google Scholar] [CrossRef]
- Hayashi, S.; et al. Comprehensive investigation of CASK mutations and other genetic etiologies in 41 patients with intellectual disability and microcephaly with pontine and cerebellar hypoplasia (MICPCH). PLoS One 2017, 12, e0181791. [Google Scholar] [CrossRef]
- Bidinosti, M.; et al. Postnatal deamidation of 4E-BP2 in brain enhances its association with raptor and alters kinetics of excitatory synaptic transmission. Mol Cell 2010, 37, 797–808. [Google Scholar] [CrossRef] [PubMed]
- Meehan, J.; et al. A Novel Approach for the Discovery of Biomarkers of Radiotherapy Response in Breast Cancer. J Pers Med 2021, 11, 796. [Google Scholar] [CrossRef]
- Bryan, A.M.; Del Poeta, M. Sphingosine-1-phosphate receptors and innate immunity. Cell Microbiol 2018, 20, e12836. [Google Scholar] [CrossRef] [PubMed]
- Hla, T.; Maciag, T. An abundant transcript induced in differentiating human endothelial cells encodes a polypeptide with structural similarities to G-protein-coupled receptors. J Biol Chem 1990, 265, 9308–9313. [Google Scholar] [CrossRef]
- Gruchot, J.; et al. Siponimod Modulates the Reaction of Microglial Cells to Pro-Inflammatory Stimulation. Int J Mol Sci 2022, 23, 13278. [Google Scholar] [CrossRef]
- Chen, X.; et al. Integrative analysis of potential biomarkers and immune cell infiltration in Parkinson’s disease. Brain Res Bull 2021, 177, 53–63. [Google Scholar] [CrossRef]
- Matsumoto, N.; et al. Up-regulation of sphingosine-1-phosphate receptors and sphingosine kinase 1 in the peri-ischemic area after transient middle cerebral artery occlusion in mice. Brain Res 2020, 1739, 146831. [Google Scholar] [CrossRef] [PubMed]
- Liu, L.; et al. Radiosensitivity-related Variation in MicroRNA-34a-5p Levels and Subsequent Neuronal Loss in the Hilus of the Dentate Gyrus after Irradiation at Postnatal Days 10 and 21 in Mice. Radiat Res 2024. [Google Scholar] [CrossRef]
| miRNA | Primer sequence |
|---|---|
| mmu-miR-448-3p | TTGCATATGTAGGATGTCCCAT |
| mmu-miR-193a-3p | AACTGGCCTACAAAGTCCCAGT |
| mmu-miR-361-5p | TTATCAGAATCTCCAGGGGTAC |
| mmu-miR-450-5p | CGTTTTGCGATGTGTTCCTAAT |
| mmu-miR-20a-3p | ACTGCATTACGAGCACTTAAAG |
| mmu-miR-495-3p | AAACAAACATGGTGCACTTCTT |
| mmu-miR-199b-3p | ACAGTAGTCTGCACATTGGTTA |
| mmu-miR-101a-5p | TCAGTTATCACAGTGCTGATGC |
| mmu-miR-10b-5p | TACCCTGTAGAACCGAATTTGTG |
| mmu-miR-1298-3p | CATCTGGGCAACTGATTGAACT |
| mmu-miR-124b-3p | TCAAGGTCCGCTGTGAACACGG |
| mmu-miR-16-2-3p | GACCAATATTATTGTGCTGCTTT |
| mmu-miR-7037-5p | AAGGTGGCCACAGGAGATCATGGT |
| mmu-miR-206-3p | TGGAATGTAAGGAAGTGTGTGG |
| mmu-miR-1947-5p | AGGACGAGCTAGCTGAGTGCTG |
| mmu-miR-199b-3p | ACAGTAGTCTGCACATTGGTTA |
| mmu-miR-5134-3p | ACGGGTGGCCCTCTTTCTGCAG |
| mmu-miR-296-5p | AGGGCCCCCCCTCAATCCTGT |
| mmu-miR-7024-5p | TTGGGGGATGGGTTGCTTGGC |
| mmu-miR-6967-3p | TCATCTTTATCTCTCCCCAG |
| mmu-miR-68 | GCTGTACTGACTTGATGAAAGTAC |
| Gene name | Primer sequence |
|---|---|
| Ccn1 F | CGTCCTTGTGGACAACCAGT |
| Ccn1 R | CATGATGCTTGCGCTTCTCC |
| Cort F | TGTGAGATGCCAACGAGACC |
| Cort R | TGTTGTCGGTAGCGAGCATT |
| Foxh1 F | CAGGCTGAAACTGGCTCAGA |
| Foxh1 R | AGGAGCTAGAGGGTCCAGTG |
| Fli1 F | ATCTGAAGGGGCTACGAGGT |
| Fli1 R | TGACTCTCCGTTCGTTGGTG |
| Opalin | GATGAGCCCCGTATGTCCTG |
| Opalin | GCCTGTCCTAACTTGTGCCA |
| Fosb F | CCTTCAGTCCCAAAGACGAGT |
| Fosb R | GGGTGGGGTTTGGGATTAGG |
| Ets1 | CGGTCAGCGGGAATTTGAGA |
| Ets1 | ATCTCCTGGCCACCTCATCT |
| Hs3st5 | GGCGTGTCTGAATGTAGGCT |
| Hs3st5 | CTCCTTCCCCTCTAGCACCT |
| Eif4ebp2 F | AGCAGAAGTGCCAACACCTT |
| Eif4ebp2 R | GATGTGGAAAATGGCCCGGT |
| Zfhx4 F | TAAGGCTGAGACTTGGCTGC |
| Zfhx4 R | CCCTGTCAGGCTCTATCCCT |
| YOD1 F | TTTGACCCCATTTCCCCAGT |
| YOD1 R | TAGGTTGGCCAGTAACCCCT |
| Hivep3 F | CCCACCATCCCCACTGAAAG |
| Hivep3 R | GGCAACCCGGGCTCCTTTAT |
| Chrm5 F | GCTTGTCAAGGTGCAAGGTC |
| Chrm5 R | GTCCCTGCTGTTCTTCACAGA |
| Cox6b2 F | TTTTCTCCCGTGCTCTTGGG |
| Cox6b2 R | AGTACTCGCAGGGTTGTGTG |
| TSPO F | CTTGGGTCTCTACACTGGTC |
| TSPO R | AGACTTTATTTAGCTTTAAAACACC |
| Notch3 F | CTCTCCCTGCCTCAACTTCC |
| Notch3 R | CTCCCAAATGTCCCCTGACC |
| Kifc1 F | GAGCCTGCAAAGAAACGGAC |
| Kifc1 R | TATATGCCACCTACTGCCAGG |
| Orc1 F | AAGTGTTGGAGAAGTTACGGT |
| Orc1 R | GACCAACCCACCAGGGATTT |
| Apoc1 F | GGGCGGTGGTGAATACTAGC |
| Apoc1 R | TGGCTACGACCACAATCAGG |
| Rnf43 F | AATTTGTTTCATCCCCGTGCC |
| Rnf43 R | CTCCCATCGTCACTGCGAAT |
| Ahnak F | CAGTCAGCACTGCGACCTC |
| Ahnak R | TTTGCAGGACTCTGCTCAGG |
| Tppp3 F | TAGAAGCCGGGTGGCATGG |
| Tppp3 R | GTTCTTTGTGGGAGCCCGTA |
| Cdkn2c F | CCGGCACAGTACCTTCAGAG |
| Cdkn2c R | AGCTCAGGCTCTTCACTGCAA |
| S1pr5 F | ACACCAAATGCCCAGCTTAC |
| S1pr5 R | AAGTCTCCTGTAACCGGCAC |
| Mcpt4 F | AGAATCTCTCTCCAAGCTGT |
| Mcpt4 R | GTAAGGGCGAGAATGTGGTC |
| Rbpms F | ATTGCCTCAAGAGGAGCAGG |
| Rbpms R | GGGCGGTCTATCTGACATGG |
| Vcam1 F | ACTTTCTAATTCATGGTAGAATGGC |
| Vcam1 R | CAATGAAGAAACAGGTCCCCG |
| Lepr F | TGATAATGGTGTGACGGTTGC |
| Lepr R | GGAAGCTTTCACACACTGAA |
| Slc15a2 F | CAGGGAACGAGCTTGGGAAT |
| Slc15a2 R | GCAGTTGTCTGGGGAAAGGA |
| Mlxipl F | CCTGAGCATCTGCAGCCTC |
| Mlxipl R | ATGACAGCCTCAGGTTTCCG |
| GAPDH F | ACCACAGTCCATGCCATCAC |
| GAPDH R | TCCACCACCCTGTTGCTGTA |
Disclaimer/Publisher’s Note: The statements, opinions and data contained in all publications are solely those of the individual author(s) and contributor(s) and not of MDPI and/or the editor(s). MDPI and/or the editor(s) disclaim responsibility for any injury to people or property resulting from any ideas, methods, instructions or products referred to in the content. |
© 2024 by the authors. Licensee MDPI, Basel, Switzerland. This article is an open access article distributed under the terms and conditions of the Creative Commons Attribution (CC BY) license (http://creativecommons.org/licenses/by/4.0/).


