Preprint
Article

Remaining Useful Life Prediction for Lithium-Ion Batteries Based on Hybrid Ensembles Allied with Data-Driven Approach

Altmetrics

Downloads

74

Views

28

Comments

0

This version is not peer-reviewed

Submitted:

30 August 2024

Posted:

30 August 2024

You are already at the latest version

Alerts
Abstract
In the realm of Lithium-ion batteries, issues like material aging and capacity decline contribute to performance degradation or potential safety hazards. Predicting Remaining Useful Life (RUL) serves as a crucial method to assess the health of batteries, thereby enhancing reliability and safety. Currently hybrid approaches for batteries RUL estimation are prevalence and gained fruitful development. In this paper, a hybrid voting ensembles combining Gradient Boosting, Random Forest and K-Nearest Neighbors is proposed to predict the capacity fade trend and knee point. Finally, extensive experiments are conducted using CALCE CS2 datasets. According to the experimental results, the proposed approach supersedes the single deep learning approach for RUL prediction and the knee point is predicted accurately. Besides prediction purpose, this innovated approach can be also proposed to be integrated into the real-world application for wider usage.
Keywords: 
Subject: Chemistry and Materials Science  -   Electrochemistry

1. Introduction

The manufacturing techniques of lithium-ion batteries are rapidly developing globally nowadays, since global corporations are actively positioning themselves in battery technology sector and scholars are attracted to engage in research for the improvement of battery technology. Meanwhile, various green energy policies and reducing greenhouse gas emissions plans are introduced by governments around the world for boosting the development of battery and battery relative industries [1]. As a result, the battery industry can be foreseen to become even more prosperous in the near future. However, there is a significant shortcoming of lithium-ion batteries is that the performance declines gradually over time with usage [2]. This degradation problem is affected by many different factors because of the complexity of lithium-ion batteries systems. Therefore, there is a long way to go for tackling this problem. On another hand, the battery operational data, such as voltage, current, temperature, capacity, and energy, are available during its lifespan. Further, the relation between battery performance features and degradation to a certain extent has been proven by scholars [3]. There is feasibility of predicting the battery remaining useful life influenced by the historical performance features. This estimation is called as remaining useful life (RUL) estimation.
Accurate RUL estimation is crucial aspects of prognostics and health management since the estimation result can provide reference for improving maintenance strategies, optimizing life-cycle costs, and mitigating operational risks or issues [4]. Model-based methods, data-driven approaches and hybrid approaches are the mainstream methods for RUL estimation at present [5]. The model-based method can be further divided into mechanism-based method and empirical-based method. These methods are highly depending on the equipment and requires for long-time experimental exercisers, which is difficult to apply to real-world applications [6]. With the development of data minding technology, data-driven approach is able to constructing aging prediction models by historical operational data. But this approach requires large amount of data for modeling. Its adaptability and reliability are uncertain as well [7]. Due to the rapid evolution of machine learning technology, the hybrid approaches combining optimization and machine learning techniques have gained popularity [8]. Having the advantages of both methodologies, a powerful framework with the ability to resolve complicated problems is built. That leads to the more accurate and efficient batteries RUL estimation modules while applying this kind of approaches.
There are remaining numerous technical and practical obstacles for predicting the state of charge (SOC), state of health (SOH), and remaining useful life (RUL) of batteries, machine learning methods have great advantage in improving the accuracy and efficiency [9]. K-Nearest Neighbor regression model is exploited for remaining useful life estimation by incorporating data from all the cells in a battery pack [10]. Gradient Boosting machine learning approach is suitable for real world applications and handling nonlinear input features [11,12]. An optimized Random Forest Regression model is developed to enhance the learning and generalization ability. This model can achieve high accuracy in a short time using a small number of samples [13].
Recently, in order to lessen the error rate, gain better robustness and achieve better prediction performance, the ensemble learning method is frequently used for battery RUL estimation. A novel ensemble learning method [14] consists of 5 basic learners, including Relevance Vector Machine (RVM), Random Forest (RF), Elastic Net (EN), Auto Regressive (AR), and Long Short-Term Memory (LSTM), is developed. The experiment validation shows that this approach has improvement in robustness and generalization effect. Another ensemble model [15] based on CEEMDAN and CNN-BiGRU is designed to achieve higher precision and reliability.
Remaining useful life (RUL), which is typically random and unknown, is the number of charge-discharge cycles left on a battery at a particular time of operation until its maximum usable capacity decays to a predefined failure threshold. A hybrid deep learning model [16] for early prediction of battery RUL combining handcrafted features with domain knowledge and latent features learned by deep networks is proposed. This model enhances model generalization ability without increasing any additional training cost and has great contribution to the improvement of model prediction accuracy and generalization ability.The main objective of this proposed approach is to predict the batteries RUL from features, such as voltage, current, internal resistance, and capacity. This proposed approach jointly combines Gradient Boosting, Random Forest and K-Nearest Neighbor into voting ensembles, so as to integrate the advantages of ensemble learning.
The battery capacity degradation processes can be divided into two period. Initially, the battery is health and the capacity is stable with a steady decline. When the capacity degrades to a certain rate and then drops to a certain point, the capacity goes through an accelerated degradation. That certain point is normally called knee point [17]. Currently, most of previous works are focusing on predicting the SOC, SOH or RUL for battery health determination. But for knee point, there is seldom researches discussed on it. Although the existing works have enhanced the model to be low error rate, high accurate and efficient, these models are normally evaluated within a single battery dataset, where they are divided into training and evaluation measurement segments. The experiments of applying the model to multiple batteries has not been considered. Therefore, the experiments taken for verification are not sufficient enough.
In this paper, to overcome the above existing issues, an innovated hybrid ensembles approach is proposed for battery RUL prediction and knee point estimation, as shown in Figure 1. Regression methods of Gradient Boosting, Random Forest and K-Nearest Neighbors are integrated into voting ensembles is designed to enhance the generalization performance and improve the accuracy. After generating the prediction result, the binomial fitting algorithm is employed to predict the RUL knee point. With extensive experiments, the proposed approach has demonstrated significant advantages and potential in predicting battery RUL and knee point, contributing to improving the development and application of battery RUL prediction technology.

2. Methods

Three models integrated into voting ensembles are developed for predicting based on regression methods. These three regression methods are Gradient Boosting, Random Forest and K-Nearest Neighbors.

2.1. Gradient Boosting

Gradient Boosting [18] is a popular machine learning technique used for regression tasks. It is an ensemble learning method that combines the predictions of several base estimators sequentially, with each subsequent estimator correcting the errors made by its predecessor. Gradient Boosting algorithmic is as follows.
Let dataset x i , y i i = 1 , , n . Initialize model with constant value f ^ ( x ) = f ^ 0 , f ^ 0 = γ , γ R ,
f ^ 0 = a r g m i n γ i = 1 n L ( y i , γ )
Calculate residuals, for each t = 1 , , M , repeat. Compute pseudo-residuals, for i = 1 , , n ,
r i t = L ( y i , f ( x i ) ) f ( x i ) f x = f ^ ( x )
Build new base algorithm h t x   as regression on pseudo-residuals x i , y i i = 1 , , n . Find optimal coefficient ρ t   at h t x   regarding initial loss function.
ρ t = a r g m i n ρ i = 1 n L ( y i , f ^ x i + ρ h x i , θ )
f ^ t ( x ) = ρ t h t x
Update current approximation and compose final model,
f ^ x f ^ x + f ^ t x = i = 1 t f ^ i x
f ^ x = i = 0 M f ^ i x

2.2. Random Forest

Random Forest [19,20] is a powerful ensemble learning method that operates by constructing a multitude of decision trees during training and outputs the class that is the mode of the classes or mean prediction of the individual trees. This method is widely used across various domains due to its flexibility, robustness, and high performance. Particularly, it is favored when accuracy and interpretability of results are both important considerations. The algorithm for Random Forest construction is as follows.
For each k = 1 , , N , generate a bootstrap sample X k . Build a decision tree b k   on the sample X k . Pick the best feature according to the given criteria. Split the sample by this feature to create a new tree level. Repeat this procedure until the sample is exhausted. Building the tree until any of its leaves contains no more than n min instances or until a certain depth is reached. For each split, we first randomly pick m features from the d   original ones and then search for the next best split only among the subset. The final model is defined as,
a x = 1 N k = 1 N b k ( x )

2.3. K-Nearest Neighbor

K-Nearest Neighbor [21] is a fundamental algorithm in machine learning, providing a baseline for many regression problems. Its simplicity and effectiveness make it a valuable tool in various domains. K-Nearest Neighbor helps identify the nearest points. There are some metrics to determine the nearest points. Minkowski distance is a metric in a normed vector space. Mainly, Minkowski distance is applied in machine learning to find out distance similarity. The formula is indicated as follows,
L p ( x i , x j ) = i n x i ( l ) x j ( l ) p 1 p
For the above formula, when p = 2 then it is the same as the formula for the Euclidean distance, and when p = 1 then we obtain the formula for the Manhattan distance.

2.4. Voting Ensembles

Voting ensembles are generally used in classification or regression problems to improve predictive performance. In addition, voting methods are the appropriate integrating method for bagging and boosting methods [22]. In this paper, method of averaging voting is employed for the proposed approach. The idea of averaging voting is that predictions are extracted from multiple models, and an average of the predictions is used to make the final prediction. Average prediction is calculated using the arithmetic mean, which is the sum of the predictions divided by the total predictions made as shown in the following formula.
y * = a r g m a x i 1 n j = 1 m w i j
where w i j is the probability of the i t h class label of the j t h classifier [23].

3. Experiments

3.1. Experiment and Dataset

In this paper, the voting ensembles integrated with Gradient Boosting, Random Forest, and K-Nearest Neighbor. All these algorithms are implemented by Scikit-learn. The battery test dataset of CS2 is provided by CALCE (Centre for Advanced Life Cycle Engineering) battery team [24,25,26,27]. The CALCE CS2 battery follows a standard constant current/constant voltage protocol and its capacity rating is 1.1 Ah. Initially, this battery is charged with a current of 0.5C until the voltage reaches 4.2V. The voltage sustains until the current drops to 0.05A. Under normal circumstances, the battery discharges at a rate of 1C until the voltage reaches 2.7V. Batteries named CS2_35, CS2_36, CS2_37, and CS2_38 are selected to verify the proposed approach from the dataset.
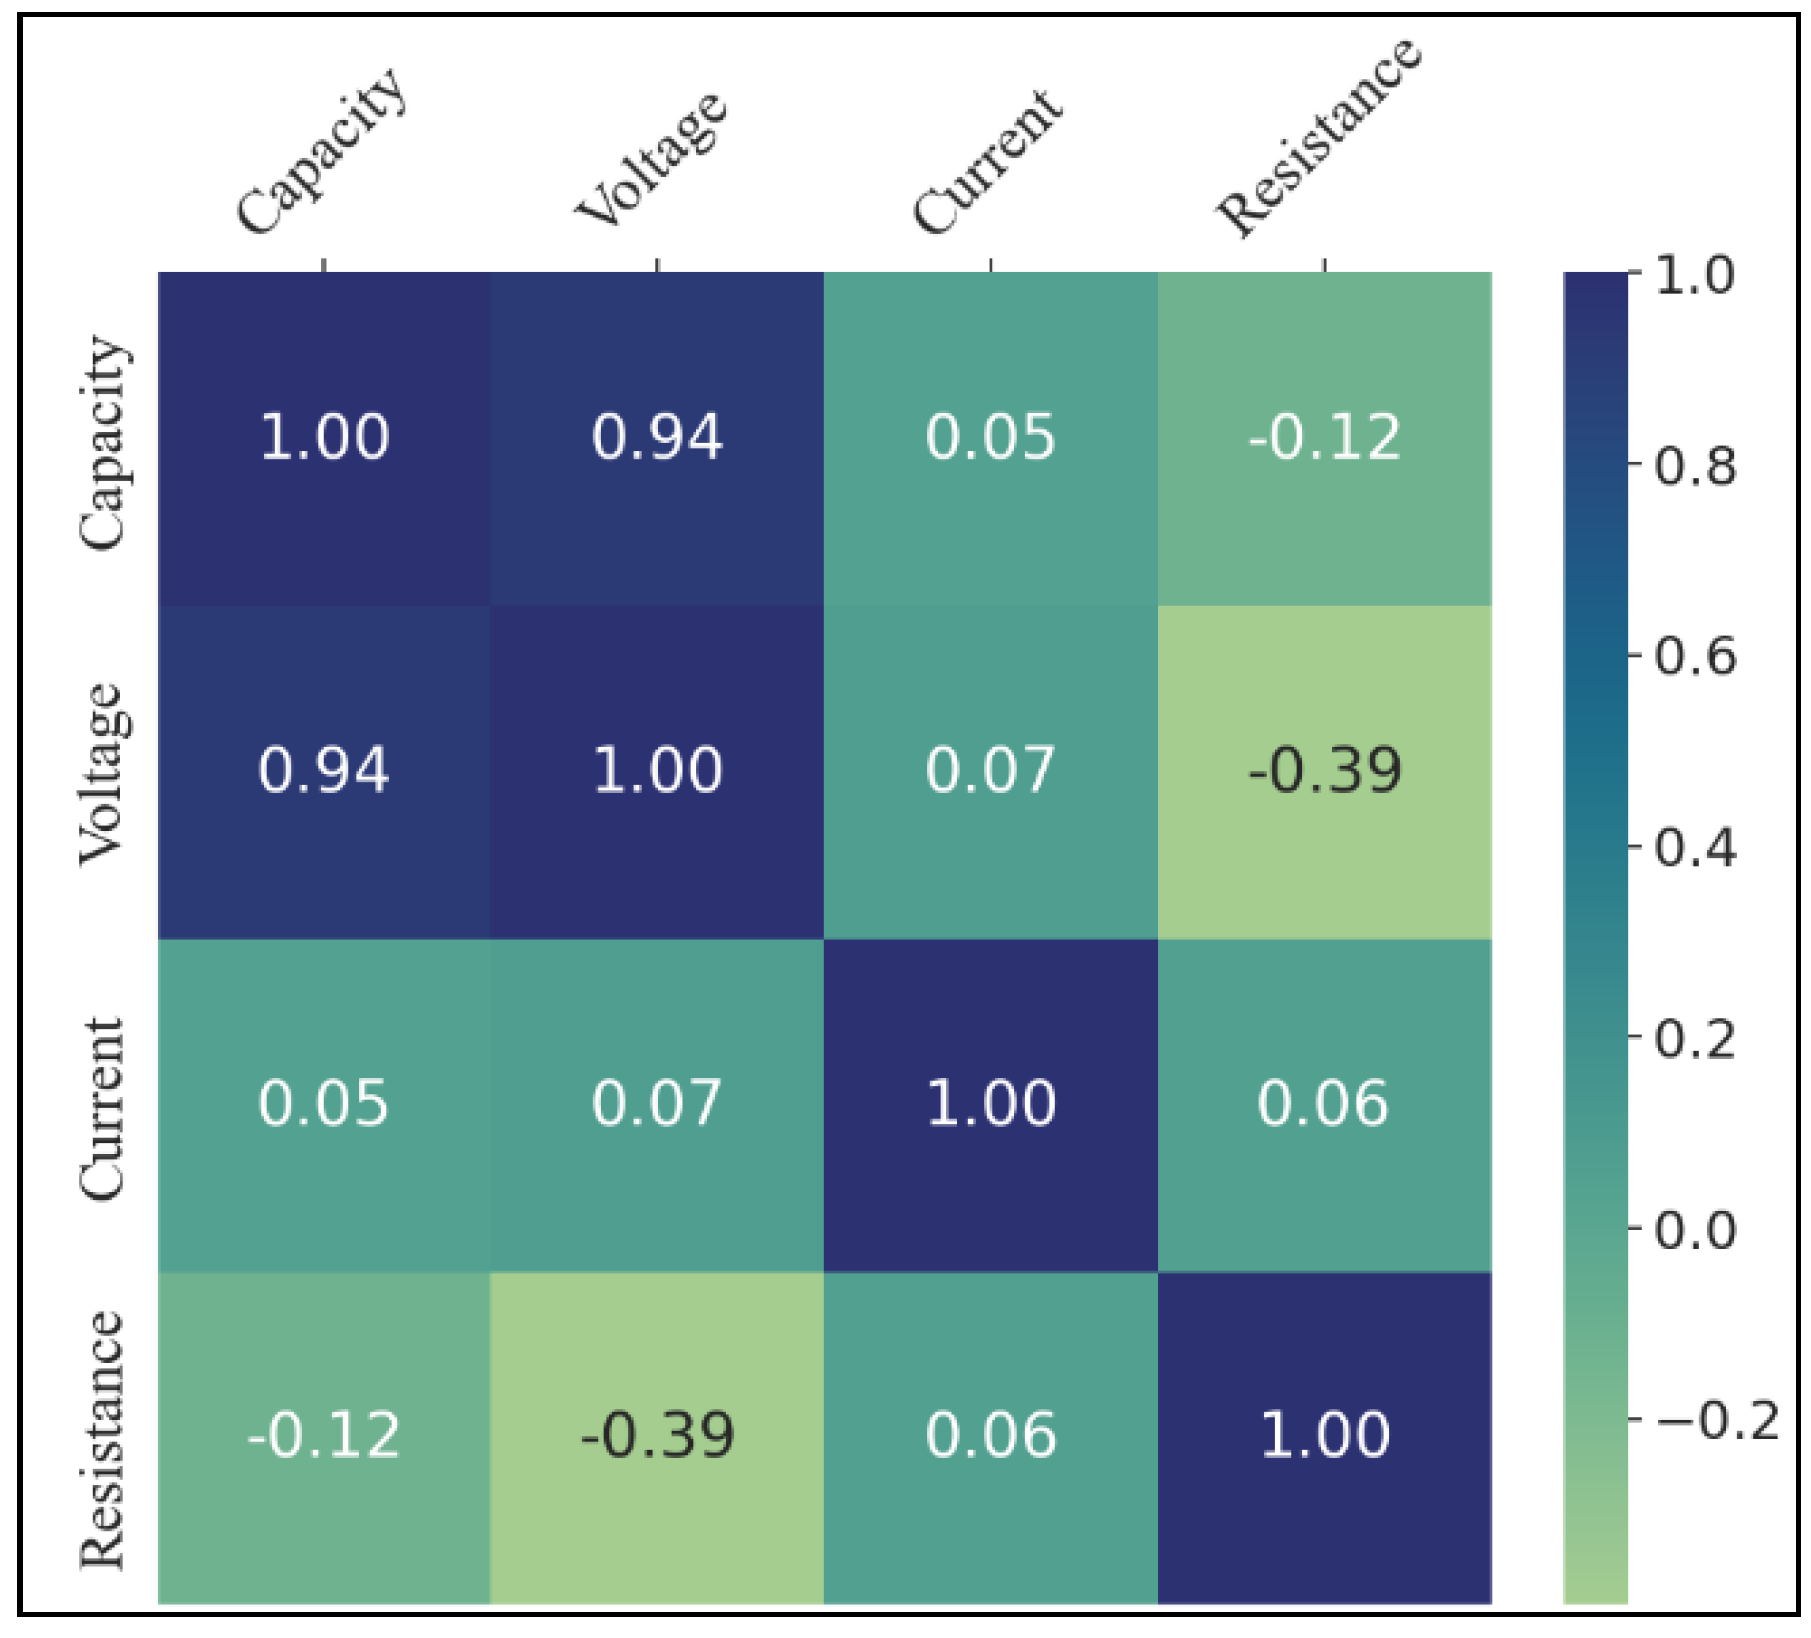
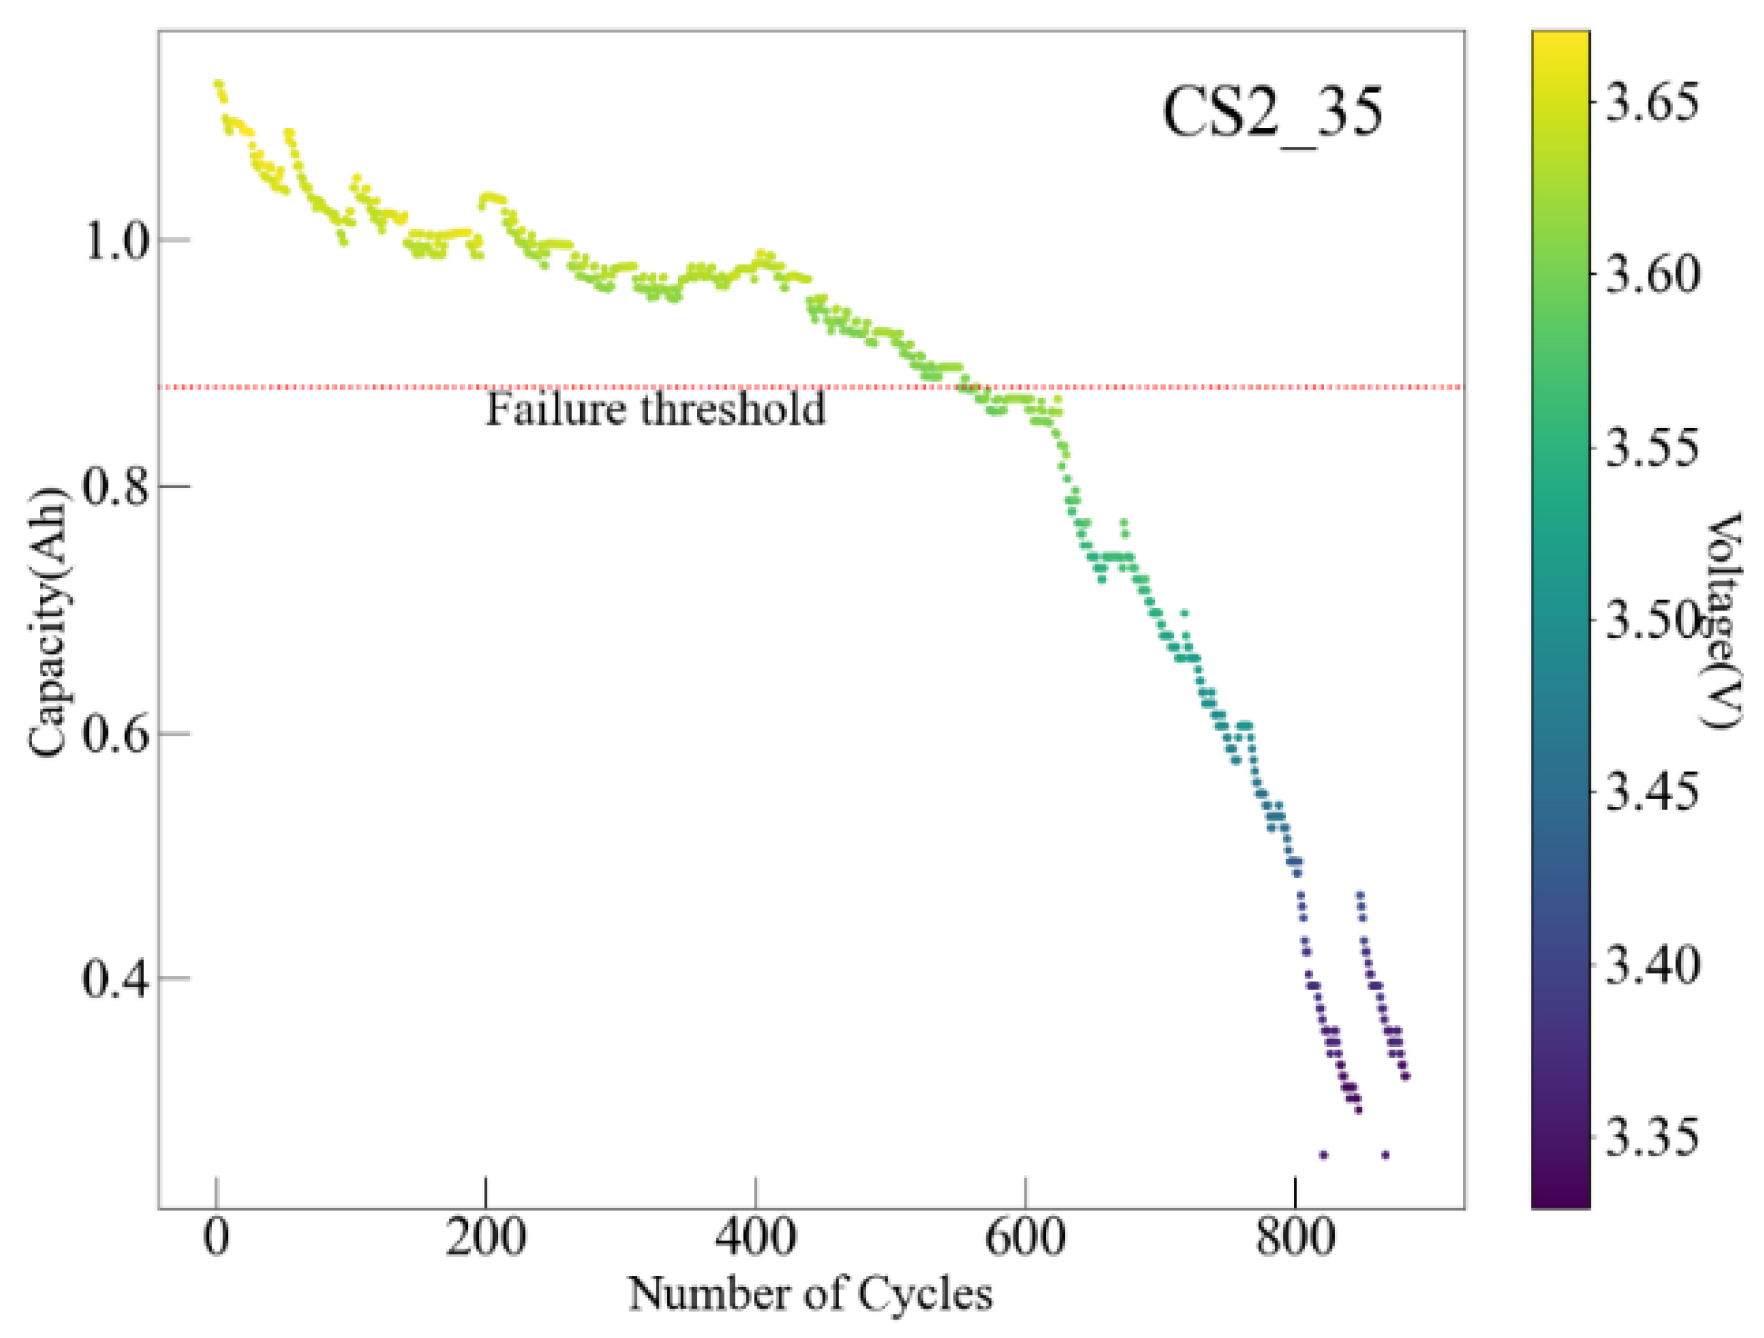
As can be seen in Figure 2, the feature of voltage has the greatest correlation coefficient (0.94) with capacity among others. This indicates that the change of capacity relates to voltage change trend closely. Take CS2_35 for example (Figure 3), the nominal capacity is 1.1 Ah, the failure threshold is 0.88 Ah. Initially, the capacity drops steadily. Once the capacity reaches the line of failure threshold, the capacity become stable for a few cycles, but diminishes dramatically subsequently. The voltage has the same trend as capacity as well. To explore this phenomenon, due to the loss of charge carriers or active materials, the capacity fade. Further, since the impedance keeps increasing while rising of charge-discharge cycles, the voltage drops [28].
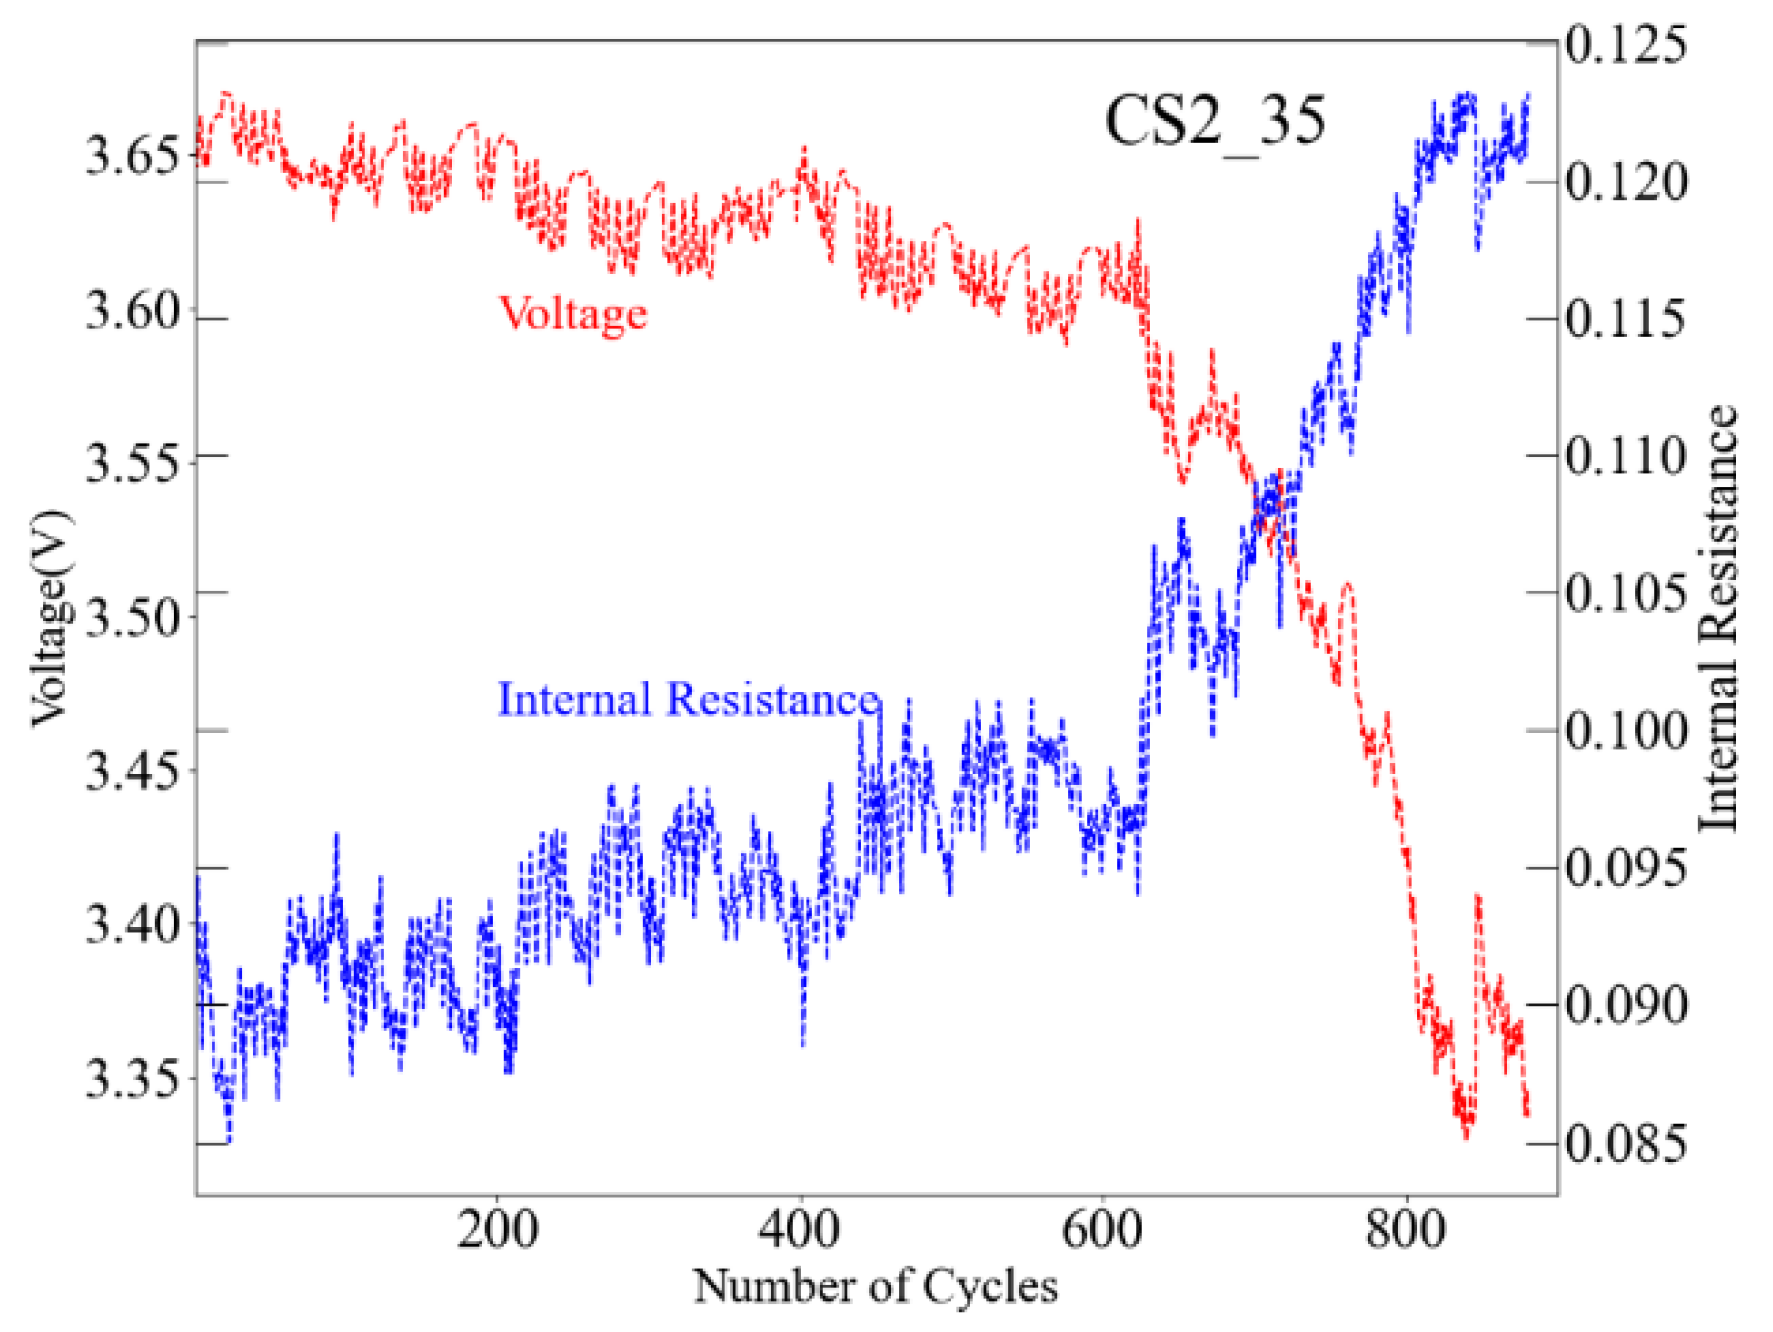
With time and use, the battery storage capacity diminishes and the internal resistance increases due to a wide range of degradation mechanisms, some occurring simultaneously, or triggering further mechanisms [29]. Electrode material aging leads to a decrease in capacity and/or a rise in resistance of the whole cell and thus can dramatically affect the performance of lithium-ion batteries. Furthermore, the aging phenomena are extremely complicated to describe due to the coupling of various factors [30]. Figure 4 evidences this phenomenon quantitatively. As the result of impedance increase, the battery internal resistance keeps rising. The internal resistance rises smoothly, but after certain cycles (failure threshold), the increasing trend accelerates. The trend for voltage is converse. This leads to the decrease of battery capacity as describe previously.
It is worth mentioning that the feature of current has the low correlation coefficient (0.05) with capacity. The reason is that experimental test for battery CS2 was conducted with a constant current of 1C. Hence, the capacity can be considered as not affected by current due to its stable status on data-driven perspective. Nevertheless, current is also one of factors for battery capacity prediction. Although some usage patterns and operating conditions lead to rapid degradation by one or more processes and the interplay between mechanisms is still not well understood [31], the features of voltage and current are still having connection with capacity. There is feasibility to apply these features for prediction.

3.2. Data Standardization

For this study, data for battery numbered CS2_35 are selected for training, and data for batteries CS2_36, CS2_37 and CS2_38 are applied for prediction. In order to streamline data storage, reduce input error, and ensure consistency, data standardization is crucial for the standard preprocessing step. Z-score technique based on the mean and standard deviation of the data is adopted. For this approach, each value is replaced by a score that indicates the standard deviations from the mean. The following formula is defined as follows.
x n o r m = x m i n ( x ) max x m i n ( x )  
where x n o r m   is the new value of x , m a x ( x )   and m i n ( x )   define the maximum and minimum of x .

3.3. Estimation Indicator and Process

Currently, there are two key indicators are used normally for battery health prediction, namely, Remaining Useful Life (RUL) and State of Health (SOH) [32]. The RUL of lithium-ion batteries represents the remaining number of battery cycles, including charging and discharging, before the actual capacity drops to the baseline and reaches the end of life (EOL) [33]. The formula for RUL is defined as follows,
R U L = N e o l N t
where N e o l denotes the number of battery cycles while reaching the end of life, and N t represents the total number of charge-discharge cycles occurred.
SOH is the key health indicator for battery aging, and indicates the percentage of current charge-discharge capacity over the nominal capacity [34,35]. The SOH formula [36] is defined as follows,
S O H t = C t C n × 100 %
where C t denotes the capacity at the t t h cycle, and C n denotes the nominal capacity when the battery is fresh.
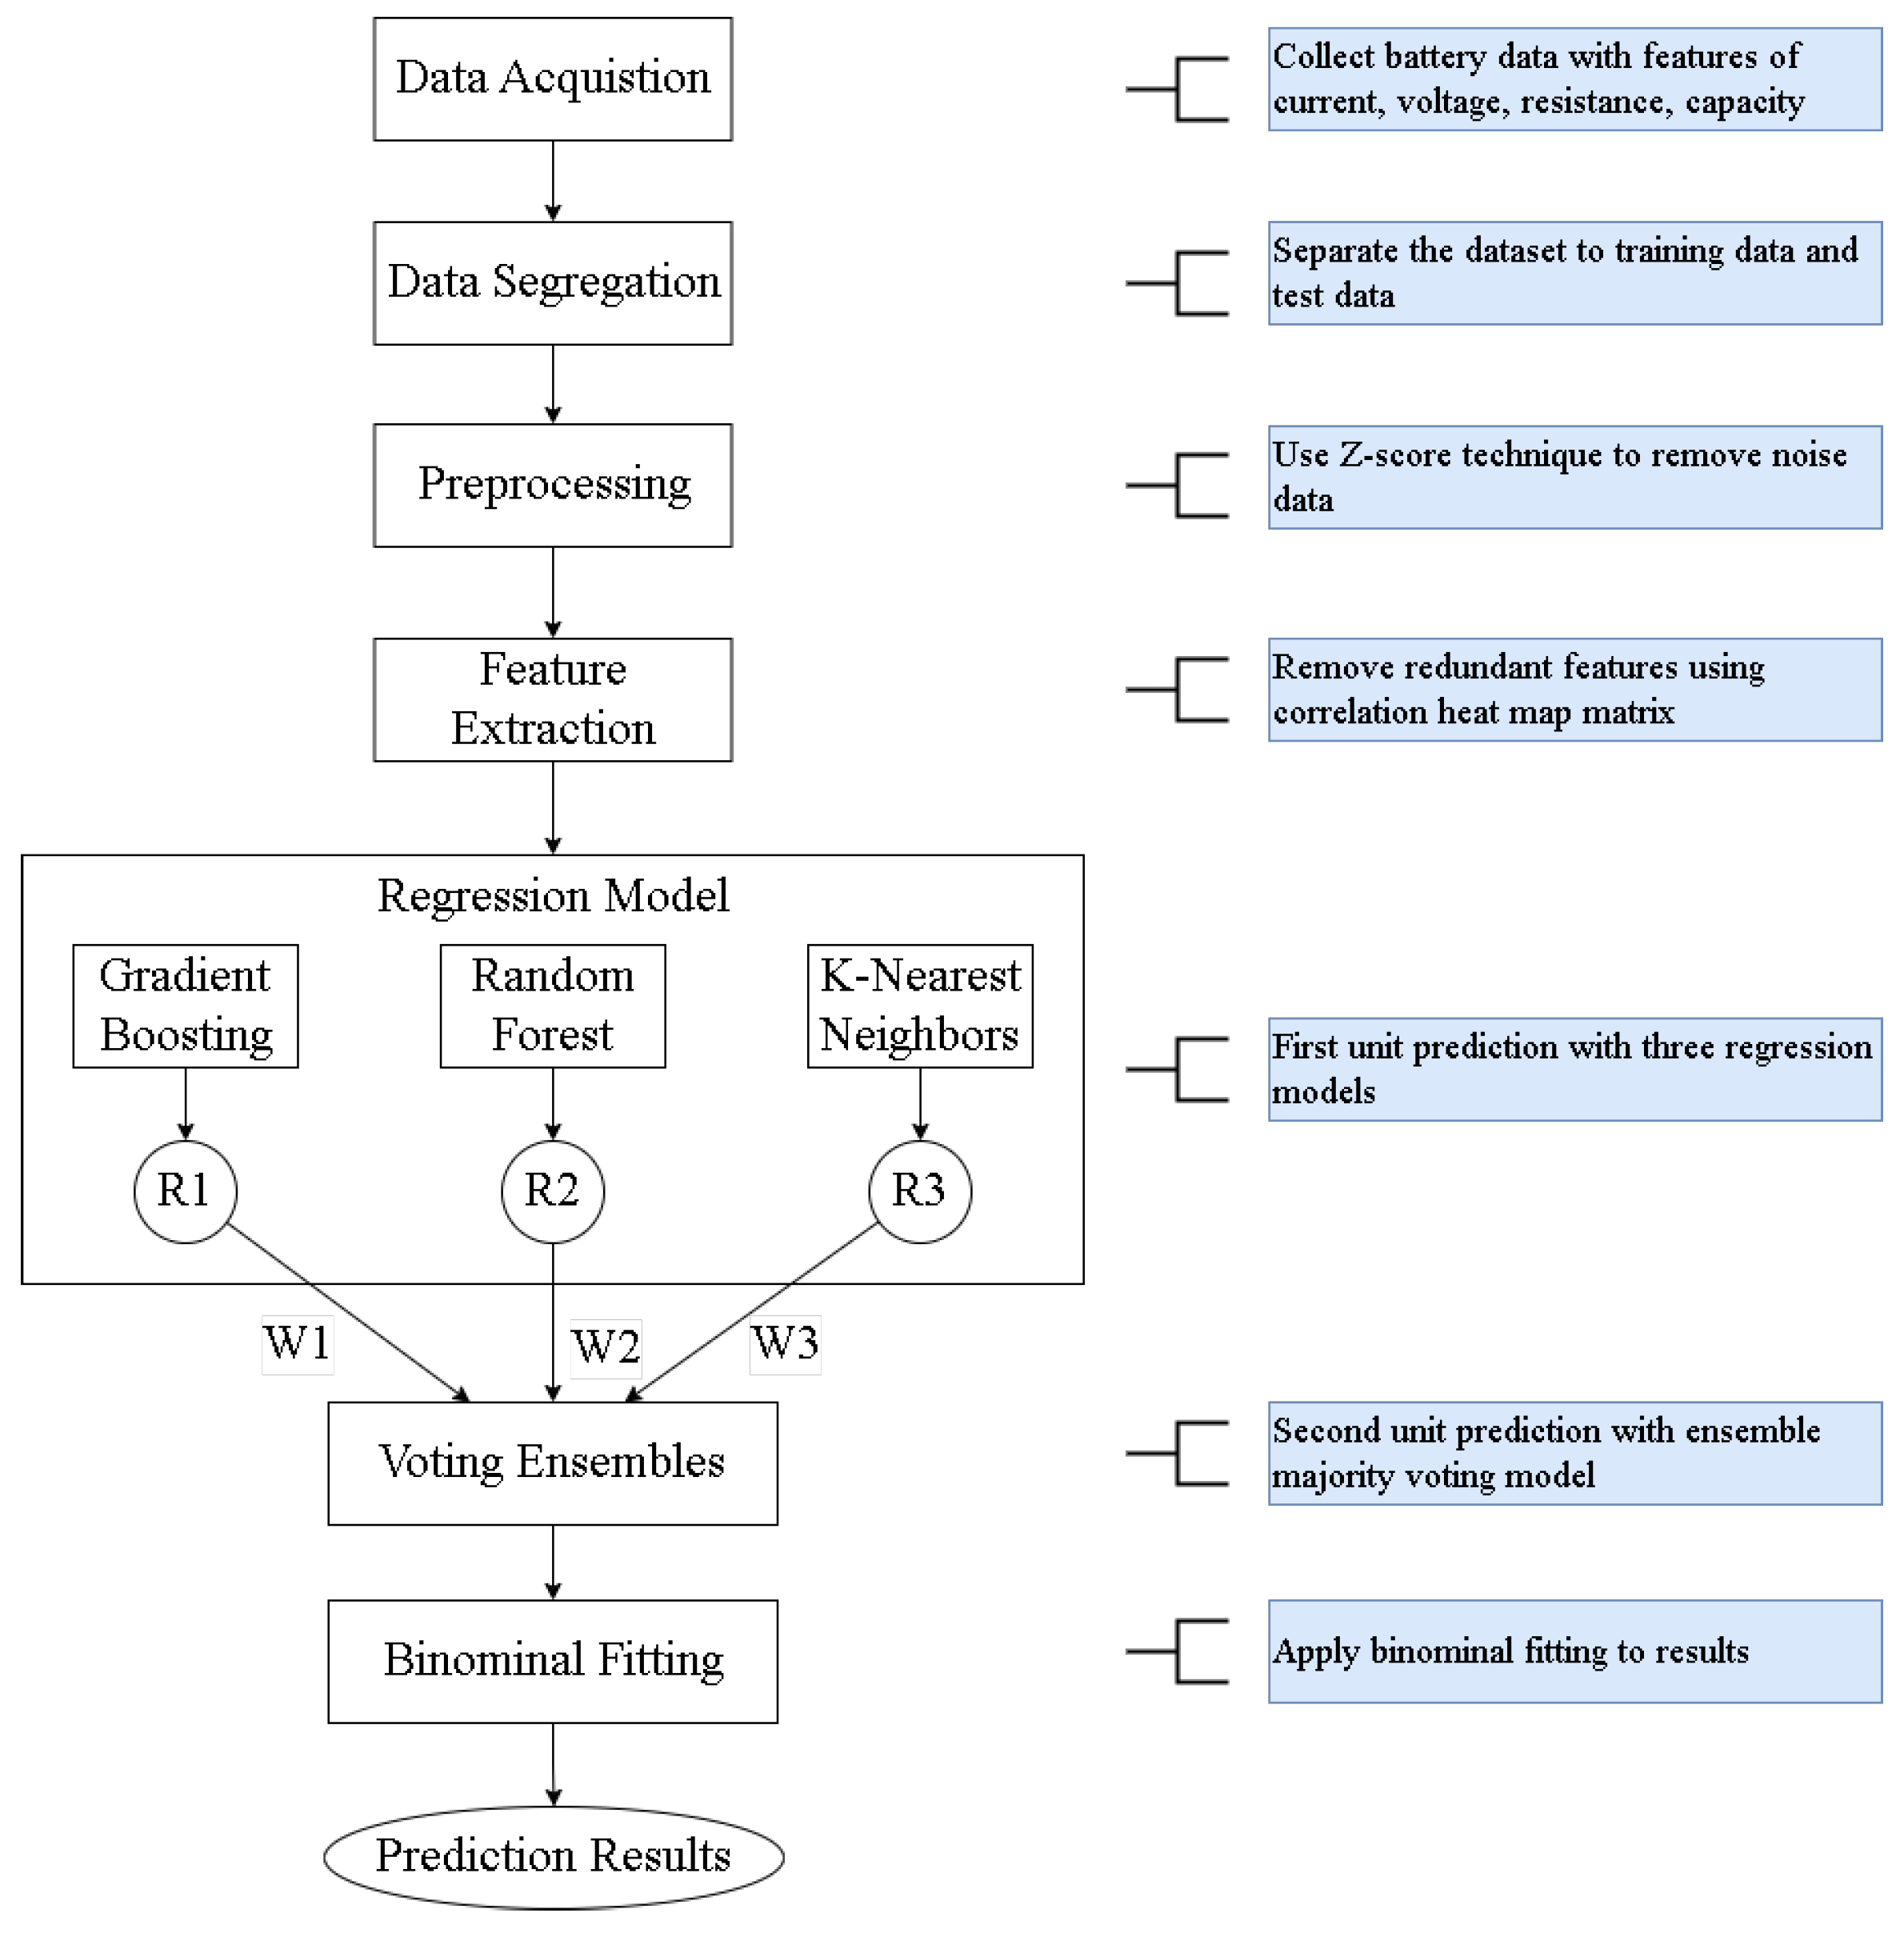
While reviewing these two indicators, there is a key point to be noticed that the factor of capacity plays the crucial role for the both calculations. Besides, the RUL is also considered as ended once the actual capacity drops to 80% or below of the initial capacity [37]. Overall, to simplify the estimation process, the battery ages and deteriorates, the battery capacity gradually decreases. When the capacity drops to 80%, the battery has deteriorated to the end of its lifespan. The overall workflow of the estimation process is shown in Figure 5. The ensemble model is integrating three different state-of-the-art machine learning regression models. Data of battery numbered CS2_35 are selected as training data, data of battery CS2_36, CS2_37 and CS2_38 are selected as test data. Both training data and test data are normalized, and the most relevant features are selected from the high dimensional. All three models are experienced first unit training with training data. All the three models are combined to develop the proposed voting ensembles model. The voting ensembles model is evaluated by calculating the performance measures. With the assistance of binomial fitting, the final results, including RUL, knee point, are computed.

3.4. Evaluation Metrics

For the purpose of examining and verifying the results of the improved method, there are four evaluation metrics to be employed, namely mean absolute error, root mean square error, relative error and coefficient of determination. Mean Absolute Error (MAE) is a widely used measure of evaluating the accuracy of a forecasting model. The best possible score is 0.0, smaller value is better. MAE is calculated as the average of the absolute differences between the predicted values and the actual values [38].
M A E y , y ^ = i = 0 N 1 y i y ^ i N
where y i denotes the observed value for the i t h observation, y ^ i denotes the predicted value for the i t h observation, and N denotes the total sample size.
Root Mean Square Error (RMSE) is widely used to evaluate the performance of forecasting models in various fields. The best possible score is 0.0, smaller value is better. A lower RMSE indicates better forecast accuracy. RMSE is calculated as the square root of the average of the squared differences between the predicted values and the actual values [39].
R M S E y , y ^ = 1 N i = 1 N ( y i y ^ i ) 2
Relative Error (RE) is used for the evaluation of regression model accuracy. The best possible score is 0.0, smaller value is better. RE is the ratio of the absolute error to the actual value.
R E y , y ^ = y i y ^ i y i
Coefficient of Determination ( R 2 ) is a measure of how well unseen samples are likely to be predicted by the model, through the proportion of explained variance. Best possible score is 1.0, bigger value is better. R 2 represents the proportion of variance that has been explained by the independent variables in the model [40].
R 2 y , y ^ = 1 i = 1 N ( y i y ^ i ) 2 i = 1 N ( y i y ¯ ) 2

4. Result and Discussion

4.1. Prediction for Battery with Short Voltage Decline Period

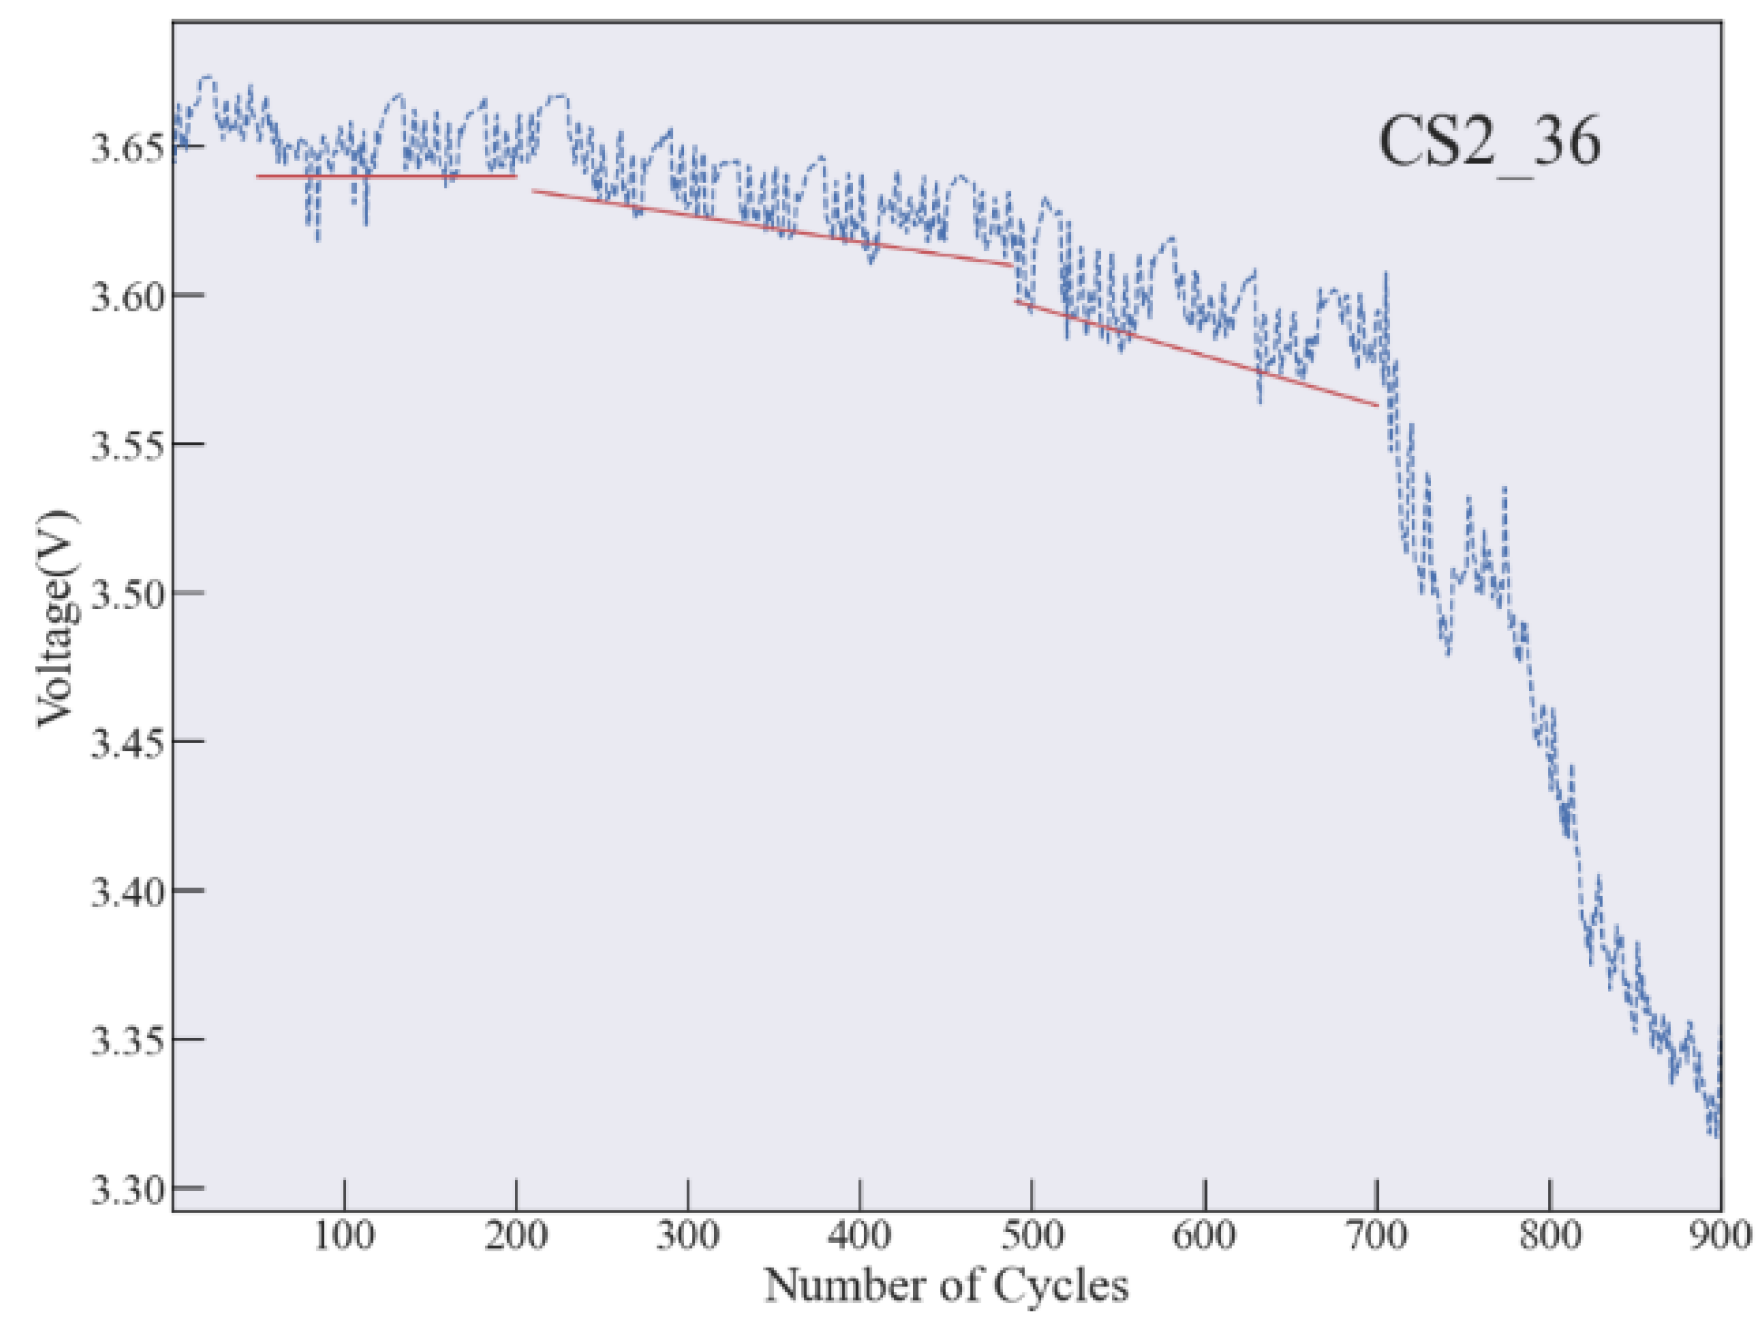
Figure 6 describes the voltage change trend for battery CS2_36. The voltage is stable at about 3.64 before the first 200 charge-discharge cycles. Although the voltage drops steadily during cycles between 200 and 420, there is a sudden drop after that. Subsequently, when the cycles go beyond 700, the voltage drops dramatically.
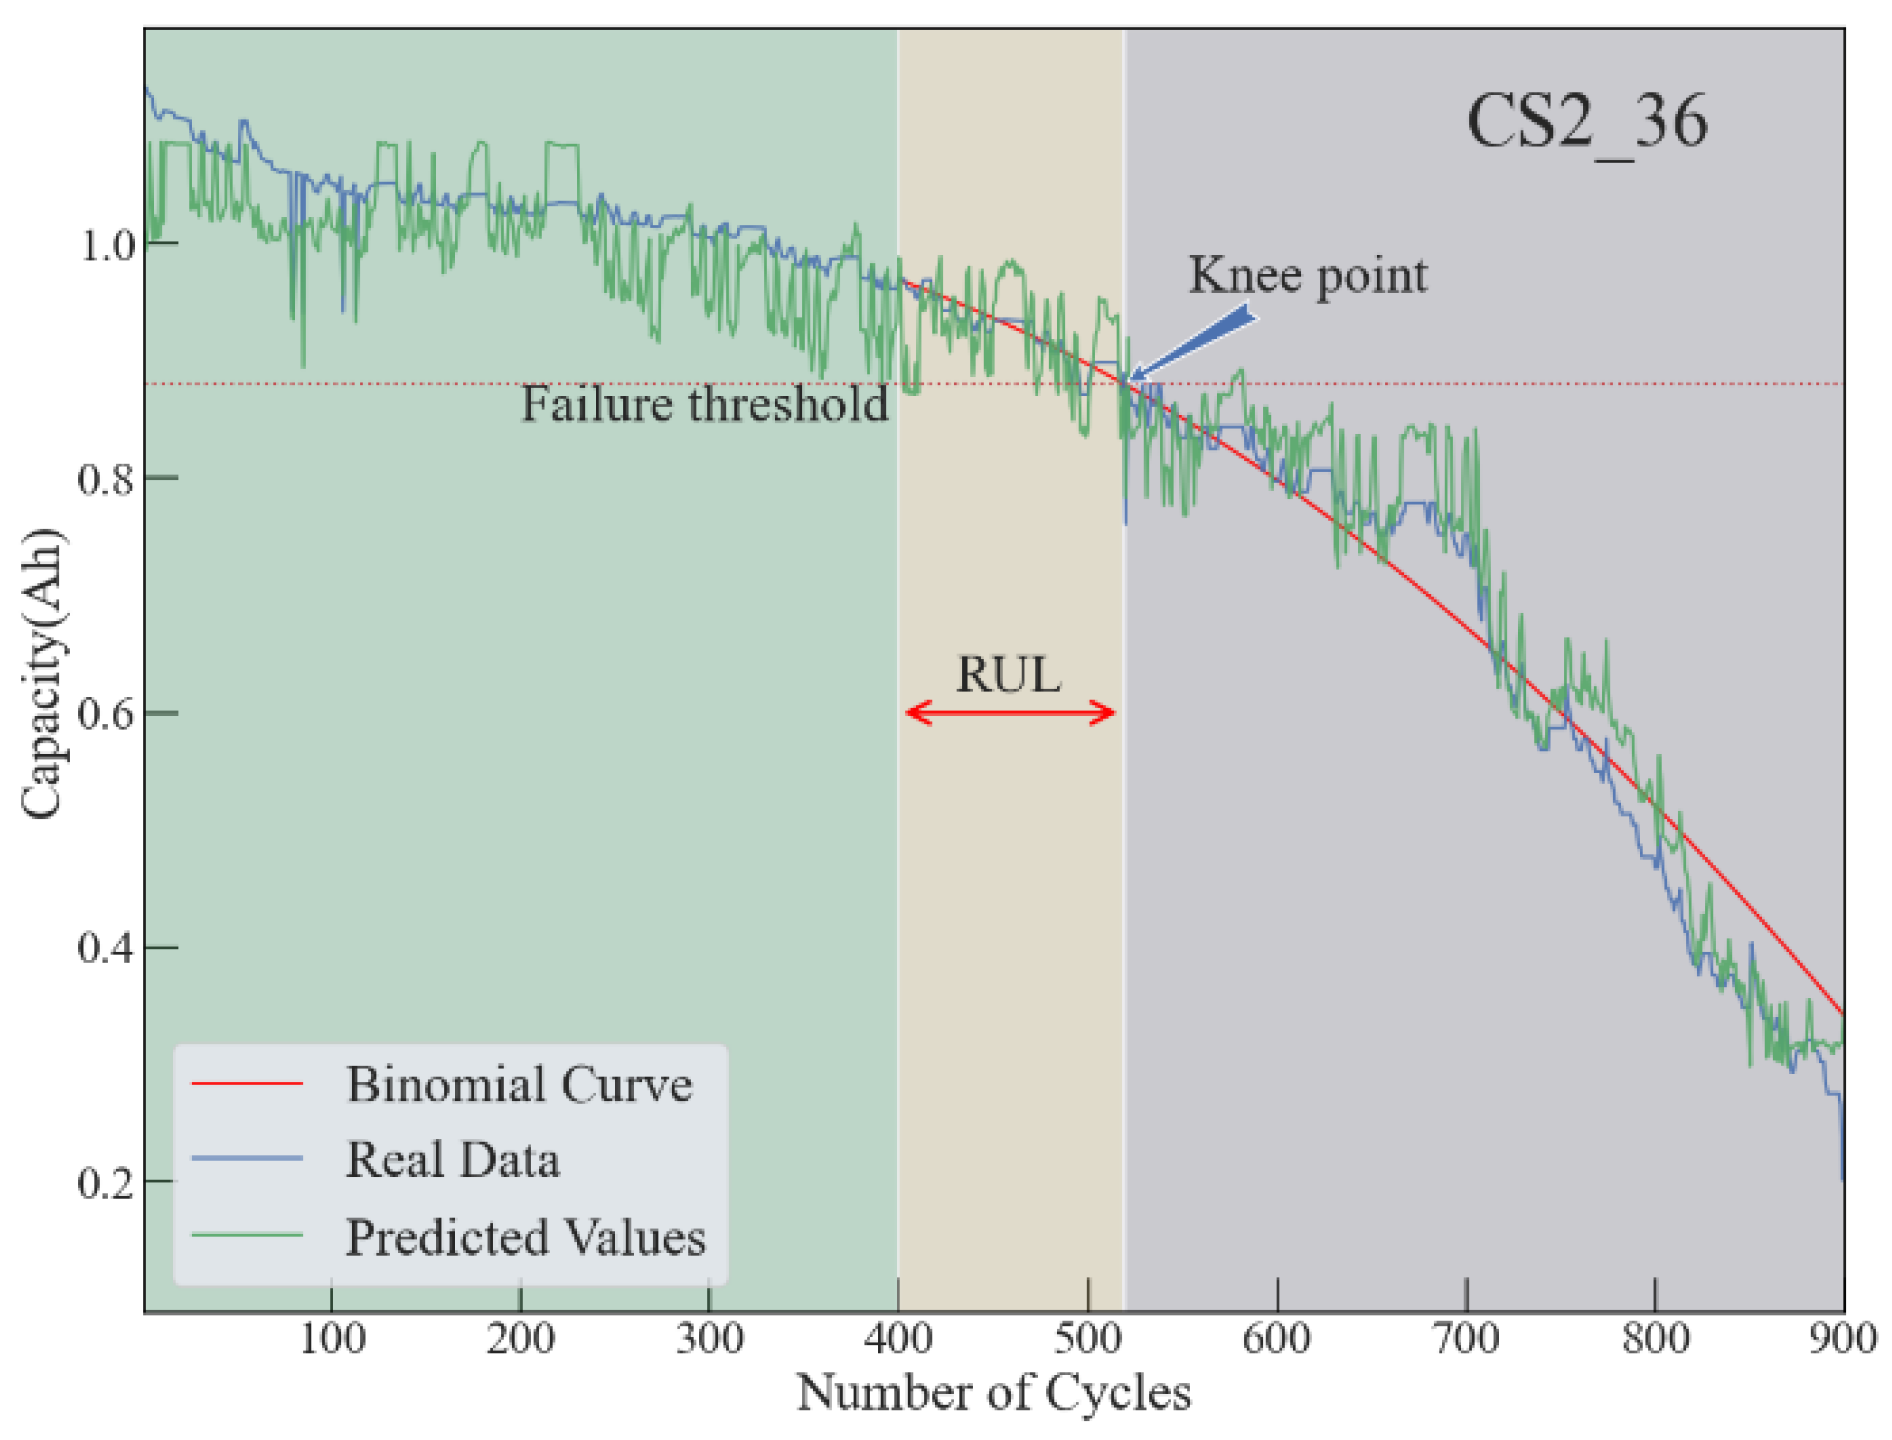
The final prediction result for battery CS2_36 is indicated in Figure 7. The period of RUL is defined as from cycles between 400 and number of capacities reaching 80% of initial capacity. Before RUL period, the prediction curve accompanies the real data curve by a steady decline. When it goes into the RUL period, the prediction curve become fluctuated, as it is affected by the sudden drop of the voltage. Since the actual capacity become steady after RUL and lasts for about 100 cycles, following by the abrupt decline, the prediction curve is affected and the prediction curve stands stably for certain period and drops dramatically after that. For battery CS2_36, the impact of sudden drop of voltage is obvious. As a result, the RUL period becomes short, and it is no more than 150 cycles. Applying the binomial fitting to the prediction curve, the binomial curve fits the real data curve. Particularly, all of those curves and the failure threshold line meets at the same point. That means the prediction results for RUL and knee point for battery CS2_36 is accurate.

4.2. Prediction for Battery with Stable Voltage Decline Period

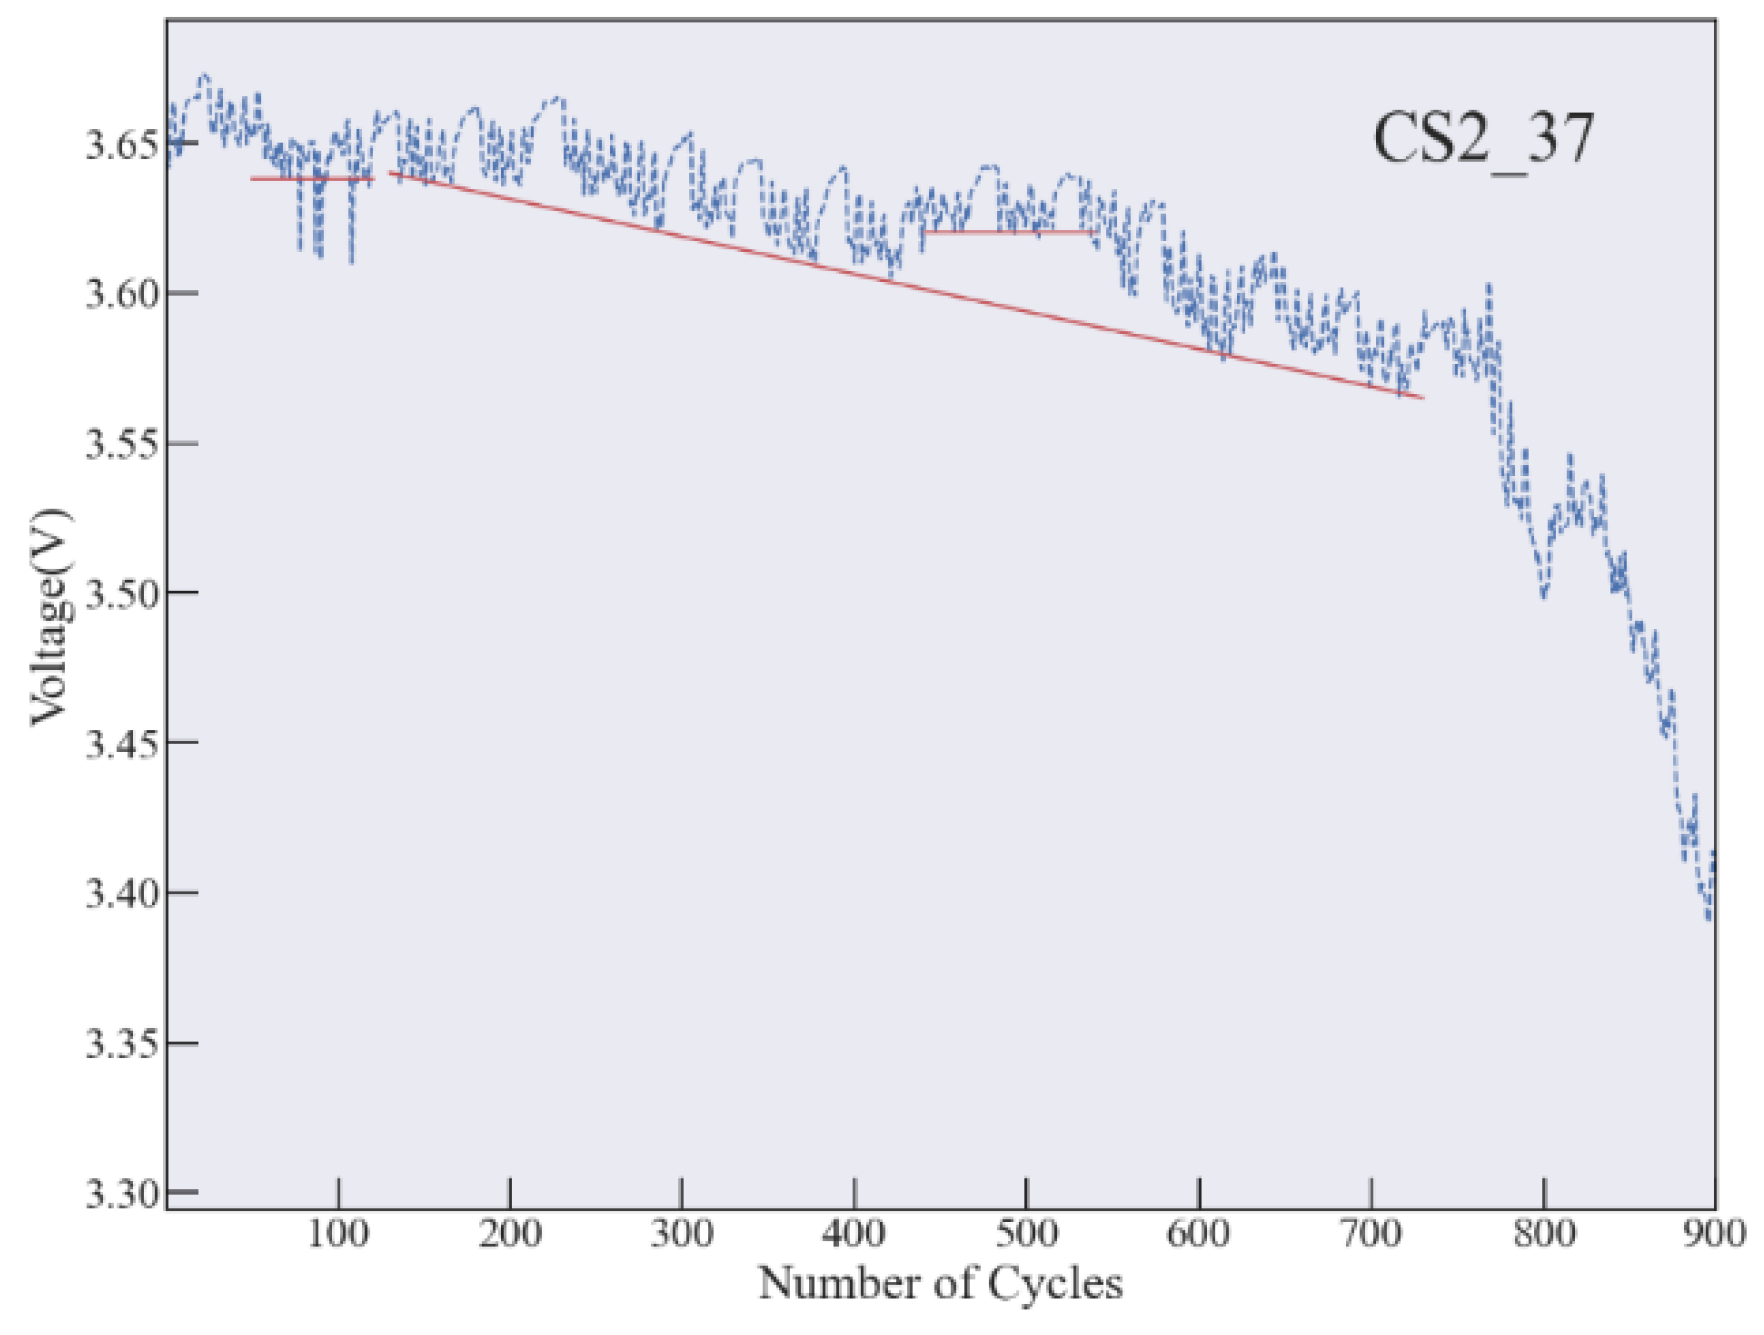
Figure 8 describes the voltage change trend for battery CS2_37. The voltage is stable at about 3.64 before the first 100 charge-discharge cycles. After that, the voltage drops steadily. By comparing the voltage decline period for battery CS2_37 and battery CS2_36, the voltage decline period for battery CS2_37 lasts longer. By contrary, there is a sudden jump for battery CS2_37 after cycle of 420, and continuing decrease after cycle of 500. After cycle of 700, the voltage drops steeply.
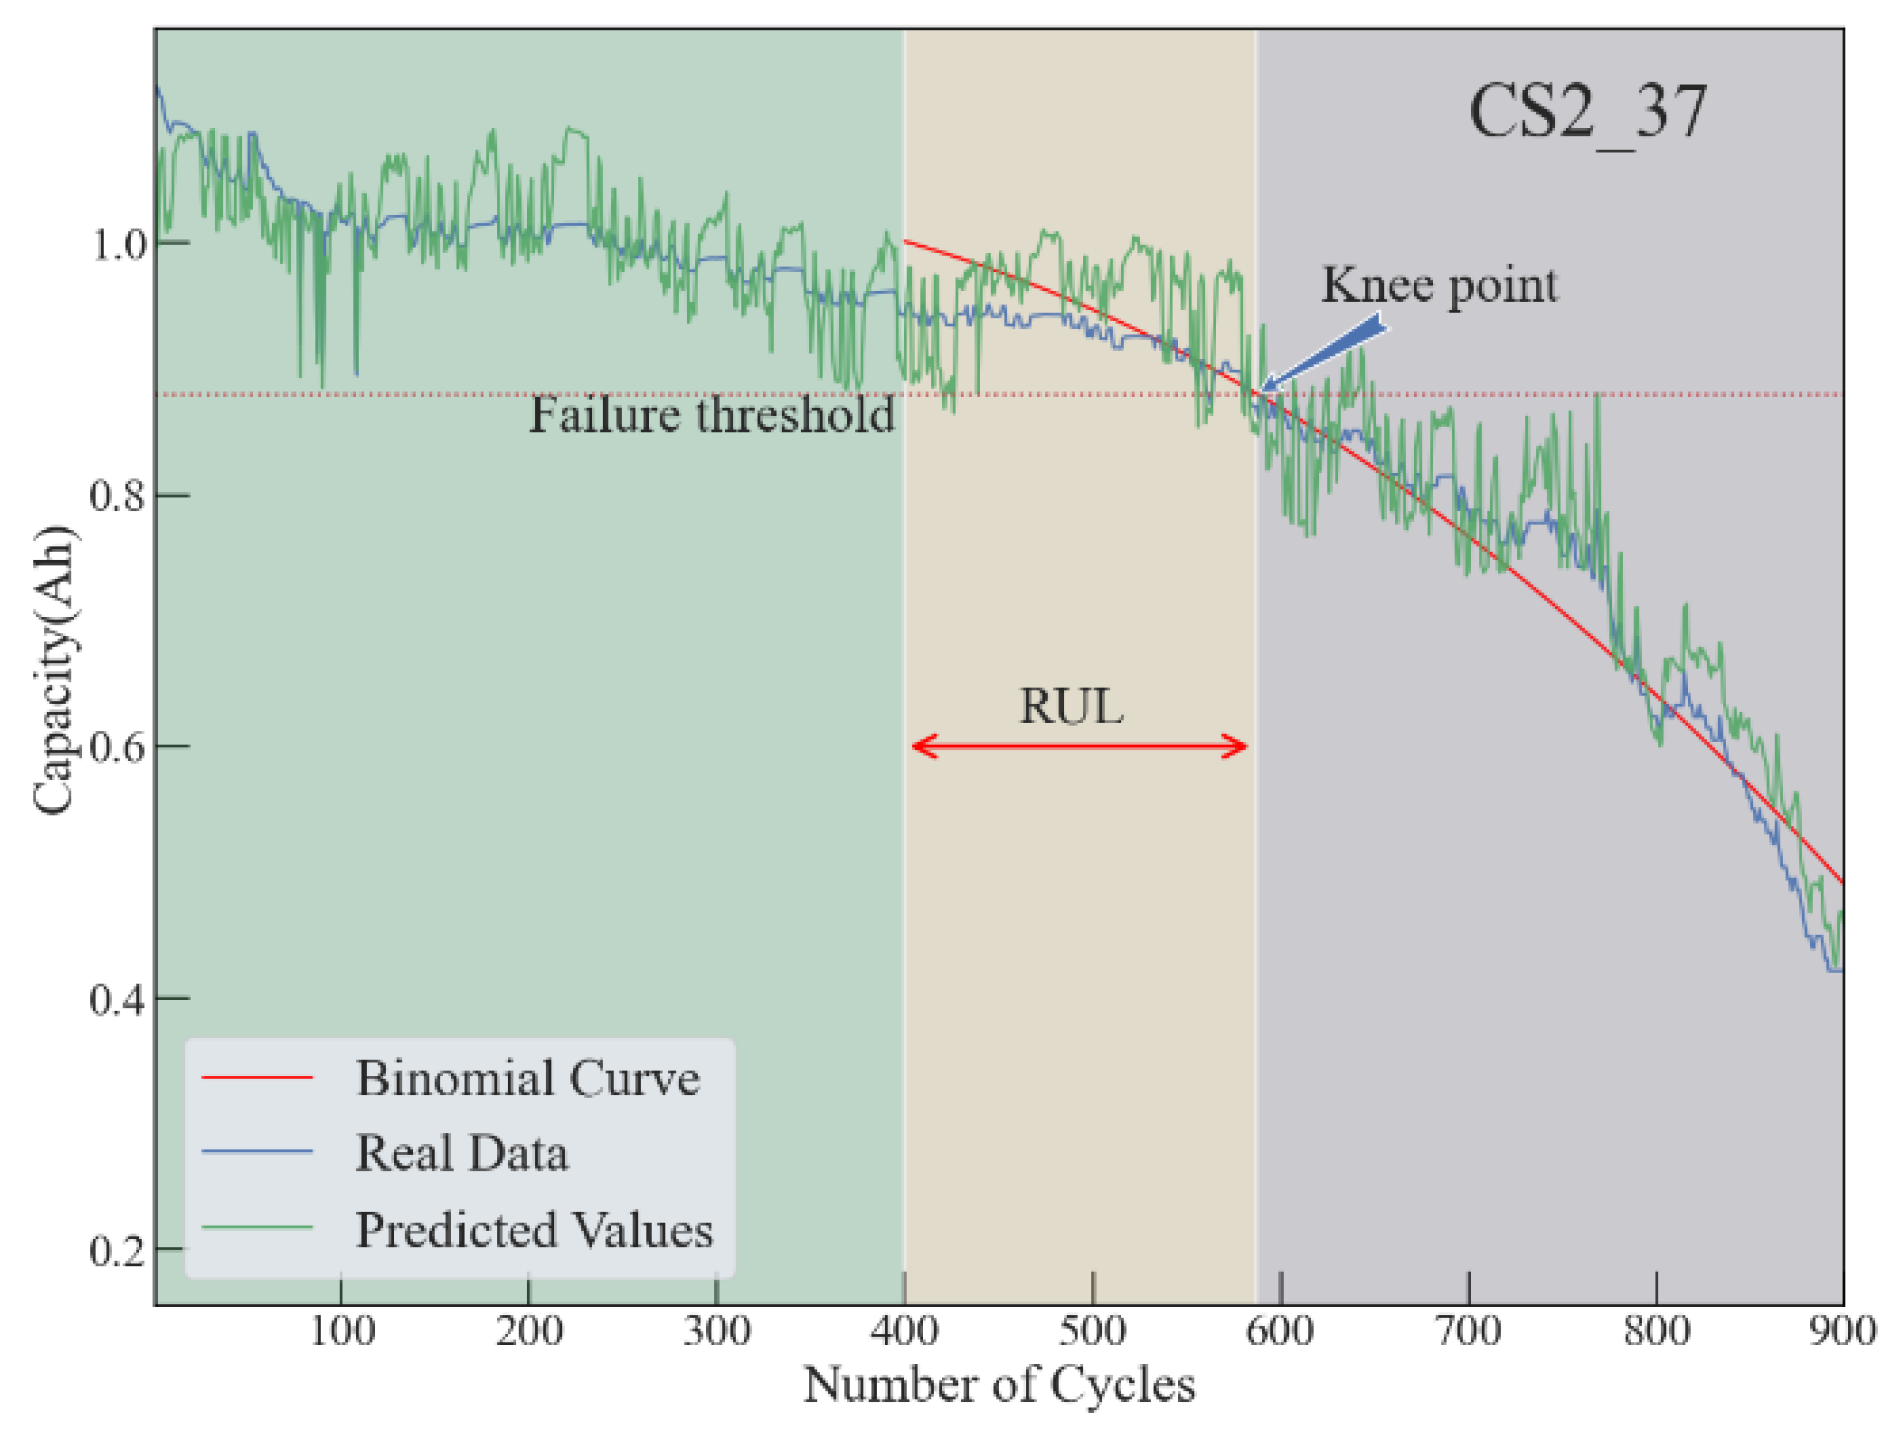
The final prediction result for battery CS2_37 is indicated in Figure 9. Before RUL period, both of the prediction curve and real data curve are stable with a steady decline, and the prediction curve goes ups and downs around the real data curve. When it goes into the RUL period, the prediction curve become fluctuated, as well as a rise up. This is because of the sudden jump of the voltage. After the RUL period, both of the prediction curve and real data curve become stable for about 100 cycles, following by the significant decline. Different from battery CS2_36, the RUL period for battery CS2_37 is longer and it lasts about 190 cycles. This is the result of the long decline cycles of voltage and the sudden jump of the voltage. Applying the binomial fitting to the prediction curve, the binomial curve for battery CS2_37 does not like that for battery CS2_36. This curve is over-fitted for the beginning of the RUL period. But as it goes to the middle of the RUL period, this curve become fitted to the real data curve. And same as the result for battery CS2_36, all of those curves and the failure threshold line meets at the same point.
By comparing the prediction results for battery CS2_37 and prediction result for battery CS2_36, it shows not only the prediction results are precise, but also indicates the performance and quality of the battery. In fact, the RUL period for battery CS2_37 lasts longer and the prediction curve looks steadier. As a result, the knee point for battery CS2_37 is greater, and this battery can be used for more charge-discharge cycles.

4.3. Prediction for Battery with Unstable Voltage Decline Period

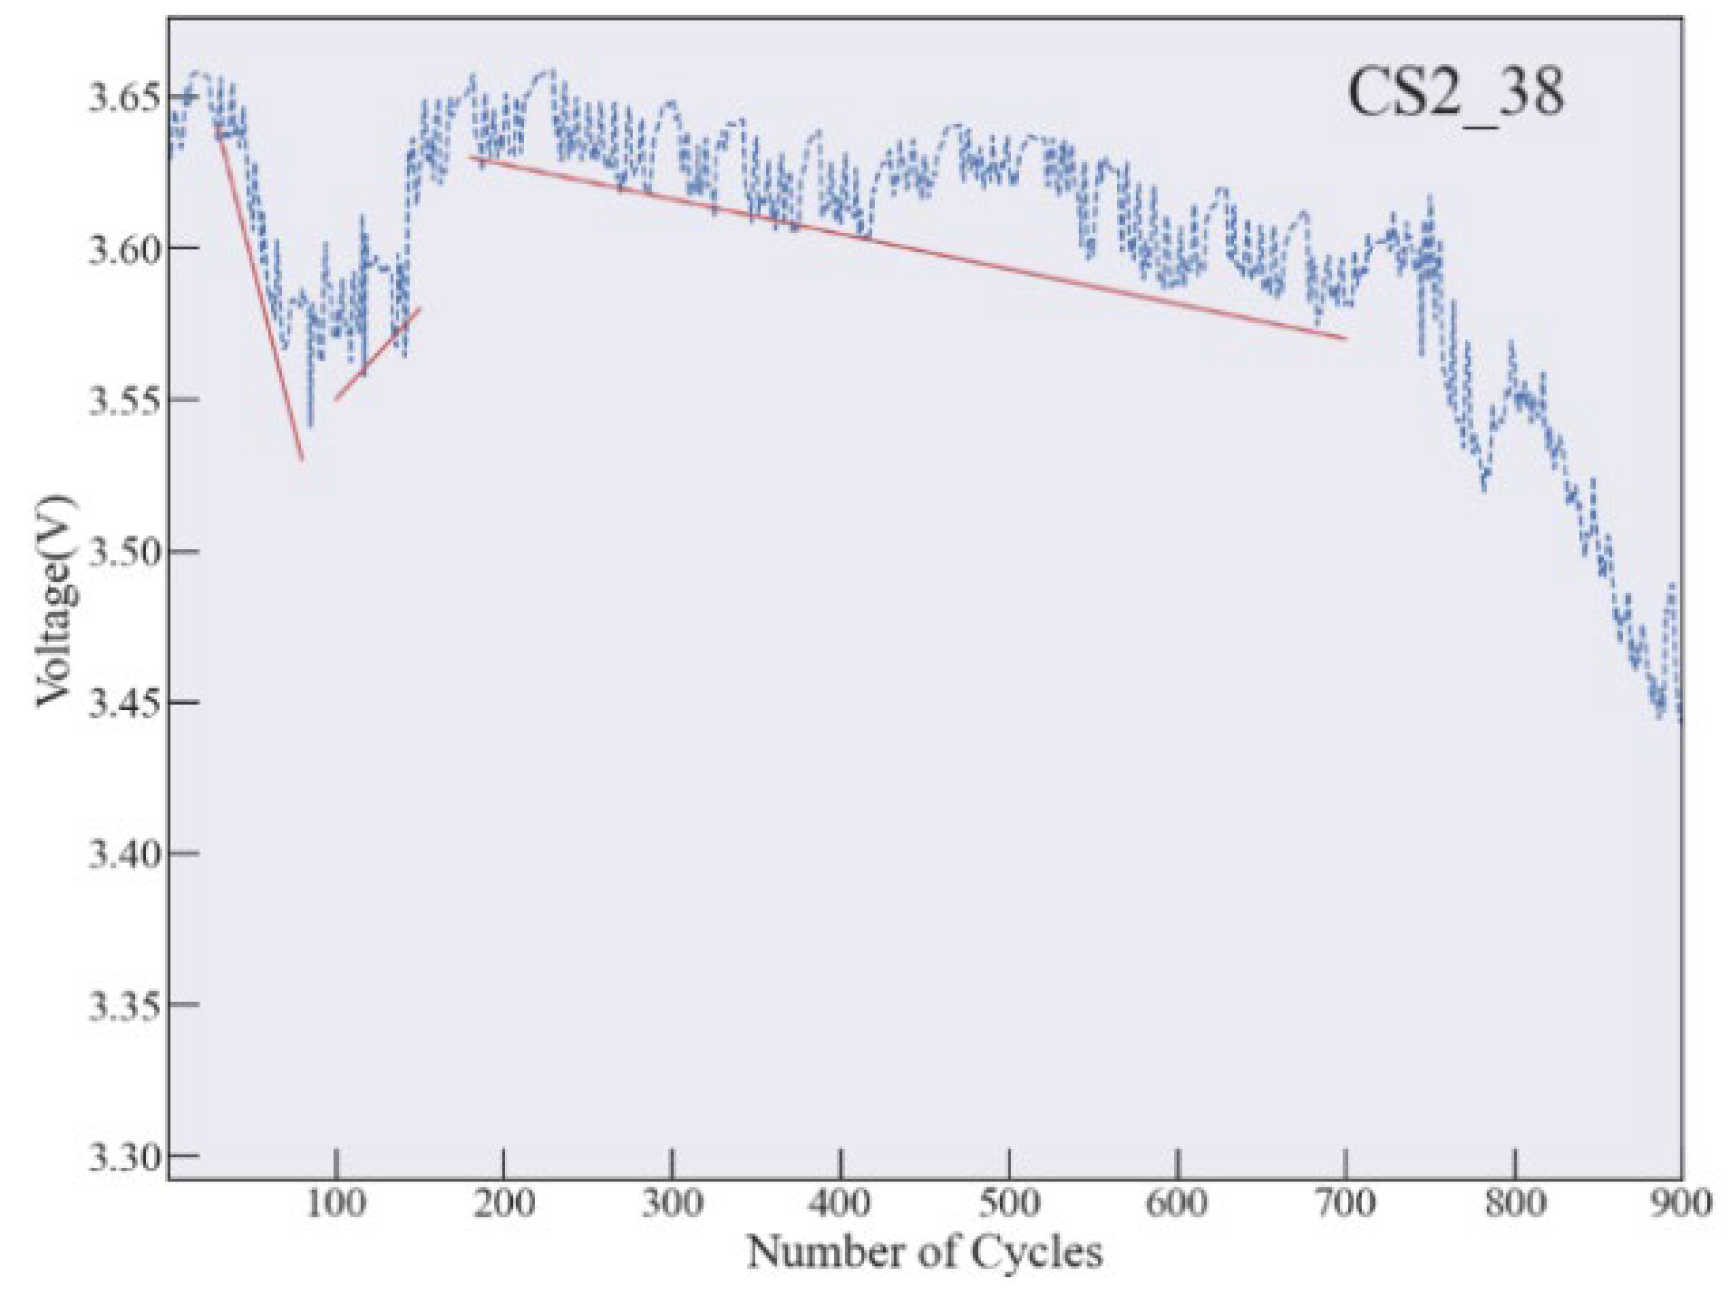
Figure 10 describes the voltage change trend for battery CS2_38. The voltage change trend is different. The voltage fluctuated during the first 200 cycles. There is an abrupt drop between cycle of 10 and cycle of 90, and it rises steadily for about 50 cycles and there is a sudden jump after that. After cycle of 200, the voltage becomes stable with a steady decline trend. Although there are some ups and downs during the decline cycles, the curve is smoother than that of for both battery CS2_36 and battery CS2_37. Obviously, after cycle of 700, there is a steep drop for voltage curve.
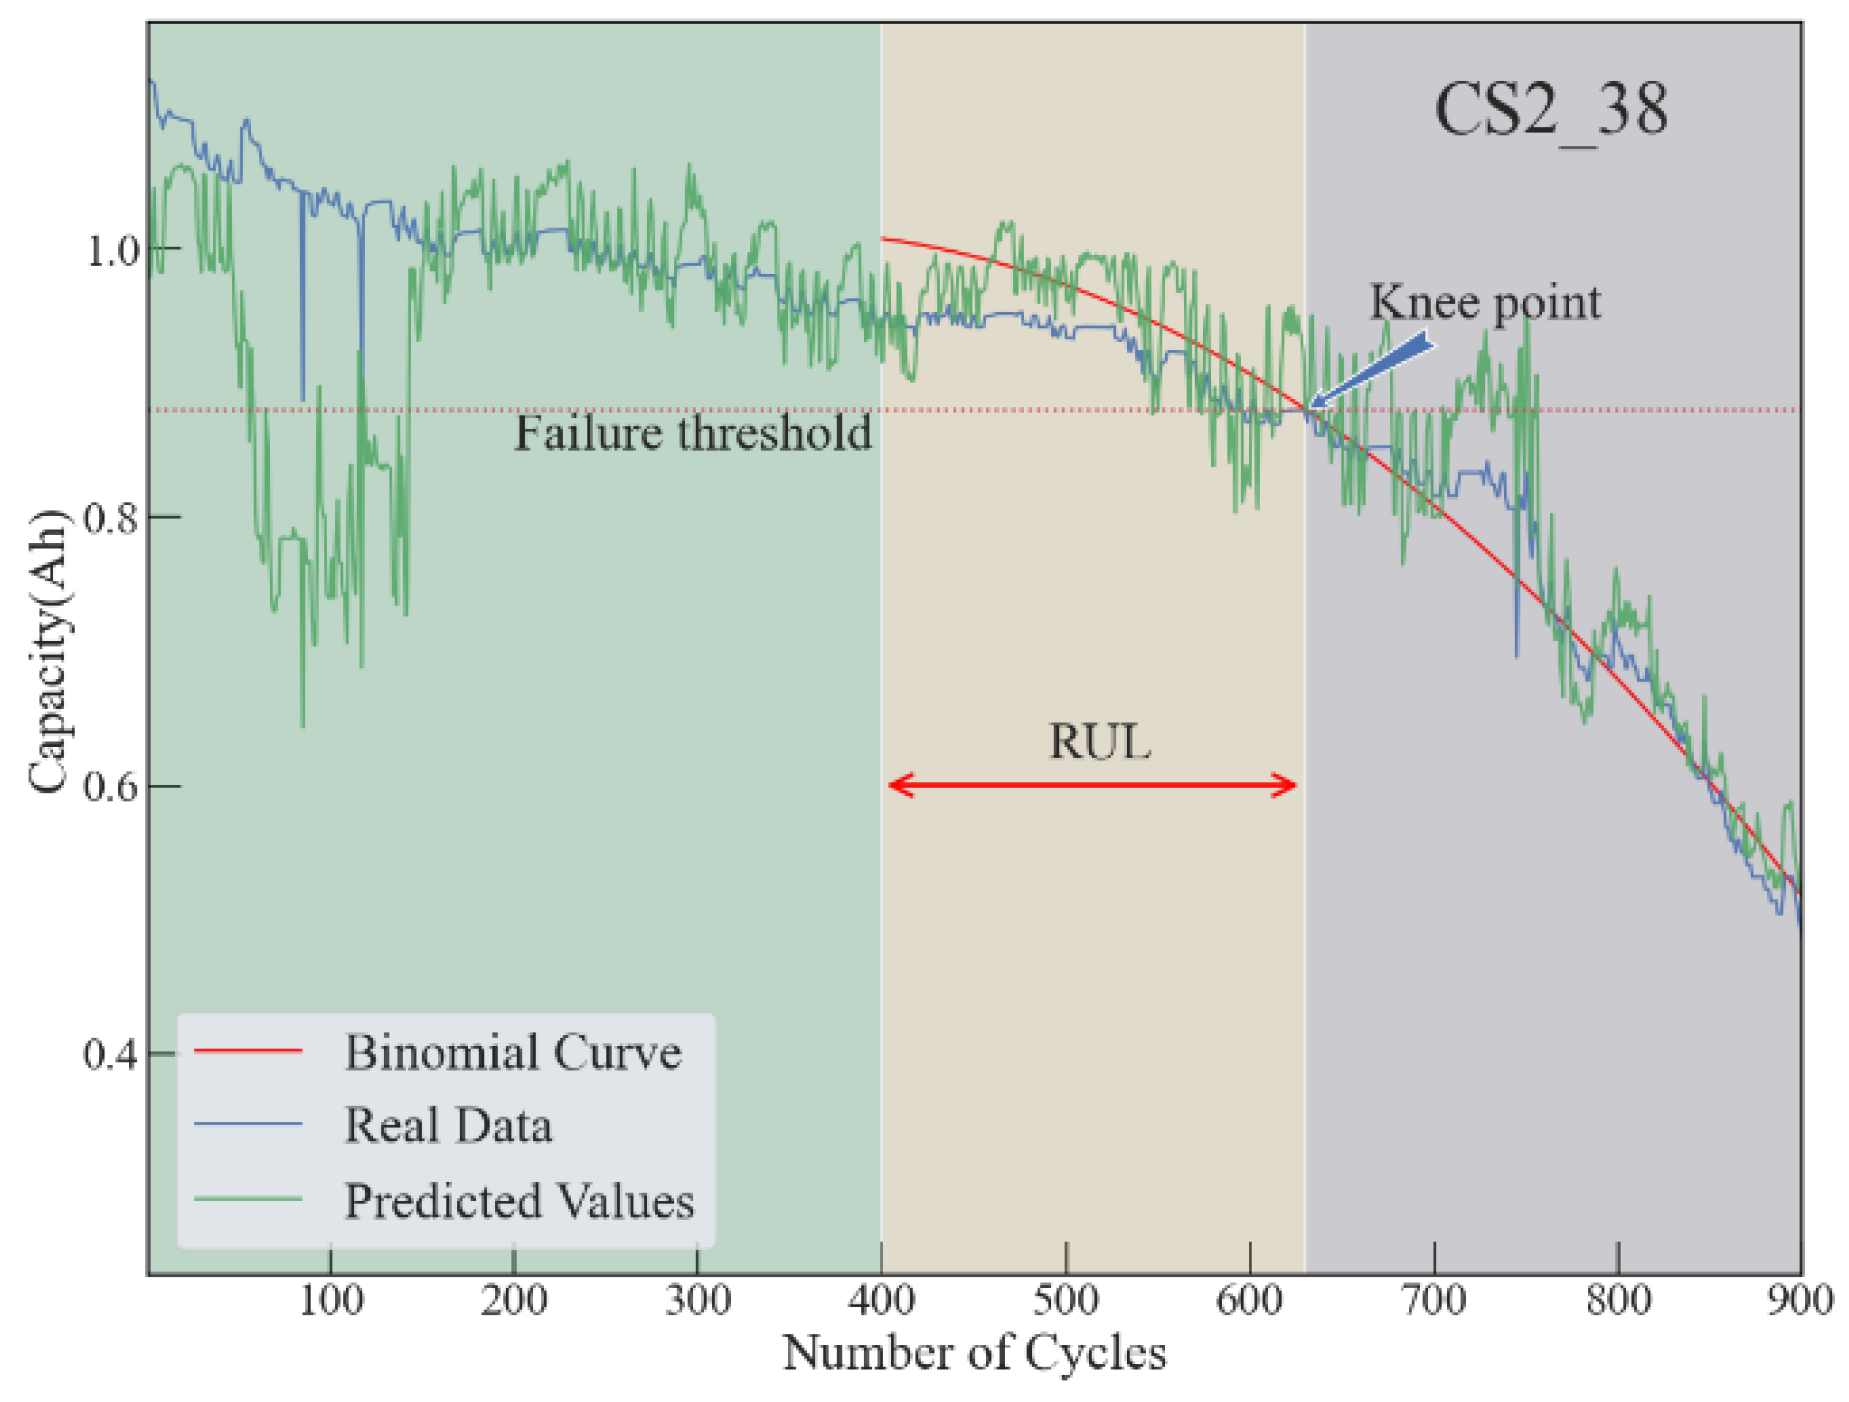
The final prediction result for battery CS2_38 is indicated in Figure 11. The impact of the fluctuation of the voltage curve at the beginning is significant. Before RUL period, the deflection from the prediction curve and real data curve is large. At the beginning, the prediction curve drops dramatically and rises abruptly after cycle of 150. At about cycle of 200, the prediction curve returns to normal and become stable. This curve accompanies the real data curve with a steady decline. Although both curves decline significantly after the RUL period, they are not as steep as those for battery CS2_36 and battery CS2_37. This result is significant, as the decline period for battery CS2_38 is the longest and more stable if not taking the first 150 cycles into account. Applying the binomial fitting to the prediction curve, the binomial curve for battery CS2_38 is over-fitted nearly during the whole RUL period. But in the end of the RUL period, all of those curves and the failure threshold line still meets at the same point as well.
By comparing the prediction results for all three batteries, it shows at least the performance for battery CS2_38 is the best among all the three batteries. The knee point for battery CS2_38 is the greatest as well, and it is about 630 cycles. This battery can be used for more charge-discharge cycles than those two. On the other hand, the manufacturing quality for battery CS2_38 is not as good as battery CS2_37, due to the fluctuation of the prediction curve during the first 200 cycles. In reality, this unstable voltage affects device performance. Especially, the device using this kind of batteries may not be able to work properly due to low voltage.

4.4. Overall Performance

As shown in Table 1, due to the sudden drop of the voltage, the data fluctuates for a certain period of time, and affects the prediction results. The MAE, RMSE and RE of CS2_36 are lower than the benchmarks, and R 2 is higher than benchmark. Although there is a sudden jump for this dataset, it is slight jump and the decline period is long and steady. That means the noise data for this dataset is less. So the performance of CS2_37 is relative good. For battery CS2_38, although the variance from prediction and real data is big, it becomes narrow slowly while cycles increase. On machine learning’s perspective, when the testing data keep increasing and model experiences more prediction cycles, the approach has the capacity for result rectification.
The prediction of the knee point is precise for those three scenarios, and those prediction curve, real data curve and binomial curve cross at the same point, where it is the knee point for the battery. That means this approach is applicable for predicting the RUL and knee point for battery and can be used for more scenario or even in the real-world application. Therefore, this proposed approach is able to predict the RUL of a battery accurately and effectively based on small size of sampling data.

5. Conclusion

In this paper, a methodology for predicting the battery RUL based on a hybrid ensembles approach integrated with Gradient Boosting, Random Forest and K-Nearest Neighbor is presented. The battery features of voltage, current, internal resistance are extracted from dataset of CALCE are applied to this proposed approach for training and prediction. With small size of training and testing data, this approach also performs satisfactory in terms of accuracy, robustness, and adaptability. Particularly, this approach utilizes the binomial fitting for capacity faded trend prediction. The predicted RUL and knee point for batteries are precise and fits the real data very well. Compared with existing RUL methods, this proposed approach achieves better performance as indicated by lower RE, MAE, and RMSE scores and higher R 2 scores. This approach can also be promoted to wider usage for other real world application scenario.

Acknowledgments

In the course of this experiment, it was supported by “The Natural Science Foundation of Jiangsu Province, grant number BK20221133”, “China Postdoctoral Science Foundation, grant number 2021M693421”, “The 2021 Jiangsu Shuangchuang (Mass Innovation and Entrepreneurship) Talent Program, grant number JSSCBS20211238”. The authors also express their appreciation to technical reviewers for their constructive comments.

References

  1. Perera F. Pollution from Fossil-Fuel Combustion is the Leading Environmental Threat to Global Pediatric Health and Equity: Solutions Exist. International Journal of Environmental Research and Public Health, 2018. [CrossRef]
  2. Xuebing Han, Languang Lu, Yuejiu Zheng, Xuning Feng, Zhe Li, Jianqiu Li, Minggao Ouyang. A review on the key issues of the lithium ion battery degradation among the whole life cycle, eTransportation, 2019, 1: 100005. [CrossRef]
  3. Liang Ma, Jinp eng Tian, Tieling Zhang, Qinghua Guo, Chunsheng Hu. Accurate and efficient remaining useful life prediction of batteries enabled by physics-informed machine learning, Journal of Energy Chemistry, 2024, 91: 512-521. [CrossRef]
  4. Xiao-Sheng Si, Wenbin Wang, Chang-Hua Hu, Dong-Hua Zhou. Remaining useful life estimation – A review on the statistical data driven approaches. European Journal of Operational Research, 2011, 213: 1-14. [CrossRef]
  5. M.S. Reza, M. Mannan, M. Mansor, Pin Jern Ker, T. M. Indra Mahlia, M.A. Hannan. Recent advancement of remaining useful life prediction of lithium-ion battery in electric vehicle applications: A review of modelling mechanisms, network configurations, factors, and outstanding issues. Energy Reports, 2024, 11: 4824-4848. [CrossRef]
  6. Lin Chen, Jingjing An, Huimin Wang, Mo Zhang, Haihong Pan. Remaining useful life prediction for lithium-ion battery by combining an improved particle filter with sliding-window gray model. Energy Reports, 2020, 6: 2086-2093. [CrossRef]
  7. K. Liu, Y. Shang, Q. Ouyang and W. D. Widanage. A Data-Driven Approach With Uncertainty Quantification for Predicting Future Capacities and Remaining Useful Life of Lithium-ion Battery. IEEE Transactions on Industrial Electronics, 2021, 68: 3170-3180. [CrossRef]
  8. Azevedo, B.F., Rocha, A.M.A.C., Pereira, A.I. Hybrid approaches to optimization and machine learning methods: a systematic literature review. Mach Learn, 2024, 113: 4055–4097. [CrossRef]
  9. Jun Yuan, Zhili Qin, Haikun Huang, Xingdong Gan, Ziwei Wang, Yichen Yang, Shujiang Liu, An Wen, Chuang Bi, Baihai Li, Chenghua Sun. Progress in the prognosis of battery degradation and estimation of battery states. Sci. China Mater, 2024, 67: 1014–1041. [CrossRef]
  10. Yapeng Zhou, Miaohua Huang, Michael Pecht. Remaining useful life estimation of lithium-ion cells based on k-nearest neighbor regression with differential evolution optimization. Journal of Cleaner Production, 2020, 249: 119409. [CrossRef]
  11. Jafari S, Shahbazi Z, Byun Y-C, Lee S-J. Lithium-Ion Battery Estimation in Online Framework Using Extreme Gradient Boosting Machine Learning Approach. Mathematics, 2022, 10(6): 888. [CrossRef]
  12. Jafari, S., Byun, YC. Enhancing Predictive Battery Maintenance Through the Use of Explainable Boosting Machine. Kabassi, K., Mylonas, P., Caro, J. (eds) Novel & Intelligent Digital Systems: Proceedings of the 3rd International Conference (NiDS 2023). Lecture Notes in Networks and Systems, 2023, 784.
  13. Wang G, Lyu Z, Li X. An Optimized Random Forest Regression Model for Li-Ion Battery Prognostics and Health Management. Batteries, 2023, 9(6), 332. [CrossRef]
  14. Jiaju Wu, Linggang Kong, Zheng Cheng, Yonghui Yang, Hongfu Zuo. RUL Prediction for Lithium Batteries Using a Novel Ensemble Learning Method. Energy Reports, 2022, 8(12): 313-326. [CrossRef]
  15. Lv K, Ma Z, Bao C, Liu G. Indirect Prediction of Lithium-Ion Battery RUL Based on CEEMDAN and CNN-BiGRU. Energies, 2024, 17(7): 1704. [CrossRef]
  16. Xu, Qing & Wu, Min & Khoo, Edwin & Chen, Zhenghua & Li, Xiaoli. A Hybrid Ensemble Deep Learning Approach for Early Prediction of Battery Remaining Useful Life. IEEE/CAA Journal of Automatica Sinica, 2023, 10: 177-187. [CrossRef]
  17. Paula Fermín-Cueto, Euan McTurk, Michael Allerhand, Encarni Medina-Lopez, Miguel F. Anjos, Joel Sylvester, Gonçalo dos Reis. Identification and machine learning prediction of knee-point and knee-onset in capacity degradation curves of lithium-ion cells. Energy and AI, 2020, 1: 100006. [CrossRef]
  18. Jerome H. Friedman. Greedy function approximation: A gradient boosting machine. Annals of Statistics, 2001, 29. [CrossRef]
  19. Leo Breiman. Random Forests. Machine Learning, 2001, 45.
  20. Adele Cutler, David Cutler, and John Stevens. Random Forests. Machine Learning – ML. 2011, 45.
  21. Syriopoulos, P.K., Kalampalikis, N.G., Kotsiantis, S.B. et al. kNN Classification: a review. Ann Math Artif Intell , 2023. [CrossRef]
  22. Ammar Mohammed, Rania Kora. A comprehensive review on ensemble deep learning: Opportunities and challenges. Journal of King Saud University - Computer and Information Sciences, 2023, 35(2): 757-774. [CrossRef]
  23. Eric Bax. Selecting a number of voters for a voting ensemble. CoRR abs/2104.11833, 2021.
  24. Gonçalo dos Reis, Calum Strange, Mohit Yadav, Shawn Li. Lithium-ion battery data and where to find it. Energy and AI, 2021, 5(100081). [CrossRef]
  25. Wei He, Nicholas Williard, Michael Osterman, Michael Pecht. Prognostics of lithium-ion batteries based on Dempster–Shafer theory and the Bayesian Monte Carlo method. Journal of Power Sources, 2011, 196(23): 10314-10321. [CrossRef]
  26. Yinjiao Xing, Eden W.M. Ma, Kwok-Leung Tsui, Michael Pecht. An ensemble model for predicting the remaining useful performance of lithium-ion batteries. Microelectronics Reliability, 2013, 53(6): 811-820. [CrossRef]
  27. Williard, Nick & He, Wei & Osterman, Michael & Pecht, Michael. Comparative Analysis of Features for Determining State of Health in Lithium-Ion Batteries. International Journal of Prognostics and Health Management, 2013, 4. [CrossRef]
  28. Omenya Fredrick, Paiss Matthew, Li Xiaolin, Reed David. Energy and Power Evolution Over the Lifetime of a Battery. ACS Energy Letters, 2023, 8(6). [CrossRef]
  29. Edge Jacqueline S, O’Kane Simon, Prosser Ryan, et al. Lithium-ion battery degradation: what you need to know. Phys. Chem. Chem. Phys, 2021, 23. [CrossRef]
  30. Cheng Lin, Aihua Tang, Hao Mu, Wenwei Wang, Chun Wang. Aging Mechanisms of Electrode Materials in Lithium-Ion Batteries for Electric Vehicles. Journal of Chemistry 2015, 2015, 1. [CrossRef]
  31. Jorn M. Reniers, Grietus Mulder, David A. Howey. Review and Performance Comparison of Mechanical-Chemical Degradation Models for Lithium-Ion Batteries. Journal of The Electrochemical Society, 2019, 166(14). [CrossRef]
  32. Tang X, Wan H, Wang W, Gu M, Wang L, Gan L. Lithium-Ion Battery Remaining Useful Life Prediction Based on Hybrid Model. Sustainability, 2023, 15(7): 6261. [CrossRef]
  33. Zuxin Li, Shengyu Shen, Yifu Ye, Zhiduan Cai, Aigang Zhen. An interpretable online prediction method for remaining useful life of lithium-ion batteries. Sci Rep 14, 2024, 12541. [CrossRef]
  34. Xing Shu, Shiquan Shen, Jiangwei Shen, Yuanjian Zhang, Guang Li, Zheng Chen, Yonggang Liu. State of health prediction of lithium-ion batteries based on machine learning: Advances and perspectives, iScience. 24, 2021, 11: 103265. [CrossRef]
  35. Daoquan Chen, Weicong Hong, Xiuze Zhou. Transformer Network for Remaining Useful Life Prediction of Lithium-Ion Batteries. IEEE Access, 2022, 10: 19621-19628. [CrossRef]
  36. Wei Liu , Yan Xu. Data-Driven Online Health Estimation of Li-Ion Batteries Using A Novel Energy-Based Health Indicator. IEEE Transactions on Energy Conversion, 2020, 35(3). [CrossRef]
  37. Yi Li, Kailong Liu, Aoife M. Foley, Alana Zülke, Maitane Berecibar, Elise Nanini-Maury, Joeri Van Mierlo, Harry E. Hoster. Data-driven health estimation and lifetime prediction of lithium-ion batteries: A review. Renewable and Sustainable Energy Reviews, 2019, 113: 109254. [CrossRef]
  38. Thieu Nguyen, Nhuan Tran, Binh Minh Nguyen, Giang Nguyen. A Resource Usage Prediction System Using Functional-Link and Genetic Algorithm Neural Network for Multivariate Cloud Metrics. 2018 IEEE 11th Conference on Service-Oriented Computing and Applications (SOCA), 2018.
  39. Thieu Nguyen, Binh Minh Nguyen, and Giang Nguyen. Building Resource Autoscaler with Functional-Link Neural Network and Adaptive Bacterial Foraging Optimization. Theory and Applications of Models of Computation, 2019. [CrossRef]
  40. Binh Minh Nguyen, Bao Hoang, Thieu Nguyen, Giang Nguyen. Nqsv-net: a novel queuing search variant for global space search and workload modeling. Journal of Ambient Intelligence and Humanized Computing, 2021. [CrossRef]
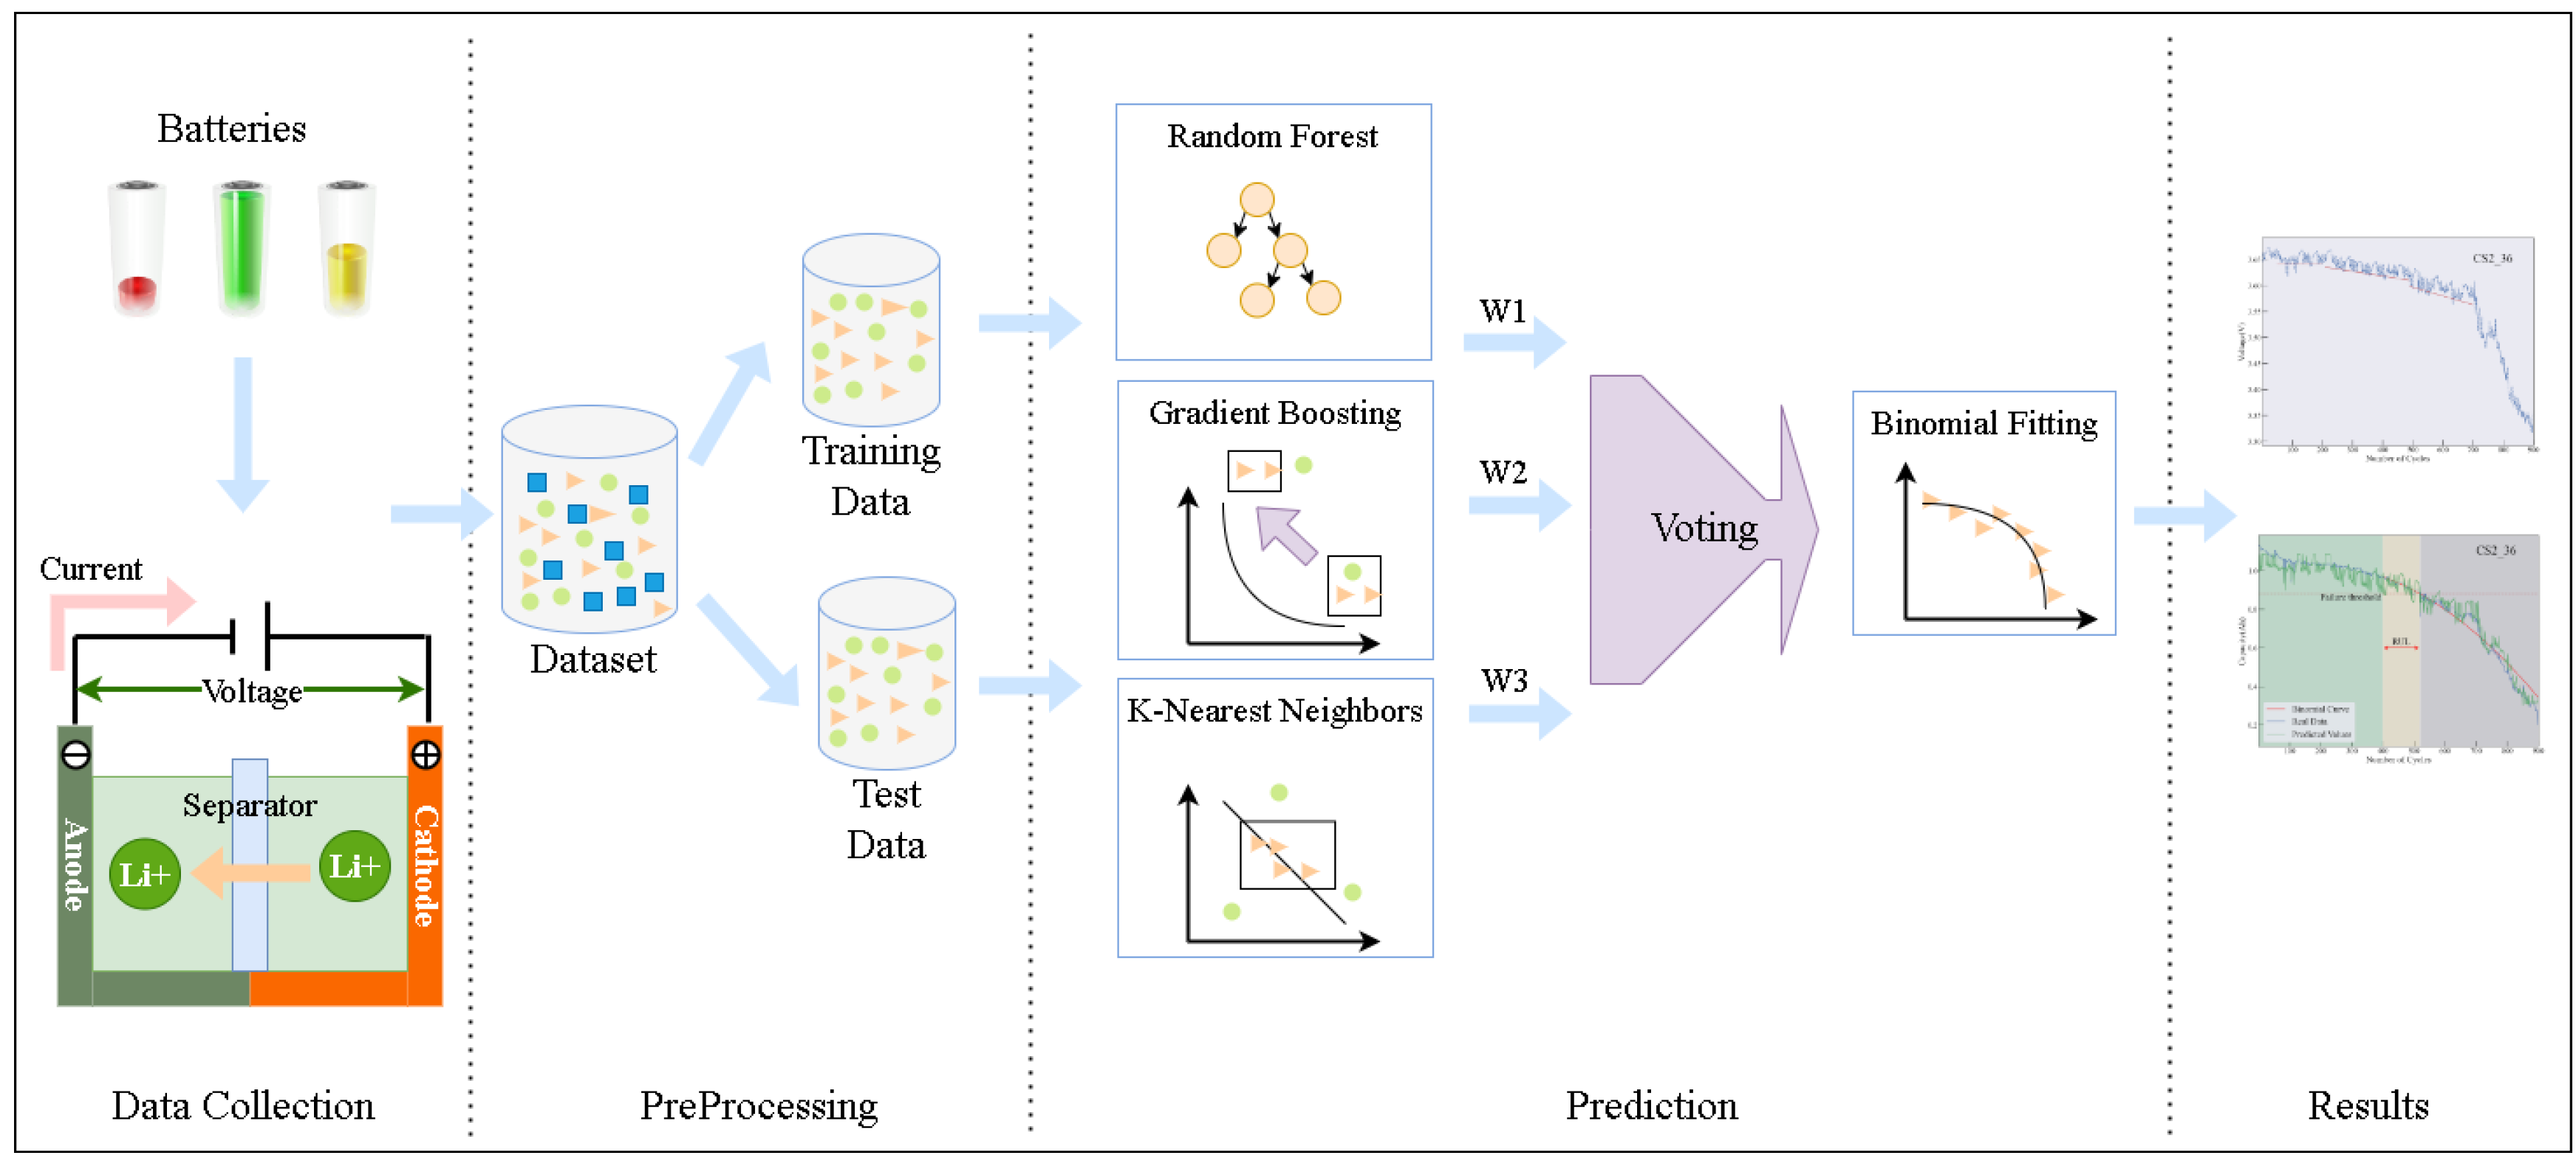
Figure 1. Framework of proposed approach.
Preprints 116734 g001
Figure 2. Correlation of features with capacity.
Preprints 116734 g002
Figure 3. Capacity and voltage change for CS2_35.
Preprints 116734 g003
Figure 4. Voltage and internal resistance change for CS2_35.
Preprints 116734 g004
Figure 5. Estimation process workflow.
Preprints 116734 g005
Figure 6. Voltage change for battery CS2_36.
Preprints 116734 g006
Figure 7. Prediction result for battery CS2_36.
Preprints 116734 g007
Figure 8. Voltage change for battery CS2_37.
Preprints 116734 g008
Figure 9. Prediction result for battery CS2_37.
Preprints 116734 g009
Figure 10. Voltage change for battery CS2_38.
Preprints 116734 g010
Figure 11. Prediction result for battery CS2_38.
Preprints 116734 g011
Table 1. Performance results.
Algorithm MAE RMSE RE R 2
K-Nearest Neighbor 0.044788 0.057151 0.085195 0.951340
Random Forest 0.044589 0.055903 0.083007 0.953442
Gradient Boosting 0.043230 0.054165 0.075759 0.956291
Hybrid Ensembles for CS2_36 0.037993 0.048951 0.072705 0.964301
Hybrid Ensembles for CS2_37 0.032584 0.040113 0.045291 0.962737
Hybrid Ensembles for CS2_38 0.051992 0.084168 0.059868 0.829940
Disclaimer/Publisher’s Note: The statements, opinions and data contained in all publications are solely those of the individual author(s) and contributor(s) and not of MDPI and/or the editor(s). MDPI and/or the editor(s) disclaim responsibility for any injury to people or property resulting from any ideas, methods, instructions or products referred to in the content.
Copyright: This open access article is published under a Creative Commons CC BY 4.0 license, which permit the free download, distribution, and reuse, provided that the author and preprint are cited in any reuse.
Prerpints.org logo

Preprints.org is a free preprint server supported by MDPI in Basel, Switzerland.

Subscribe

© 2024 MDPI (Basel, Switzerland) unless otherwise stated