Submitted:
29 August 2024
Posted:
30 August 2024
You are already at the latest version
Abstract
Keywords:
1. Introduction
2. Results and Discussion
2.1. DsQ Adsorbed on the GrNP Surface
2.2. Charge Transfer and Distance from Surface
3. Materials and Methods
4. Conclusions
Supplementary Materials
Author Contributions
Funding
Institutional Review Board Statement
Informed Consent Statement
Data Availability Statement
Acknowledgments
Conflicts of Interest
References
- Bakulin, A.A.; Dimitrov, S.D.; Rao, A.; Chow, P.C.Y.; Nielsen, C.B.; Schroeder, B.C.; McCulloch, I.; Bakker, H.J.; Durrant, J.R.; Friend, R.H. Charge-Transfer State Dynamics Following Hole and Electron Transfer in Organic Photovoltaic Devices. J. Phys. Chem. Lett. 2013, 4, 209–215. [Google Scholar] [CrossRef] [PubMed]
- Stoltzfus, D.M.; Donaghey, J.E.; Armin, A.; Shaw, P.E.; Burn, P.L.; Meredith, P. Charge Generation Pathways in Organic Solar Cells: Assessing the Contribution from the Electron Acceptor. Chem. Rev. 2016, 116, 12920–12955. [Google Scholar] [CrossRef] [PubMed]
- Holliday, S.; Li, Y.; Luscombe, C.K. Recent advances in high performance donor-acceptor polymers for organic photovoltaics. Prog. Polym. Sci. 2017, 70, 34–51. [Google Scholar] [CrossRef]
- Li, Y.; Huang, W.; Zhao, D.; Wang, L.; Jiao, Z.; Huang, Q.; Wang, P.; Sun, M.; Yuan, G. Recent Progress in Organic Solar Cells: A Review on Materials from Acceptor to Donor. Molecules 2022, 27, 1800. [Google Scholar] [CrossRef] [PubMed]
- Solak, E.K.; Irmak, E. Advances in organic photovoltaic cells: A comprehensive review of materials, technologies, and performance. RSC Adv. 2023, 13, 12244. [Google Scholar] [CrossRef]
- Buzzetti, L.; Crisenza, G.E.M.; Melchiorre, P. Mechanistic Studies in Photocatalysis. Angew. Chem. Int. Ed. 2019, 58, 3730–3747. [Google Scholar] [CrossRef]
- Yuan, Y.q.; Majumder, S.; Yang, M.h.; Guo, S.r. Recent advances in catalyst-free photochemical reactions via electron- donor-acceptor (EDA) complex process. Tetrahedron Lett. 2020, 61, 151506. [Google Scholar] [CrossRef]
- Tasnim, T.; Ayodele, M.J.; Pitre, S.P. Recent Advances in Employing Catalytic Donors and Acceptors in Electron Donor Acceptor Complex Photochemistry. J. Org. Chem. 2022, 87, 10555–10563. [Google Scholar] [CrossRef]
- Ostroverkhova, O. Organic Optoelectronic Materials: Mechanisms and Applications. Chem. Rev. 2016, 116, 13279–13412. [Google Scholar] [CrossRef]
- Mathur, C.; Gupta, R.; Bansal, R.K. Organic Donor-Acceptor Complexes As Potential Semiconducting Materials. Chem. Eur. J. 2024, 30, e202304139. [Google Scholar] [CrossRef]
- Mulliken, R.S. Molecular Compounds and their Spectra. II. J. Am. Chem. Soc. 1952, 74, 811–824. [Google Scholar] [CrossRef]
- Mulliken, R.S. Molecular Compounds and their Spectra. III. The Interaction of Electron Donors and Acceptors. J. Phys. Chem. 1952, 56, 801–822. [Google Scholar] [CrossRef]
- Mulliken, R.S.; Person, W.B. Donor-Acceptor Complexes. Ann. Rev. Phys. Chem. 1962, 13, 107–126. [Google Scholar] [CrossRef]
- Cabellos, J.L.; Mowbray, D.J.; Goiri, E.; El-Sayed, A.; Floreano, L.; de Oteyza, D.G.; Rogero, C.; Ortega, J.E.; Rubio, A. Understanding Charge Transfer in Donor - Acceptor/Metal Systems: A Combined Theoretical and Experimental Study. J. Phys. Chem. C 2012, 116, 17991–18001. [Google Scholar] [CrossRef]
- Chen, X.K.; Coropceanu, V.; Brédas, J.L. Assessing the nature of the charge-transfer electronic states in organic solar cells. Nat. Commun. 2018, 9, 5295. [Google Scholar] [CrossRef]
- Crisenza, G.E.M.; Mazzarella, D.; Melchiorre, P. Synthetic Methods Driven by the Photoactivity of Electron Donor–Acceptor Complexes. J. Am. Chem. Soc. 2020, 142, 5461–5476. [Google Scholar] [CrossRef] [PubMed]
- Wortman, A.K.; Stephenson, C.R. EDA photochemistry: Mechanistic investigations and future opportunities. Chem 2023, 9, 2390–2415. [Google Scholar] [CrossRef]
- Marcus, R.A. Chemical and electrochemical electron-transfer theory. Annu. Rev. Phys. Chem. 1964, 15, 155–196. [Google Scholar] [CrossRef]
- Piechota, E.J.; Meyer, G.J. Introduction to Electron Transfer: Theoretical Foundations and Pedagogical Examples. J. Chem. Educ. 2019, 96, 2450–2466. [Google Scholar] [CrossRef]
- Marcus, R.A. Reflections on electron transfer theory. J. Chem. Phys. 2020, 153, 210401. [Google Scholar] [CrossRef]
- Taylor, N.B.; Kassal, I. Generalised Marcus theory for multi-molecular delocalised charge transfer. Chem. Sci. 2018, 9, 2942–2951. [Google Scholar] [CrossRef]
- Derr, J.B.; Tamayo, J.; Clark, J.A.; Morales, M.; Mayther, M.F.; Espinoza, E.M.; Rybicka-Jasińska, K.; Vullev, V.I. Multifaceted aspects of charge transfer. Phys. Chem. Chem. Phys. 2020, 22, 21553–22118. [Google Scholar] [CrossRef] [PubMed]
- Nazmutdinov, R.R.; Shermokhamedov, S.A.; Zinkicheva, T.T.; Ulstrup, J.; Xiao, X. Understanding molecular and electrochemical charge transfer: Theory and computations. Chem. Soc. Rev. 2023, 52, 6223–6588. [Google Scholar] [CrossRef] [PubMed]
- Hashemi, A.; Peljo, P.; Laasonen, K. Understanding Electron Transfer Reactions Using Constrained Density Functional Theory: Complications Due to Surface Interactions. J. Phys. Chem. C 2023, 127, 3398–3407. [Google Scholar] [CrossRef] [PubMed]
- Liu, Z.; Sun, X. Instantaneous Marcus theory for photoinduced charge transfer dynamics in multistate harmonic model systems. J. Phys. Condens. Matter 2024, 36, 315201. [Google Scholar] [CrossRef]
- Henderson, M.A. A surface science perspective on TiO2 photocatalysis. Surf. Sci. Rep. 2011, 66, 185–297. [Google Scholar] [CrossRef]
- Xu, C.; Anusuyadevi, P.R.; Aymonier, C.; Luque, R.; Marre, S. Nanostructured materials for photocatalysis. Chem. Soc. Rev. 2019, 48, 3868–3902. [Google Scholar] [CrossRef]
- Wang, L.; Zhu, W. Organic Donor-Acceptor Systems for Photocatalysis. Adv. Sci. 2024, 11, 2307227. [Google Scholar] [CrossRef]
- Quina, F.H.; Silva, G.T.M. The photophysics of photosensitization: A brief overview. J. Photochem. Photobiol. 2021, 7, 100042. [Google Scholar] [CrossRef]
- Zhao, X.; Liu, J.; Fan, J.; Chao, H.; Peng, X. Recent progress in photosensitizers for overcoming the challenges of photodynamic therapy: From molecular design to application. Chem. Soc. Rev. 2021, 50, 4185–4219. [Google Scholar] [CrossRef] [PubMed]
- Sun, L.; Chen, Y.; Sun, M.; Zheng, Y. Organic Solar Cells: Physical Principle and Recent Advances. Chem. Asian J. 2023, 18, e202300006. [Google Scholar] [CrossRef]
- Wodtke, A.M.; Matsiev, D.; Auerbach, D.J. Energy transfer and chemical dynamics at solid surfaces: The special role of charge transfer. Prog. Surf. Sci. 2008, 83, 167–214. [Google Scholar] [CrossRef]
- Farcaş, A.A.; Bende, A. Theoretical insights into dopamine photochemistry adsorbed on graphene-type nanostructures. Phys. Chem. Chem. Phys. 2024, 26, 14937–14947. [Google Scholar] [CrossRef] [PubMed]
- Falamaş, A.; Petran, A.; Hada, A.M.; Bende, A. Dopamine Photochemical Behaviour under UV Irradiation. Int. J. Mol. Sci. 2022, 23, 5483. [Google Scholar] [CrossRef]
- Hirata, K.; Kasai, K.I.; Yoshizawa, K.; Grégoire, G.; Ishiuchi, S.I.; Fujii, M. Excited state dynamics of protonated dopamine: Hydration and conformation effects. Phys. Chem. Chem. Phys. 2022, 24, 10737–10744. [Google Scholar] [CrossRef]
- Liebscher, J.; Mrówczyński, R.; Scheidt, H.A.; Filip, C.; Hădade, N.D.; Turcu, R.; Bende, A.; Beck, S. Structure of Polydopamine: A Never-Ending Story? Langmuir 2013, 29, 10539–10548. [Google Scholar] [CrossRef]
- Lyu, Q.; Hsueh, N.; Chai, C.L.L. Unravelling the polydopamine mystery: Is the end in sight? Polym. Chem. 2019, 10, 5771–5777. [Google Scholar] [CrossRef]
- Bacil, R.P.; Chen, L.; Serrano, S.H.P.; Compton, R.G. Dopamine oxidation at gold electrodes: Mechanism and kinetics near neutral pH. Phys. Chem. Chem. Phys. 2020, 22, 607–614. [Google Scholar] [CrossRef] [PubMed]
- Adasme-Carreño, F.; Ochoa-Calle, A.; Galván, M.; Ireta, J. Conformational preference of dipeptide zwitterions in aqueous solvents. Phys. Chem. Chem. Phys. 2024, 26, 8210–8218. [Google Scholar] [CrossRef]
- Sundararaman, R.; III, W.A.G. The charge-asymmetric nonlocally determined local-electric (CANDLE) solvation model. J. Chem. Phys. 2015, 142, 064107. [Google Scholar] [CrossRef]
- Castro-Neto, A.H.; Guinea, F.; Peres, N.M.R.; Novoselov, K.S.; Geim, A.K. The electronic properties of graphene. Rev. Mod. Phys. 2009, 81, 109–162. [Google Scholar] [CrossRef]
- Mak, K.F.; Sfeir, M.Y.; Wu, Y.; Lui, C.H.; Misewich, J.A.; Heinz, T.F. Measurement of the Optical Conductivity of Graphene. Phys. Rev. Lett. 2008, 101, 196405. [Google Scholar] [CrossRef] [PubMed]
- Mak, K.F.; Ju, L.; Wang, F.; Heinz, T.F. Optical spectroscopy of graphene: From the far infrared to the ultraviolet. Solid State Commun. 2012, 152, 1341–1349. [Google Scholar] [CrossRef]
- Chen, S.; Ullah, N.; Zhao, Y.; Zhang, R. Nonradiative Excited-State Decay via Conical Intersection in Graphene Nanostructures. ChemPhysChem 2019, 20, 1–6. [Google Scholar] [CrossRef]
- Dou, W.; Nitzan, A.; Subotnik, J.E. Surface hopping with a manifold of electronic states. II. Application to the many-body Anderson-Holstein model. J. Chem. Phys. 2015, 142, 084110. [Google Scholar] [CrossRef]
- Dou, W.; Nitzan, A.; Subotnik, J.E. Surface hopping with a manifold of electronic states. III. Transients, broadening, and the Marcus picture. J. Chem. Phys. 2015, 142, 234106. [Google Scholar] [CrossRef] [PubMed]
- Dou, W.; Nitzan, A.; Subotnik, J.E. Erratum: "Surface hopping with a manifold of electronic states. III. Transients, broadening and the Marcus picture" [J. Chem. Phys. 142, 234106 (2015)]. J. Chem. Phys. 2015, 143, 189902. [Google Scholar] [CrossRef]
- Chen, J.; Jin, Z.; Dou, W.; Subotnik, J. Electronic Structure for Multielectronic Molecules near a Metal Surface. J. Phys. Chem. C 2021, 125, 2884–2899. [Google Scholar] [CrossRef]
- Bende, A.; Farcaş, A.A.; Falamaş, A.; Petran, A. New insight into catechol photochemistry: The role of different monomer and dimer configurations in radiation-less decay of the S1 electronic excited state. Phys. Chem. Chem. Phys. 2022, 24, 29165–29175. [Google Scholar] [CrossRef]
- Bende, A.; Farcaş, A.A. Intermolecular-Type Conical Intersections in Benzene Dimer. Int. J. Mol. Sci. 2023, 24, 2906. [Google Scholar] [CrossRef]
- Lui, C.H.; Mak, K.F.; Shan, J.; Heinz, T.F. Ultrafast Photoluminescence from Graphene. Phys. Rev. Lett. 2010, 105, 127404. [Google Scholar] [CrossRef] [PubMed]
- Wang, J.; Cao, S.; Ding, Y.; Ma, F.; Lu, W.; Sun, M. Theoretical Investigations of Optical Origins of Fluorescent Graphene Quantum Dots. Sci. Rep. 2016, 6, 24850. [Google Scholar] [CrossRef] [PubMed]
- Ji, X.; Wang, W.; Mattoussi, H. Effects of separation distance on the charge transfer interactions in quantum dot–dopamine assemblies. Phys. Chem. Chem. Phys. 2015, 17, 10108–10117. [Google Scholar] [CrossRef]
- Chai, J.D.; Head-Gordon, M. Long-range corrected hybrid density functionals with damped atom-atom dispersion corrections. Phys. Chem. Chem. Phys. 2008, 10, 6615–6620. [Google Scholar] [CrossRef] [PubMed]
- Lehtola, S.; Steigemann, C.; Oliveira, M.; Marques, M. Recent developments in Libxc - A comprehensive library of functionals for density functional theory. Software X 2018, 7, 1–5. [Google Scholar] [CrossRef]
- Grimme, S.; Antony, J.; Ehrlich, S.; Krieg, H. A consistent and accurate ab initio parametrization of density functional dispersion correction (DFT-D) for the 94 elements H-Pu. J. Chem. Phys. 2010, 132, 154104. [Google Scholar] [CrossRef]
- Grimme, S.; Ehrlich, S.; Goerigk, L. Effect of the damping function in dispersion corrected density functional theory. J. Comput. Chem. 2011, 32, 1456–1465. [Google Scholar] [CrossRef]
- Weigend, F.; Ahlrichs, R. Balanced basis sets of split valence, triple zeta valence and quadruple zeta valence quality for H to Rn: Design and assessment of accuracy. Phys. Chem. Chem. Phys. 2005, 7, 3297–3305. [Google Scholar] [CrossRef]
- Neese, F. Software update: The ORCA program system–Version 5.0. WIREs Comput. Mol. Sci. 2022, 12, e1606. [Google Scholar] [CrossRef]
- Neese, F.; Wennmohs, F.; Becker, U.; Riplinger, C. The ORCA quantum chemistry program package. J. Chem. Phys. 2020, 152, 224108. [Google Scholar] [CrossRef]
- Barone, V.; Cossi, M. Quantum Calculation of Molecular Energies and Energy Gradients in Solution by a Conductor Solvent Model. J. Phys. Chem. A 1998, 102, 1995–2001. [Google Scholar] [CrossRef]
- Garcia-Rates, M.; Neese, F. Effect of the Solute Cavity on the Solvation Energy and its Derivatives within the Framework of the Gaussian Charge Scheme. J. Comput. Chem. 2020, 41, 922–939. [Google Scholar] [CrossRef] [PubMed]
- Hirata, S.; Head-Gordon, M. Time-dependent density functional theory within the Tamm-Dancoff approximation. Chem. Phys. Lett. 1999, 314, 291–299. [Google Scholar] [CrossRef]
- Neese, F.; Wennmohs, F.; Hansen, A.; Becker, U. Efficient, approximate and parallel Hartree-Fock and hybrid DFT calculations. A ’chain-of-spheres’ algorithm for the Hartree-Fock exchange. Chem. Phys. 2009, 356, 98–109. [Google Scholar] [CrossRef]
- Izsák, R.; Neese, F. An overlap fitted chain of spheres exchange method. J. Chem. Phys. 2011, 135, 144105. [Google Scholar] [CrossRef]
- Izsák, R.; Neese, F.; Klopper, W. Robust fitting techniques in the chain of spheres approximation to the Fock exchange: The role of the complementary space. J. Chem. Phys. 2013, 139, 094111. [Google Scholar] [CrossRef]
- Helmich-Paris, B.; de Souza, B.; Neese, F.; Izsák, R. An improved chain of spheres for exchange algorithm. J. Chem. Phys. 2021, 155, 104109. [Google Scholar] [CrossRef]
- Neese, F. The SHARK Integral Generation and Digestion System. J. Comp. Chem. 2022, 44, 381–396. [Google Scholar] [CrossRef]
- Weigend, F. Accurate Coulomb-fitting basis sets for H to Rn. Phys. Chem. Chem. Phys. 2006, 8, 1057–1065. [Google Scholar] [CrossRef] [PubMed]
- Hellweg, A.; Hättig, C.; Höfener, S.; Klopper, W. Optimized accurate auxiliary basis sets for RI-MP2 and RI-CC2 calculations for the atoms Rb to Rn. Theor. Chem. Acc. 2007, 117, 587–597. [Google Scholar] [CrossRef]
- Lu, T.; Chen, F. Multiwfn: A multifunctional wavefunction analyzer. J. Comput. Chem. 2012, 33, 580–592. [Google Scholar] [CrossRef]
- Allouche, A.R. Gabedit–A graphical user interface for computational chemistry softwares. J. Comput. Chem. 2011, 32, 174–182. [Google Scholar] [CrossRef] [PubMed]
- Hanwell, M.D.; Curtis, D.E.; Lonie, D.C.; Vandermeersch, T.; Zurek, E.; Hutchison, G.R. Avogadro: an advanced semantic chemical editor, visualization, and analysis platform. J. Cheminformatics 2012, 4, 17. [Google Scholar] [CrossRef] [PubMed]
- Dennington, R.; Keith, T.; Millam, J. Gaussview 6.1.1, 2009. Semichem Inc., Shawnee Mission, KS.
- Cayambe, M.; Zambrano, C.; Tene, T.; Guevara, M.; Usca, G.T.; Brito, H.; Molina, R.; Coello-Fiallos, D.; Caputi, L.S.; Gomez, C.V. Dispersion of graphene in ethanol by sonication. Materials Today: Proceedings 2021, 37, 4027–4030. [Google Scholar] [CrossRef]
- Yang, L.; Deslippe, J.; Park, C.H.; Cohen, M.L.; Louie, S.G. Excitonic Effects on the Optical Response of Graphene and Bilayer Graphene. Phys. Rev. Lett. 2009, 103, 186802. [Google Scholar] [CrossRef]
- Trevisanutto, P.E.; Holzmann, M.; Côté, M.; Olevano, V. Ab initio high-energy excitonic effects in graphite and graphene. Phys. Rev. B 2010, 81, 121405. [Google Scholar] [CrossRef]


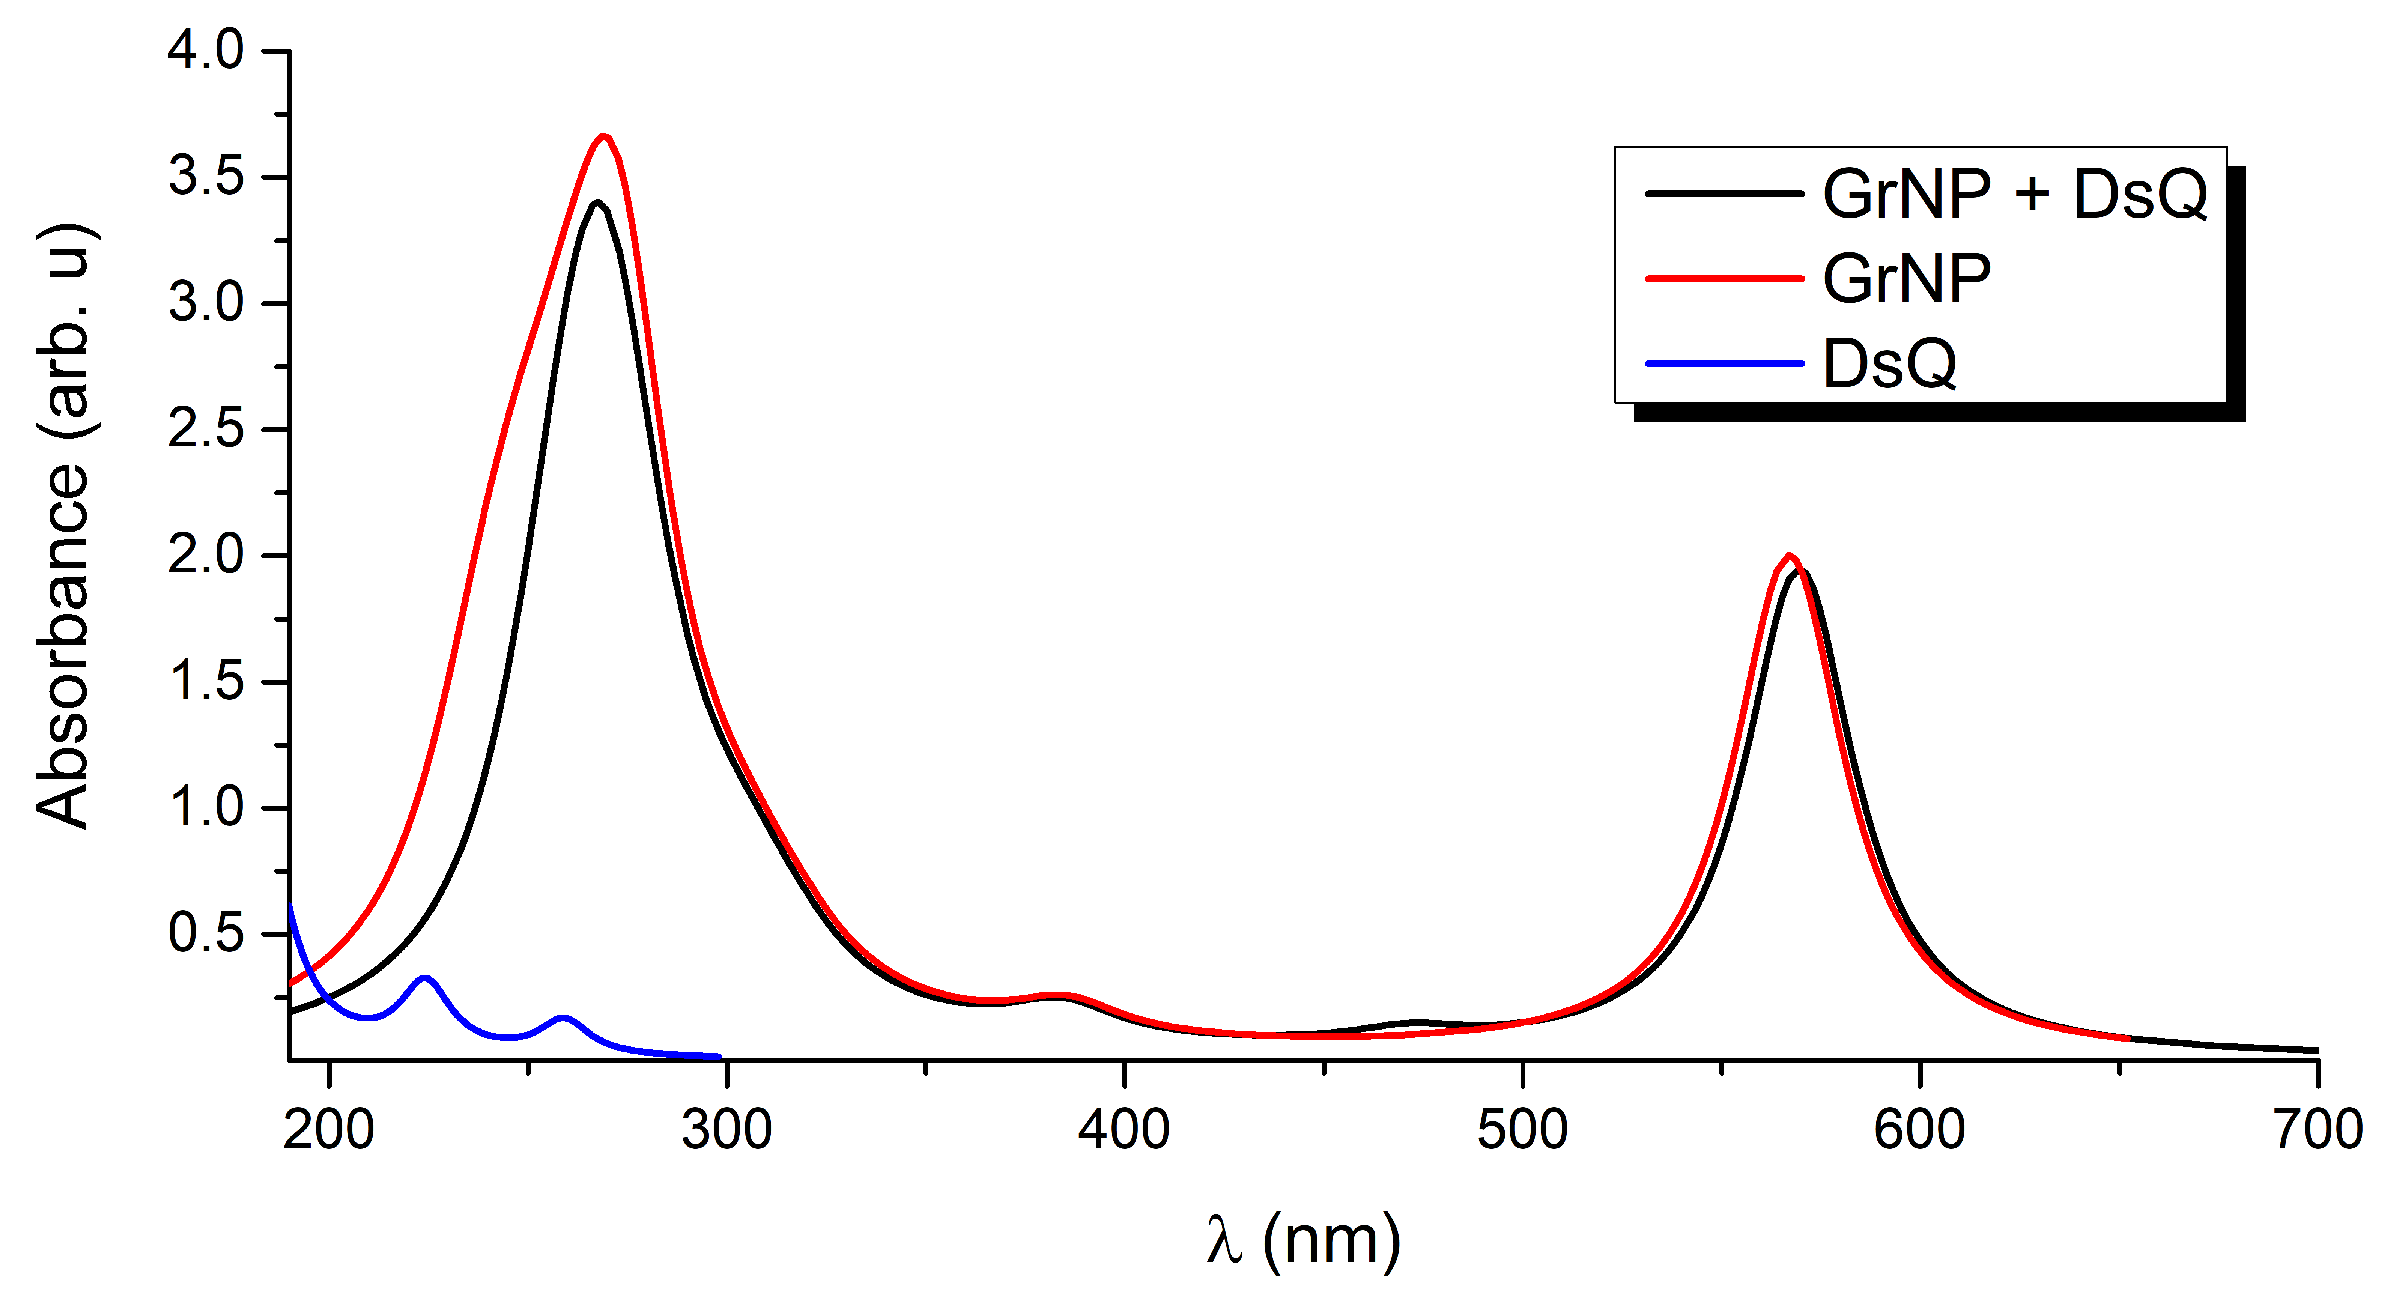
| Si | 1 | 2 | 3 | 4 | 5 | 6 | 7 | 8 | 9 | 10 |
| λ (nm) | 570 | 471 | 384 | 375 | 364 | 357 | 340 | 325 | 322 | 314 |
| Osc. Str. | 1.9323 | 0.0573 | 0.1312 | 0.0004 | 0.0000 | 0.0025 | 0.0023 | 0.0035 | 0.0144 | 0.1213 |
| Charge tr. (e) | 0.085 | 1.000 | 0.075 | 0.066 | 0.074 | 0.070 | 0.068 | 0.083 | 0.069 | 0.064 |
| Type | GrNP | CT | GrNP | GrNP | GrNP | GrNP | GrNP | GrNP | GrNP | GrNP |
| Si | 11 | 12 | 13 | 14 | 15 | 16 | 17 | 18 | 19 | 20 |
| λ (nm) | 305 | 304 | 301 | 297 | 295 | 290 | 285 | 284 | 282 | 273 |
| Osc. Str. | 0.2109 | 0.0050 | 0.0313 | 0.0253 | 0.0410 | 0.0020 | 0.0406 | 0.0407 | 0.0819 | 0.9082 |
| Charge tr. (e) | 0.110 | 0.190 | 0.576 | 0.505 | 0.569 | 0.930 | 0.233 | 0.478 | 0.604 | 0.429 |
| Type | GrNP + CT | GrNT + CT | CT | CT | CT | CT | GrNP + CT | CT | CT | CT |
| Si | 21 | 22 | 23 | 24 | 25 | 26 | 27 | 28 | 29 | 30 |
| λ (nm) | 270 | 268 | 266 | 262 | 261 | 260 | 259 | 258 | 256 | 254 |
| Osc. Str. | 0.6146 | 0.2963 | 0.5778 | 0.1547 | 0.4897 | 0.0171 | 0.0570 | 0.0121 | 0.2461 | 0.1927 |
| Charge tr. (e) | 0.651 | 0.107 | 0.099 | 0.227 | 0.237 | 0.095 | 0.215 | 0.828 | 0.148 | 0.690 |
| Type | CT | GrNP + CT | GrNP + CT | GrNP + CT | DsQ + CT | GrNP | GrNP + CT | CT | GrNP + CT | CT |
Disclaimer/Publisher’s Note: The statements, opinions and data contained in all publications are solely those of the individual author(s) and contributor(s) and not of MDPI and/or the editor(s). MDPI and/or the editor(s) disclaim responsibility for any injury to people or property resulting from any ideas, methods, instructions or products referred to in the content. |
© 2024 by the authors. Licensee MDPI, Basel, Switzerland. This article is an open access article distributed under the terms and conditions of the Creative Commons Attribution (CC BY) license (http://creativecommons.org/licenses/by/4.0/).


