
Submitted:
30 August 2024
Posted:
02 September 2024
You are already at the latest version
Abstract
This paper addresses the lack of analytical tools for visual data analysis in IEEE Xplore, an abstract database of publications on technical problems in electronics and electrical engineering. The openness of the platform and the good fillability of a large number of bibliometric record fields make it attractive for visual data analysis. The topic of machine learning and artificial intelligence applied to power systems, which are critical issues in the energy transition process, is chosen as an example for visual data analysis. The programs and utilities used for data analysis were VOSviewer, Scimago Graphica, FP-Growth algorithm, Inkscape, and MultiDendrograms. The use of IEEE Terms field data to identify publication topics in the exported data is analyzed in the most comprehensive way. This paper can be considered a reference for professionals interested in bibliometric analysis and visualization of IEEE Xplore data.
Keywords:
IEEE Xplore
; IEEE Terms
; bibliometric analysis
; visualization
; VOSviewer
; Scimago Graphica
; FP-Growth algorithm
; MultiDendrograms
Objectives of the Study
IEEE Xplore, an open platform of interest to address engineering challenges in energy transition and digitalization, contains qualitative bibliometric data but does not provide analytical tools for visual data analysis.
To eliminate this problem and show experts the possibilities of using freeware to visually analyze data exported from IEEE Xplore is the main goal of this paper. The topic ‘Machine learning and Artificial intelligence applied to Power Systems and Energy Systems’, as part of the theme of energy transition and digitalization of the Fuel and Energy Complex, besides being topical, reflects the interest of the author of this article and the center in which he works.
Introduction
Motivation for selecting a source of bibliometric data and designing a query
Reason for choosing IEEE Xplore
Electrification and digitalization are critical issues in the energy transition, as they affect technological, social and economic aspects. The technological integration of diverse energy sources requires the use of smart grids to improve their efficiency and security [1, 2].
The tasks listed above are largely within the purview of the IEEE, the largest professional engineering organization in the world. [https://www.ieee.org/about/vision-mission.html].
IEEE and its publishing partners publish their scientific and technical content on the IEEE Xplore digital platform. IEEE Xplore contains more than 6 million of the world’s most cited publications in electrical engineering, computer science and related areas. [https://ieeexplore.ieee.org/Xplorehelp/overview-of-ieee-xplore/about-ieee-xplore].
A distinctive feature of the IEEE Xplore platform is its openness and good fillability of a large number of fields of bibliometric records. The data exported from IEEE Xplore contain fields available for bibliometric analysis: Document Title; Authors; Author Affiliations; Publication Title; Publication Year; Abstract; DOI; Funding Information; Author Keywords; IEEE Terms; Mesh_Terms; Article Citation Count; Patent Citation Count; Reference Count; Publisher. This is more than the bibliometric records of Elsevier’s ScienceDirect platform containing fields: Title; Authors; Year; DOI; Author Keywords; Abstract. That is, the citation, affiliation, and system keyword fields are missing in the data exported from ScienceDirect. In addition, the ‘IEEE Terms’ of IEEE Xplore can be seen as an analog of the ‘Index Keywords’ of Scopus.
Note: Within this article, single quotes are used to emphasize a particular substring, such as a term consisting of several words, and double quotes are used to cite text.
IEEE Xplore query selection
To confirm the thesis that the engineering issues of IEEE Xplore publications are relevant to the challenges of digitalization, the most common topics of publications are shown in Table 1. It is difficult to imagine the process of digitalization without solving problems of image processing, machine learning, deep learning, and artificial intelligence.
Data are current as of August 9, 2024. The verification showed that the data in the table corresponds to the queries to the fields: ‘All Metadata’ for all years of publications indexing.
The terms ‘Machine Learning’ and ‘Artificial Intelligence’ are chosen for this study. Image Processing and Deep Learning are also relevant terms worthy of a separate study in the context of energy transition. Again, the main objective of this paper is to demonstrate the possibilities of visual analysis of bibliometric data of IEEE Xplore platform using free software, and the topic is chosen simply as an example of the current issue of digitalization and energy transition.
Investment is a good indicator of the relevance of the issue under study, so Figure 1 shows a graph of global investment in key areas of the energy transition as presented in a Bloomberg Agency report [https://data.bloomberglp.com/professional/sites/24/Energy-Transition-Investment-Trends-2024.pdf].
The power grid is an essential part of the energy systems, in which intensive investments have been made since 2020, which is quite logical, since the further development of the other tasks shown in the graph is not possible without the development of the power grid. The most common concepts that include the term ‘power grid’ are ‘Power Systems’ and ‘Energy Systems’, so let’s choose them as keywords for the final query to the bibliometric database IEEE Xplore: (("All Metadata":Power Systems) OR ("All Metadata":Energy Systems)) AND (("All Metadata":Machine learning OR "All Metadata":Artificial intelligence))); Filters Applied: Journals, Years 2020—2-24.
Comment: This preprint is proposed for further publication in the journal Energy Systems Research [https://esrj.ru/], a factor that also influenced the choice of bibliometric data source and publication topic selected for visual analysis.
Materials and Methods
This study used bibliometric records exported from the IEEE Xplore platform on query: ‘(("All Metadata":Power Systems) OR ("All Metadata":Energy Systems)) AND (("All Metadata":Machine learning OR "All Metadata":Artificial intelligence))); Filters Applied: Journals, Years 2020—2-24’, 1000 records for each year, sorted by their relevance to the query. A total of 5 thousand records containing fields were used: Document Title; Authors; Author Affiliations; Publication Title; Publication Year; Abstract; DOI; Funding Information; Author Keywords; IEEE Terms; Mesh_Terms; Article Citation Count; Patent Citation Count; Reference Count; Publisher. Data is current as of August 8, 2024.
Further in this paper we will briefly denote the analyzed topic as: ‘Machine Learning OR Artificial Intelligence for Power Systems OR Energy Systems’.
Programs and Utilities Used
VOSviewer is a widely used software application for building and visualizing bibliometric networks. Developed by Nees Jan van Eck and Ludo Waltman at Leiden University’s Centre for Science and Technology Studies [3].
Scimago Graphica is a free data visualization tool developed by SCImago LAB that makes it easy to explore data without any programming knowledge [4].
The FP-Growth algorithm is a data mining technique that can detect frequent itemsets without the need to generate candidates, making it more efficient than traditional algorithms such as Apriori [5].
Inkscape is a free and open source vector graphics editor for creating and editing vector images such as illustrations, diagrams, logos, and complex paintings. It primarily uses the Scalable Vector Graphics (SVG) format [https://inkscape.org].
MultiDendrograms is a hierarchical data clustering software distributed under an Open Source license [6].
Results and Discussions
General Record Characteristics
Total number of authors in records 24098, average number of authors per publication 4.8. The number of unique authors is 12324.
Table 2 shows the list of 30 authors and the number of their publications in the exported bibliometric records.
The table shows the dominance of Chinese authors, which is consistent with the fact that China is experiencing high growth in energy consumption due to economic development [7]. China is a leader in renewable energy. It’s a policy aimed at economic growth, environmental protection and reducing dependence on imports [8,9].
Below is the list of countries with the highest publication activity. Affiliation was assessed by the number of records in which the name of the country appeared, i.e. the number of publications in which at least one author was affiliated with that country.
China|Hong Kong → 1962, USA → 1072, ‘UK|U\.K’ → 377, Canada → 327, India → 299, Saudi Arabia → 286, South Korea → 272, Singapore → 191, Italy → 170, Germany → 160, Iran → 125, Taiwan → 127, Japan → 110, Malaysia → 98, Brazil → 90, France → 83, Finland → 78, Switzerland → 67, Portugal → 50, South Africa → 31, Russian Federation|Russia → 26. The low number of affiliations with Russia is most often explained by two factors: many Russian authors publish in Russian journals, many Russian journals only accept articles in Russian.
The dominance of Chinese affiliations is consistent with the data on authors; in addition, authors with Chinese surnames may also appear with USA, UK, Canada, Singapore affiliations.
The Author Affiliations field in the bibliometric records of the IEEE Xplore platform is fairly uniformly populated, but there may be slightly different spellings, e.g., ‘5GIC and 6GIC, Institute for Communication Systems (ICS), University of Surrey, Guildford, U. K.’ and ‘5GIC and 6GIC, Institute for Communication Systems, University of Surrey, Guildford, U. K.’. K’ and ‘5GIC and 6GIC, Institute for Communication Systems, University of Surrey, Guildford, U.K.’, therefore Table 3 was compiled in two stages: first, the occurrence of affiliations was counted, and then the possibility of their different spellings was checked for the most frequent ones. Other option: the author may have multiple affiliations, e.g. ‘National Key Laboratory of Science and Technology on Multispectral Information Processing, School of Artificial Intelligence and Automation, Huazhong University of Science and Technology, Wuhan, China’.
Below are examples of the three most frequent affiliations with different spellings, with → followed by the frequency of occurrence.
School of Electrical and Information Engineering, The University of Sydney, Sydney, NSW, Australia → 100
- the School of Electrical and Information Engineering, The University of Sydney, Sydney, NSW, Australia→ 2
School of Artificial Intelligence and Automation, Huazhong University of Science and Technology, Wuhan, China → 78
- Key Laboratory of Image Processing and Intelligent Control, School of Artificial Intelligence and Automation, Huazhong University of Science and Technology, Wuhan, China → 19
- National Key Laboratory of Science and Technology on Multispectral Information Processing, School of Artificial Intelligence and Automation, Huazhong University of Science and Technology, Wuhan, China → 12
- Key Laboratory of Ministry of Education for Image Processing and Intelligent Control, School of Artificial Intelligence and Automation, Huazhong University of Science and Technology, Wuhan, China → 9
- National Key Laboratory of Science and Technology on Multispectral Information Processing and Key Laboratory of Image Processing and Intelligent Control, School of Artificial Intelligence and Automation, Huazhong University of Science and Technology, Wuhan, China → 6
- Key Laboratory of Imaging Processing and Intelligence Control, School of Artificial Intelligence and Automation, Huazhong University of Science and Technology, Wuhan, China → 5
- Key Laboratory of Image Processing and Intelligent Control of Ministry of Education, School of Artificial Intelligence and Automation, Huazhong University of Science and Technology, Wuhan, China → 4
- Key Laboratory of Image Processing and Intelligent Control, Ministry of Education, School of Artificial Intelligence and Automation, Huazhong University of Science and Technology, Wuhan, China → 3
- Key Laboratory of Imaging Processing and Intelligent Control, School of Artificial Intelligence and Automation, Huazhong University of Science and Technology, Wuhan, China → 3
- Key Laboratory of the Ministry of Education for Image Processing and Intelligent Control, School of Artificial Intelligence and Automation, Huazhong University of Science and Technology, Wuhan, China → 3
- Image Processing and Intelligent Control Key Laboratory of Education Ministry of China, School of Artificial Intelligence and Automation, Huazhong University of Science and Technology, Wuhan, China → 2
- Key Laboratory of Image Information Processing and Intelligent Control, School of Artificial Intelligence and Automation, Huazhong University of Science and Technology, Wuhan, China → 2
- Key Laboratory of Image Processing and Intelligent Control of Education Ministry, School of Artificial Intelligence and Automation, Huazhong University of Science and Technology, Wuhan, China → 2
- Key Laboratory on Image Information Processing and Intelligent Control of Ministry of Education, School of Artificial Intelligence and Automation, Huazhong University of Science and Technology, Wuhan, China → 2
- Engineering Research Center of Autonomous Intelligent Unmanned Systems, Key Laboratory of Image Processing and Intelligent Control, School of Artificial Intelligence and Automation, Huazhong University of Science and Technology, Wuhan, China → 1
School of Electrical and Electronic Engineering, Nanyang Technological University, Singapore → 69
- School of Electrical and Electronic Engineering, Nanyang Technological University, Singapore, Singapore → 22
- Delta-NTU Corporate Laboratory for Cyber-Physical Systems, School of Electrical and Electronic Engineering, Nanyang Technological University, Singapore → 3
- Department of School of Electrical and Electronic Engineering, Nanyang Technological University, Singapore → 2
Note: for the first 30 most frequent affiliations, variants containing abbreviations in parentheses and differences in word case were not found.
Considering the above, we compile Table 3 as follows: the number of matches was checked by a direct search for the shortest spelling of the affiliation, e.g., ‘School of Artificial Intelligence and Automation, Huazhong University of Science and Technology, Wuhan, China’, Two values were calculated: the number of records in which the affiliation spelling occurred (reflecting the number of publications with this affiliation N2) and the total number of occurrences of the affiliation (reflecting the number of authors with this affiliation N1).

Table 3.
Top 30 examples of frequently occurring affiliations.
| Author Affiliations | N1 | N2 |
|---|---|---|
| School of Electrical and Information Engineering, The University of Sydney, Sydney, NSW, Australia | 102 | 38 |
| School of Artificial Intelligence and Automation, Huazhong University of Science and Technology, Wuhan, China | 151 | 58 |
| School of Electrical and Electronic Engineering, Nanyang Technological University, Singapore | 96 | 54 |
| Department of Electrical Engineering, Tsinghua University, Beijing, China | 84 | 38 |
| School of Computer Science and Engineering, Nanyang Technological University, Singapore | 61 | 31 |
| College of Electrical Engineering, Zhejiang University, Hangzhou, China | 52 | 27 |
| State Key Laboratory of Networking and Switching Technology, Beijing University of Posts and Telecommunications, Beijing, China | 52 | 14 |
| Department of Energy Technology, Aalborg University, Aalborg, Denmark | 50 | 27 |
| Department of Electrical and Computer Engineering, Texas A&M University, College Station, TX, USA | 48 | 21 |
| College of Electrical and Information Engineering, Hunan University, Changsha, China | 47 | 20 |
| Pacific Northwest National Laboratory, Richland, WA, USA | 64 | 15 |
| School of Electrical Engineering, Southeast University, Nanjing, China | 44 | 20 |
| State Key Laboratory of Alternate Electrical Power System with Renewable Energy Sources, North China Electric Power University, Beijing, China | 44 | 15 |
| China Electric Power Research Institute, Beijing, China | 65 | 33 |
| College of Artificial Intelligence, Nankai University, Tianjin, China | 54 | 13 |
| College of Electrical Engineering, Sichuan University, Chengdu, China | 41 | 15 |
| College of Electrical Engineering and New Energy, China Three Gorges University, Yichang, China | 40 | 12 |
| College of Energy and Electrical Engineering, Hohai University, Nanjing, China | 39 | 12 |
| School of Electrical Engineering, Northeast Electric Power University, Jilin, China | 37 | 15 |
| IBM T. J. Watson Research Center, Yorktown Heights, NY, USA | 36 | 4 |
| School of Control and Computer Engineering, North China Electric Power University, Beijing, China | 38 | 18 |
| School of Electrical, Computer and Energy Engineering, Arizona State University, Tempe, AZ, USA | 39 | 15 |
| School of Artificial Intelligence, University of Chinese Academy of Sciences, Beijing, China | 36 | 10 |
| State Key Laboratory of Management and Control for Complex Systems, Institute of Automation, Chinese Academy of Sciences, Beijing, China | 34 | 10 |
| Department of Computer Science and Engineering, Institute of Technology, Nirma University, Ahmedabad, Gujarat, India | 33 | 7 |
| Department of Electrical Engineering, Shanghai Jiao Tong University, Shanghai, China | 41 | 17 |
| Department of Electronic and Electrical Engineering, University of Bath, Bath, U.K. | 39 | 13 |
| School of Electric Power Engineering, South China University of Technology, Guangzhou, China | 33 | 13 |
| School of Electrical and Information Engineering, Tianjin University, Tianjin, China | 38 | 18 |
| State Key Laboratory for Management and Control of Complex Systems, Institute of Automation, Chinese Academy of Sciences, Beijing, China | 35 | 16 |
The data shows the dominance of Chinese affiliations in the table: China → 20 lines, followed by the U.S. → 4 lines, Singapore → 2, U.K., Australia, India, Denmark → 1.
A well populated ‘Author Affiliations’ field in the bibliometric data of IEEE Xplore platform allows for other studies, such as tracking scholarly collaborations by matching author affiliations. But this is beyond the scope of this study.
Main Topics of Institutions
In order to assess the predominant themes of the institutions, the ‘IEEE Terms’ were used. The choice of ‘IEEE Terms’ is due to their normalized spelling and peer review, unlike the Author keywords, which require preprocessing, such as lemmatization and the use of a list of synonyms.
The data in Table 3 were used as queries on the ‘Author Affiliations’ field of the general table of exported data. The query results defined ‘IEEE terms’ corresponding to this affiliation.
Alluvial diagrams are a handy way many-to-many mapping data such as ‘Author Affiliations’ and ‘IEEE terms’. To construct it, we need to build a correspondence table ‘Author Affiliations’ and ‘IEEE terms’. In order to place Alluvial diagrams in the article, the number of entries in the table has to be reduced, since even for the first 10 affiliations from Table 3, the total occurrence of ‘IEEE Terms’ was 2262 results. Of these, 608 were unique terms. For such a large number of terms Alluvial diagram for a printed article cannot be built, it is necessary to select the terms. The easiest way is to use the frequency of occurrence of terms from the total list of 2263 results and select the top 30 terms from them. The list of such terms is shown in Table 4.
Main Topics of Journals
Of particular interest to experts may be the subject matter of the journals represented in IEEE Xplore on the topic under study ( ‘Machine Learning OR Artificial Intelligence for Power Systems OR Energy Systems’ ‘Machine Learning OR Artificial Intelligence for Power Systems OR Energy Systems’) expressed in ‘IEEE Terms’. Such knowledge can simplify query composition using ‘IEEE Terms’, e.g., (‘IEEE Terms’:Random forest).
A total of 179 unique values occur in the ‘Publication Title’ field in the sample examined, the 30 with the highest number of articles are presented in Table 5.
For the top 10 journals from Table 5, their subject matter expressed in the most frequent ‘IEEE Terms’ was determined. These 10 journals represent 2,943 entries out of a total of 5,000. The converted file containing one ‘IEEE Terms’ per line contains 21709 entries and 1654 unique ‘IEEE Terms’. The top 30 of them are shown in Table 6.
Of the terms in the main query: ‘Machine learning’ → 477 occurs more often than ‘Artificial intelligence’ → 228. ‘Power system stability’ → 261 and ‘Power systems’ → 153 indicate that in this topic the term ‘Power systems’ and its combinations are more common than ‘Energy systems’. For the terms Deep learning → 263 and Reinforcement learning → 141 a separate study is advisable.
The Alluvial diagram shown in Figure 3 is constructed for the top 10 journals and the 30 most frequent ‘IEEE Terms’ in them.
In the journal list, the full title, ‘IEEE Transactions on Circuits and Systems I: Regular Papers’, is replaced by the short one, ‘IEEE Transactions on Circuits and Systems’.
As an alternative Alluvial diagram data can be presented as pivot Table 7.
The use of Alluvial diagram or Pivot table depends on the task at hand and personal preference.
Using the VOSviewer program for clustering ‘IEEE Terms’
‘IEEE Terms’ can be used similarly to Scopus Index Keywords to identify the subject matter of the collected bibliometric data using the VOSviewer program.
Figure 4 shows the clustering of ‘IEEE Terms’. The graph is constructed with the following parameters: total unique ‘IEEE Terms’ - 2608 of them 918 occur 5 or more times, the co-occurrence network is constructed for 400 terms in the highest total strength. At the same time, 5 clusters were obtained and visualized using the LinLog/modularity algorithm.
The most common “IEEE Terms” for all 5 clusters are summarized in Table 8.
Table 9 presents the top 10 ‘IEEE Terms’ for each of the 5 clusters. These terms reveal the main themes of the clusters.
The trend of change in the topics of publications described by the terms of each cluster over time can be assessed by comparing the data in Table 9 and Table 10, which presents the terms most frequently occurring in new publications. The assessment was made by the parameter Avg.pub.year, which reflects the average year of the publication in which the term appears.
Using the combination of terms from the two tables it is possible to actualize queries for publlications described by terms from each cluster.
For example, for the term ‘machine learning’ of the first cluster, the relevant issues can be represented by the terms: accuracy, computational efficiency, random forests, and for the term ‘predictive models’ of the fifth cluster from Table 9 by the terms ‘long short term memory’ and ‘transformers’.
Another important criterion for selecting terms to identify relevant research topics may be the citation rate of publications with “IEEE Terms” in their bibliometric records. According to the VOSviewer guidelines, this indicator is proposed to be evaluated by the parameter Avg.norm.citations - average normalized citations. The data for the top 10 ‘IEEE Terms’ for each of the 5 clusters with the highest Avg.norm.citations are presented in Table 11.
Example of using terms from the three tables for the first cluster: feature extraction, computational efficiency, signal processing algorithms, intrusion detection. For the fourth cluster, an interesting topic can be described by the terms: power system stability, mathematical models, nonlinear dynamical systems, frequency control.
Considering that "a picture is worth a thousand words" [https://en.wikipedia.org/wiki/A_picture_is_worth_a_thousand_words], we use the terms presented in Table 9, Table 10 and Table 11 and their parameters to graphically display the network of these terms in the coordinates Avg.pub.year and Avg.norm.citations using the program Scimago Graphica. The results are shown in Figure 5, Figure 6, Figure 7, Figure 8 and Figure 9.
There are repetitions in Table 9, Table 10 and Table 11, for example, a term may be “highly cited” and “frequently occurring”. Such repetitions were removed when constructing the graphs, so that fewer than 30 datasets were actually used for construction - 28 to 26.
In the fourth and largest cluster in Figure 5, the term ‘transfer learning’ is found in new publications and has a relatively high citation rate compared to the terms in this cluster. Here is a publication in which this term appears in a quote: “this article proposes a novel phasor measurement unit (PMU) measurements-based STVSA method by using deep transfer learning"[10]. In the third cluster, the topic described by the terms ‘intrusion detection’ and ‘accuracy’ described by the quotation from the publication [11] may be of interest: “Cyber intrusion detection systems ... power system protection schemes. The accuracy and time to detect cyber attacks ... are two key factors for reliable ... smart grids.” For the terms ‘pipelines’ and ‘computational efficiency’, we can suggest the paper [12] with the quote, “In this paper ... a computationally efficient framework ... to rank the importance of filters and thus converting a three-step pipeline”
Let’s take the non-obvious combination of terms — metaheuristics and q-learning for which an interesting publication can be found [13]. Explanatory quote from the abstract: "Embedding Q-Learning in the selection of metaheuristic operators..." .
The terms ‘digital twins’ and ‘federated learning’ reflect the topical aspect of learning models without violating data privacy, an example of such an approach is presented in the paper [14]. Explanatory quote from the abstract: "Federated learning (FL) based digital twin (DT) model framework could be seen as an emerging paradigm to avoid large communication loads and high data leakage".
For the terms ‘regulation’ and ‘mathematical models’ a quote can be given"... voltage regulation applications ... based on a developed mathematical model to control the output voltage ..." from the article [15].
The fourth cluster’s emerging theme (Figure 9), expressed in terms ‘transformers’ and ‘long short term memory’ can be represented by a quote"Incipient Faults in Power Transformers ... Bi-Directional Long Short-Term Memory Network" from the article [16].
Convex hull chart for ‘IEEE Terms’ as an indicator of Research fronts
Research fronts form when a small fraction of previous publications are cited in new ones, indicating common concepts, hypotheses, experimental data, or methods in similar articles [https://clarivate.com/cis/blog/research_fronts_2021].
Definition: IEEE Terms — Keywords assigned to IEEE journal articles and conference papers from a controlled vocabulary created by the IEEE [https://ieeexplore.ieee.org/Xplorehelp/searching-ieee-xplore/command-search#summary-of-data-fields]. That is, a dictionary compiled by experts based on the use of terms in already published works, meaning these terms have been widely used in publications from previous years.
To determine something similar to a research front, but not based on publications, rather on ‘IEEE Terms’, one can do it as follows — select the terms with the highest average citation rates and display them in the coordinates of Avg.pub.year and Avg.norm.citations in the form of a ‘Convex hull chart’. The diagram for the top 30 ‘IEEE Terms’ from all clusters is presented in Figure 10.
The right border of the green area can be interpreted as the actual thematic front described by the terms: ‘medical services’, ‘manufacturing’, ‘6g mobile communication’, ‘array signal processing’, ‘privacy’, ‘wireless communication’.
If using modern search engines for scientific publications, for example, scite.ai, it is possible to get a proposal for a highly cited article that best reflects the topic described by the above terms. Unlike ‘classical’ search, where the output must match the terms in the query with logical operators, in AI search the output indicates that the article is more likely to be ‘relevant’ to the terms listed compared to other publications. An example of such an article is [17], suggested by scite.ai for the set of terms listed above, but containing only the terms ‘6g’ and ‘wireless communication’ in the title and abstract, but due to the review nature of the article it may be useful in a broader context relevant to the terms listed.
Figure 11 shows the 30 ‘IEEE Terms’ with the highest ‘Total Link Strength’, i.e. the terms most frequently co-occurring with other terms. Such terms can be seen as reflecting the overall context of the topic at hand. An interesting query can be composed of terms reflecting the general context (field of application) and, for example, terms with high citation rates, which may reflect the relevance of the issue under study.
There is a significant difference between Figure 10 and Figure 11. In the latter, the term ‘mathematical models’ is found in new publications, while in highly cited articles the term refers to the dominance of earlier publications.
In contrast to Figure 11, which contains frequently co-occurring terms, a ‘Convex hull chart’ can be constructed for rarely co-occurring terms, see Figure 12.
In our context, ‘nonlinear dynamical systems’ and ‘observers’ rarely co-occur with other terms. But in a general search for the terms ‘nonlinear dynamical systems’ and ‘observers’, a search for ‘(‘All Metadata’:nonlinear dynamical systems) AND (‘All Metadata’:observers)’ for 2020-2024 yields 5,736 results; Conferences (3,789) and Journals (1,875). Thus in a broad context this topic is relevant. For example, the article [18] has been cited 205 times (current as of August 20, 2024). A quote revealing the content of the publication "A new approach to the design of nonlinear disturbance observers (DOBs) for a class of nonlinear systems described by input-output differential equations is presented in this paper".
It can be seen that the topic studied in this paper and the topic described by the terms ‘nonlinear dynamical systems’ and ‘observers’ have little overlap, but the topics themselves are extensive. In such cases, by looking closely at their intersection, it is possible to formulate a promising problem that is not yet well represented in publications but has the potential for development. For example, for the ‘observers for nonlinear dynamical systems’ problem, one can explore the use of ‘Machine learning’ to find the optimal parameters of ‘observers for nonlinear dynamical systems’ and ‘nonlinear dynamical systems’ can be narrowed down to ‘Power Systems OR Energy Systems’.
Applying the FP-growth algorithm to detect co-occurrence of ‘IEEE Terms’
As the previous analysis showed, it is most interesting to create queries containing multiple terms. The use of multiple term co-occurrence estimation can be accomplished using the well-known FP-growth algorithm. Figure 13 shows the result of applying this algorithm to identify the co-occurrence of ‘IEEE Terms’ in the records with the highest citations as an Alluvial diagram. Records with 20 or more citations from the ‘Article Citation Count’ column were used. Individual words in ‘IEEE Terms’ are joined by underscores.
‘Load modeling’, ‘Deep learning’, ‘Forecasting’ and ‘Predictive models’ — an example of the co-occurrence of four ‘IEEE Terms’ in highly cited records. The 2021 article [19], cited 143 times (current as of August 21, 2024) found in IEEE Xplore by request ‘("All Metadata":’Load modeling’) AND ("All Metadata":’Predictive models’) AND ("All Metadata":’Forecasting’) AND ("All Metadata":’Deep learning’)’ can serve as an example of a publication revealing the topic described by these terms.
The results presented in Figure 13 can be compared with those for 2024 with citations, see Figure 14.
Figure 14 displays the dominant theme described by the terms: ‘Microgrids’ ‘Optimization’ ‘Renewable energy sources’ ‘Costs’. Example of a publication disclosing this topic [20] and corresponding to the query: ‘("All Metadata":Microgrids) AND ("All Metadata":Costs) AND ("All Metadata":Renewable energy sources) AND ("All Metadata":Optimization)’. A quote revealing the topic: "The generation sources of a microgrid system mainly include distributed generators and renewable energy sources. The improved artificial bee colony (ABC) algorithm is proposed to solve this generation cost optimization."
Hierarchical clustering of ‘IEEE Terms’
Hierarchical clustering is the most easily interpretable clustering algorithm.
The plots shown in Figure 15 and Figure 16 are obtained using Multidendrograms-5.2.1 with clustering parameters: Type of measure → Similarity; Precision → 3; Clustering algorithm → ‘Beta Flexible’ and ‘Weighted’. Inkscape was used to add color to the dendrograms. The co-occurrence of ‘IEEE Terms’ was determined using the FP-growth utility.
The analysis of these dendrograms allows us to compare the overall co-occurrence of terms and the terms co-occurrence inherent in the most cited publications.
These dendrograms allow us to compare the total co-occurrence of ‘IEEE Terms’ and ‘IEEE Terms’ inherent in the most cited publications.
Conclusions
IEEE Xplore provides open, exportable, very high quality data that includes fields: ‘Document Title, Authors, Author Affiliations, Publication Title, Publication Year, Abstract, DOI, Funding Information, Author Keywords, IEEE Terms, Mesh_Terms, Article Citation Count, Patent Citation Count, Reference Count, Publisher’, allowing for detailed bibliometric analysis. The exception to this is the absence of a field ‘Reference’. If necessary, the ‘Reference’ field can be taken from another open reference database, e.g. The Lens.
The results of the analysis presented in this paper show that the lack of built-in and open source analytical tools in the IEEE Xplore platform can be overcome by using free software that allows bibliometric analysis and visualization of the results obtained.
The use of the IEEE Terms field data to identify field-specific publication topics in the exported data was most fully analyzed.
This paper can also be considered as a recommendation for professionals interested in bibliometric analysis of IEEE Xplore data.
References
- X. Li, D. Lepour, F. Heymann, and F. Maréchal, ‘Electrification and digitalization effects on sectoral energy demand and consumption: A prospective study towards 2050’, Energy, vol. 279, p. 127992, Sep. 2023. [CrossRef]
- H. Housni, N. Majit, N. Amrous, N. Daoudi, and M. J. Malzi, ‘Energy transition and digitalization: Small modular reactors and smart grids’, in 2023 7th IEEE Congress on Information Science and Technology (CiSt), Agadir - Essaouira, Morocco: IEEE, Dec. 2023, pp. 405–410. [CrossRef]
- N. J. Van Eck and L. Waltman, ‘Software survey: VOSviewer, a computer program for bibliometric mapping’, Scientometrics, vol. 84, no. 2, pp. 523–538, Aug. 2010. [CrossRef]
- Y. Hassan-Montero, F. De-Moya-Anegón, and V. P. Guerrero-Bote, ‘SCImago Graphica: a new tool for exploring and visually communicating data’, EPI, p. e310502, Sep. 2022. [CrossRef]
- C. Borgelt, ‘Frequent item set mining’, WIREs Data Min & Knowl, vol. 2, no. 6, pp. 437–456, Nov. 2012. [CrossRef]
- A. Fernández and S. Gómez, ‘Versatile Linkage: a Family of Space-Conserving Strategies for Agglomerative Hierarchical Clustering’, J Classif, vol. 37, no. 3, pp. 584–597, Oct. 2020. [CrossRef]
- H. Yin and Z. Sun, ‘Gray Correlation Analysis of Energy Consumption, Energy Structure and Economic Growth in China’, FBEM, vol. 15, no. 3, pp. 242–247, Jul. 2024. [CrossRef]
- H. Ding, ‘Trends and Status of Renewable Energy Power Generation in China’, HSET, vol. 69, pp. 470–479, Nov. 2023. [CrossRef]
- B. Lin and S. Wang, ‘Sustainability of renewable energy in China: Enhanced strategic investment and displaced R&D expenditure’, Energy Economics, vol. 131, p. 107312, Mar. 2024. [CrossRef]
- Y. Li, S. Zhang, Y. Li, J. Cao, and S. Jia, ‘PMU Measurements-Based Short-Term Voltage Stability Assessment of Power Systems via Deep Transfer Learning’, IEEE Trans. Instrum. Meas., vol. 72, pp. 1–11, 2023. [CrossRef]
- A. Aljohani, M. AlMuhaini, H. V. Poor, and H. M. Binqadhi, ‘A Deep Learning-Based Cyber Intrusion Detection and Mitigation System for Smart Grids’, IEEE Trans. Artif. Intell., vol. 5, no. 8, pp. 3902–3914, Aug. 2024. [CrossRef]
- C. Li, Z. Wang, and H. Qi, ‘An Efficient Pipeline for Pruning Convolutional Neural Networks’, in 2020 19th IEEE International Conference on Machine Learning and Applications (ICMLA), Miami, FL, USA: IEEE, Dec. 2020, pp. 907–912. [CrossRef]
- D. Tapia et al., ‘Embedding Q-Learning in the selection of metaheuristic operators: The enhanced binary grey wolf optimizer case’, in 2021 IEEE International Conference on Automation/XXIV Congress of the Chilean Association of Automatic Control (ICA-ACCA), Valparaíso, Chile: IEEE, Mar. 2021, pp. 1–6. [CrossRef]
- Z. Wang, X. Ma, H. Zhang, and D. Yuan, ‘Communication-Efficient Personalized Federated Learning for Digital Twin in Heterogeneous Industrial IoT’, in 2023 IEEE International Conference on Communications Workshops (ICC Workshops), Rome, Italy: IEEE, May 2023, pp. 237–241. [CrossRef]
- S. G. Kanse, S. V. Malge, A. A. Rathod, and S. L. Patil, ‘Mathematical Modeling and Regulation of the High Step-up DC-DC Boost converter’, in 2022 2nd Asian Conference on Innovation in Technology (ASIANCON), Ravet, India: IEEE, Aug. 2022, pp. 1–6. [CrossRef]
- S. Das, A. Paramane, S. Chatterjee, and U. M. Rao, ‘Sensing Incipient Faults in Power Transformers Using Bi-Directional Long Short-Term Memory Network’, IEEE Sens. Lett., vol. 7, no. 1, pp. 1–4, Jan. 2023. [CrossRef]
- M. Z. Chowdhury, Md. Shahjalal, S. Ahmed, and Y. M. Jang, ‘6G Wireless Communication Systems: Applications, Requirements, Technologies, Challenges, and Research Directions’, IEEE Open J. Commun. Soc., vol. 1, pp. 957–975, 2020. [CrossRef]
- S. Ding, W.-H. Chen, K. Mei, and D. J. Murray-Smith, ‘Disturbance Observer Design for Nonlinear Systems Represented by Input–Output Models’, IEEE Trans. Ind. Electron., vol. 67, no. 2, pp. 1222–1232, Feb. 2020. [CrossRef]
- B. Farsi, M. Amayri, N. Bouguila, and U. Eicker, ‘On Short-Term Load Forecasting Using Machine Learning Techniques and a Novel Parallel Deep LSTM-CNN Approach’, IEEE Access, vol. 9, pp. 31191–31212, 2021. [CrossRef]
- D. C. Huynh, L. D. Ho, and M. W. Dunnigan, ‘Generation Cost Optimization of an Islanded Microgrid System with Distributed Generators and Renewable Energy Sources’, in 2021 IEEE 2nd International Conference on Smart Technologies for Power, Energy and Control (STPEC), Bilaspur, Chhattisgarh, India: IEEE, Dec. 2021, pp. 1–6. [CrossRef]
Figure 1.
Global investment in energy transition, by sector. Source: BloombergNEF. Energy transition investment grew 17% in 2023.
Figure 1.
Global investment in energy transition, by sector. Source: BloombergNEF. Energy transition investment grew 17% in 2023.
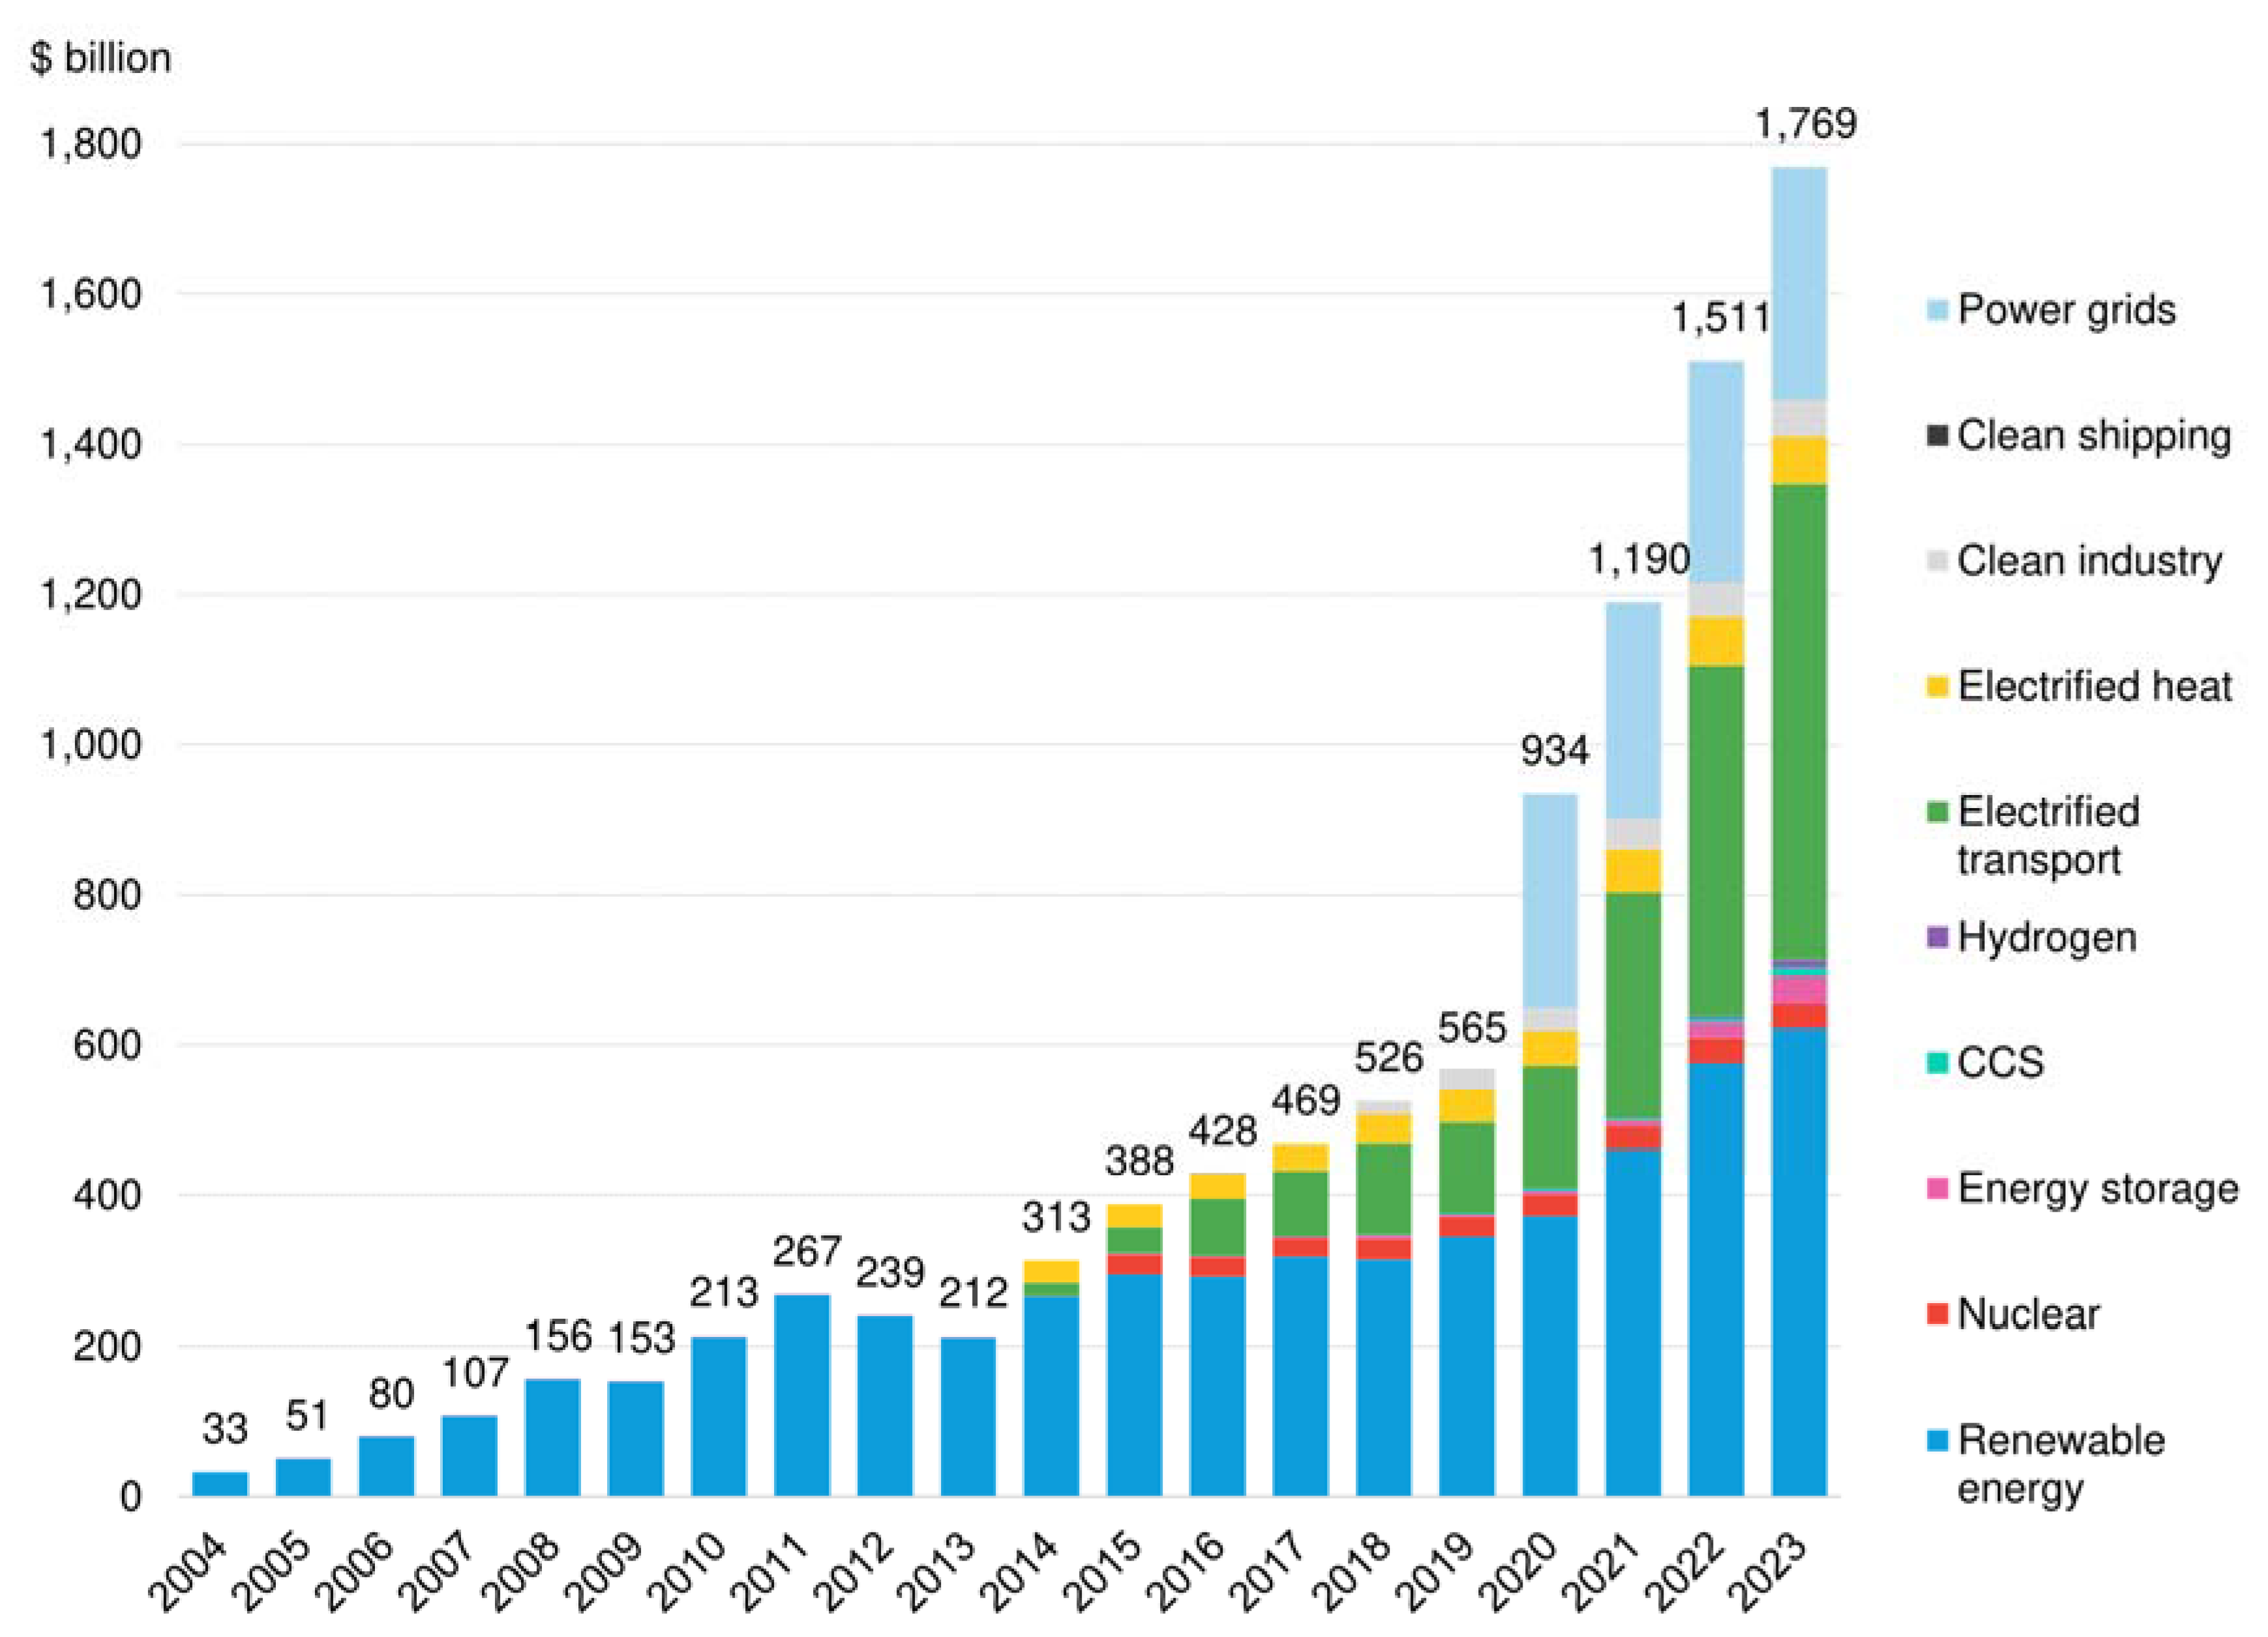
Figure 2.
Alluvial diagram for 10 affiliations and 30 ‘IEEE Terms’.
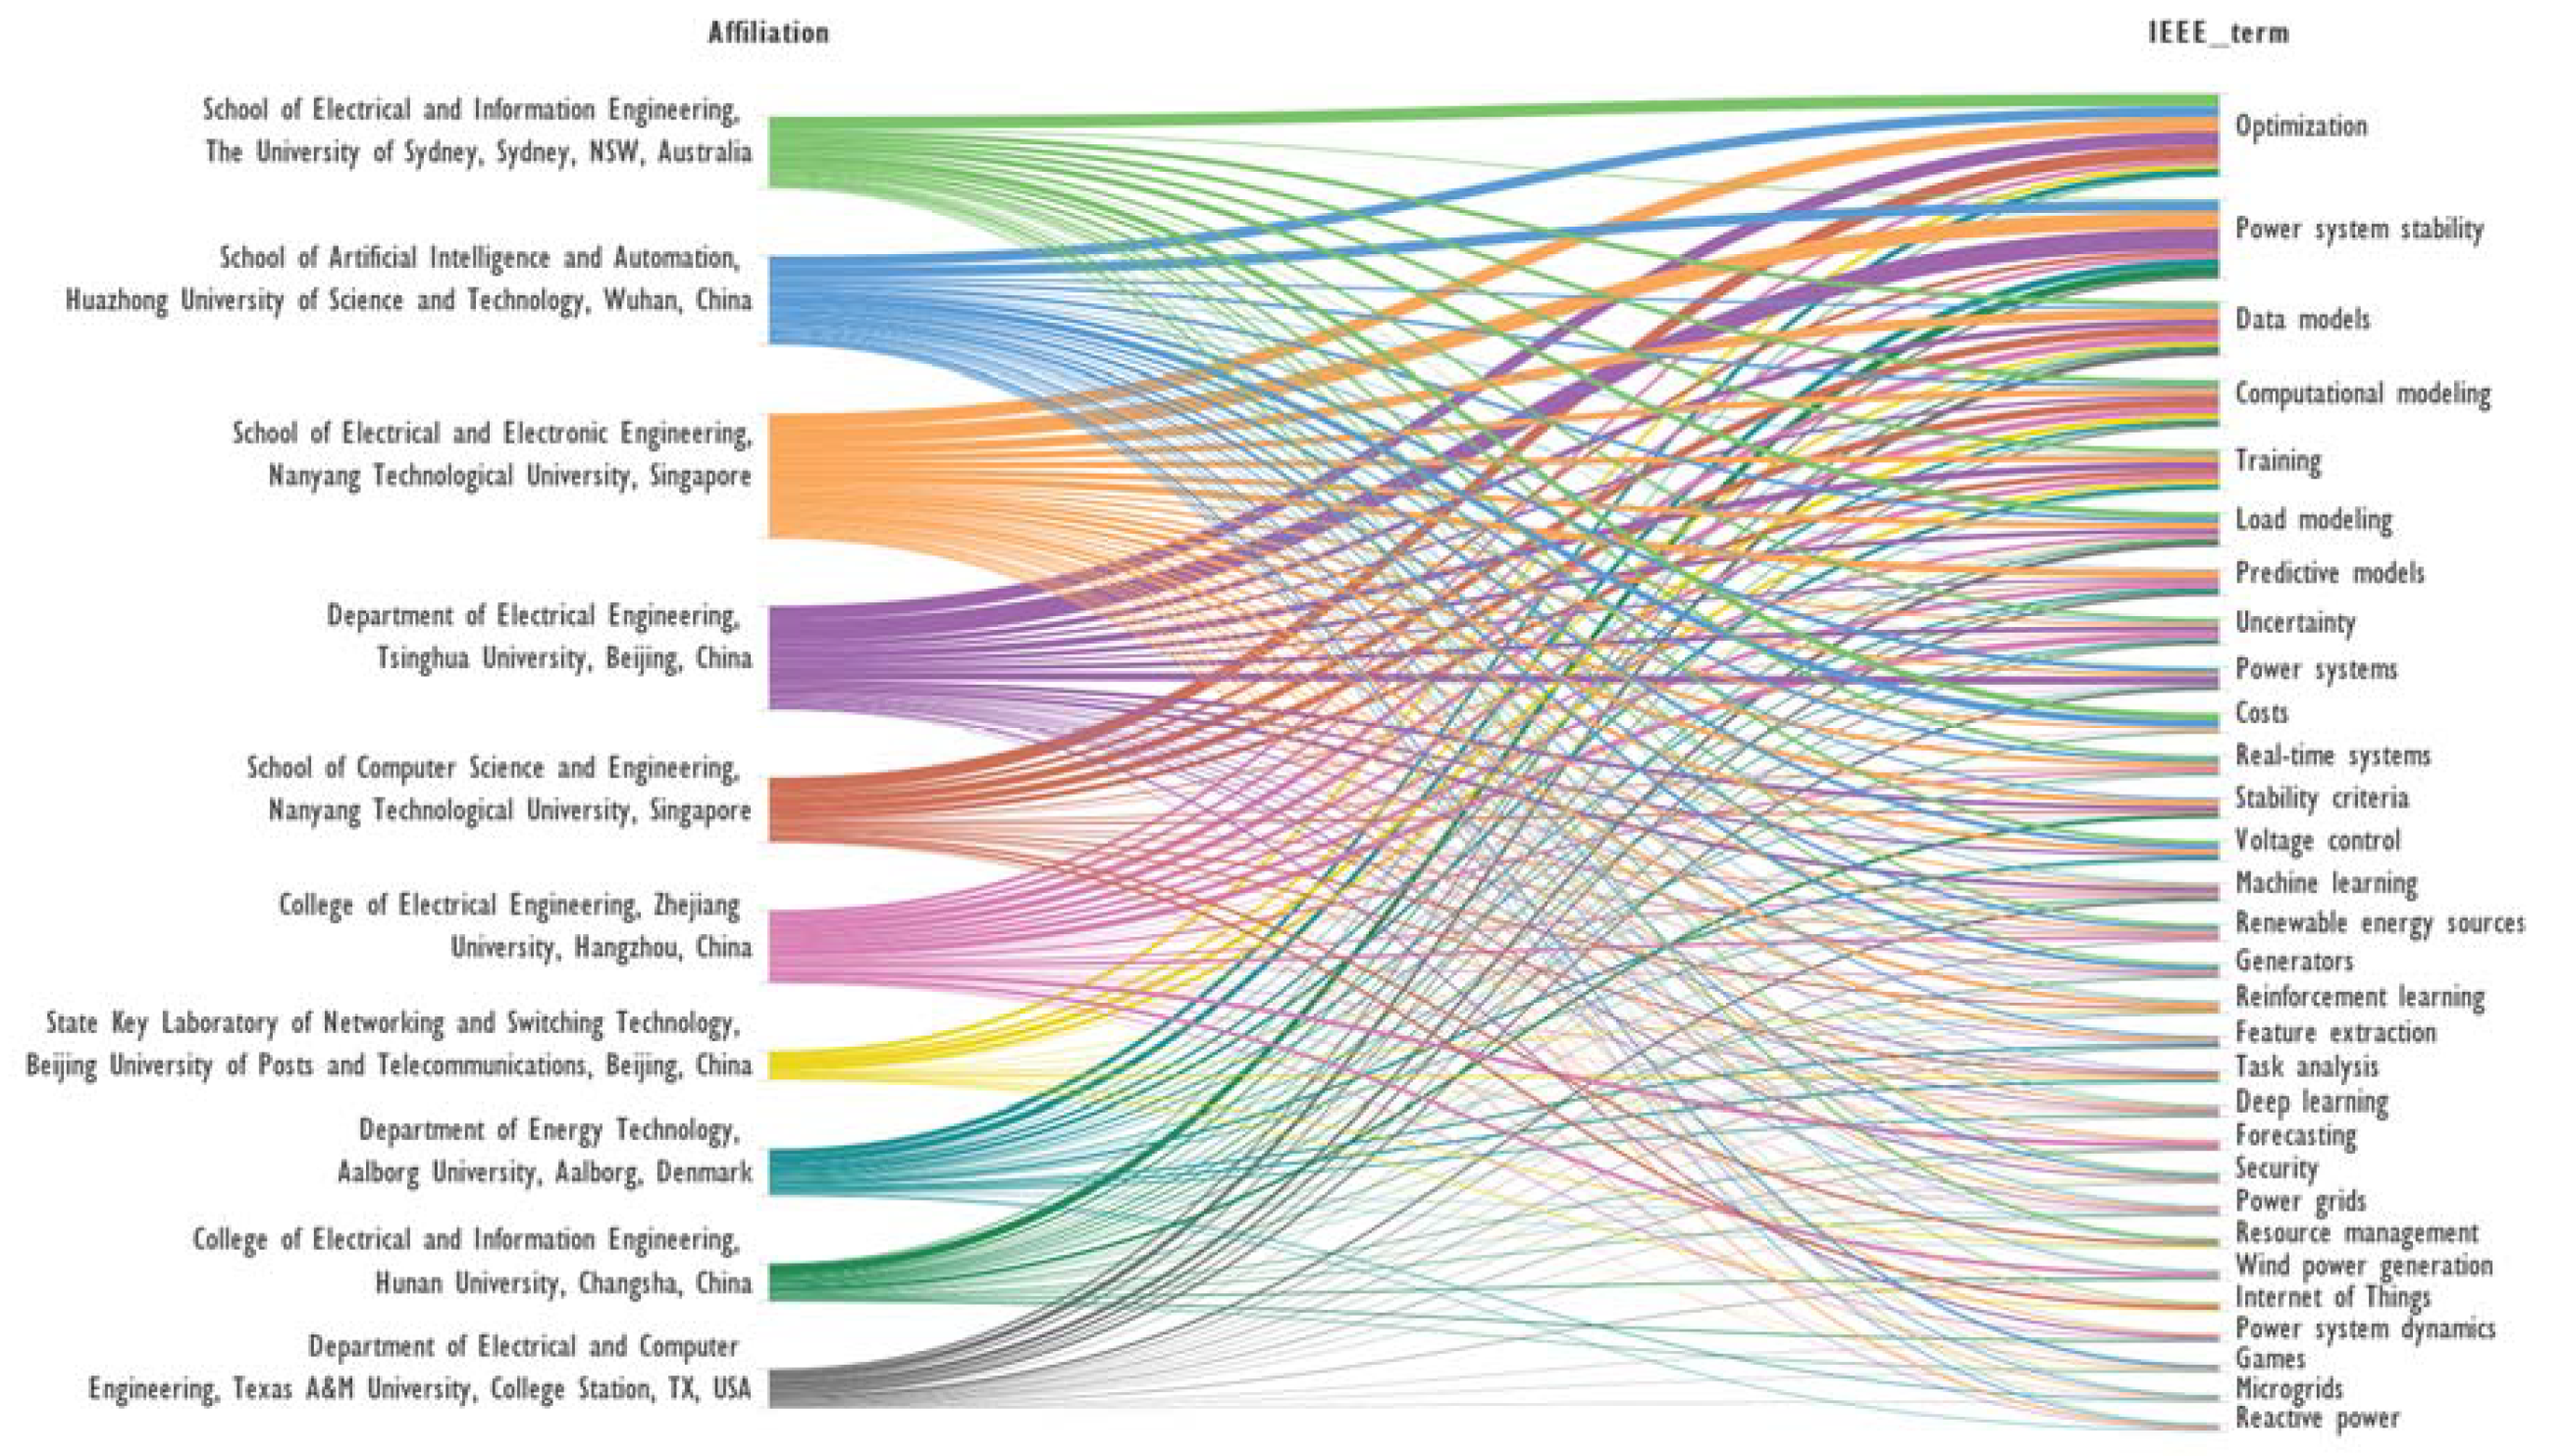
Figure 3.
Alluvial diagram for 10 journals and 30 ‘IEEE Terms’.
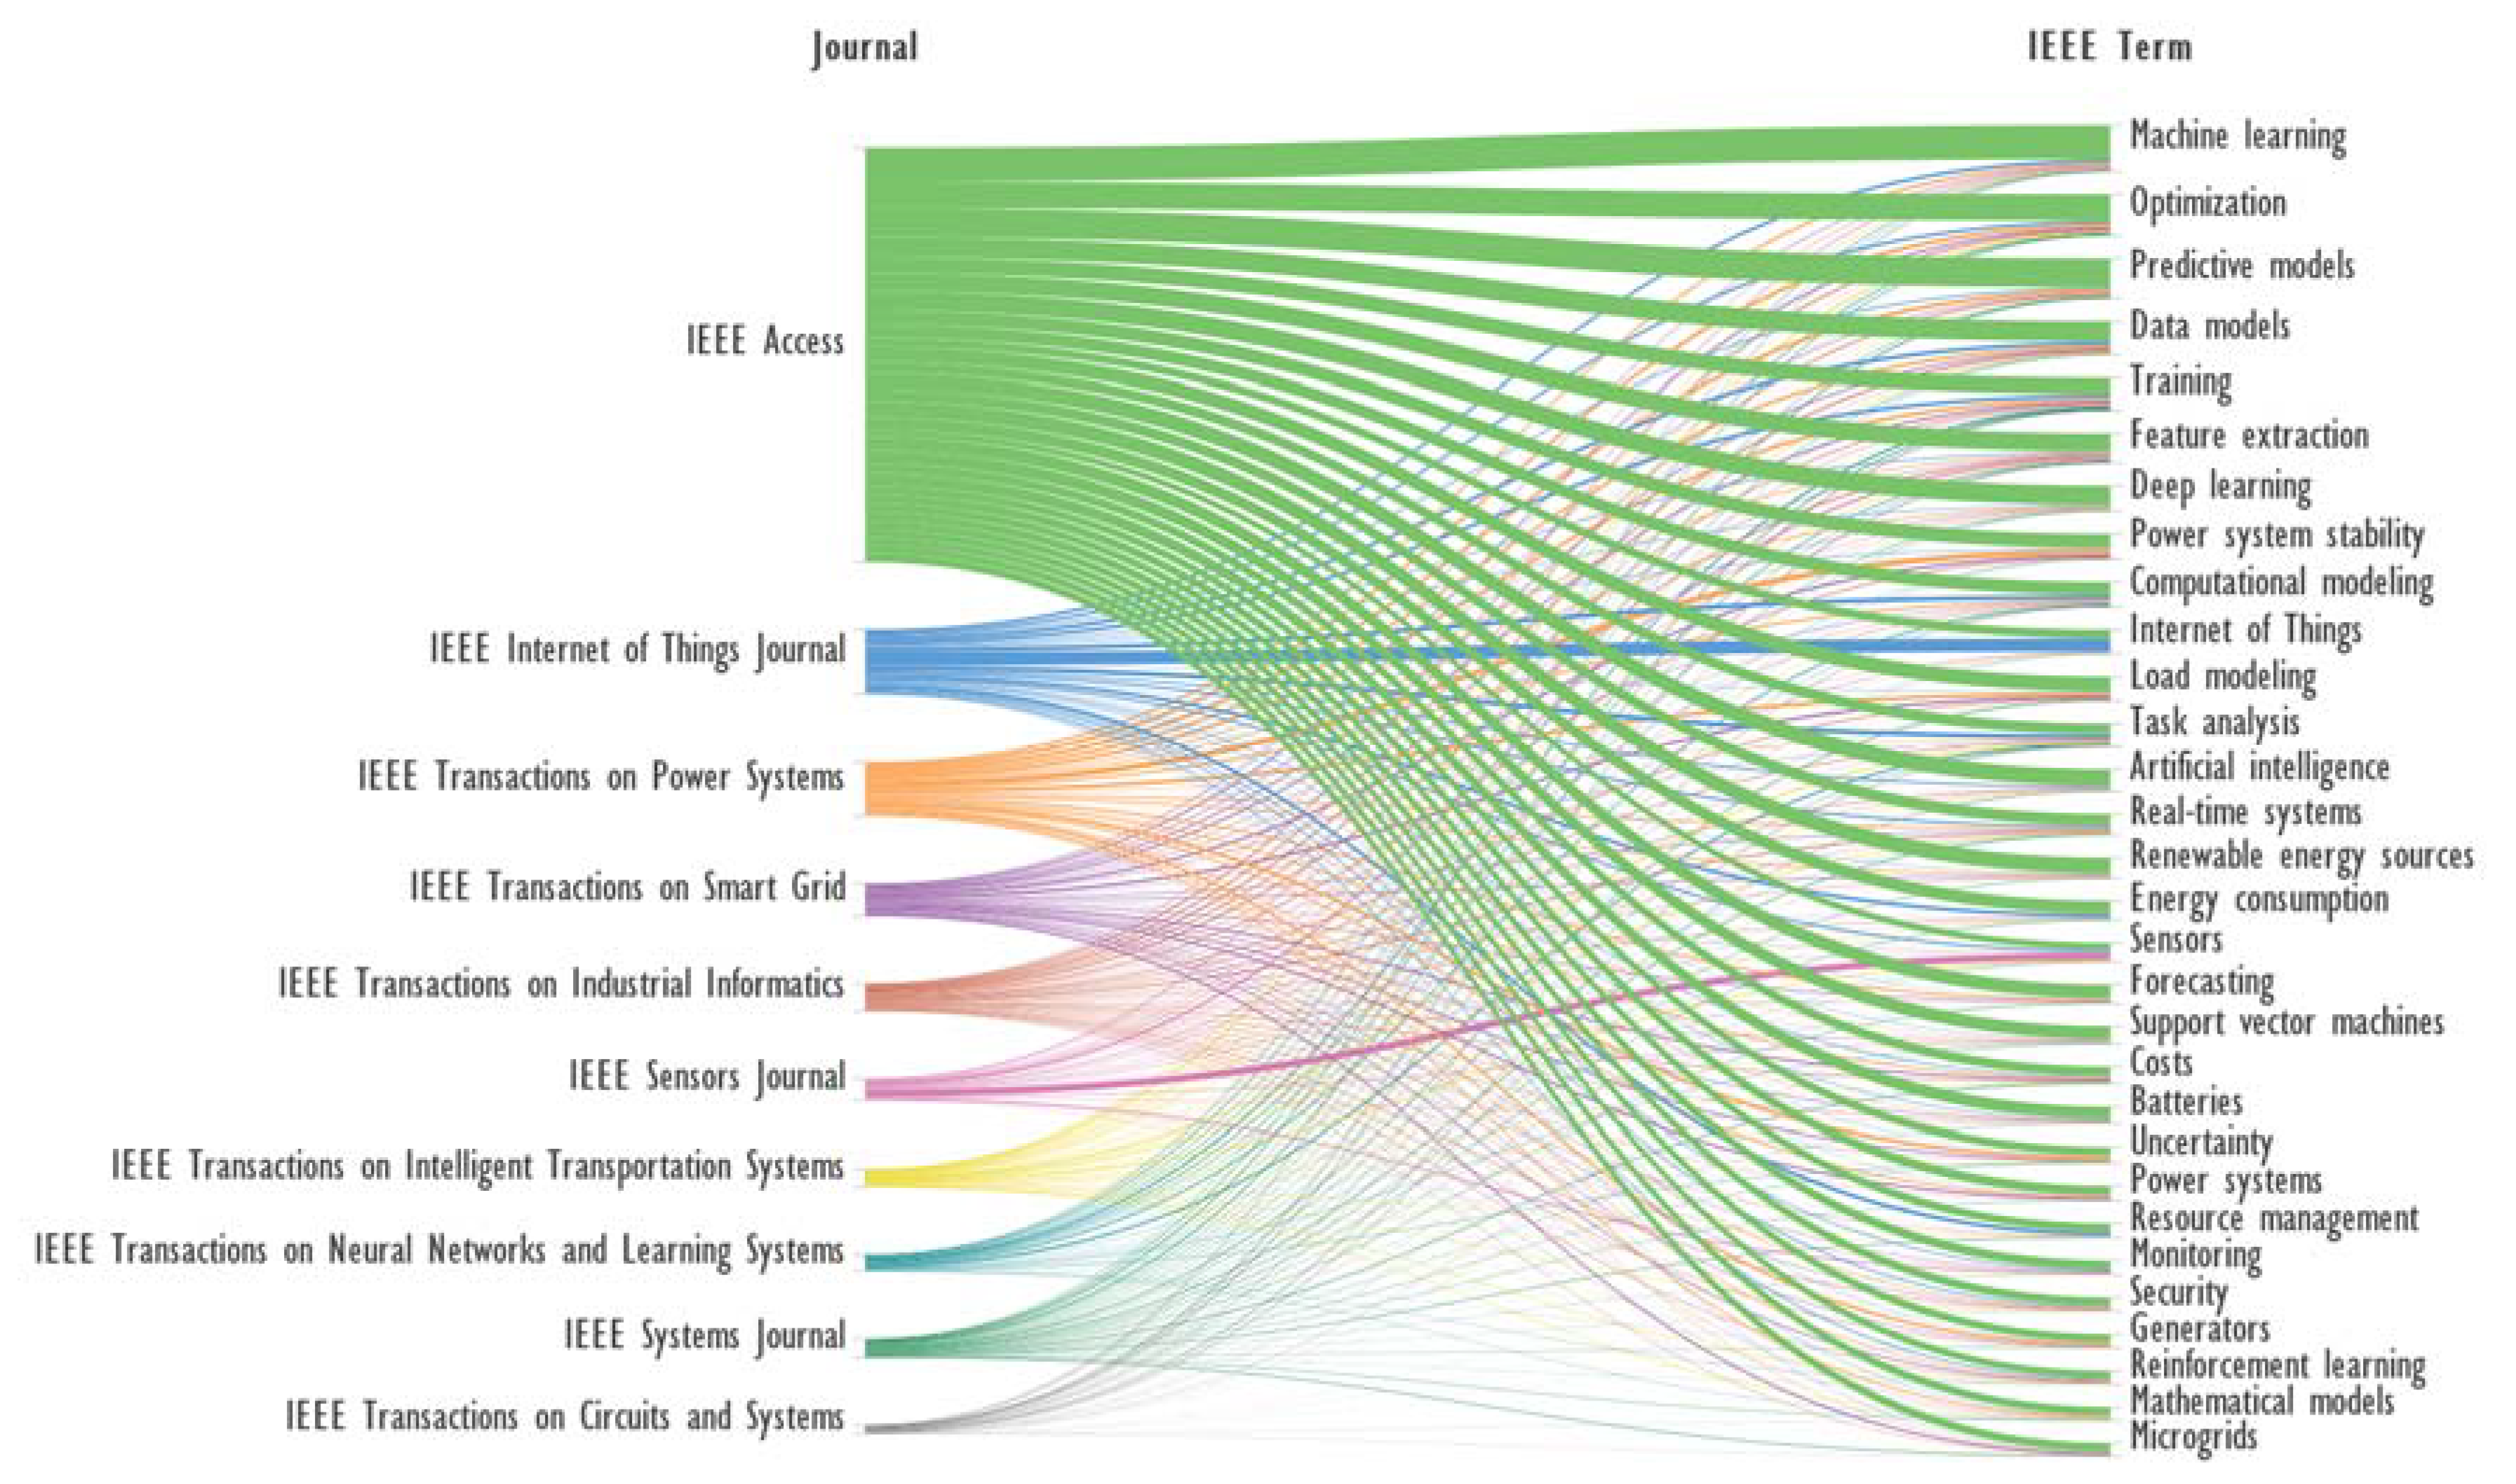
Figure 4.
Cooccurrence network of ‘IEEE Terms’ for the collected bibliometric data built using VOSviewer.
Figure 4.
Cooccurrence network of ‘IEEE Terms’ for the collected bibliometric data built using VOSviewer.
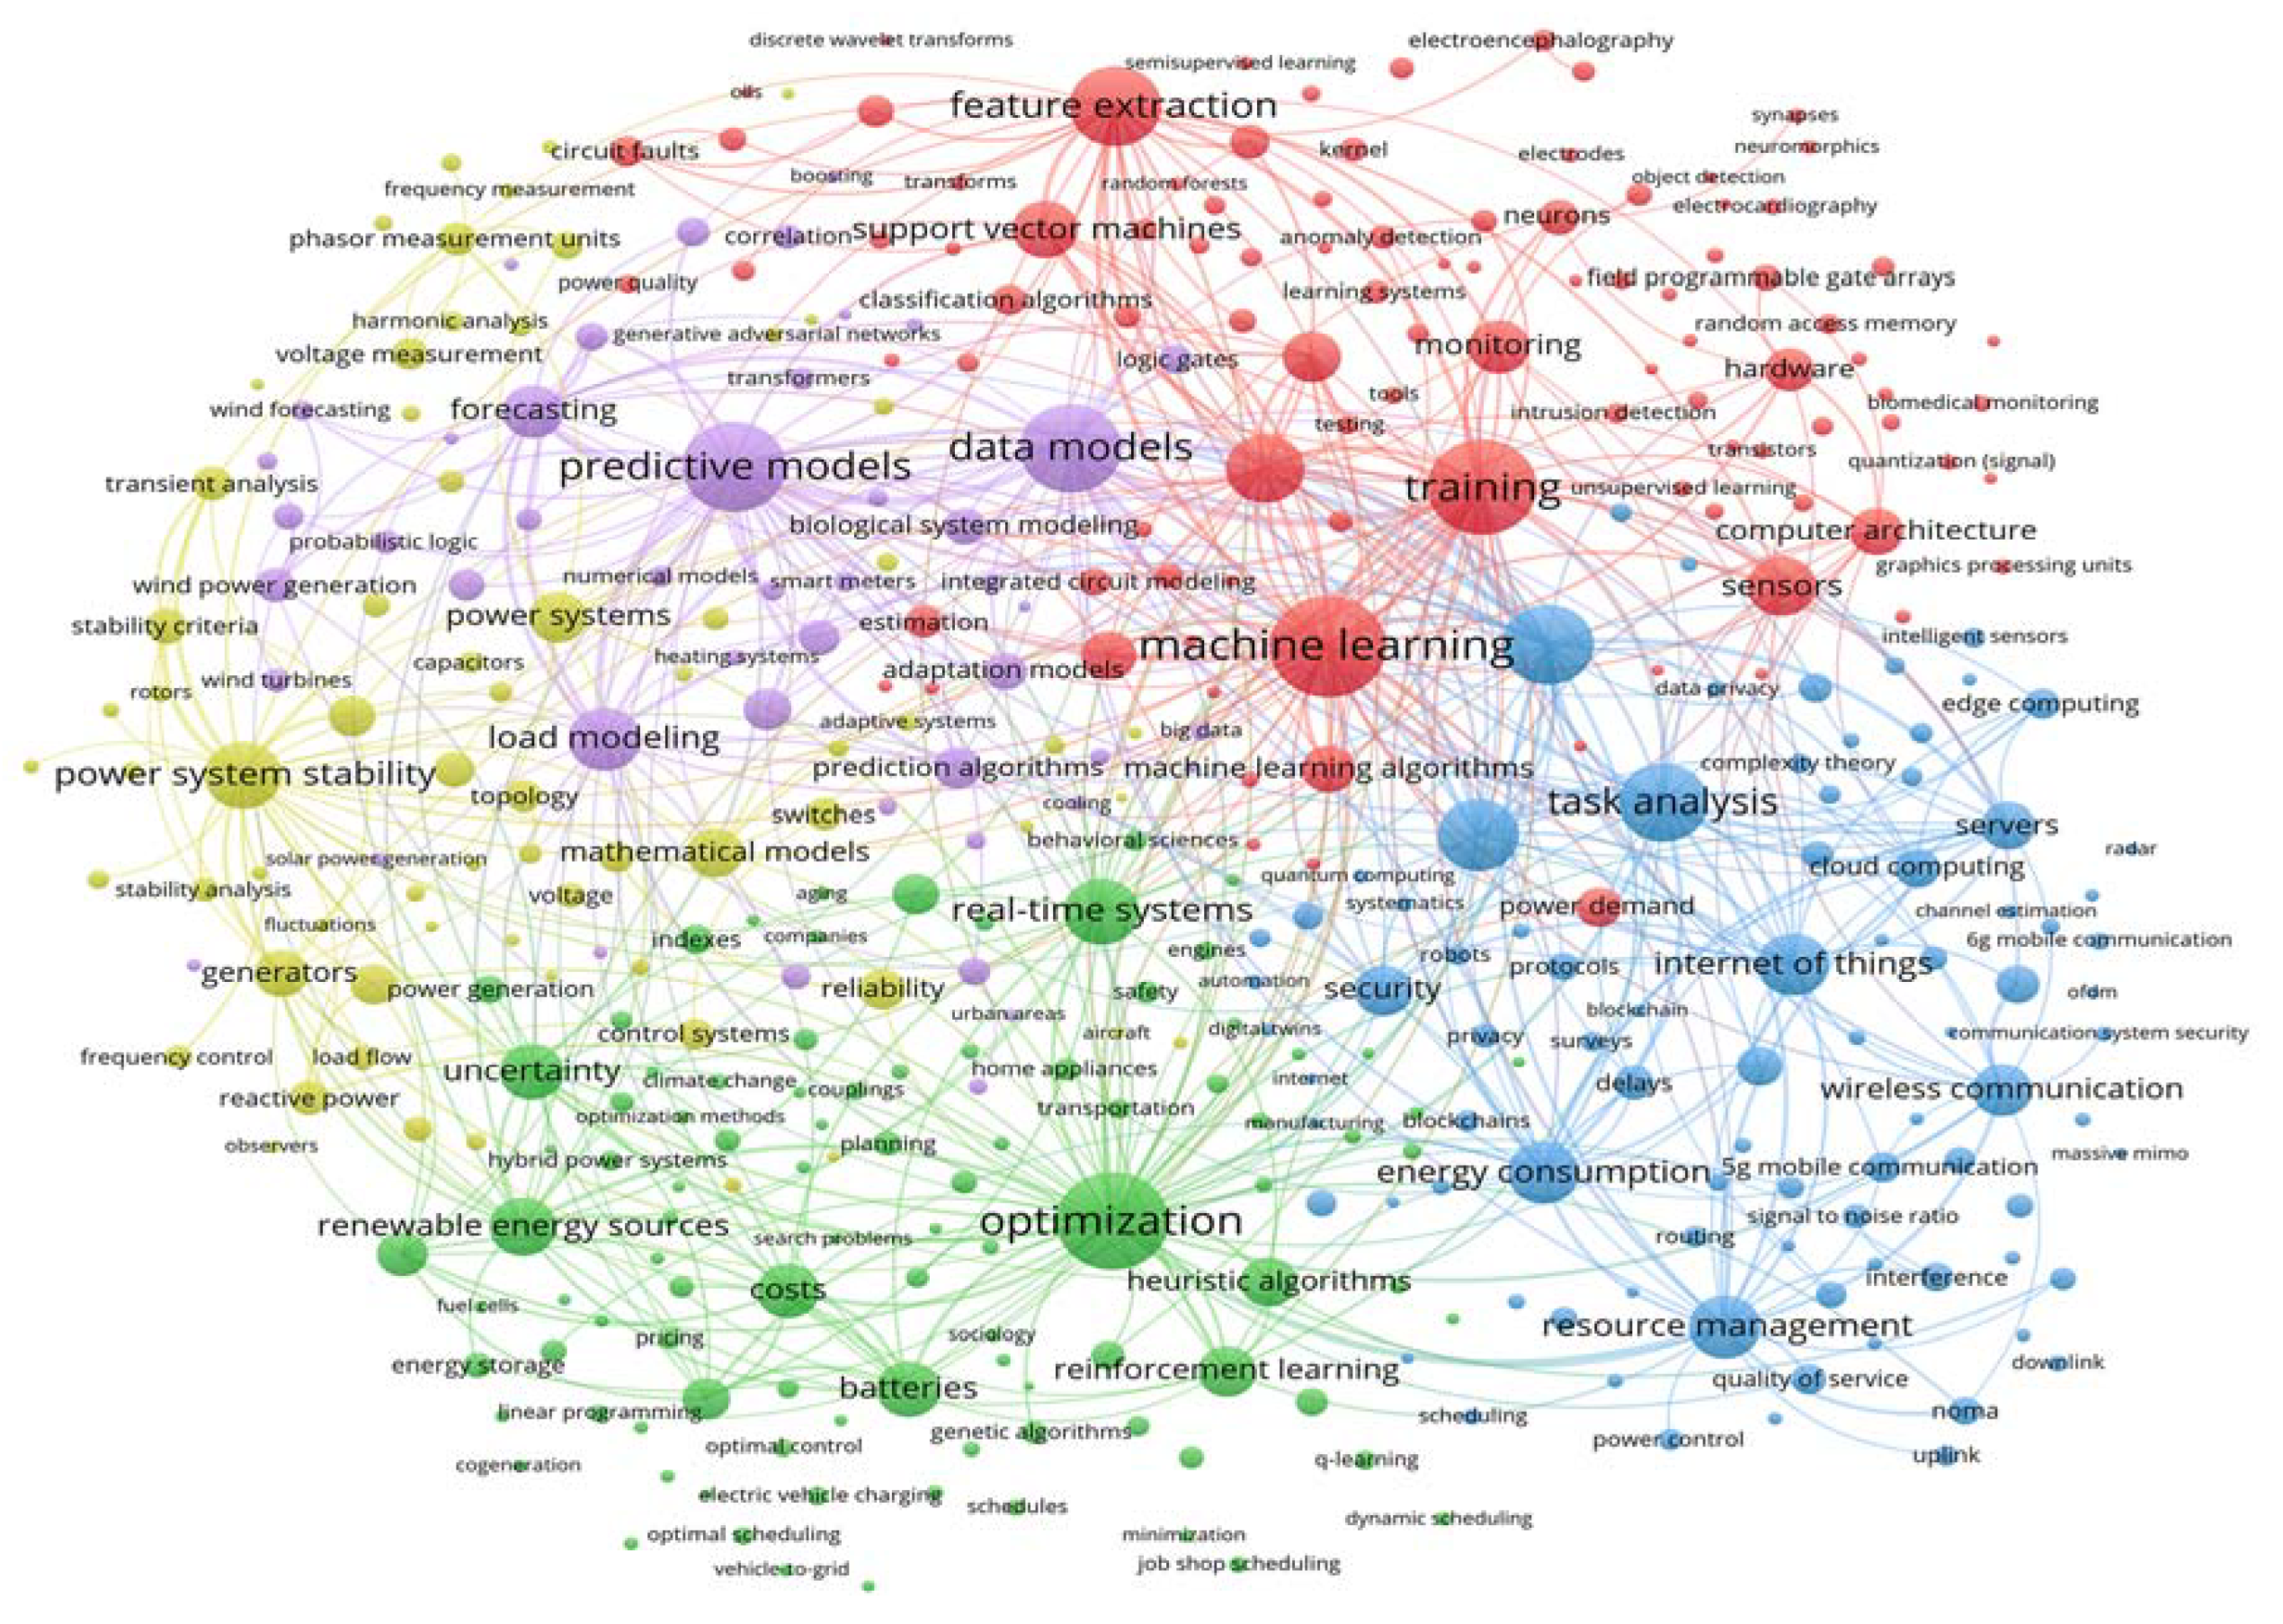
Figure 5.
Cooccurrence network of ‘IEEE Terms’ in coordinates Avg.pub.year and Avg.norm.citations for the first cluster of data from Table 9, Table 10 and Table 11. Note: For each cluster obtained by VOSviewer, ‘IEEE Terms’ were taken, and in Figure 5, Figure 6, Figure 7, Figure 8 and Figure 9, the four clusters obtained by Scimago Graphica for each cluster obtained by VOSviewer are highlighted in color.
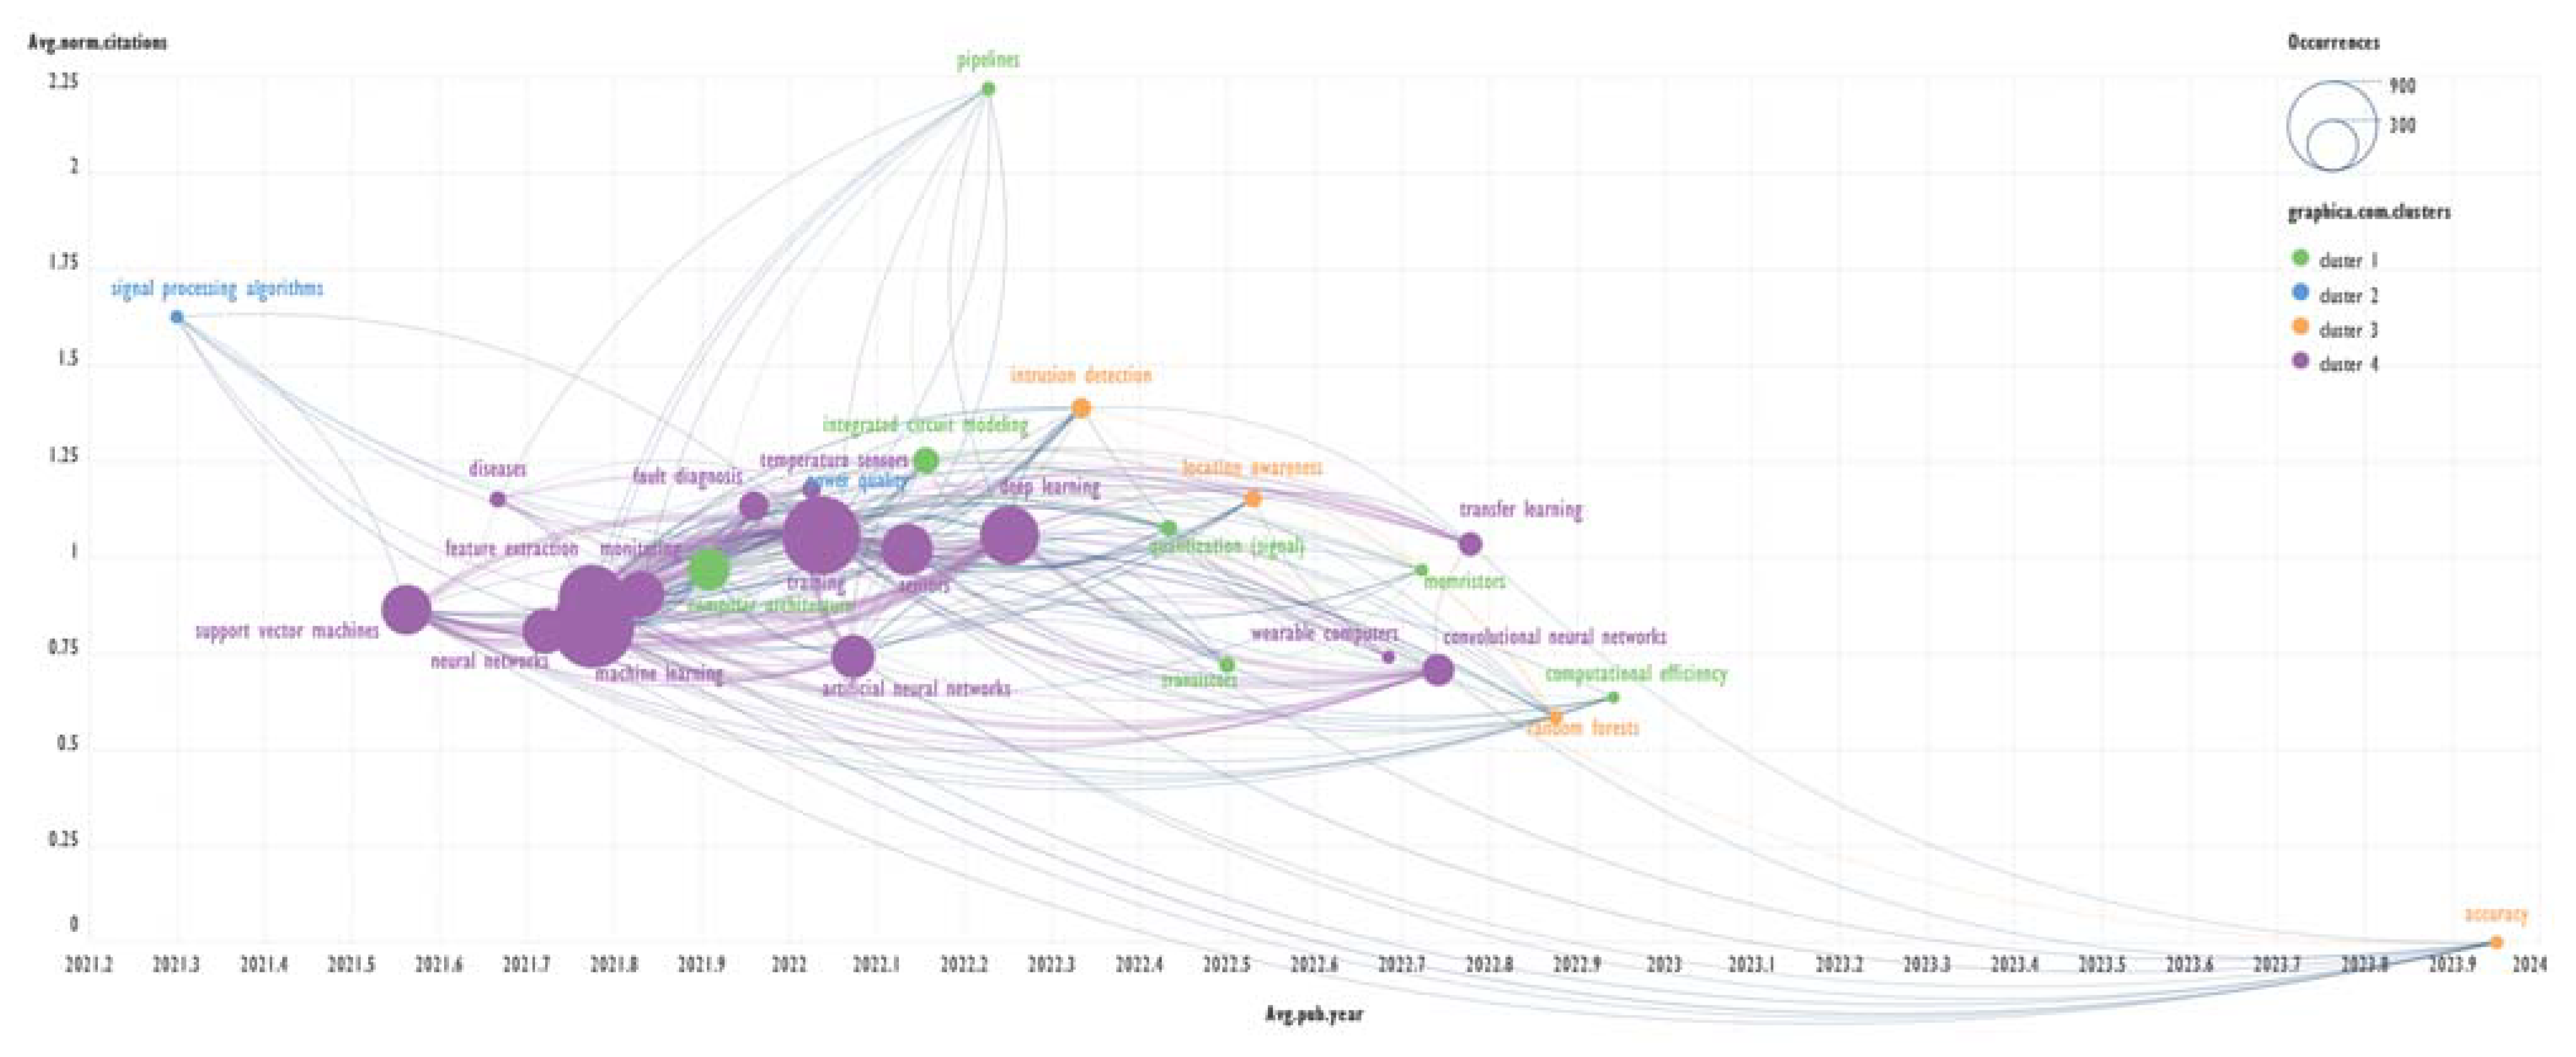
Figure 6.
Cooccurrence network of ‘IEEE Terms’ in coordinates Avg.pub.year and Avg.norm.citations for the second cluster of data from Table 9, Table 10 and Table 11.
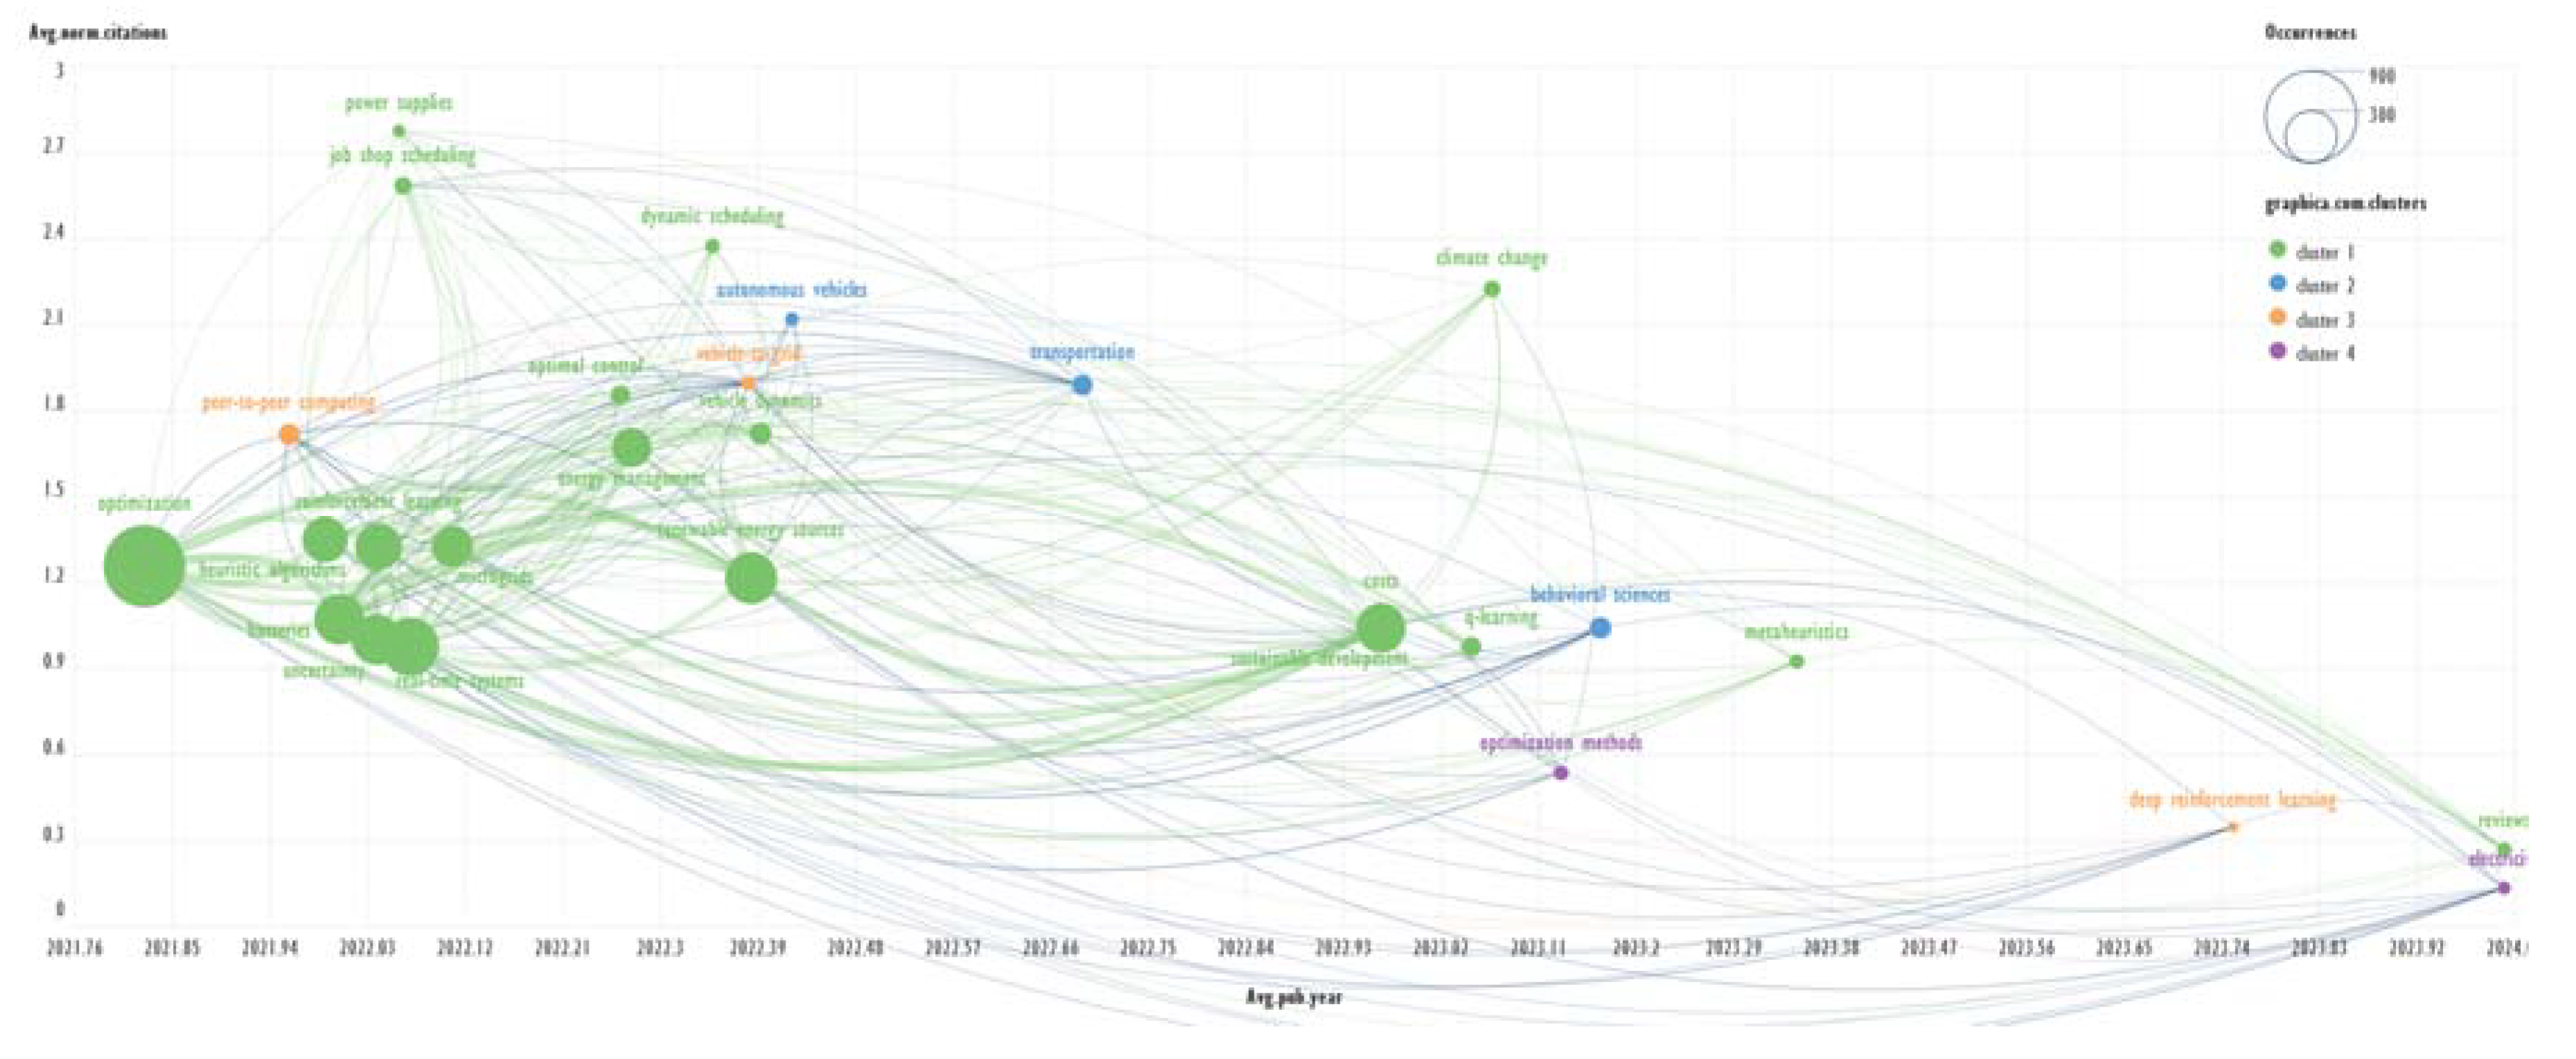
Figure 7.
Cooccurrence network of ‘IEEE Terms’ in coordinates Avg.pub.year and Avg.norm.citations for the third cluster of data from Table 9, Table 10 and Table 11.
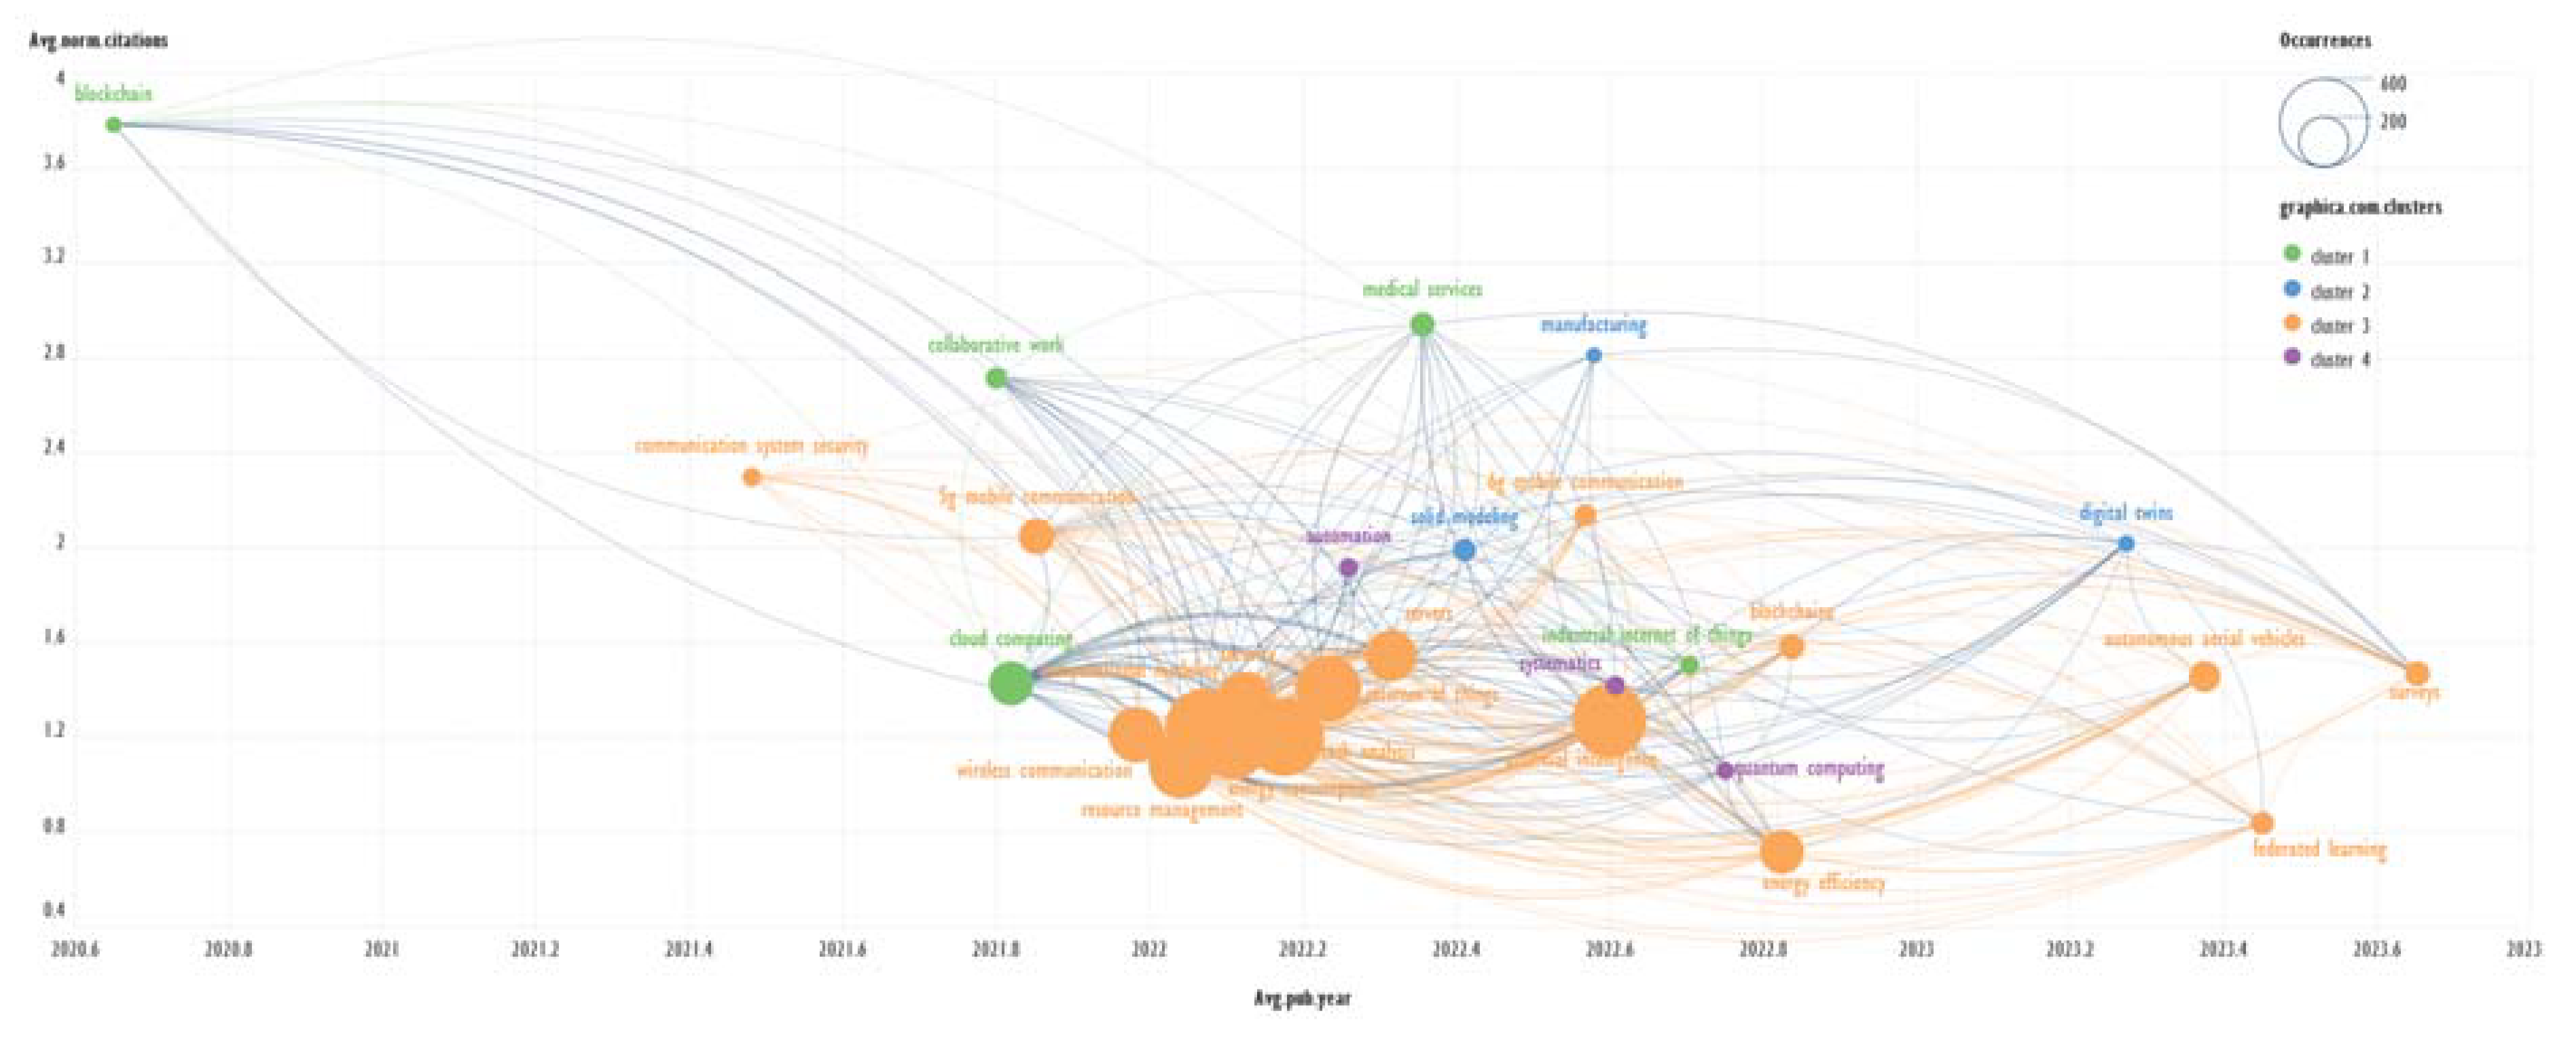
Figure 8.
Cooccurrence network of ‘IEEE Terms’ in coordinates Avg.pub.year and Avg.norm.citations for the fourth cluster of data from Table 9, Table 10 and Table 11.
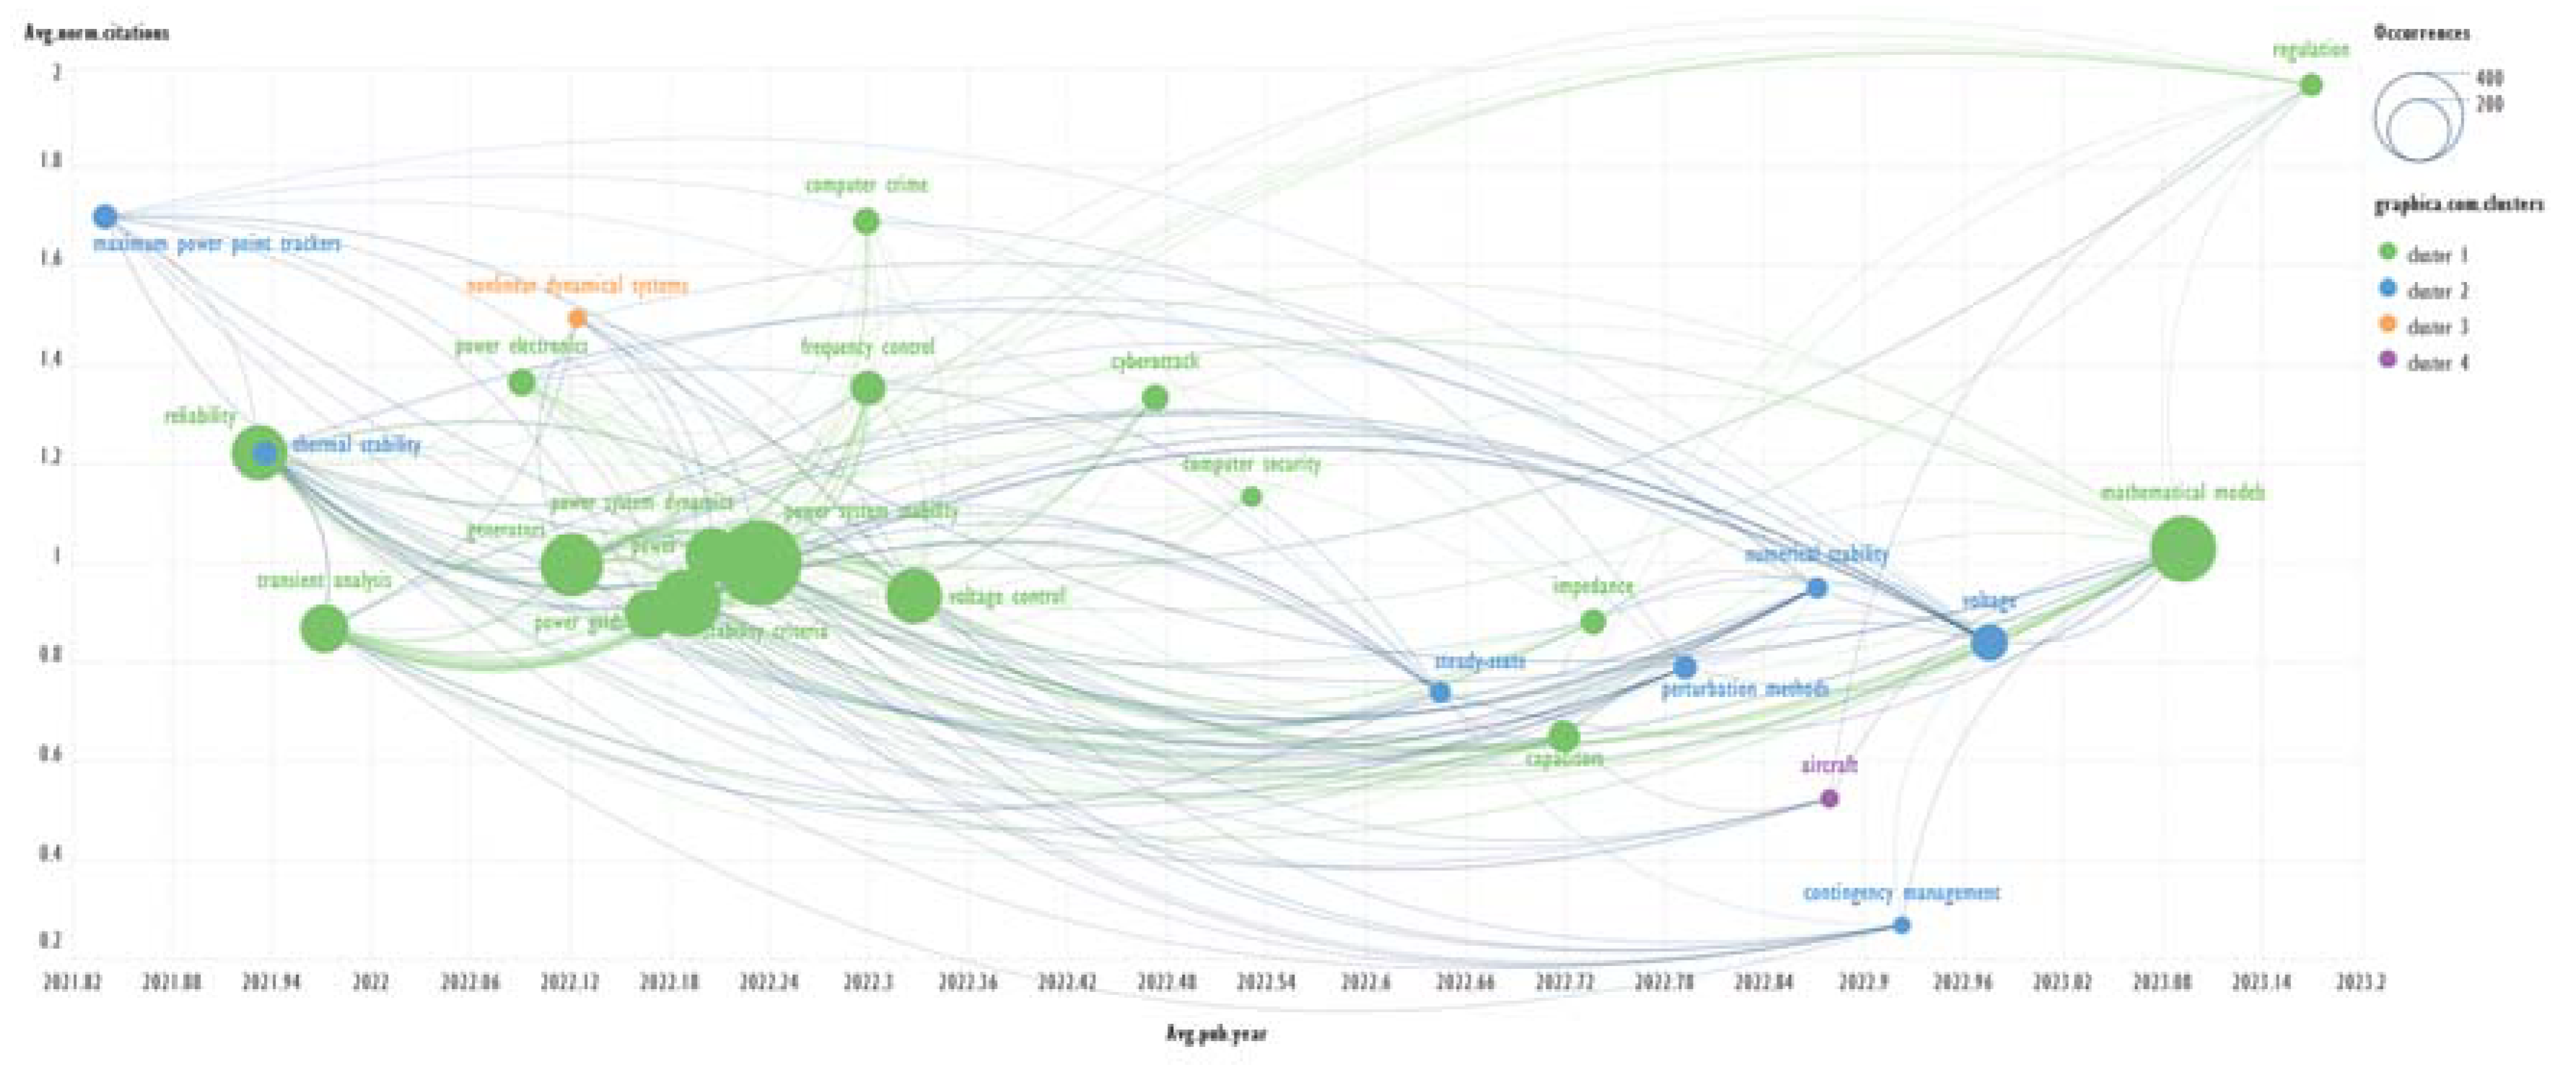
Figure 9.
Cooccurrence network of ‘IEEE Terms’ in coordinates Avg.pub.year and Avg.norm.citations for the fifth cluster of data from Table 9, Table 10 and Table 11.
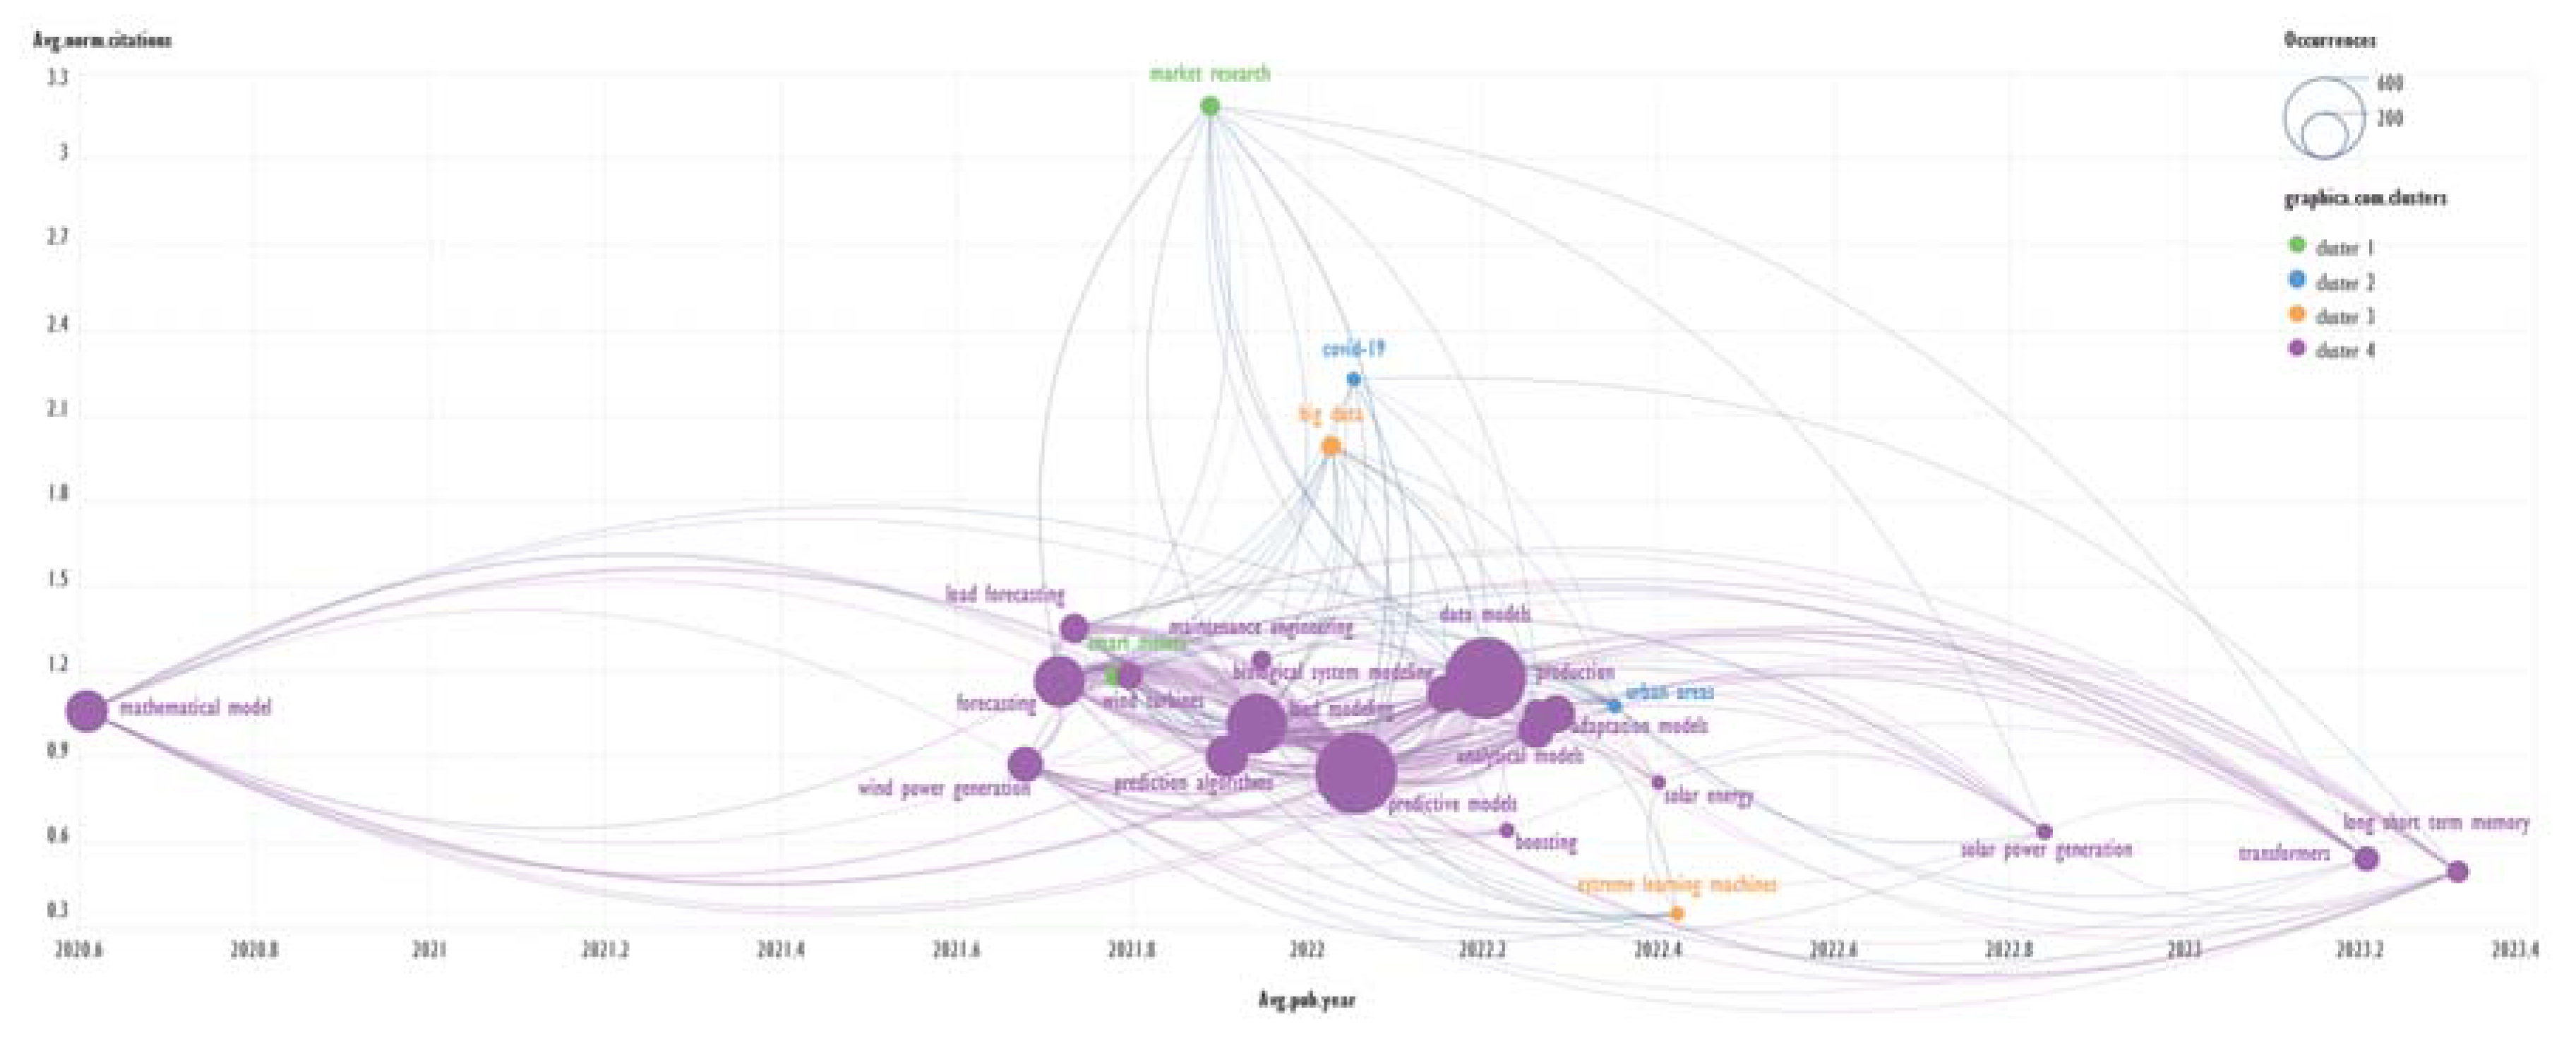
Figure 10.
Top 30 ‘IEEE Terms’ with highest average citation common to all clusters mapped as ‘Convex hull chart’.
Figure 10.
Top 30 ‘IEEE Terms’ with highest average citation common to all clusters mapped as ‘Convex hull chart’.
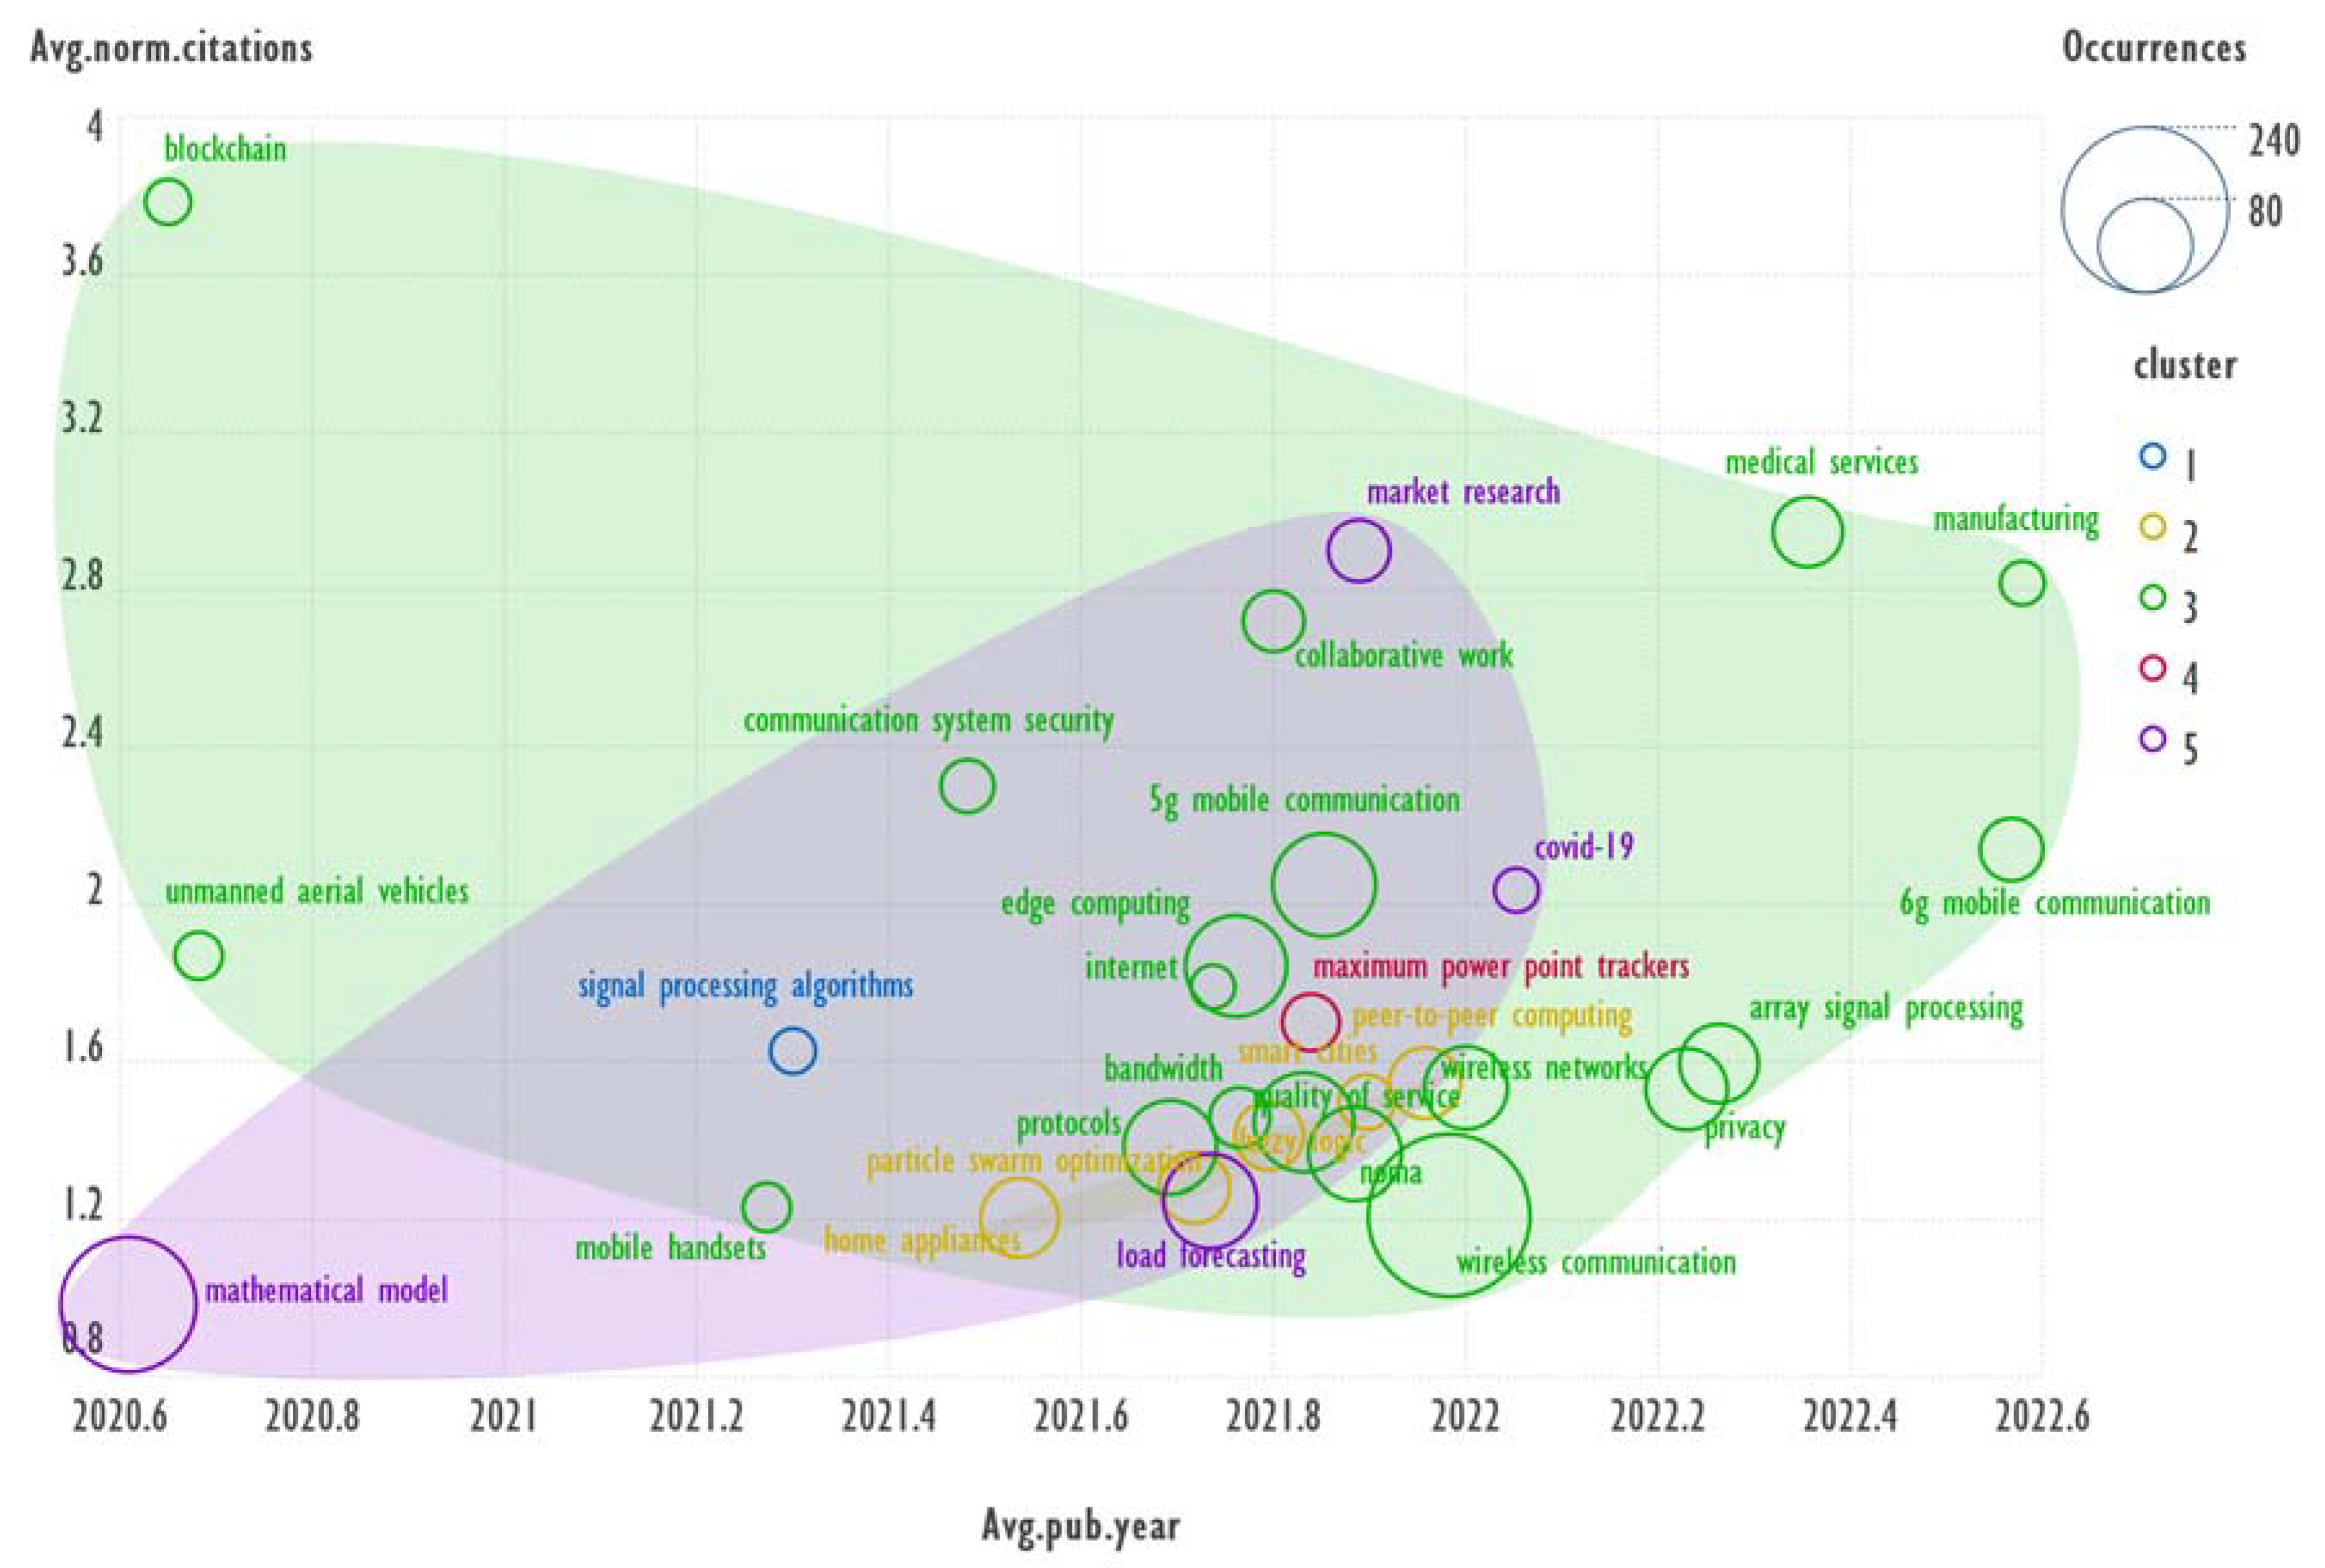
Figure 11.
Top 30 ‘IEEE Terms’ with highest ‘Total Link Strength’ for all clusters mapped as ‘Convex hull chart’.
Figure 11.
Top 30 ‘IEEE Terms’ with highest ‘Total Link Strength’ for all clusters mapped as ‘Convex hull chart’.
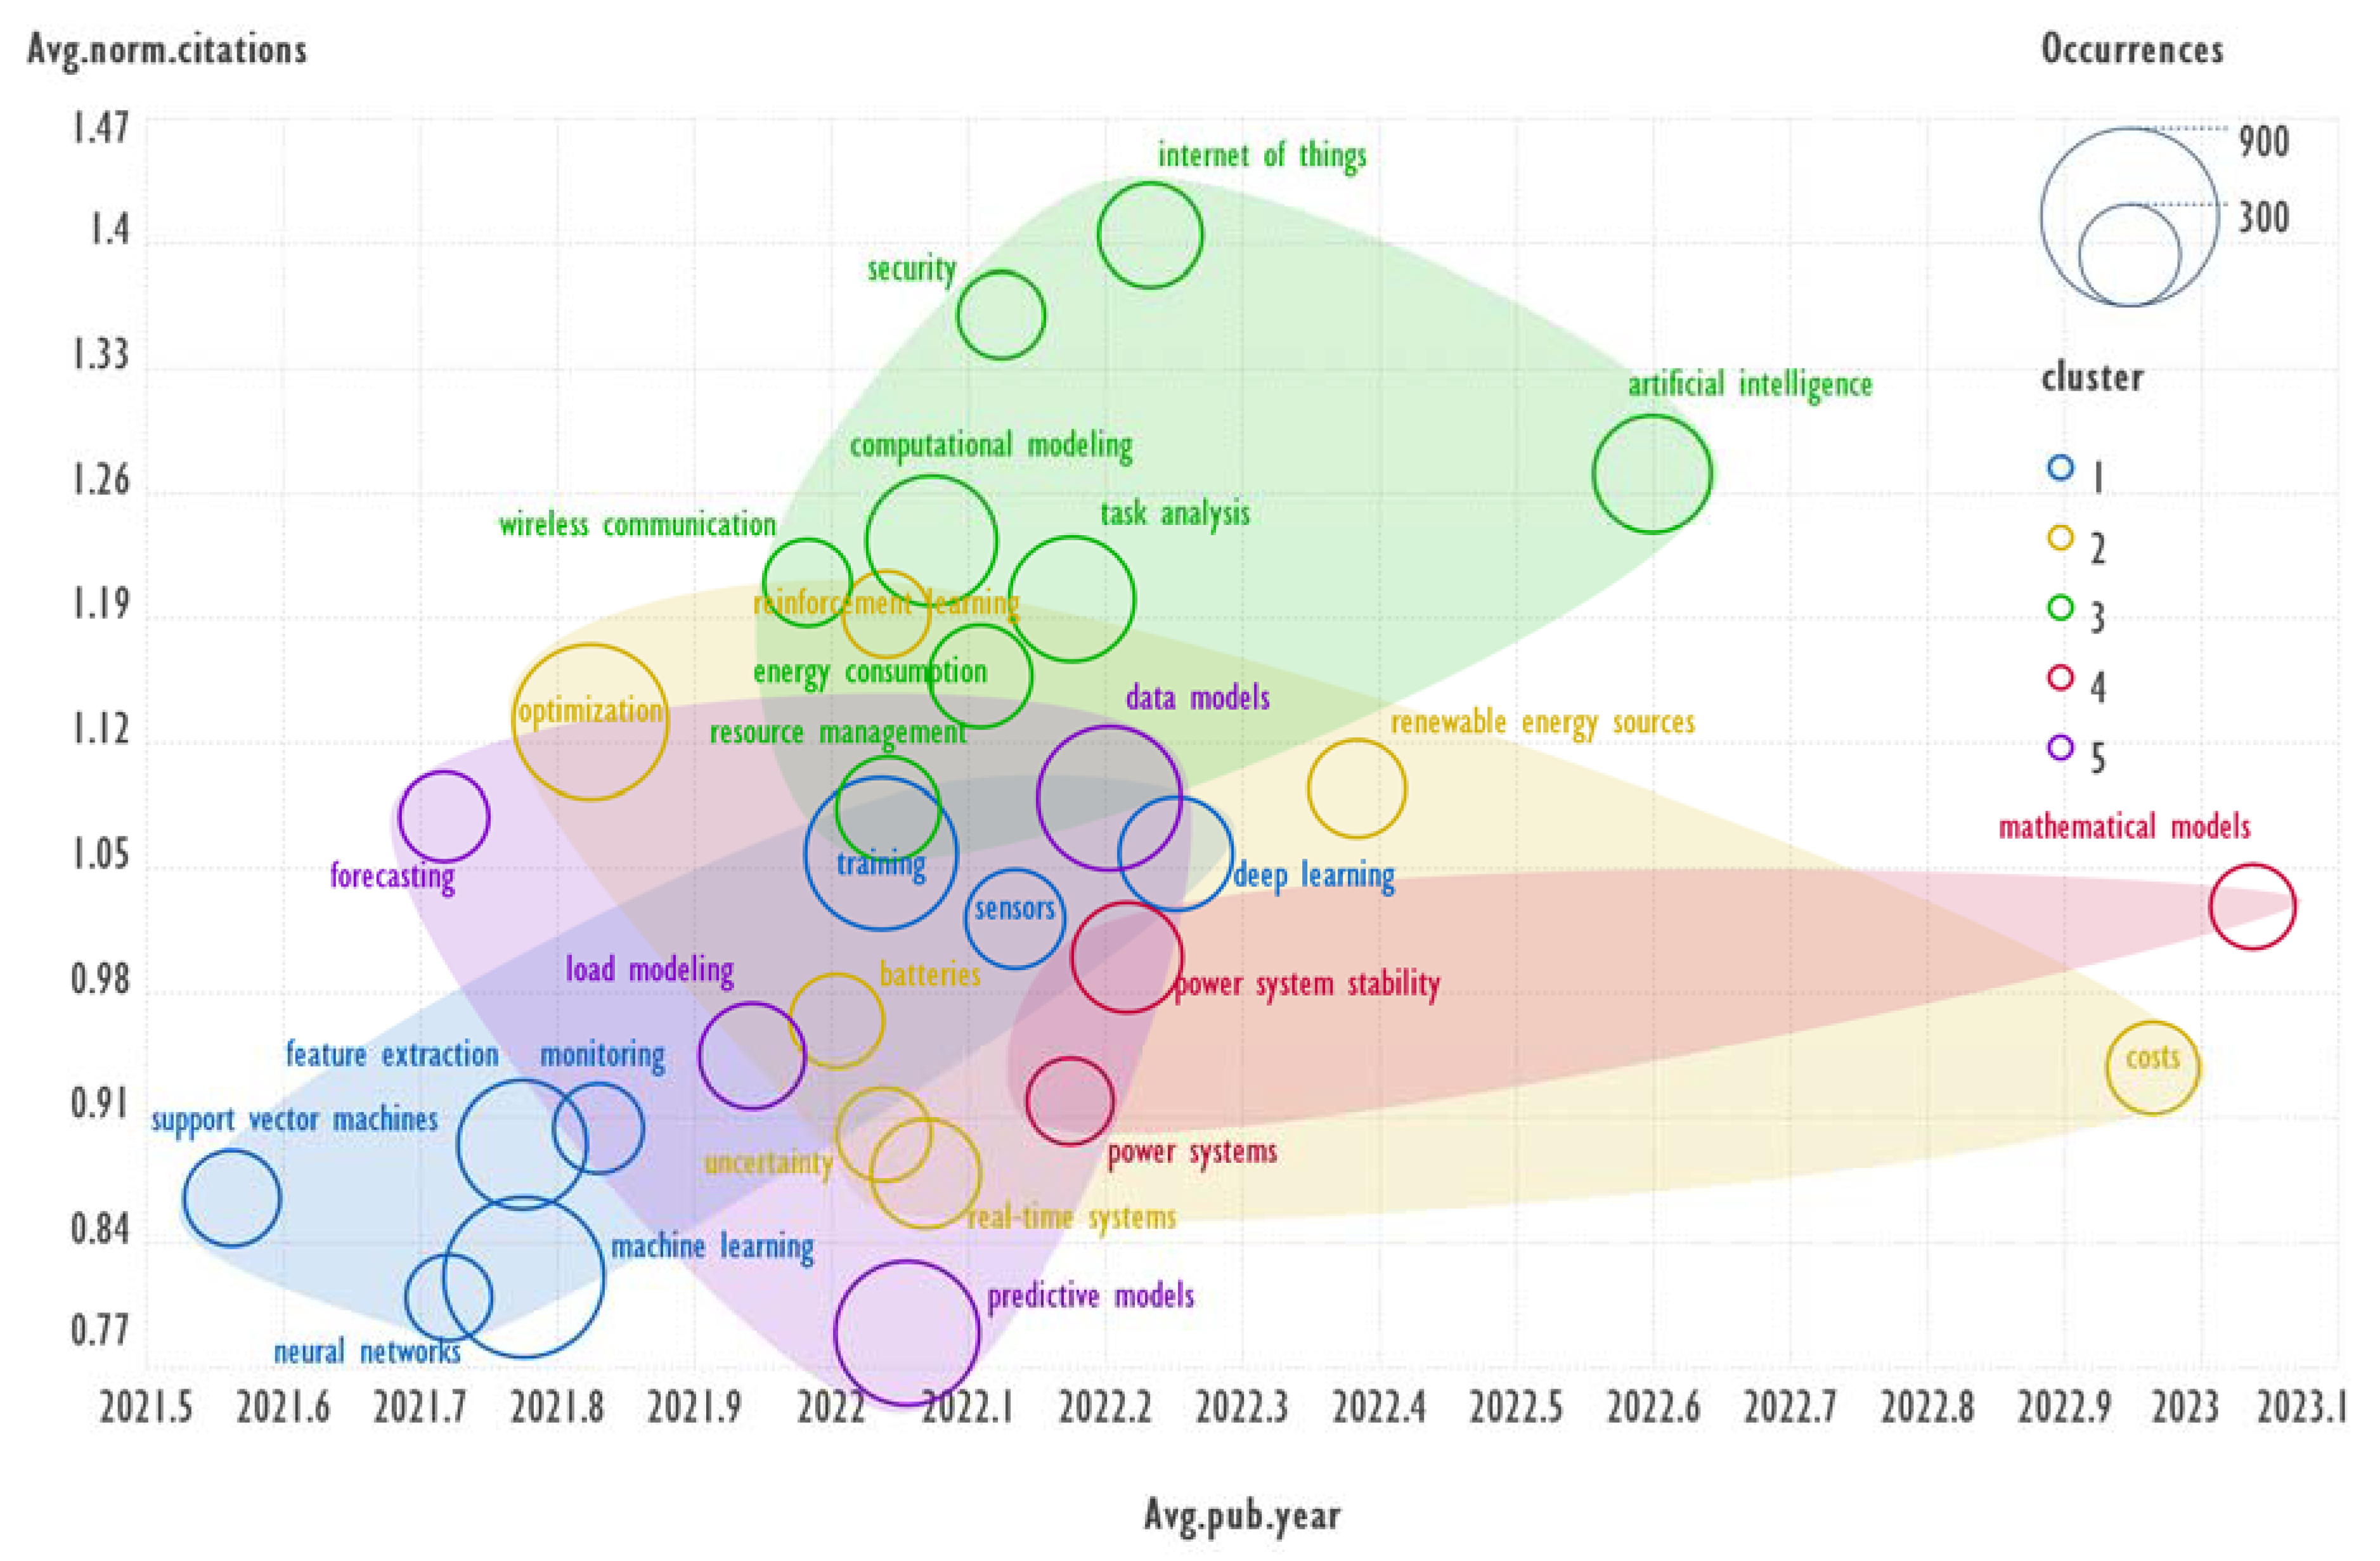
Figure 12.
Top 30 ‘IEEE Terms’ with the lowest ‘Total Link Strength’ for all clusters mapped as ‘Convex hull chart’.
Figure 12.
Top 30 ‘IEEE Terms’ with the lowest ‘Total Link Strength’ for all clusters mapped as ‘Convex hull chart’.
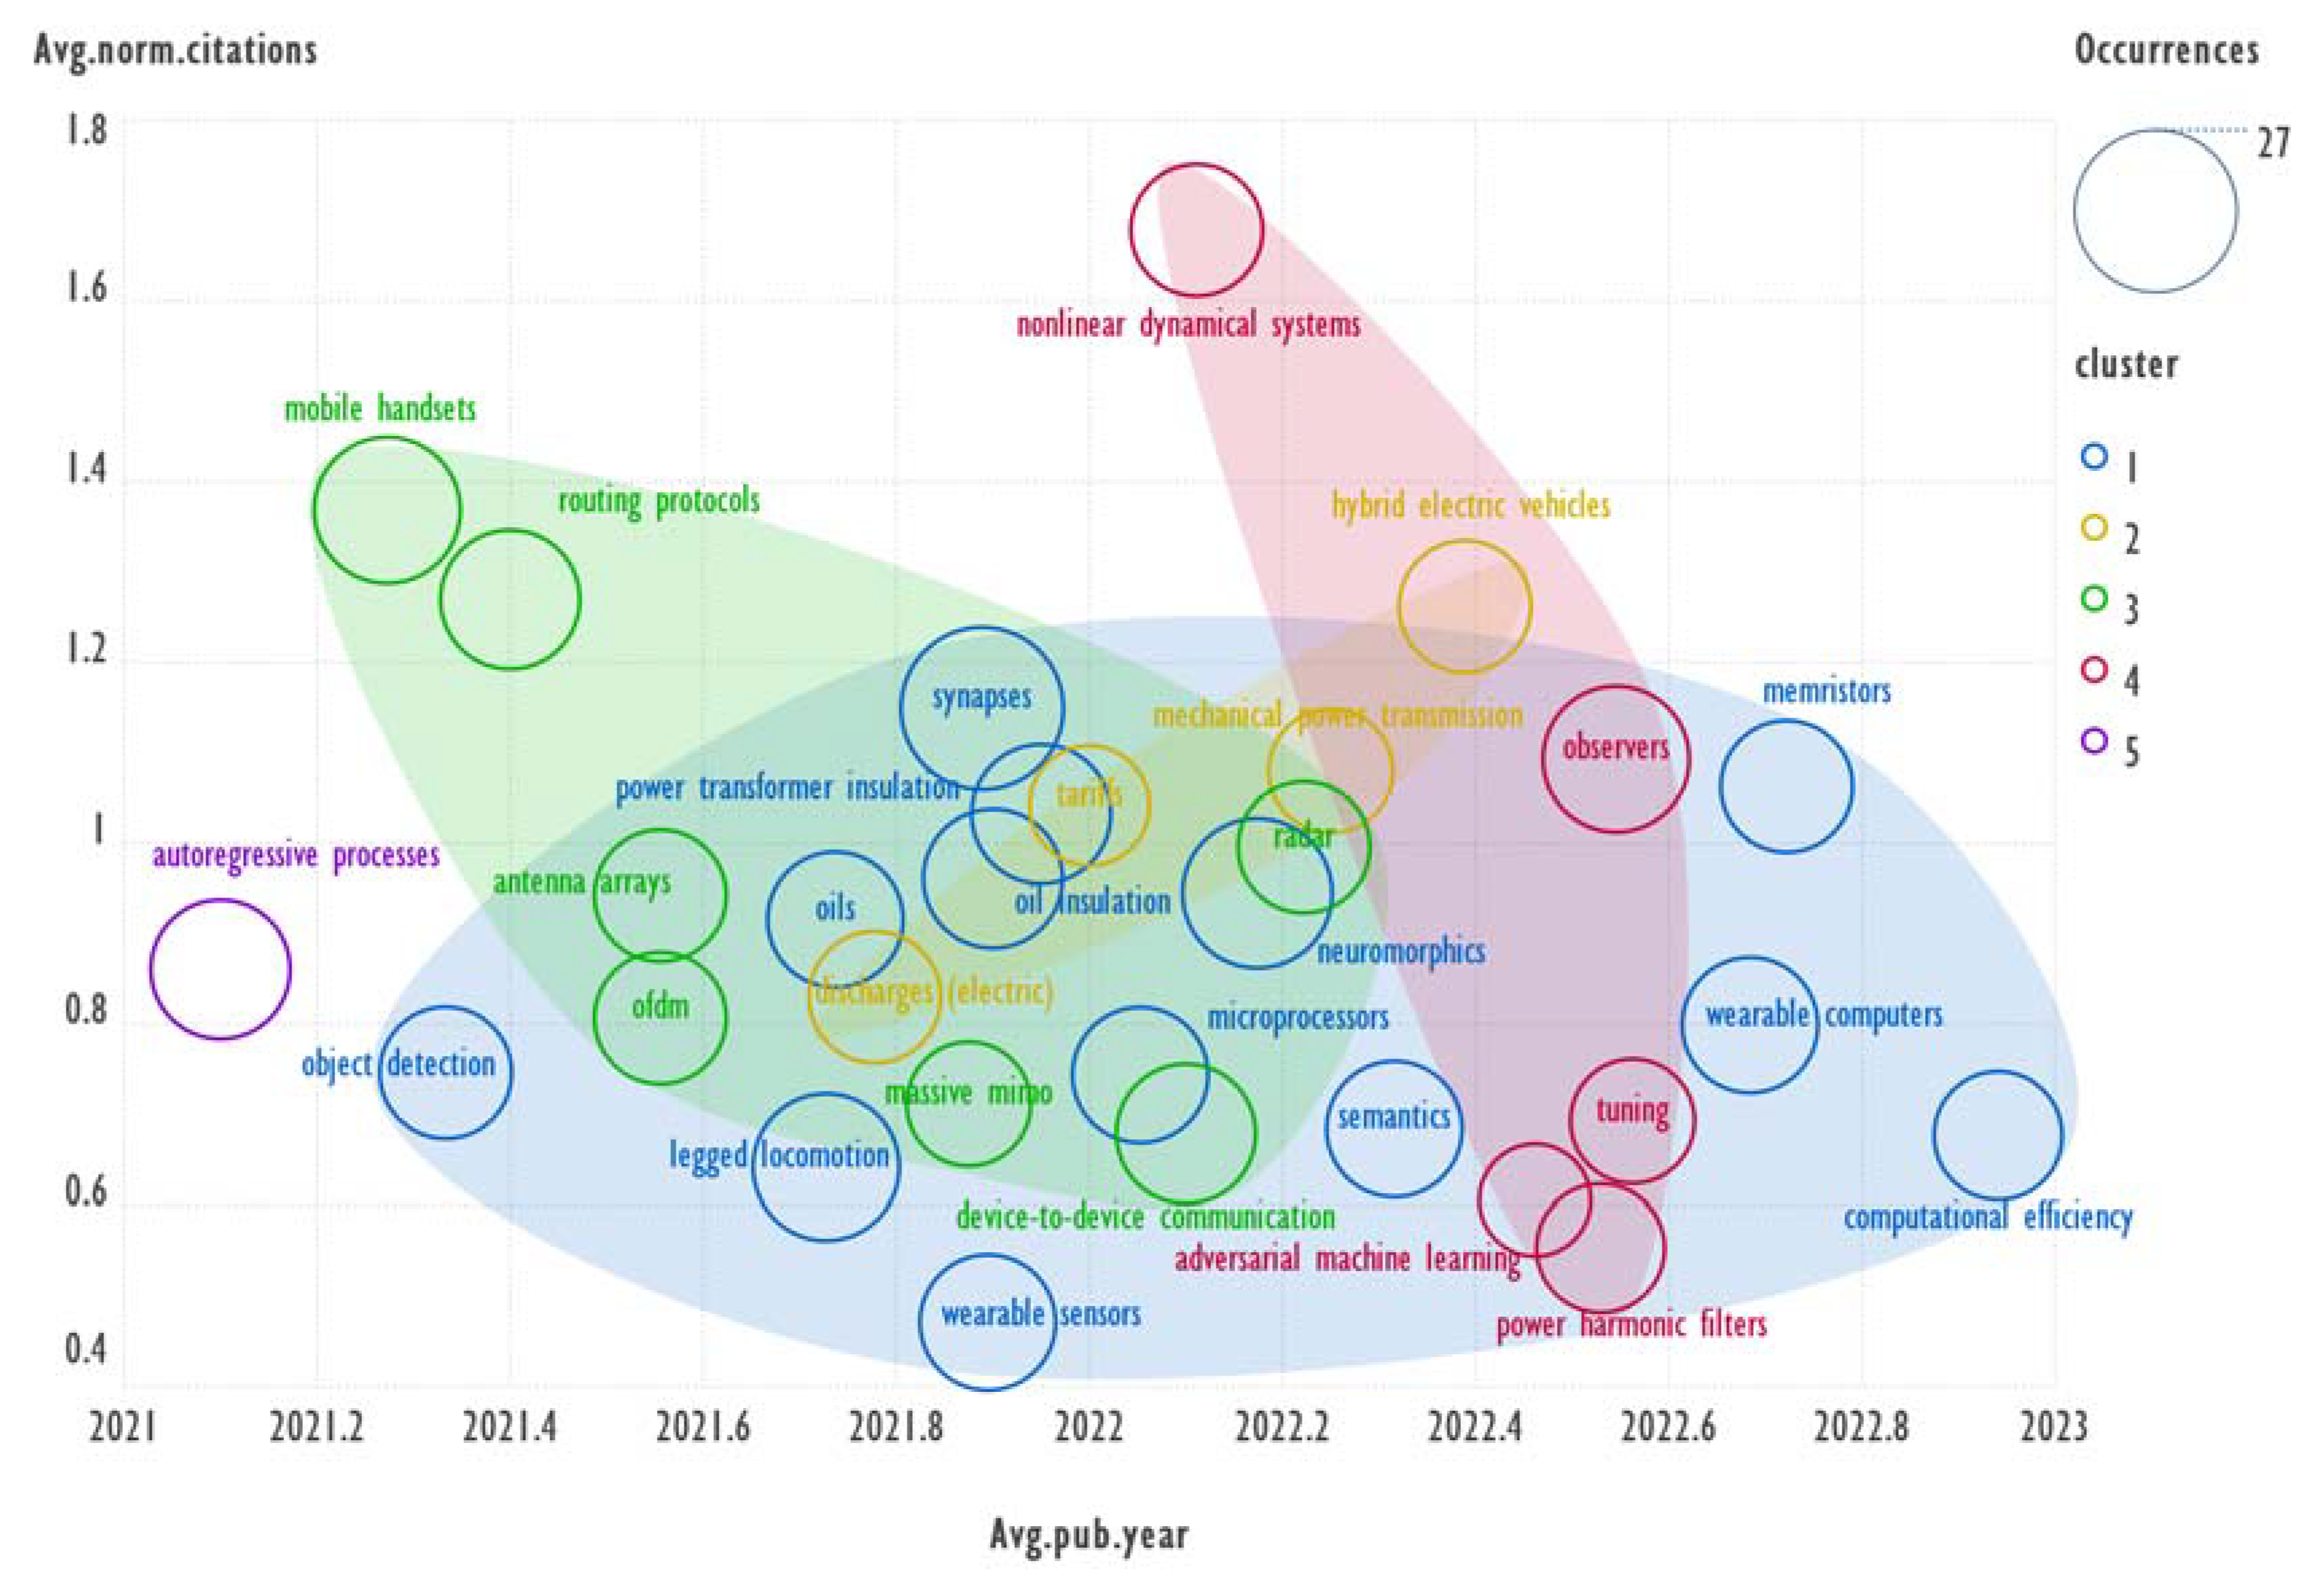
Figure 13.
Co-occurrence of four terms in the ‘IEEE Terms’ field for records cited 20 or more times.
Figure 13.
Co-occurrence of four terms in the ‘IEEE Terms’ field for records cited 20 or more times.
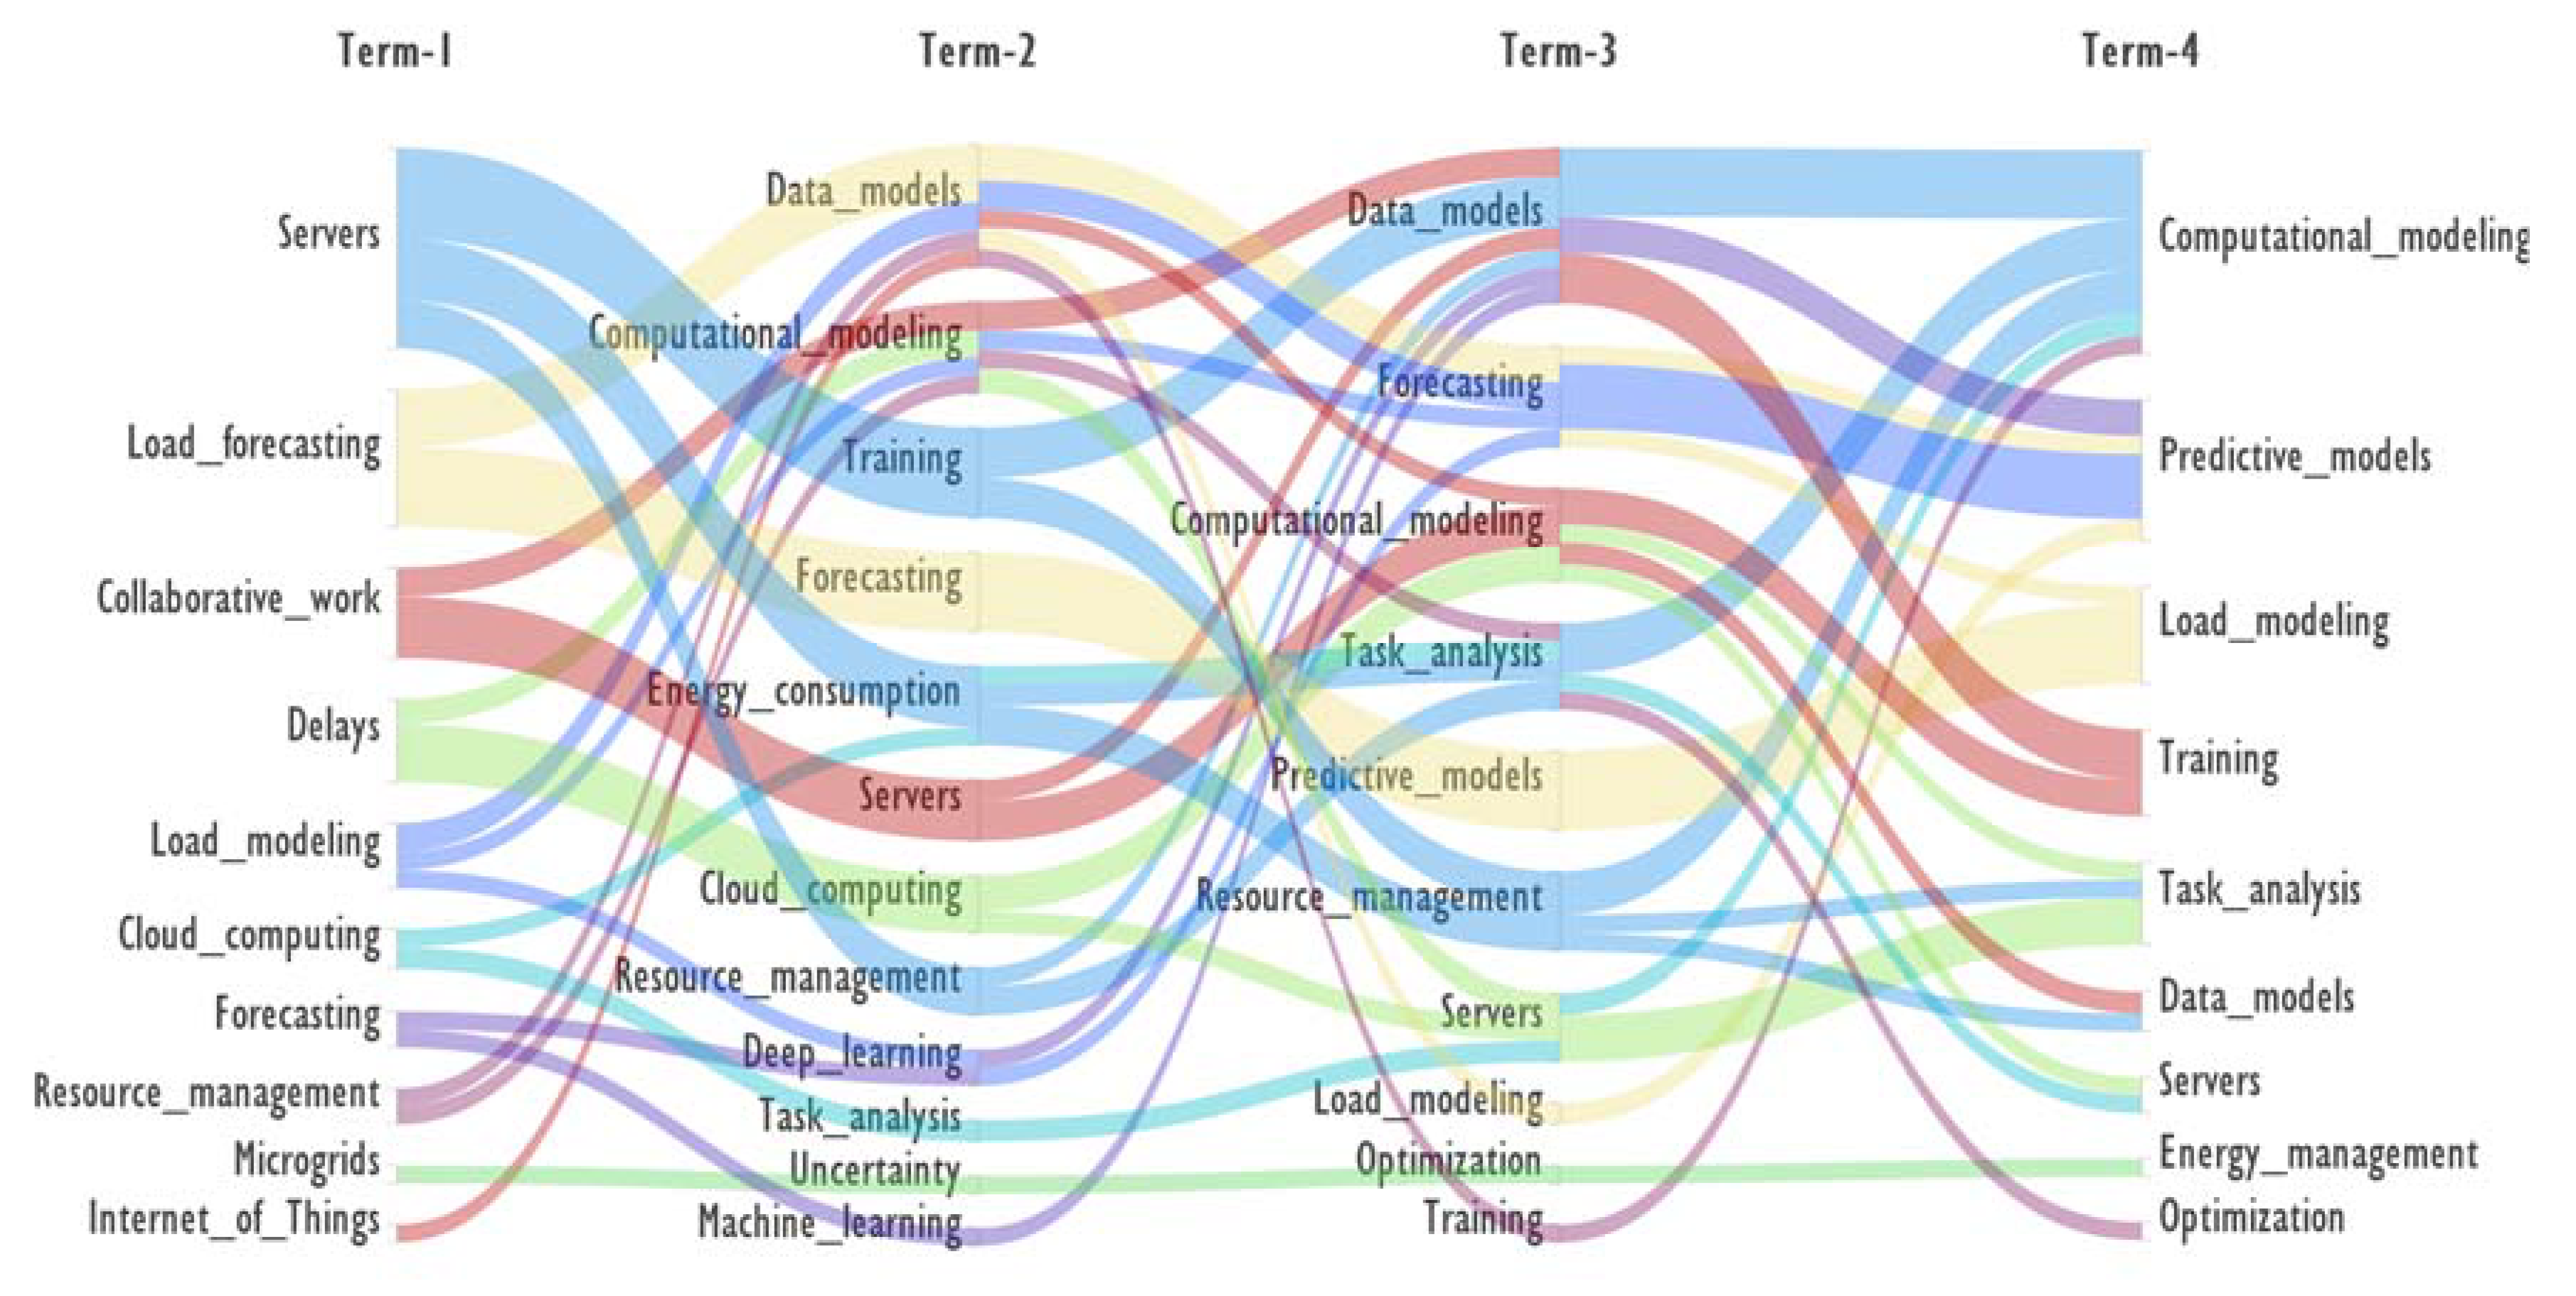
Figure 14.
Co-occurrence of the four terms in the ‘IEEE Terms’ field for 2024 records with citations.
Figure 14.
Co-occurrence of the four terms in the ‘IEEE Terms’ field for 2024 records with citations.
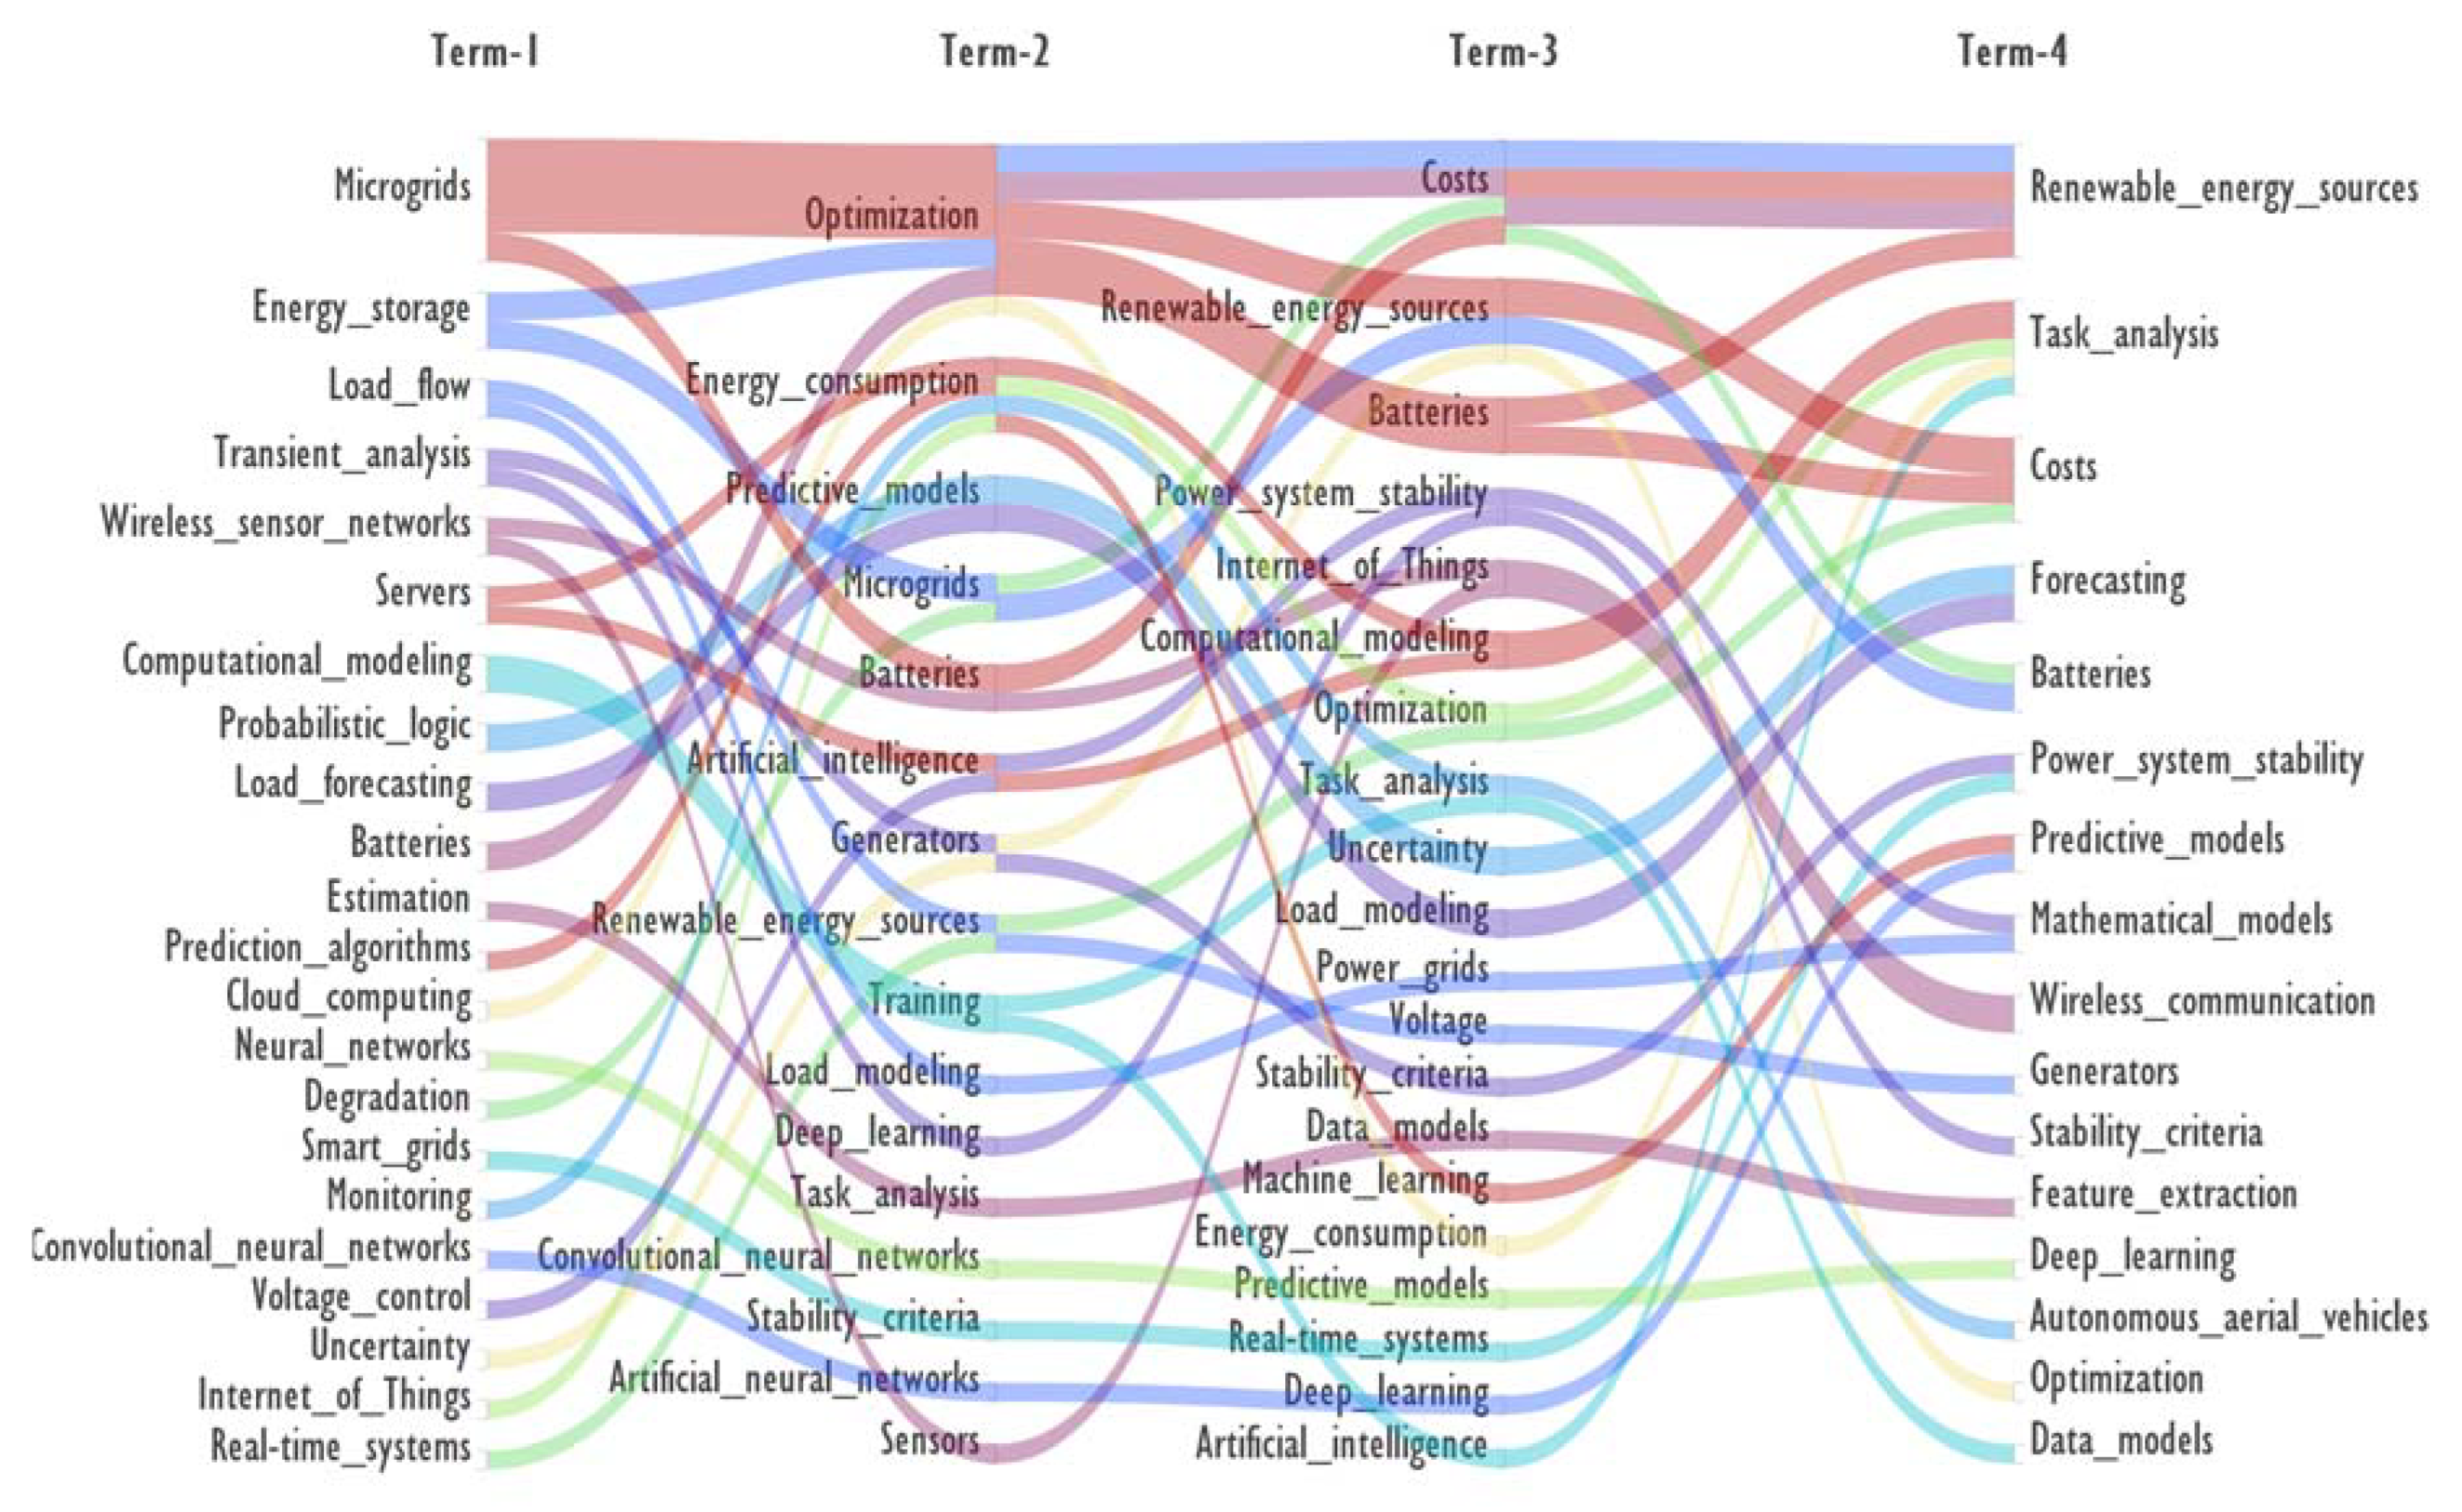
Figure 15.
Dendrogram constructed for the 50 most frequently co-occurring terms defined for all bibliometric records.
Figure 15.
Dendrogram constructed for the 50 most frequently co-occurring terms defined for all bibliometric records.
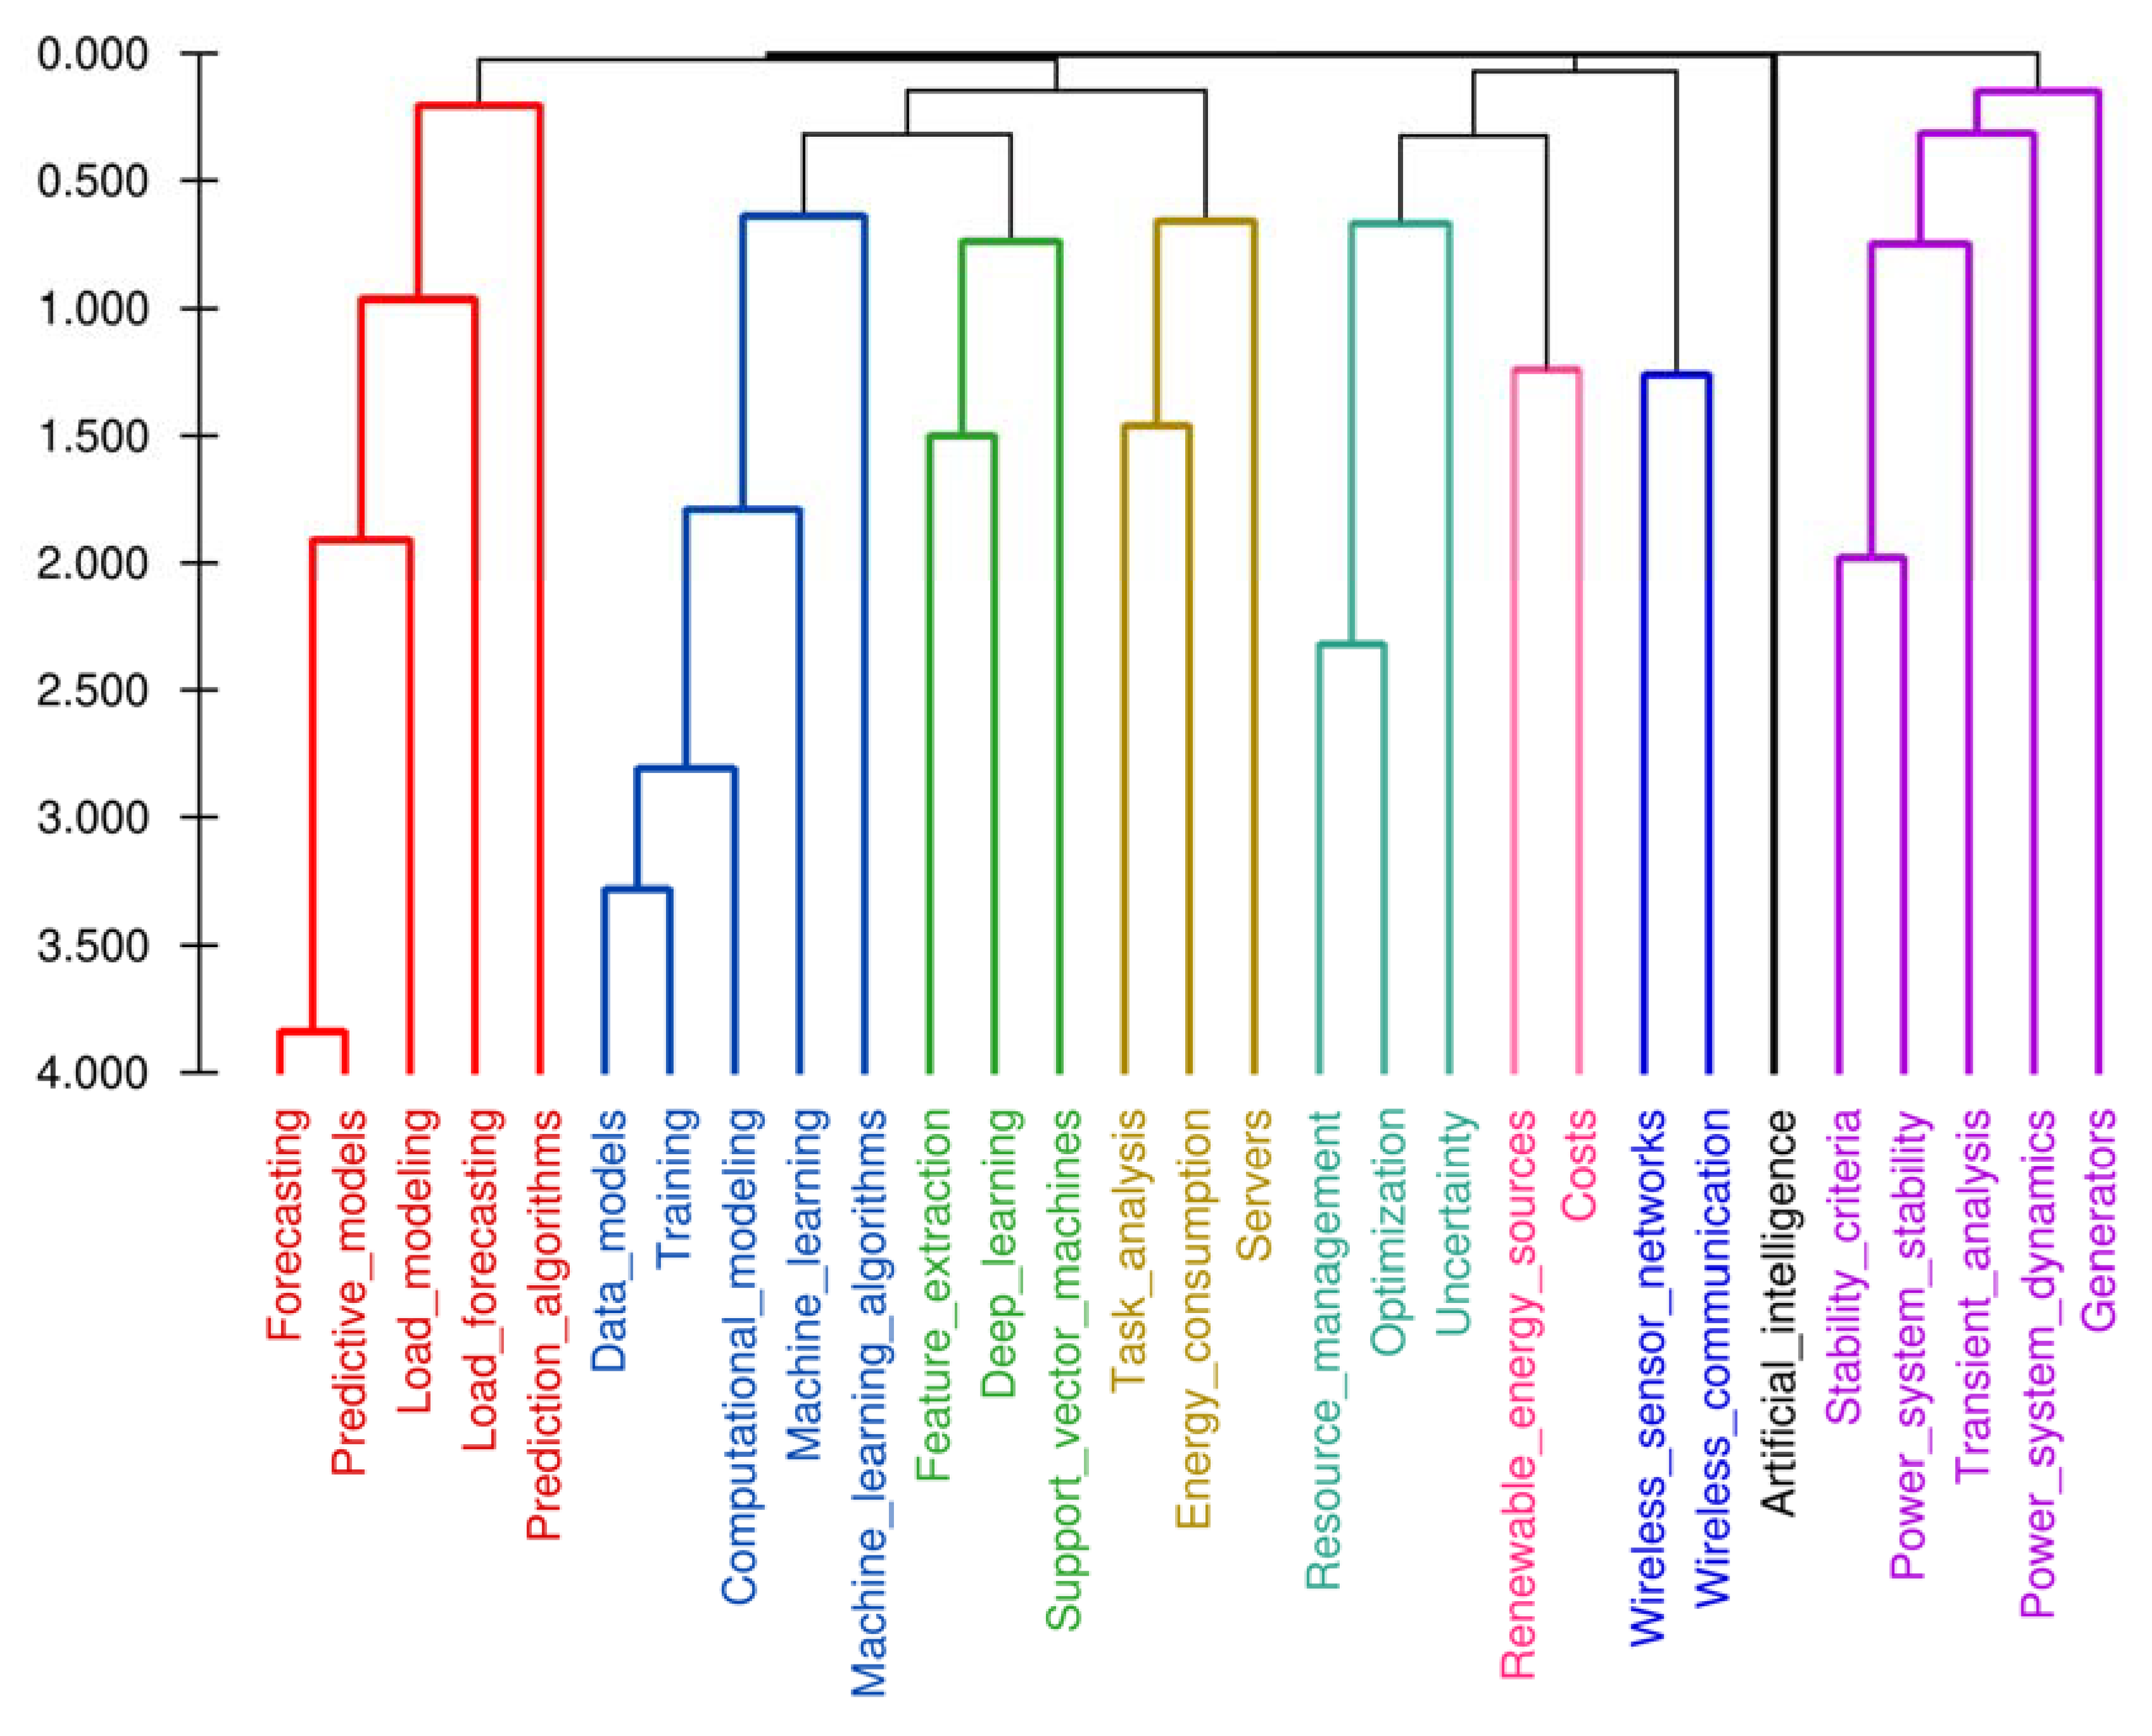
Figure 16.
Dendrogram constructed for the 50 most frequently co-occurring terms defined for bibliometric records with citations of 30 times and higher.
Figure 16.
Dendrogram constructed for the 50 most frequently co-occurring terms defined for bibliometric records with citations of 30 times and higher.
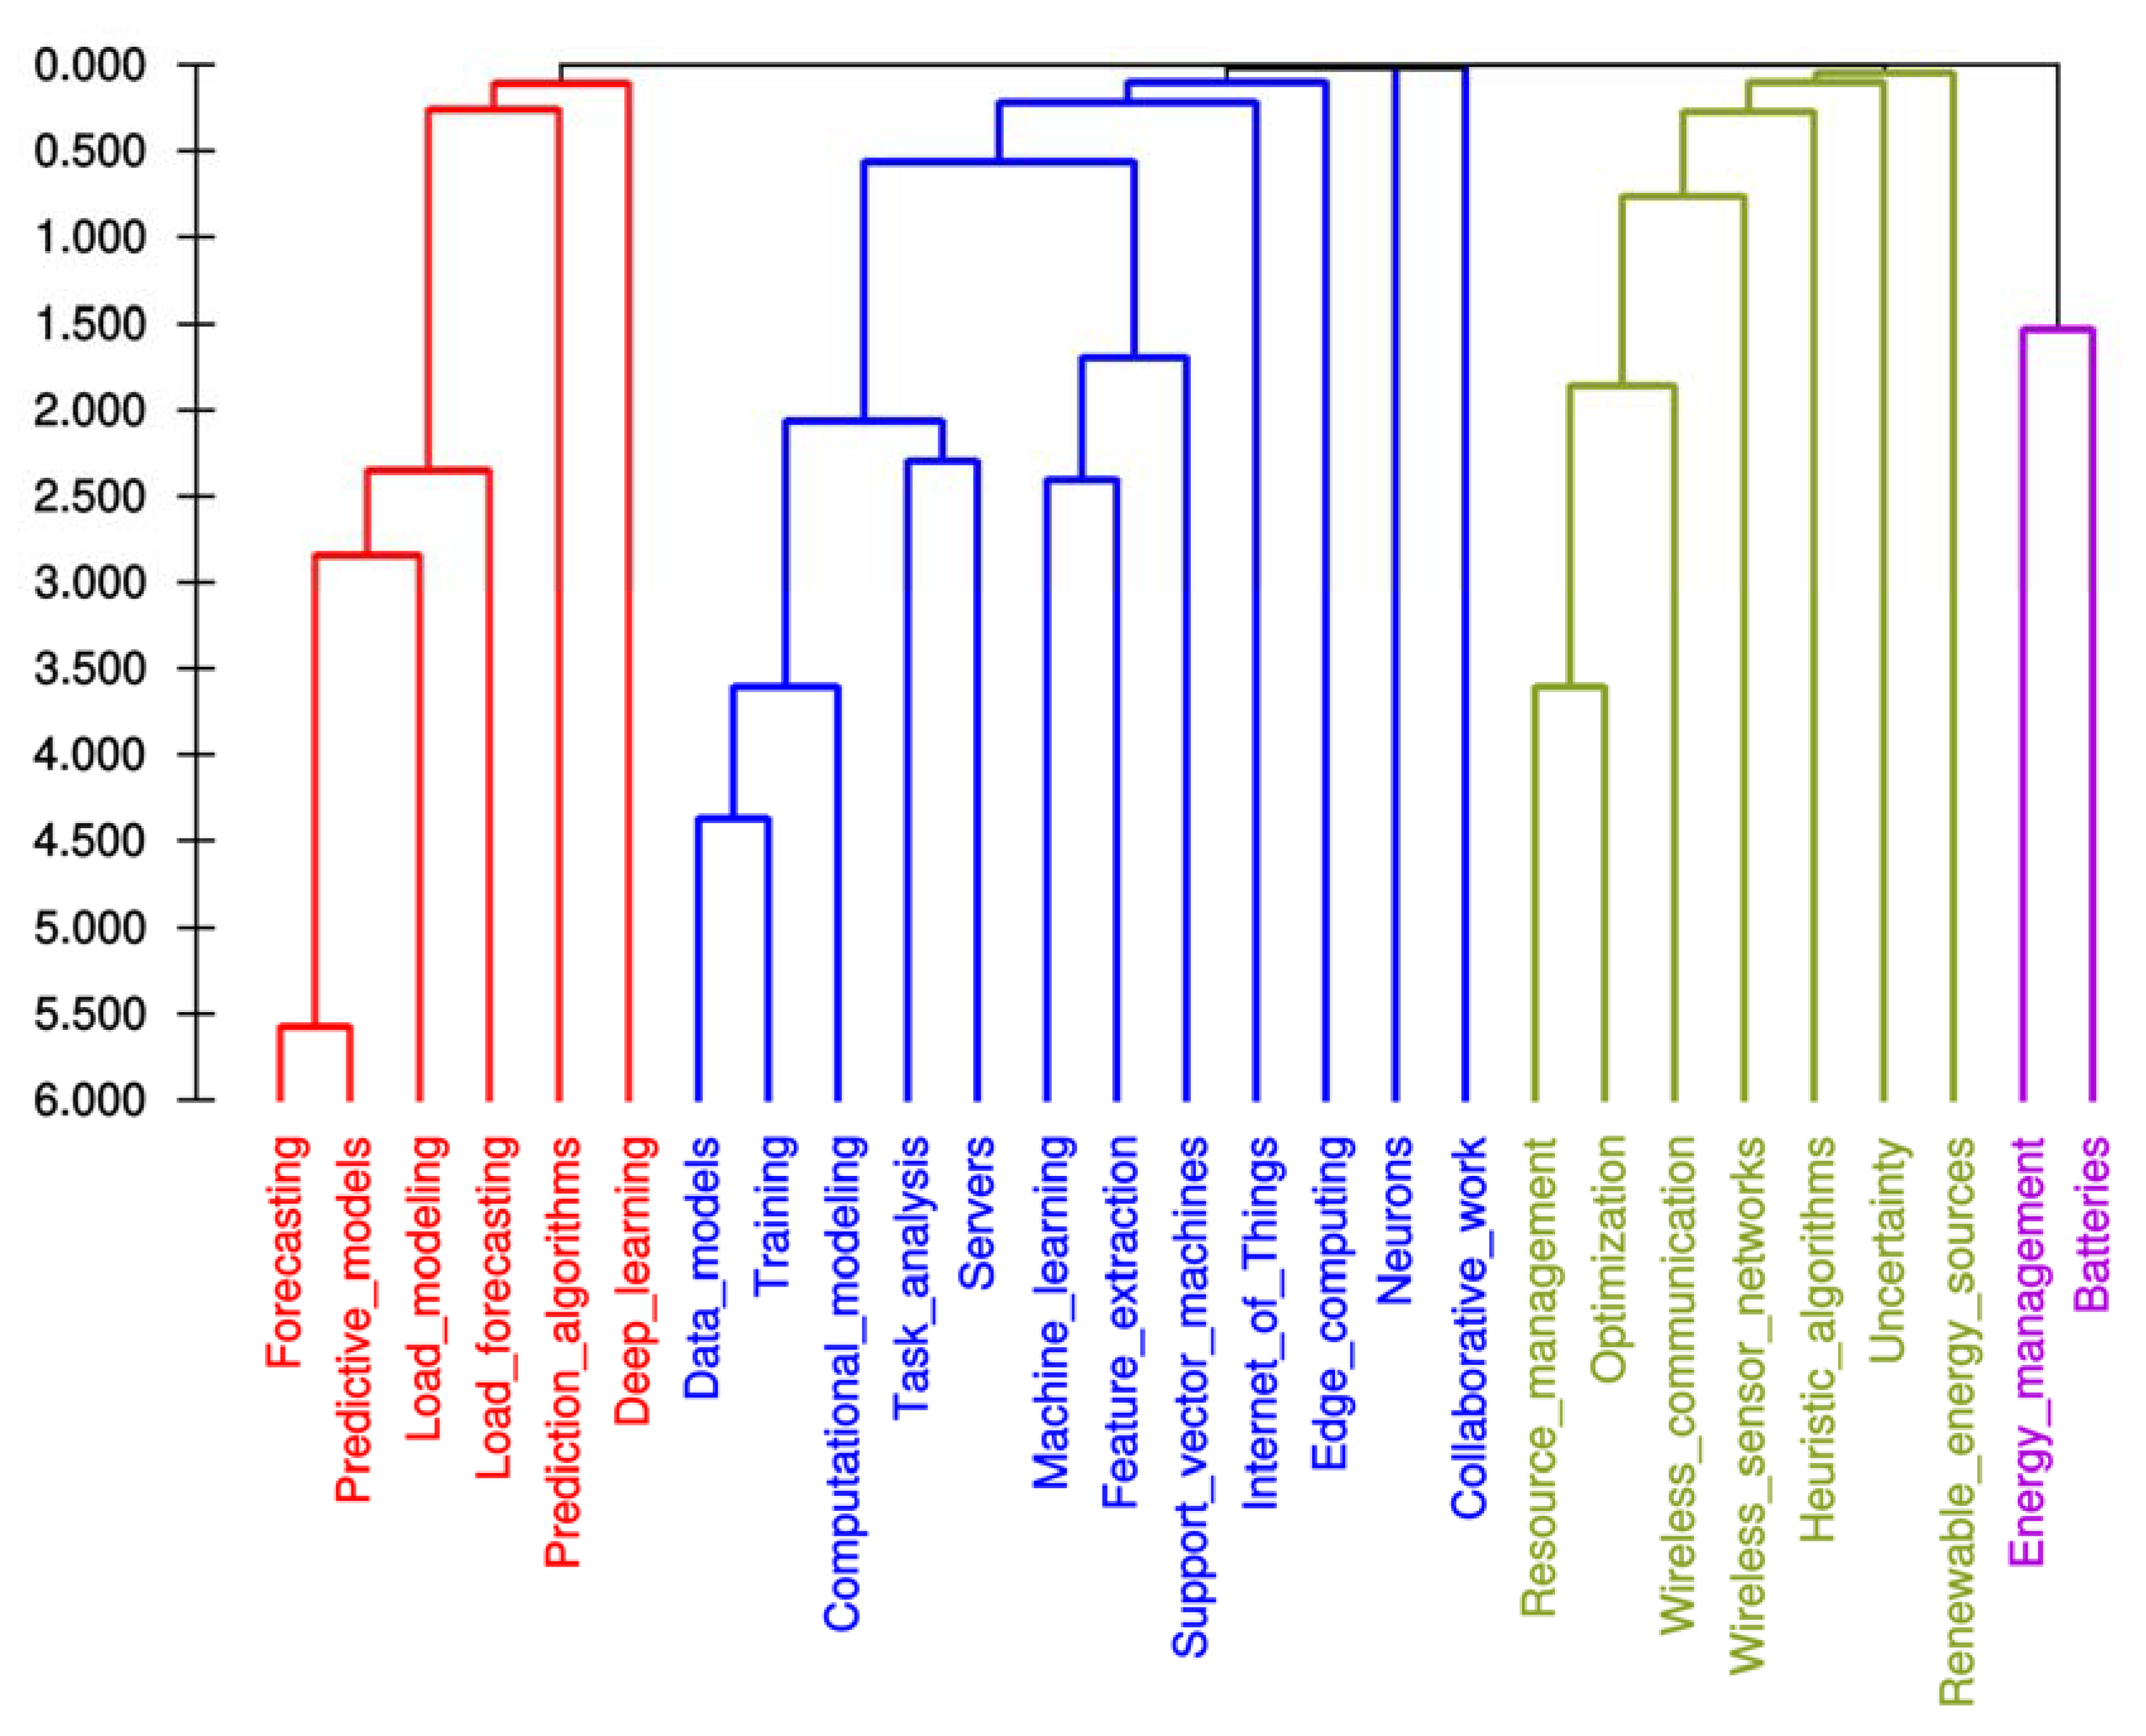
Table 1.
Top Searches and Matching Documents [https://ieeexplore.ieee.org/Xplore/home.jsp].
Table 1.
Top Searches and Matching Documents [https://ieeexplore.ieee.org/Xplore/home.jsp].
| Top Searches | Matching Documents |
| Image Processing | 416453 |
| Machine Learning | 324970 |
| Deep Learning | 234558 |
| Artificial Intelligence | 220871 |
Table 2.
Top 30 authors with the largest number of publications.
| Author | Count | Author | Count | Author | Count |
| Y. Li | 141 | X. Zhang | 69 | J. Chen | 50 |
| Y. Wang | 120 | J. Li | 68 | X. Liu | 49 |
| Y. Liu | 109 | J. Zhao | 68 | H. Liu | 48 |
| Y. Zhang | 94 | J. Liu | 63 | Z. Chen | 46 |
| X. Wang | 92 | J. Zhang | 61 | J. Yang | 41 |
| H. Zhang | 87 | X. Li | 60 | C. Wang | 40 |
| Z. Wang | 80 | Y. Xu | 60 | L. Zhang | 40 |
| J. Wang | 79 | S. Wang | 59 | S. Li | 39 |
| H. Wang | 76 | Z. Zhang | 58 | Z. Liu | 39 |
| Y. Chen | 74 | L. Wang | 51 | S. Liu | 38 |
Table 4.
Top 30 ‘IEEE Terms’ obtained for the first 10 affiliations from Table 3. N - occurrence of the term in the list of 2262 results.
Table 4.
Top 30 ‘IEEE Terms’ obtained for the first 10 affiliations from Table 3. N - occurrence of the term in the list of 2262 results.
| Term | N | Term | N |
|---|---|---|---|
| Optimization | 53 | Generators | 22 |
| Power system stability | 52 | Reinforcement learning | 21 |
| Data models | 43 | Feature extraction | 20 |
| Computational modeling | 40 | Task analysis | 20 |
| Training | 37 | Deep learning | 19 |
| Load modeling | 34 | Forecasting | 19 |
| Predictive models | 30 | Security | 19 |
| Uncertainty | 30 | Power grids | 18 |
| Power systems | 28 | Resource management | 18 |
| Costs | 26 | Wind power generation | 18 |
| Real-time systems | 26 | Internet of Things | 17 |
| Stability criteria | 26 | Power system dynamics | 17 |
| Voltage control | 26 | Games | 16 |
| Machine learning | 25 | Microgrids | 15 |
| Renewable energy sources | 24 | Reactive power | 15 |
Table 5.
Top 30 journals with the largest number of publications on the topic under study.
| Publication Title | N | Publication Title | N |
| IEEE Access | 1774 | IEEE Transactions on Industry Applications | 56 |
| IEEE Internet of Things Journal | 236 | IEEE Transactions on Sustainable Energy | 56 |
| IEEE Transactions on Power Systems | 213 | IEEE Transactions on Industrial Electronics | 50 |
| IEEE Transactions on Smart Grid | 148 | CSEE Journal of Power and Energy Systems | 47 |
| IEEE Transactions on Industrial Informatics | 136 | IEEE Transactions on Computer-Aided Design of Integrated Circuits and Systems | 47 |
| IEEE Sensors Journal | 105 | IEEE Transactions on Biomedical Circuits and Systems | 41 |
| IEEE Transactions on Intelligent Transportation Systems | 91 | IEEE Transactions on Power Delivery | 40 |
| IEEE Transactions on Neural Networks and Learning Systems | 85 | IEEE Transactions on Systems, Man, and Cybernetics: Systems | 40 |
| IEEE Systems Journal | 83 | IEEE Transactions on Power Electronics | 36 |
| IEEE Transactions on Circuits and Systems I: Regular Papers | 72 | IEEE Transactions on Green Communications and Networking | 34 |
| IEEE Transactions on Vehicular Technology | 69 | IEEE Transactions on Transportation Electrification | 32 |
| IEEE Transactions on Circuits and Systems II: Express Briefs | 67 | IEEE Open Journal of the Communications Society | 31 |
| IEEE Transactions on Instrumentation and Measurement | 64 | IEEE Transactions on Fuzzy Systems | 29 |
| Journal of Modern Power Systems and Clean Energy | 59 | IEEE Transactions on Communications | 28 |
| IEEE Transactions on Wireless Communications | 57 | IEEE Transactions on Consumer Electronics | 28 |
Table 6.
Top 30 ‘IEEE Terms’ in the 10 journals with the highest number of publications on the topic under study.
Table 6.
Top 30 ‘IEEE Terms’ in the 10 journals with the highest number of publications on the topic under study.
| IEEE Term | N | IEEE Term | N | IEEE Term | N |
| Machine learning | 477 | Load modeling | 251 | Batteries | 175 |
| Optimization | 427 | Task analysis | 236 | Uncertainty | 164 |
| Predictive models | 412 | Artificial intelligence | 228 | Power systems | 153 |
| Data models | 345 | Real-time systems | 217 | Resource management | 149 |
| Training | 331 | Renewable energy sources | 213 | Monitoring | 147 |
| Feature extraction | 304 | Energy consumption | 199 | Security | 147 |
| Deep learning | 263 | Sensors | 197 | Generators | 144 |
| Power system stability | 261 | Forecasting | 195 | Reinforcement learning | 141 |
| Computational modeling | 258 | Support vector machines | 183 | Mathematical models | 138 |
| Internet of Things | 251 | Costs | 178 | Microgrids | 137 |
Table 7.
Pivot table of occurrence of 30 ‘IEEE Terms’ in 10 journals.
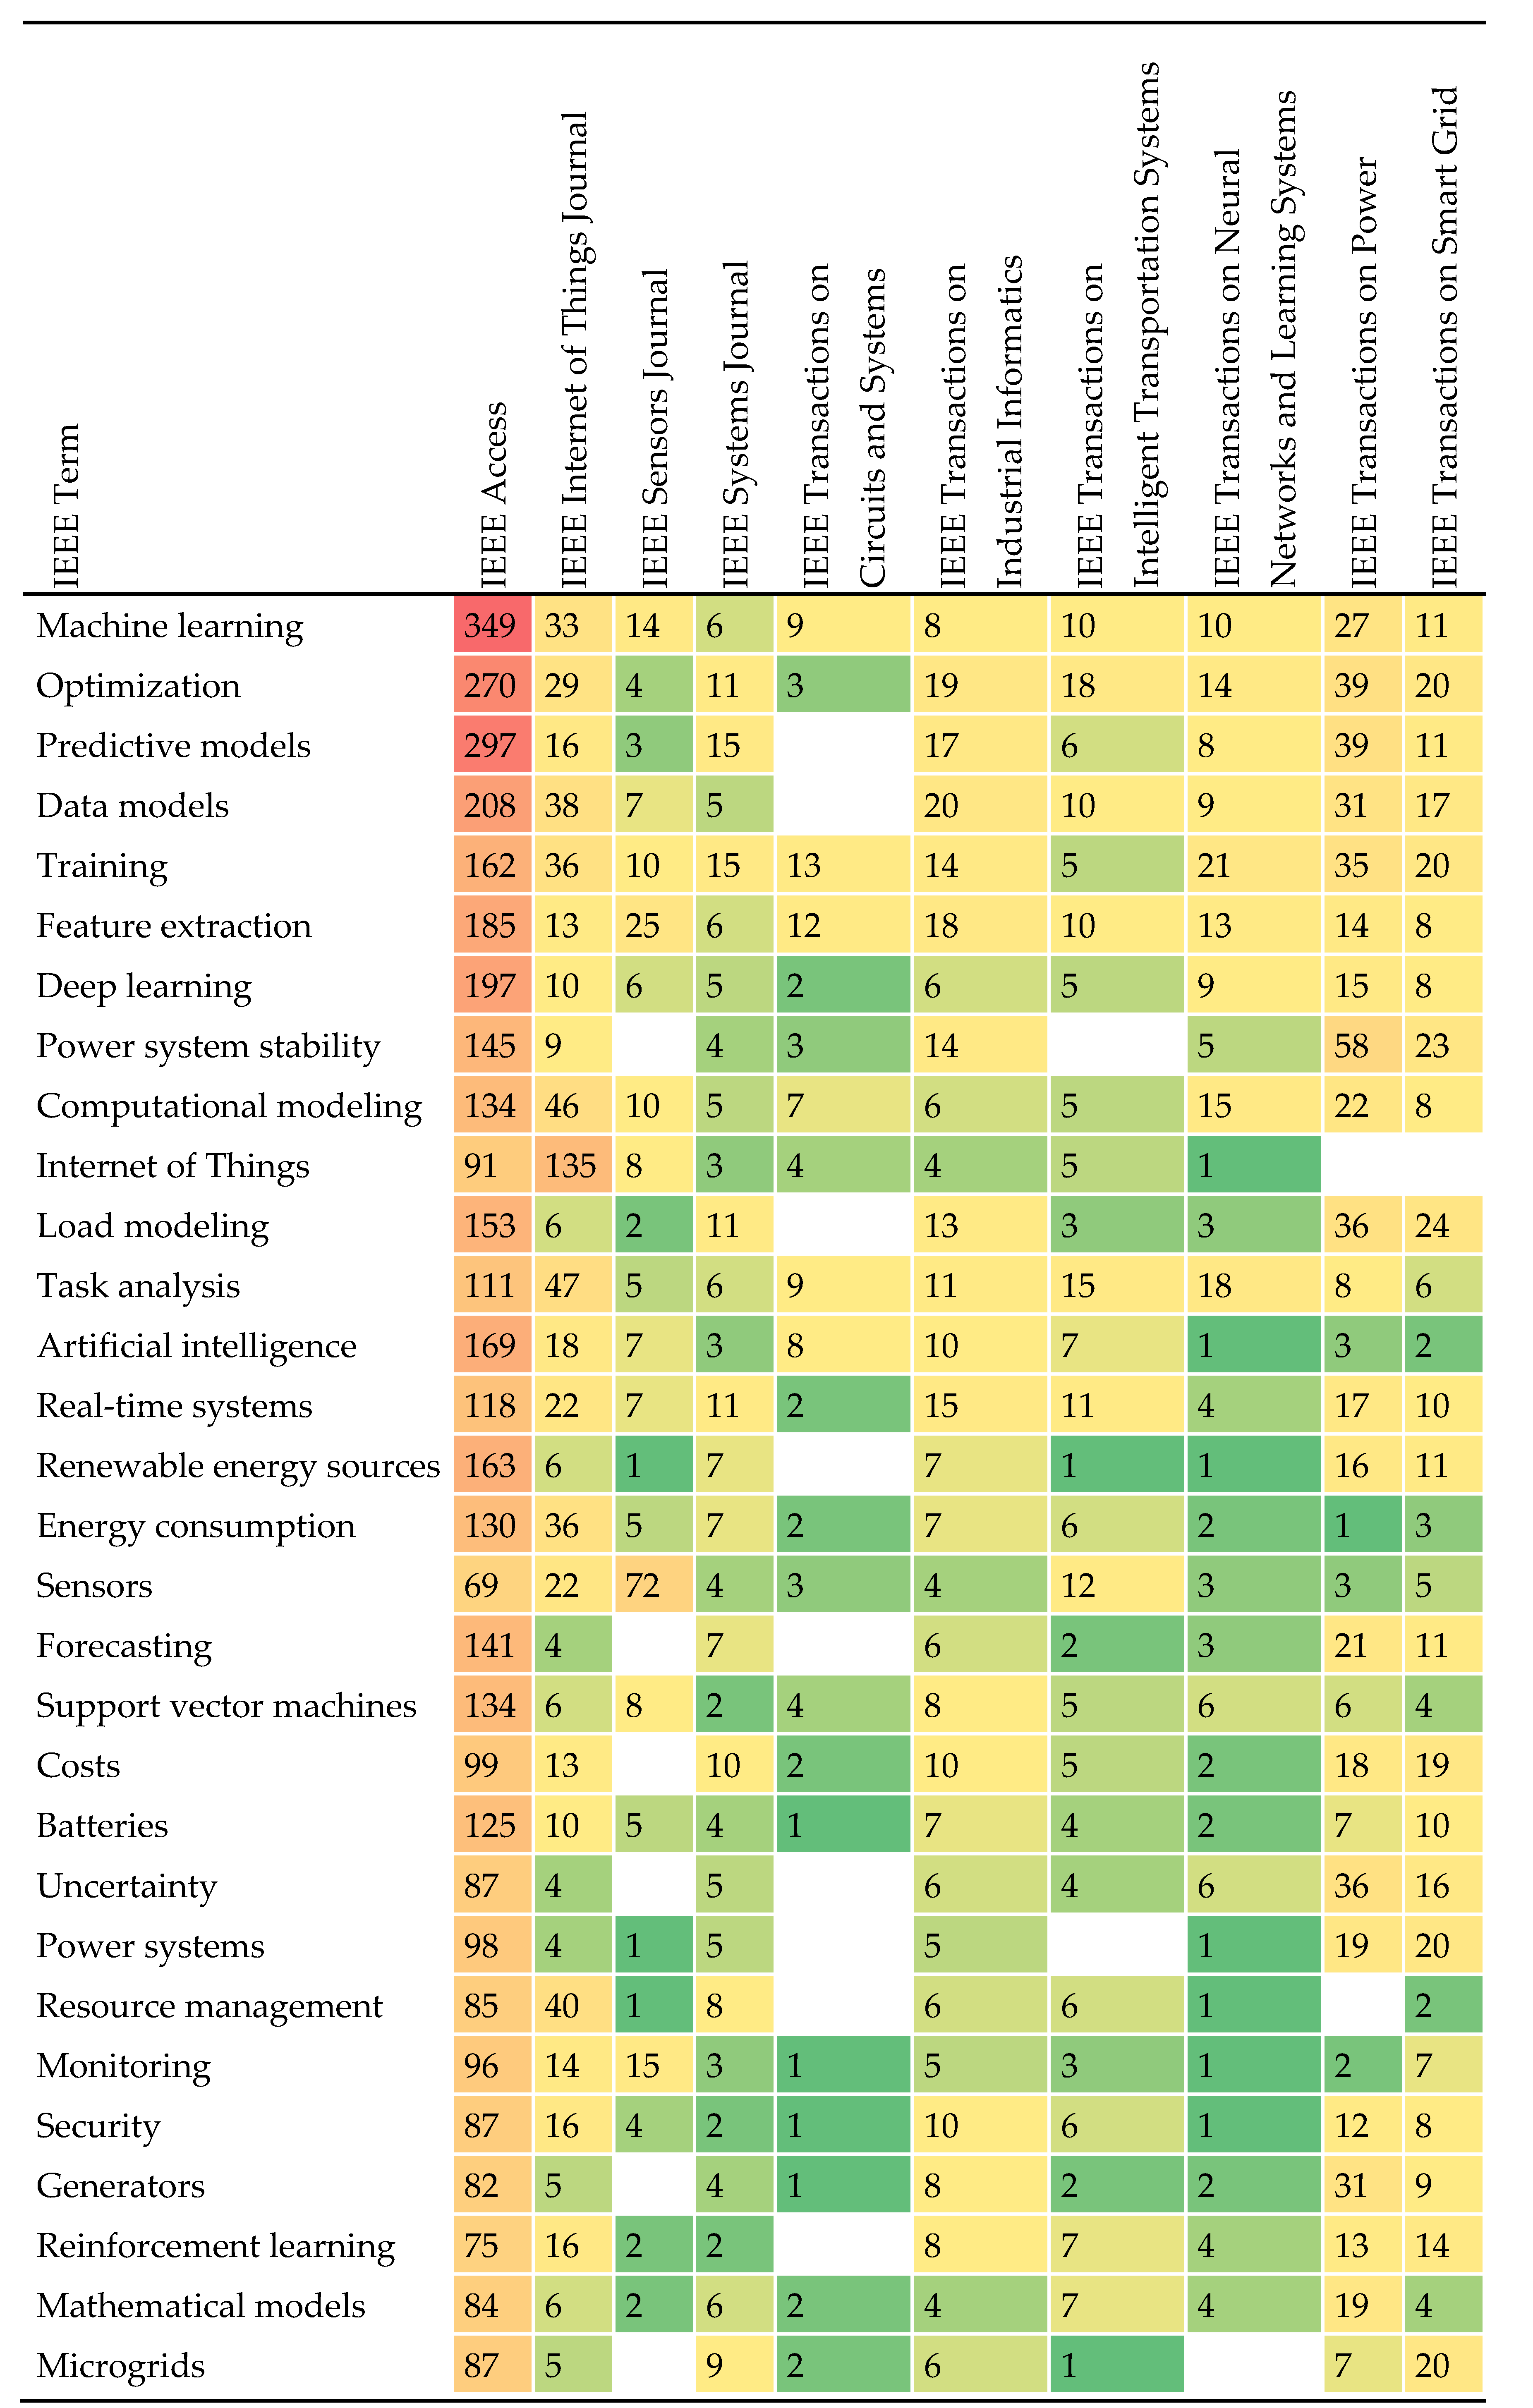
Table 8.
Top 30 ‘IEEE Terms’ for all 5 clusters selected by their occurrences.
| IEEE Term | N | IEEE Term | N | IEEE Term | N |
| machine learning | 739 | power system stability | 357 | batteries | 260 |
| optimization | 688 | real-time systems | 349 | costs | 252 |
| training | 663 | load modeling | 328 | monitoring | 241 |
| predictive models | 598 | internet of things | 318 | forecasting | 237 |
| data models | 592 | resource management | 315 | wireless communication | 228 |
| computational modeling | 493 | energy consumption | 313 | security | 226 |
| feature extraction | 483 | sensors | 291 | reinforcement learning | 225 |
| task analysis | 456 | renewable energy sources | 279 | power systems | 224 |
| artificial intelligence | 404 | support vector machines | 272 | neural networks | 222 |
| deep learning | 378 | uncertainty | 262 | mathematical models | 215 |
Table 9.
Top 10 ‘IEEE Terms’ by frequency of occurrence for each of the 5 clusters.
| Cluster-1 | Cluster-2 | Cluster-3 | Cluster-4 | Cluster-5 |
| machine learning | optimization | computational modeling | power system stability | predictive models |
| training | real-time systems | task analysis | power systems | data models |
| feature extraction | renewable energy sources | artificial intelligence | mathematical models | load modeling |
| deep learning | uncertainty | internet of things | generators | forecasting |
| sensors | batteries | resource management | voltage control | prediction algorithms |
| support vector machines | costs | energy consumption | reliability | mathematical model |
| monitoring | reinforcement learning | wireless communication | power system dynamics | adaptation models |
| neural networks | heuristic algorithms | security | power grids | biological system modeling |
| artificial neural networks | microgrids | servers | stability criteria | analytical models |
| computer architecture | energy management | cloud computing | transient analysis | wind power generation |
Table 10.
Top 10 ‘IEEE Terms’ by occurrence in new publications (Avg.pub.year score) for each of the 5 clusters.
Table 10.
Top 10 ‘IEEE Terms’ by occurrence in new publications (Avg.pub.year score) for each of the 5 clusters.
| Cluster-1 | Cluster-2 | Cluster-3 | Cluster-4 | Cluster-5 |
| accuracy | reviews | surveys | regulation | long short term memory |
| computational efficiency | electricity | federated learning | mathematical models | transformers |
| random forests | deep reinforcement learning | autonomous aerial vehicles | voltage | solar power generation |
| transfer learning | metaheuristics | digital twins | contingency management | extreme learning machines |
| convolutional neural networks | behavioral sciences | blockchains | aircraft | solar energy |
| memristors | optimization methods | energy efficiency | numerical stability | urban areas |
| wearable computers | climate change | quantum computing | perturbation methods | adaptation models |
| location awareness | q-learning | industrial internet of things | impedance | production |
| transistors | sustainable development | systematics | capacitors | analytical models |
| quantization (signal) | costs | artificial intelligence | steady-state | boosting |
Table 11.
Top 10 ‘IEEE Terms’ by occurrence in highly cited publications (Avg.norm.citations score) for each of the 5 clusters.
Table 11.
Top 10 ‘IEEE Terms’ by occurrence in highly cited publications (Avg.norm.citations score) for each of the 5 clusters.
| Cluster-1 | Cluster-2 | Cluster-3 | Cluster-4 | Cluster-5 |
| pipelines | power supplies | blockchain | regulation | market research |
| signal processing algorithms | job shop scheduling | medical services | maximum power point trackers | covid-19 |
| intrusion detection | dynamic scheduling | manufacturing | computer crime | big data |
| integrated circuit modeling | climate change | collaborative work | nonlinear dynamical systems | load forecasting |
| temperature sensors | autonomous vehicles | communication system security | power electronics | maintenance engineering |
| location awareness | vehicle-to-grid | 6g mobile communication | frequency control | smart meters |
| diseases | transportation | 5g mobile communication | cyberattack | wind turbines |
| fault diagnosis | optimal control | digital twins | reliability | data models |
| power quality | vehicle dynamics | solid modeling | thermal stability | forecasting |
| quantization (signal) | peer-to-peer computing | automation | computer security | biological system modeling |
Disclaimer/Publisher’s Note: The statements, opinions and data contained in all publications are solely those of the individual author(s) and contributor(s) and not of MDPI and/or the editor(s). MDPI and/or the editor(s) disclaim responsibility for any injury to people or property resulting from any ideas, methods, instructions or products referred to in the content. |
© 2024 by the authors. Licensee MDPI, Basel, Switzerland. This article is an open access article distributed under the terms and conditions of the Creative Commons Attribution (CC BY) license (http://creativecommons.org/licenses/by/4.0/).
Copyright: This open access article is published under a Creative Commons CC BY 4.0 license, which permit the free download, distribution, and reuse, provided that the author and preprint are cited in any reuse.


