1. Introduction
Horse is a common domestic animal, which is usually used for sports, companionship and various work roles [
1]. At one time, horses were considered as important partners of human beings in agriculture and war, especially in transportation; Nowadays, horses play a major role in sports, leisure and tourism [
2]. In the horse industry, especially for sports horses, continuous single stable grazing (> 20h/day) is still dominant, and more and more scientific evidence shows that single stable grazing has a negative impact on the health of horses [
3]. Horse postures and behaviors is one of the important factors to reflect its health status. When a horse has health problems, it will show different behavior characteristics. Monitoring the postures and behaviors of horses in stables and promptly assessing their health status is of paramount importance for modern horse industry management. However, in the face of continuous horses raised in a single stable, there are various problems such as high cost, high strength and easy fatigue in manual monitoring. Therefore, it is very necessary to use advanced equipment and technical means to quickly and efficiently identify horse postures and behaviors.
Recently, researchers have been exploring methods of animal behaviors recognition. Some researchers are committed to the research of intelligent wearable devices in animal behaviors recognition, and have achieved certain results. For example, using wearable equipment on sheep and using traditional machine learning algorithm, the classification of sheep behaviors [
4,
5] and the analysis of sheep behaviors when facing predators [
6] are realized. Similarly, smart wearable devices are also applied to the behavior analysis of dairy cows, achieved the analysis of common behaviors of dairy cows [
7,
8] and the analysis of milk yield of dairy cows [
9].
With the development of computer vision technology, researchers widely use deep learning to identify animal behaviors. Man et al. [
10] used YOLO v5 to identify four behaviors of sheep, namely, lying, standing, grazing and drinking, and achieved an accuracy of 0.967. Yalei et al. [
11] established a fusion network structure based on yolo and LSTM, and realized the identification of aggressive behavior of flock sheep, and achieved 93.38% accuracy. Hongke et al. [
12] proposed a high-performance sheep image instance segmentation method based on Mask R-CNN framework, and the indexes of box AP, mask AP and boundary AP on the test set reached 89.1%, 91.3% and 79.5% respectively. Zishuo et al. [
13] proposed a two-stage detection method based on yolo and VGG networks, which realized the identification of sheep behaviors and the classifications accuracy exceeded 94%. In the research field of cow behaviors recognition, various behavior recognition models based on yolo algorithm have also been widely used. For example, the recognition accuracy of routine behaviors such as drinking water, ruminating, walking, standing and lying down, grazing behavior and estrus behavior of dairy cows is higher than 94.3% [
14,
15,
16]. Cheng et al. [
17] proposed a method of cattle behavior recognition based on the dual attention mechanism, which combined the improved SE and CBAM attention modules with mobileNet network. The accuracy of this method can reach 95.17%. For other animal behaviors, such as pig and dog behavior recognition, researchers used convolutional neural network (CNN), long-term and short-term memory network (LSTM), DeepSORT network, yolox series network, ResNet50, PointNet and other networks to design an improved model based on the optimized parameters of the above networks or a multi-network fusion model to optimize the network structure. The recognition of routine behavior (walking, standing and lying down, etc.) [
18,
19], individual recognition [
20], grazing time statistics [
21], three-dimensional posture estimation [
22,
23], emotion recognition[
24]and aggressive behavior recognition[
25]are realized, and the accuracy rate is higher than 90%. Kaifeng et al. [
26] proposed the video behavior recognition of pigs by combining the extended 3D convolution network (I3D) and the time sequence segmentation network (TSN), and the average accuracy rate of recognizing pigs' behaviors such as grazing, lying down, walking, scratching and crawling was 98.99%.
Conclusively, researchers have achieved excellent research results in their respective research fields by using different intelligent devices and advanced algorithms. However, in the field of intelligent recognition of horse behaviors, no related research has been found. This study fully consider and analyzed various research method put forward by researchers, and summarized that following views:
Smart wearable devices are contact data collection devices. Horses are more alert and sensitive than other domestic animals, especially when it comes to physical contact. As a result, there will be some interference with different horse postures and behaviors when using contact intelligent wearable devices. So, it is not the best idea to study horse postures and behaviors using contact-based intelligent wearable devices.
Compared with pictures, videos contain time series, and video behaviors recognition requires attention to both the target's spatial and temporal dimensions, making it richer in time domain information than picture behavior recognition alone. Therefore, video behaviors recognition has spatio-temporal characteristics. The research object of this study is the horse in stable, and its behaviors have very important spatio-temporal characteristics. Consequently, it is more meaningful to adopt horse video behavior recognition.
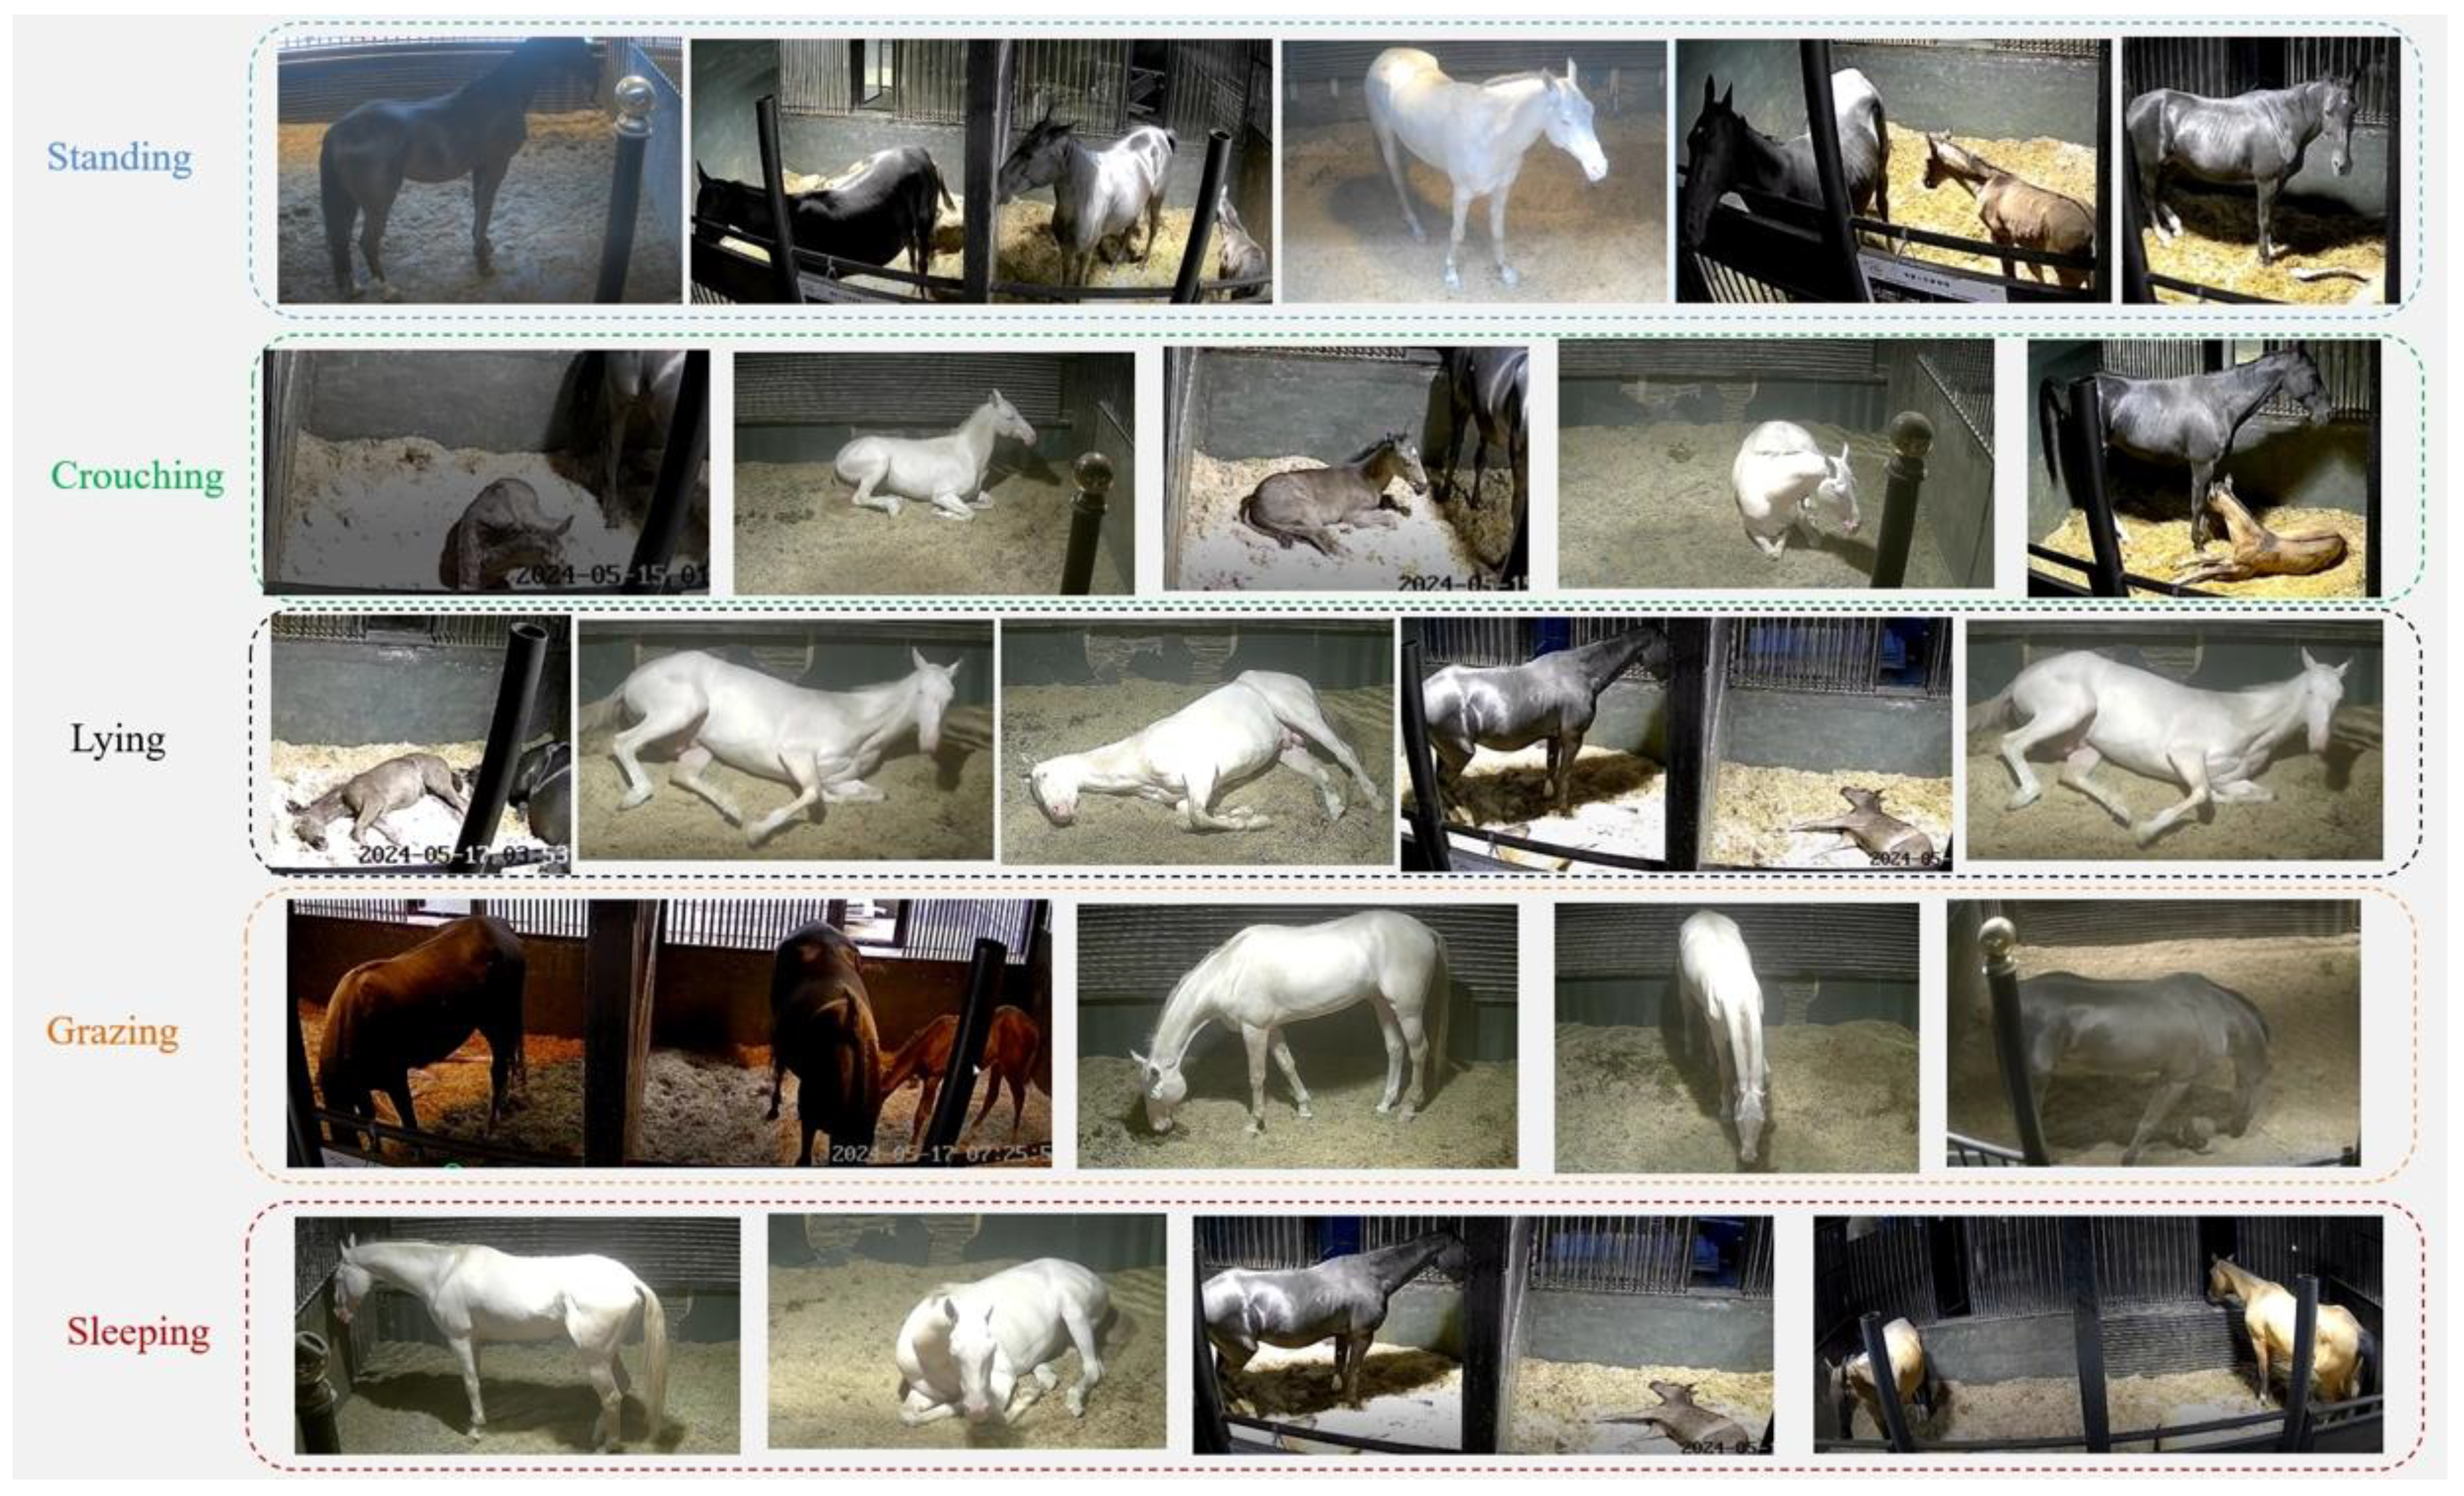
Behaviors recognition is a complex and challenging research. The common postures of horse include: Standing、Crouching and Lying.the common behaviors are: Sleeping and Grazing. Horses' behaviors all occur in a certain posture, so it is particularly important to apply the multi-label recognition algorithm to the recognition of horse postures and behaviors.
According to the above point of view, this study uses SlowFast [
27] algorithm to recognize horse postures and behaviors. The algorithm can realize multi-tag recognition, and mark the result on the recognition object in the way of bounding box, which makes the result more intuitive and valuable. The contributions of this study are as follows:
(1). An AVA format dataset for horse multiple postures and behaviors recognition is constructed, which includes five categories: Standing, Crouching, Lying, Sleeping and Grazing.
(2). SE attention module is applied to the SlowFast network, and an improved loss function is proposed, which improves the accuracy of SlowFast in identifying horse posture and behavior.
(3). YOLOX is applied to the behaviors recognition of SlowFast network, which improves the efficiency of horse video recognition.
2. Materials and Methods
2.1. Description of Horse Postures and Behaviors
In the stable, most postures of horses are Standing, crouching and lying, and their behaviors are based on these three postures. Horses' sleeping behavior and grazing behavior are of great significance to their health. Horses that have no sleep due to prolonged activities will result in health detection and poor welfare, and made a detailed analysis with pictures of three sleeping positions [
28]. Linda et al. [
29] described the relationship between horse's sleep behavior and horse's health from four aspects, and put forward how to study horse's sleep behavior in the future. The lack of foraging opportunity leads to a reduction in caring time with consistent negative impacts on the digestive system and potential development of stereotypes [
30]. In this study, computer vision algorithm will be used to study the sleeping behavior and grazing behavior of horses in a non-contact way, which will bring benefits to horse health. As shown in
Figure 1, the original data supporting this study are all multi-angle and multi-directional video data resources from the experimental base.
J´essica et al. [
31] described the behavior of more than ten kinds of horses. The research team fully investigated the experimental base and put forward horses postures and behaviors suitable for this study. As shown in
Table 1, there are seven kinds of tags for Multiple postures and behaviors recognition of horse based on SE-SlowFast network, namely, Standing, Crouching, Lying, Standing-Sleeping, Standing-Grazing, Crouching-Sleeping and Lying-Sleeping.
2.2. Environmental Index
The postures and behaviors of horse are intricately linked with weather conditions, especially temperature [
32]. Maintaining the horse's living environment within an optimal temperature range is crucial for conducting research on horse postures and behaviors. Therefore, in this study, intelligent sensors were installed on the beams of the stable to monitor environmental data such as temperature, illumination, and humidity, ensuring the scientific integrity of the research. As depicted in
Figure 2, we records the key weather indices during the study period (from May 2023 to August 2023).
2.3. Data Acquisition
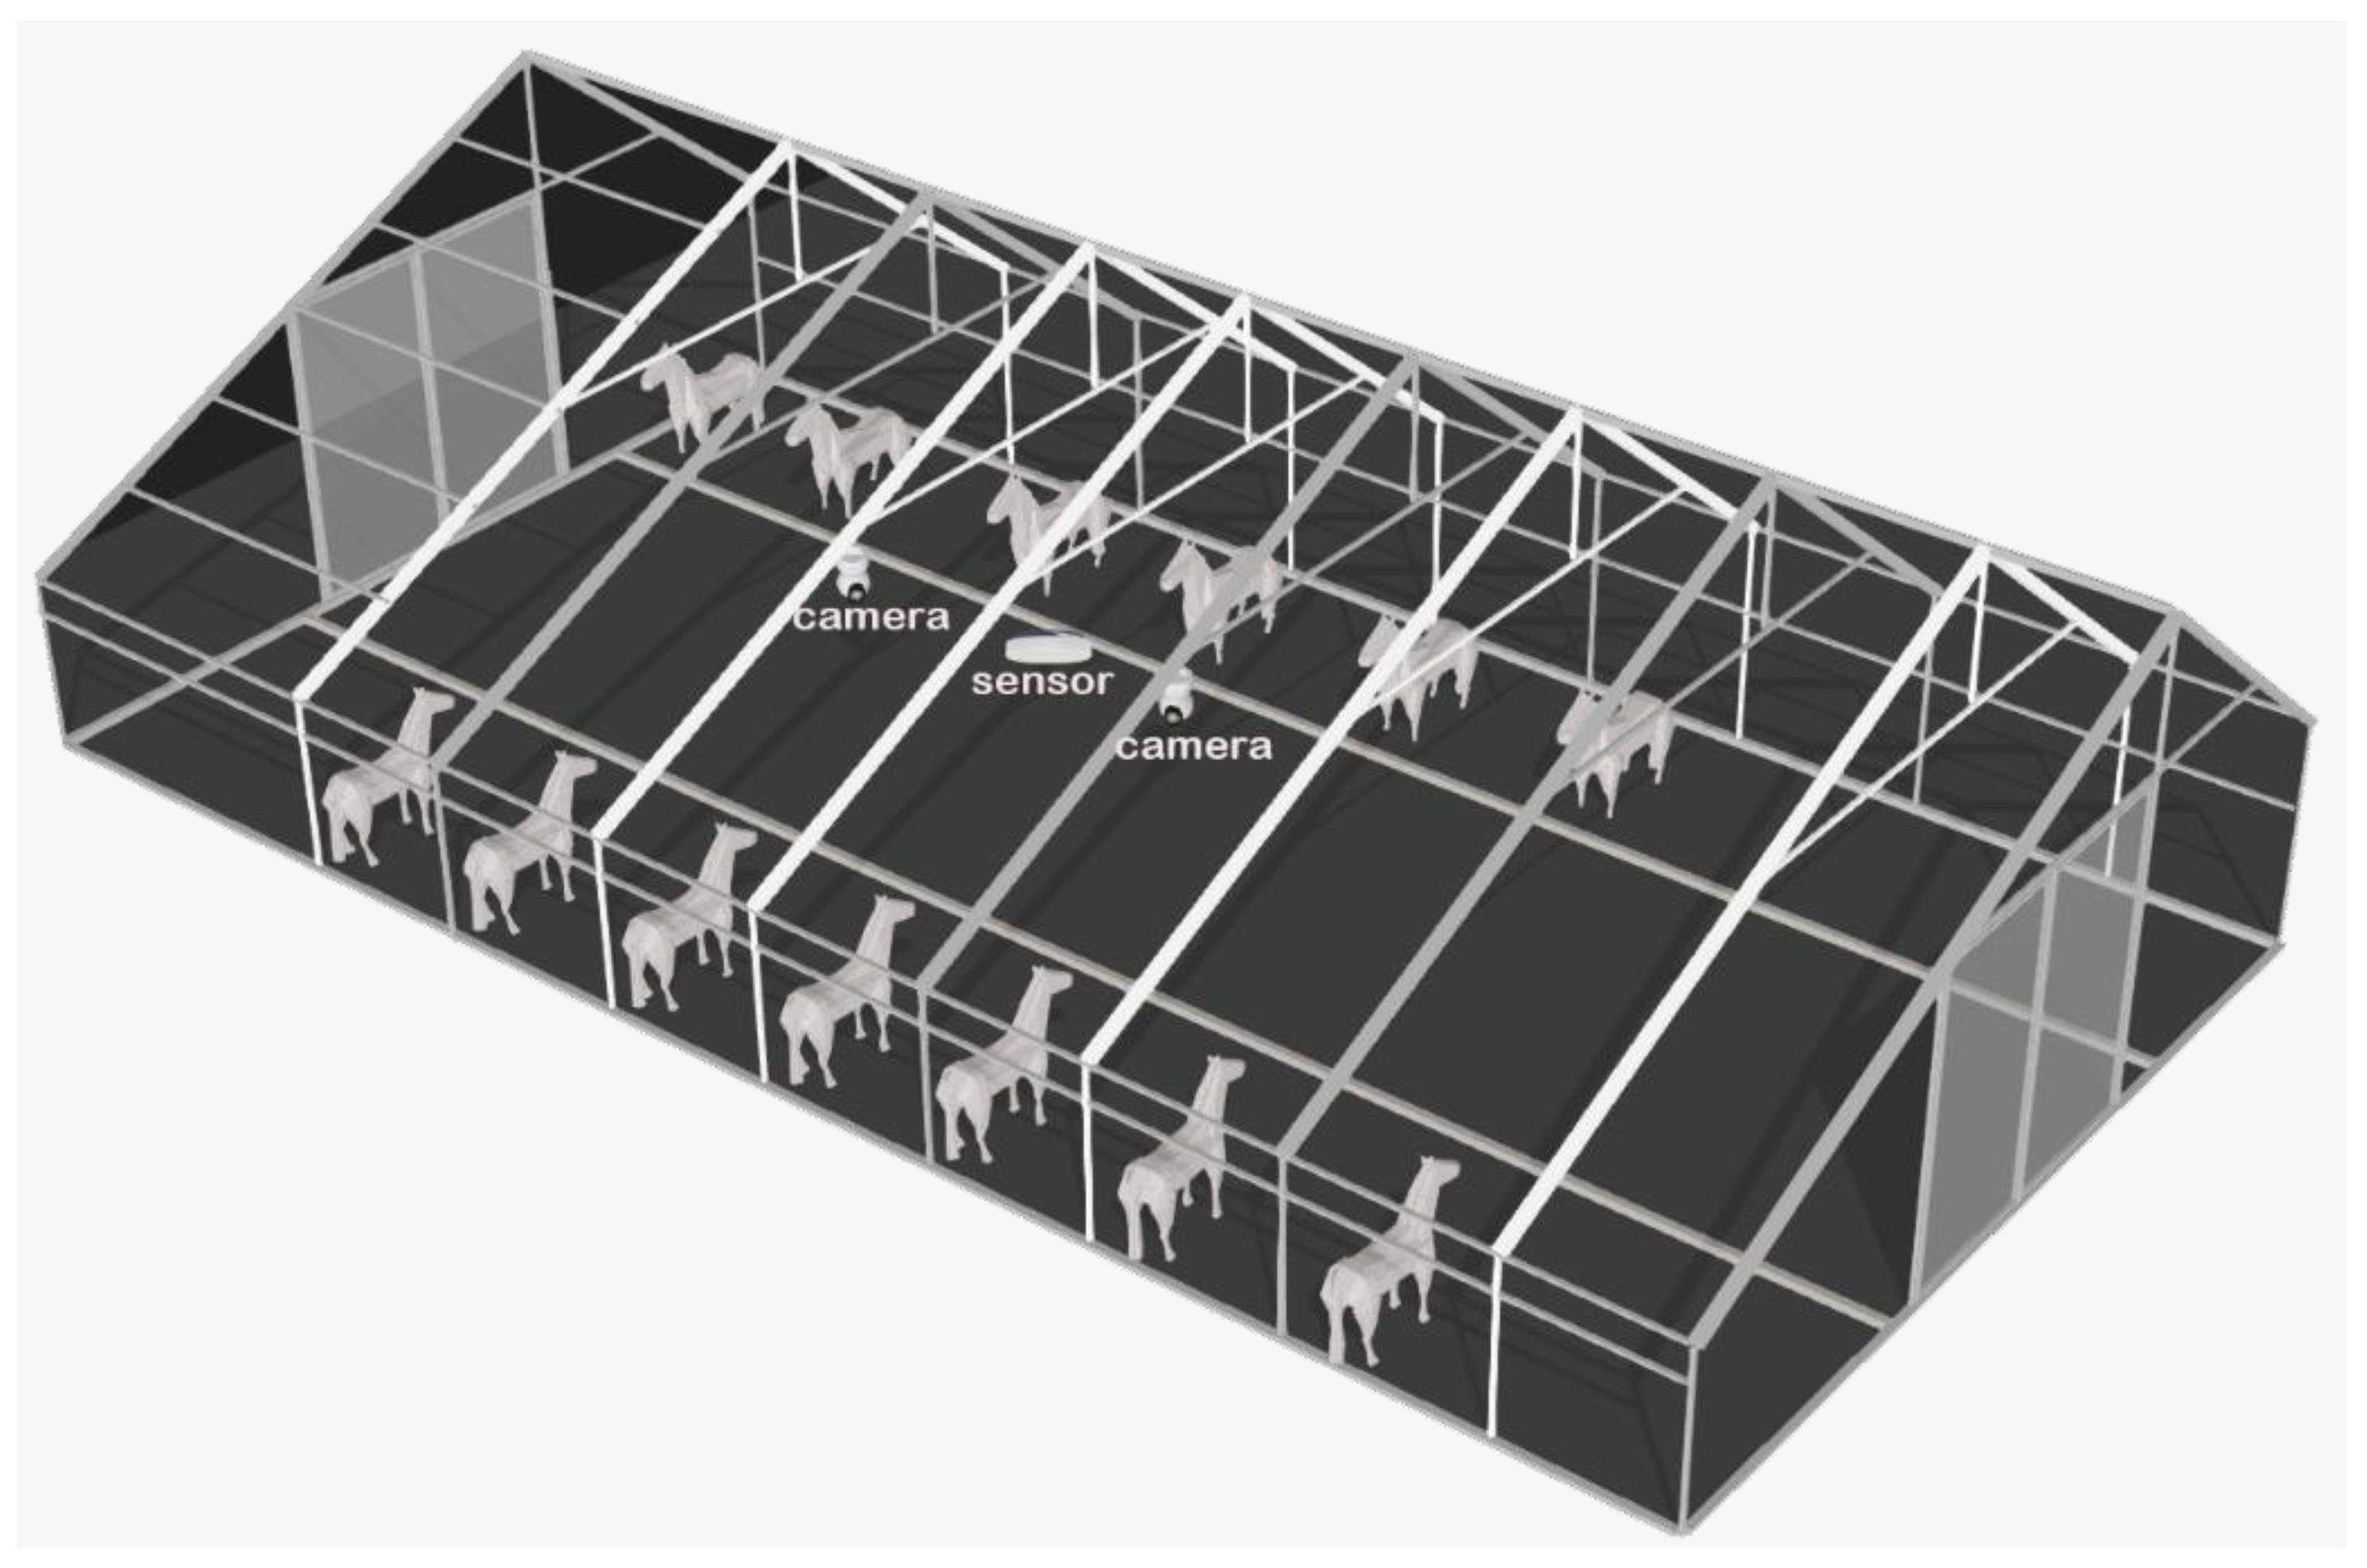
To efficiently and non-invasively collect horse postures and behaviors data without disturbing or affecting the horses' normal activities, this study employed smart cameras. As illustrated in
Figure 3, a set of high-definition cameras with 360-degree rotation capability was strategically installed on the beams of the stable. The video streams were recorded at a resolution of 1920 x 1080 pixels with a frame rate of 30.0 frames per second. Each camera was positioned to cover a specific horse stall, comprehensively capturing the postures and behaviors of the horse in their respective stalls.
The data collection for this study was divided into two phases. The first phase spanned from May 2023 to August 2023, while the second phase took place from May to June 2024. Two sets of cameras were deployed: one for collecting data from stallions and the other for collecting data from mares and foals. A total of 48 horses, including stallions, mares, and foals, were captured in the video dataset. In total, 320 raw video clips were recorded, with a cumulative size of 9.08 TB. During the entire data collection process, continuous analysis of all the raw videos revealed a high degree of repetition in the postures and behaviors of horses within the stable. For most of the time, the horses in the stable were observed in a standing posture, occupying the majority of the 24-hour period. For example, the duration of sleep behavior in a standing posture was approximately 10 minutes, during which the horse remained nearly motionless. This posed challenges for subsequent video frame extraction. Additionally, due to the large body size of the horses, it was common for them to either turn their backs to the camera or extend their heads out of the stable, making it difficult to capture the postures and behavioral information accurately in the raw data. Based on these observations, this study systematically analyzed and organized all the posture and behavior videos collected during this period, forming a subset that represents the raw data of horse behavior for further analysis.
After excluding incomplete and highly repetitive data samples, this study retained 41 original videos capturing horse postures and behaviors, occupying a total space of 9.6 GB. As depicted in
Figure 4, a subset of data samples utilized for horse behavior recognition research is showcased
2.4. Dataset Construction
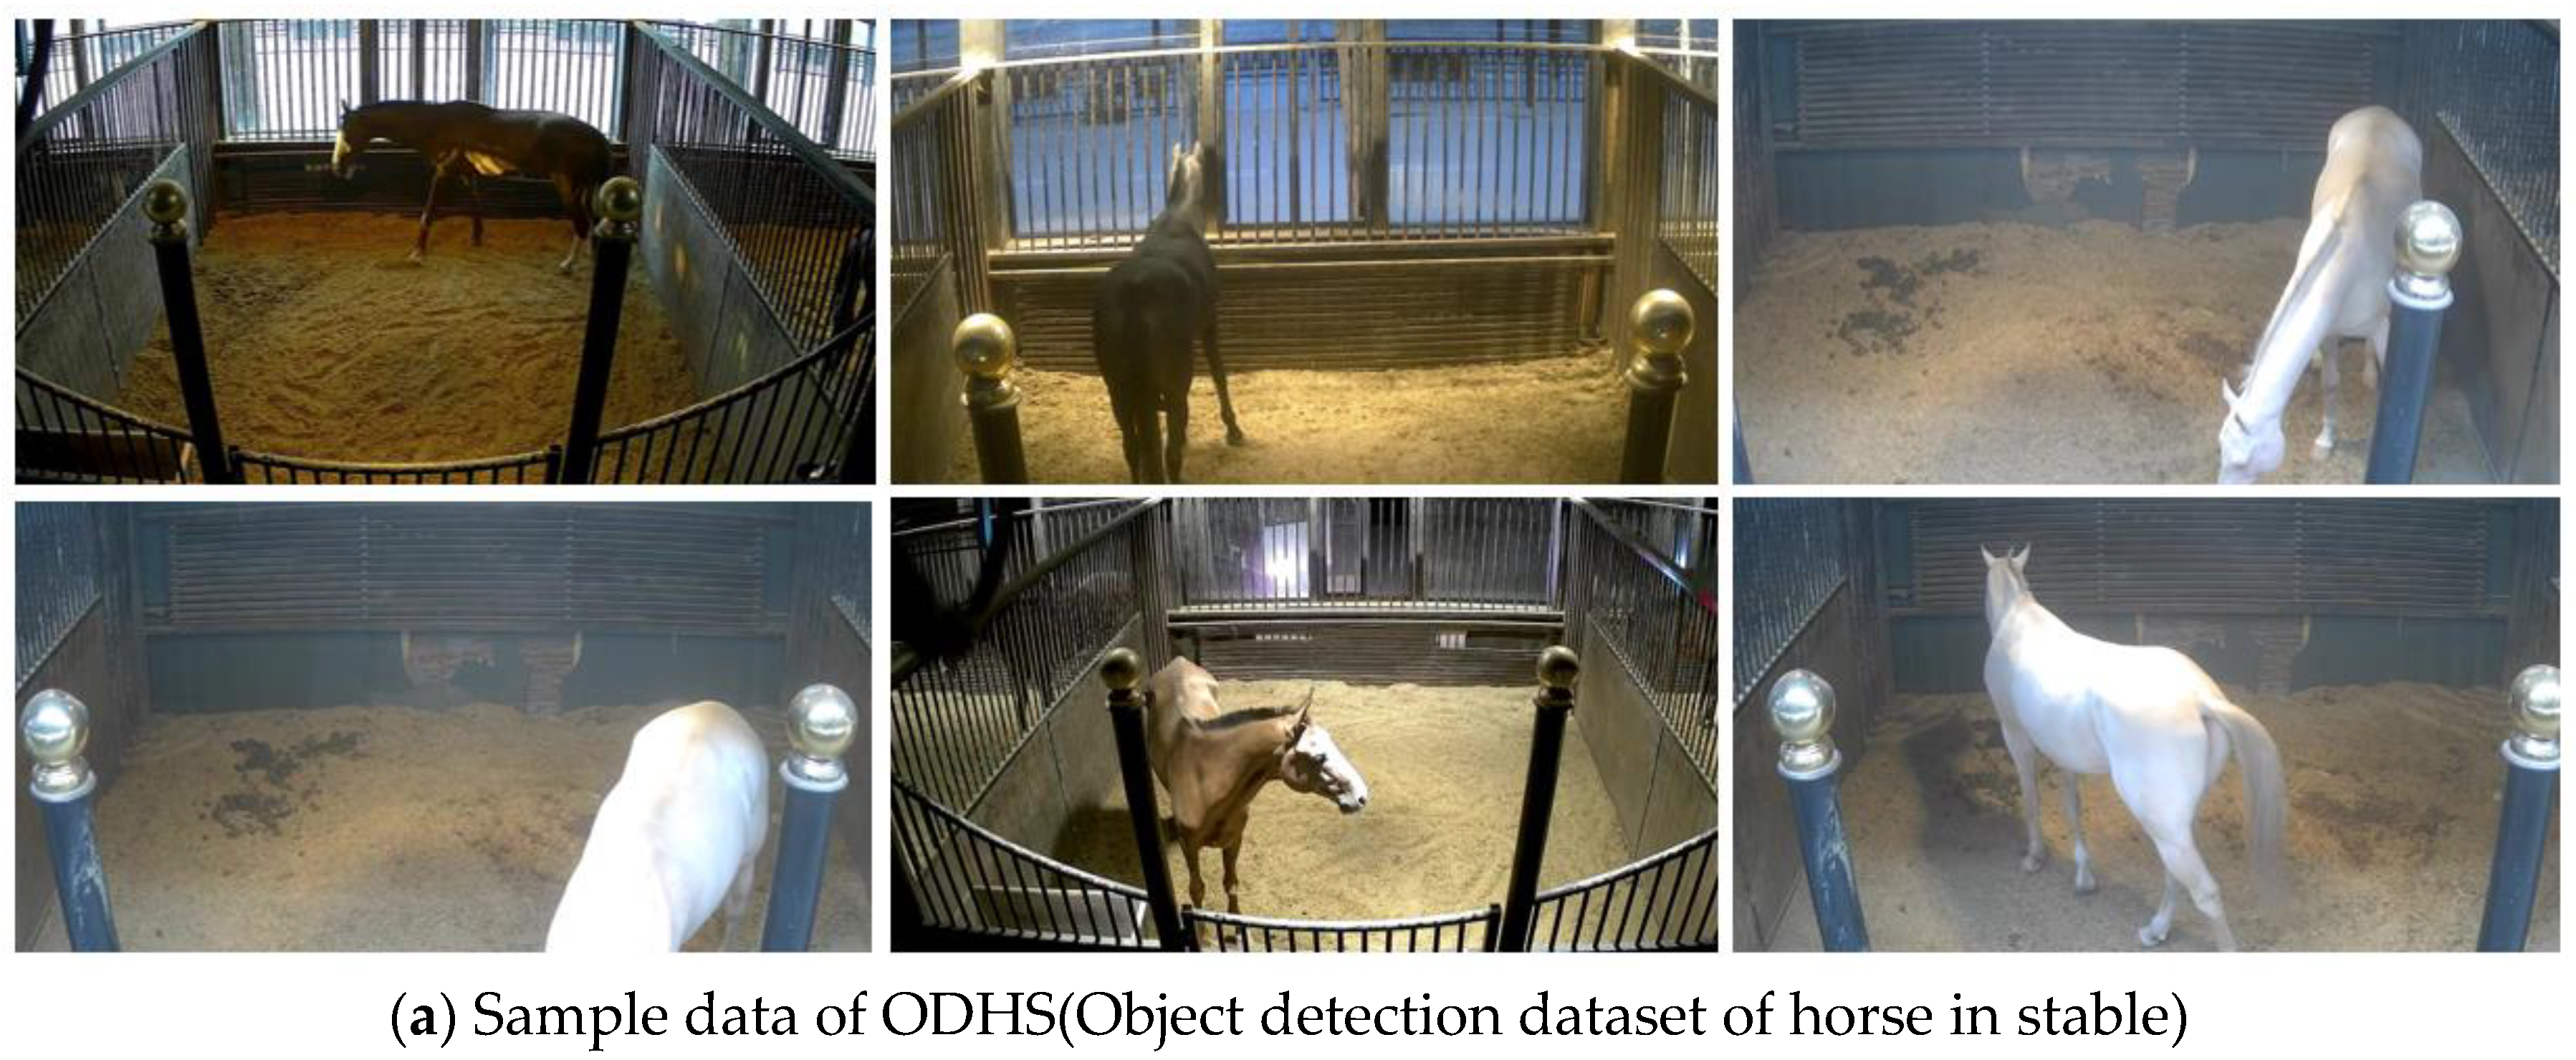
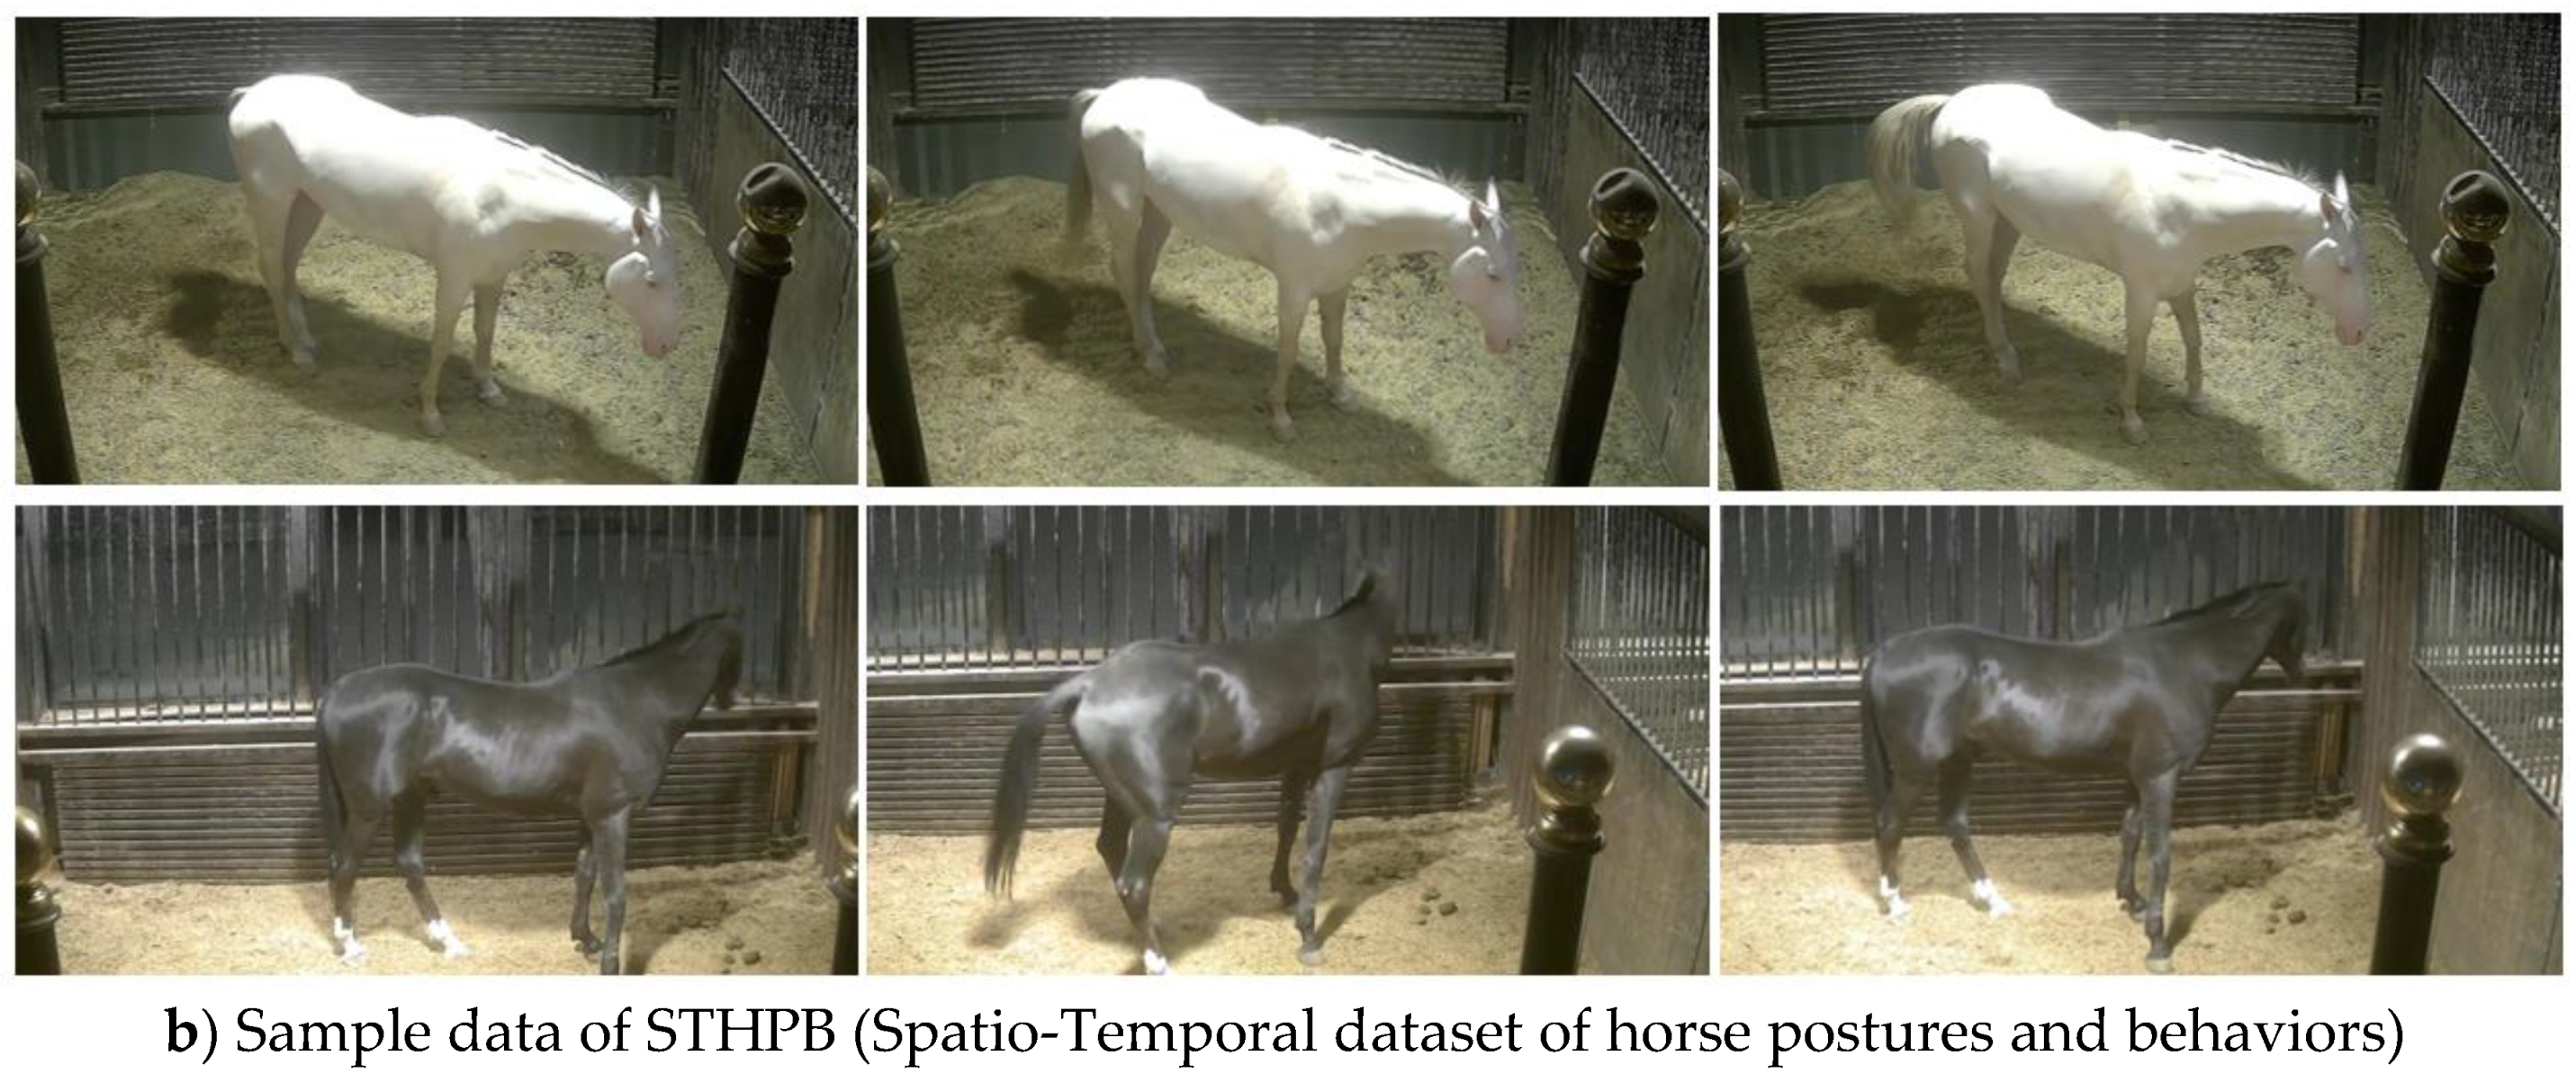
One of the focal points of this study is to construct two datasets: ODHS (Object Detection Dataset of Horse in Stable) for horse target detection and STHPB (Spatio-Temporal Dataset of Horse Postures and Behaviors) for spatio-temporal detection of horse postures and behaviors. As illustrated in
Figure 5, ODHS is employed for detecting horses within the stable. STHPB is a spatio-temporal dataset focusing on horse postures and behaviors detection, encompassing all postures and behaviors data necessary for spatio-temporal detection of horses. The most important thing is that ODHS contains STHPB, which enables YOLOX to detect horses in all key frame pictures used in SE-SlowFast network when ODHS is applied to YOLOX.
2.5. Model Implementation
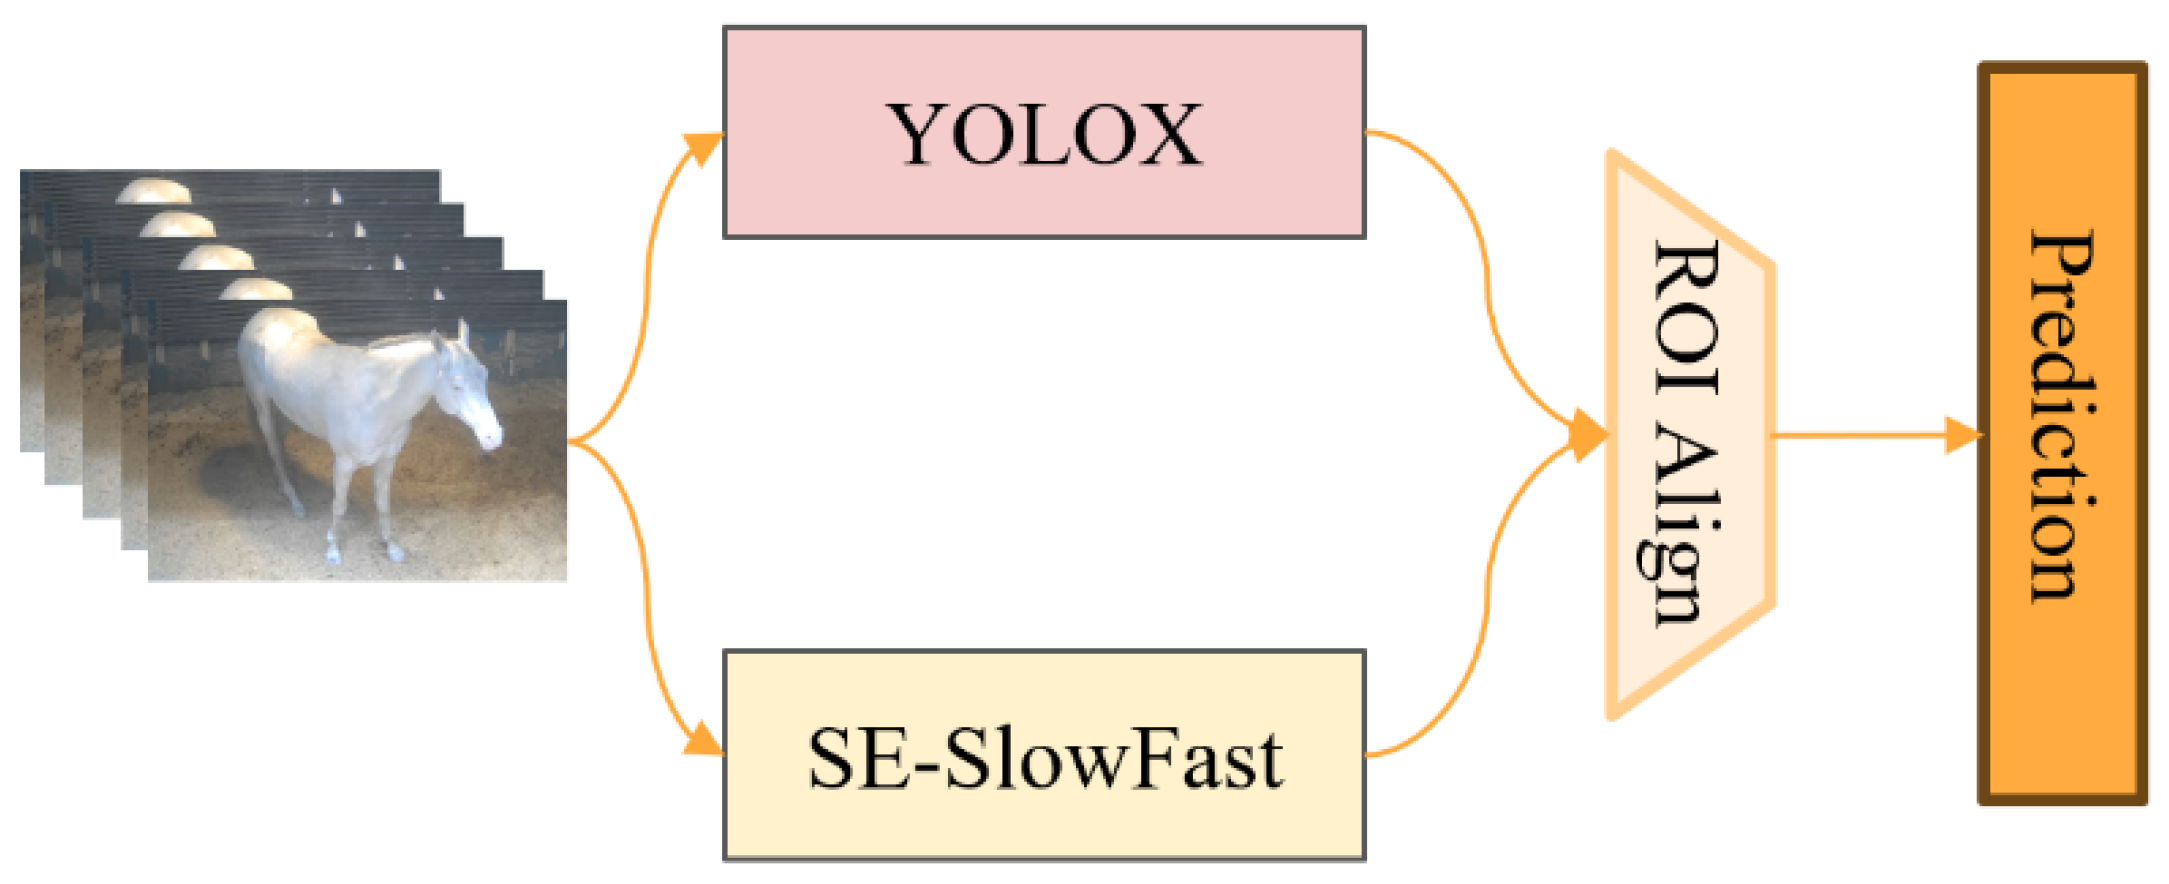
To better recognize various horse postures and behaviors, we designed the identification framework as illustrated in
Figure 6. In the task of recognizing multiple horse postures and behaviors, we replaced the original object detection algorithm, Faster R-CNN, integrated within the SlowFast network and instead adopted YOLOX for standalone object detection. This approach specifically identifies adult horses and foals in key frames. For posture and behavior recognition, we applied the improved SE-SlowFast algorithm. Finally, the RoIAlign method was employed to process the feature regions of interest for both object detection and behavior recognition, ensuring uniform sizing before performing classification predictions for various horse postures and behaviors.
2.5.1. SE-SlowFast Network
The recognition of horse multiple postures and behaviors adopts a dual-stream network architecture known as the SE-SlowFast network. This network comprises three main components: Slow pathway with SE attention module added, fast pathway, and lateral connection, as depicted in
Figure 7.
2.5.1.1. SlowFast Network
The SlowFast network includes slow path and fast path. Slow Pathway: With an original clip length of 64 frames, the slow pathway's backbone network utilizes ResNet50. It has a larger time stride on input frames, set to 16 in this study, resulting in a refresh rate of approximately 2 frames per second, processing 1 frame out of 16. The number of frames sampled by the slow pathway is 4. Therefore, the slow pathway effectively addresses temporal down sampling. Fast Pathway: Compared to the slow pathway, the fast pathway possesses characteristics such as a high frame rate, high temporal resolution features, and low channel capacity. In terms of feature channels, the fast pathway uses a smaller time stride, set to 2 in this study. No temporal down sampling layer is used throughout the entire fast pathway until the global pooling layer before classification, ensuring the fast pathway maintains high-resolution features. Additionally, the fast pathway adopts a smaller number of channels, set to 1/8 of the slow pathway in this study. Given that the slow pathway has 64 channels, the fast pathway is configured with only 8 channels. This configuration ensures the fast pathway exhibits superior accuracy. After completing feature matching, the lateral connection links from the fast path to the slow path. Through multiple lateral connections, SlowFast achieves the fusion of feature information from both stream branches. Finally, the fused feature information is fed into the classifier for horse multifaceted behavior classification predictions.
2.5.1.2. SE Module
The basic structure of SE Module is shown in
Figure 8. For any given transform F
tr: X→U, X∈R
W′×H′×C′, U∈R
W×H×C. The feature U first passes through F
sq,which can aggregate feature mapping across spatial dimension W×H to generate channel descriptors。This descriptor embeds the global distribution of channel characteristic response, so that the information from the global receptive field of the network can be used by its lower layers. After that, through F
sq,the activation of specific samples is learned for each channel through the self-gating mechanism based on channel dependence, and the excitation of each channel is controlled. The feature map U is then re-weighted to generate the output of the SE block.
2.5.2. YOLOX Network
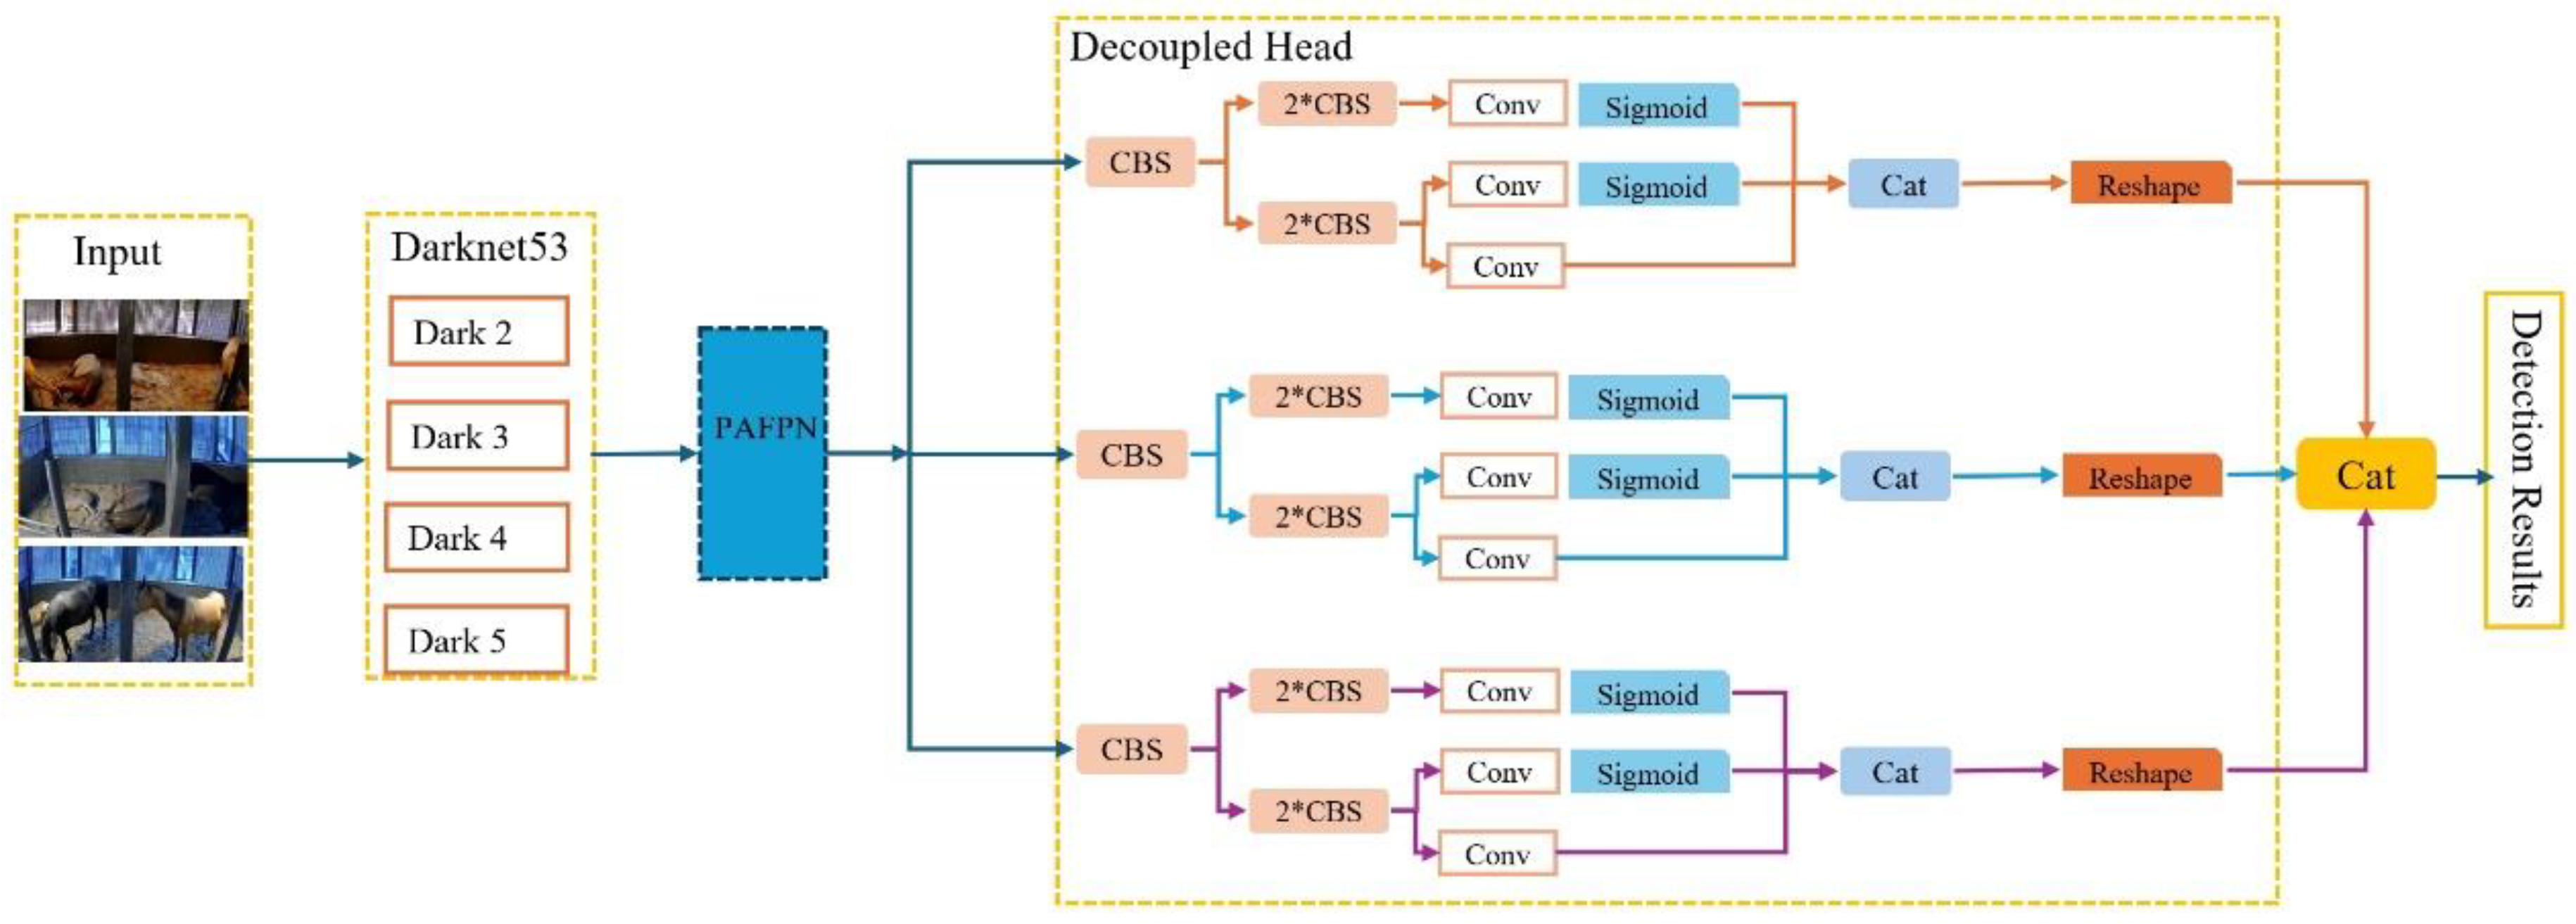
To better identify adult horses and foals in key frames, as shown in
Figure 9, we adopt YOLOX as the target detection algorithm, with yoloV3 and Darknet 53 as the baseline, and adopt the structure of Darknet 53 backbone network and SPP layer. The key structure of YOLOX is the use of Decoupled Head, which improves the convergence speed of YOLOX and realizes the end-to-end performance of YOLOX.
2.6. Improved Loss Function
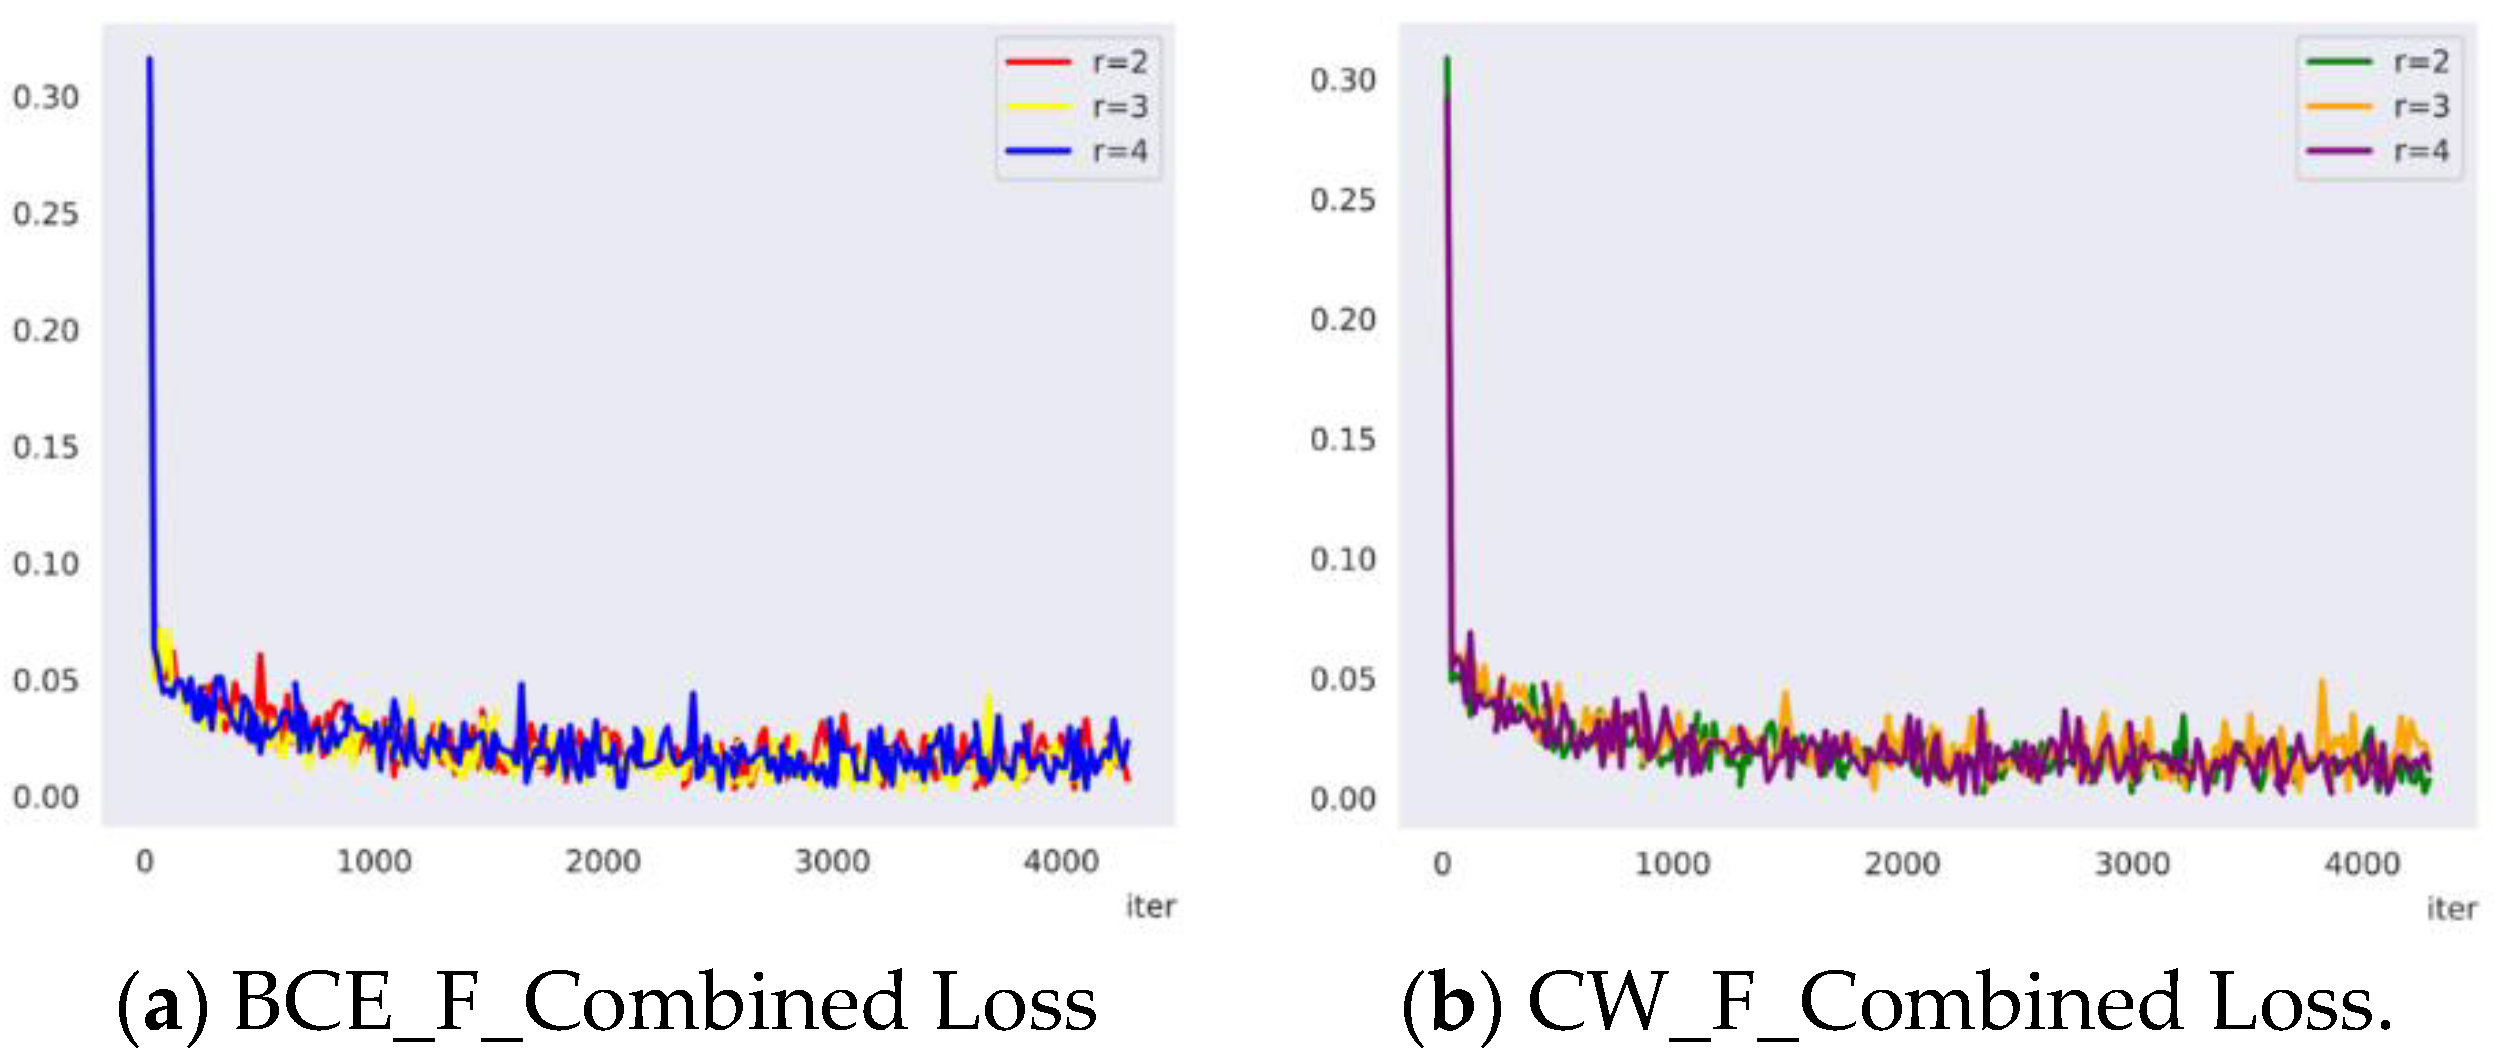
In classification tasks, the commonly used loss function for multilabel classification is Binary Cross Entropy Loss (BCE Loss). However, BCE Loss may not perform optimally when dealing with imbalanced datasets, leading to lower accuracy during model training. Therefore, this study addresses the characteristics of the STHPB dataset and adopts the CW Loss (Class Weighted Loss) combined with Focal Loss to form the CW_F_Combined Loss. This aims to reduce the weight of the loss function for categories with more instances and increase the weight for categories with fewer instances in the multilabel dataset. The formula for CW Loss is as follows:
Formula (1)is the definition of the CW Loss function, In the formulas, represents the sample quantity, is the function, denotes the predicted score of the model, signifies the true label, and represents the class weight. Formula (2) is the definition of the class weight calculation formula, is the total number of classes. The CW Loss consists of two main parts. CW Loss consists of two main components: the first part calculates the confidence of positive classes, and the second part calculates the confidence of negative classes. =1, the first part predominates, maximizing the model's confidence in positive classes; =0, the second part predominates, maximizing the model's confidence in negative classes. The purpose of is to multiply the loss terms for each sample by the corresponding category weight during the computation of the loss function. This ensures that categories with fewer instances contribute more significantly to the loss during training.Formula (3) is the definition of , Passing the value of to , and the final loss function is computed, effectively addressing the issue of data imbalance.
2.7. Data Enhancement
The horse raw video data exhibits a severe imbalance issue, with the majority of data representing standing postures, while crouching and lying postures have fewer instances. Despite proposing the CW_F_Combined Loss in this study to address this phenomenon, the significant data imbalance still impacts the overall performance of the model. To mitigate the impact on the overall model performance while maintaining effective horse postures and behaviors video recognition, this study aims to integrate and reduce the sample count of standing postures as much as possible. video data augmentation and temporal frame image data augmentation techniques are employed to augment the sample count of crouching and lying postures.
2.7.1. Video Data Enhancement
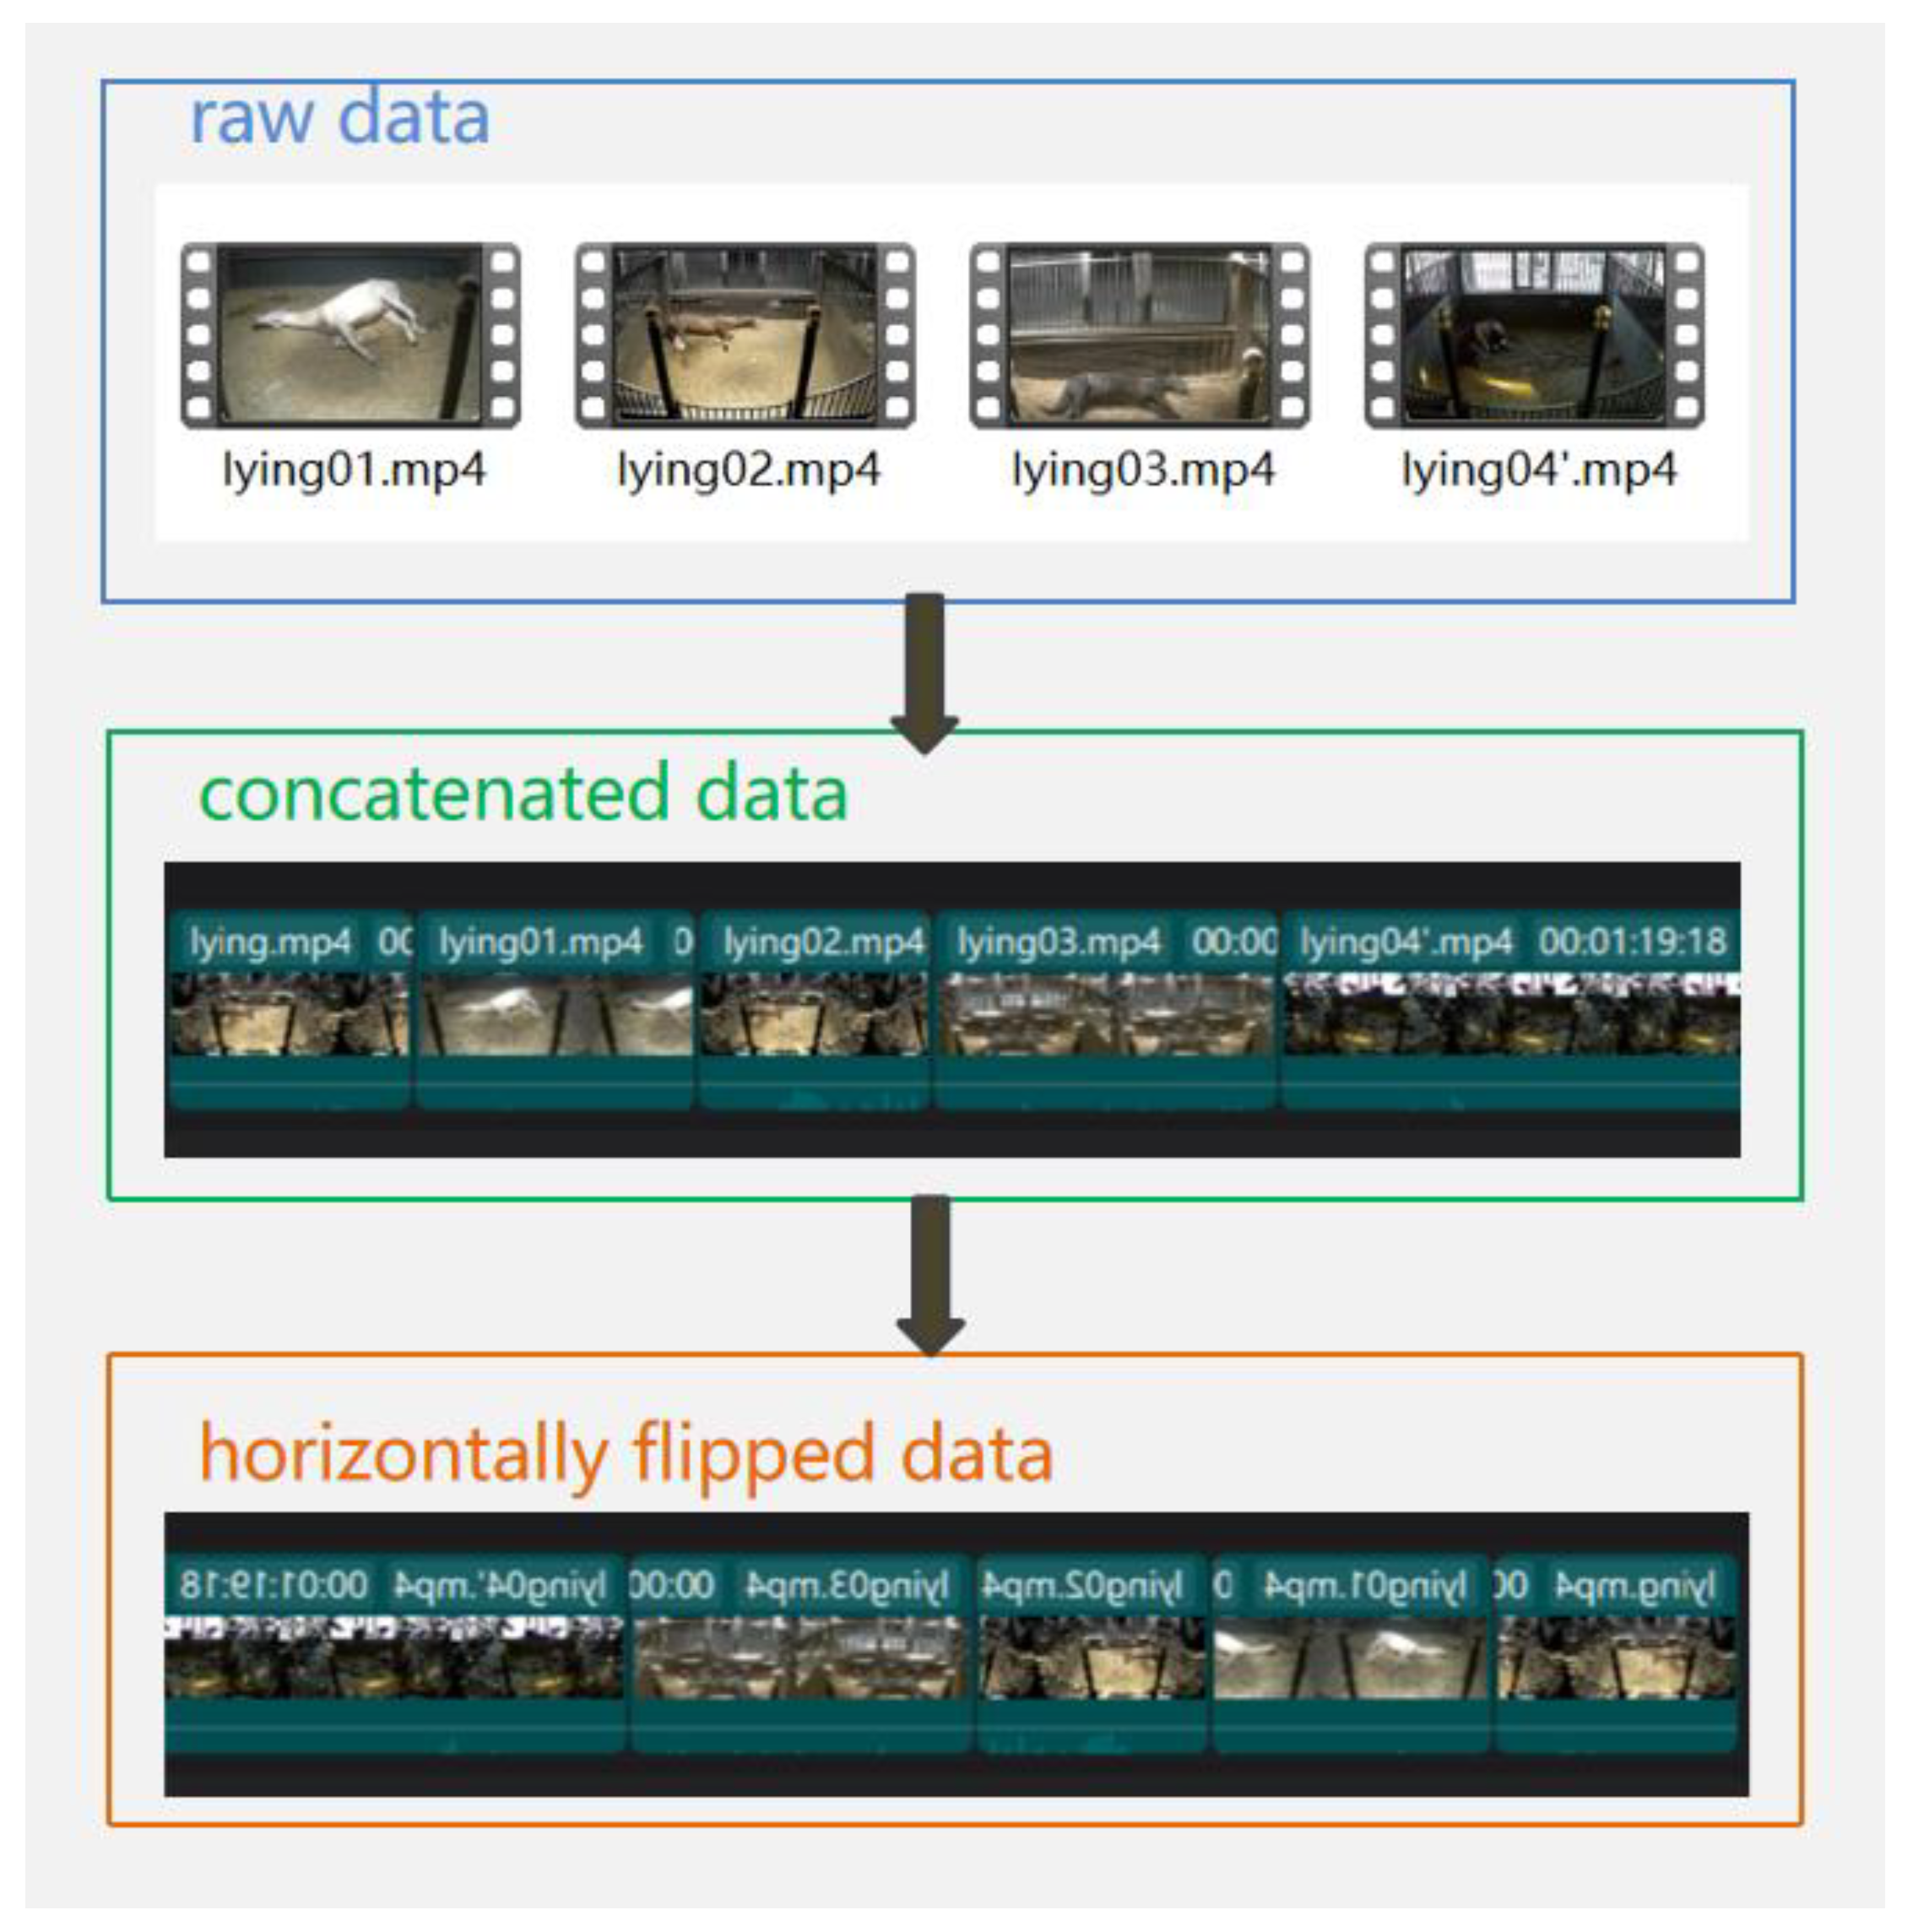
In this study, video processing software, as shown in
Figure 10, is utilized to crop and concatenate all original crouching and lying posture video data, enabling horizontal flipping to expand the sample count of these postures.
2.7.2. Image Data Enhancement
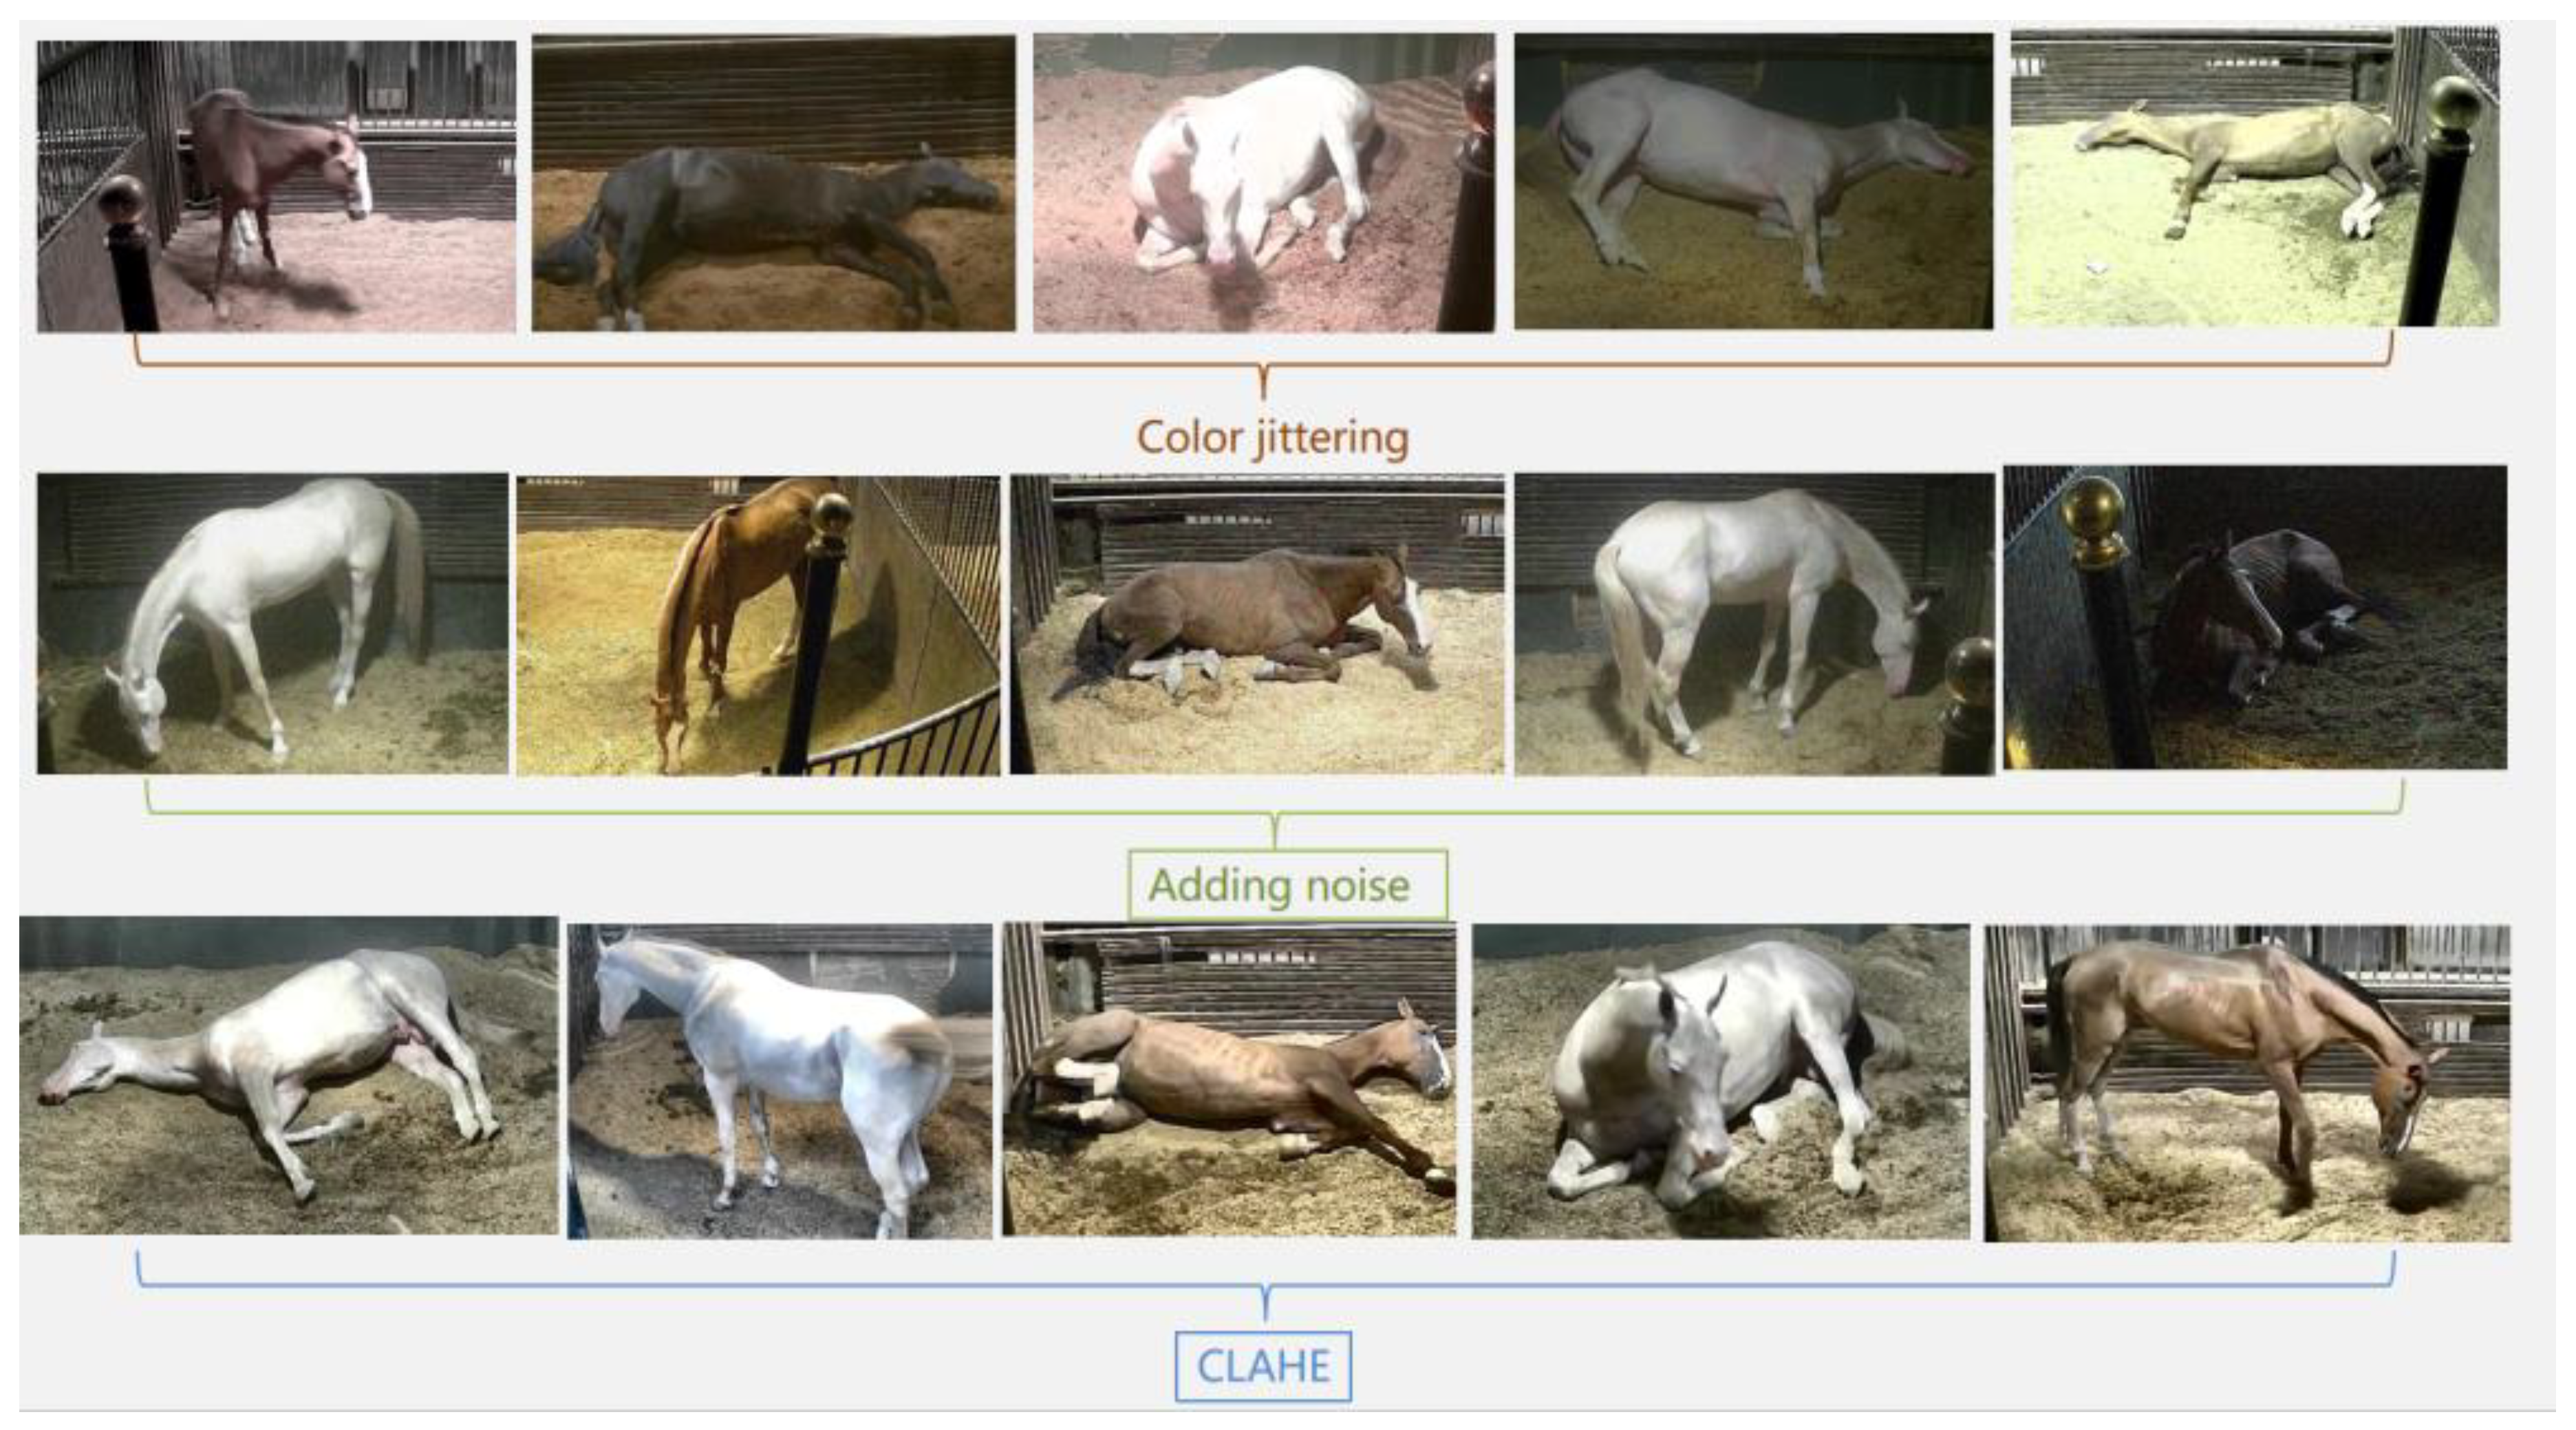
After augmenting the horse postures and behaviors video data through video data augmentation, this study employs image data augmentation techniques to further enhance the dataset for crouching and lying postures. To ensure optimal model performance, as illustrated in
Figure 11, this study selectively employs three methods for image augmentation: Color Jittering, Adding Noise, and CLAHE. The augmentation process is randomized for variability.
2.8. Model Evaluation Metrics
To objectively analyze the model's performance, this study adopts the Mean Average Precision (mAP) with IOU=0.5 as an evaluation metric. The formula is as follows:
Formula (4) represents the Intersection Over Union (IOU) threshold calculation, where A denotes the ground truth bounding box, and B represents the predicted detection box. Formula (5) is the calculation formula for mAP, where R is recall, and P is precision. Formulas (6) and (7) provide the calculation formulas for R and P, representing the number of true positives; representing the number of false positives; represents the number of negative samples mistakenly classified as positive samples; represents the total number of positive samples; represents the total number of positive samples; represents the total number of samples classified as positive.
Figure 1.
Sample data of horse behaviors and postures: (a) is fine race horses; (b) is mares and a foals, foals lived with his mother until she was half a year old.
Figure 1.
Sample data of horse behaviors and postures: (a) is fine race horses; (b) is mares and a foals, foals lived with his mother until she was half a year old.
Figure 2.
Temperature, Illumination and Humidity Data in the stable: the average temperature(The red curve in the figure represents the temperature) is between 21.62 ℃ and 26.14 ℃, which is a suitable temperature. At the same time, the sensor can also collect ammonia, hydrogen sulfide and other environmental data in real time to ensure that the horses in the stable have a good living environment.
Figure 3.
Schematic diagram of data collection scenario.
Figure 3.
Schematic diagram of data collection scenario.
Figure 4.
Sample raw video data of horse postures and behaviors.
Figure 4.
Sample raw video data of horse postures and behaviors.
Figure 5.
ODHS and STHPB.
Figure 5.
ODHS and STHPB.
Figure 6.
Architecture diagram for intelligent recognition of horse Multi-Posture and Behavior.
Figure 6.
Architecture diagram for intelligent recognition of horse Multi-Posture and Behavior.
Figure 7.
The architecture of spatiotemporal convolutional network for horse postures and behaviors recognition: The backbone network uses ResNet50, and the dimension size of the kernel is , where represents the time dimension size, represents the spatial dimension size, and represents the channel size.
Figure 8.
Structure diagram of SE Module.
Figure 8.
Structure diagram of SE Module.
Figure 9.
structural diagram of yolox.
Figure 9.
structural diagram of yolox.
Figure 10.
Samples of horse raw video data augmentation:The study only used horizontal flip to process video data, did not use other methods to expand video data, such as 90-degree rotation, 180-degree rotation and other angle rotations.
Figure 10.
Samples of horse raw video data augmentation:The study only used horizontal flip to process video data, did not use other methods to expand video data, such as 90-degree rotation, 180-degree rotation and other angle rotations.
Figure 11.
Example of Image data augmentation.
Figure 11.
Example of Image data augmentation.
Figure 12.
Process of experiment implementation.
Figure 12.
Process of experiment implementation.
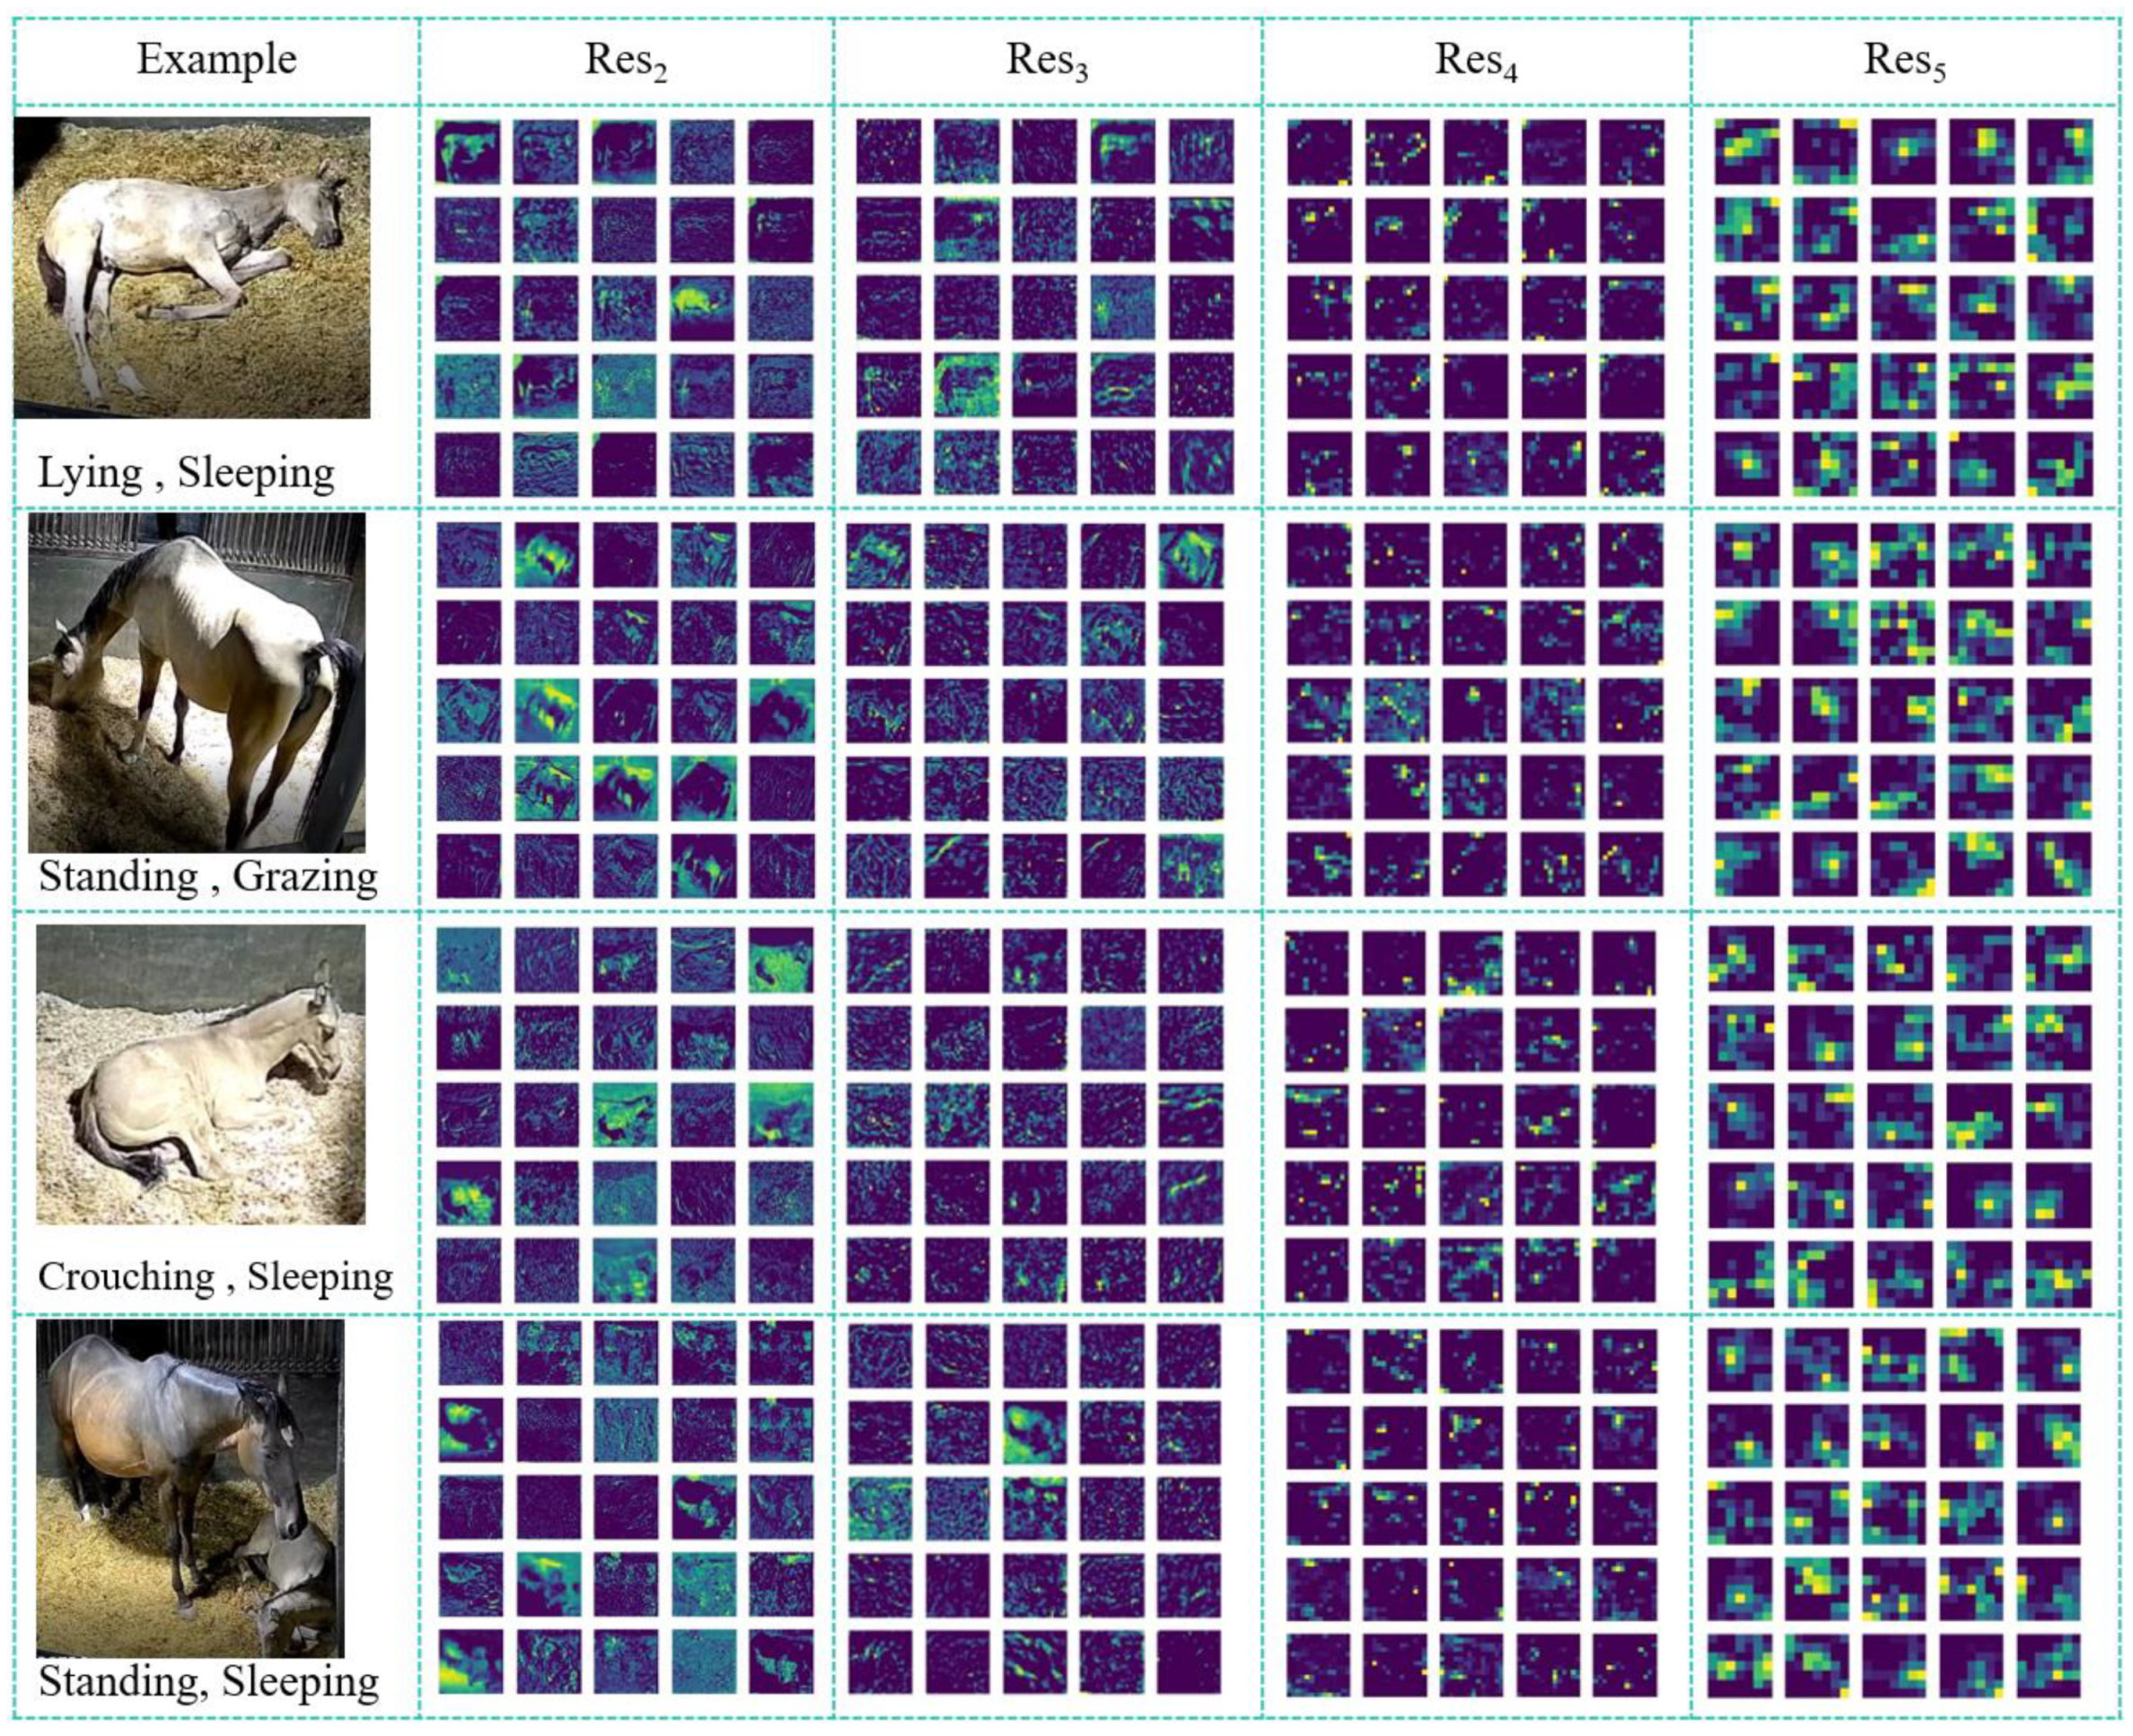
Figure 13.
Example of Slow pathway Feature Learning:Res2,Res3,Res4,Res5correspond to
Figure 6. Each feature map learned after the convolution operation has sizes: 56
2,28
2,14
2,7
2.
Figure 13.
Example of Slow pathway Feature Learning:Res2,Res3,Res4,Res5correspond to
Figure 6. Each feature map learned after the convolution operation has sizes: 56
2,28
2,14
2,7
2.
Figure 14.
Comparison of two different loss functions in the SE-SlowFast network.
Figure 14.
Comparison of two different loss functions in the SE-SlowFast network.
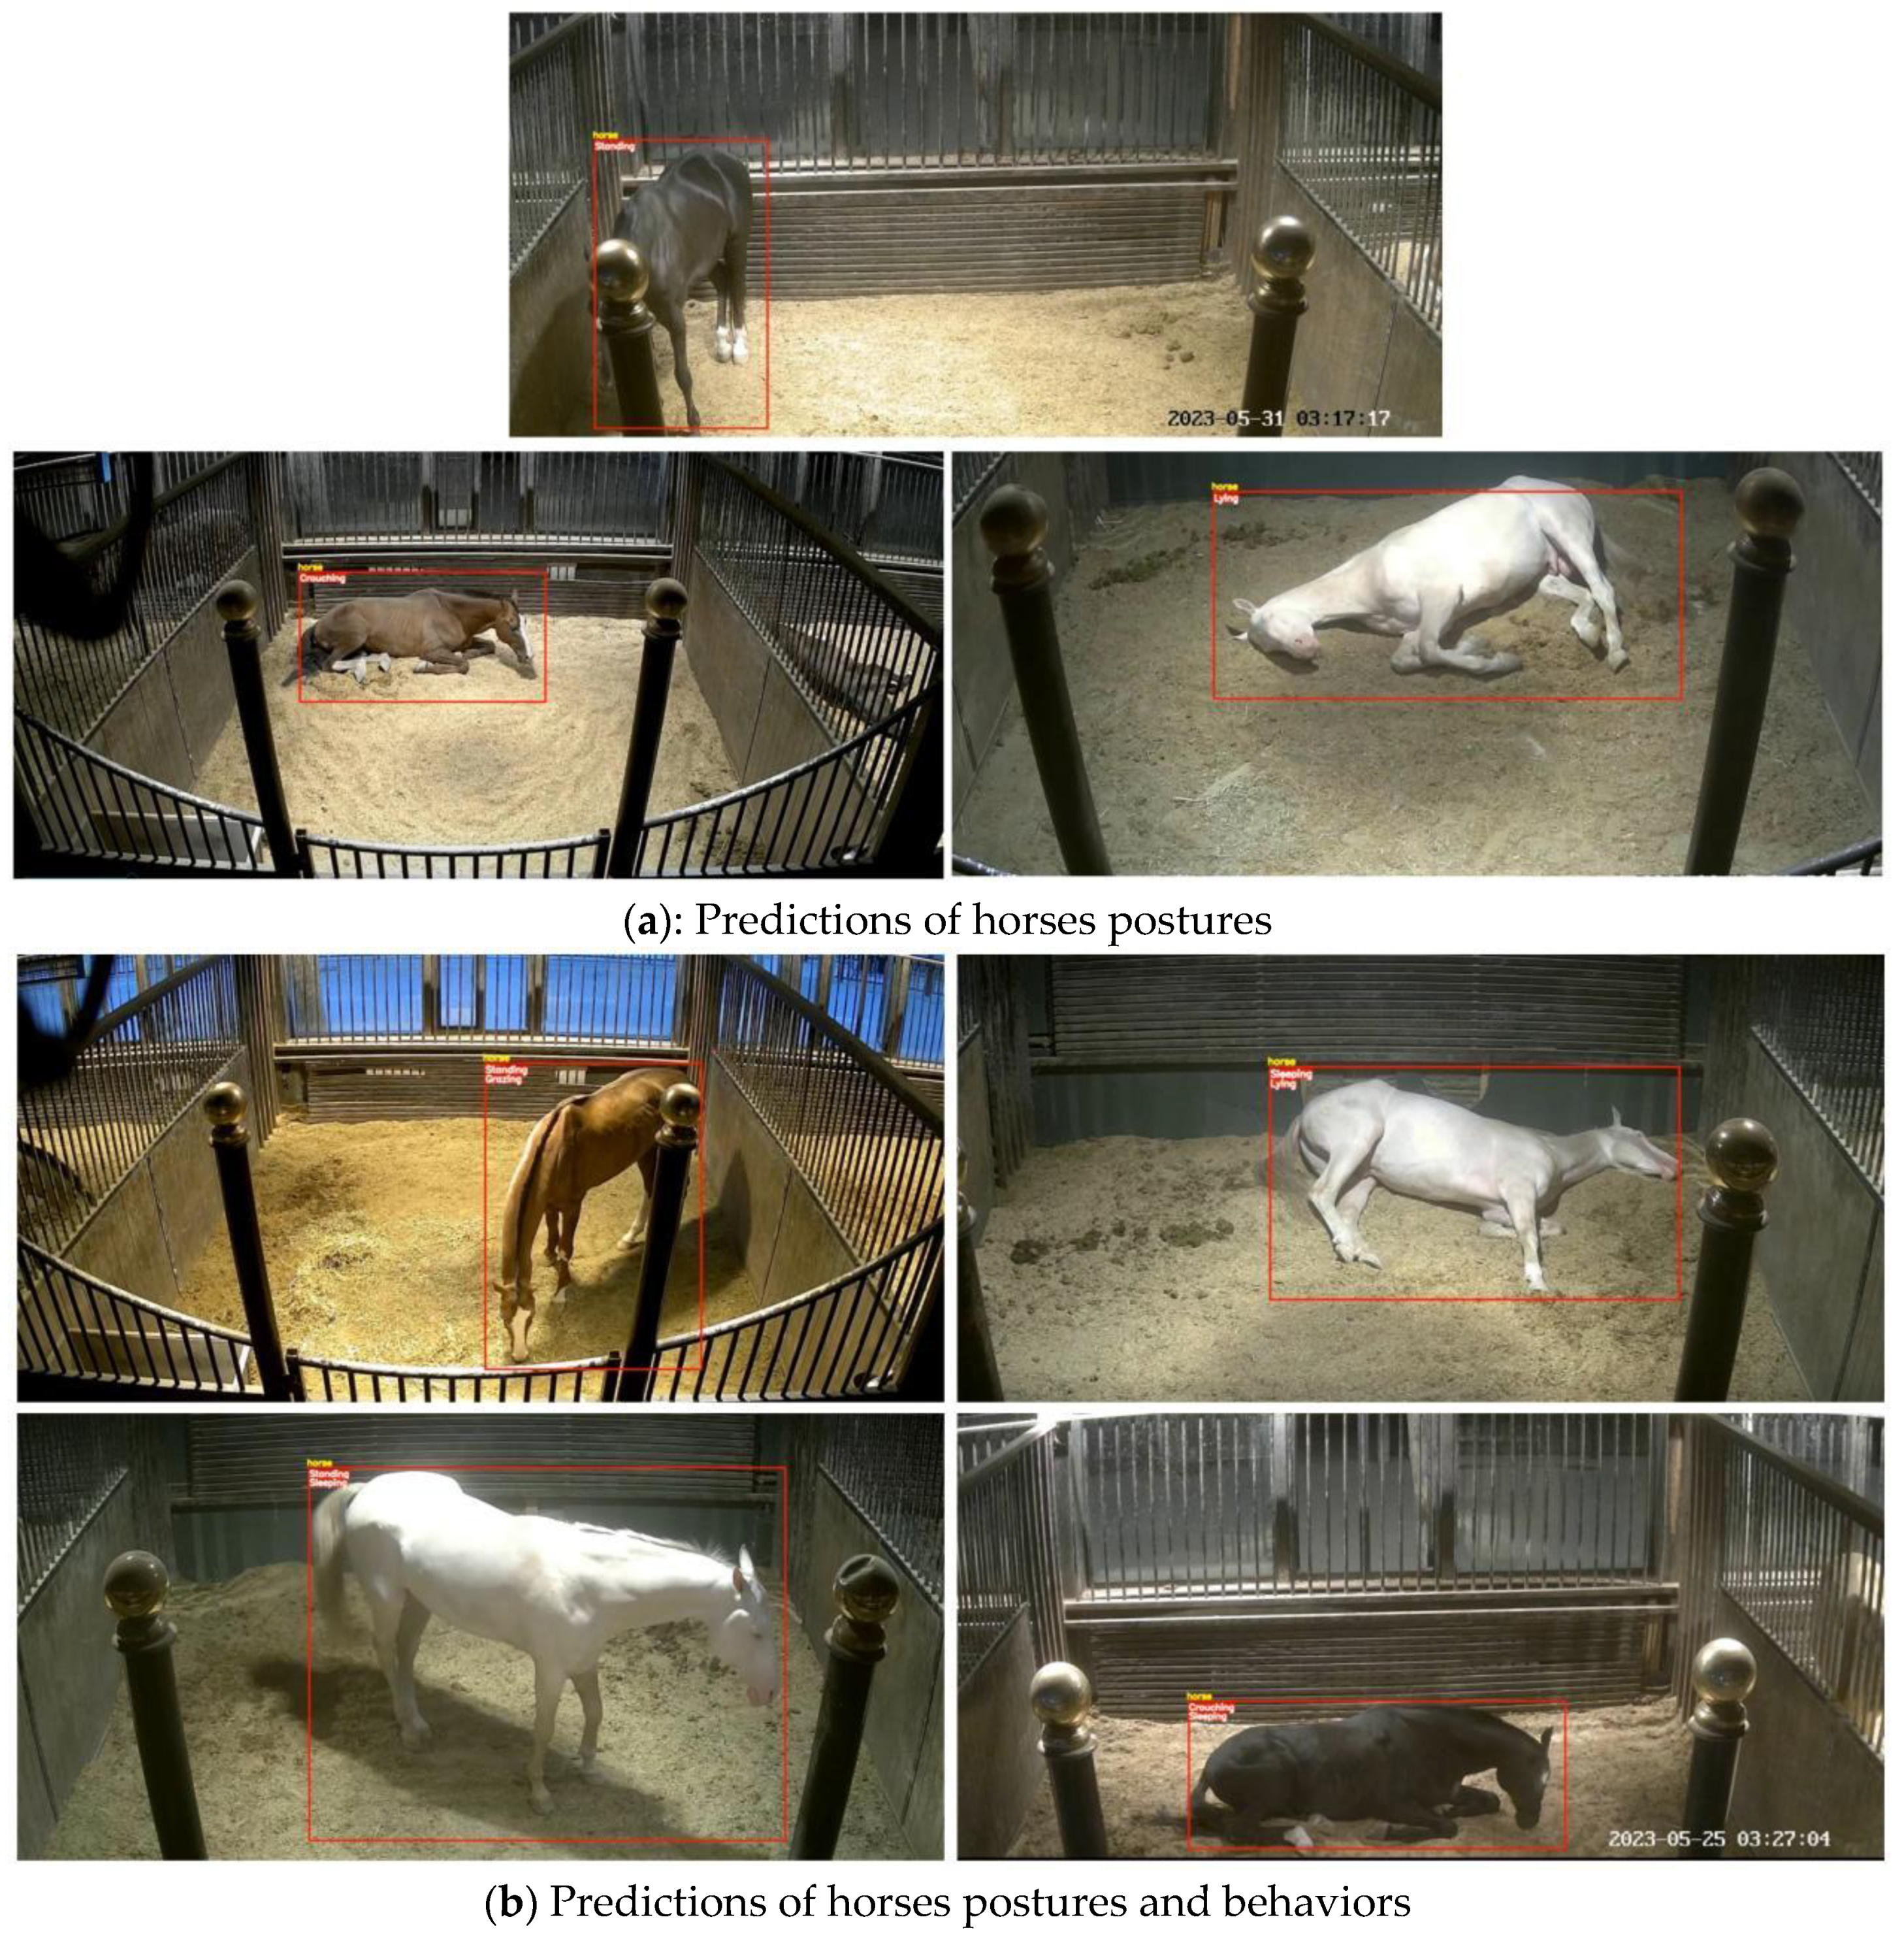
Figure 15.
Examples of predicting horse multi-postures and behaviors using the optimal model.
Figure 15.
Examples of predicting horse multi-postures and behaviors using the optimal model.
Figure 16.
Confusion Matrix for Video Recognition.
Figure 16.
Confusion Matrix for Video Recognition.
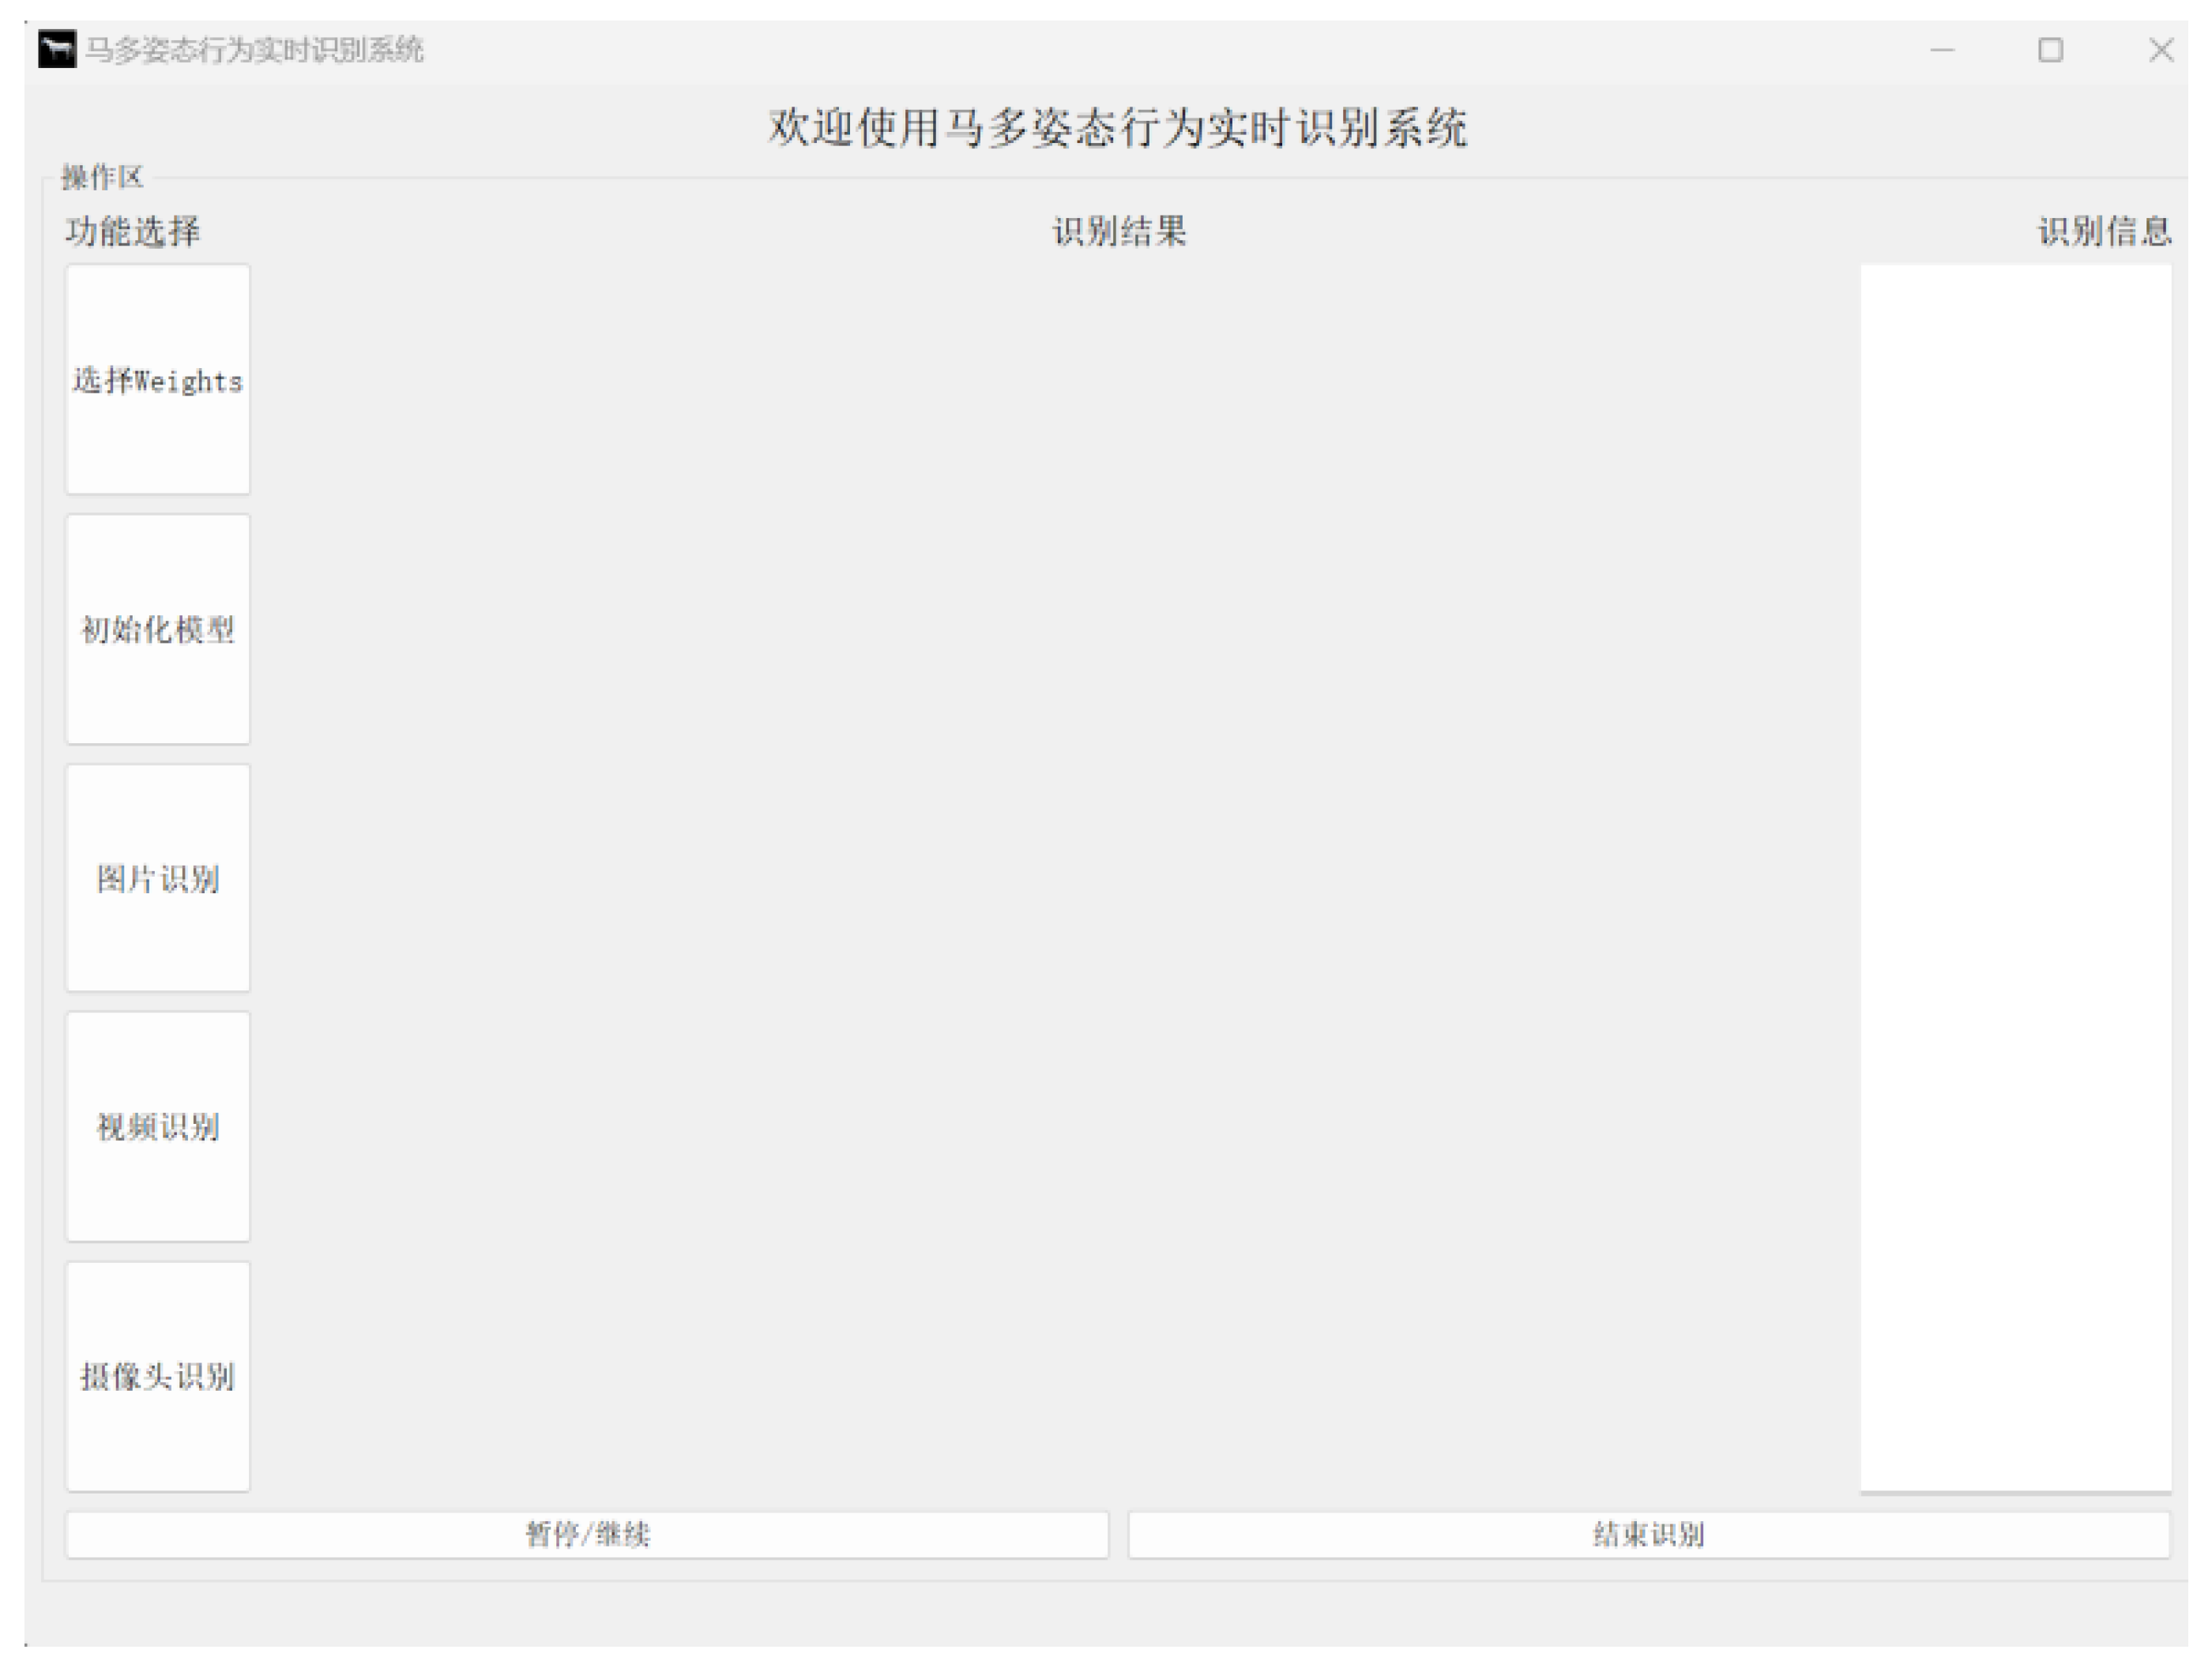
Figure 17.
Real-time Recognition System for Horse Multi-Postures and Behaviors.
Figure 17.
Real-time Recognition System for Horse Multi-Postures and Behaviors.
Table 1.
Definition of labels.
Table 1.
Definition of labels.
| Label |
Description |
| Standing |
Standing、Crouching or Lying still, without entering a state of rest or engaging in sleep-related behaviors |
| Crouching |
| Lying |
| Standing, Grazing |
Grazing in a standing |
| Standing, Sleeping |
Sleeping in standing、crouching or lying |
| Crouching, Sleeping |
| Lying, Sleeping |
Table 2.
Accuracy comparison of SE-SlowFast training with different loss functions.
Table 2.
Accuracy comparison of SE-SlowFast training with different loss functions.
| Loss Functions |
postures |
|
Behaviors |
mAP
(IOU=0.5) |
| Standing |
Crouching |
Lying |
Sleeping |
Grazing |
| BCE_F_Combined Loss |
=2 |
0.9126 |
0.8724 |
0.9145 |
0.9188 |
0.9621 |
0.9161 |
|
=3 |
0.9121 |
0.8915 |
0.9089 |
0.9051 |
0.9745 |
0.9182 |
|
=4 |
0.9245 |
0.8843 |
0.8957 |
0.9298 |
0.9822 |
0.9233 |
| CW_F_Combined Loss |
=2 |
0.9273 |
0.9187 |
0.9258 |
0.9356 |
0.9877 |
0.9390 |
|
=3 |
0.9156 |
0.8834 |
0.9102 |
0.9213 |
0.9544 |
0.9170 |
|
=4 |
0.9135 |
0.8525 |
0.9012 |
0.9124 |
0.9725 |
0.9104 |
Table 3.
Results of ablation experiments.
Table 3.
Results of ablation experiments.
| Backbone Network |
SE Module at the Front of the Slow Path |
SE Module at the End of the Slow Path |
Accuracy of postures and Behaviors Recognition |
| Standing |
Crouching |
Lying |
Sleeping |
Grazing |
| SlowFast |
× |
× |
0.8945 |
0.9051 |
0.8829 |
0.9011 |
0.9247 |
| √ |
× |
0.9023 |
0.9122 |
0.8754 |
0.9123 |
0.9189 |
| × |
√ |
0.9273 |
0.9187 |
0.9258 |
0.9356 |
0.9877 |
Table 4.
Comparison of different algorithms for video frame detection and Spatio-Temporal Action Detection time.
Table 4.
Comparison of different algorithms for video frame detection and Spatio-Temporal Action Detection time.
| Method |
Horse Detection Time |
Spatio-Temporal Action Detection Time |
| FasterRCNN+ SE-SlowFast |
35s |
12.5s |
| YOLOv3 + SE-SlowFast |
13s |
11s |
| YOLOX + SE-SlowFast |
12.5s |
10s |


