1. Background
The mobile phone sector is clearly a key industrial sector capable of contributing to the goals of economic development and social progress. With the Chinese mobile phone market just beginning to take off, the speed of its consumption growth in recent years has slowed for several reasons: general macroeconomic downturns, stagnation in the per capita income growth rate, and deceleration in consumer spending. This makes the forecasting of mobile phone sales even more important. Accurate forecasts can help government authorities adjust industry policy at the macro level in one direction, and they can also help mobile phone producers design appropriate for devising more effective production plans and operational strategies at the micro level.
Conventional methods to predict mobile phone sales often rely on historical sales data along with a limited number of macroeconomic predictors. However, such data sources are naturally retrospective and most often fail to capture the real-time dynamics of mobile phone sales; therefore, forecasts are less accurate. Online search data are, in the digital era, the most productive source of information that basically reflects consumer interest and activity for all brands and products, shedding light not only on consumer behavior but also on real purchasing decisions. In recent years, online search data have been incorporated into mobile phone sales forecasting models with increasing frequency. However, the reasonable selection of the search keywords directly affects the reliability of the forecasting results. The existing methods mostly include empirical keyword selection and keyword recommendation tools. The empirical methods are relatively convenient, but their subjectivity strongly depends on individuals. On the other hand, keyword suggestion tools depend mostly on the predesigned word list with categorization, which may not be able to represent the virtual customer flow and searching behavior related to mobile phone brands. Consequently, keyword optimization for searches still presents a major problem that needs to be resolved through research. For the forecasting model, previous studies commonly used time series models, linear regression, and traditional machine learning models.
However, sales data related to mobile devices are usually seasonal and are affected by a variety of factors, such as macroeconomic conditions, online reputation, and brand exposure. All these reasons make the data distinctly nonlinear, which cannot be handled by time series models in general. In addition, the two commonly applied machine learning models, SVMs and BP neural networks, usually have weak abilities when facing high-dimensional, complicated time series prediction tasks. Therefore, from the perspective of mobile phone sales forecasting, it is necessary to enhance the effectiveness of integrating these two types of nonlinear factors into predictive models.
This paper proposes a new, improved brand-focused mobile phone sales forecasting framework, with the two most important aspects enhanced: keyword searching and model construction.
Brand Exposure Quantification: This study proposes a novel approach to quantify brand exposure by integrating online reputation comments and search data. Word2vec is primarily used to develop a word vector model that arises from a body of text comments in relation to an online reputation, helps extract initial keywords, and time-lagged correlation is used to identify key keywords to reduce multicollinearity in keywords to pave the way for approximation to overall customer behavior. PCA is undertaken for the integration of brand exposure factors and later prediction of the model loaded with factors.
A Mobile Phone Sales Forecasting Model Based on the Attention-LSTM Algorithm: In this paper, an attention-LSTM deep learning model is employed to capture and memorize time series data in an environment with few samples, and an unsupervised method for robust forecasting is used. The experimental results verify the effectiveness of the model, and the ability of the proposed model to solve real-world mobile phone sales forecasting problems is verified.
2. Introduction
The mobile phone industry is an important part of economic and social development, and its influence can be found in every sphere of life. The growth in the consumption of mobile phones in the Chinese market has decreased to some extent in recent years. The reasons for this include macroeconomic downturns, slowing growth of per capita income, and reduced spending by consumers. This decline again underlines the need for an accurate forecast of sales to critically support policy adjustments by government authorities and help mobile phone manufacturers develop better production plans/operational strategies.
2.1. Brand Exposure Research
Internet, which is widely applied and popularized, online search behavior is a very important source of real-time insight with great value for consumer interest [
1]. In recent years, scholars have increasingly applied online search data to many fields, such as monitoring diseases [
2], stock market analysis [
3], and tourism forecasting [
4], to validate the predictive power of data, such as Google Trends and the Baidu Index. In sales forecast research, some researchers have started to discuss the relevance of online search data and certain product sales. Chen et al. discussed online review data relevance and customer purchase decisions related to product sales and concluded that effective usage of online review data would increase the accuracy of the predictive model [
5]. Fantazzini et al. merged Google search data along with economic variables such as the consumer price index (CPI), oil price, and loan interest rate to develop a model of monthly sales forecasting and reported that the inclusion of Google search data in the models significantly enhances predictive accuracy compared with baseline models [
6]. Wang et al. presented regression models using Baidu search data to predict product sales and market share and emphasized that Baidu search data serve as a very important basis for predicting autospales when other information is not available [
7]. The results show the power of using Baidu search data in sales forecasts of the automotive sector, especially when other sources of information may not be as readily available. One of the critical roles of studies on this subject involves the selection of keywords for search purposes. Three major methods have been discussed in the literature for selecting search keywords. First, the empirical keyword selection method is based mainly on domain expertise. For example, Wang et al. selected product models manually according to personal experience by assuming that searching for a particular model is more representative of consumer purchase intent than searching for a higher category. The second class uses keyword-recommendation tools [
7]. For example, Fantazzini et al. used the automated categorization of Google to pick appropriate
“product
” and
“product brand
” relevant keywords and collected data from January 2004--June 2014 [
6]. A hybrid approach, a third approach, merges empirical keyword selection with suggestions provided by various tools. A representative example is the work of Feng et al., who used four benchmark keywords that were manually picked on the basis of common consumer search behaviors and subsequently extended this list with recommendation tools [
8]. More specifically, all these studies, whether they are based on empirical methods or recommendation tools, do not explain whether the chosen keywords reflect the real interests and habits of consumption manifested during online searches.
2.2. Research on the Mobile Phone Sales Forecasting Model
Traditional mobile phone sales forecasting models fall into three broad categories: statistical models (such as linear regression [
9], time series models [
10], gray models [
11] and more), machine learning models (including support vector machines (SVMs) [
12], BP neural networks [
13] and more) and the ensemble forecasting model. Considering the seasonal, autocorrelated and cyclical nature of mobile phone sales data, many scholars have applied time series models to forecast sales. For example, Shaik used a hybrid time series model for forecasting the trend in mobile phone sales [
10], whereas Sun et al. used exponential smoothing on historical data and performed simple forecasting for car sales [
9].
However, there is indeed evidence that product sales have enormous nonlinearities [
12,
13], which may not be captured fully by traditional statistical models. Some scholars have drawn on the support of machine learning models to solve this problem in mobile phone sales forecasting. Duan et al. used the support vector machine model to predict factors, including price changes, design features, and repeat purchasing decisions [
12]. Wang et al. predicted sales volumes, prices, brands, memory, and operational systems when constructing a BP neural network forecast model [
13]. Although ML methods can learn nonlinear dependences from data and have high predictive accuracy, in practice, they often suffer from limited generalizability and lack enough capacity in modeling high-dimensional nonlinear time series data.
2.3. Deep Learning Developments in Sales Forecasting
Development at an incredible rate, artificial intelligence has recently led to developments in the use of deep learning algorithms for performing studies in time series prediction. Thus, RNNs find an application in handling time series data [
14], with a great advantage for short-term memory. On the other hand, problems such as gradient vanishing and explosion appear in the training phase for long-term memory. LSTMs have been found to be excellent at learning very long sequence data [
15,
16]. For example, Guo et al. proposed a sentiment analysis for online reviews via the CNN-BiLSTM approach. This approach was more effective than traditional machine learning algorithms [
15]. Similarly, Petersen et al. also proposed an LSTM-based multitime step deep neural network for highly precise prediction of the arrival times of urban buses [
16]. The attention-LSTM network extends the LSTM architecture by using an attention mechanism that can rapidly pinpoint relevant key information from voluminous data, even in low-dimensional and low-sample environments [
17,
18]. Attention–LSTM models have extensive applications in the fields of natural language processing, time series forecasting, and computer vision. For example, Tao et al. proposed an end-to-end short text classification model based on LSTM with enhanced attention, which solved the problem caused by the sparse features of short texts [
19]. Similarly, Ullah sequenced learning of action and activity recognition via long short-term memory (LSTM) and its variants [
20]. Kumar et al. incorporated multiple attention mechanisms in LSTM models for multidimensional time series forecasting [
21]. It has been demonstrated that the enhanced model shows strong prediction performance in various experimental settings.
2.4. Research Gaps and Challenges
Most of the studies conducted to date on forecasting the sales of mobile phones with the help of data from online searches have focused on exploring the relationship between online search trends and the sales of smartphones and on building models that predict sales from such data. However, the deep research and optimization of choosing keywords have not been engaged in to any significant lengths, and this finally remains one of the most important steps in the given research. Moreover, an effective determination of brand exposure is a problem under further consideration. With respect to model choice, within this framework, time series models, SVMs, and BP neural networks are the most popular models that have been widely used until now. These methods typically cannot consider some complex characteristics of the mobile-phone sales dataset, such as nonstationarity, nonlinearity, and serial correlation. In contrast, LSTM network structures are advantageous for learning long-sequence data; thus, they are well used within research on time series predictions. However, the applicability of this method can differ across scenarios, but it also differs among various datasets; therefore, further validation with respect to efficiency when it is applied in forecasting mobile phone sales is needed. Given the limitation of long short-term memory (LSTM) when the number of feature variables is large in small data volumes, this paper introduces an attention mechanism to assign different weights to different features in the input features. A prediction model of an attention-LSTM network was built and then used for testing against real mobile phone sales datasets to predict accuracy.
3. Materials and Methods
3.1. Research Framework
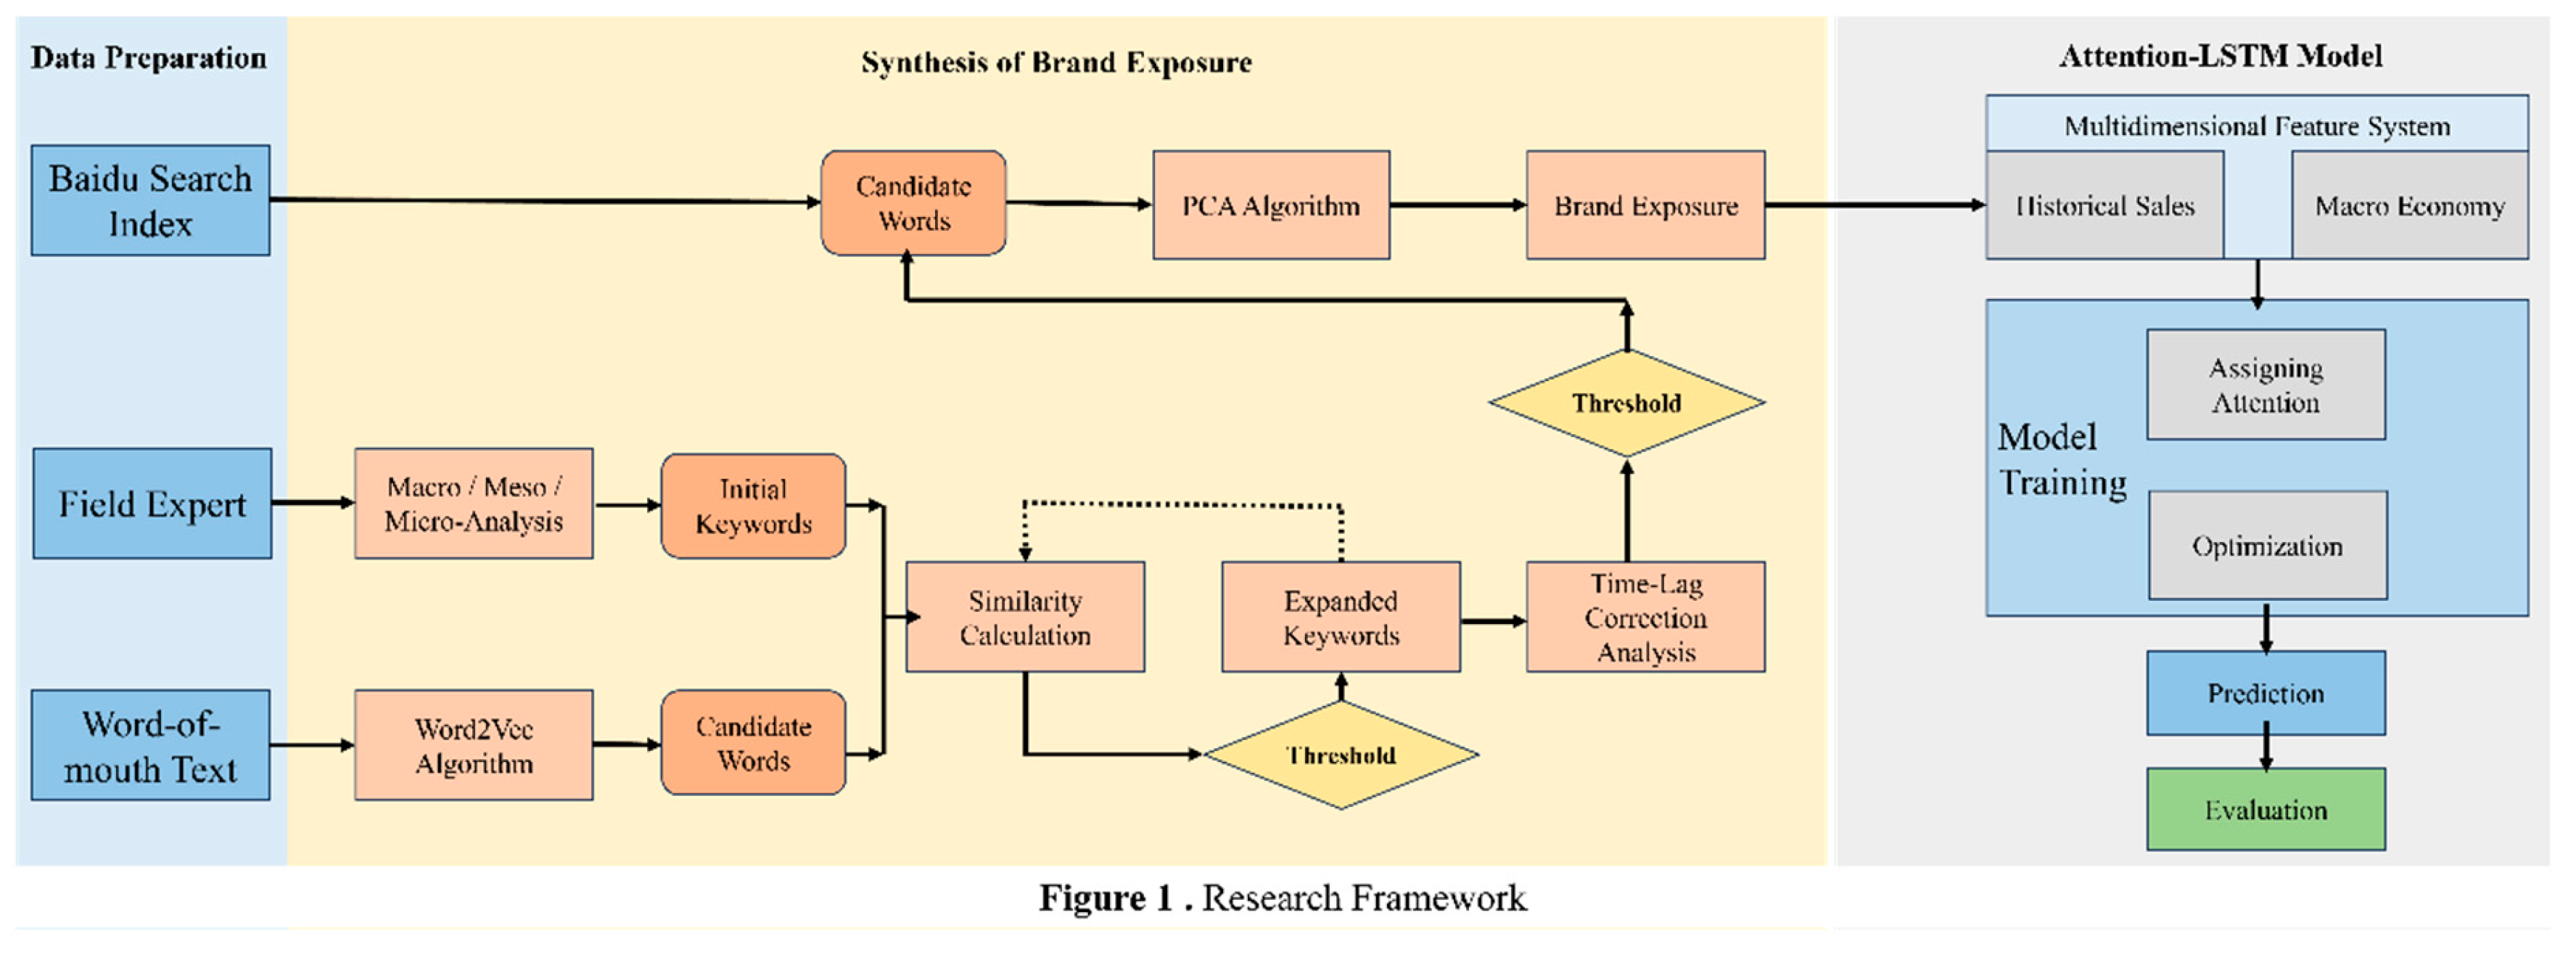
The main procedure followed is to first preprocess word-of-mouth reviews stringently. This involves segmentation of textual content, removal of stop words, and removal of low-quality information. This process processes the raw data into a structured format that can be properly considered in further analytical processes. In the second stage, a new assessment in the field of quantifying brand exposure involves synthesizing online reputation metrics and searching data. This methodology starts with the initial keyword extraction from three dimensions: the macro, meso, and micro perspectives. The keywords are further extended by constructing word vectors via the Word2Vec model trained on the WOM corpus of the China Mobile Home website. The core keywords are determined via time‒lag correlation analysis. Brand exposure indicators are then constructed by synthesizing Baidu search data corresponding to the core keywords via principal component analysis. This broad quantification is necessary for subsequent predictive modeling. The final step involves the development of the advanced forecasting model using the attention-augmented long short-term memory network, Attention-LSTM. Model development involves selecting multidimensional features and integrating an attention mechanism that extends the predictive capability of the LSTM network. This ensures that rigorous training is performed to optimize the parameters and thereby realize mobile phone sales forecasting. A visual representation of the research framework is shown in
Figure 1. Data were collected from January 2018 to December 2023 for the experiments.
3.2. Integrated Brand Exposure Quantification via Online Reviews and Search Data
3.2.1. Initial Keyword Selection
As stated in a report on a recent mobile consumption survey released by one Chinese news agency, online media has become the largest source from which a majority of consumers acquire mobile brand-related information that largely determines the purchase trend. In essence, consumer concerns focus on the brand name, model series, performance, and price of mobile phones [
22]. Additionally, mobile consumption maintains a close relationship with the macro economy, consumers’ income level, and policy changes in consumption. When these factors of influence are applied, preliminary keywords are drawn on three levels: macro, meso, and micro. The influencing factors at the macro level include policy measures and economic indicators, such as interest rates, inflation rates, and industry regulations. In light of this, the meso level encompasses online service platforms related to mobile phones, such as portal websites and mobile phone forums. At the micro level, it focuses primarily on aspects of mobile phone products, which consider the top ten mobile phone brands in the Chinese market over the last five years. The basic unit of analysis employed at the micro level is a “brand + model” combination structure. These three levels are then used as the basis for an initial keyword selection process that results in an initial set of 75 keywords. A subset of these initial sets of keywords is illustrated in
Table 1.
3.2.2. Keyword Selection Using Word Vectors
In customer-driven decision-making, word-of-mouth forums are important sources of user-generated content and play an influential role in the buying process. Potential customers often seek these forums to glean knowledge about product brands, and postconsumer reviews become immensely useful feedback for future customers. Such forums, with high levels of consumer participation, carry a substantial amount of information on multifarious dimensions of a product and prevailing trends of consumption. In this report, data related to consumer sentiment and search behavior are extracted from China Mobile Home, one of the leading mobile-focused websites in China.
The data crawled from China Mobile Home were crawled via authorization requests to avoid anti-crawling mechanisms. In this work, the Word2Vec algorithm is applied to train a word vector model that maps each term into a fixed-dimensional vector space. Word2Vec is a framework that encompasses two major training methodologies: continuous bag-of-words (CBOW) and skip-gram [
23]. Both are included to represent semantic relations between words. In the present work, the CBOW model was used, with a vector dimension of 100 and a context window of 5. Since the initial keywords were first identified, cosine similarity was used to calculate the semantic similarity between candidate keywords, as shown in Equation (1) [
24]. It allows for the quantification of semantic distance and guides expansion from an initial set of keywords in terms of relevance. The top 5%, as chosen by this metric of similarity, were taken as expansions of the initial set of keywords. Iterative training and selection yielded this final set of 1,519 expanded keywords.
Equation (1). In Equation and represent two words or phrases, which are mapped into n-dimensional vectors and . The cosine value of the angle between w₁ and w₂, calculated as , indicates the degree of similarity between two words or phrases. A higher value signifies a higher degree of similarity.
3.2.3. Using time‒lag correlation analysis to screen out core keywords
To identify core keywords that are vital predictors of sales in mobile phones, we apply time‒lag correlation analysis [
25]. The approach accepts the empirical inevitability that consumers’ search behaviors always precede a buying act. Specifically, paying attention to some mobile phone brands and searching online normally precedes the act of buying. The time‒lag correlation analysis correlated the Baidu search data for every keyword, which was temporally lagged by an interval ranging from 0--12 months, against the sales of mobile phones. Over such lag intervals, the correlation coefficients for the lagged search data and the sales of mobile phones are calculated. The leading order is determined by the term where the time difference maximizes the correlation coefficient for a given keyword. A threshold is set at 0.5 for the maximal correlation coefficient, R, to determine the core keywords. Those will then be used as filtering criteria to finalize 197 core keywords out of those found in the keyword library. These results are summarized in
Table 2.
The results show that the order of magnitude of keyword search data series is usually confined within 1--6 months of lag periods. This might be because the nature of the mobile phone is a high-end consumer good with complicated attributes, and it takes time for consumption to collate information and make a reasoned purchase decision. The study further established positive and negative correlations between the trends in keyword search data and actual sales. Examples include the keyword “Kirin Processor,” which is positively related to sales of mobile phones due to high levels of brand awareness and consumer attention that culminate in a purchase decision. In contrast, the keyword “data breach” is negatively related to sales since it is indicative of how privacy concerns impact consumer purchasing decisions. Importantly, greater data breaches ensure greater scrutiny by the public and less consumer willingness to buy, consequently underlining the importance of privacy issues to spearhead consumer trends.
3.2.4. Constructing Brand Exposure Based on PCA
Hulth et al. demonstrated that once the coverage of keywords reaches a threshold, the marginal contribution of additional keywords becomes negligible, with an excess of keywords potentially degrading the performance of predictive models [
26]. This phenomenon is attributed primarily to the multicollinearity present in keyword search data. To address the challenges posed by multicollinearity, reduce feature dimensionality, enhance model robustness, and preserve the most pertinent information reflecting overall online search trends, this study employs principal component analysis (PCA) to synthesize the Baidu search data of core keywords. The variance contribution rate of each principal component is then utilized as a weight to derive the brand exposure.
The fundamental principles of PCA are as follows:
Let
be a p-dimensional random vector composed of standardized indicators. PCA transforms the original p observed variables
into p new variables, as shown in Equation (2).
Equation (2). needs to satisfy the following conditions: σ²
is uncorrelated with
Var() Var() Var() Var()
The number of principal components n can be determined on the basis of the cumulative variance contribution rate of each principal component, as shown in Equation (3).
Equation (3). where k represents the selected number of principal components; p denotes the total number of principal components; and λ represents the eigenvalues corresponding to each principal component.
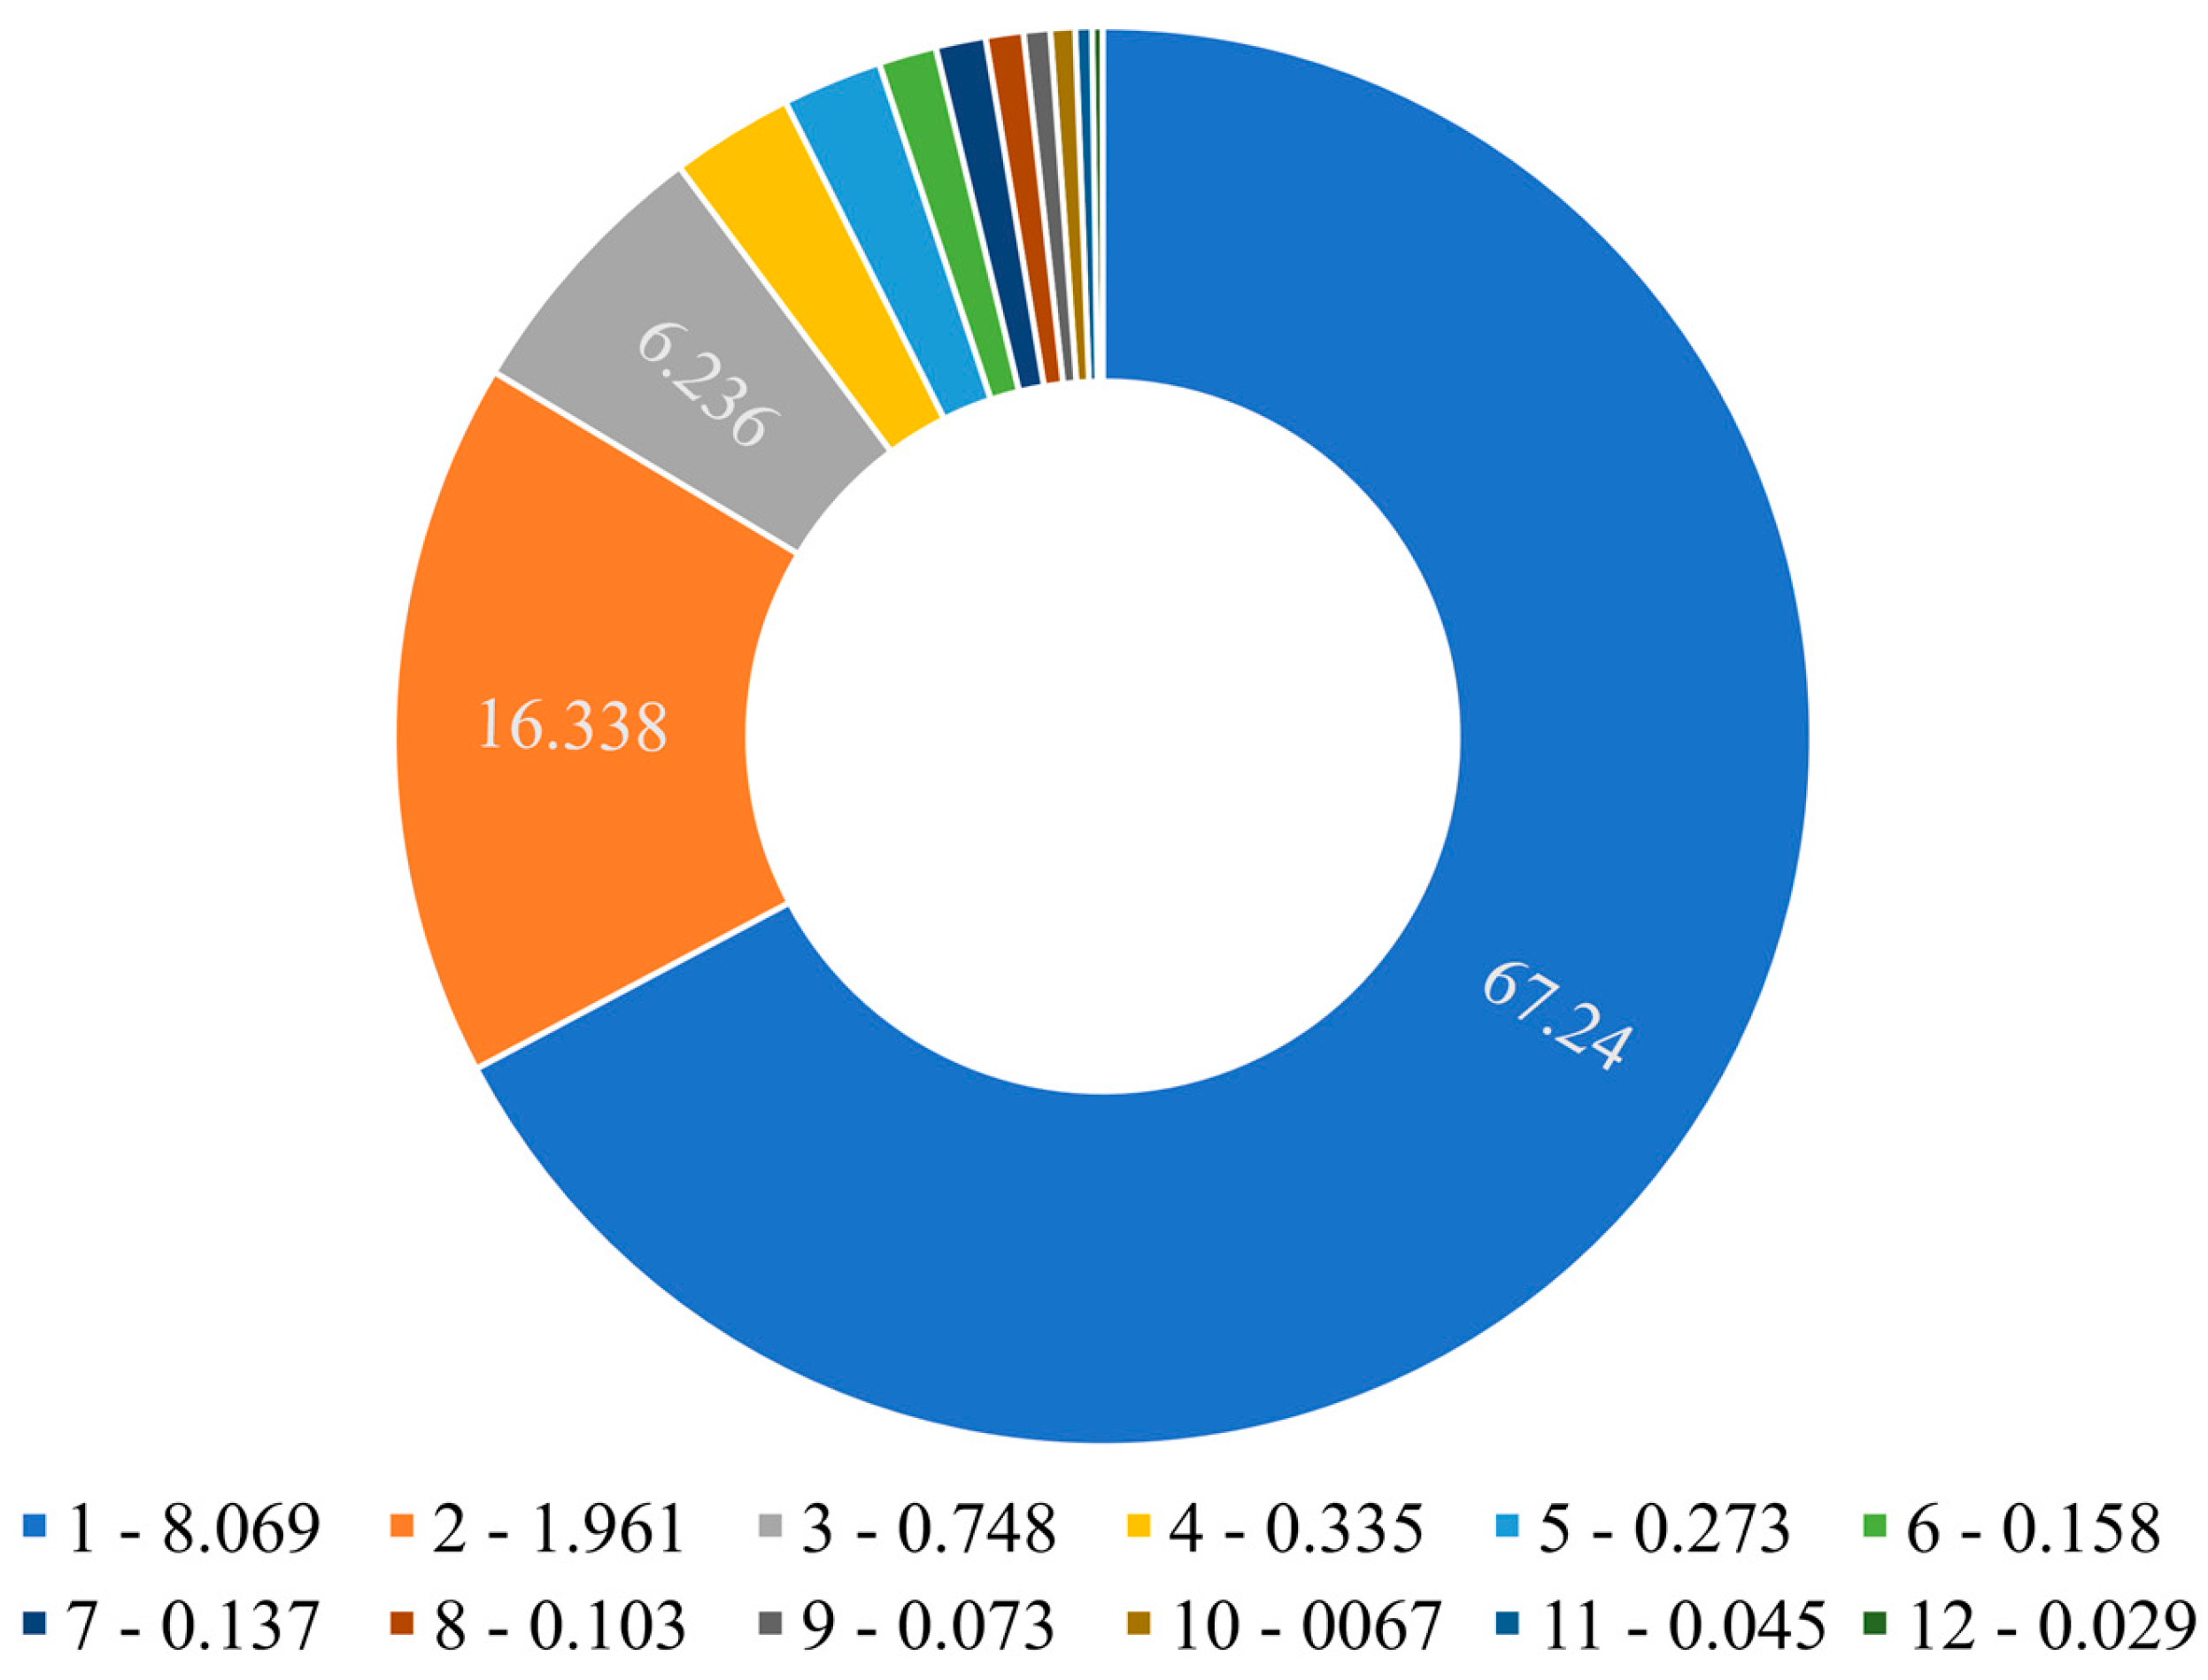
This study uses principal component analysis (PCA) to extract the principal components of the macro, meso and 10 mobile phone brands’ online search data, with the goal of synthesizing the macro, meso and brand indices. The same method is then used to extract the principal components of the macro index, meso index and brand index to synthesize brand exposure. The total variance explanation table and components matrix are shown in
Table 3 (Visual Representation of
Table 3 is given in
Figure 2) and
Table 4. Owing to the cumulative variance contribution rate of the first two principal components exceeding 80%, this study extracts two principal components. The first principal component is significantly correlated with Huawei, Xiaomi, Vivo, Apple, Honor, OPPO, and Lenovo, reflecting the consumption patterns of mid- to high-end mobile phone brands. The second principal component shows notable correlations with ZTE and Coolpad, representing consumption patterns of low-end automobiles.
The expressions for each principal component are as follows:
Weighted by the variance contribution rates of F and F2, the brand exposure of mobile phones is calculated as follows:
3.3. Attention-LSTM Model for Mobile Phone Sales Forecasting
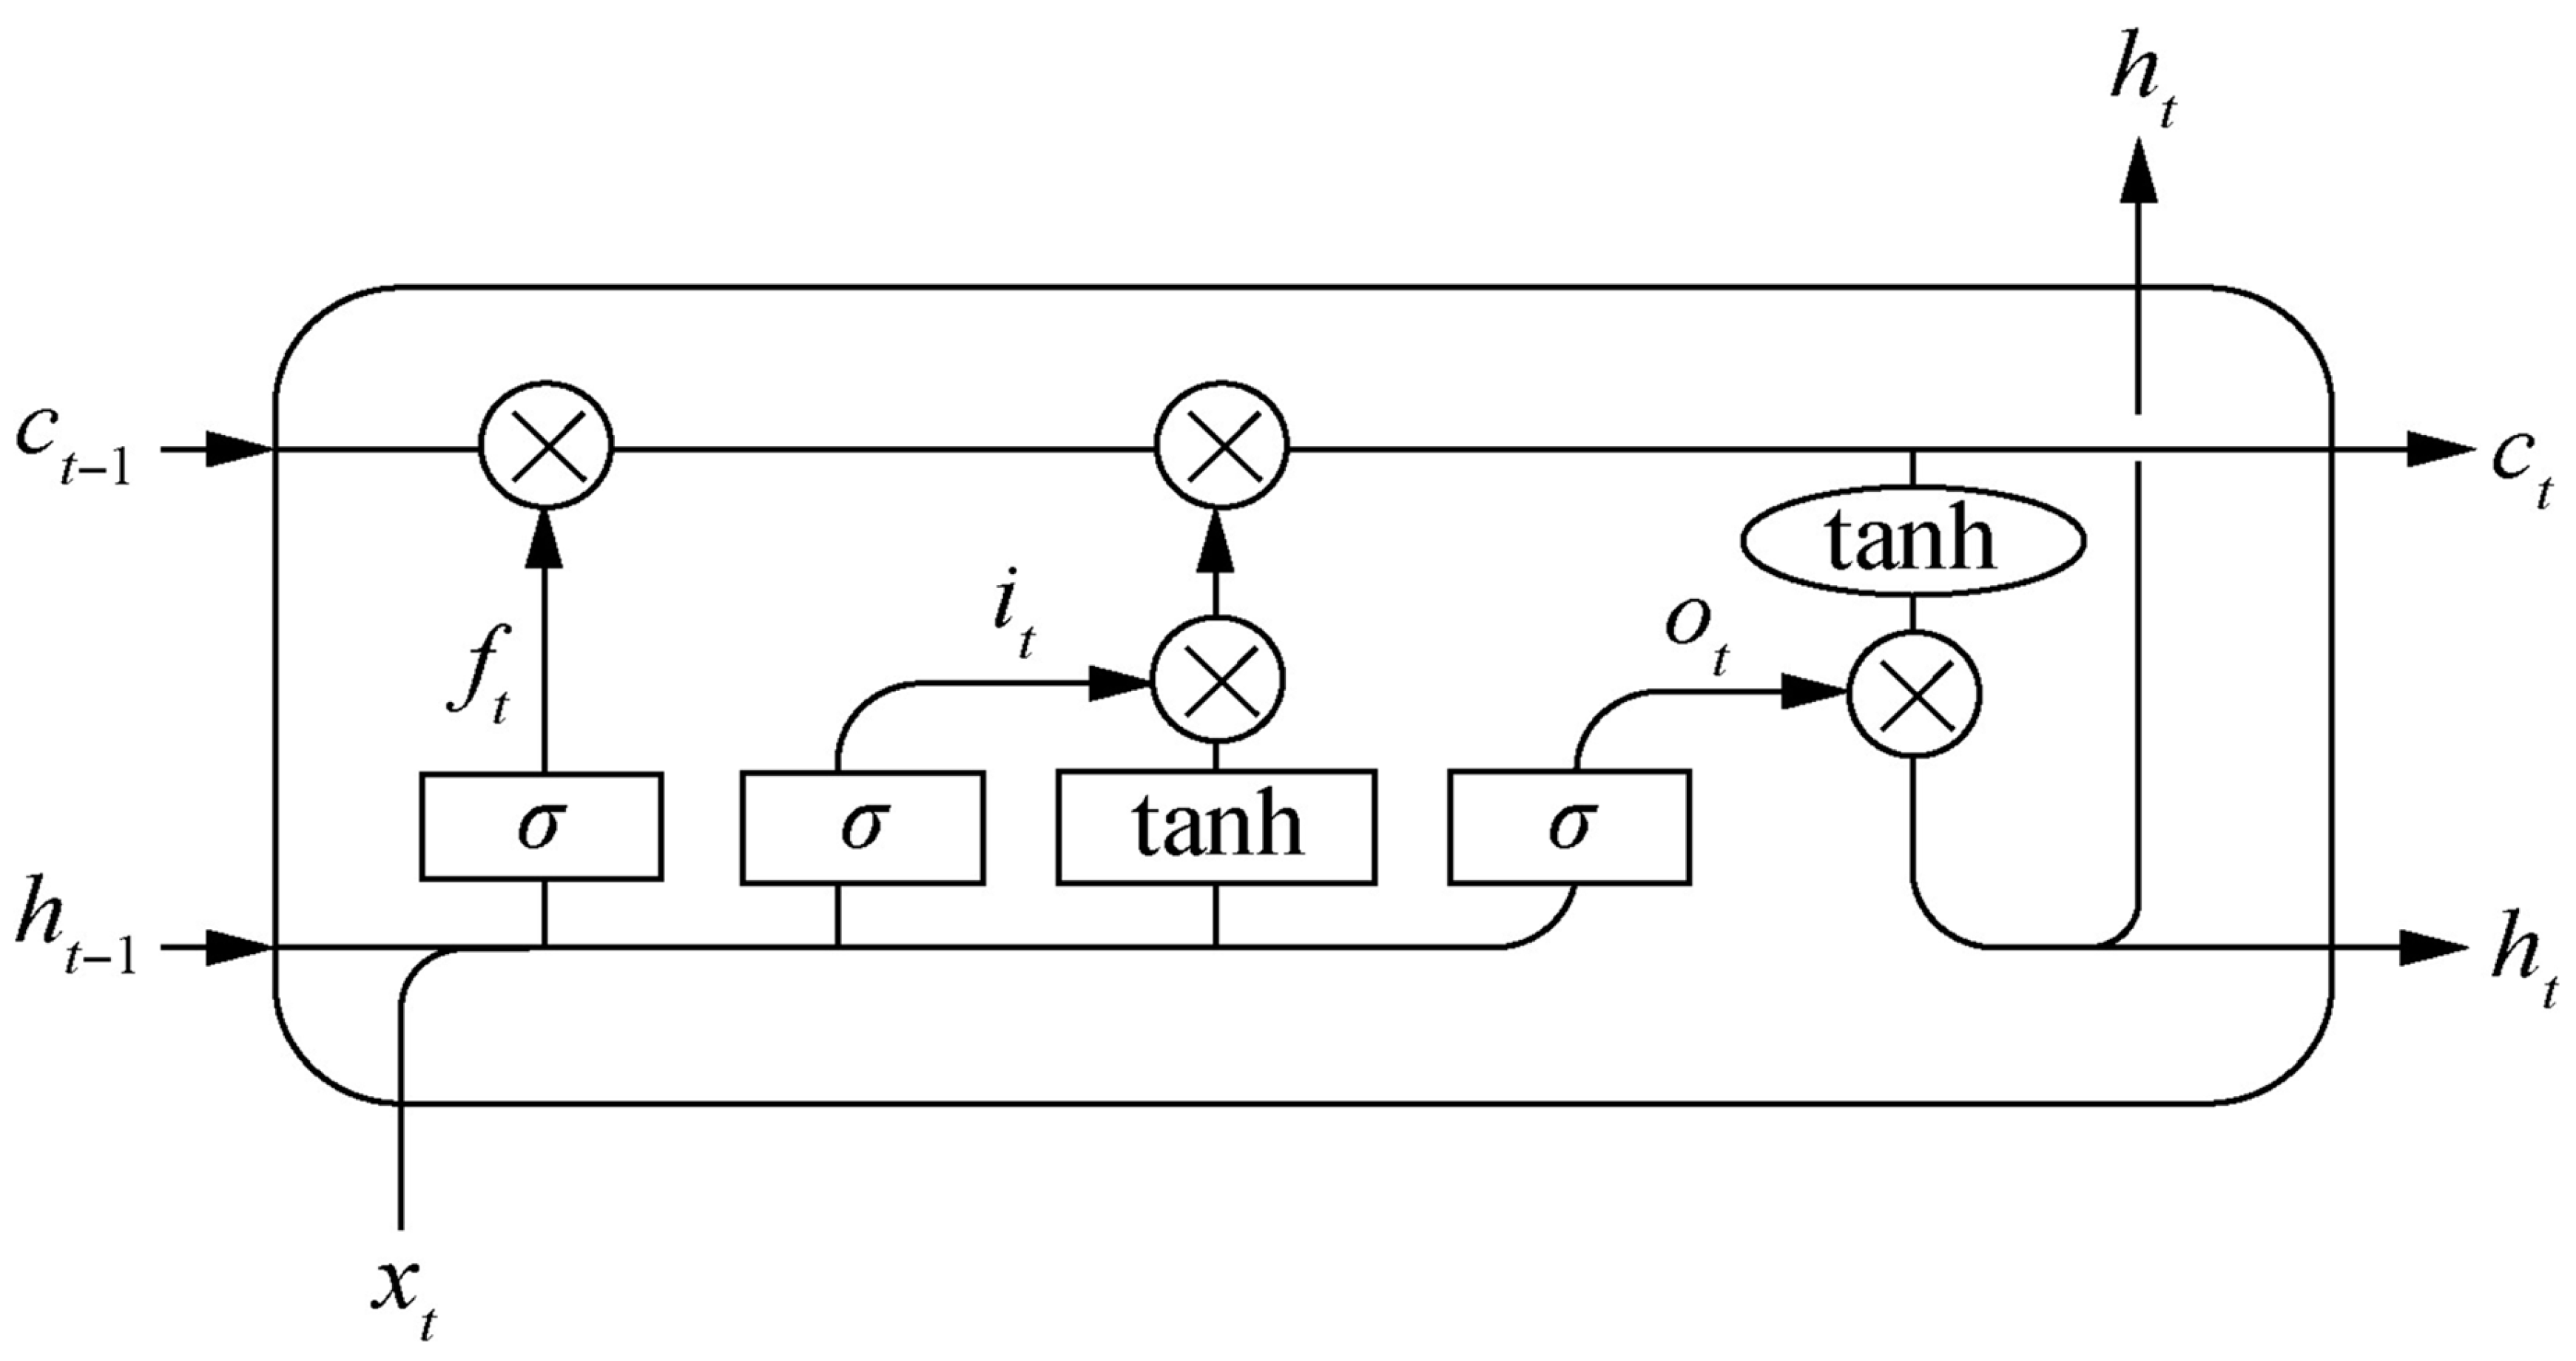
Recurrent long short-term memory networks exploit gate structures and memory cell states for efficient updating and passing significant information contained in time series data.
Figure 3: Architecture of an LSTM unit [
16]. Because they are able to manage long-term dependencies much better than traditional RNNs are able to manage long-term dependencies, LSTMs thus fit well for the processing of data with strong temporal relations. Increasing the parameters while training any model generally results in a higher expressive capacity and information retaining capacity of the model. However, the increase actually contributes to information overload. To address this issue, the attention-LSTM model implements an attention mechanism within an LSTM framework [
17]. Accordingly, this represents an enhancement that allows more computational resources to be spent on the most relevant components to achieve better performance where the computational capacity is at a premium.
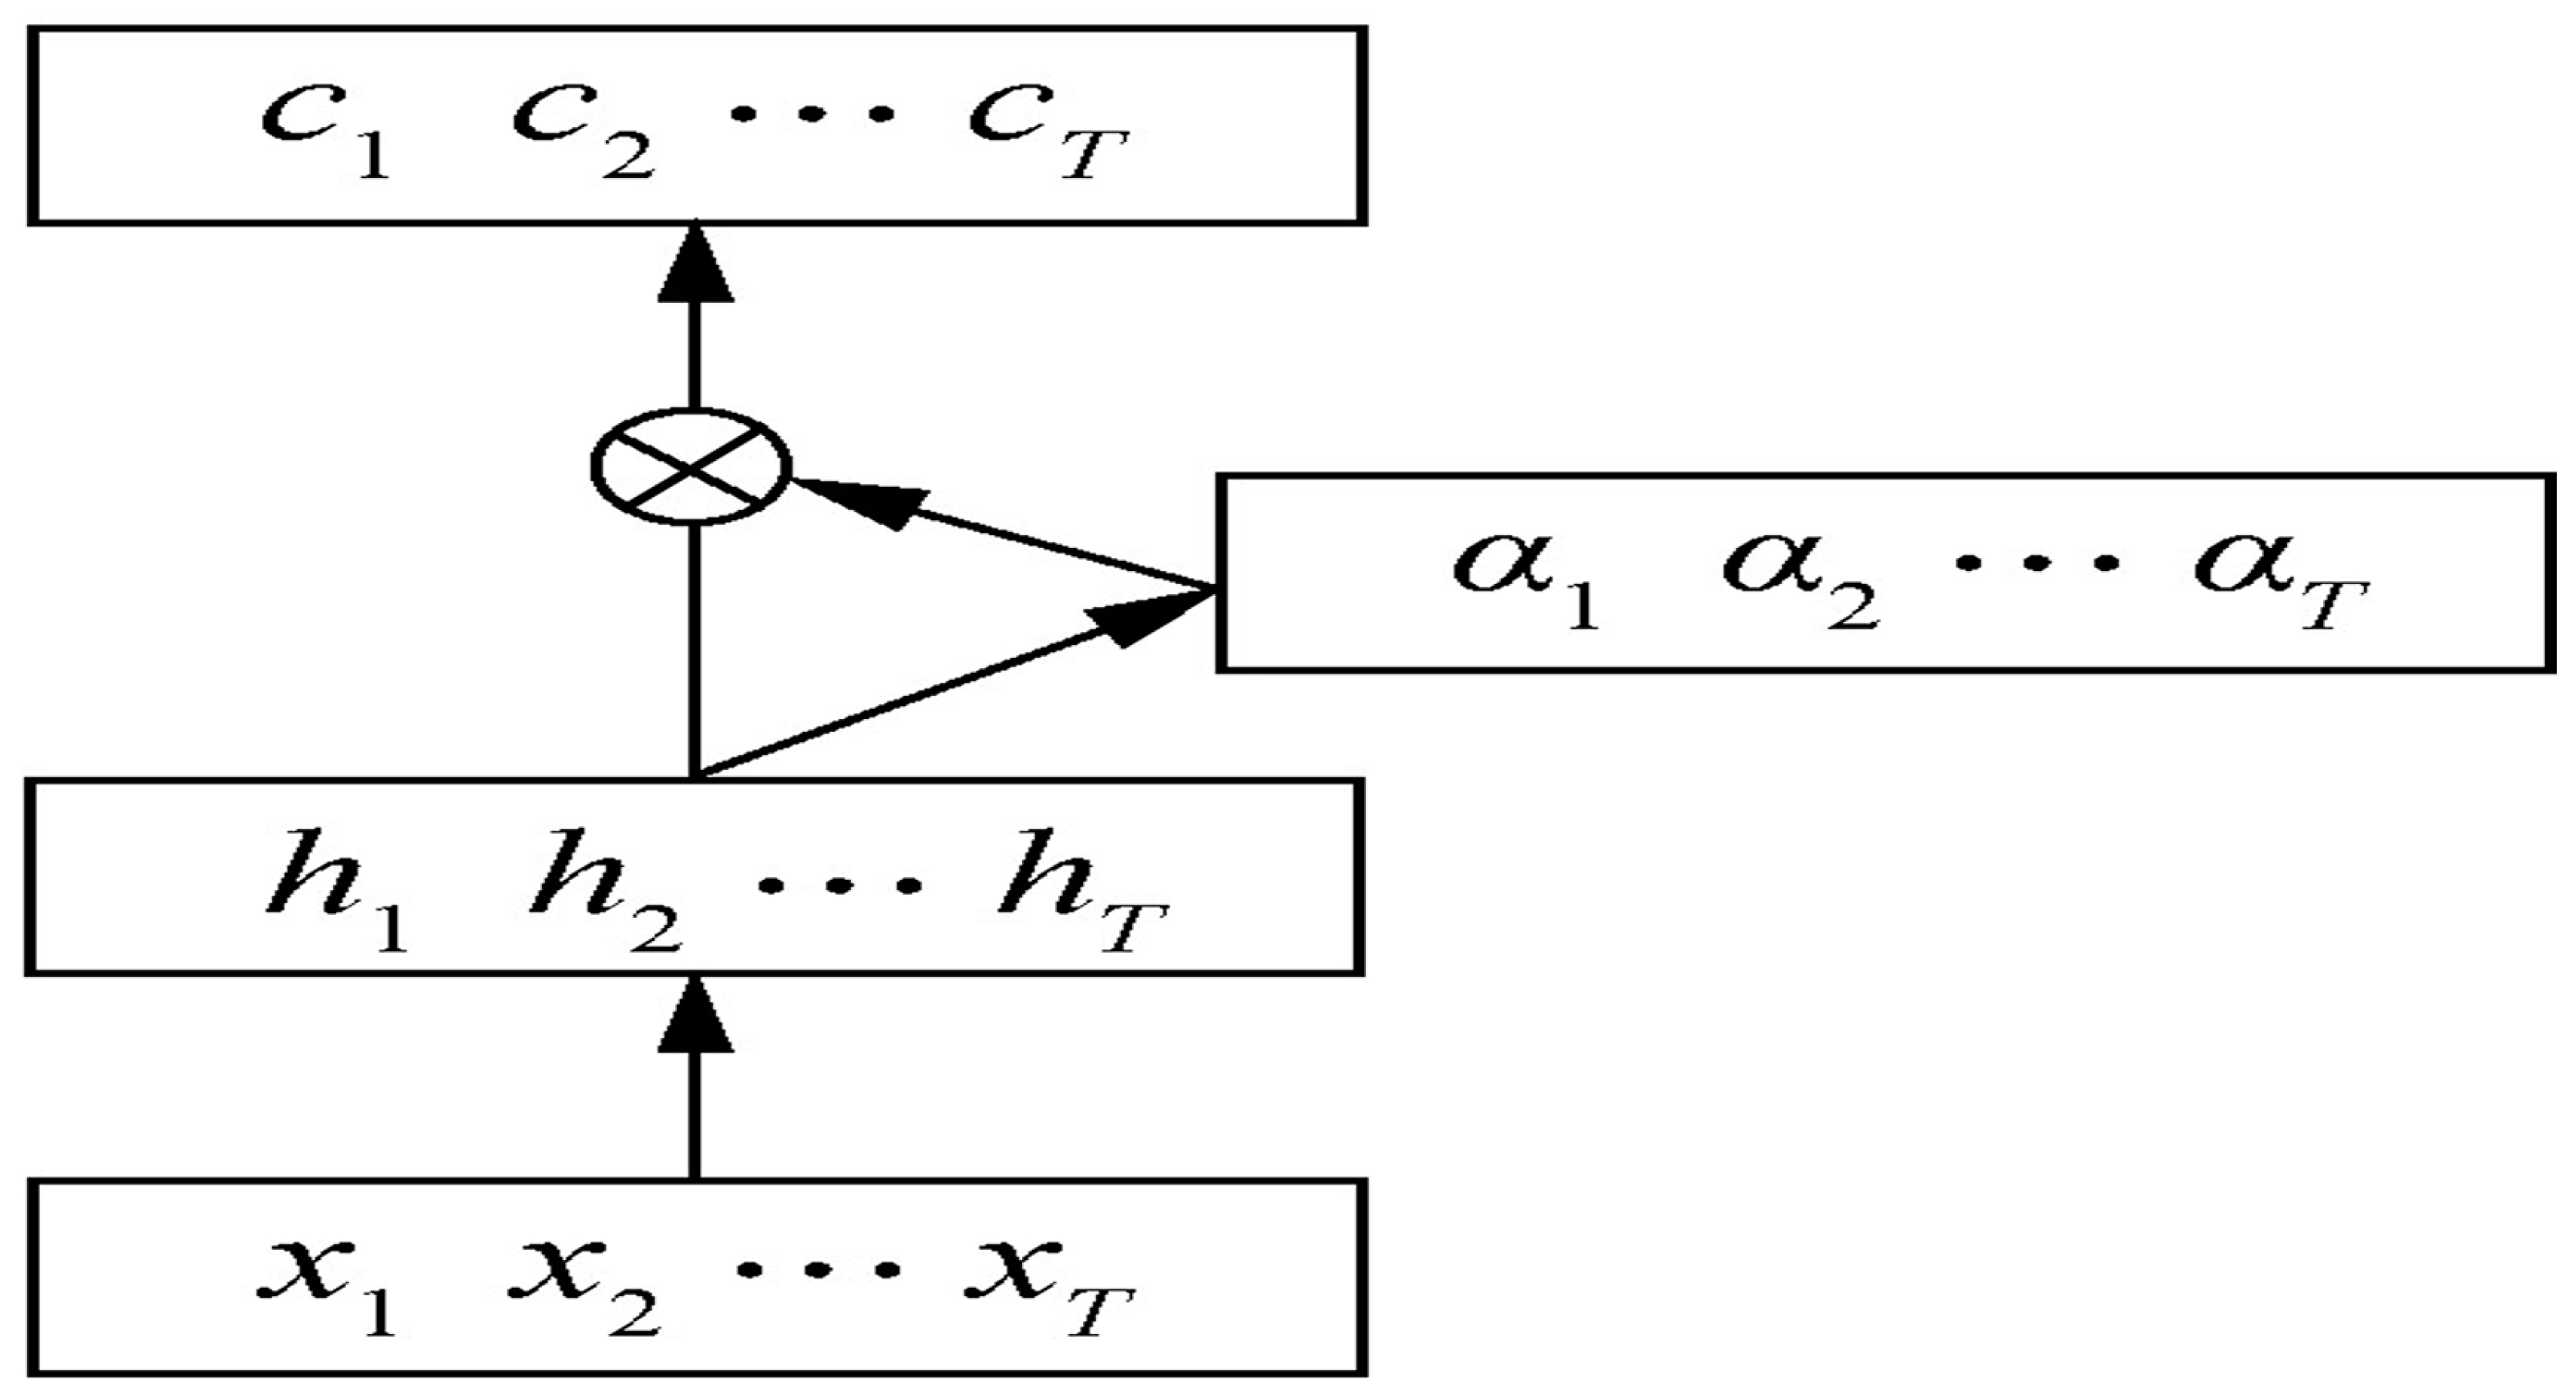
In practice, attention usually comes into two flavors: soft attention and hard attention. Soft attention involves learning and assigning weights to all data points in a differentiable manner where each point is assigned a continuous value reflecting its relative importance. On the other hand, hard attention gives weights in a binary manner, 0 or 1, to data points; that is, it either selects or does not select information. In this work, a soft attention mechanism is applied by independently setting different weights for each feature dimension during training. Hence, this can be regarded as the contribution rate of each feature dimension to the performance of automobile sales prediction.
Figure 4 shows the architecture of the LSTM network integrated with the attention mechanism [
18,
21]. This allows the model to pay more attention to the most influential features that can lead to predictive accuracy. The attention mechanism of Bin et al. is represented in equations (4) and (5).
In Equations (4) and (5), represents the attention weight, represents the output feature value of the input sequence, represents the training matrix, and are the trained weight matrices, indicates the internal hidden state of the output unit, and represents the hidden layer state of the input sequence.
The output of the attention mechanism is
4. Results
4.1. Data Collection and Processing
The data used in this research are from the “China Mobile Home” website, which is rich in monthly statistical data. The sample tested ranges from January 2018 to December 2023, and data from January 2018 to June 2023 are used as the training set, while those from July to December 2023 are used for testing.
The current paper has modeled the predictive feature system on the basis of an enormous literature review related to the determinants of sales of mobile phones, featuring three broad key dimensions. The first dimension captures the online behavioral nature of consumers, such as brand exposure, word-of-mouth, and the frequency of interactions with web pages. The second dimension incorporates features derived from macroeconomic indicators, such as GDP, CPI, and other relevant economic metrics. The third dimension incorporates historical sales metrics such as past sales figures and statistics on the ownership of mobile phones. Each feature is described in detail in
Table 5.
To ensure that the selected features are relevant, a correlation analysis was carried out, which confirmed that all 15 features are significantly correlated with the actual sales of mobile phones. Notably, in addition to historical sales, brand exposure was the most influential factor, with a Pearson correlation coefficient of 0.647. This correlation is statistically significant at the 10% level. The results of the feature correlation analysis are listed below in
Table 6. Since the value ranges of these multidimensional features vary widely, the data should first be normalized before being fed into the model. This step is very important for accelerating the learning process of the neural network represented by Equation (6).
4.2. Analysis of Results
In the attention-LSTM network training process, the mean square error (MSE) is used as the loss function to calculate the Euclidean distance between the model prediction value and the actual value, as shown in Equation (7).
Equation (7). where represents the actual value of the th data point; represents the model’s prediction value; and represents the data volume.
This work is concerned with minimizing the MSE to achieve high predictive accuracy. The procedure initializes the random seed, specifies the number of iterations for training, and fixes the learning rate η; it then invokes the optimization algorithm Adam for fine-tuning to derive the eventual model parameters. The salient point is that Adam remains an extension over the stochastic gradient descent algorithm that updates all model parameters at their individual learning rates. Unlike SGD, which implements one uniform learning rate for all parameters, Adam assigns independent adaptive learning rates for each model parameter and is proposed in practice to be more effective and efficient.
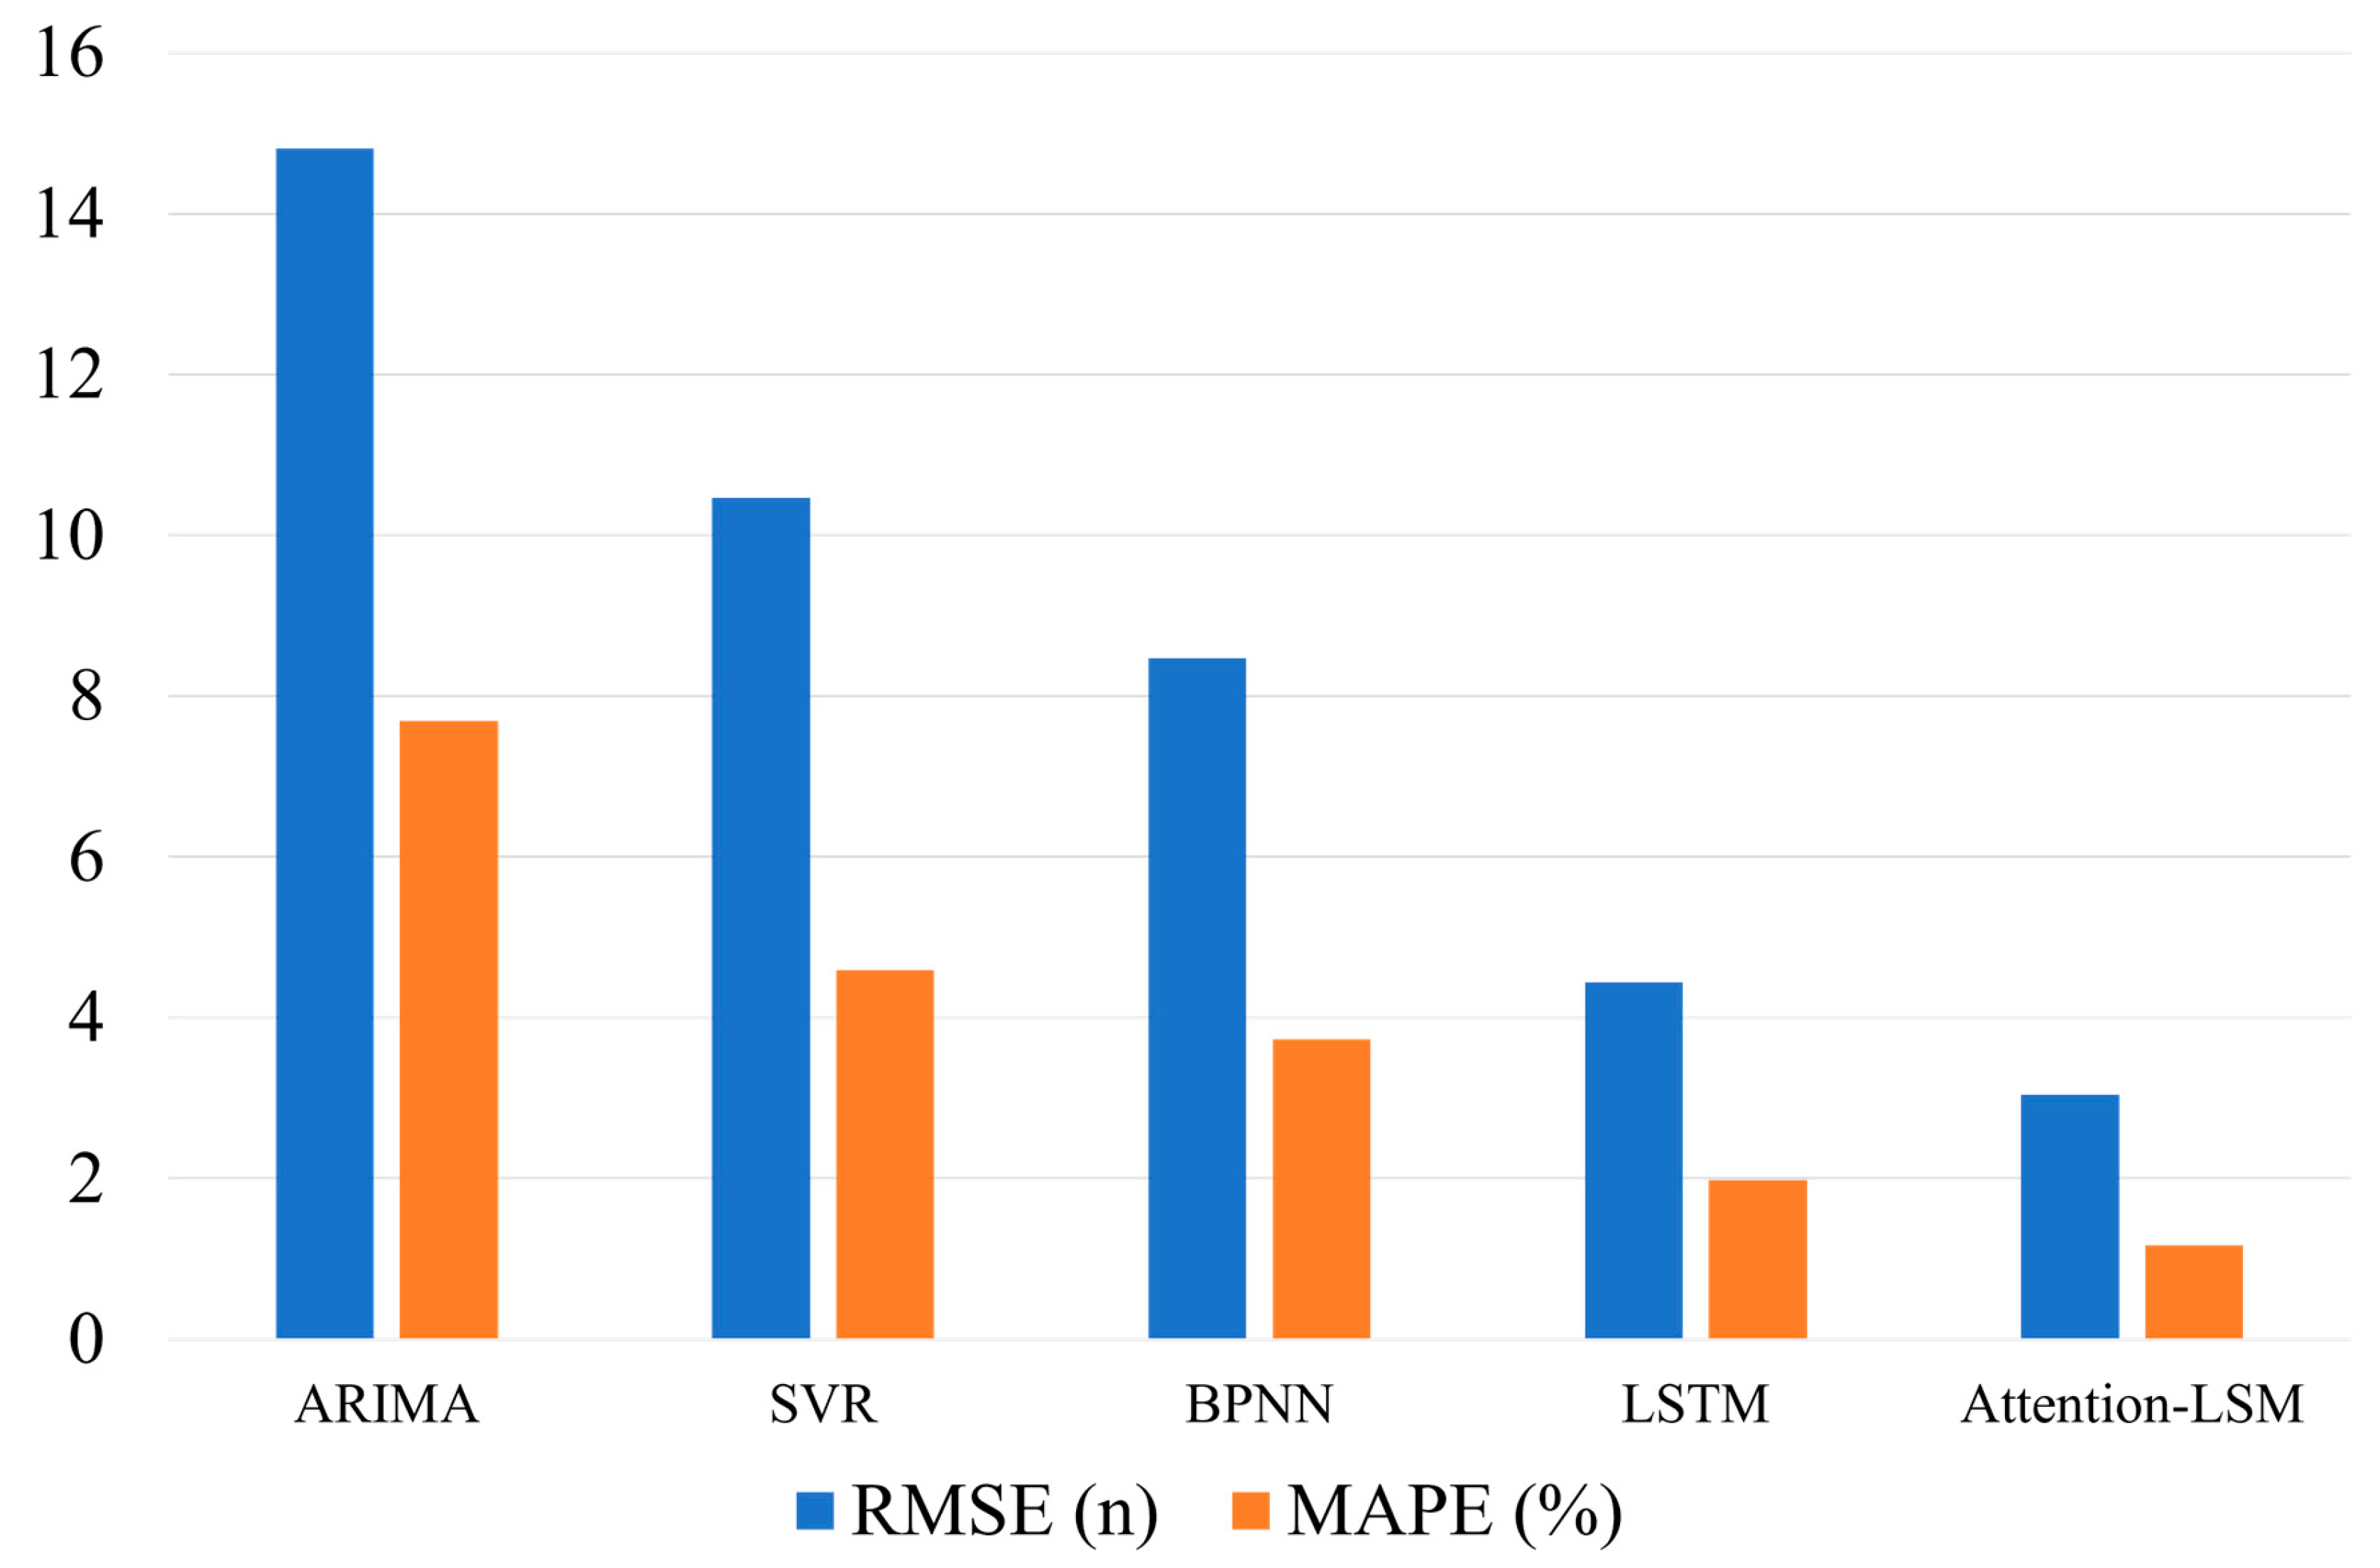
The two main metrics for assessing the predictive performance of the model in this study are the RMSE and MAPE. The RMSE is particularly useful because it shares the same unit as the variable being predicted; thus, the result is intuitive and easy to interpret. Additionally, the RMSE is very sensitive to strong deviations between forecasts and actual values; hence, it is one of the desired metrics when performing any forecasting assessment. On the other hand, the MAPE is scale independent, and it allows multiple model comparisons directly, which is key to the prediction accuracy of the models. Thus, the dual use of the RMSE and MAPE allows one to make a more robust assessment regarding predictive model performance. The expressions used to compute the RMSE and MAPE are shown in Equations (8) and (9), respectively [
27].
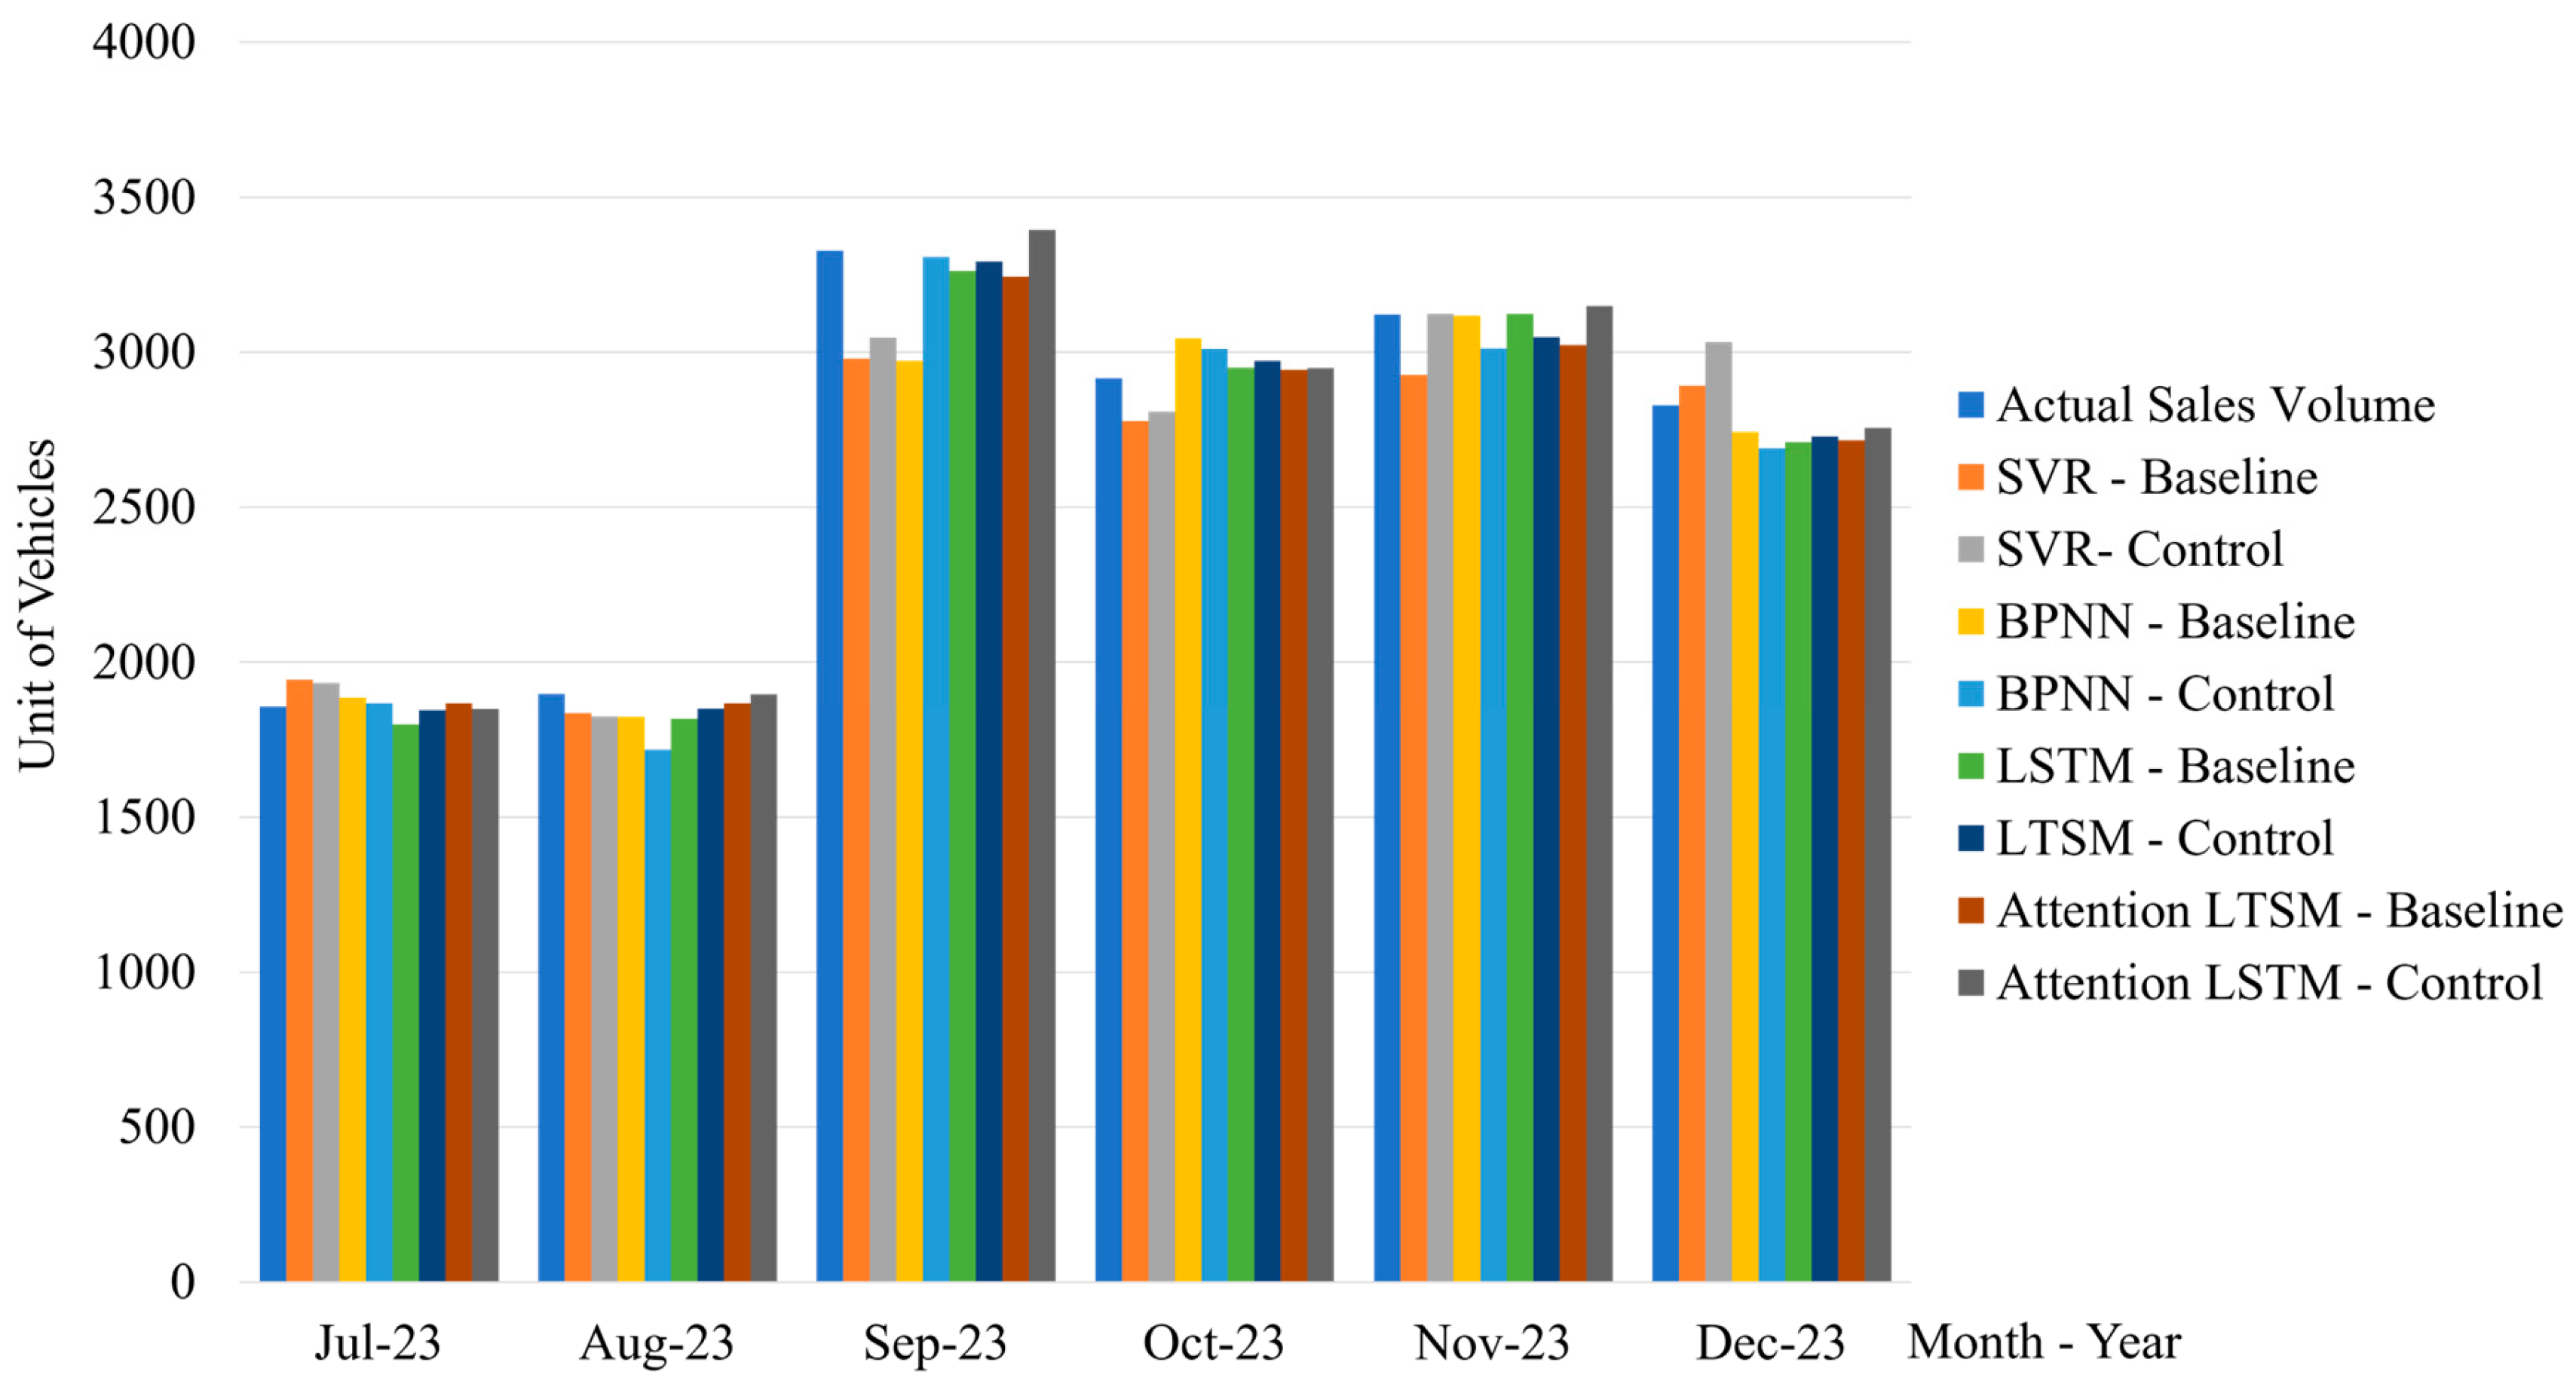
In this study, we tested the effects of support vector regression, a backpropagation neural network, long short-term memory, and an attention-LSTM network on the predictive power of brand exposure for mobile phone sales. We created four comparative experimental structures; two kinds of structures are baseline models without brand exposure, with and without the promotion; and control groups contain brand exposure, with and without the promotion. These experimental results can be summarized in
Table 7 (
Figure 5), which clearly shows that, in all cases, the addition of brand exposure greatly enhanced the prediction qualities of the models—that is, decreased the RMSE and MAPE (
Figure 6). More precisely, the ones that showed the largest relative improvements were the attention-LSTM models, with magnitudes of 2.02% for the RMSE and 0.96% for the MAPE. These results highlight the real predictive power of the brand exposure metric, which was created by synthesizing word-of-mouth comments and online search data, in sales forecasting for mobile phones.
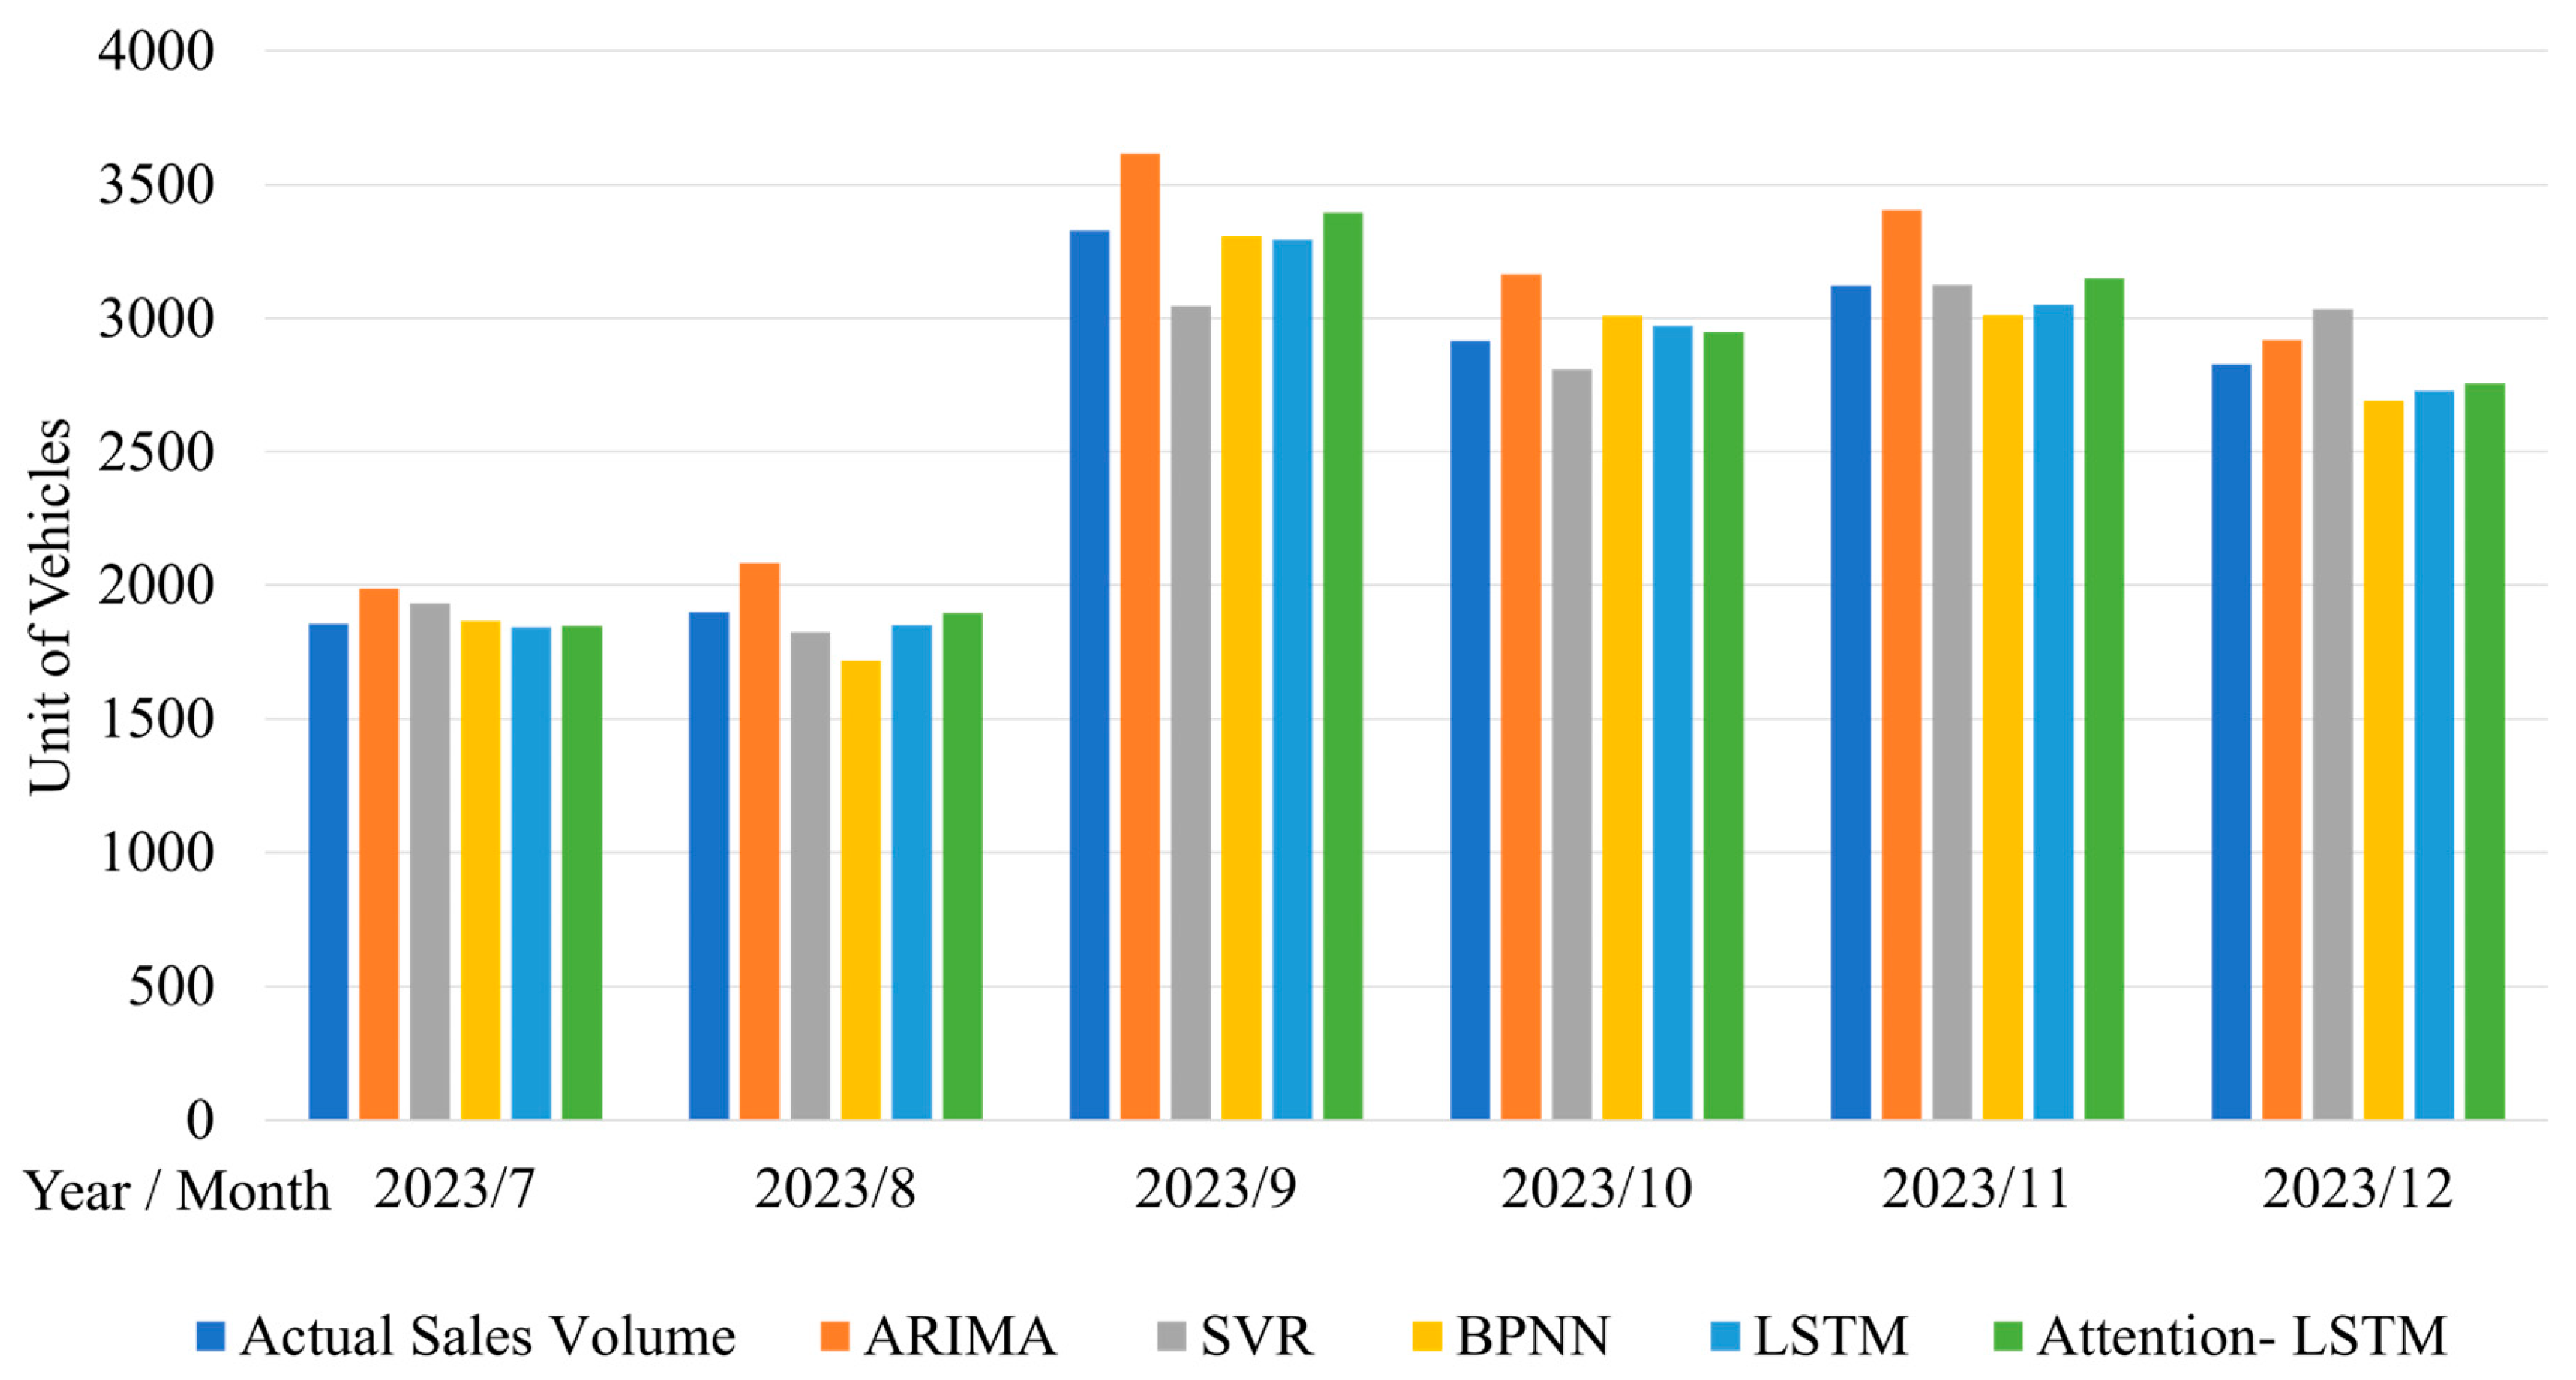
Furthermore, the predictive performances of the attention-LSTM model are compared with those of several traditional forecasting methods, including the time series models ARIMA, SVR, and the BP neural network. The results are shown in
Table 8 (
Figure 7 and
Figure 8), and the predictive errors of
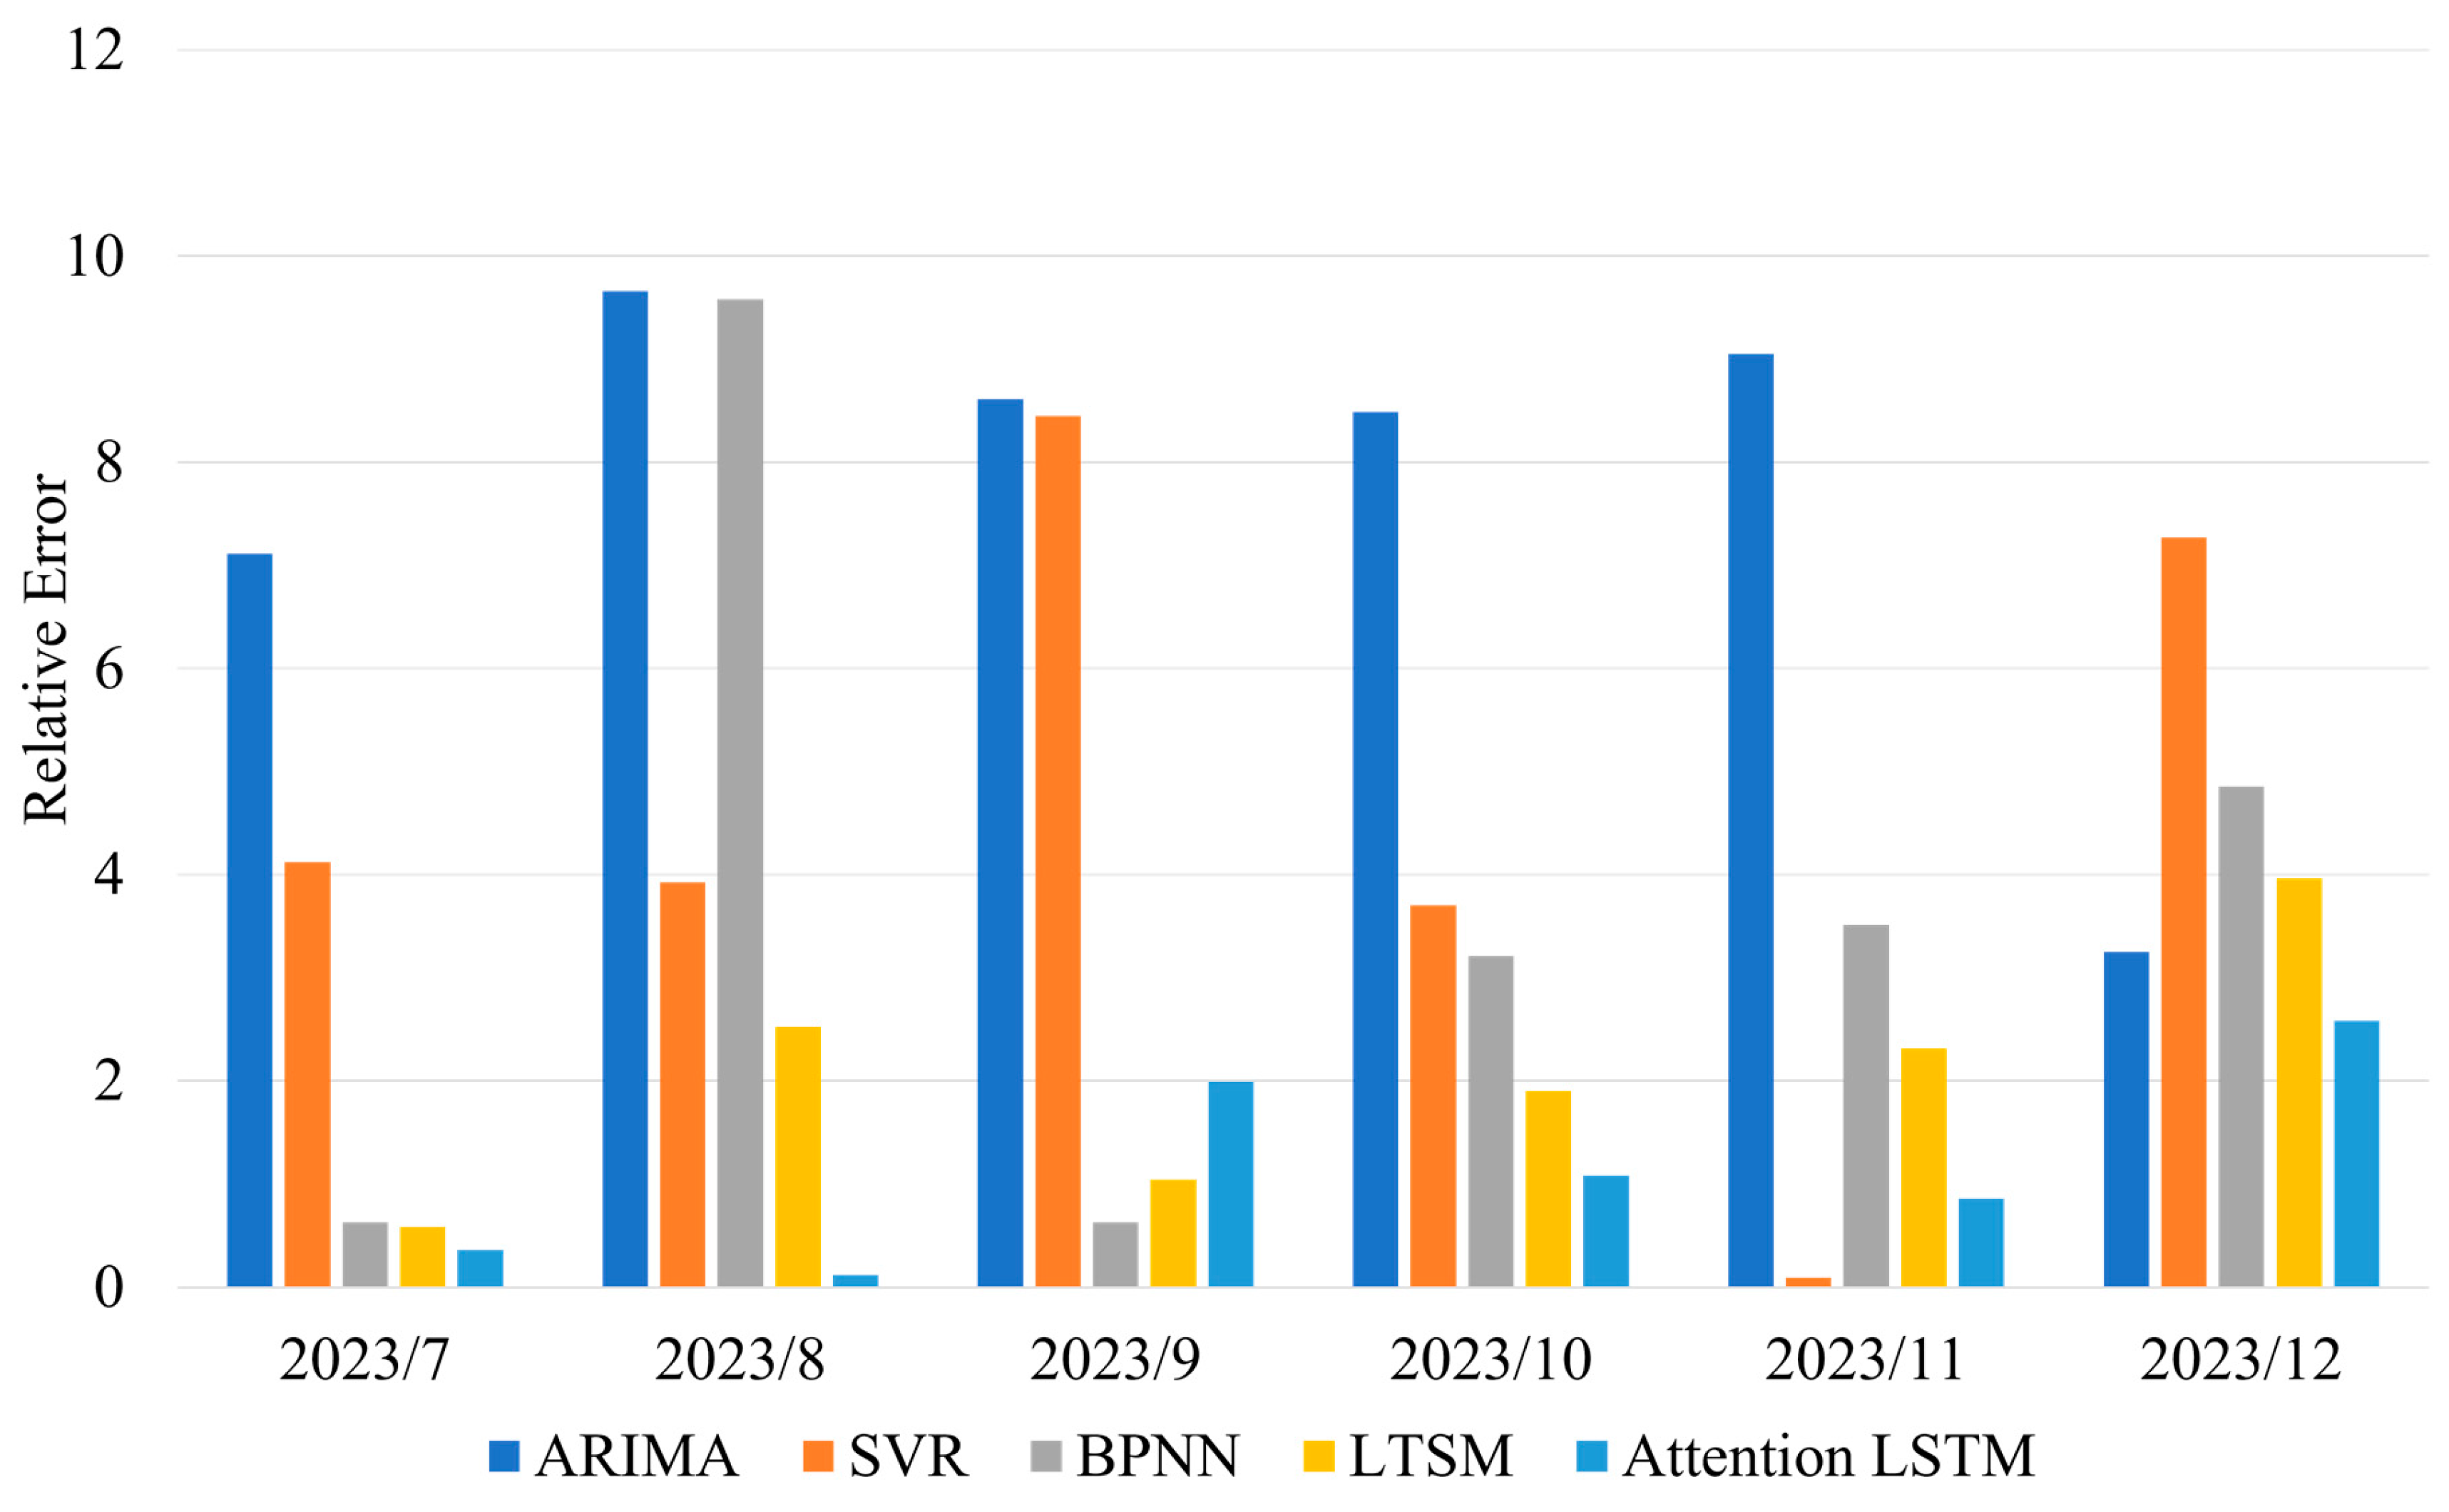
Table 8 are shown in
Table 9 (
Figure 9).
Table 9 shows that the Attention-LSTM model significantly improves the results over those of the ARIMA model by 11.77% in terms of the RMSE and by 6.52% in terms of the MAPE. Compared with SVR, the attention LSTM model achieves a 3.42% reduction in the MAPE, a 2.56% reduction in the MAPE, and a 0.81% reduction in the MAPE. These in-sample results confirm that the Attention-LSTM model offers the best predictive performance in sales forecasting for mobile phones, especially when the sample size is small and the time series is high-dimensional.
5. Discussion
The development and application of a mobile phone sales forecasting model integrated with brand exposure and based on the attention-LSTM framework represent important steps forward in the domain of sales forecasting, especially in such a fast-evolving context represented by the mobile phone industry. This study not only considers the classical limitations of both time series models and machine learning methods but also develops a new brand exposure measure that significantly increases the accuracy of sales predictions. The other highly useful innovation of the study involves quantifying brand exposure. This study effectively combines online reputation data from word-of-mouth forums and online search trends, capturing the real-world dynamics of consumer behavior.
This system overcomes the inadequacy of historical sales data and macroeconomic predictors, most of which fall short on many occasions due to their retrospective nature and inability to factor in fast-changing consumer sentiments and brand perceptions in the digital space. The use of word2vec for keyword extraction and PCA for synthesizing brand exposure has introduced strong mechanisms for quantifying brand exposure into this study, making it a critical predictor of sales trends. This method is important because it may reveal the real interest of consumers in mobile phone brands and their real engagement, which are the main precursors of sales. Building brand exposure into the forecasting model can provide a far better understanding of what truly drives sales, thus offering more reliable ground for predicting further tendencies. This is particularly important in the context of the influence of the Chinese mobile phone market, where consumer behavior increasingly flows from online interactions and digital platforms.
The attention-LSTM model is applied in this paper to address intrinsic nonlinear problems, high dimensionality, and seasonality of mobile phone sales. Traditional models that address such difficulties, such as the ARIMA, SVR, and BP neural networks, are not effective. In contrast, long-term dependence can be captured with the attention-LSTM model by means of an attention mechanism that assigns different weights to input features. The results of this study prove that Attention-LSTM does a better job than traditional models do with respect to reducing the RMSE and MAPE when capturing the complex patterns of mobile phone sales. This is evidenced by the fact that the model outperforms standard LSTM models by 2.02% for RMSE reduction and 0.96% for MAPE reduction. Compared with the ARIMA, SVR, and BP neural networks, the attention-LSTM model reduced the average percentage error by 6.52%, 3.42%, and 2.56%, respectively. These results highlight that this model is effective in capturing the intricacies of mobile phone sales trends and is thus valuable to policymakers and stakeholders alike. Implications for the Mobile Phone Industry
The contributions of this research will extend beyond the academic realm to offer pragmatic benefits to mobile phone manufacturers and government policy thinkers. For manufacturers, for example, increased accuracy in sales forecasting enables one to plan production and manage inventory with greater ease. Accurately predicting the number of units demanded in the market would enable companies to optimize their supply chains to minimize costs and maximize profitability. In addition, an analysis of brand exposure will provide insights to further drive marketing strategizing by allowing companies to focus on reinforcing brand engagement and responding to consumer concerns in good time. This provides government policymakers with more accurate sales forecasts to make informed decisions on industry regulation and economic policy. With better predictions of sales trends, any shifting market will be better anticipated; thus, policy adjustments can be made well in time to sustain growth in the industry. In this context, such predictions can prove of great value in slowing the mobile phone market, such as what China has witnessed, in sustaining economic stability and consumer confidence.
6. Conclusion
This research underlines the increasing relevance of using online search data and word-of-mouth comments in inferring mobile phone sales. We have integrated these sources of data to devise a novel means of quantifying brand exposure, which is integral to enhancing that predictive power. In this paper, by implementing a more refined word2vec approach, we select significant time-lag correlated keywords of mobile phone sales and combine them with PCA to create the brand exposure feature. Compared with traditional time series models such as ARIMA and machine learning algorithms such as support vector regression (SVR) and backpropagation neural networks, the attention-LSTM model performs much better in forecasting mobile phone sales. Advanced feature selection, network optimization, and parameter training can enable the attention-LSTM model to achieve good performance by improving the accuracy of prediction. These findings underline the possibility of using brand exposure metrics within forecasting models and build valuable insights relevant to developing methodologies for predicting sales.
7. Limitations
This study is subject to several limitations. First, it considers only brand exposure and ignores other important influences on sales volume, such as product attributes and promotional activities, in shaping mobile phone selling activities. In the future, complementary variables can be added to increase the model’s accuracy. The model considers only brand exposure as a single feature. Making the model more elaborate, taking multidimensional features such as product type and consumer sentiment into consideration might be helpful in enhancing the forecast. Furthermore, the paper uses certain online platform data; therefore, it becomes reflective and does not fully represent customer behavior. Drawing from more social media and review sites in the data could provide a comprehensive understanding. Finally, the model fails to consider the variation in time and context, which might affect the sales pattern. Future research should consider incorporating such factors in modeling to make the model adaptable and relevant at the time of application.
Author Contributions
Conceptualization, H.M.; methodology, H.M.; software, H.M.; validation, H.M.; formal analysis, H.M.; investigation, H. M. and M.C.; resources, H. M and M.C.; data curation, H.M.; writing—original draft preparation, H.M.; writing—review and editing, H.M. and M.C.; visualization, H.M.; supervision, H. M; project administration, H. M; funding acquisition, M.C. and H.M. All authors have read and agreed to the published version of the manuscript.
Funding
This research was funded by the National Natural Science Foundation of China, grant number 70832003.
Data Availability Statement
Some of the data analyzed in this study are not publicly available, as they were obtained from a private company, and restrictions apply to the availability of these data, but the remaining data can be acquired from the corresponding author upon reasonable request.
Conflicts of Interest
The authors declare no conflicts of interest.
References
- Xu, T.; Wu, Q. Research on New Product Announcement and Consumer Attention. Soft Science 2020, 34, 58-64.
- Crowson, M.G.; Witsell, D.; Eskander, A. Using Google Trends to Predict Pediatric Respiratory Syncytial Virus Encounters at a Major Health Care System. Journal of Medical Systems 2020, 44(3), 57. [CrossRef]
- Kang, H. G.; Bae, K.; Shin, J. A.; Jeon, S. Will data on internet queries predict the performance in the marketplace: an empirical study on online searches and IPO stock returns. Electronic Commerce Research 2021, 21, 101-124. [CrossRef]
- Li, X.; Law, R.; Xie, G.; Wang, S. Review of tourism forecasting research with internet data. Tourism Management 2021, 83, 104245. [CrossRef]
- Chen, G.; Huang, L.; Xiao, S.; Zhang, C.; Zhao, H. Attending to customer attention: A novel deep learning method for leveraging multimodal online reviews to enhance sales prediction. Information Systems Research 2024, 35(2), 829-849. [CrossRef]
- Fantazzini, D.; Toktamysova, Z. Forecasting German Car Sales Using Google Data and Multivariate Models. International Journal of Production Economics 2015, 170(A), 97-135. [CrossRef]
- Wang, L.; Ning, Y.; Jia, Jianmin. Predicting Sales and Market Share with Online Search: Evidence from Chinese Automobile Market. Journal of Industrial Engineering and Engineering Management 2015, 29(4), 56-64.
- Feng, M.; Liu, C. Prepurchase Research Behaviors, Leading Climate Index and Demand Forecasting Based on internet Search Data: The Case of Automobile Industry in China. Journal of Marketing Science 2013, 9(3), 31-44.
- Sun, W.; Dai, M. Mobile Phone Sales Forecast based on Exponential Smoothing and Regression. Journal of Mudanjiang Normal University (Natural Science Edition) 2017, (04), 23-26.
- Shaik, M. A.; Verma, D. Predicting present day mobile phone sales using time series based hybrid prediction model. AIP Conference Proceedings 2022, 2418, No. 1.
- Kiran, M.; Shanmugam, P. V.; Mishra, A.; Mehendale, A.; Sherin, H. N. A multivariate discrete gray model for estimating the waste from mobile phones, televisions, and personal computers in India. Journal of Cleaner Production 2021, 293,126185.
- Duan, Z.; Liu, Y.; Huang, K. Mobile Phone Sales Forecast Based on Support Vector Machine. Journal of Physics: Conference Series 2019, 1229, 012061. [CrossRef]
- Wang, Man. Mobile phone sales analysis and prediction based on data mining. Beijing University of Technology, 2019. Master Degree Thesis, Beijing University of Technology, Beijing, 2019.6.
- Wang, J.; Li, X.; Li, J.; Sun, Q.; Wang, H. NGCU: A new RNN model for time-series data prediction. Big Data Research 2022, 27, 100296. [CrossRef]
- Guo, X.; Zhao, N.; Cui, S. Consumer Reviews Sentiment Analysis Based on CNN-BiLSTM. Systems Engineering Theory&Practice 2020,40(3),653-663.
- Petersen, N.C.; Rodrigues, F.; Pereira, F.C. Multi-Output Bus Travel Time Prediction with Convolutional LSTM Neural Network. Expert Systems with Applications 2019, 120, 426-435. [CrossRef]
- Jia, P.; Chen, H.; Zhang, L.; Han, D. Attention-LSTM based prediction model for aircraft 4-D trajectory. Scientific reports 2022, 12(1), 15533. [CrossRef]
- Xu, T.; Sun, H.; Ma, C. et al. Classification Model for Few-shot Texts Based on Bidirectional Long-term Attention Features. Data Analysis and Knowledge Discovery 2020, 4 (10), 113-123.
- Tao, Z.; Li, X.; Liu, Y. et al. Classifying Short Texts with Improved-Attention Based Bidirectional Long Memory Network. Data Analysis and Knowledge Discovery 2019, 3(12), 21-29.
- Ullah, A.; Muhammad, K.; Hussain, T.; Lee, M.; Baik, SW. Deep LSTM-based Sequence Learning Approaches for Action and Activity Recognition. in Deep Learning in Computer Vision CRC Press, 2020; pp. 127-150.
- Kumar, I.; Tripathi, B. K.; Singh, A. Attention-based LSTM network-assisted time series forecasting models for petroleum production. Engineering Applications of Artificial Intelligence 2023, 123, 106440. [CrossRef]
- China Daily Economic News, Smartphone Consumption Trend Report 2. 2022.
- Sun, C. An Empirical Study on the Effect of Automobile Market on Automobile Industry Distribution. Technical Economics&Management 2016, (6), 119-123.
- Kim, S.; Park, H.; Lee, J. Word2Vec-Based Latent Semantic Analysis (W2V-LSA) for Topic Modeling: A Study on Blockchain Technology Trend Analysis. Expert Systems with Applications 2020, 152, 113401. [CrossRef]
- Stein, R.A.; Jaques, P.A.; Valiati, J.F. An Analysis of Hierarchical Text Classification Using Word Embeddings. Information Sciences 2019, 471, 216-232. [CrossRef]
- Chen, Xu. Indices Selection for the Early Warning System of Tourism Macro-Economic Performance:Basing on Time Difference Relation Method. Ecological Economy 2013, (11), 87-89.
- Qi, Min.; Zhang, G. An Investigation of Model Selection Criteria for Neural Network Time Series Forecasting. European journal of operational research 2001, 132.3, 666-680. [CrossRef]
|
Disclaimer/Publisher’s Note: The statements, opinions and data contained in all publications are solely those of the individual author(s) and contributor(s) and not of MDPI and/or the editor(s). MDPI and/or the editor(s) disclaim responsibility for any injury to people or property resulting from any ideas, methods, instructions or products referred to in the content. |
© 2024 by the authors. Licensee MDPI, Basel, Switzerland. This article is an open access article distributed under the terms and conditions of the Creative Commons Attribution (CC BY) license (http://creativecommons.org/licenses/by/4.0/).
