Submitted:
02 September 2024
Posted:
02 September 2024
You are already at the latest version
Abstract
Keywords:
1. Introduction
- Optimization of a right-turning pedestrian detection system: The use of 64-channel LiDAR is sufficient to satisfy the requirements of the proposed system and demonstrates that the use of 64-channel LiDAR is reasonable in terms of system efficiency and cost. These results show that the system can maximize the efficiency of the sensor configuration while maintaining high performance recognition capability.
- Cost Effectiveness: The study shows that pedestrian detection systems in intersection can complement the perceptual capabilities of existing autonomous vehicles and reduce the cost of additional sensors on the vehicle.
- Right turn scenario configuration and dedicated dataset: As there are not enough datasets for right turn scenarios compared to the existing studies, we constructed a dedicated dataset based on various right turn scenarios in the simulator separately.
- Robustness in Various Weather Conditions: For pedestrian detection, the robustness of the pedestrian detection system was enhanced by using only LiDAR sensors that are less sensitive to weather changes, as opposed to other sensors that are sensitive to weather changes.
2. System Architecture
3. Materials
3.1. Simulator Selection
- Easy to access
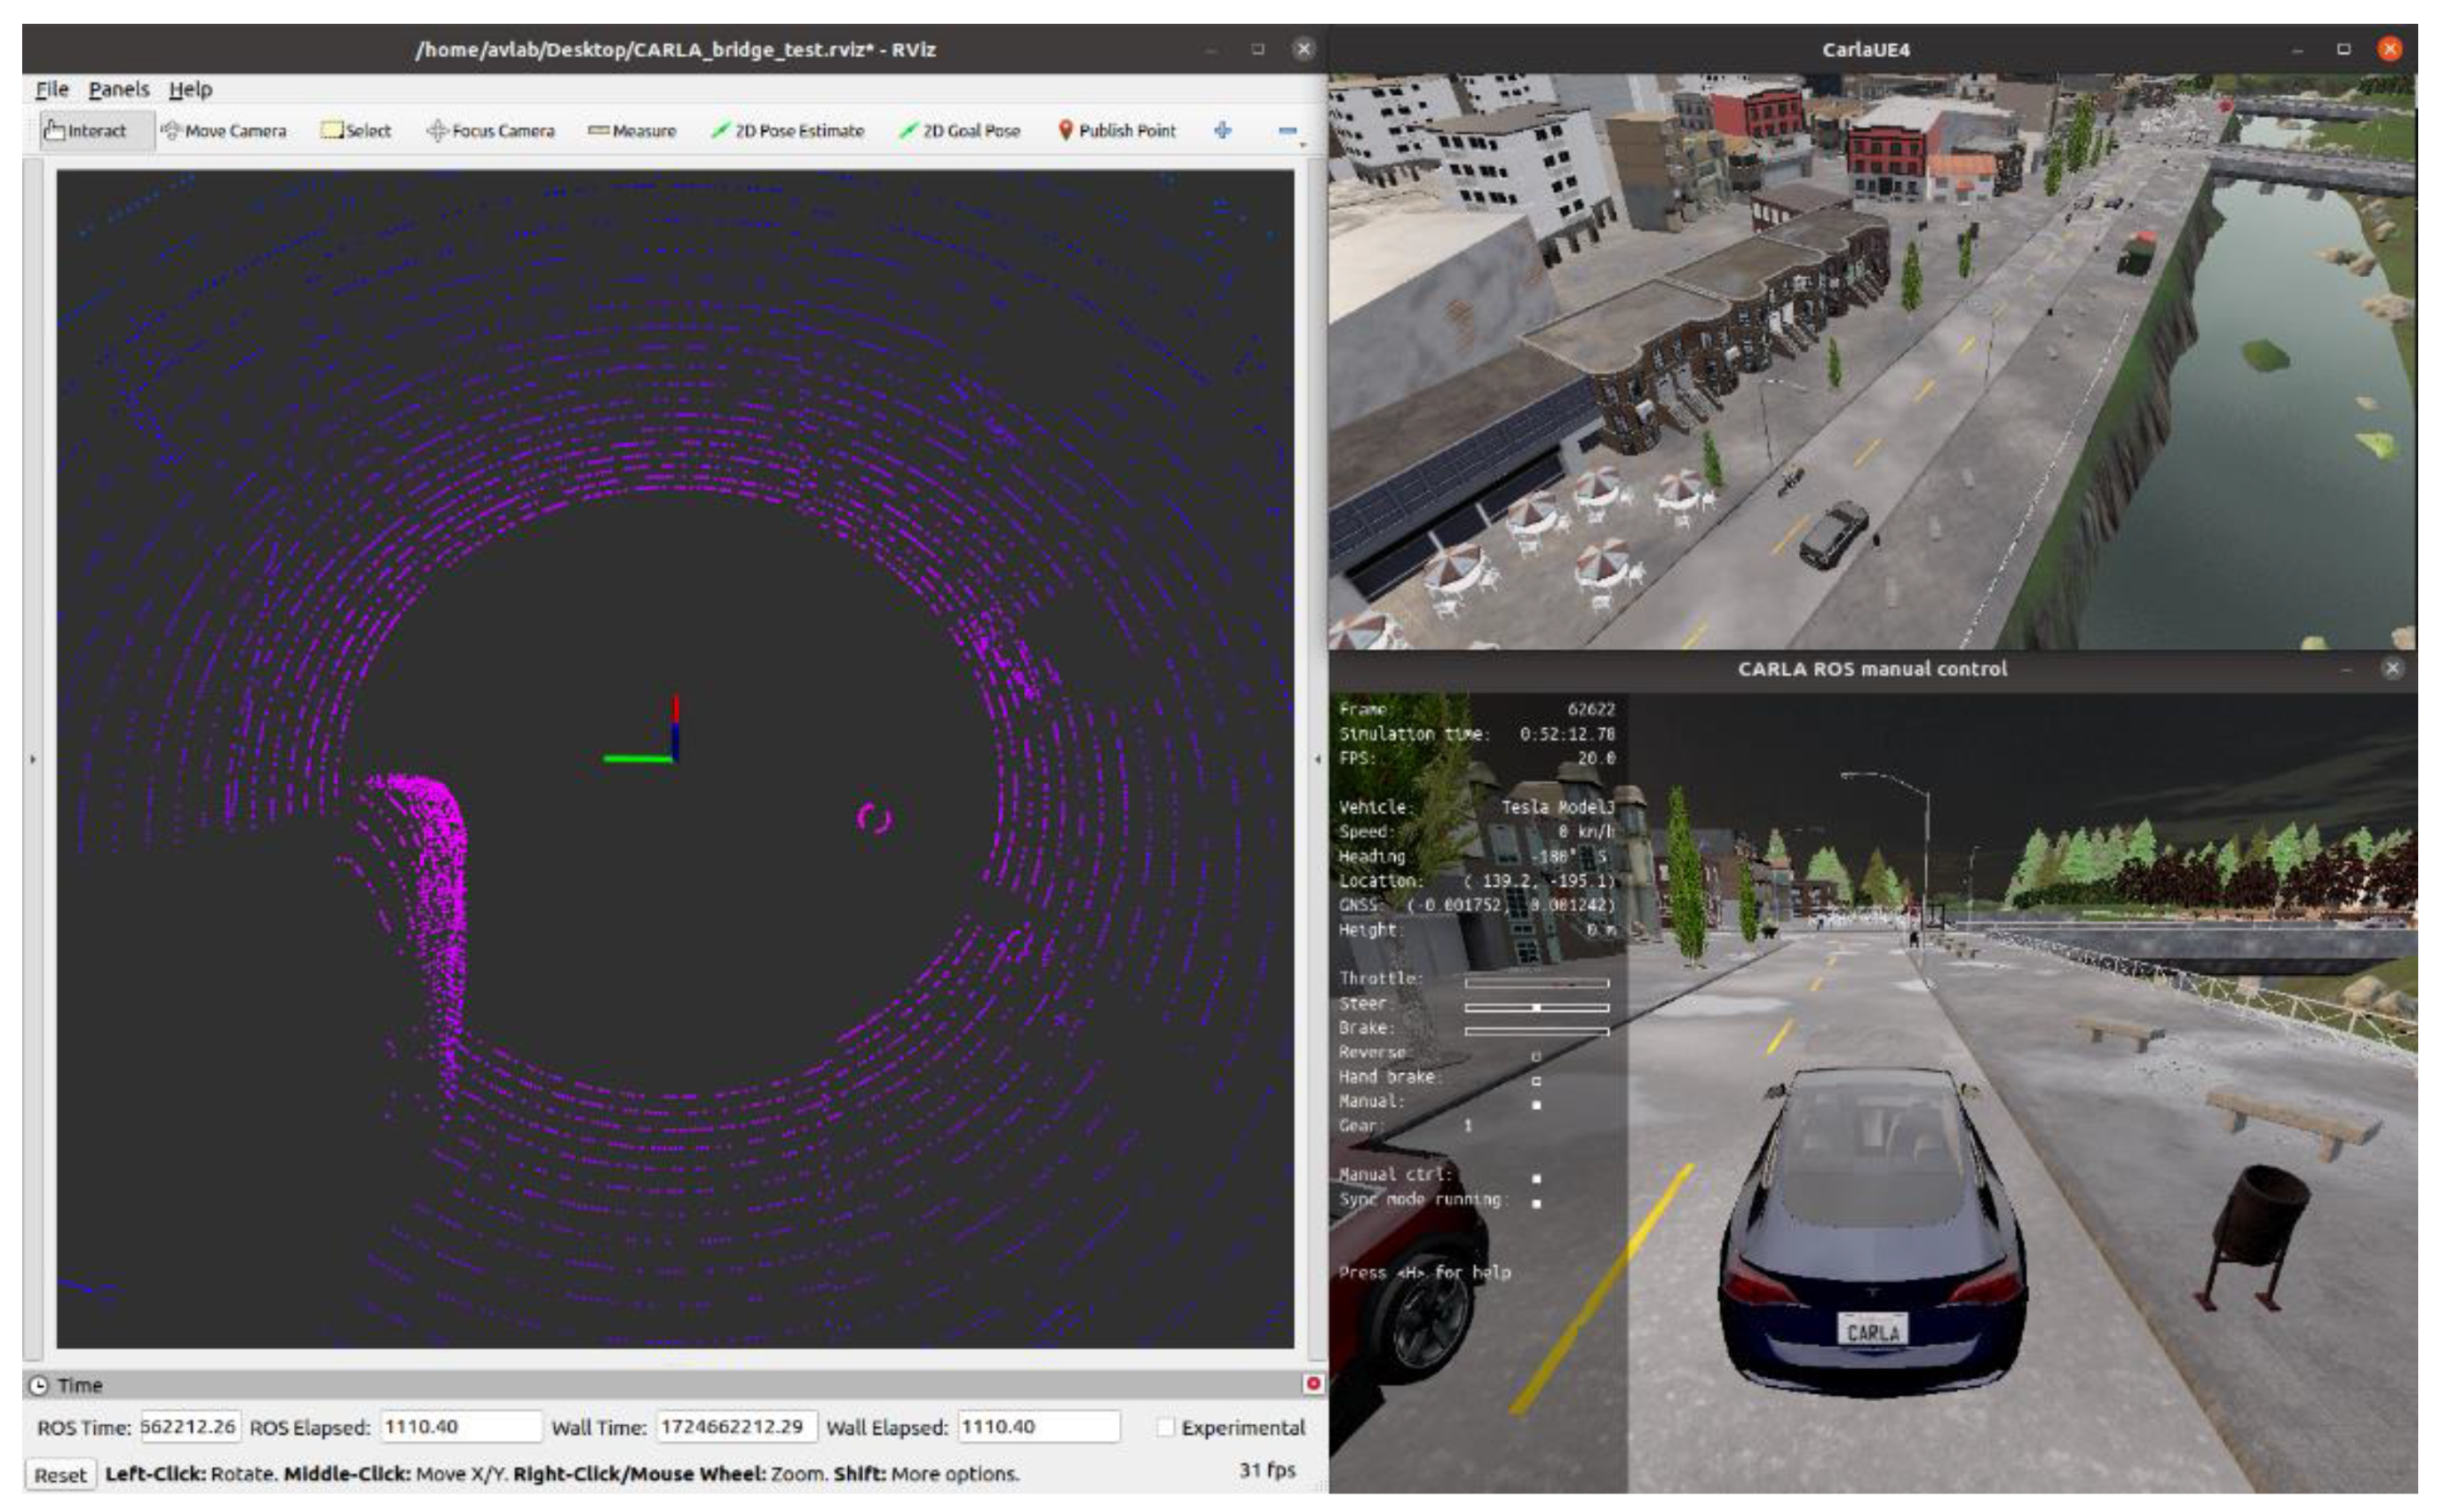
- Integration with the ROS platform
3.2. Simulator Setting
- ①
- Experiment Configuration
- ②
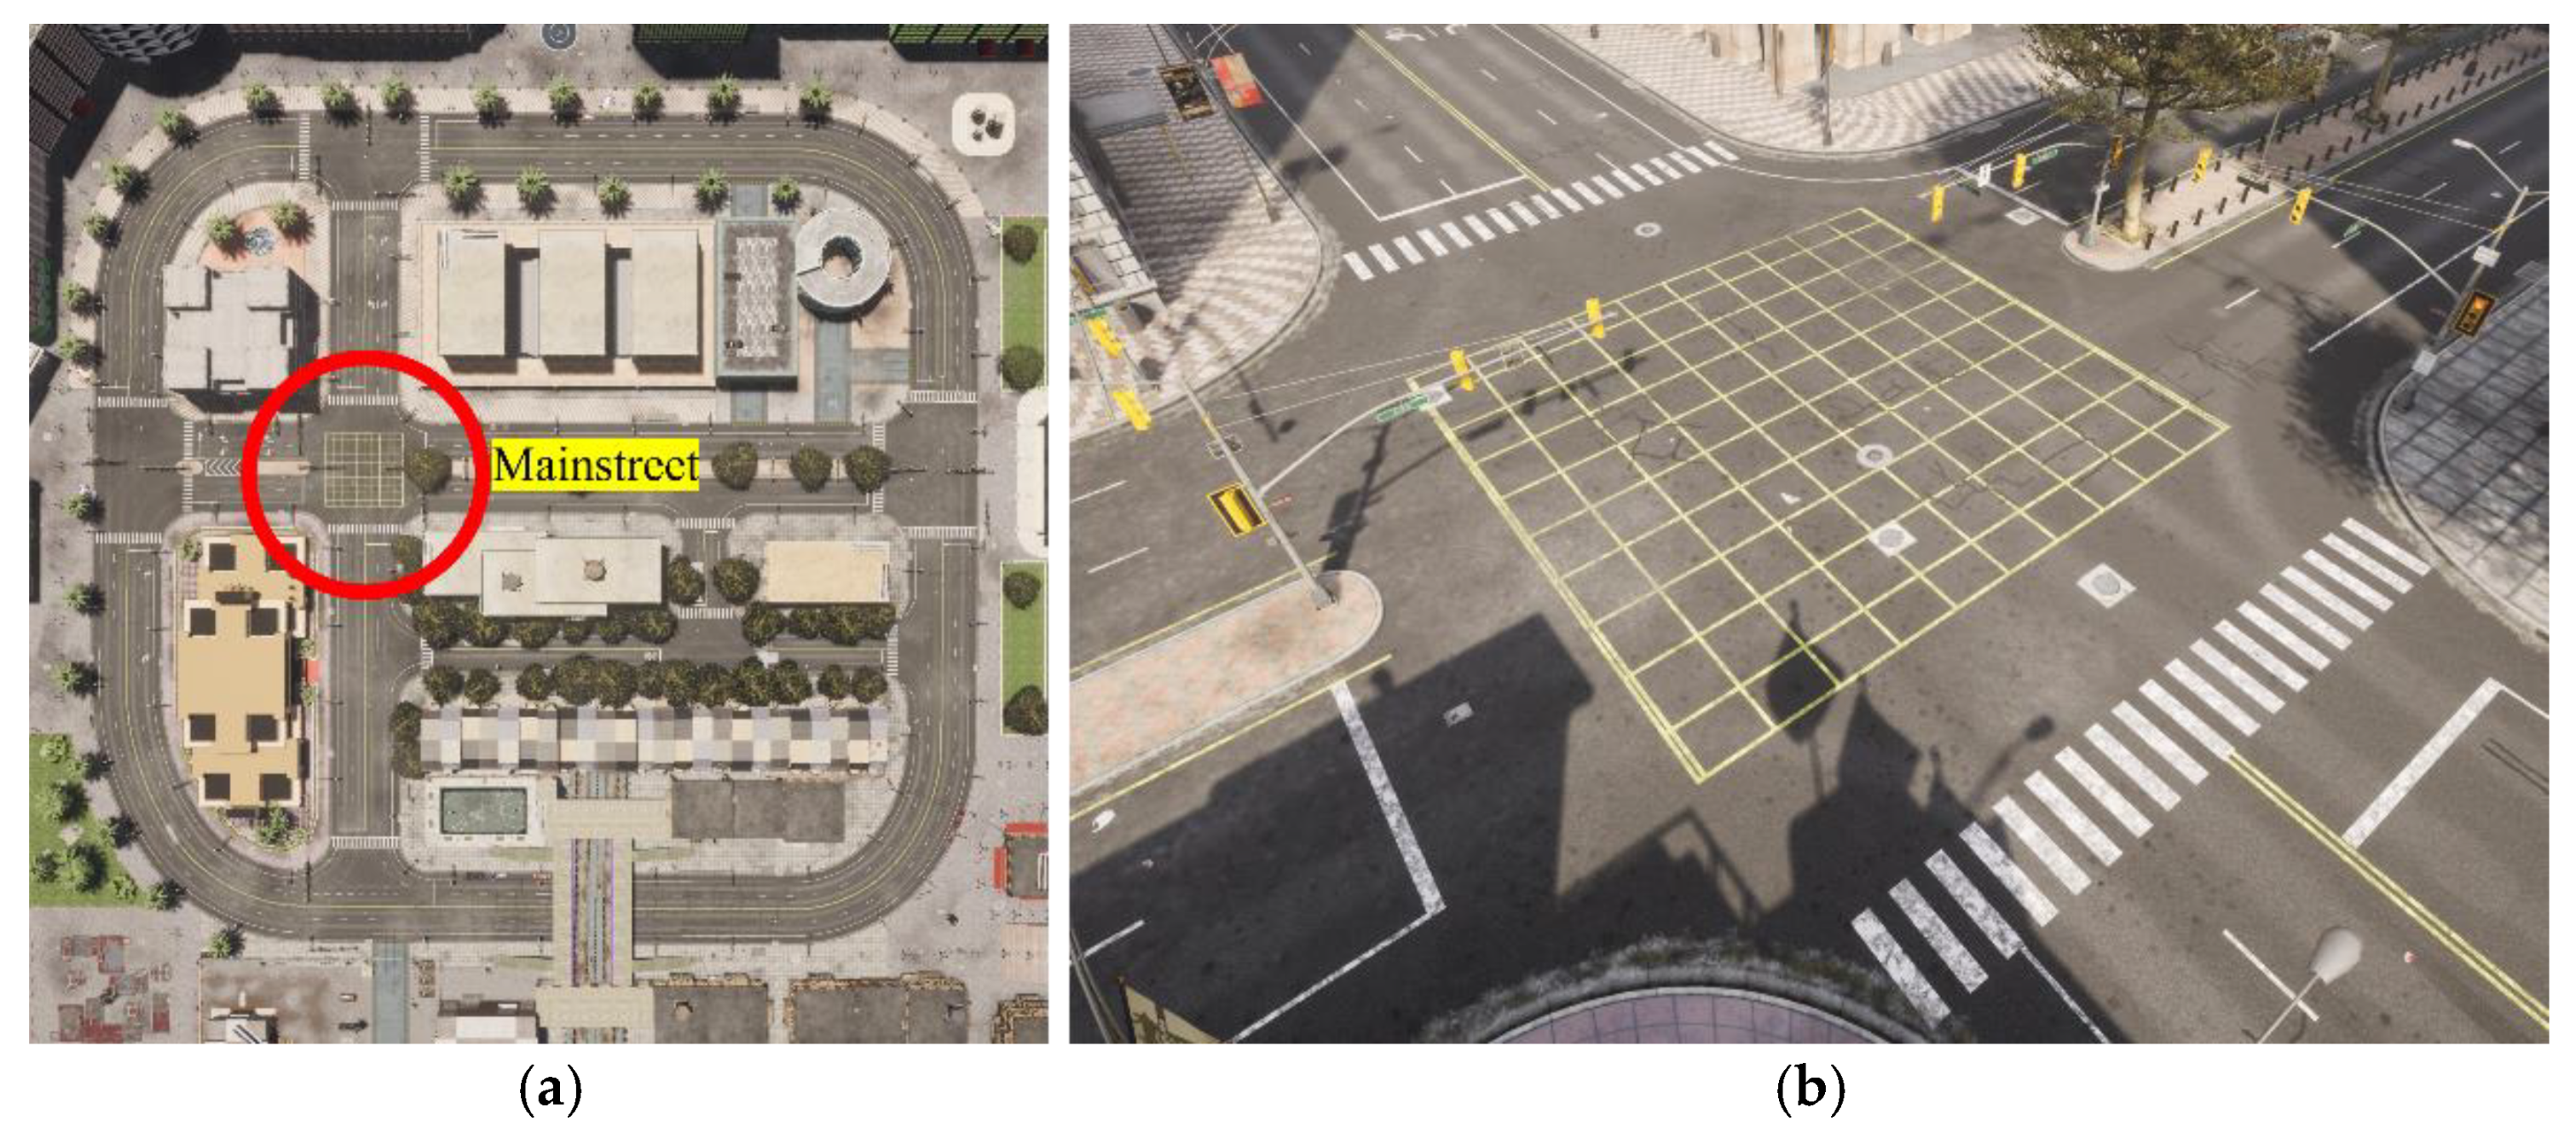
- Map
- ③
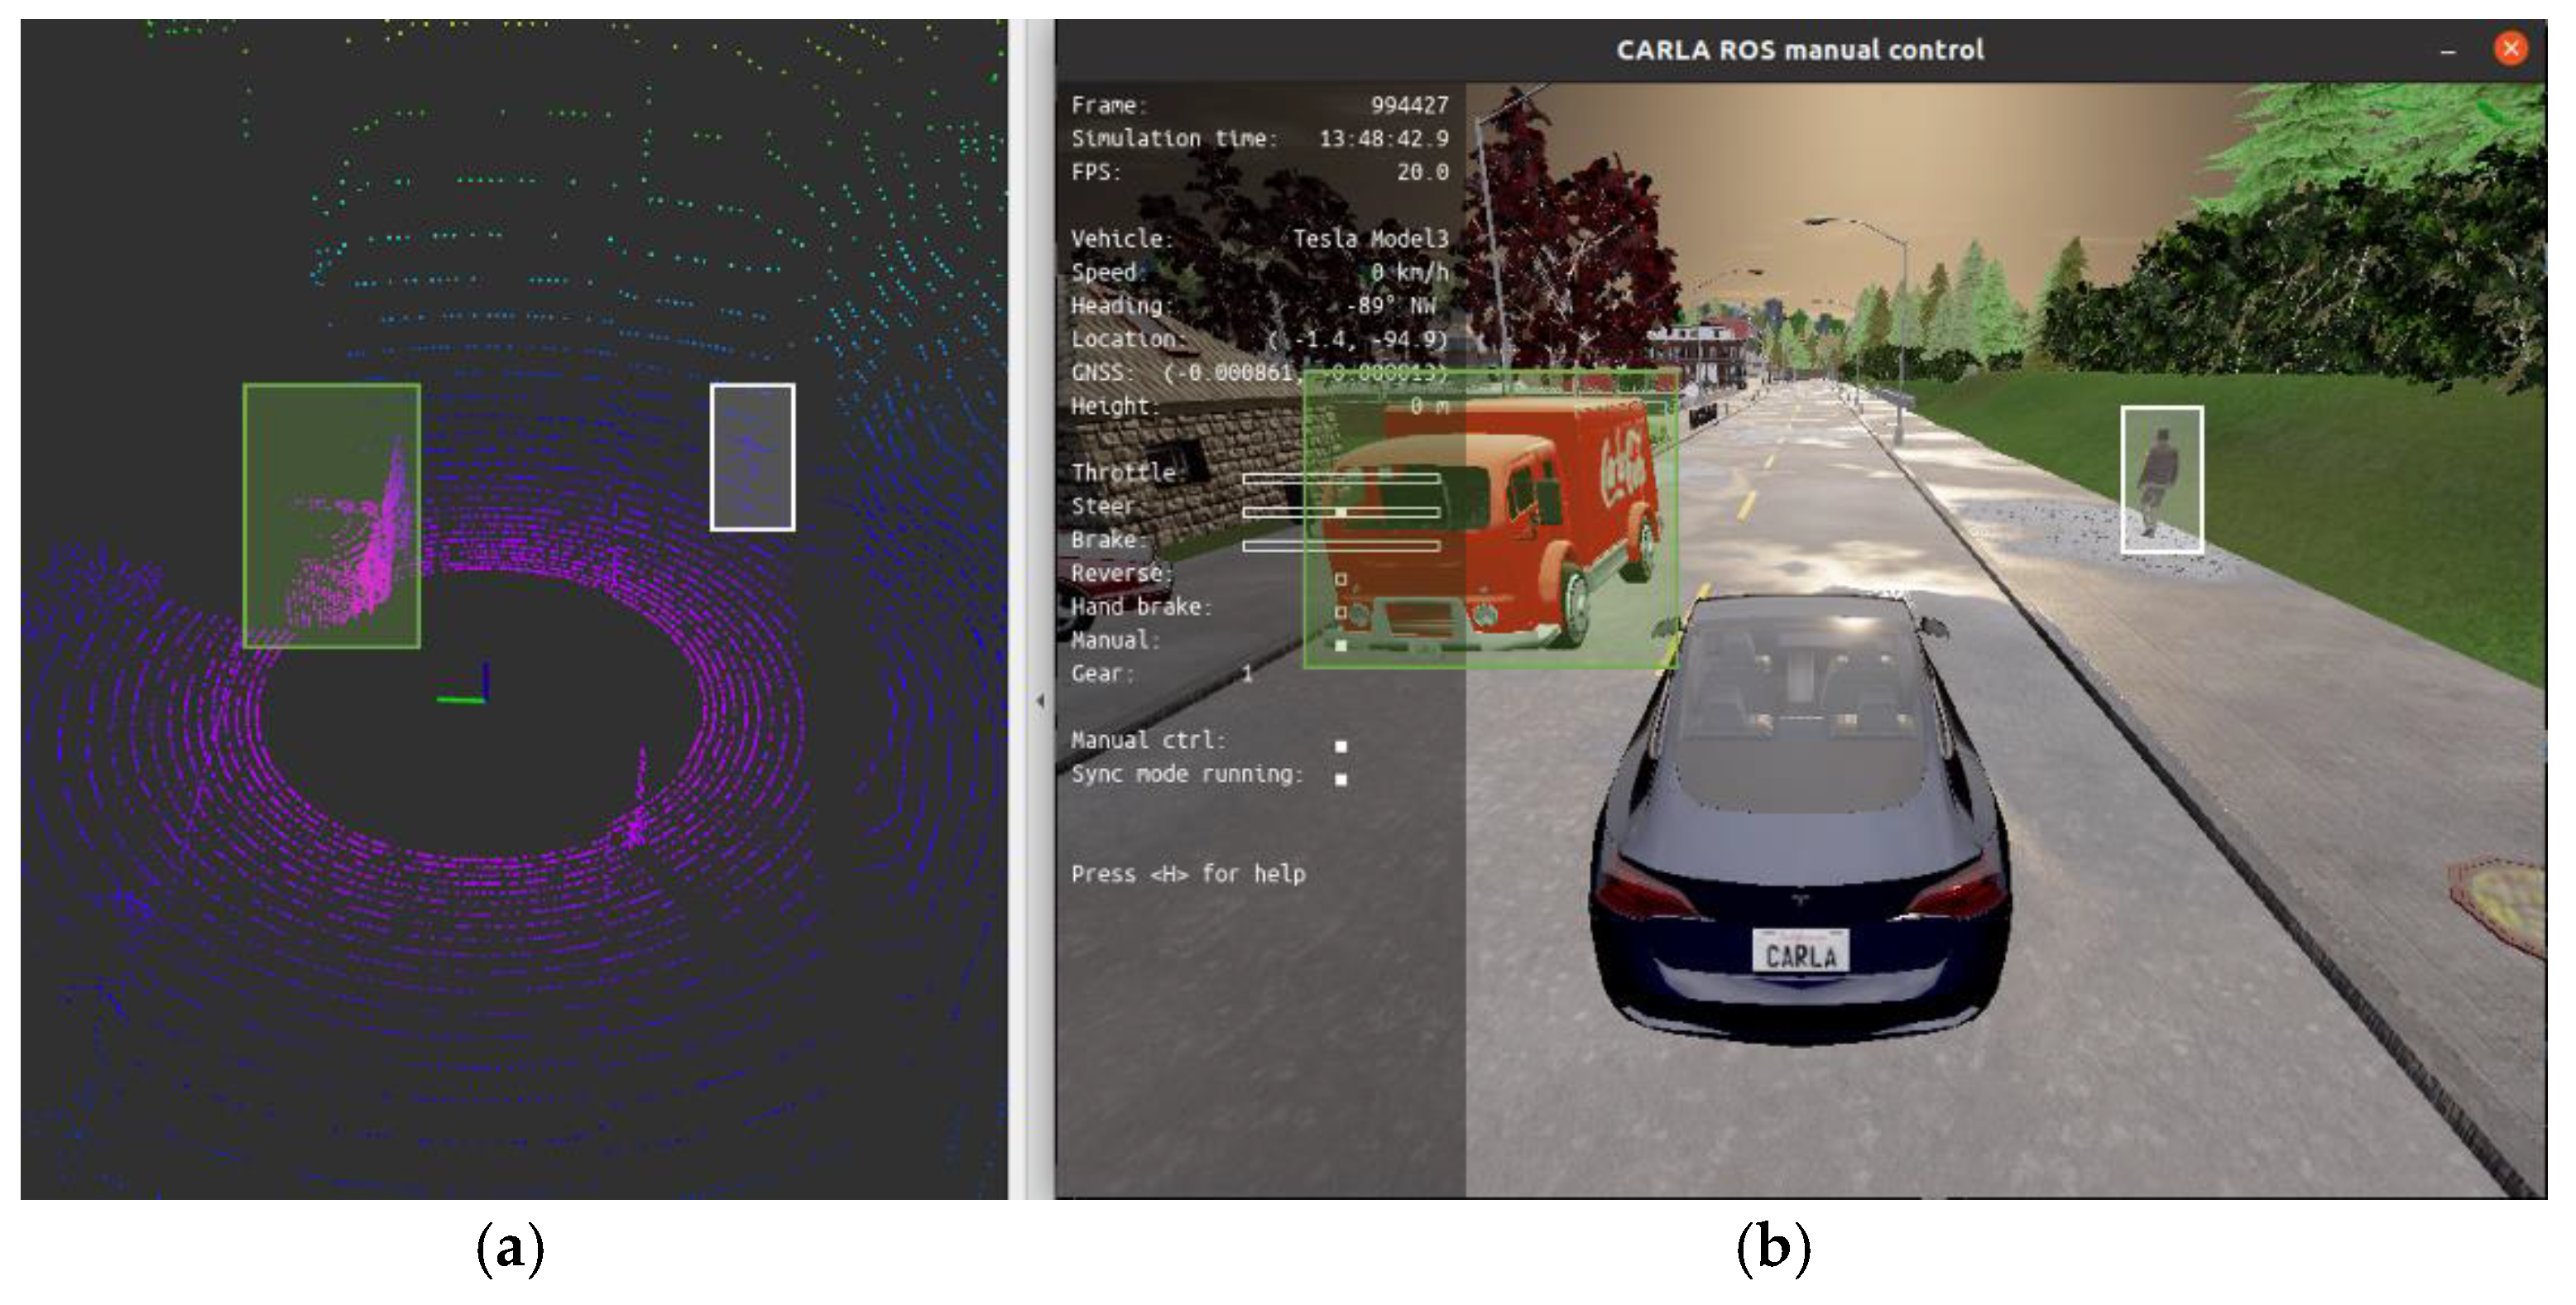
- Onboard Sensor
- ④
- Intersection Sensor
- ⑤
- Weather Condition
4. Experiment
4.1. Dataset
- ①
- Pedestrian Setting
- ②
- Scenario Configuration
- Data Time Synchronization
- ④
- Data Extraction
4.2. Training Details
4.3. Clustering Details
5. Experimental Result
5.1. Onboard Evaluation
5.1.1. Qualitative Evaluation
5.1.2. Quantitative Evaluation
5.2. Intersection Evaluation
5.2.1. Qualitative Evaluation
5.2.2. Quantitative Evaluation
6. Conclusion And Discussion
- ①
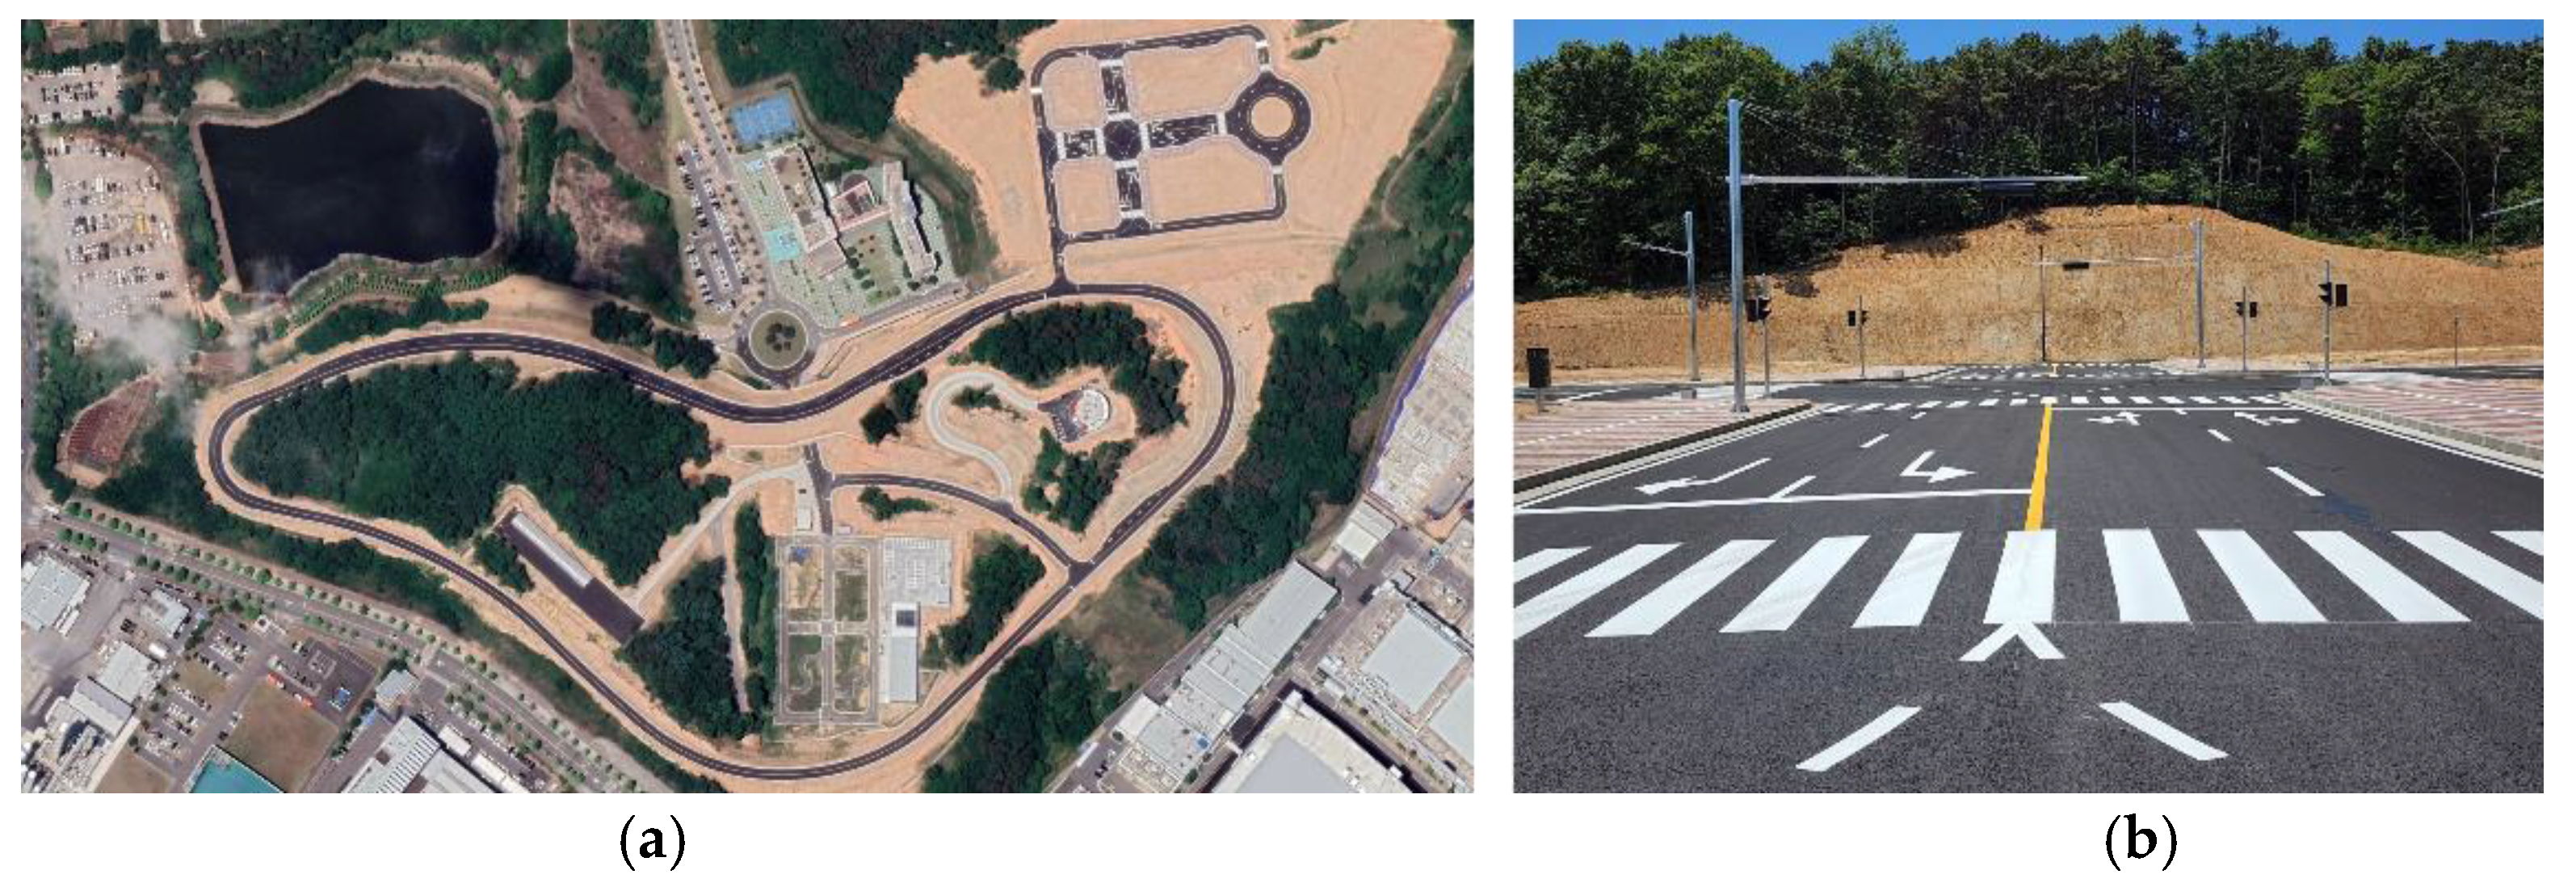
- Sensitivity to weather: The LiDAR sensor used in this experiment is considered to be less sensitive to noise in different weather conditions because it produces idealized data in virtual environment. However, in the real world, LiDAR sensors are very sensitive to extreme external environments, making data collection difficult [28]. Therefore, in future research, we will install LiDAR in an urban environment in a real testbed (Figure 25) and collect and analyze LiDAR data directly as the weather changes.
- ②
- Design of sensor-mounted equipment and wireless data transmission: For the system to work in the real world, a process is required to transmit pedestrian data from the sensors to the vehicle without loss. In this study, the data transmission was performed by replacing the ROS server, but in the real world, we plan to design a separate communicable hardware to further design the data transmission and reception process and verify the safety. In addition, the role of sensor-mounted equipment is very important in this system, and many studies have been conducted in this regard [29,30,31]. Based on this, we plan to implement this system by designing a device that satisfies the Korean road traffic law.
Author Contributions
Funding
Data Availability Statement
Acknowledgments
Conflicts of Interest
References
- Chen, L.; et al. Milestones in Autonomous Driving and Intelligent Vehicles: Survey of Surveys. IEEE Transactions on Intelligent Vehicles, 2023, 8, 1046–1056. [Google Scholar] [CrossRef]
- Hussain, R.; Zeadally, S. Autonomous Cars: Research Results, Issues, and Future Challenges. IEEE Communications Surveys & Tutorials, 2019, 21, 1275–1313. [Google Scholar]
- Parekh, D.; Poddar, N.; Rajpurkar, A.; Chahal, M.; Kumar, N.; Joshi, G.P.; Cho, W. A Review on Autonomous Vehicles: Progress, Methods and Challenges. Electronics 2022, 11, 2162. [Google Scholar] [CrossRef]
- Yeong, D.J.; Velasco-Hernandez, G.; Barry, J.; Walsh, J. Sensor and Sensor Fusion Technology in Autonomous Vehicles: A Review. Sensors 2021, 21, 2140. [Google Scholar] [CrossRef] [PubMed]
- Fayyad, J.; Jaradat, M.A.; Gruyer, D.; Najjaran, H. Deep Learning Sensor Fusion for Autonomous Vehicle Perception and Localization: A Review. Sensors 2020, 20, 4220. [Google Scholar] [CrossRef] [PubMed]
- Ahangar, M.N.; Ahmed, Q.Z.; Khan, F.A.; Hafeez, M. A Survey of Autonomous Vehicles: Enabling Communication Technologies and Challenges. Sensors 2021, 21, 706. [Google Scholar] [CrossRef] [PubMed]
- Zhu, Z.; Du, Q.; Wang, Z.; Li, G. A Survey of Multi-Agent Cross Domain Cooperative Perception. Electronics 2022, 11, 1091. [Google Scholar] [CrossRef]
- Shan, M.; Narula, K.; Wong, Y.F.; Worrall, S.; Khan, M.; Alexander, P.; Nebot, E. Demonstrations of Cooperative Perception: Safety and Robustness in Connected and Automated Vehicle Operations. Sensors 2021, 21, 200. [Google Scholar] [CrossRef] [PubMed]
- Ngo, H.; Fang, H.; Wang, H. Cooperative Perception With V2V Communication for Autonomous Vehicles. IEEE Transactions on Vehicular Technology, 2023, 72, 11122–11131. [Google Scholar] [CrossRef]
- Xiang, C.; et al. Multi-Sensor Fusion and Cooperative Perception for Autonomous Driving: A Review. IEEE Intelligent Transportation Systems Magazine, 2023, 15, 36–58. [Google Scholar] [CrossRef]
- Q, Chen; S, Tang; Q, Yang; Fu, S. Cooper: Cooperative Perception for Connected Autonomous Vehicles Based on 3D Point Clouds. 2019 IEEE 39th International Conference on Distributed Computing Systems (ICDCS), Dallas, TX, USA, 2019.
- Qi, Chen; et al. F-cooper: feature based cooperative perception for autonomous vehicle edge computing system using 3D point clouds. Proceedings of the 4th ACM/IEEE Symposium on Edge Computing. Association for Computing Machinery, New York, NY, USA, 2019.
- Sun, P.; Sun, C.; Wang, R.; Zhao, X. Object Detection Based on Roadside LiDAR for Cooperative Driving Automation: A Review. Sensors 2022, 22, 9316. [Google Scholar] [CrossRef] [PubMed]
- Bai, Z.; Wu, G.; Qi, X.; Liu, Y.; Oguchi, K.; Barth, M.J. Infrastructure-Based Object Detection and Tracking for Cooperative Driving Automation: A Survey. 2022 IEEE Intelligent Vehicles Symposium (IV), Aachen, Germany, 2022.
- Lee, S. A Study on the Structuralization of Right Turn for Autonomous Driving System. Journal of Korean Public Police and Security Studies, 2022, 19, 173–190. [Google Scholar]
- Park, S.; Kee, S.-C. Right-Turn Pedestrian Collision Avoidance System Using Intersection LiDAR. EVS37 Symposium, COEX, Seoul, Korea, April 23-26, 2024.
- Martin,S. et al. Complex-yolo: An euler-region-proposal for real-time 3d object detection on point clouds. Proceedings of the European conference on computer vision (ECCV) workshops, Munich, Germany, 2018.
- Shaoshuai, S.; et al. Pv-rcnn: Point-voxel feature set abstraction for 3d object detection. Proceedings of the IEEE/CVF conference on computer vision and pattern recognition, Seattle, Washington, USA, 2020.
- CARLA official site. Available online: https://CARLA.org/ (accessed on 2017).
- Alexey, D.; et al. CARLA: An open urban driving simulator. Proceedings of Machine Learning Research, Mountain View, California, USA, November 13-15, 2017.
- Gómez-Huélamo, C.; Del Egido, J.; Bergasa, L.M.; et al. Train here, drive there: ROS based end-to-end autonomous-driving pipeline validation in CARLA simulator using the NHTSA typology. Multimed Tools Appl, 2022, 81, 4213–4240. [Google Scholar] [CrossRef]
- Rosende, S.B.; Gavilán, D.S.J.; Fernández-Andrés, J.; Sánchez-Soriano, J. An Urban Traffic Dataset Composed of Visible Images and Their Semantic Segmentation Generated by the CARLA Simulator. Data 2024, 9, 4. [Google Scholar] [CrossRef]
- Lee, H.-G.; Kang, D.-H.; Kim, D.-H. Human–Machine Interaction in Driving Assistant Systems for Semi-Autonomous Driving Vehicles. Electronics 2021, 10, 2405. [Google Scholar] [CrossRef]
- ROS(Robot operating system) official site. Available online: https://www.ros.org/ (accessed on 2007).
- Rosique, F.; Navarro, P.J.; Fernández, C.; Padilla, A. A Systematic Review of Perception System and Simulators for Autonomous Vehicles Research. Sensors 2019, 19, 648. [Google Scholar] [CrossRef] [PubMed]
- CARLA blueprint document site. Available online: https://CARLA.readthedocs.io/en/latest/bp_library/ (accessed on 2017).
- CARLA-ROS bridge package official site. Available online: https://github.com/CARLA-simulator/ros-bridge (accessed on 2018).
- Vargas, J.; Alsweiss, S.; Toker, O.; Razdan, R.; Santos, J. An Overview of Autonomous Vehicles Sensors and Their Vulnerability to Weather Conditions. Sensors 2021, 21, 5397. [Google Scholar] [CrossRef] [PubMed]
- Torres, P.; Marques, H.; Marques, P. Pedestrian Detection with LiDAR Technology in Smart-City Deployments–Challenges and Recommendations. Computers 2023, 12, 65. [Google Scholar] [CrossRef]
- B. Lv et al. LiDAR-Enhanced Connected Infrastructures Sensing and Broadcasting High-Resolution Traffic Information Serving Smart Cities. IEEE Access 2019, 7, 79895–79907.
- Yaqoob, I.; Khan, L.U.; Kazmi, S.M.A.; Imran, M.; Guizani, N.; Hong, C.S. Autonomous Driving Cars in Smart Cities: Recent Advances, Requirements, and Challenges. IEEE Network 2019, 34, 174–181. [Google Scholar] [CrossRef]









| Sensor List | Type | ID |
|---|---|---|
| Camera | sensor.camera.rgb | rgb_view |
| LiDAR | sensor.LiDAR.ray_cast | LiDAR |
| GNSS | sensor.other.gnss | gnss |
| Objects | sensor.pseudo.objects | objects |
| Odom | sensor.pseudo.tf | tf |
| Tf | sensor.pseudo.odom | odometry |
| Speedometer | sensor.pseudo.speedometer | speedometer |
| Control | sensor.pseudo.control | control |
| Sensor List | Type | ID |
|---|---|---|
| Camera | sensor.camera.rgb | rgb_view |
| LiDAR | sensor.LiDAR.ray_cast | LiDAR |
| GNSS | sensor.other.gnss | gnss |
| Objects | sensor.pseudo.objects | objects |
| Tf | sensor.pseudo.odom | odometry |
| LiDAR Channel |
Range(m) | Points per second | Upper FoV(deg) | Lower FoV(deg) | Rotation frequency(hz) |
|---|---|---|---|---|---|
| 64 | 80 | 2,621,440 | 22.5 | -22.5 | 100 |
| 128 | 80 | 5,242,880 | 22.5 | -22.5 | 100 |
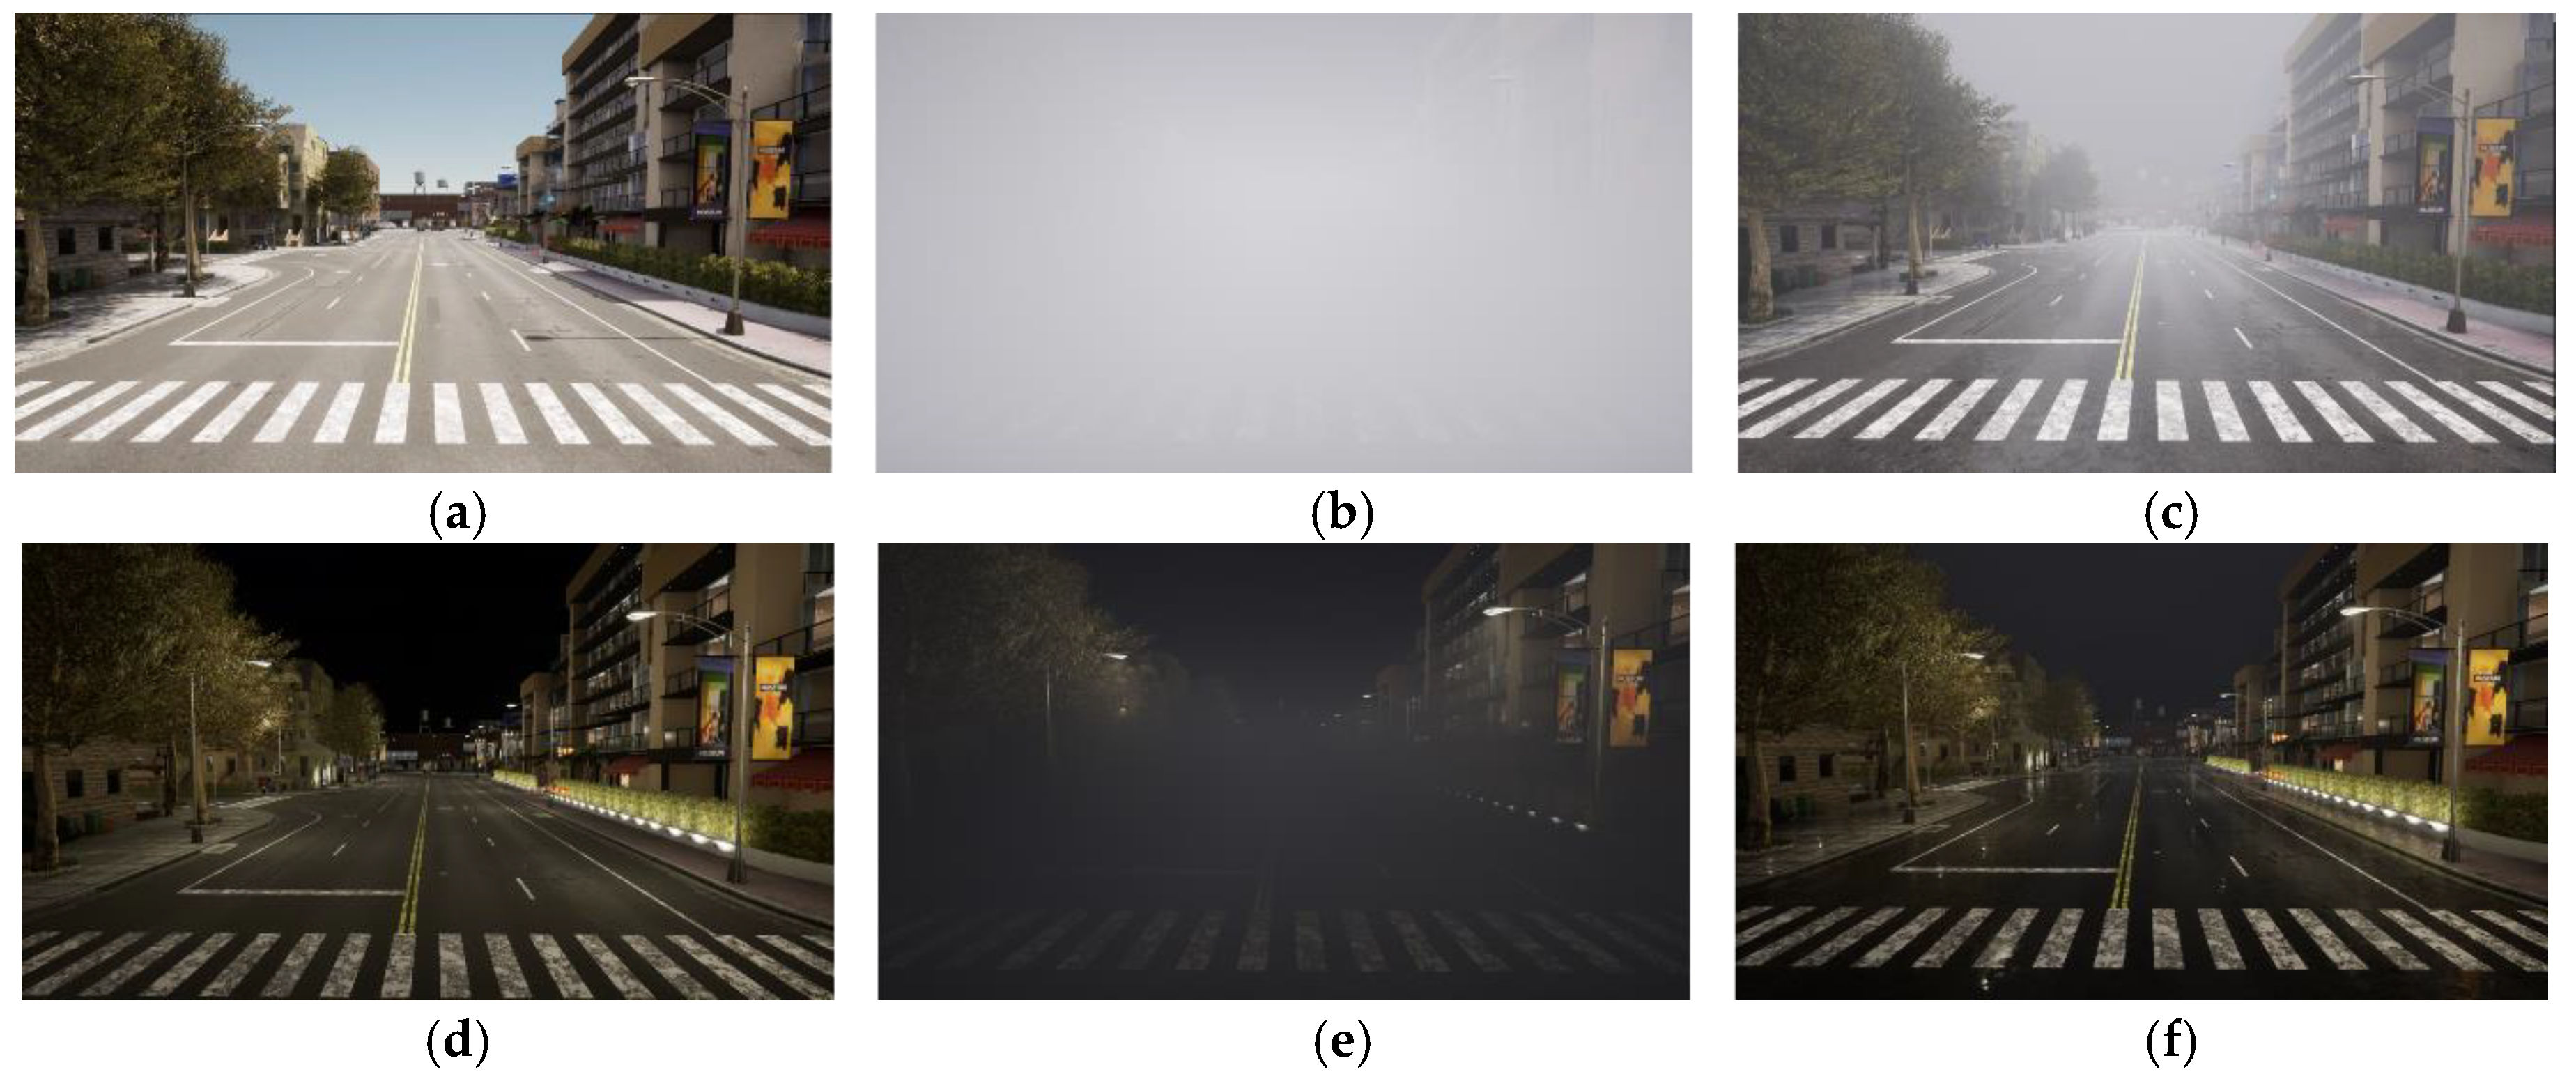
| Cloudiness | Sun altitude angle |
Precipitation | Fog density | Fog fallout | Precipitation deposits |
|
|---|---|---|---|---|---|---|
| Sunny day | 0.0 | 70.0 | 0.0 | - | - | - |
| Clear night | 0.0 | -70.0 | 0.0 | - | - | - |
| Fog day | 60.0 | 70.0 | 0.0 | 35.0 | 7.0 | - |
| Fog night | 60.0 | -70.0 | 0.0 | 25.0 | 7.0 | - |
| Rain day | 85.0 | 70.0 | 80.0 | 10.0 | - | 100.0 |
| Rain night | 85.0 | -70.0 | 80.0 | 10.0 | - | 100.0 |
| Type | blueprint ID |
|---|---|
| Normal Adult | 0001/0005/0006/0007/0008/0004/0003/0002/0015 0019/0016/0017/0026/0018/0021/0020/0023/0022 0024/0025/0027/0029/0028/0041/0040/0033/0031 |
| Overweight Adult | 0034/0038/0035/0036/0037/0039/0042/0043/0044 0047/0046 |
| Children | 0009/0010/0011/0012/0013/0014/0048/0049 |
| Weather | Type of pedestrians | Direction of pedestrian | Speed of pedestrian | Vehicle speed | |
|---|---|---|---|---|---|
| #1 | Sunny day | Adult : 2 (normal) | Ped1: 0°/Ped2: 180° | Ped1: 1.0(m/s)/Ped2: 1.5(m/s) | 15-25(km/h) |
| #2 | Sunny day | Adult : 2 (normal, overweight) | Ped1: 0°/Ped2: 180° | Ped1: 1.0(m/s)/Ped2: 1.5(m/s) | 15-25(km/h) |
| #3 | Sunny day | Adult : 1, Children :1 | Ped1: 0°/Ped2: 180° | Ped1: 1.0(m/s)/Ped2: 1.5(m/s) | 15-25(km/h) |
| #4 | Clear night | Adult : 2 (normal) | Ped1: 0°/Ped2: 180° | Ped1: 1.0(m/s)/Ped2: 1.5(m/s) | 15-25(km/h) |
| #5 | Clear night | Adult : 2 (normal, overweight) | Ped1: 0°/Ped2: 180° | Ped1: 1.0(m/s)/Ped2: 1.5(m/s) | 15-25(km/h) |
| #6 | Clear night | Adult : 1, Children :1 | Ped1: 0°/Ped2: 180° | Ped1: 1.0(m/s)/Ped2: 1.5(m/s) | 15-25(km/h) |
| #7 | Fog day | Adult : 2 (normal) | Ped1: 0°/Ped2: 180° | Ped1: 1.0(m/s)/Ped2: 1.5(m/s) | 15-25(km/h) |
| #8 | Fog day | Adult : 2 (normal, overweight) | Ped1: 0°/Ped2: 180° | Ped1: 1.0(m/s)/Ped2: 1.5(m/s) | 15-25(km/h) |
| #9 | Fog day | Adult : 1, Children :1 | Ped1: 0°/Ped2: 180° | Ped1: 1.0(m/s)/Ped2: 1.5(m/s) | 15-25(km/h) |
| #10 | Fog night | Adult : 2 (normal) | Ped1: 0°/Ped2: 180° | Ped1: 1.0(m/s)/Ped2: 1.5(m/s) | 15-25(km/h) |
| #11 | Fog night | Adult : 2 (normal, overweight) | Ped1: 0°/Ped2: 180° | Ped1: 1.0(m/s)/Ped2: 1.5(m/s) | 15-25(km/h) |
| #12 | Fog night | Adult : 1, Children :1 | Ped1: 0°/Ped2: 180° | Ped1: 1.0(m/s)/Ped2: 1.5(m/s) | 15-25(km/h) |
| #13 | Rain day | Adult : 2 (normal) | Ped1: 0°/Ped2: 180° | Ped1: 1.0(m/s)/Ped2: 1.5(m/s) | 15-25(km/h) |
| #14 | Rain day | Adult : 2 (normal, overweight) | Ped1: 0°/Ped2: 180° | Ped1: 1.0(m/s)/Ped2: 1.5(m/s) | 15-25(km/h) |
| #15 | Rain day | Adult : 1, Children :1 | Ped1: 0°/Ped2: 180° | Ped1: 1.0(m/s)/Ped2: 1.5(m/s) | 15-25(km/h) |
| #16 | Rain night | Adult : 2 (normal) | Ped1: 0°/Ped2: 180° | Ped1: 1.0(m/s)/Ped2: 1.5(m/s) | 15-25(km/h) |
| #17 | Rain night | Adult : 2 (normal, overweight) | Ped1: 0°/Ped2: 180° | Ped1: 1.0(m/s)/Ped2: 1.5(m/s) | 15-25(km/h) |
| #18 | Rain night | Adult : 1, Children :1 | Ped1: 0°/Ped2: 180° | Ped1: 1.0(m/s)/Ped2: 1.5(m/s) | 15-25(km/h) |
| Sunny day | Clear night | Fog day | Fog night | Rain day | Rain night | Total | |
|---|---|---|---|---|---|---|---|
| Onboard | 5,299 | 4,066 | 5,143 | 4,876 | 5,420 | 5,555 | 30,359 |
| Intersection | 5,299 | 4,066 | 5,143 | 4,876 | 5,420 | 5,555 | 30,359 |
| 60,718 |
| Class list | Anchors | Filtering[m] | Feature type | Feature size | |
|---|---|---|---|---|---|
| Complex-YOLO [Intersection] |
Pedestrian | [1.08, 1.19] | Min/Max x : 0, 40 Min/Max y : 0, 40 Min/Max z : -4.5, 0 |
BEV | [512,1024,3] |
| PV-RCNN [Onboard] |
Pedestrian | [0.96, 0.88, 2.13] | Min/Max x : 75.2 Min/Max y : 75.2 Min/Max z : 4.0 |
Voxel | [0.1,0.1,0.15] |
| Attributes of cases | |
|---|---|
| Case 1(#1) | Normal adult: 2 |
| Case 2(#2) | Normal adult: 1 , Overweight adult: 1 |
| Case 3(#3) | Normal adult: 1, Children: 1 |
| Weather Type | Num. | Total |
|---|---|---|
| Sunny Day | #1: 609 / #2: 499 / #3: 483 | 1,591 |
| Clear Night | #1: 390 / #2: 389 / #3: 442 | 1,221 |
| Fog Day | #1: 494 / #2: 519 / #3: 531 | 1,544 |
| Fog Night | #1: 456 / #2: 437 / #3: 571 | 1,464 |
| Rain Day | #1: 566 / #2: 555 / #3: 507 | 1,628 |
| Rain Night | #1: 561 / #2: 585 / #3: 523 | 1,669 |
| Total | 9,117 |
| Sunny Day | Clear Night | Fog Day | Fog Night | Rain Day | Rain Night | |||||||||||||
|---|---|---|---|---|---|---|---|---|---|---|---|---|---|---|---|---|---|---|
| #1 | #2 | #3 | #1 | #2 | #3 | #1 | #2 | #3 | #1 | #2 | #3 | #1 | #2 | #3 | #1 | #2 | #3 | |
| PV-RCNN | 0.53 | 0.60 | 0.53 | 0.52 | 0.44 | 0.35 | 0.36 | 0.43 | 0.39 | 0.51 | 0.51 | 0.45 | 0.46 | 0.61 | 0.37 | 0.43 | 0.52 | 0.34 |
| Sunny Day | Clear Night | Fog Day | Fog Night | Rain Day | Rain Night | |||||||||||||
|---|---|---|---|---|---|---|---|---|---|---|---|---|---|---|---|---|---|---|
| #1 | #2 | #3 | #1 | #2 | #3 | #1 | #2 | #3 | #1 | #2 | #3 | #1 | #2 | #3 | #1 | #2 | #3 | |
| ComplexYOLO | 0.81 | 0.68 | 0.90 | 0.88 | 0.86 | 0.86 | 0.85 | 0.92 | 0.90 | 0.80 | 0.83 | 0.70 | 0.66 | 0.79 | 0.92 | 0.72 | 0.71 | 0.81 |
| Ours | 0.98 | 0.91 | 0.88 | 0.98 | 0.95 | 0.94 | 0.93 | 0.98 | 0.97 | 0.97 | 0.98 | 0.94 | 0.93 | 0.94 | 0.96 | 0.97 | 0.95 | 0.91 |
| Sunny Day | Clear Night | Fog Day | Fog Night | Rain Day | Rain Night | |||||||||||||
|---|---|---|---|---|---|---|---|---|---|---|---|---|---|---|---|---|---|---|
| #1 | #2 | #3 | #1 | #2 | #3 | #1 | #2 | #3 | #1 | #2 | #3 | #1 | #2 | #3 | #1 | #2 | #3 | |
| ComplexYOLO | 0.73 | 0.85 | 0.81 | 0.90 | 0.78 | 0.83 | 0.78 | 0.82 | 0.80 | 0.88 | 0.79 | 0.66 | 0.86 | 0.54 | 0.66 | 0.76 | 0.86 | 0.56 |
| Ours | 0.96 | 0.98 | 0.98 | 0.93 | 0.85 | 0.94 | 0.98 | 0.99 | 0.88 | 0.98 | 0.98 | 0.75 | 0.98 | 0.97 | 0.88 | 0.98 | 0.95 | 0.98 |
Disclaimer/Publisher’s Note: The statements, opinions and data contained in all publications are solely those of the individual author(s) and contributor(s) and not of MDPI and/or the editor(s). MDPI and/or the editor(s) disclaim responsibility for any injury to people or property resulting from any ideas, methods, instructions or products referred to in the content. |
© 2024 by the authors. Licensee MDPI, Basel, Switzerland. This article is an open access article distributed under the terms and conditions of the Creative Commons Attribution (CC BY) license (https://creativecommons.org/licenses/by/4.0/).


