1. Introduction
Foundation systems using piles are widely employed in civil engineering applications where substantial and variable loads act on the piles [
1,
2]. These systems are typically designed to exhibit an elastic response to various types of loads [
3]. In the specific case of pile foundations used in photovoltaic solar panels, they are characterized by partial embedment in the soil, with thin-walled, open-ended steel piles commonly used [
4,
5]. The non-embedded portion of the pile must be capable of withstanding significant repetitive loads, primarily wind-induced loads that variably impact the lateral surface of the photovoltaic panels [
2].
The proper selection of the soil constitutive model and the calibration of its parameters are fundamental aspects of any analysis, whether analytical or numerical. These decisions are invariably based on material characterization through in-situ tests or laboratory tests conducted on representative soil samples, whether undisturbed or reconstituted [
5,
6].
Various strategies have been proposed for modeling the mechanical behavior of the pile-soil system. The Elastic-Beam-on-Winkler-Foundation approach [
7] is considered the most basic, providing resistance directly proportional to the pile displacement. Several researchers [
8,
9] have employed the concept of an elastic beam on a nonlinear foundation, where the beam is assumed to remain elastic throughout the analysis, while the foundation’s load-displacement relationship follows a nonlinear equation. In this formulation, empirical p-y curves [
10,
11] with variable spring stiffness values are used to describe the load-deflection relationships. This allows for evaluating a non-proportional connection between lateral displacement and soil resistance per unit length of the pile. In engineering practice, this approach is frequently used to examine the response of a pile under load. Obtaining accurate p-y curves for a specific location constitutes the main challenge in the practical implementation of this methodology.
Numerous studies have addressed the impact of fatigue induced by lateral cyclic loads on pile foundations, caused by factors such as wind [
12], tides, or water waves [
13], particularly in advanced civil engineering structures [
1,
6,
14,
15]. Basack et al. [
16] analyzed the degradation of piles with increasing cycle numbers, proposing a 2D finite element model. Other studies have investigated lateral loads on end-bearing piles [
17,
18,
19] and thin-walled piles under static, non-repetitive loads [
20]. Nevertheless, specific research on the behavior of thin-walled, open-ended pile foundations under cyclic lateral loads has been limited. He et al. [
21] examined the effects of dynamic vertical interaction on thin-walled tubular piles in marine environments. The varying dimensions and properties of open thin-walled piles result in distinct mechanical behavior, highlighting the need for a specialized calculation methodology for this type of foundation. Additionally, various studies have noted potential soil deterioration due to cyclic loads, relying, among other findings, on the results obtained by Broms and Davisson in their investigations on long concrete piles [
22,
23,
24].
This study emerges from the need to determine whether the piles supporting typical solar panels can maintain their structural integrity and ensure proper operation over the 20-30 year lifespan guaranteed for photovoltaic solar plants. Consequently, the question arises as to whether, for these solar panel supports —exposed to a high number of load cycles due to wind actions over the plant’s lifespan—soil deterioration or fatigue could occur, as indicated by some studies on large-diameter and long concrete piles.
In this research, the effects of repeated lateral loads due to wind on standardized thin-walled steel piles, which generate easily measurable lateral deflections with instrumentation, are analyzed and discussed. For this purpose, an experimental study is conducted with a primary focus on the simple bending of profiles with low susceptibility to torsion [
23], aiming to measure any potential loss in soil stiffness capacity. The study is structured in the following phases:
(i) Experimental soil characterization: The soil is characterized through Dynamic Probing Super Heavy (DPSH) penetration tests, geotechnical test pits, geotechnical characterization tests, and lateral load tests to failure. This process defines a region of similar behavior where the test field is established.
(ii) Field experimentation: Lateral load tests with N load-unload cycles in one direction are conducted to simulate the effects of wind on photovoltaic panel structures. Instrumentation is used to measure lateral loads and deflections. Subsequently, tensile tests were performed by applying a progressive load until soil failure occurs. Standardized design procedures, such as API design standards [
25] or recommendations contained in Fascicle 62 in France [
26], are considered in conducting these tests.
(iii) Analysis of field results: The influence of load cycles on measured deflection and soil stiffness deterioration is examined using a retrospective study by solving the elastic equation with the measured deflections and applied loads. Moreover, the effects of repeated load tests on the tensile capacity of the piles and the resulting permanent deformation are evaluated.
2. Materials and Methods
2.1. Steel Pile Description and Properties
To conduct the experiment, we selected bi-symmetrical metal profiles with parallel wings from the American series. Specifically, W6×15 piles, as per ASTM A6/A 6M [
27], were chosen. These profiles were manufactured from S355 steel. The choice of this profile was based on its remarkable torsional constant, which surpasses that of other available profiles (see
Table 1). Furthermore, its center of gravity aligns with both its shear and torsional centers, which is particularly advantageous. This alignment effectively minimizes the potential impact of torsion caused by small eccentricities resulting from load application during the experimental test [
20].
2.2. Experimental Soil Characterization
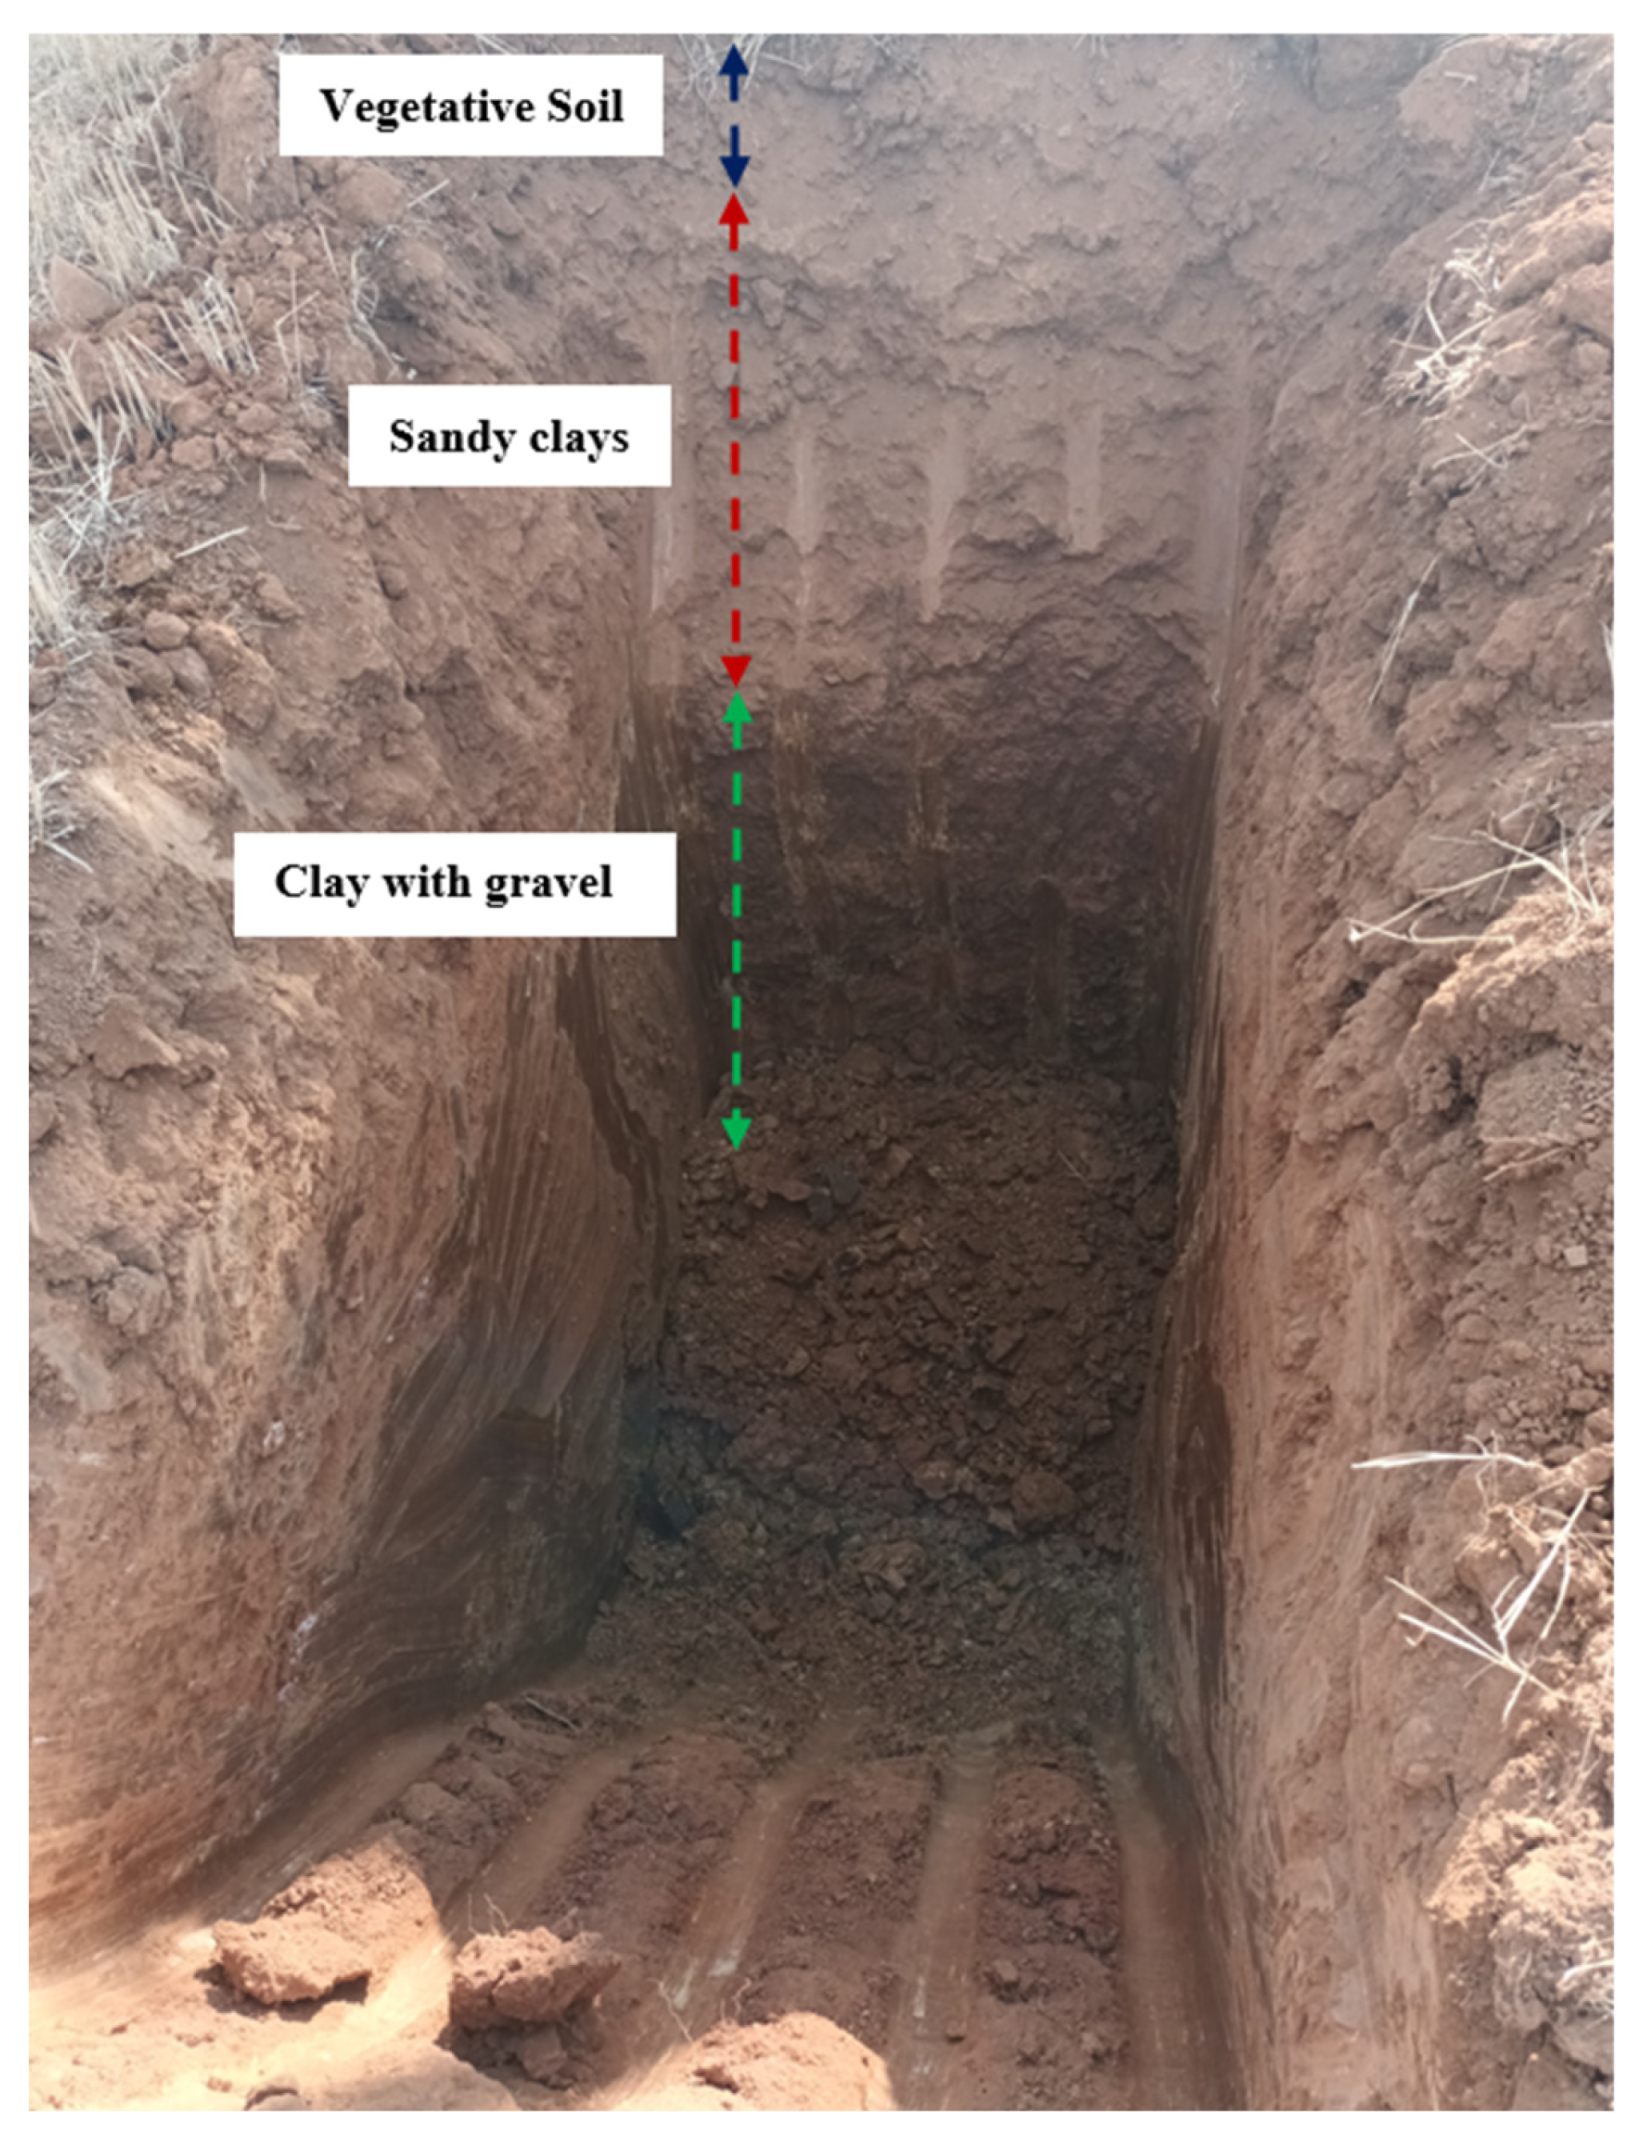
To perform a detailed characterization of the soil, a surface area of approximately 20×20 meters was demarcated within a plot located in the Los Caños Industrial Park in Zafra, Extremadura, Spain. Within this designated area, geotechnical test pits (see
Figure 1), two DPSH tests [
28], and a series of laboratory tests were conducted to achieve a comprehensive characterization of the soil.
Among these tests, the granulometric analysis was performed in accordance with the EN 17892-4:2019 [
29] standard, providing valuable information about the particle size distribution in the soil. Additionally, measurements of the Atterberg Limits were conducted according to the UNE-EN ISO 17892-4:2019 [
29] standard to assess the soil’s plastic properties, offering a deeper understanding of its behavior under various conditions.
The direct shear strength of the soil was assessed following the EN 13277-2:2011 standard [
30]. These tests provide crucial data on the soil’s capacity to withstand loads without lateral confinement, which is essential for understanding soil stability in different scenarios.
The following geotechnical strata have been identified, as shown in
Figure 1:
Level 1: Vegetative Soil. Clayey sands with a thickness ranging from 0.10 to 0.20 meters in the test zone (see
Table 2).
Level 2: Sandy clays. With a thickness between 0.80 and 0.90 meters in the test zone (
Table 2). Direct shear tests (UD) yielded cohesion values between 0.44 and 0.75 kPa, and an internal friction angle of 23.4
o to 24.7
o.
Level 3: Clay with gravel. Extending from Level 2 to the end of the boreholes, at depths greater than 3 meters (
Table 3). Direct shear tests (UD) indicated cohesion values between 0.41 and 0.44 kPa, and an internal friction angle of 23.7
o to 27
o.
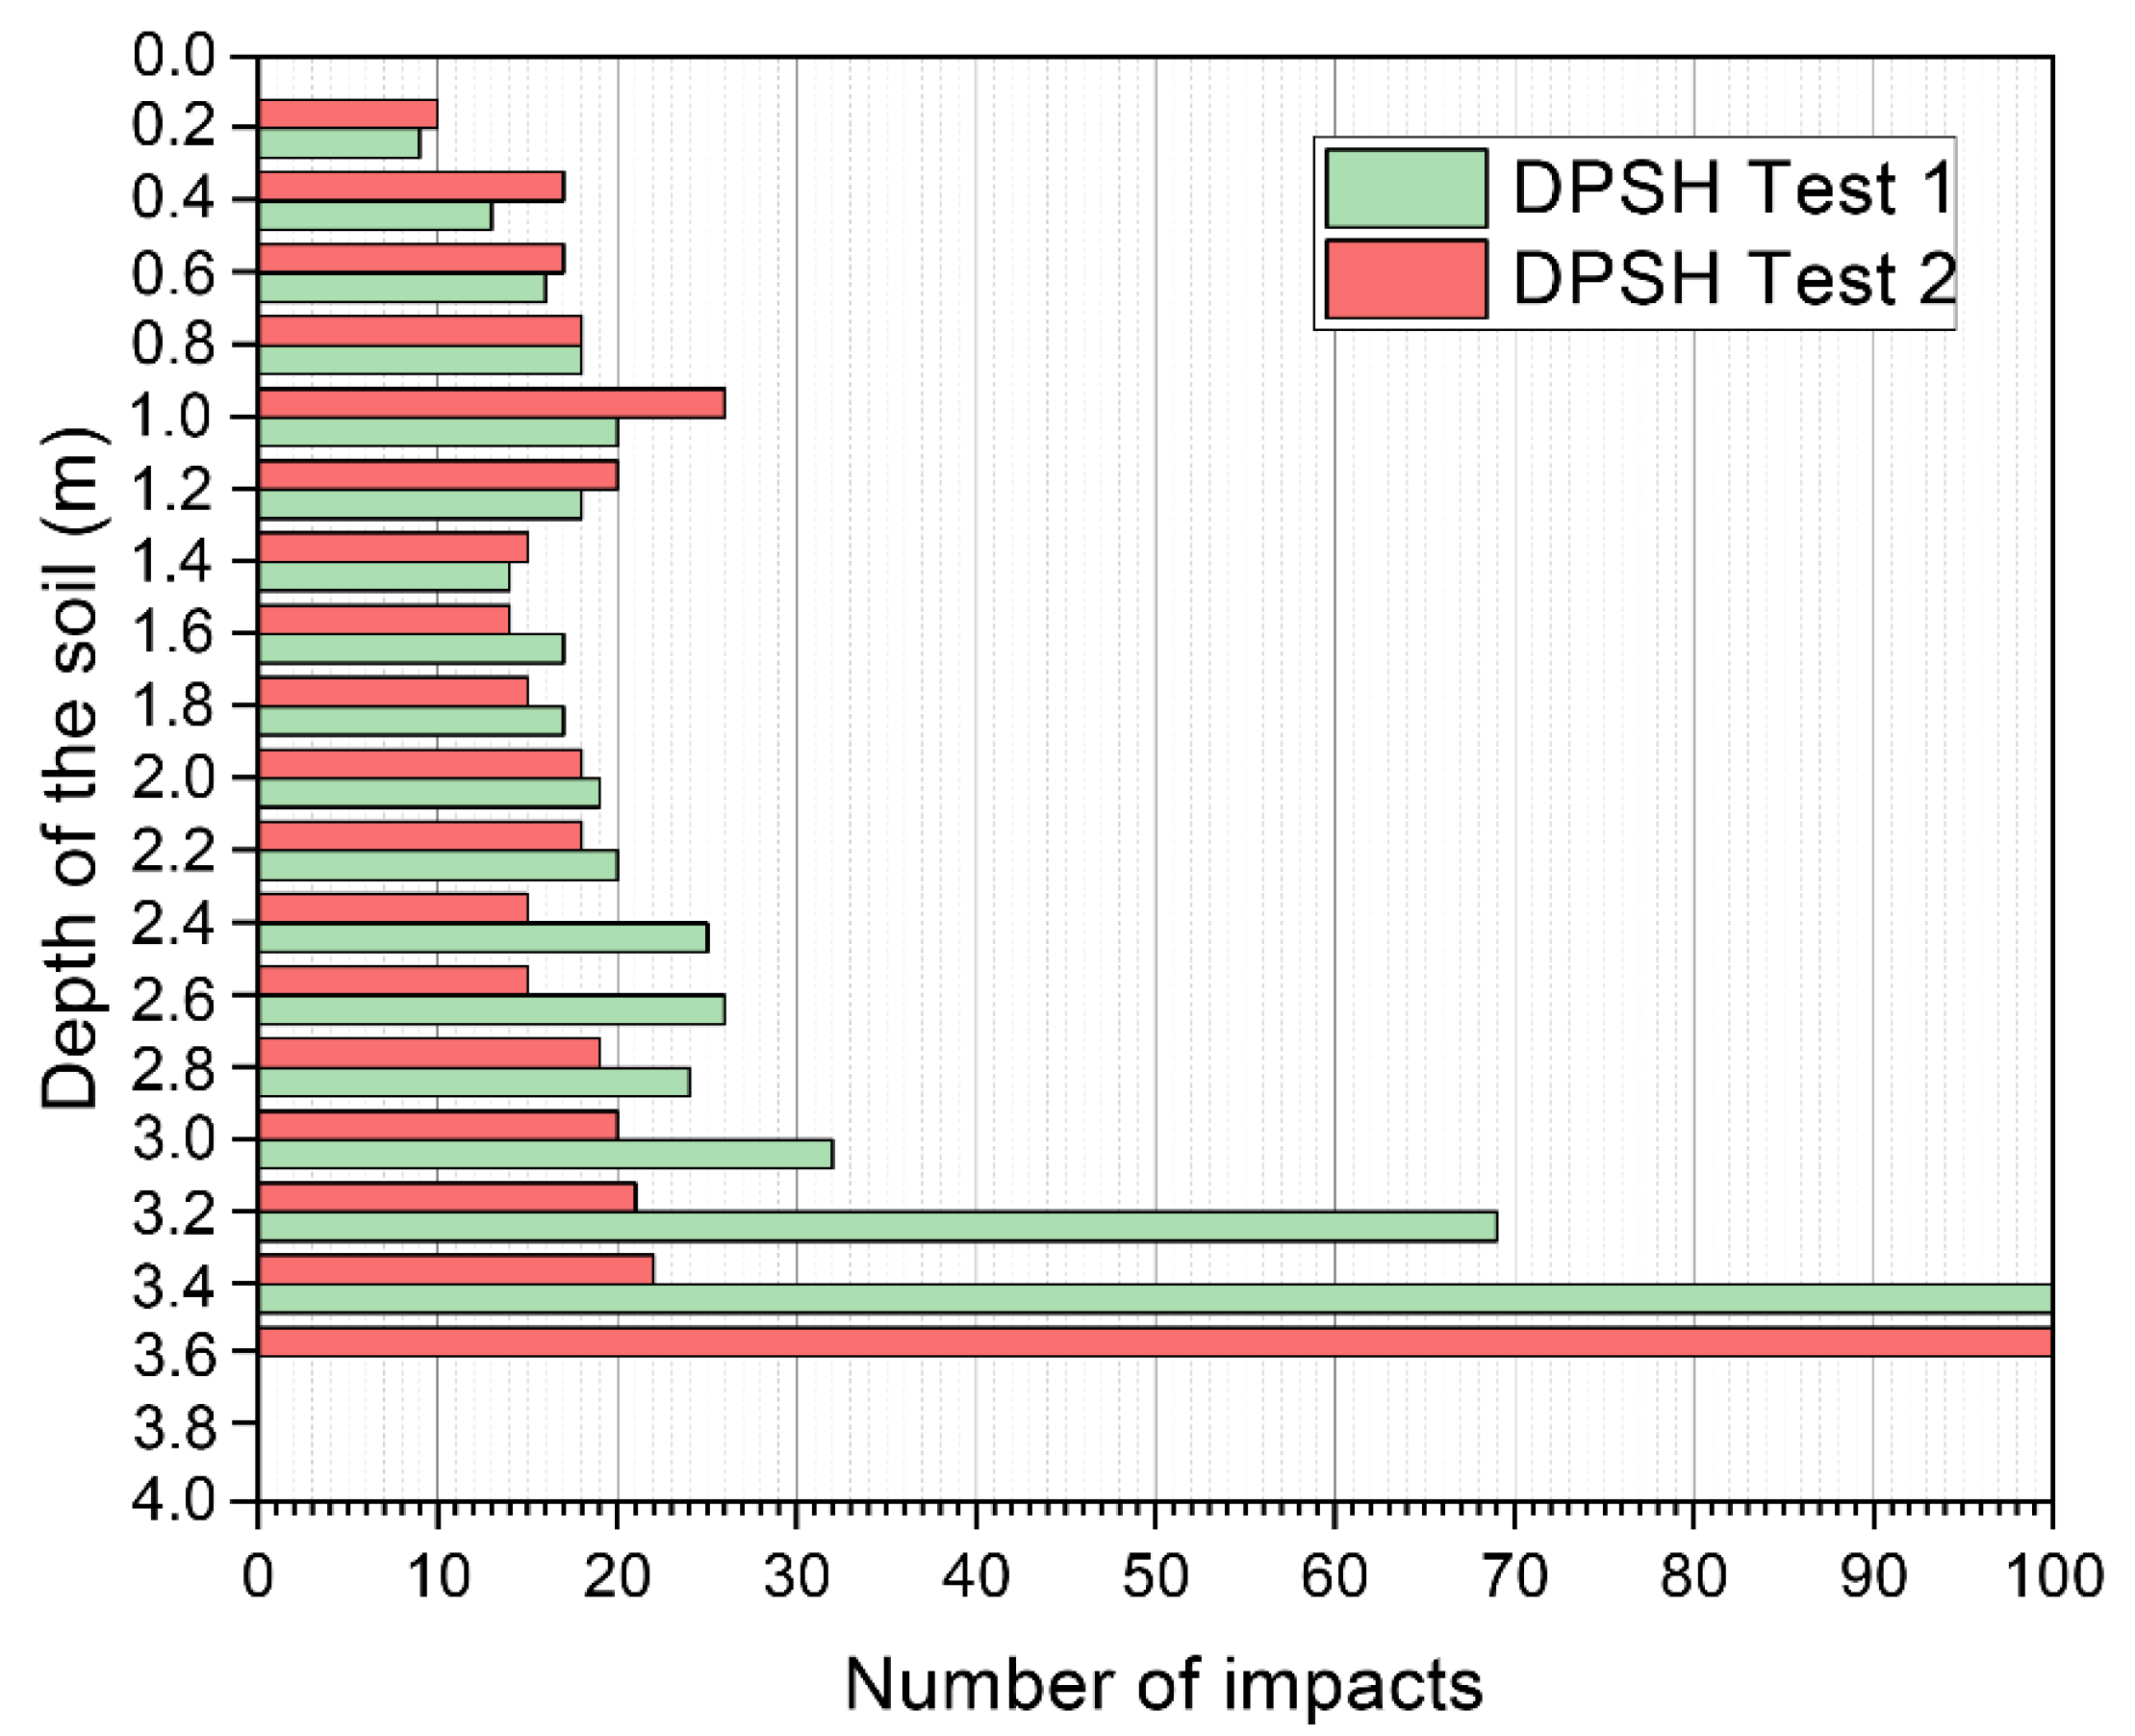
In terms of consistency, the soil exhibits a medium level of compaction, with the two DPSH tests conducted up to refusal yielding very similar results (see
Figure 2).
To calculate the horizontal subgrade modulus of the soil, lateral load tests were conducted on W6×15 profiles driven to a depth of 1.20 meters, with incremental loading applied until final soil failure (Tests 1 and 2). At each stage, the deflection and rotation of the profile were measured to ensure that torsional deflections did not influence the results [
31].
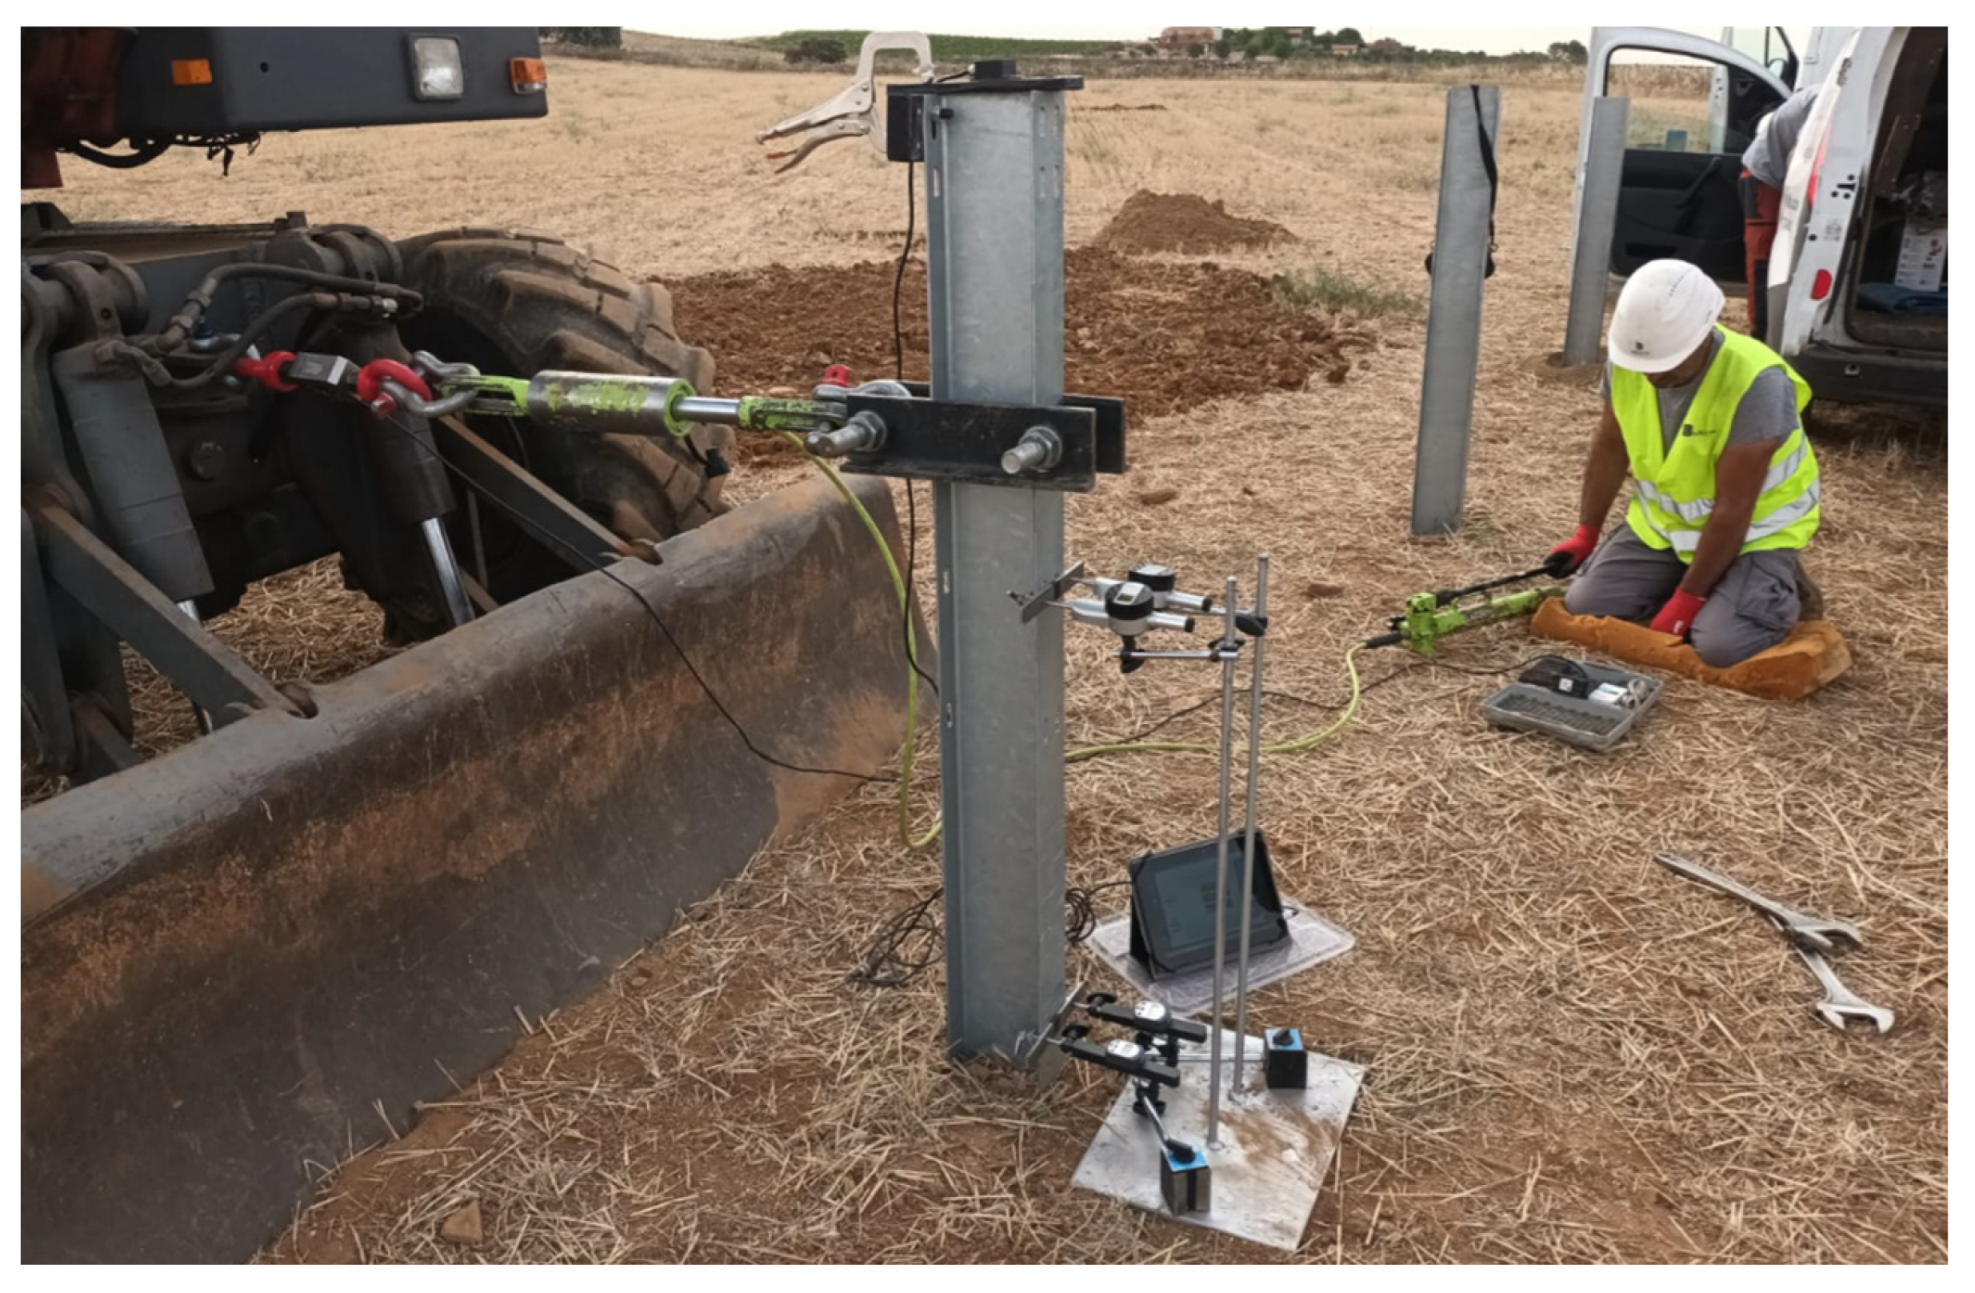
The test load was applied using a hydraulic cylinder anchored to an excavator. Load control was managed with a calibrated tension load cell. Deflection and rotation of the profile were measured at each loading-unloading stage using pairs of micrometer gauges positioned 5 cm and 75 cm above the soil surface. The instrumentation setup is illustrated in
Figure 3.
3. Experimental Campaign
The following sections describe the tests conducted and the different stages of the experimental field campaign.
3.1. Monotonic Lateral Load Tests
Two lateral load tests (Test 1 and 2) were conducted on W6×15 type profiles, each with a length of 2.2 meters and a penetration depth of 1.2 meters into the soil. These tests were specifically designed to characterize the soil properties through lateral load testing up to soil failure and to determine the soil’s ultimate bearing capacity. The results provided detailed insights into the soil’s behavior, contributing to an experimental characterization of the initial horizontal subgrade reaction as a function of the applied load.
3.2. Lateral Load Fatigue Tests
Four cyclic lateral load tests (FT-1 to FT-4) were conducted on W6×15 profiles to evaluate their behavior under various conditions. The profile length and penetration depth were the same as those used in section 3.1. FT1 and FT2 tests were subjected to maximum loads equivalent to 55% of the soil’s static failure load, with 31 loading cycles applied in increments of 12.5 kN, 18.75 kN, and 25.0 kN. The choice of 55% of the failure load was based on the results from experimental static tests, following the practice of using a safety factor between 1.8 and 2 to ensure soil integrity under service loads.
Subsequently, additional cyclic lateral load tests were conducted with maximum loads reaching 72% and 77% of the soil’s failure load. These tests (FT-3 and FT-4) involved 120 loading cycles with increments between 32 and 35 kN, respectively. The decision to increase both the load level and the number of cycles was motivated by observations from the previous phase, where the soil did not exhibit significant deterioration. This adjustment was made to explore a broader range of loads and to gather additional data on soil behavior.
3.3. Pull-Out Pile Tests
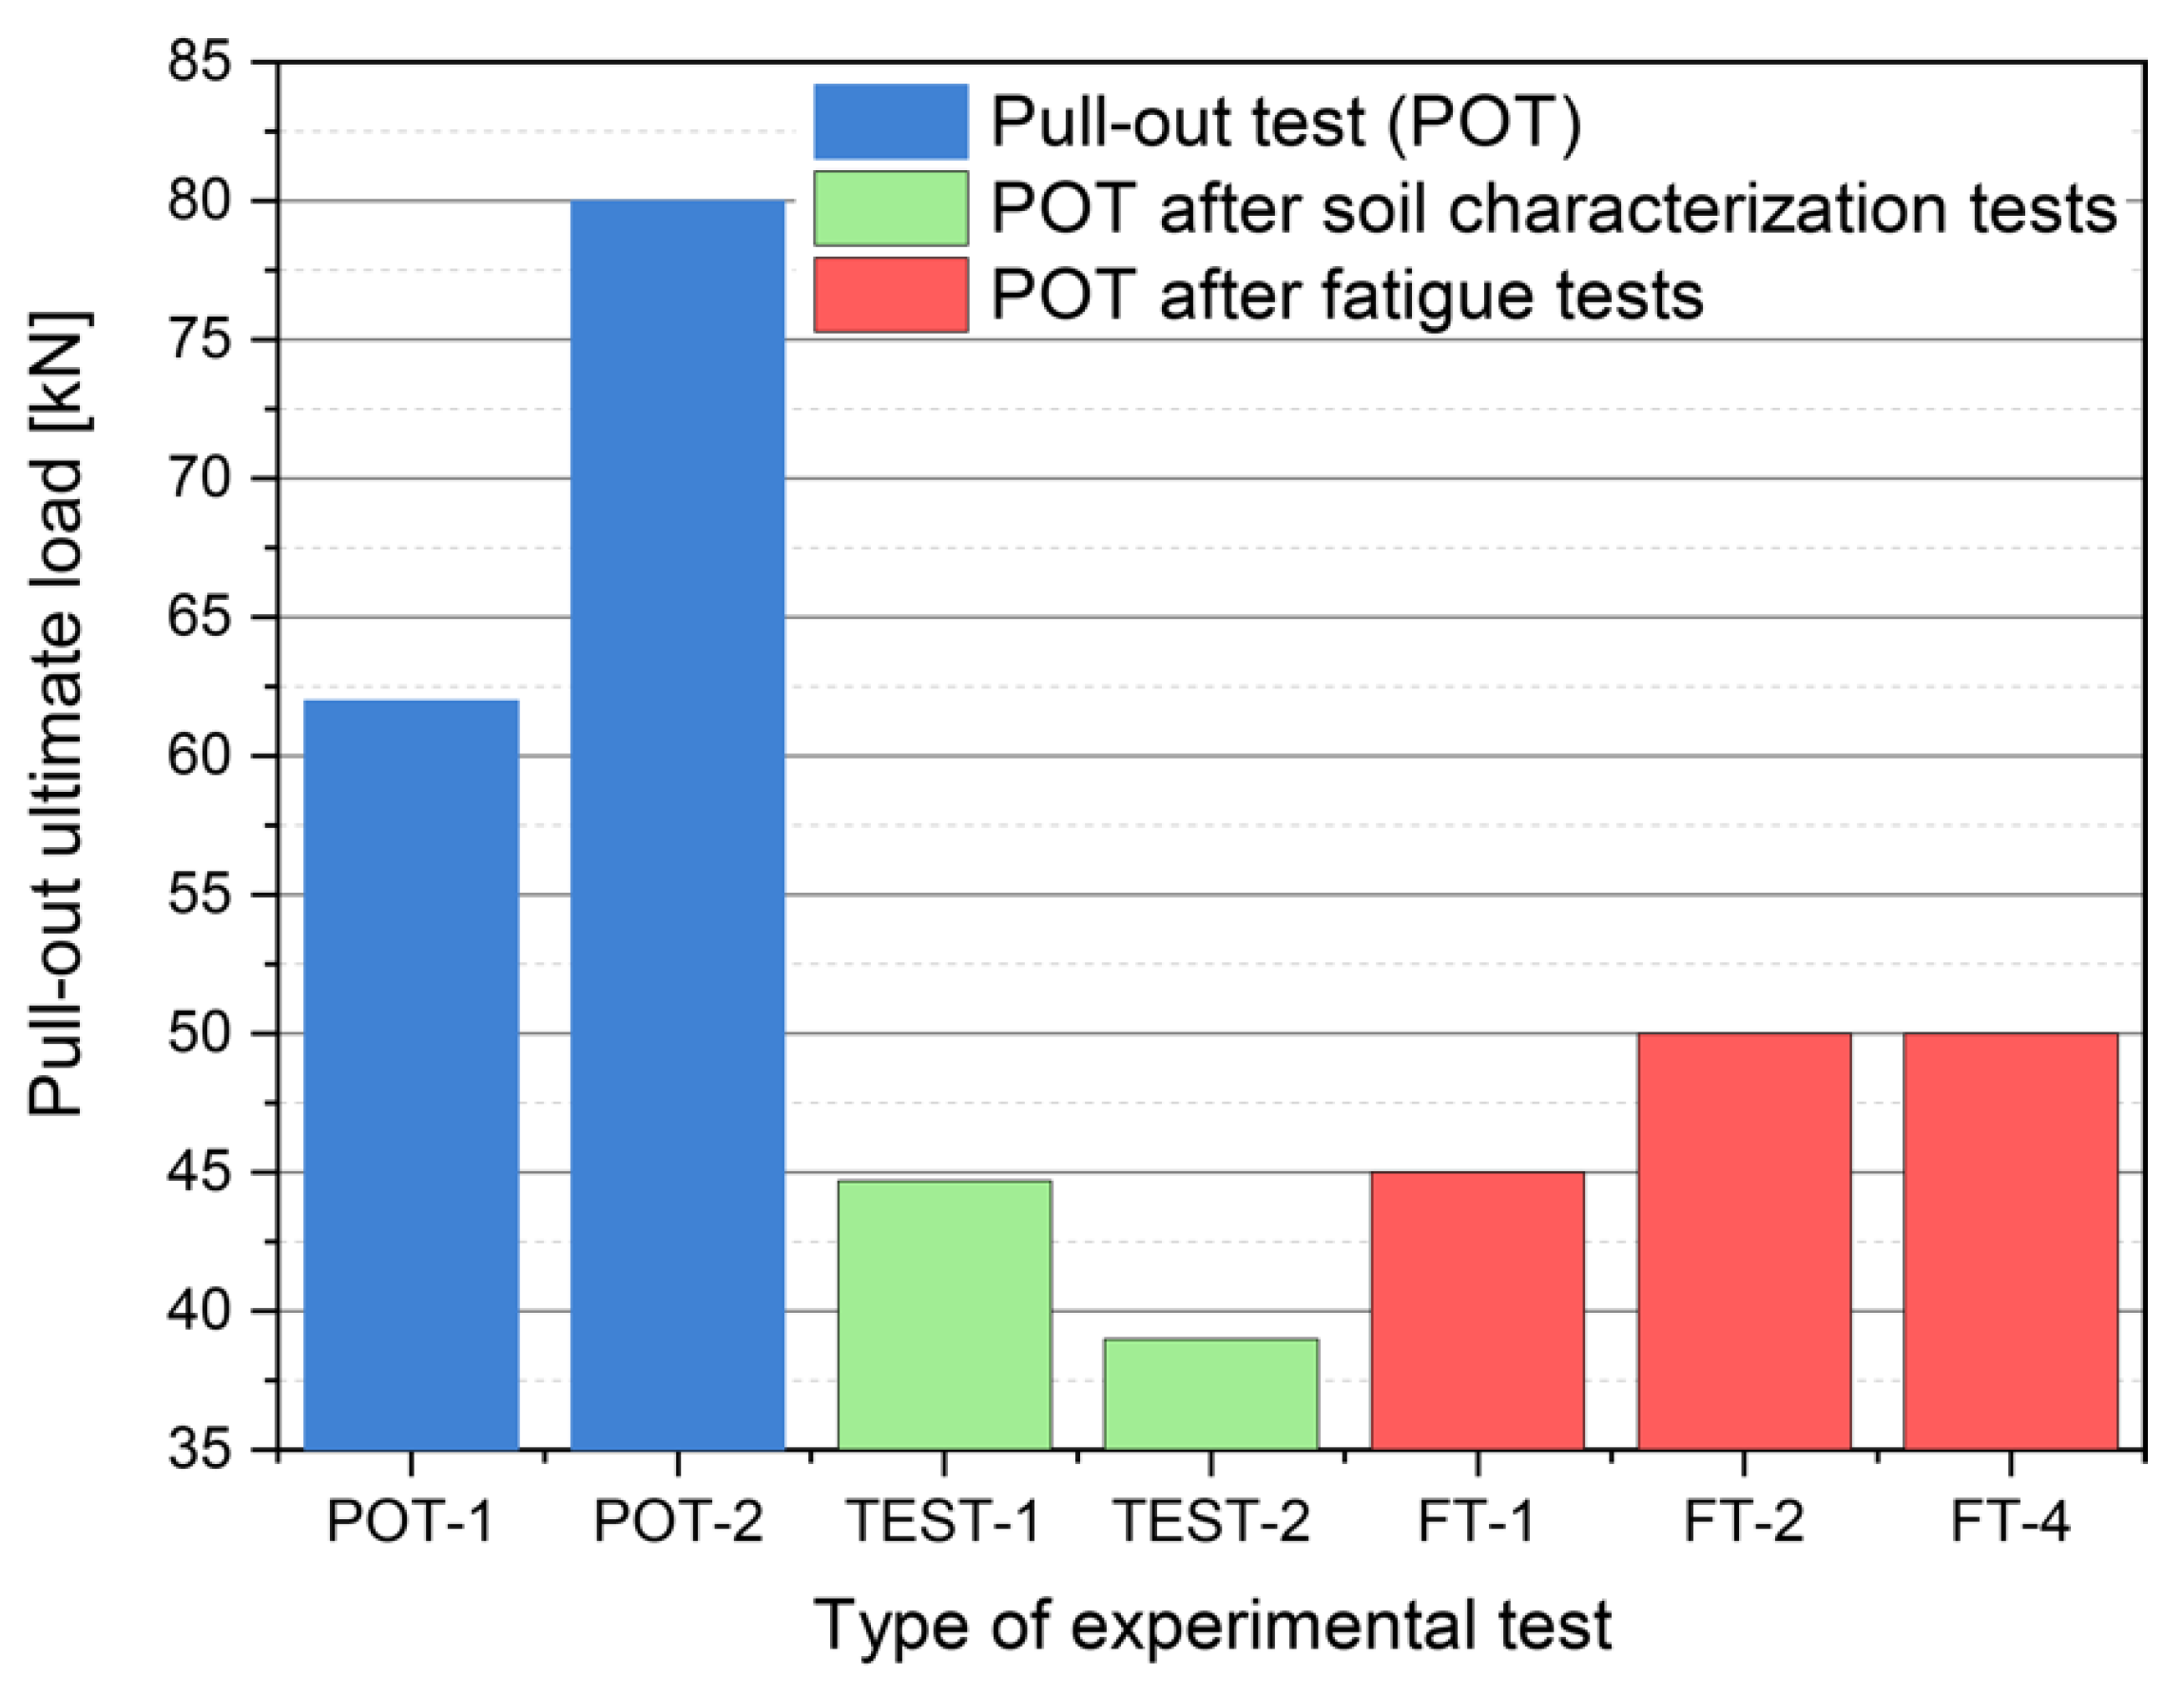
One of the objectives of this study was to determine whether repetitive lateral load tests could impact the future tensile strength of the foundations. To investigate this, seven static tensile load tests were conducted until the profiles were pulled out. Five of these profiles had been previously tested under lateral loads (Tests 1, 2, FT-1, FT-2, and FT-4), while two (POT-1 and POT-2) underwent only the tensile test, serving as a reference for potential loss of soil strength due to alteration during the lateral load tests.
All tensile tests were performed on S355 steel W6×15 profiles with an initial penetration depth of 1.20 meters. The test was conducted using pressure jaws at the center of the web section, applying a continuous incremental load until the profile was pulled out. To minimize deviations in the load direction, the verticality of the pull was controlled using a precision inclinometer.
4. Results and Discussions
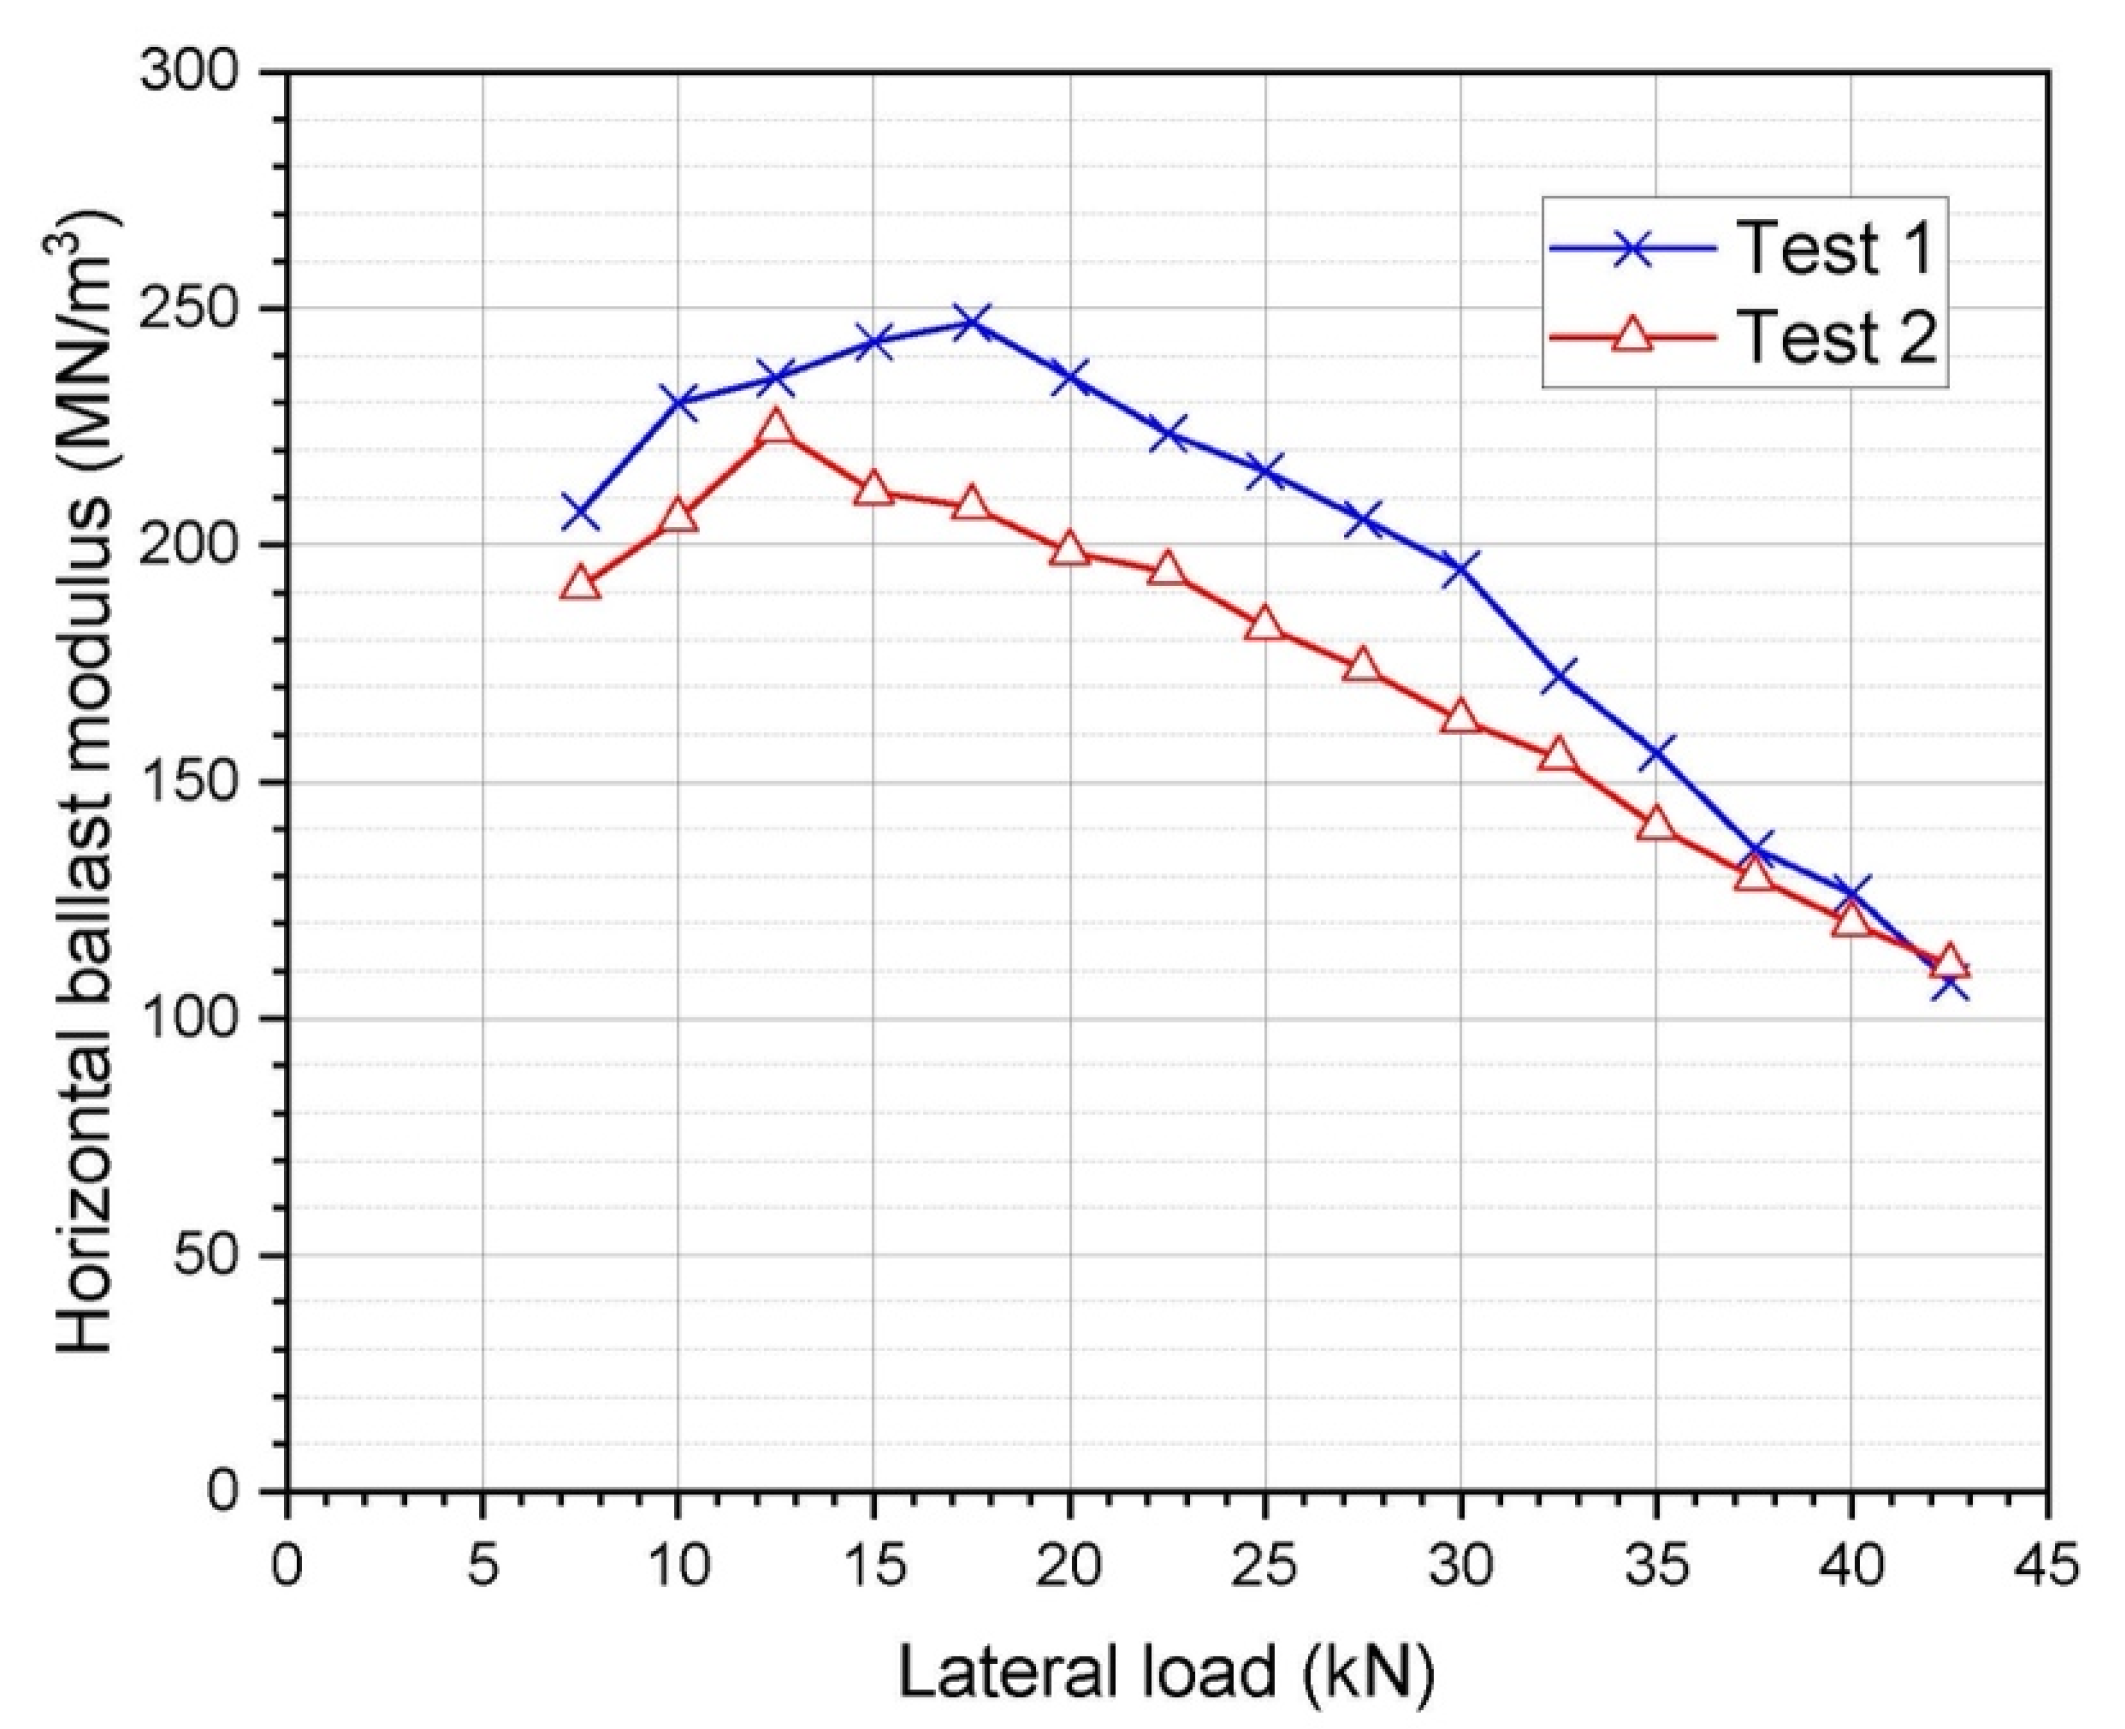
4.1. Experimental Determination of Subgrade Reaction
Figure 4 presents the experimental values of the horizontal subgrade reaction obtained from the two characterization tests. Initially, at loads below 15 kN for TEST-2 and 17.5 kN for TEST-1, an apparent increase in the subgrade reaction is observed. This phenomenon is attributed to the initial compaction of the soil, which temporarily increases the subgrade reaction. This variation is caused by the increased contact between particles as they begin to reorient themselves to accommodate the applied stress [
32].
Above 17.5 kN, an increase in soil plasticity and a decrease in the horizontal subgrade reaction are observed in all cases. This behavior is due to the reorganization and excessive pressure on the soil particles [
32], as well as the expulsion of water, which reduces particle adherence. The maximum horizontal load causing soil failure, applied at a height of 1 meter from the soil surface, was 42.5 kN in both characterization tests. Deflections were measured with reduced rotations, primarily due to profile bending under horizontal forces, as expected for a profile with high torsional capacity [
31].
4.2. Fatigue Behavior of Laterally Loaded Piles
In this section, we analyze the fatigue response of steel piles with open cross-sections and thin walls when subjected to cyclic loading. The objective is to assess the long-term performance of these elements.
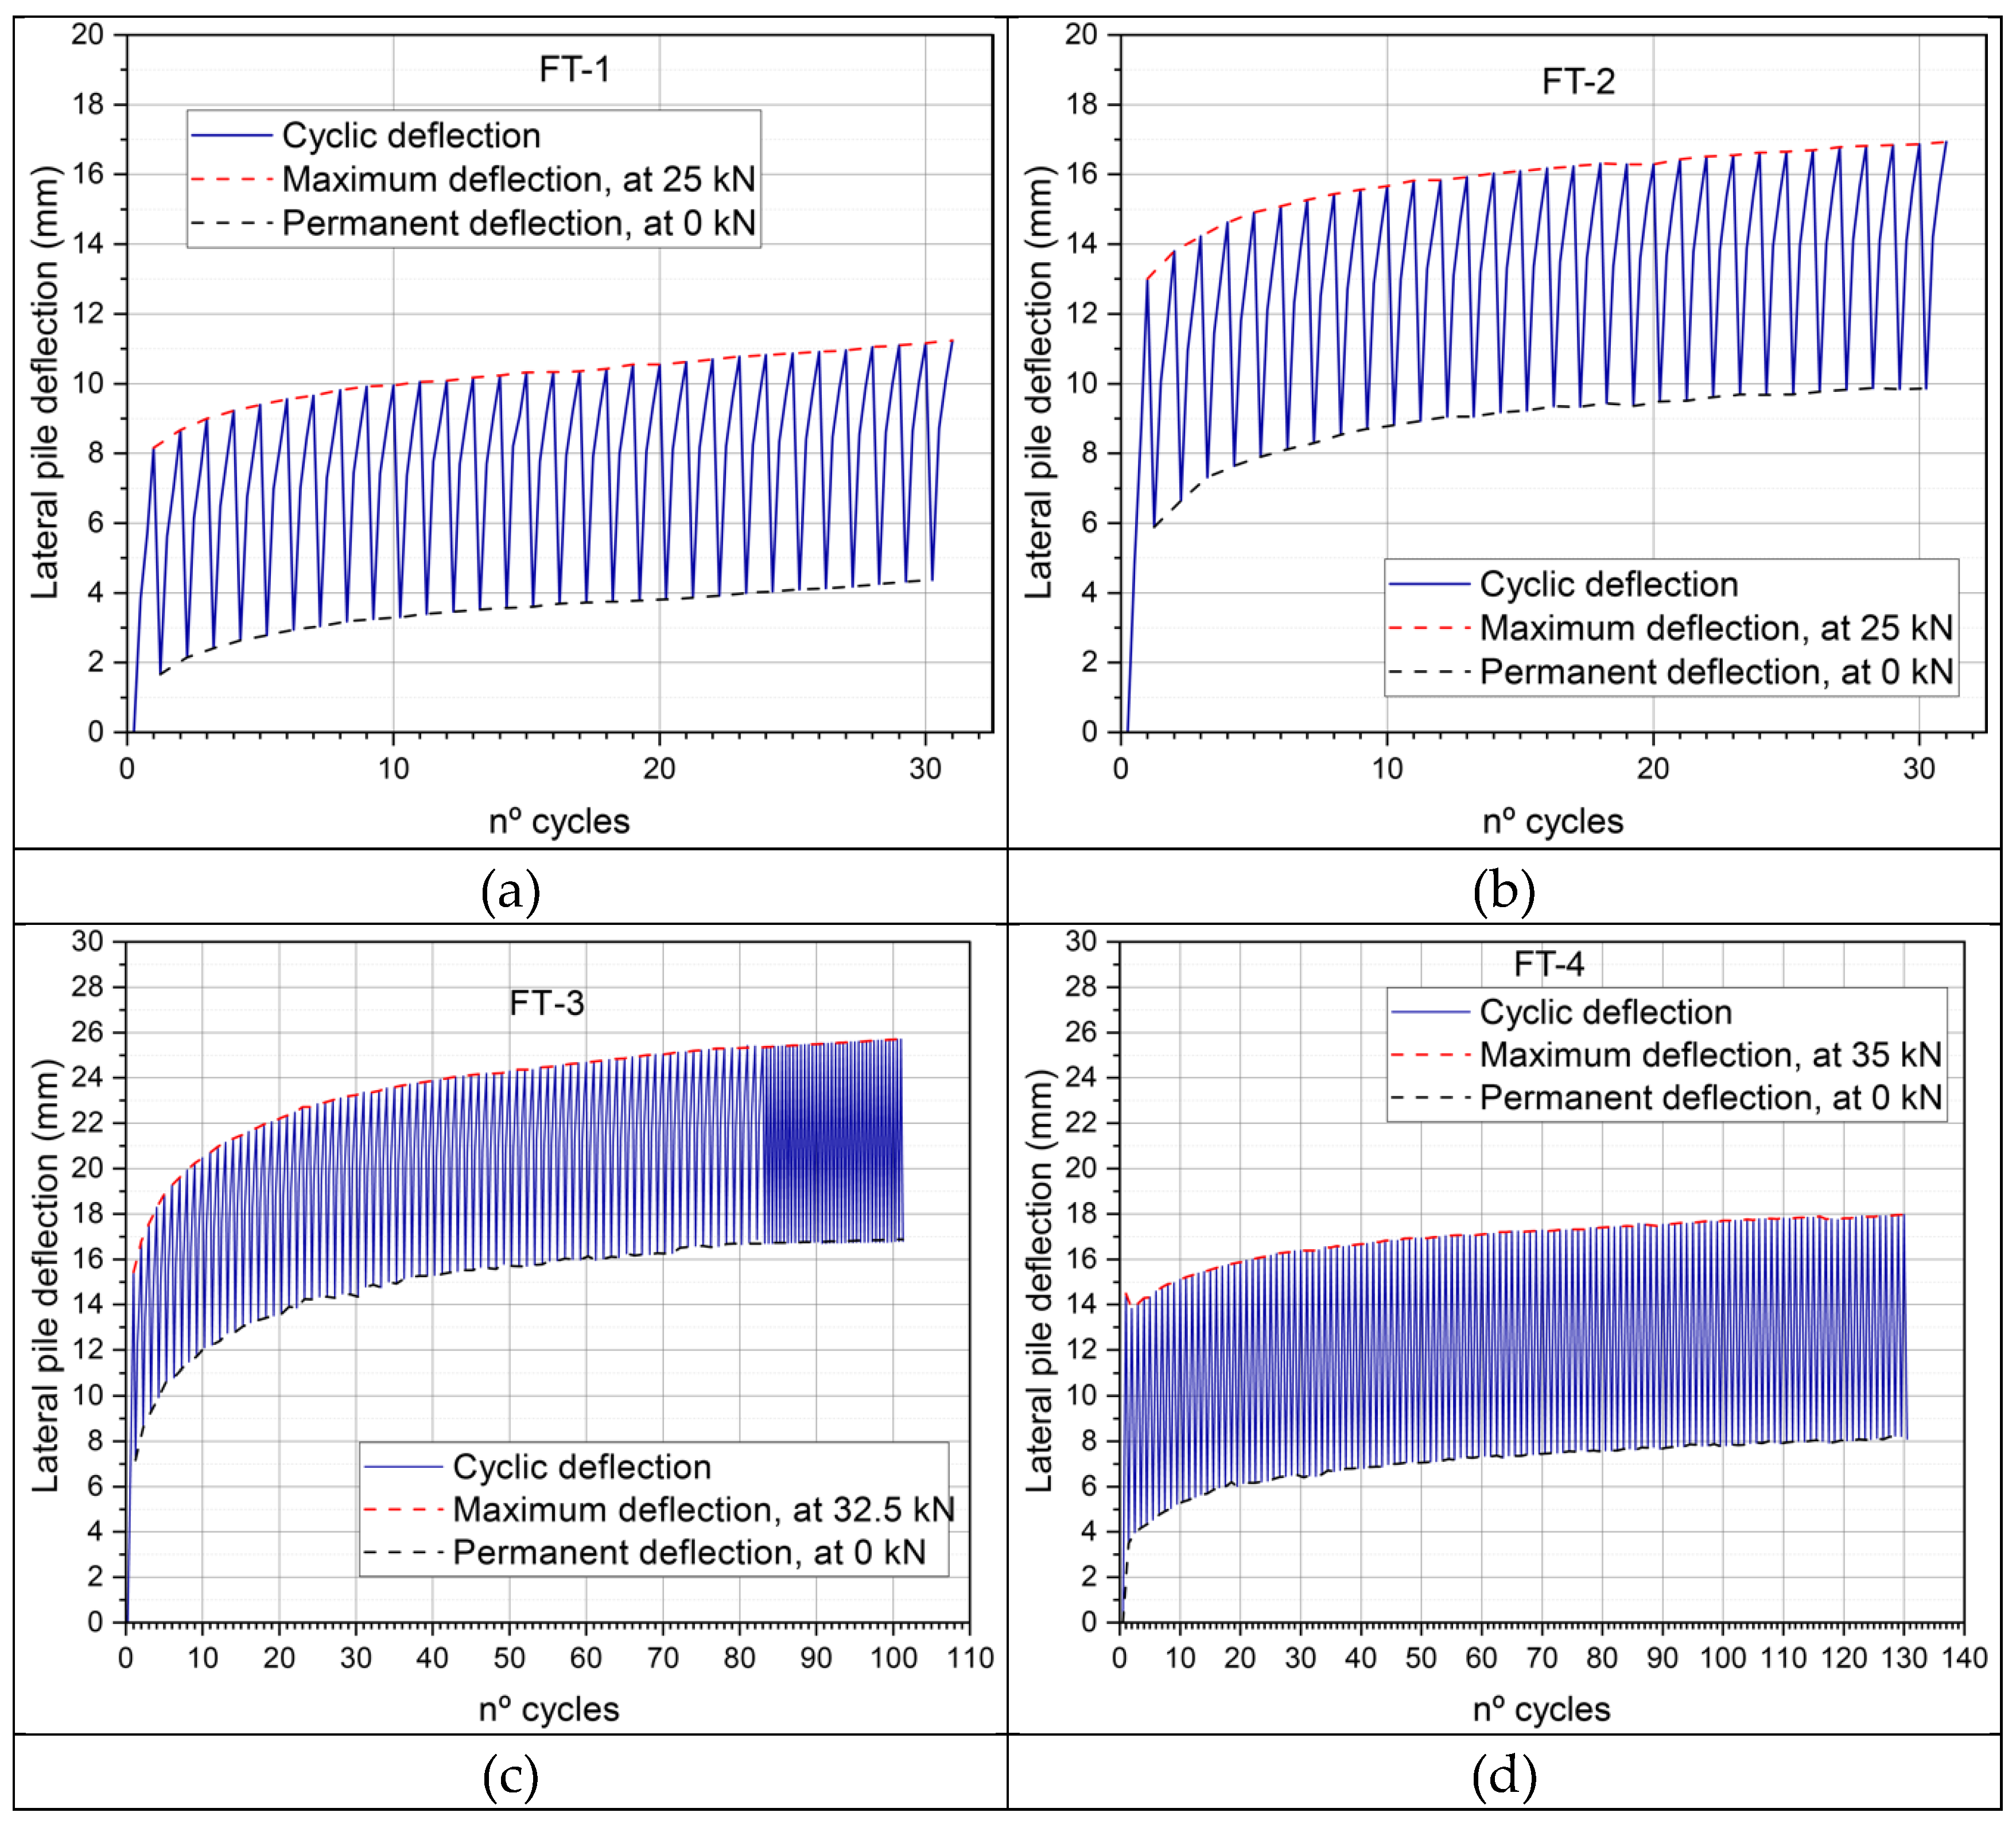
Figure 5 illustrates the evolution of the experimentally measured lateral deflection in the pile, with the number of loading cycles on the abscissa axis and the deflection on the ordinate axis. Additionally, the evolution of the maximum deflection with cycles is depicted by a red dashed line, while the permanent or residual deflection is represented by a black dashed line.
Figure 5a,b depict the fatigue tests of the W6×15 pile under the conditions described in
Section 3.2. The tests reached a maximum load of 25 kN, which is 55% of the ultimate static load, with 31 loading-unloading cycles. For this maximum load, and based on the soil characterization results shown on
Figure 4, the average horizontal soil subgrade reaction is 199 MN/m
3. Greater deformation was observed in the initial compaction phase for FT-2 due to the intrinsic variability in soil behavior [
33].
Examining the total deflection (dashed red curve), it is evident that in both FT-1 and FT-2, there is a gradual exponential increase, with transitions to a linear trend after the first 10 cycles. The trend of the permanent deflection (dashed black curve) is qualitatively similar to that of the maximum deflection.
In the test FT-3 (
Figure 5c), the maximum load for each cycle was 32.5 kN, representing 72% of the ultimate static load, with the number of cycles increased to 100 in an attempt to induce fatigue failure in the soil. As shown in
Figure 4, the average horizontal soil subgrade reaction for this load was 164 MN/m
3, lower than that observed for FT-1 and FT-2 (25 kN). Due to this lower horizontal soil subgrade reaction, the highest deflections were recorded, reaching a maximum value of 28 mm. A significant deflection occurred during the first loading cycle, likely because that area of the soil may have had lower cohesion compared to other test points. The trends of maximum and permanent deflections repeated, but soil fracture was still not achieved.
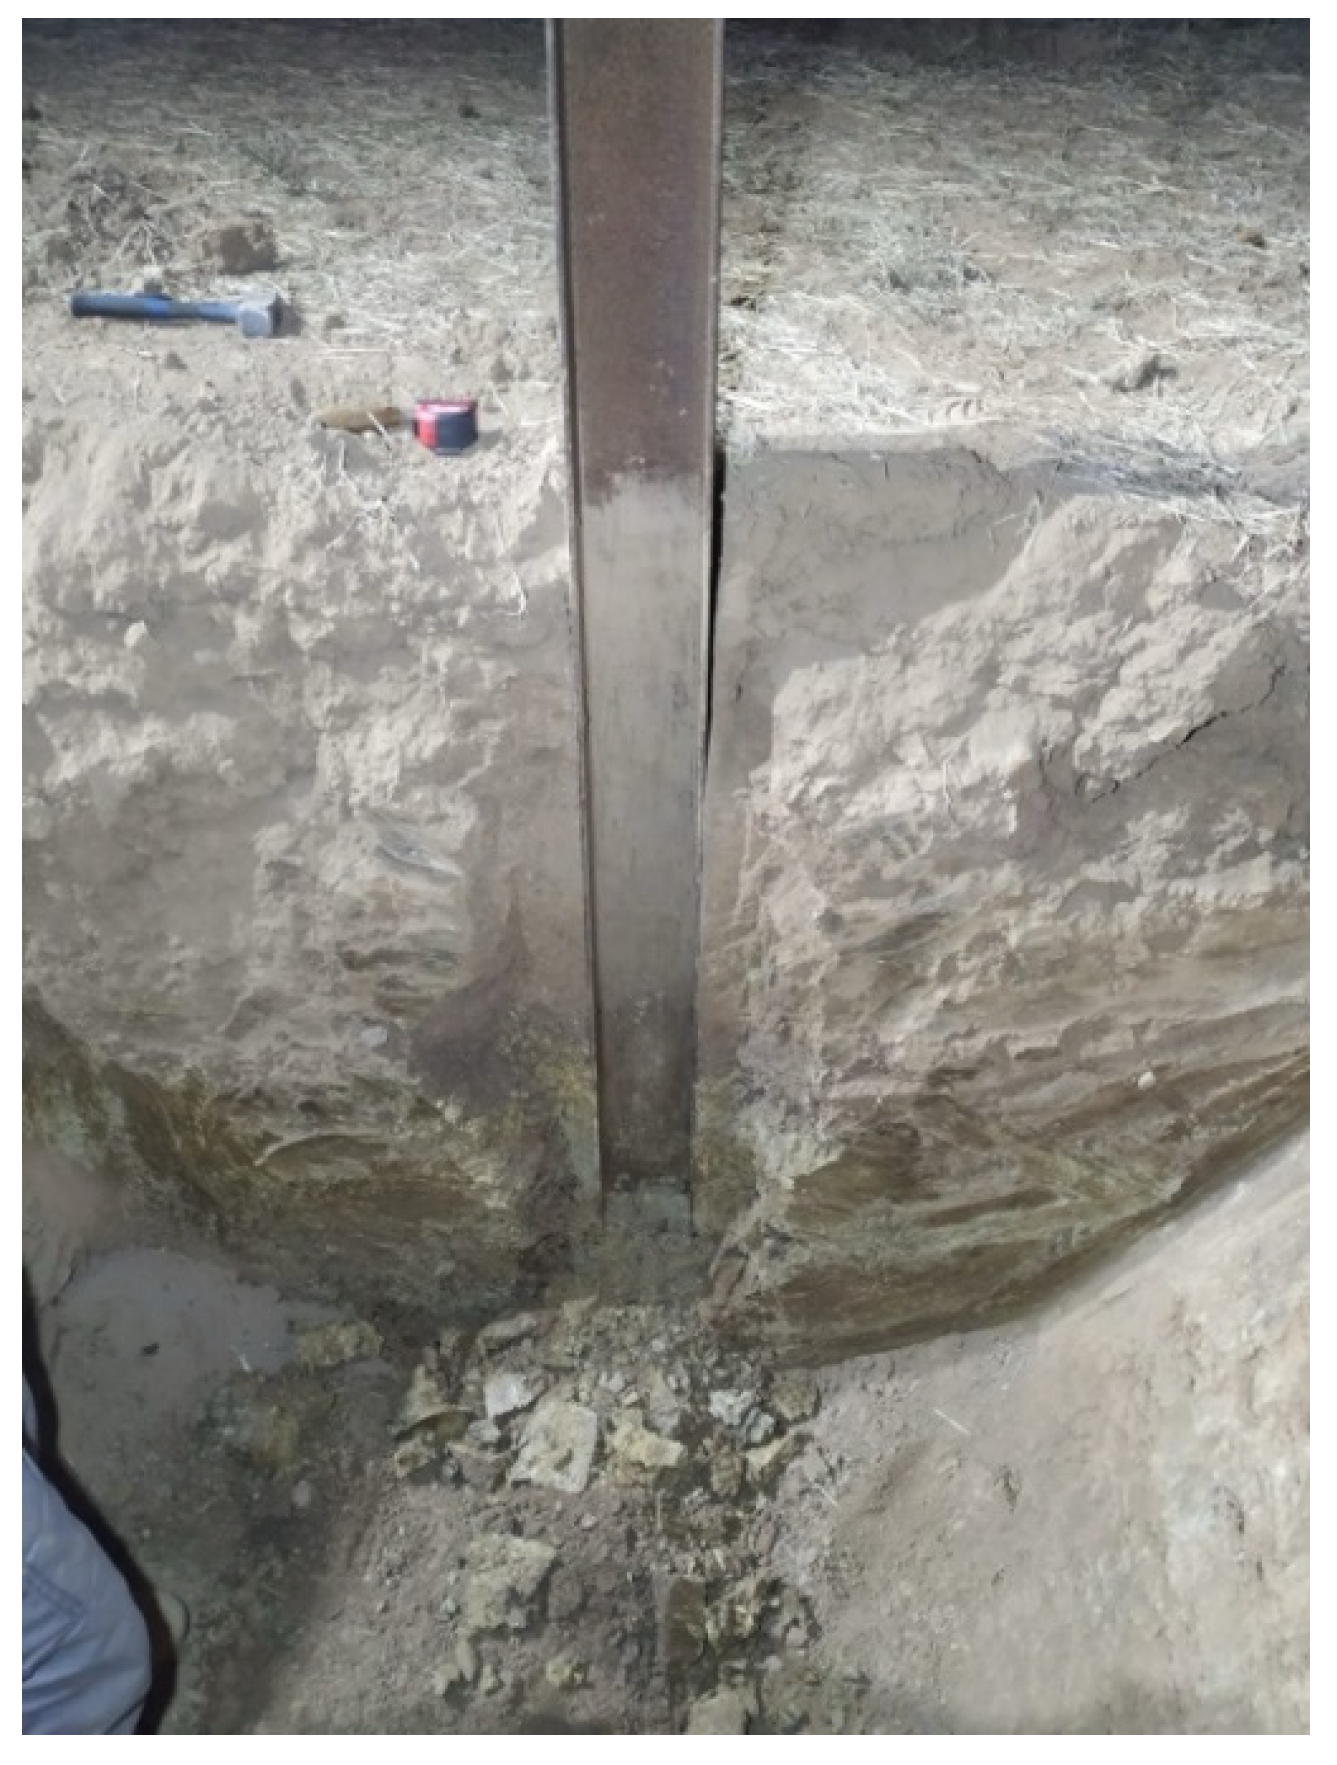
Figure 6 shows the cross-section at the end of test FT-3. It is evident that the separation between the pile and the soil occurred due to permanent deflection; however, the profile still maintained adherence and resistance at the base, likely due to the weight of the adjacent soil and the stress-strain effects it produced.
Finally, the load was increased to 35 kN, corresponding to 77% of the ultimate static load, with the number of cycles extended to 130. Despite this, soil fracture was still not achieved. The soil behavior remained similar to previous cases, though with greater deformation in each cycle due to the higher applied load (
Figure 7).
In
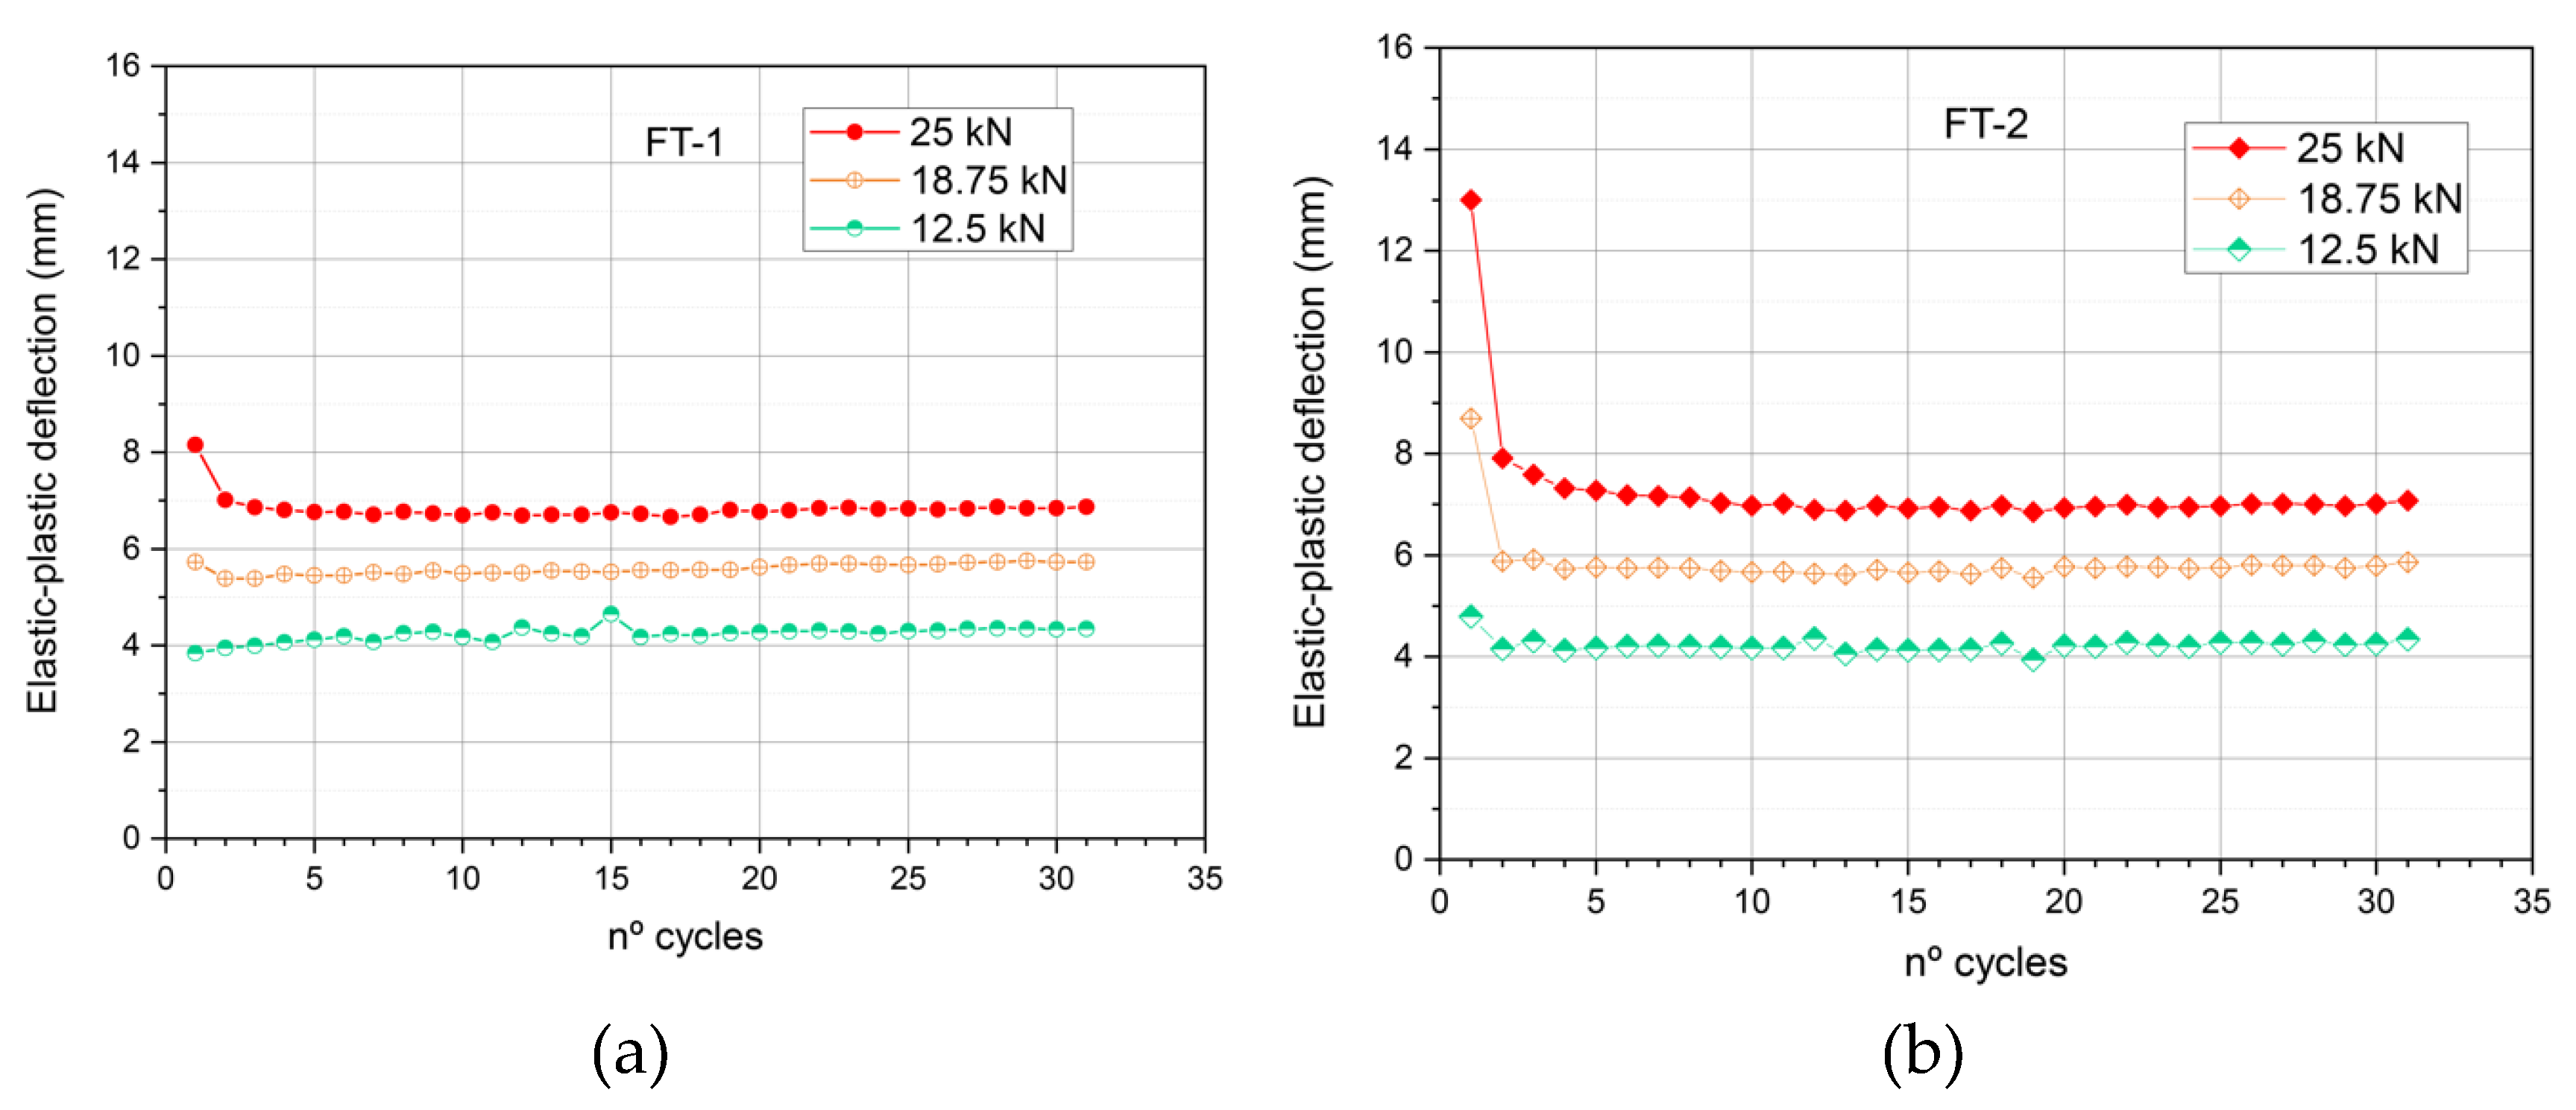
Figure 7, the results of the elastic-plastic lateral deflection resisted by the pile during each loading cycle are analyzed. The elastic-plastic lateral deflection of each cycle was calculated as the difference between the accumulated elastic-plastic deflection (red curve in
Figure 5) and the permanent deflection (black curve in
Figure 5), referred to earlier as the deflection amplitude in
Figure 5.
As shown in
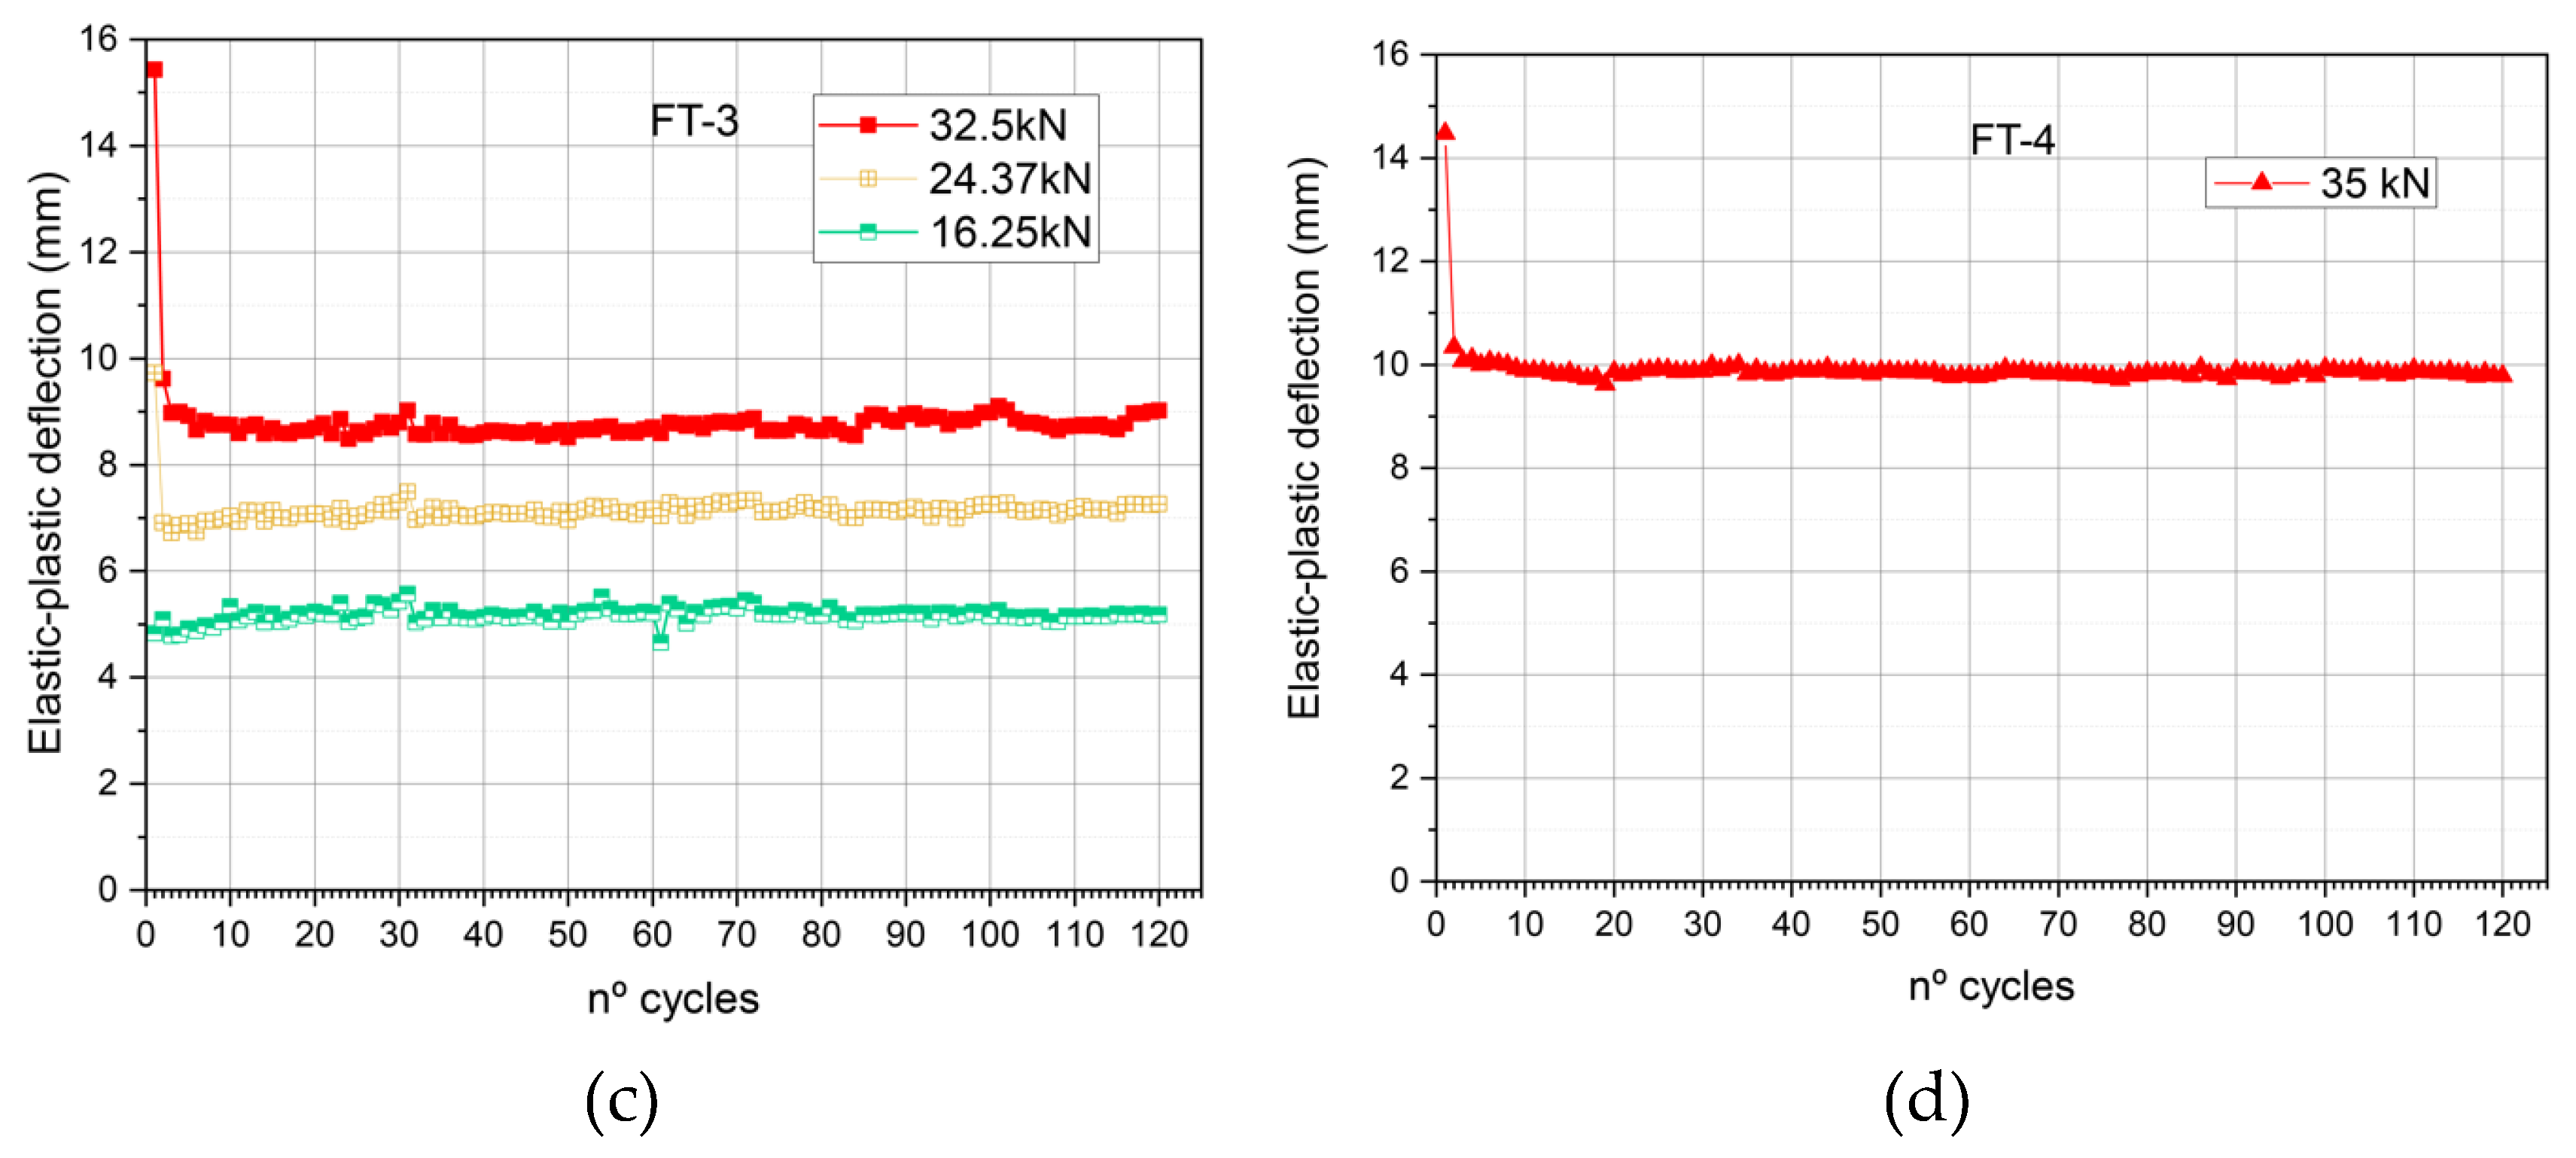
Figure 7, all curves exhibit an initial phase of gradual nonlinear degradation, followed by a phase of stable linearity until reaching the final number of cycles. The highest residual deflection is consistently observed in the first cycle. This occurs because the natural soil initially undergoes a compaction process due to the pressure applied during the test. Consequently, the initial cycles contribute to soil cohesion and reduce its plasticity. Once maximum soil cohesion is reached, plasticity remains constant, leading to a reduction and stabilization of elastic-plastic deflection (as seen in the quasi-horizontal portion of
Figure 7).
Figure 7a,b present the results of tests FT-1 and FT-2 respectively. Both tests were subjected to maximum cyclic loads of 25 kN, with deflection values recorded for loads of 12.5 kN, 18.75 kN, and 25 kN. It was observed that the maximum elastic-plastic deflection in the first cycle was 8.15 mm for FT-1 (
Figure 7a) and 13 mm for FT-2 (
Figure 7b) during the compaction stage, which falls within the typical dispersion range for different points in the same soil [
34]. Nonetheless, starting from cycle 5 in FT-1 and cycle 9 in FT-2, the elastic-plastic deflection reduced to 7 mm and remained constant for a greater number of cycles. This indicates that the cycle at which the soil consolidates and reaches constant plasticity depends on its initial characteristics. Regardless of these initial characteristics, the early load cycles promote soil compaction, resulting in a consistent linear behavior across different points within the same soil. This behavior is also observed in the FT-1 and FT-2 curves for loads of 18.75 kN (orange curve) and 12.5 kN (green curve), which stabilize at elastic-plastic deflections of 5.7 mm and 4.4 mm, respectively.
Test FT-3 was subjected to a higher maximum load of 32.5 kN to examine the effect of increasing the load and tripling the number of cycles compared to tests FT-1 and FT-2 (
Figure 7c). This was done to verify if any degradation of the soil would occur. A behavior similar to that described in the previous tests was observed. From the fifth cycle onward, the plasticity of the soil stabilizes at a load of 32.5 kN. No additional soil degradation was detected with the increase number of applied load cycles.
In test FT-4, the load was further increased to 35 kN (
Figure 7d). The observed behavior was similar to that of the previous tests. Due to the higher applied load, stiffness was reduced, which was reflected in an increase in elastic-plastic deflection within the stable zone to 9.9 mm, starting from the tenth load cycle. No further reduction in soil stiffness was observed with the increase in cyclic load.
The fact that this elastic-plastic deflection remains independent of the number of load cycles indicates that the soil’s ability to recover elastically is not affected by the frequency load application. Even if the soil undergoes repeated cycles of loading and unloading, reversible elastic-plastic deflection will remain constant as long as the applied loads stay within the same range. The evolution of the soil’s plastic component increases proportionally with the number of loads, maintaining the same pressure range.
4.3. Residual Strength and Pull-Out Capacity after Lateral Loading
This section presents the results of the pull-out resistance for a W6×15 pile embedded 1.2 meters in the cohesive soil described in
Section 2.2. Additionally, the residual pull-out resistance results are included after the pile was subjected to lateral loads in both the TEST-1 and TEST-2 trials from
Section 4.1, as well as in the fatigue tests FT-1, FT-2, and FT-4 from
Section 4.2. It is important to note that the pull-out test was not performed in the FT-3 trial, as the pile was used for dissecting the soil and analyzing its structure after the fatigue tests (see
Figure 6).
In
Figure 8, the results of the maximum pull-out resistance are presented in blue, showing values of 80 kN and 64 kN, with an average of 72 kN and a coefficient of variation of 11%, which falls within the normal range of geotechnical variation. These tests are considered the reference.
The pull-out test results conducted after applying monotonic loads in the TEST-1 and TEST-2 soil characterization trials are shown in green. A significant decrease in adherence is observed after soil exhaustion, with an average reduction of 43% compared to the previous trial.
The results of the pull-out tests after fatigue tests at 25 kN (FT-1 and FT-2) and 35 kN (FT-4) are presented in red columns. An average decrease of 33% in adherence is observed compared to the reference trial, as the soil did not collapse after the fatigue cycles. This suggests that the compaction effects in the surface layers of the soil result in permanent deflection and a loss of pile-soil contact, leading to a consequent decrease in the pile’s tensile capacity (see
Figure 6). No significant differences are observed between the fatigue tests, indicating that damage occurs primarily during the initial loading cycles that induce compaction of the surface soil layers.
5. Concluding Remarks and Significance
This study researched the fatigue effects on thin-walled, open-ended piles subjected to cyclic lateral loads applied at the shear center. The impact of fatigue on the horizontal soil subgrade reaction, tensile adherence, and load-deflection response of the pile was analyzed. The findings are summarized as follows:
The elastic-plastic deflection of the soil reaches its maximum value during the first loading cycle due to soil compaction. Nonetheless, after a few additional cycles (approximately 10 cycles under the studied conditions), the elastic-plastic deflection per cycle remains constant in all cases examined.
The permanent or residual deflection of the soil shows a steady increase after the initial compaction phase. This suggests that the soil does not experience fatigue from that point onward and that its lateral load stiffness remains constant for the same cyclically applied load, contrary to what is indicated in other studies on large-diameter piles. Nonetheless, despite the absence of soil fatigue, stability may be compromised due to the accumulated permanent deflection that occurs with each cycle, which can destabilize the system due to the effects of large deformations over the long term.
The horizontal soil subgrade reaction initially increases with the applied load, enhancing the lateral resistance of the pile through soil cohesion. However, there is an optimal cohesion load beyond which soil degradation and eventual collapse occur as the applied load continues to increase.
In static monotonic tests, the soil-pile behavior differs depending on whether the applied load is below or above the soil’s optimal cohesion load. Below the optimal load, an initial improvement in soil-pile cohesion is observed; above it, progressive degradation occurs.
The compaction effects on the surface layers of the soil result in permanent deflection and a loss of pile-soil contact, leading to a consequent decrease in the piles’ tensile capacity. No significant differences were observed between the fatigue tests, indicating that the damage primarily occurs during the initial loading cycles that induce compaction of the surface soil layers.
From the results of this study, it is evident that the horizontal soil subgrade reaction remains unaffected by repetitive cycles of the same load intensity. However, there is a gradual accumulation of permanent deflection, which could potentially lead to cumulative tilting over time. Therefore, it may be necessary to implement interventions on the structures to correct the alignment of the piles and restore them to their original position.
Author Contributions
J.A.P.: Conceptualization, Investigation, Formal Analysis, Writing original draft. A.P-T.: Conceptualization, Methodology. J.D.R.: Conceptualization, Formal Analysis, Writing—Review and Editing, Supervision. E.S-G.: Conceptualization, Writing—Review and Editing, Supervision. All authors have read and agreed to the published version of the manuscript.
Funding
This research was partially funded by AUSCULTIA corporation (Madrid, Spain).
Data Availability Statement
Data relating to the research is available to any researcher upon request to the authors.
Acknowledgments
A portion of the research for this paper was conducted by José A. Pérez during his tenure at the University of Seville in collaboration with José D. Ríos in 2024.
Conflicts of Interest
The authors declare no conflicts of interest.
Nomenclature
| A |
Pile cross section |
| b |
Width of the pile’s surface in contact with soil |
| c |
Width of cross section at top flange |
| e |
Eccentricity of the horizontal load respect to the center of gravity of cross section |
| E0 |
Elastic modulus of soil |
| Ep |
Elastic modulus of steel pile |
| G |
Shear modulus of steel pile |
| Ip |
Higher moment of inertia of steel pile |
| It |
Torsional constant of steel pile |
| Iw |
Warping constant of steel pile |
| Iy |
Moment of inertia of y-axis |
| Iz |
Moment of inertia of z-axis |
| kh |
Horizontal modulus of ballast |
| L |
Pile length |
| Lde |
Length of pile at zero lateral displacement from the soil surface |
| Le |
Length of pile embedded in the soil |
| Lu |
Height of horizontal load application respect to soil surface |
| Mt |
Torsional moment |
| p |
Soil reaction |
| RH |
Horizontal load at pile head |
| t |
Web thickness of cross section |
| δh |
Horizontal or lateral displacement of head pile |
| δs |
Horizontal or lateral displacement of pile at soil surface |
| ω |
Torsional susceptibility index |
References
- Cao, G.; Wang, X.; He, C. Dynamic analysis of a laterally loaded rectangular pile in multilayered viscoelastic soil. Soil Dynamics and Earthquake Engineering 2023, 165. [Google Scholar] [CrossRef]
- Abdelaziz, A. Y.; El Naggar, M. H.; Ouda, M. Determination of depth-of-fixity point for laterally loaded vertical offshore piles: A new approach. Ocean Engineering 2021, 232. [Google Scholar] [CrossRef]
- Xiao, X.; Zhang, Q.; Zheng, J.; Li, Z. Analytical model for the nonlinear buckling responses of the confined polyhedral FGP-GPLs lining subjected to crown point loading. Engineering Structures 2023, 282. [Google Scholar] [CrossRef]
- Hoang, L. T.; Matsumoto, T. Long-term behavior of piled raft foundation models supported by jacked-in piles on saturated clay. Soils and Foundations 2020, 60, 198–217. [Google Scholar] [CrossRef]
- Li, Z.; Zhang, Q.; Shen, H.; Xiao, X.; Kuai, H.; Zheng, J. Buckling performance of the encased functionally graded porous composite liner with polyhedral shapes reinforced by graphene platelets under external pressure. Thin-Walled Structures 2023, 183. [Google Scholar] [CrossRef]
- Zhang, Q.; Li, Z.; Huang, H.; Zhang, H.; Zheng, H.; Kuai, H. Stability of submarine bi-material pipeline-liner system with novel polyhedral composites subjected to thermal and mechanical loading fields. Marine Structures 2023, 90. [Google Scholar] [CrossRef]
- Xiao, X.; Bu, G.; Ou, Z.; Li, Z. Nonlinear in-plane instability of the confined FGP arches with nanocomposites reinforcement under radially-directed uniform pressure. Engineering Structures 2022, 252. [Google Scholar] [CrossRef]
- Zhai, Y.-J.; Ma, Z.-S.; Wang, B.; Ding, Q. Dynamic characteristic analysis of beam structures with nonlinear elastic foundations and boundaries. International Journal of Non-Linear Mechanics 2023, 153, 104409. [Google Scholar] [CrossRef]
- Yu, Q. Wavelet solution for hygrothermomechanical bending of initially defected plate undergoing large deformation on nonlinear elastic foundation. Thin-Walled Structures 2022, 179, 109601. [Google Scholar] [CrossRef]
- ISO 22477-10:2016 Geotechnical investigation and testing — Testing of geotechnical structures — Part 10: Testing of piles: rapid load testing.
- ASTM D3966-07. Standard Test Methods for Deep Foundations Under Lateral Load. 2010.
- American Petroleum Institute. Recommended practice for planning, designing and constructing fixed offshore platforms, RP2A-WSD. Dallas: API; 2000.
- Ministère de l’Equipement du Logement et des Transports. Fascicule 62, Titre V: Règles techniques de conception et de calcul des fondations des ouvrages de génie civil; 1993.
- Zhang, X.; Liu, C.; Ye, J. Model Test Study of Offshore Wind Turbine Foundation under the Combined Action of Wind Wave and Current. Applied Sciences (Switzerland) 2022, 12. [Google Scholar] [CrossRef]
- Li, C.; Xiao, Y.; Liu, J.; Lin, Q.; Zhang, T.; Liu, J. The Impact of Scour on Laterally Loaded Piles Bored and Socketed in Marine Clay. Journal of Marine Science and Engineering 2022, 10. [Google Scholar] [CrossRef]
- Bourgeois, E.; Rakotonindriana, M. H. J.; Le Kouby, A.; Mestat, P.; Serratrice, J. F. Three-dimensional numerical modelling of the behaviour of a pile subjected to cyclic lateral loading. Computers and Geotechnics 2010, 37, 999–1007. [Google Scholar] [CrossRef]
- Pedone, G.; Kontoe, S.; Zdravković, L.; Jardine, R. J.; Vinck, K.; Liu, T. Numerical modelling of laterally loaded piles driven in low-to-medium density fractured chalk. Computers and Geotechnics 2023, 156, 105252. [Google Scholar] [CrossRef]
- Georgiadis, K.; Sheil, B. Effect of torsion on the undrained limiting lateral resistance of piles in clay. Geotechnique 2020, 70, 700–710. [Google Scholar] [CrossRef]
- Cui, J.; Rao, P.; Li, J.; Chen, Q.; Nimbalkar, S. Time-dependent evolution of bearing capacity of driven piles in clays. Proceedings of the Institution of Civil Engineers—Geotechnical Engineering 2023, 176, 402–418. [Google Scholar] [CrossRef]
- Terzaghi, K. Evaluation of Coefficients of Subgrade Reaction. Géotechnique 1955, 5, 297–326. [Google Scholar] [CrossRef]
- He, R.; Zhang, J.; Zheng, J. Vertical dynamic interaction factors for offshore thin-walled pipe piles. Computers and Geotechnics 2022, 145, 104656. [Google Scholar] [CrossRef]
- Broms, B. B. Lateral Resistance of Piles in Cohesive Soils. Journal of the Soil Mechanics and Foundations Division 1964, 90, 27–63. [Google Scholar] [CrossRef]
- Wang, M.; Wang, M.; Cheng, X.; Lu, Q.; Lu, J. A New p–y Curve for Laterally Loaded Large-Diameter Monopiles in Soft Clays. Sustainability (Switzerland) 2022, 14. [Google Scholar] [CrossRef]
- Li, Q.; Askarinejad, A.; Gavin, K. Lateral response of rigid monopiles subjected to cyclic loading: centrifuge modelling. Proceedings of the Institution of Civil Engineers—Geotechnical Engineering 2022, 175, 426–438. [Google Scholar] [CrossRef]
- Liu, P.; Chen, L.; Huawei, C.; Jiang, C. A method for predicting lateral deflection of large-diameter monopile near clay slope based on soil-pile interaction. Computers and Geotechnics 2021, 135, 104180. [Google Scholar] [CrossRef]
- Winkler, E. Theory of elasticity and strength. Czechoslovakia: Dominicus 1867, 77–93. [Google Scholar]
- ASTM A6/A6M: Standard Specification for General Requirements for Rolled Structural Steel Bars, Plates, Shapes, and Sheet Piling. 2001.
- UNE-EN ISO 22476-2:2005. Geotechnical investigation and testing—Field testing—Part 2: Dynamic probing. 2005.
- UNE-EN ISO 17892-4:2019. Geotechnical investigation and testing—Laboratory testing of soil—Part 4: Determination of particle size distribution (ISO 17892-4:2016).
- EN 13277-2:2011—Soil testing—Shear strength tests—Part 2: Direct shear test.
- Pérez, J. A.; Reyes-Rodríguez, A. M.; Sánchez-González, E.; Ríos, J. D. Experimental and Numerical Flexural–Torsional Performance of Thin-Walled Open-Ended Steel Vertical Pile Foundations Subjected to Lateral Loads. Buildings 2023, 13, 1738. [Google Scholar] [CrossRef]
- Basack, S. A boundary element analysis of soil-pile interaction under lateral cyclic loading in soft cohesive soil. 2008.
- Phoon, K.-K.; Tang, C. Characterisation of geotechnical model uncertainty. Georisk: Assessment and Management of Risk for Engineered Systems and Geohazards 2019, 13, 101–130. [Google Scholar] [CrossRef]
- Phoon, K.-K. Reliability-Based Design in Geotechnical Engineering: Computations and Applications.; CRC Press, Ed.; 2008. [CrossRef]
|
Disclaimer/Publisher’s Note: The statements, opinions and data contained in all publications are solely those of the individual author(s) and contributor(s) and not of MDPI and/or the editor(s). MDPI and/or the editor(s) disclaim responsibility for any injury to people or property resulting from any ideas, methods, instructions or products referred to in the content. |
© 2024 by the authors. Licensee MDPI, Basel, Switzerland. This article is an open access article distributed under the terms and conditions of the Creative Commons Attribution (CC BY) license (http://creativecommons.org/licenses/by/4.0/).
