1. Introduction
Metal oxides are widely studied with respect to their electrochromic behavior and properties for applications such as display devices and smart windows. To decrease the absorbed heat in buildings, electrochromic films have been used as smart windows Electrochromic materials have been applied in energy-effective glazing, automobile sunroofs, smart windows, and mirrors. The structure of a smart window contains an electrochromic material layer (usually metal oxide) sandwiched between a transparent conductive layer and some solid electrolyte. Recently, energy efficiency has been affected and focused on energy solution strategies for utilizing this important field.
The electrochromic process is based on a reversible redox process and characterized by the Coloration Efficiency (CE). The energy-saving windows (smart window), energy storage systems: such as electro-chromic (EC), photochromic and thermochromic have been designed on the same mechanism and both have sandwich device structures, and it was based on the electrochemical reaction of the electrode materials.
Transition metal (Titanium, Tungsten, Nickel, Vanadium, Molybdenum and others) oxide films are the most interesting and most widely studied materials for this purpose. Conventional thin film preparation methods include for instance: chemical methods (spin coating, sol–gel deposition, chemical bath deposition, Langmuir–Blodgett technique, etc.), chemical and physical vapor deposition, electrochemical methods (anodization, plating), see ref. [
1] and references therein.
Nevertheless, relatively few publications studied the possible advantages (higher CE) of the mixtures of different metal-oxides as electrochromic material. The electrochromic effectiveness (the change of light absorption for the same electric charge) can be higher in mixed metal-oxide layers.
Earlier, we performed experiments with mixed metal-oxides and found positive effect in electrochromic behavior. Ismaeel et al [
2] determined the optimal composition of reactive magnetron-sputtered combinatorial mixed layers of Titanium oxide and Tin oxide (TiO
2-SnO
2) for electrochromic purposes. The maximum enhancement in light absorption was found at (30%) TiO
2– (70%) SnO
2 composition.
In other experiments, also combinatorial material synthesis approach has been applied for the binary MoO
3/WO
3 system. By using organic propylene carbonate electrolyte cells in a conventional three-electrode configuration, electrochromic redox reactions have been made. CE data have been evaluated from the primary data plotted against the composition that displayed a characteristic maximum at around 60% MoO
3. The localization of the maximum at 5% accuracy has been allowed in that combinatorial approach [
3].
Many researchers have used SE for pure or combinatorial material investigation [4-11] Fried et al. [
12] have used SE (which is a fast, cost-effective, and non-destructive method) for the investigation and mapping of WO
3-MoO
3 mixed layers after sputtering. The used optical models were useful to achieve the composition map and thickness map of the sample layers.
The objective of this work was to investigate the electrochromic effectiveness (the change of light absorption for the same electric charge) of SnO
2-ZnO mixed layers in a wide compositional range and the CE has been determined, too. Using metal atoms with different diameters in the layers would have a positive effect. According to our best knowledge, ZnO was investigated only as a dopant in other electrochromic metal-oxide [
13] while SnO
2 or SnO
2-metal-oxide [14, 15] mixtures were studied only as photocatalytic materials. There is no such publication where pure SnO
2 or ZnO-SnO
2 mixtures are studied as electrochromic material.
This paper aims to assess the results of investigations of such materials showing the enhanced electrochromic behavior compared to the pure materials. One can expect that mixing metal atoms with different diameters in the layers can enhance the CE.
2. Materials and Methods
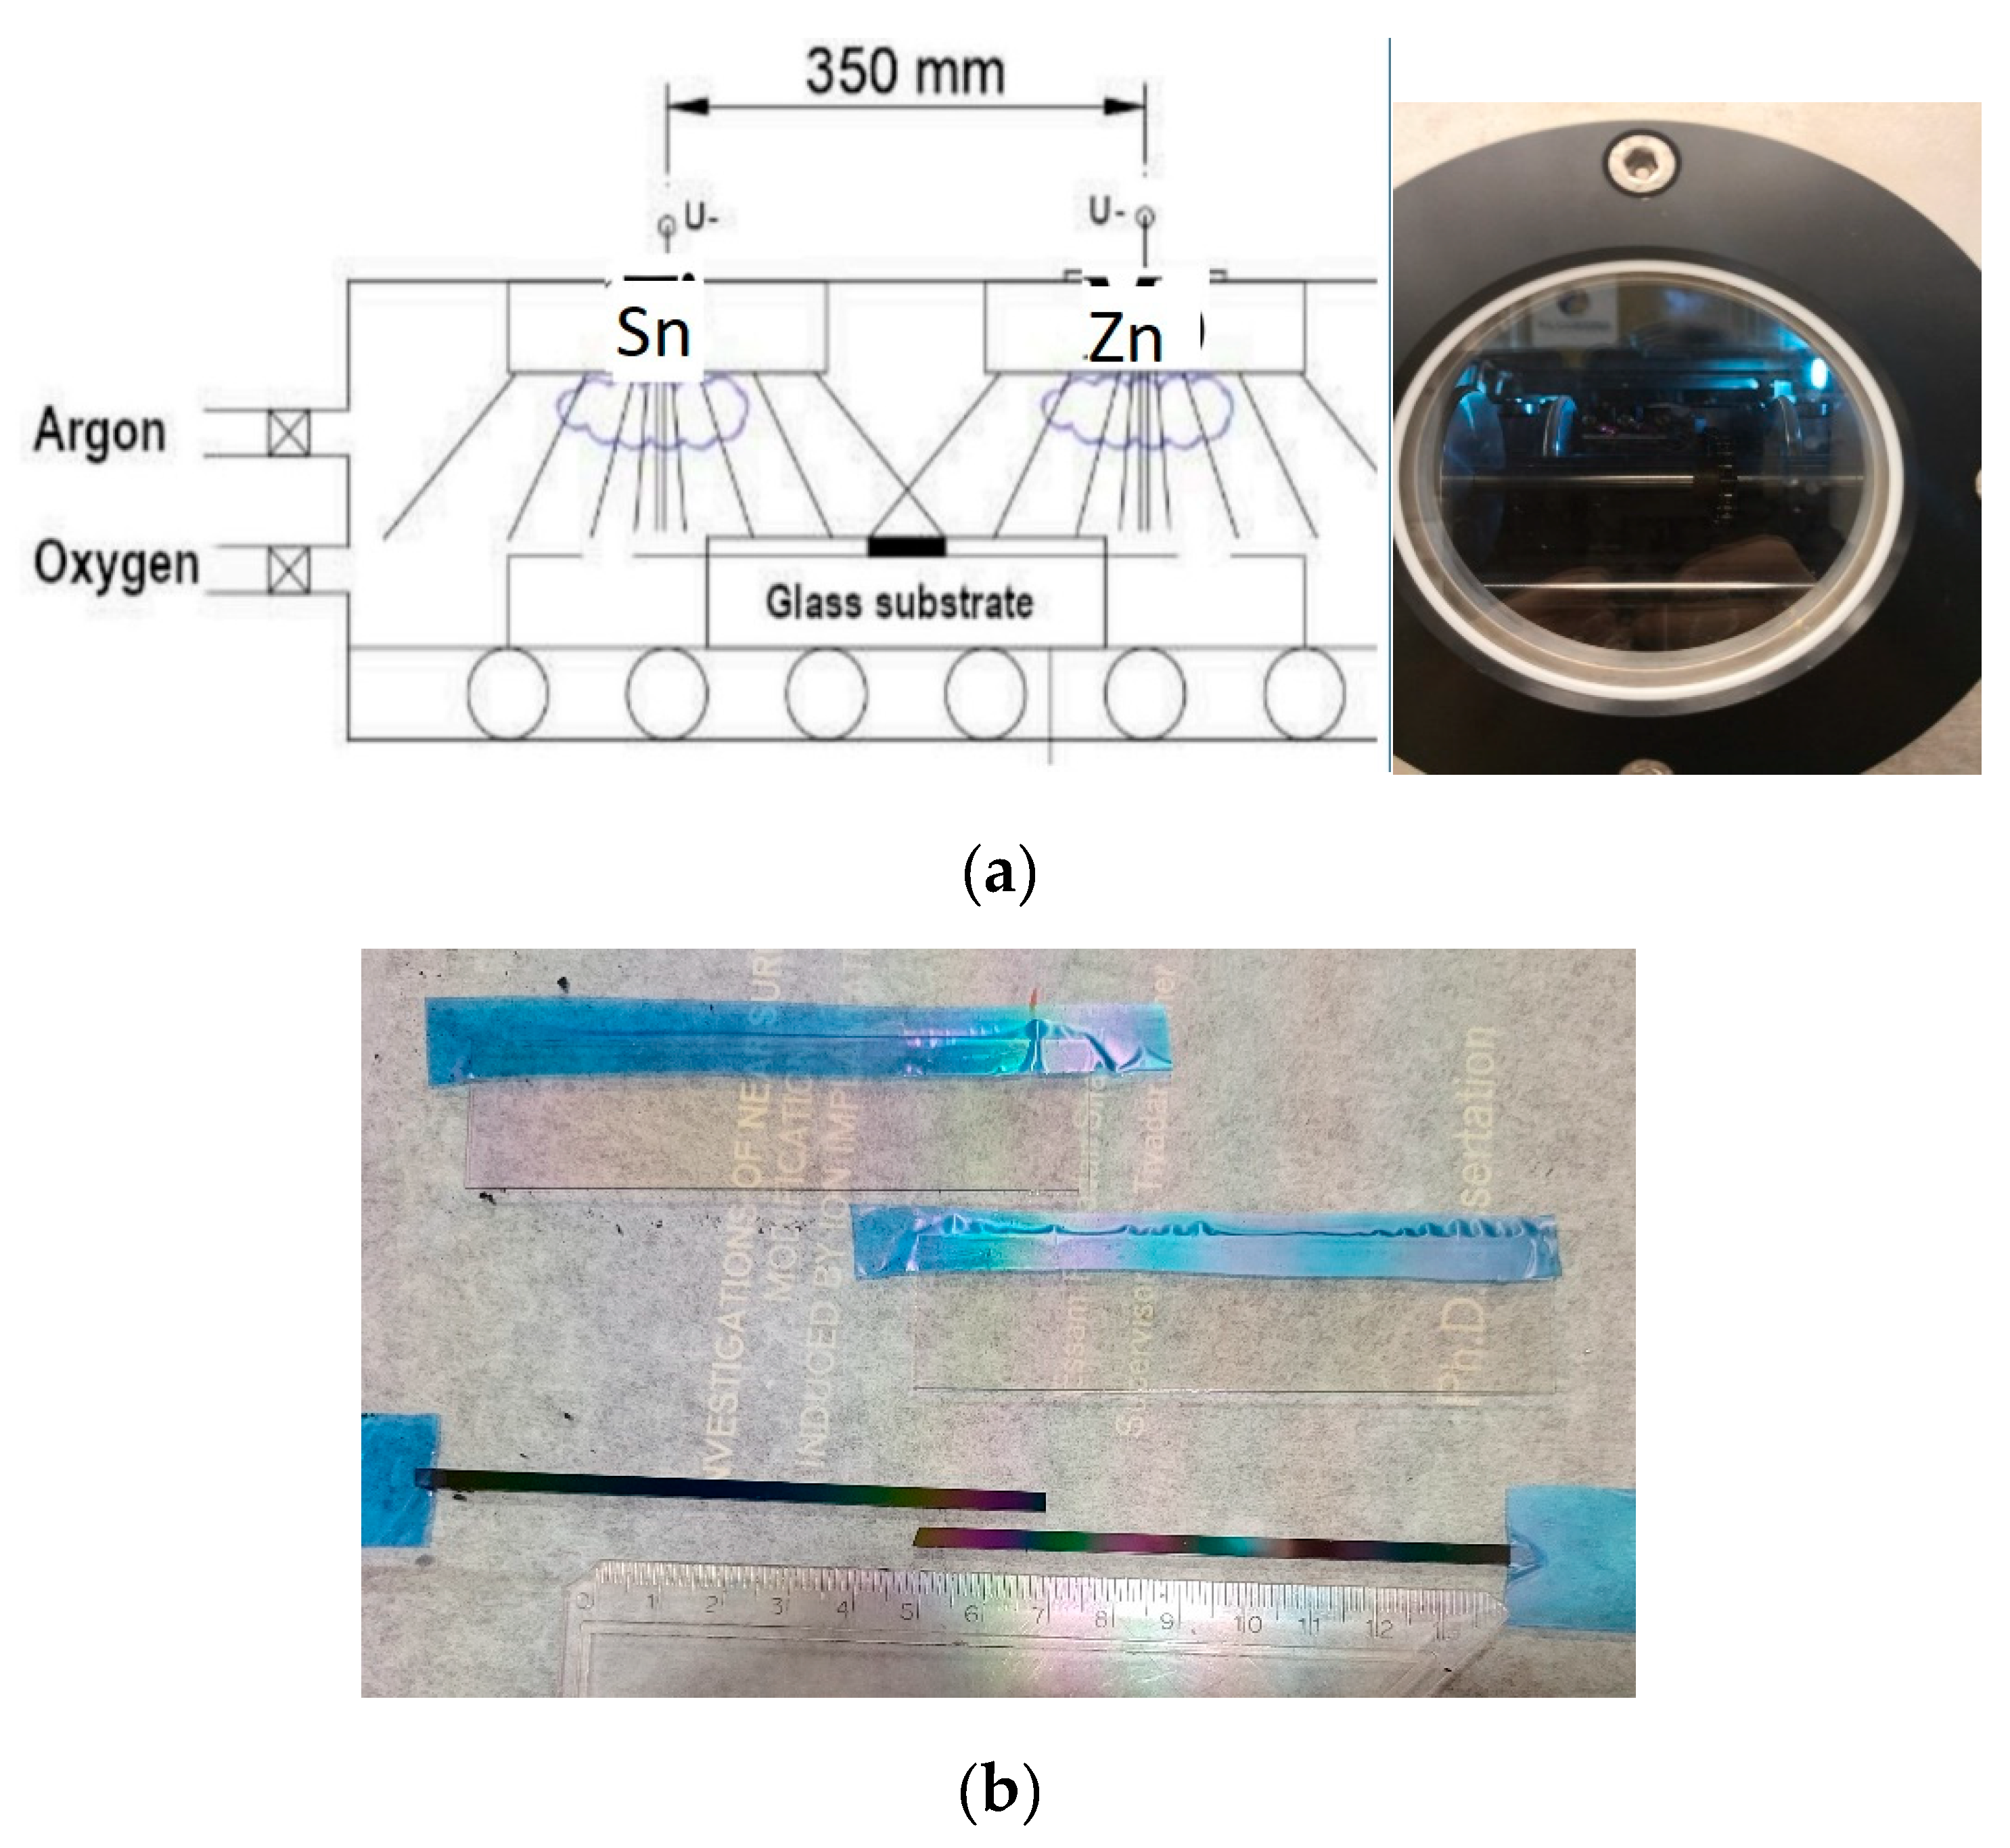
Optimal composition of reactive magnetron-sputtered combinatorial mixed layers of Tin oxide and Zinc oxide (Sn
xZn
1-x) have been determined where (where 0 < x < 1) for electrochromic purposes. Metallic Sn and Zn targets were put separately from each other, and Indium-Tin-Oxide (ITO) covered glass and Si-probes on a glass substrate (30 cm × 30 cm) were moved under the two separated targets (Sn and Zn) in a reactive Argon-Oxygen (Ar-O
2) gas mixture, see
Figure 1(a). The Tin-Zinc-oxide layers were deposited onto ITO covered 100x25 mm size glass surfaces. Layer depositions were made by reactive sputtering in an (Ar + O
2) gas mixture at ~2 × 10
−4 Pa base pressure and at ~10
−1 Pa process pressure. The target - substrate working distance was 6 cm. 30 sccm/s Ar and 70 sccm/s O
2 volumetric flow rates were applied in the magnetron sputtering chamber. Plasma powers of the Sn and Zn metal targets were selected as 800 and 1000 W respectively. Samples were moved back and forth at 25 cm/s of walking speed between the Sn and Zn targets and a mixed oxide film was deposited onto the ITO surface, see
Figure 1(b). 5 min cooling interrupt was applied after every 50 walking cycles.
Spectroscopic Ellipsometry (SE) is an optical characterization technique with high-accuracy [
16]. We used the combinatorial approach to map our mixed metal oxides as it was established in our earlier paper [
12]. Different optical models, such as Effective Medium Approximation (EMA) and 2-Tauc-Lorentz Oscillator (2T–L), have been used to achieve the composition map and thickness map of the sample layers. We used SE similar manner to determine the composition map and thickness map of our Sn-Zn combinatorial layers.
To determine the optimal composition for the best CE value, the layers were deposited onto ITO-covered glass. The composition map and thickness map were measured on the Si-probes, see
Figure 1 (b). We checked the resulted compositional map on the Si-probes
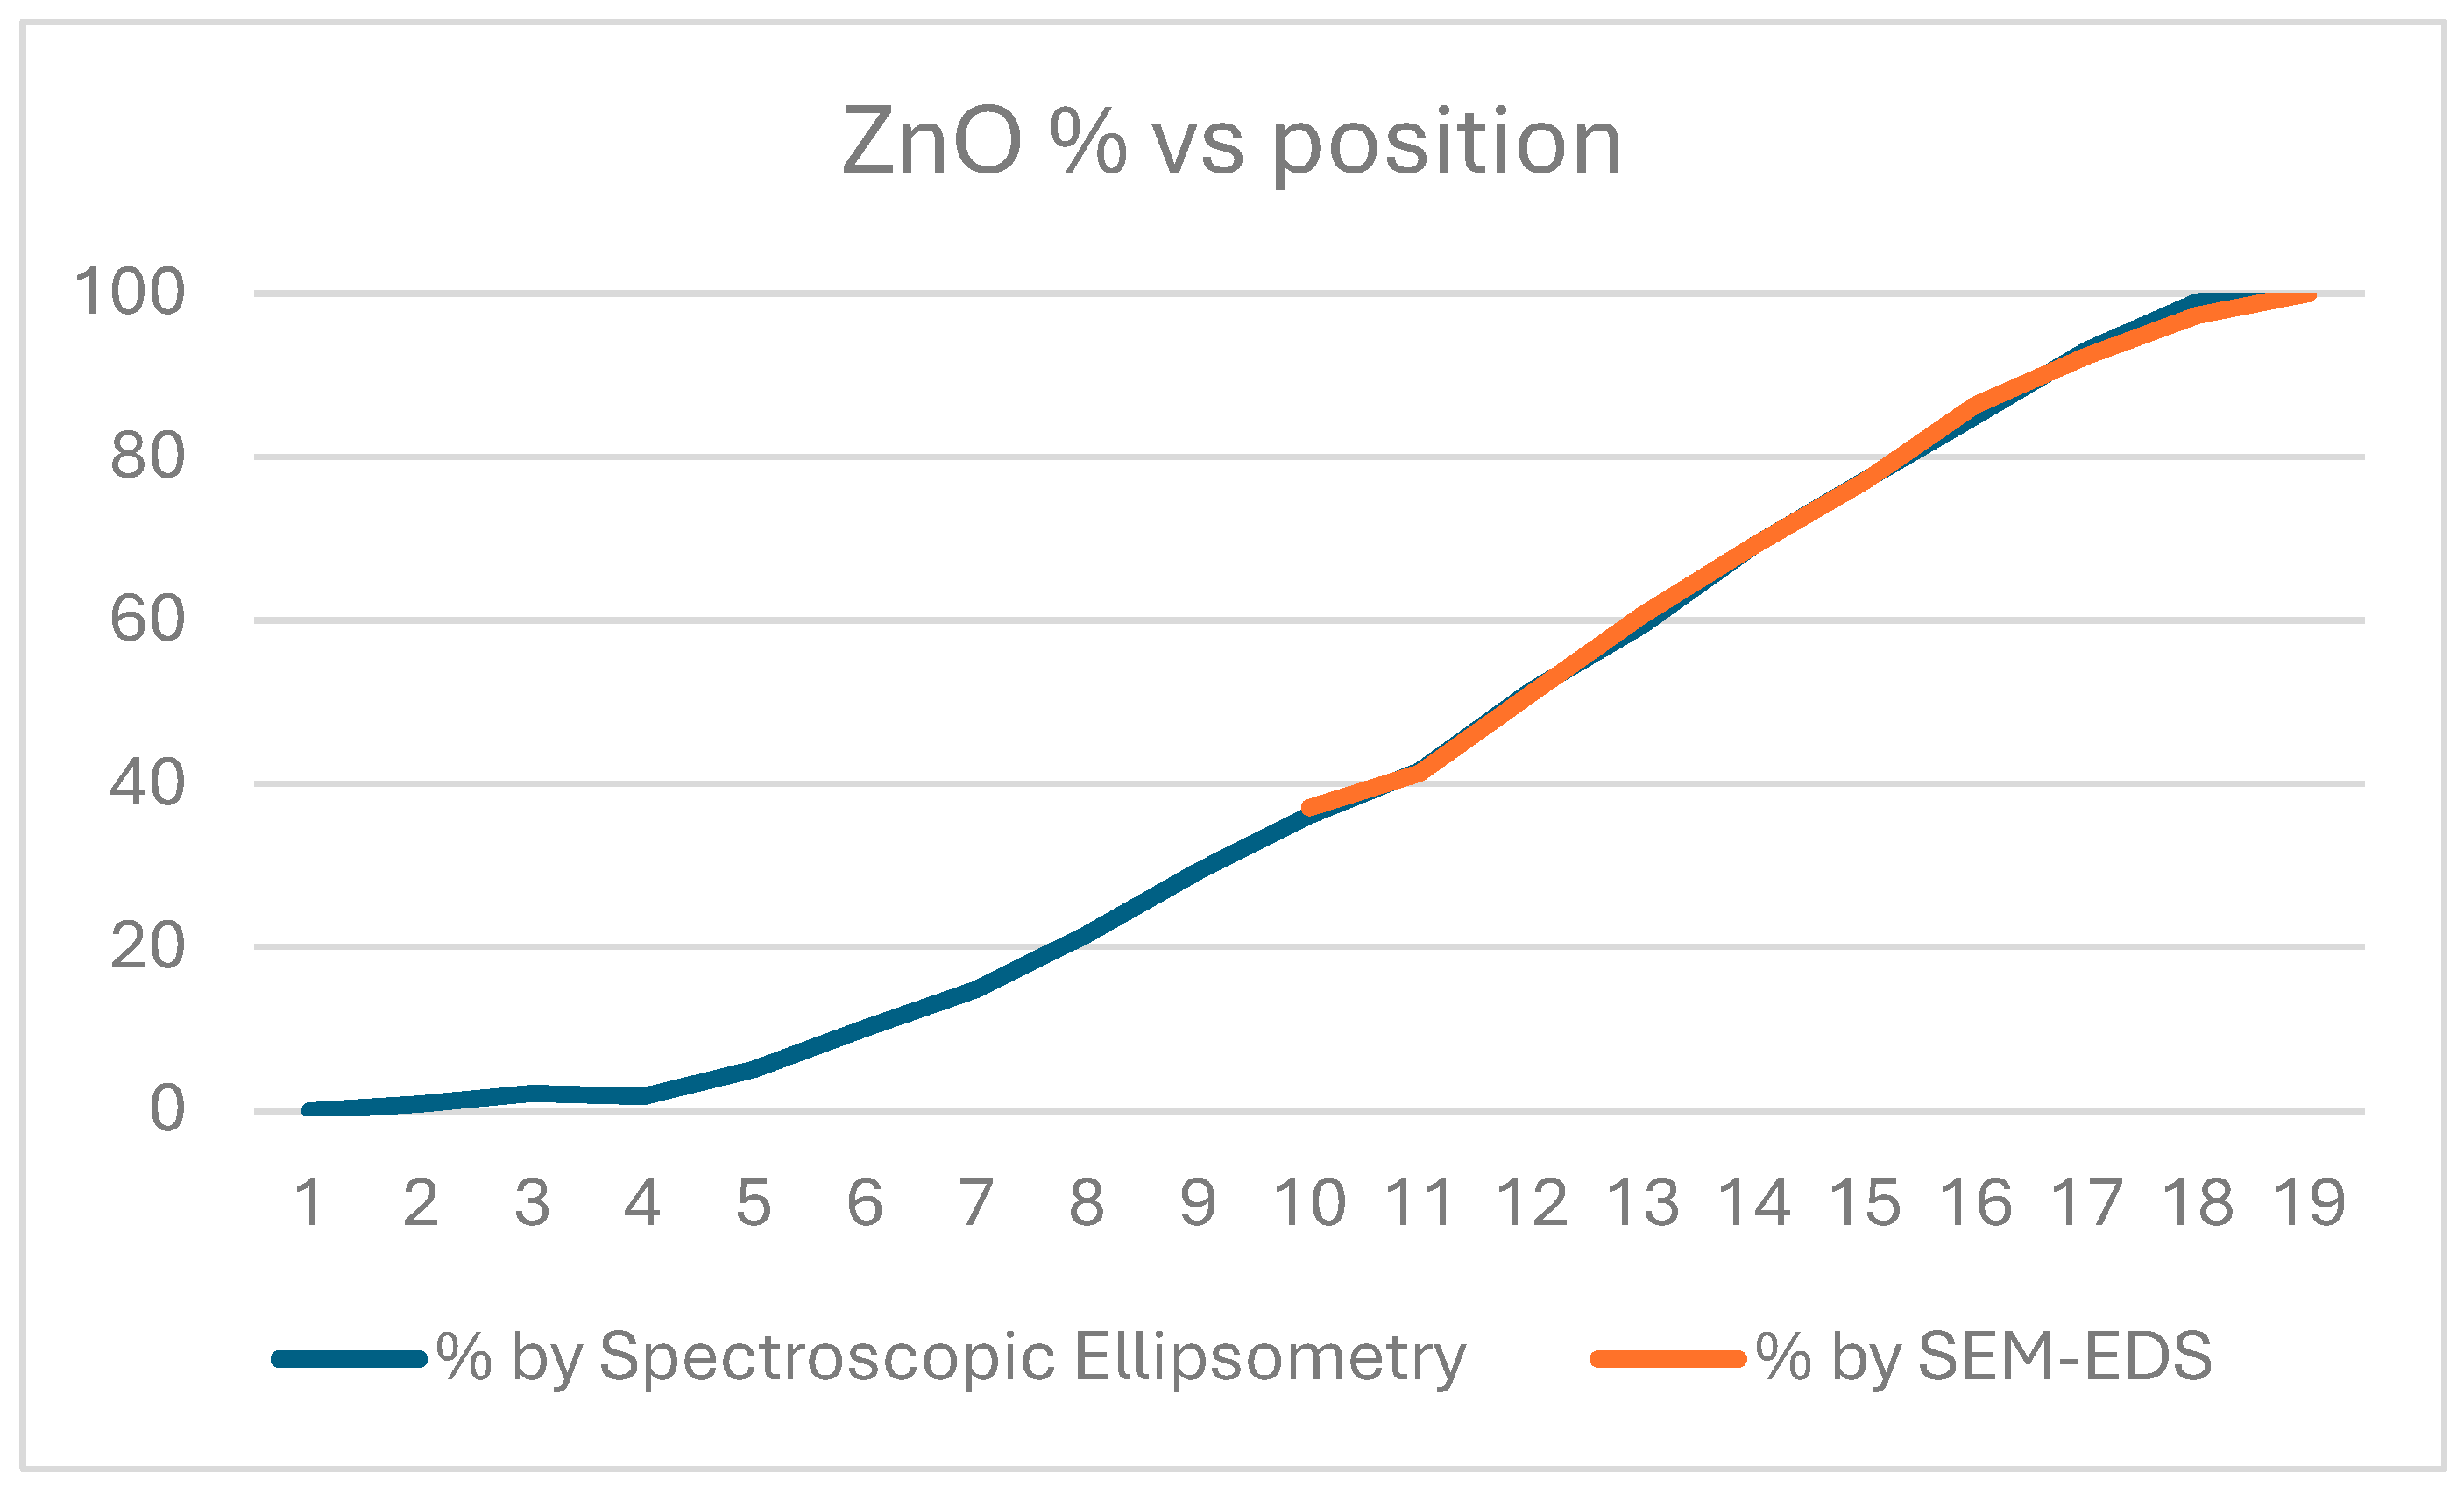
Figure 1 (b) by using SEM with EDS, see
Figure 3.
The CE η is given by the following equation:
where Qi is the electrical charge inserted into the electrochromic material per unit area, ΔOD is the change of optical density, Tb is the transmittance in the bleached state, and Tc is the transmittance in the colored state. The unit of CE is cm2/C.
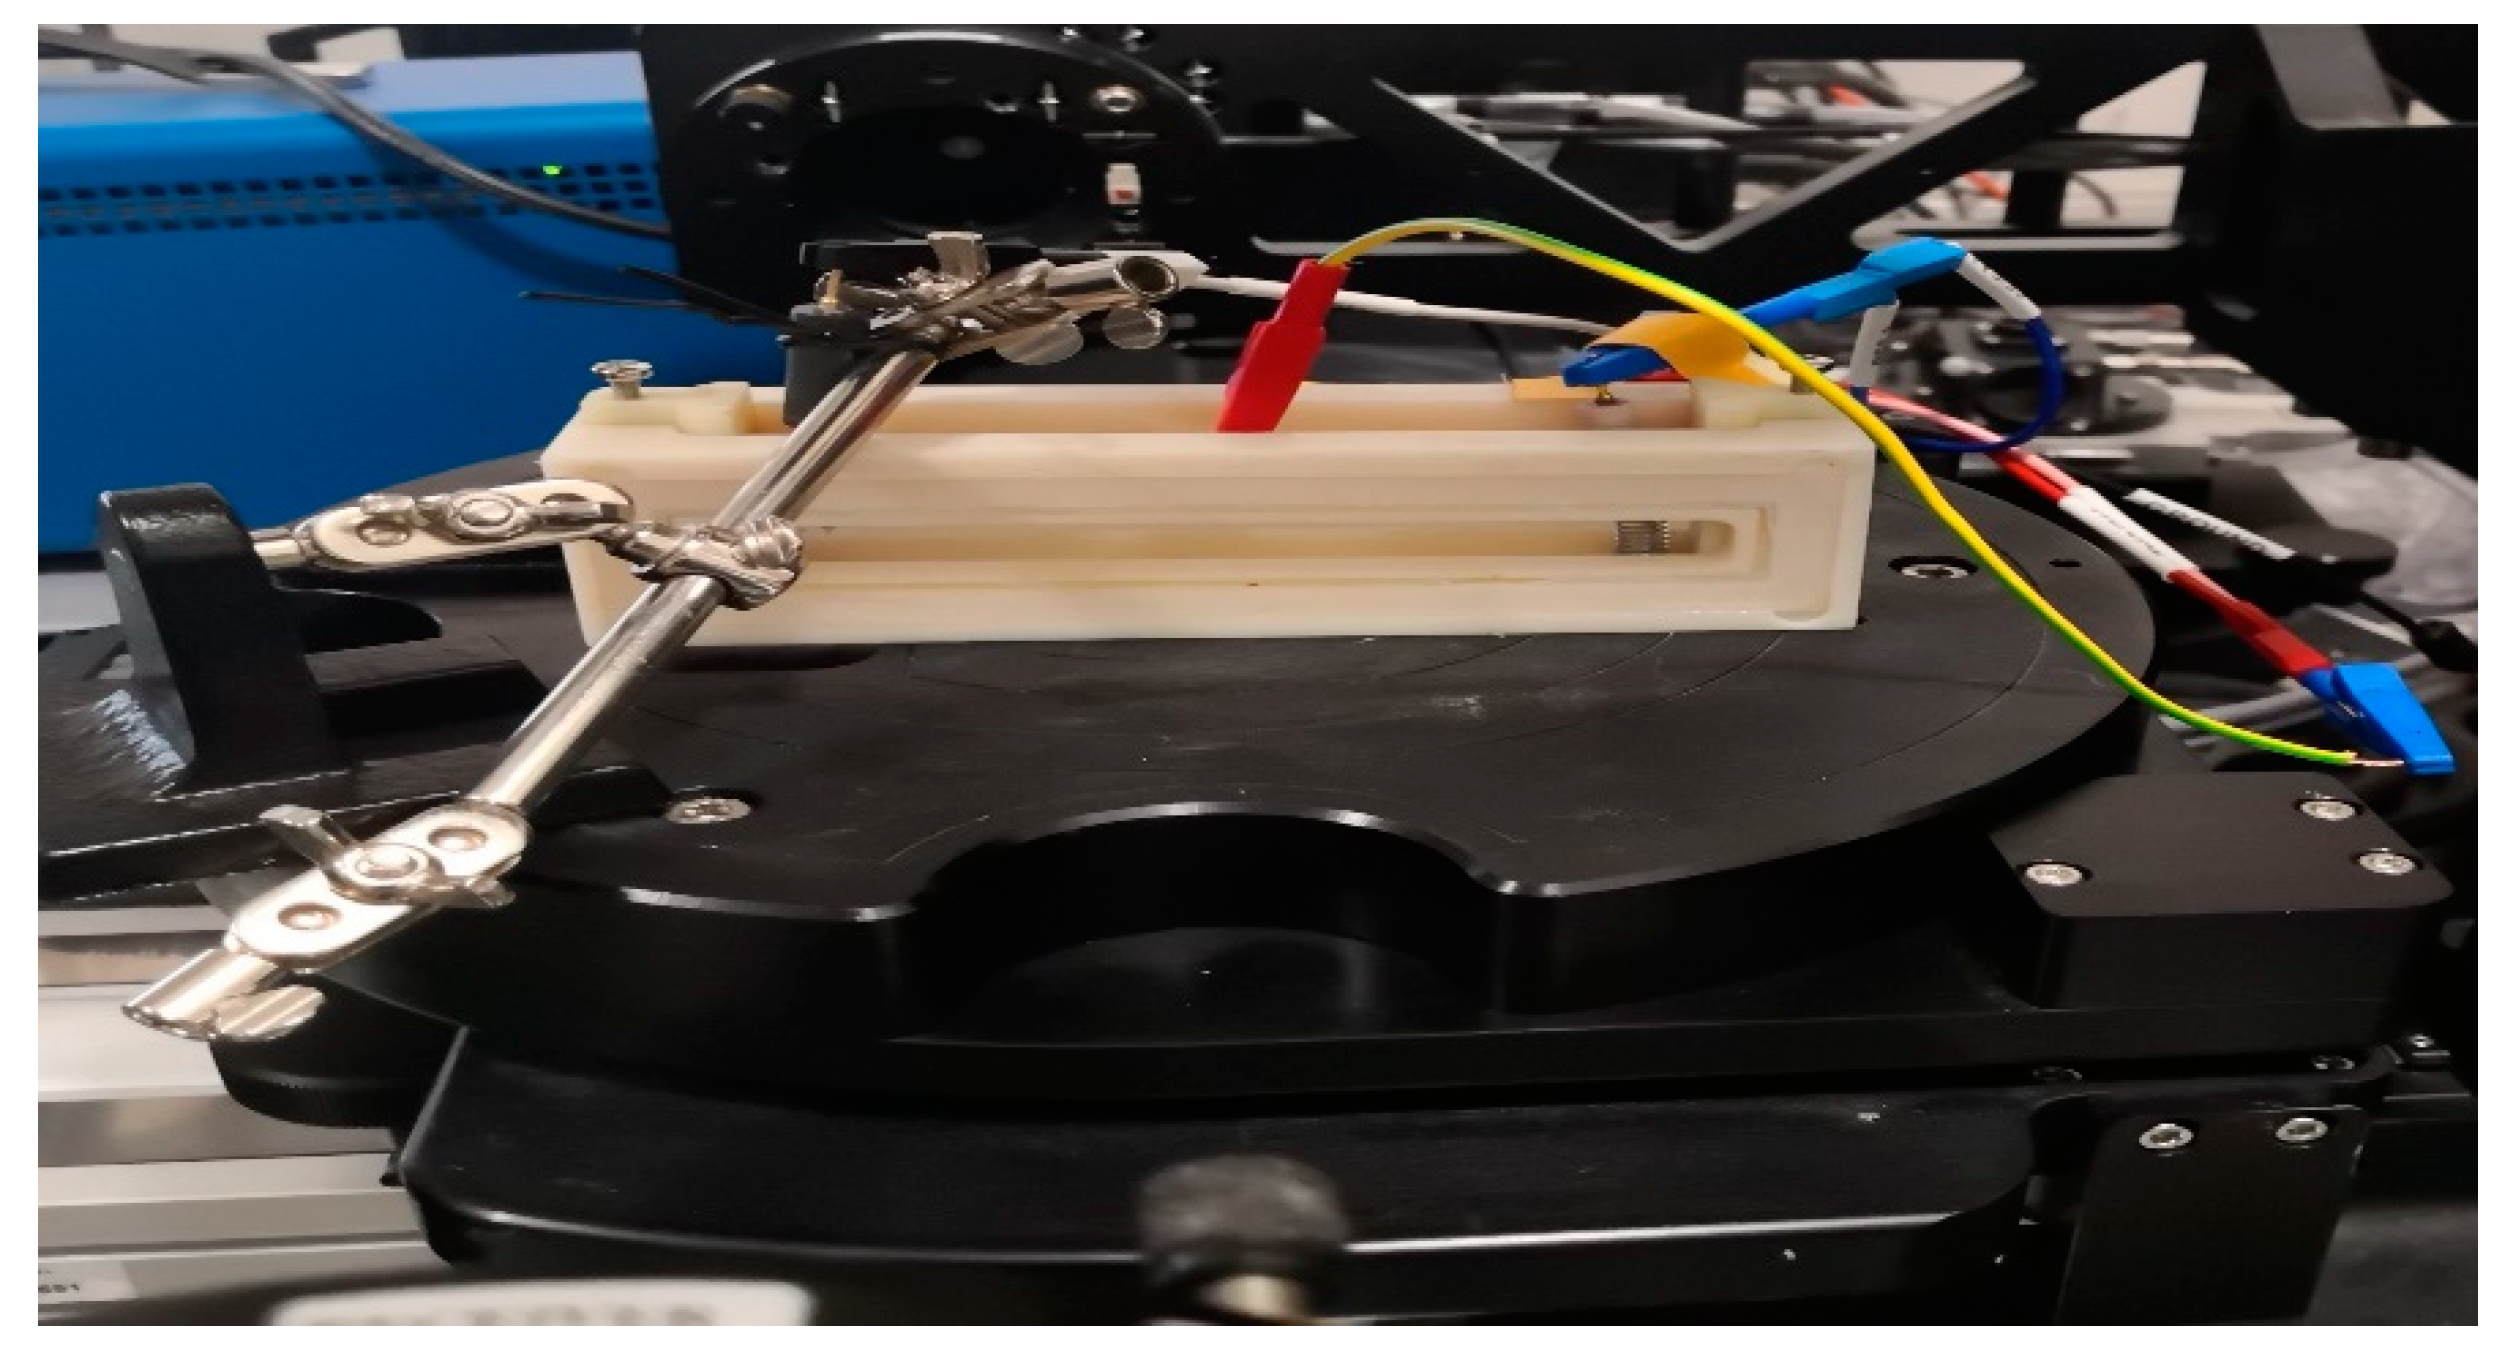
CE has been determined in a transmission electrochemical cell, see
Figure 2. The cell was filled with 1M lithium perchlorate (LiClO
4) / propylene carbonate electrolyte. A 5 mm width masked (Sn-Zn oxide-free) ITO stripe of the slides remained above the liquid level allowing direct electric contact of the cell. A Pt wire counter electrode was placed into the electrolyte alongside with a reference electrode. This arrangement was a fully functional electrochromic cell. The applied current was controlled through the cell using a Farnell U2722 Source Measurement Unit (SMU). Constant current was applied through coloration and bleaching cycles of the electrochromic layer and simultaneous spectral transmission measurements were performed by using the Woollam M2000 spectroscopic ellipsometer into transmission mode.
The precision of the Sn/Zn ratio is 2 %, while the precision of the position is 1 mm.
Figure 3.
ZnO ratio measured on the Si-probes by SE and SEM-EDS.
Figure 3.
ZnO ratio measured on the Si-probes by SE and SEM-EDS.
3. Result
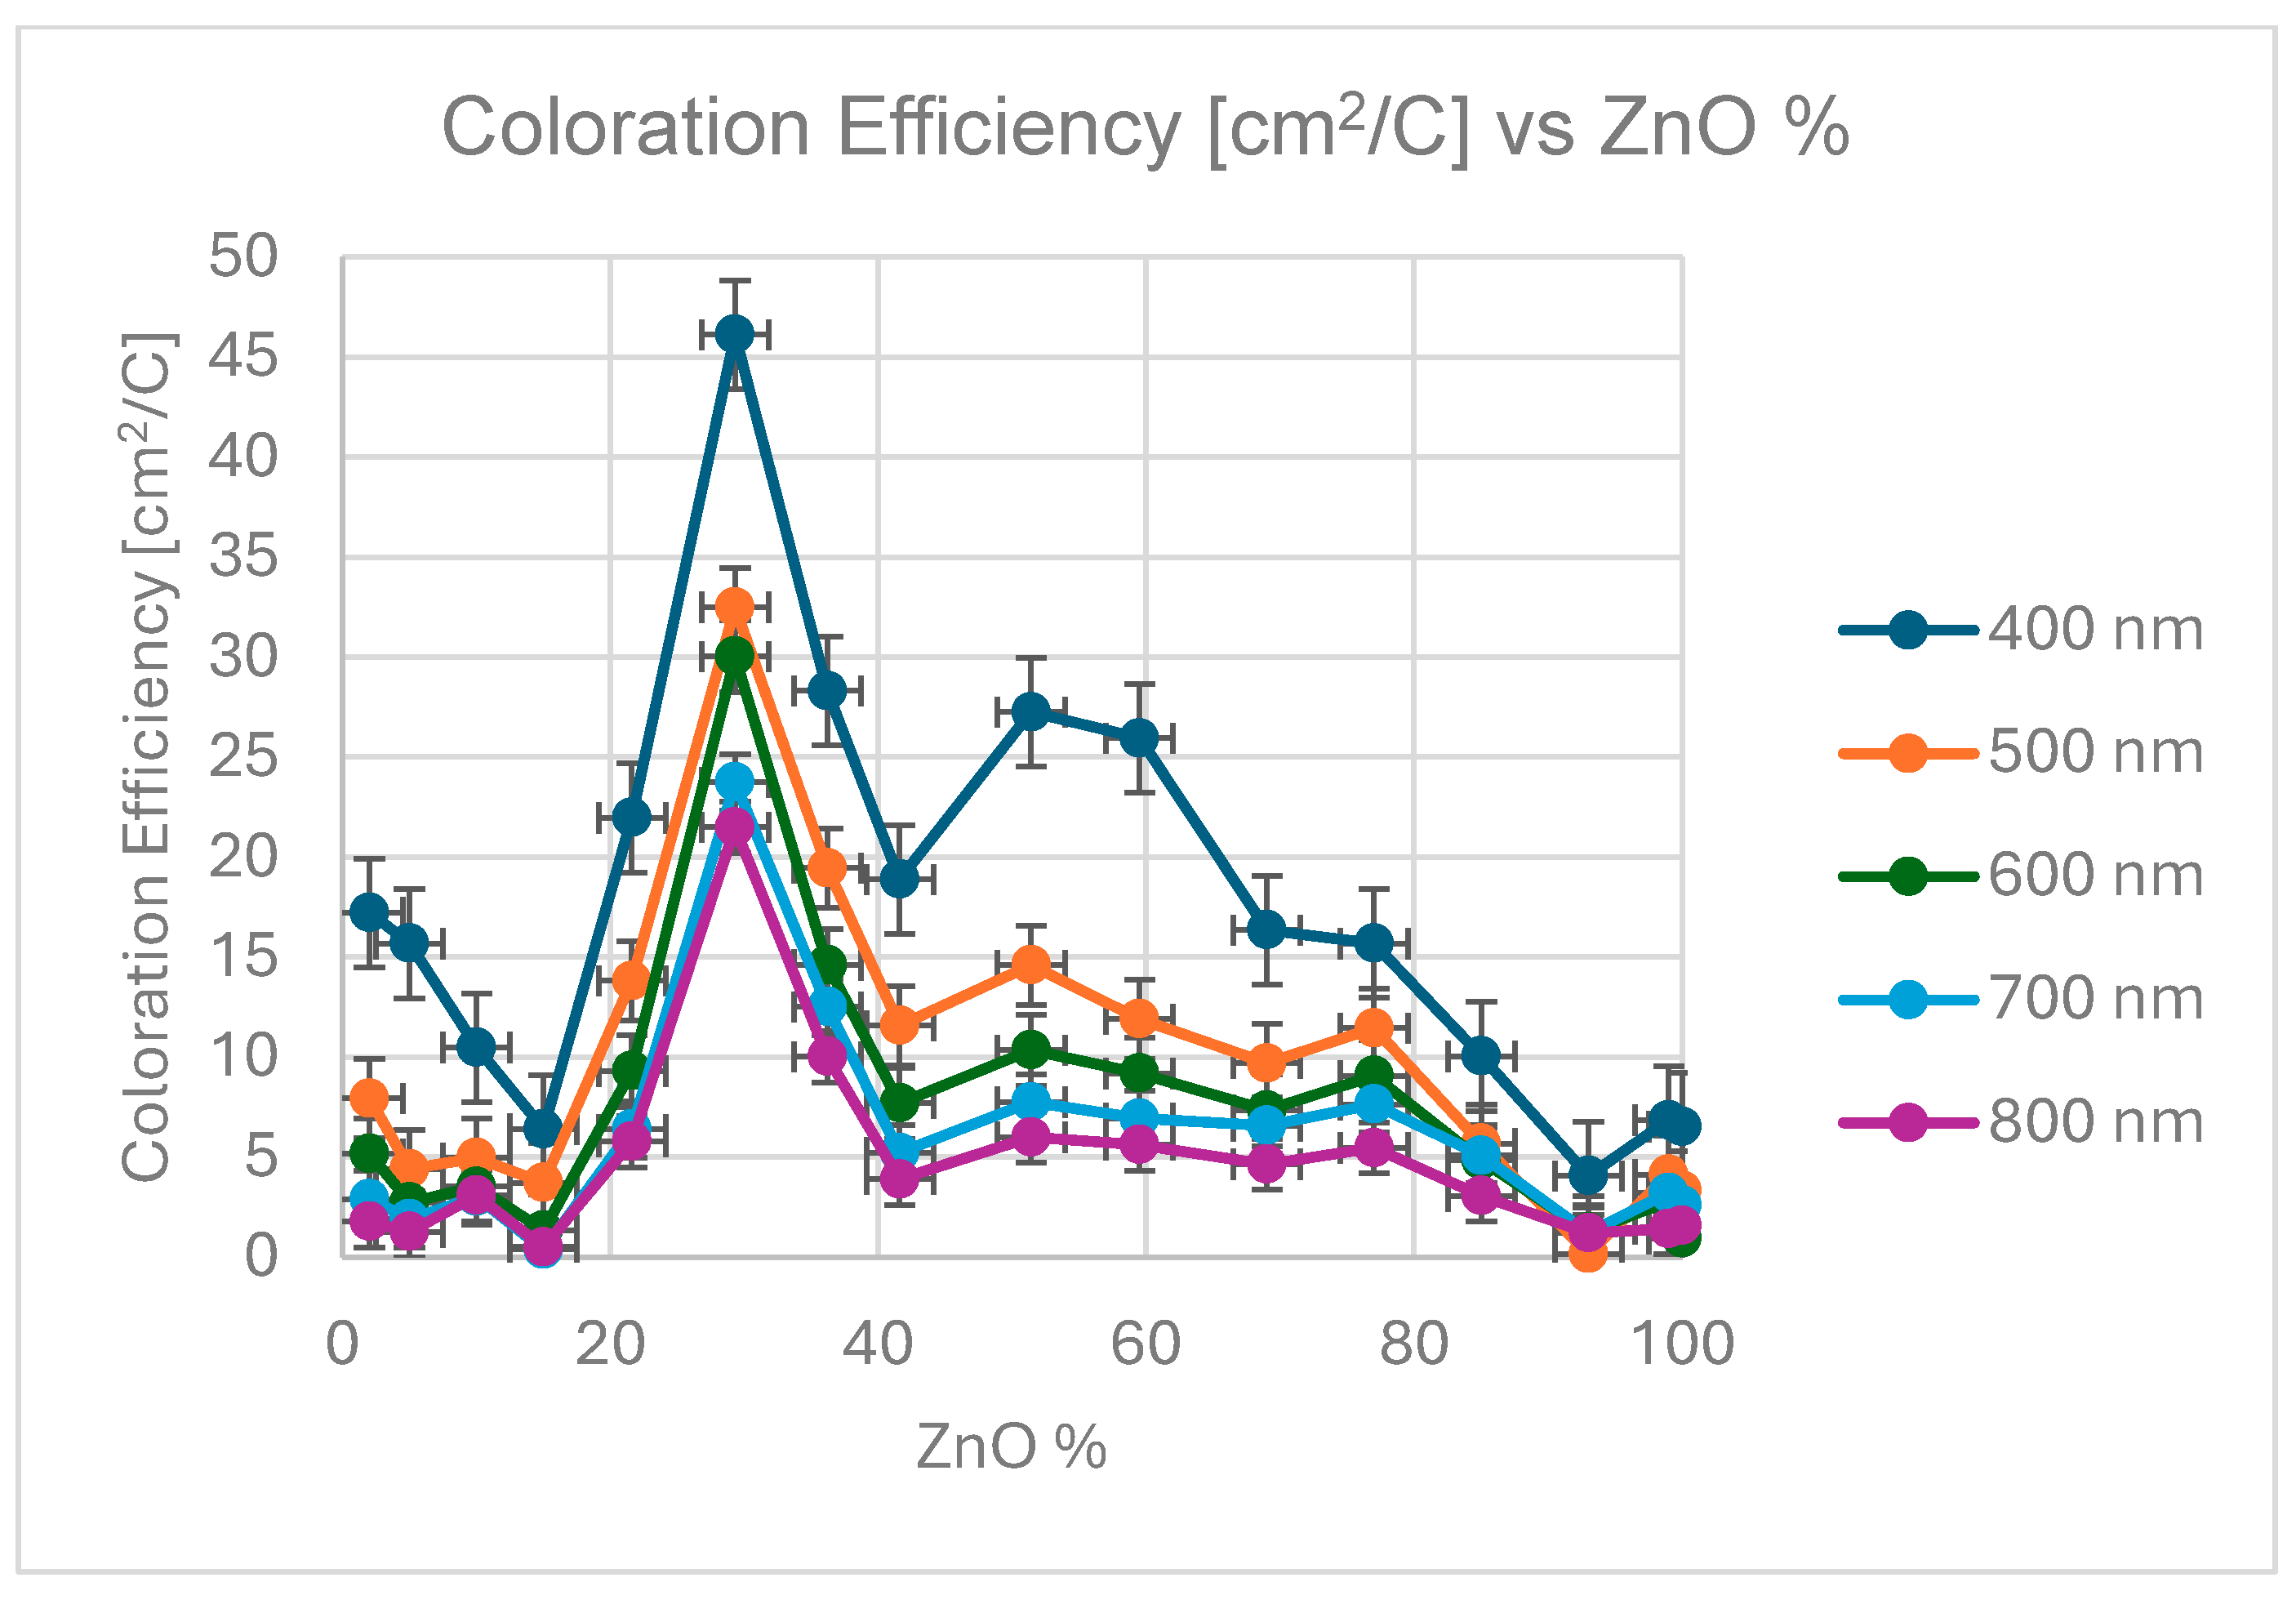
The main criterion of the EC device performance is CE. Transmittance changes were directly measured during the coloration process, while the charge was calculated from the integral of the current vs. time data, and the electrolyte wetted area of the sample.
Figure 4 shows the calculated CE data as a function of MoO3 fraction of the layer (individual color coded curves represent different wavelengths), while
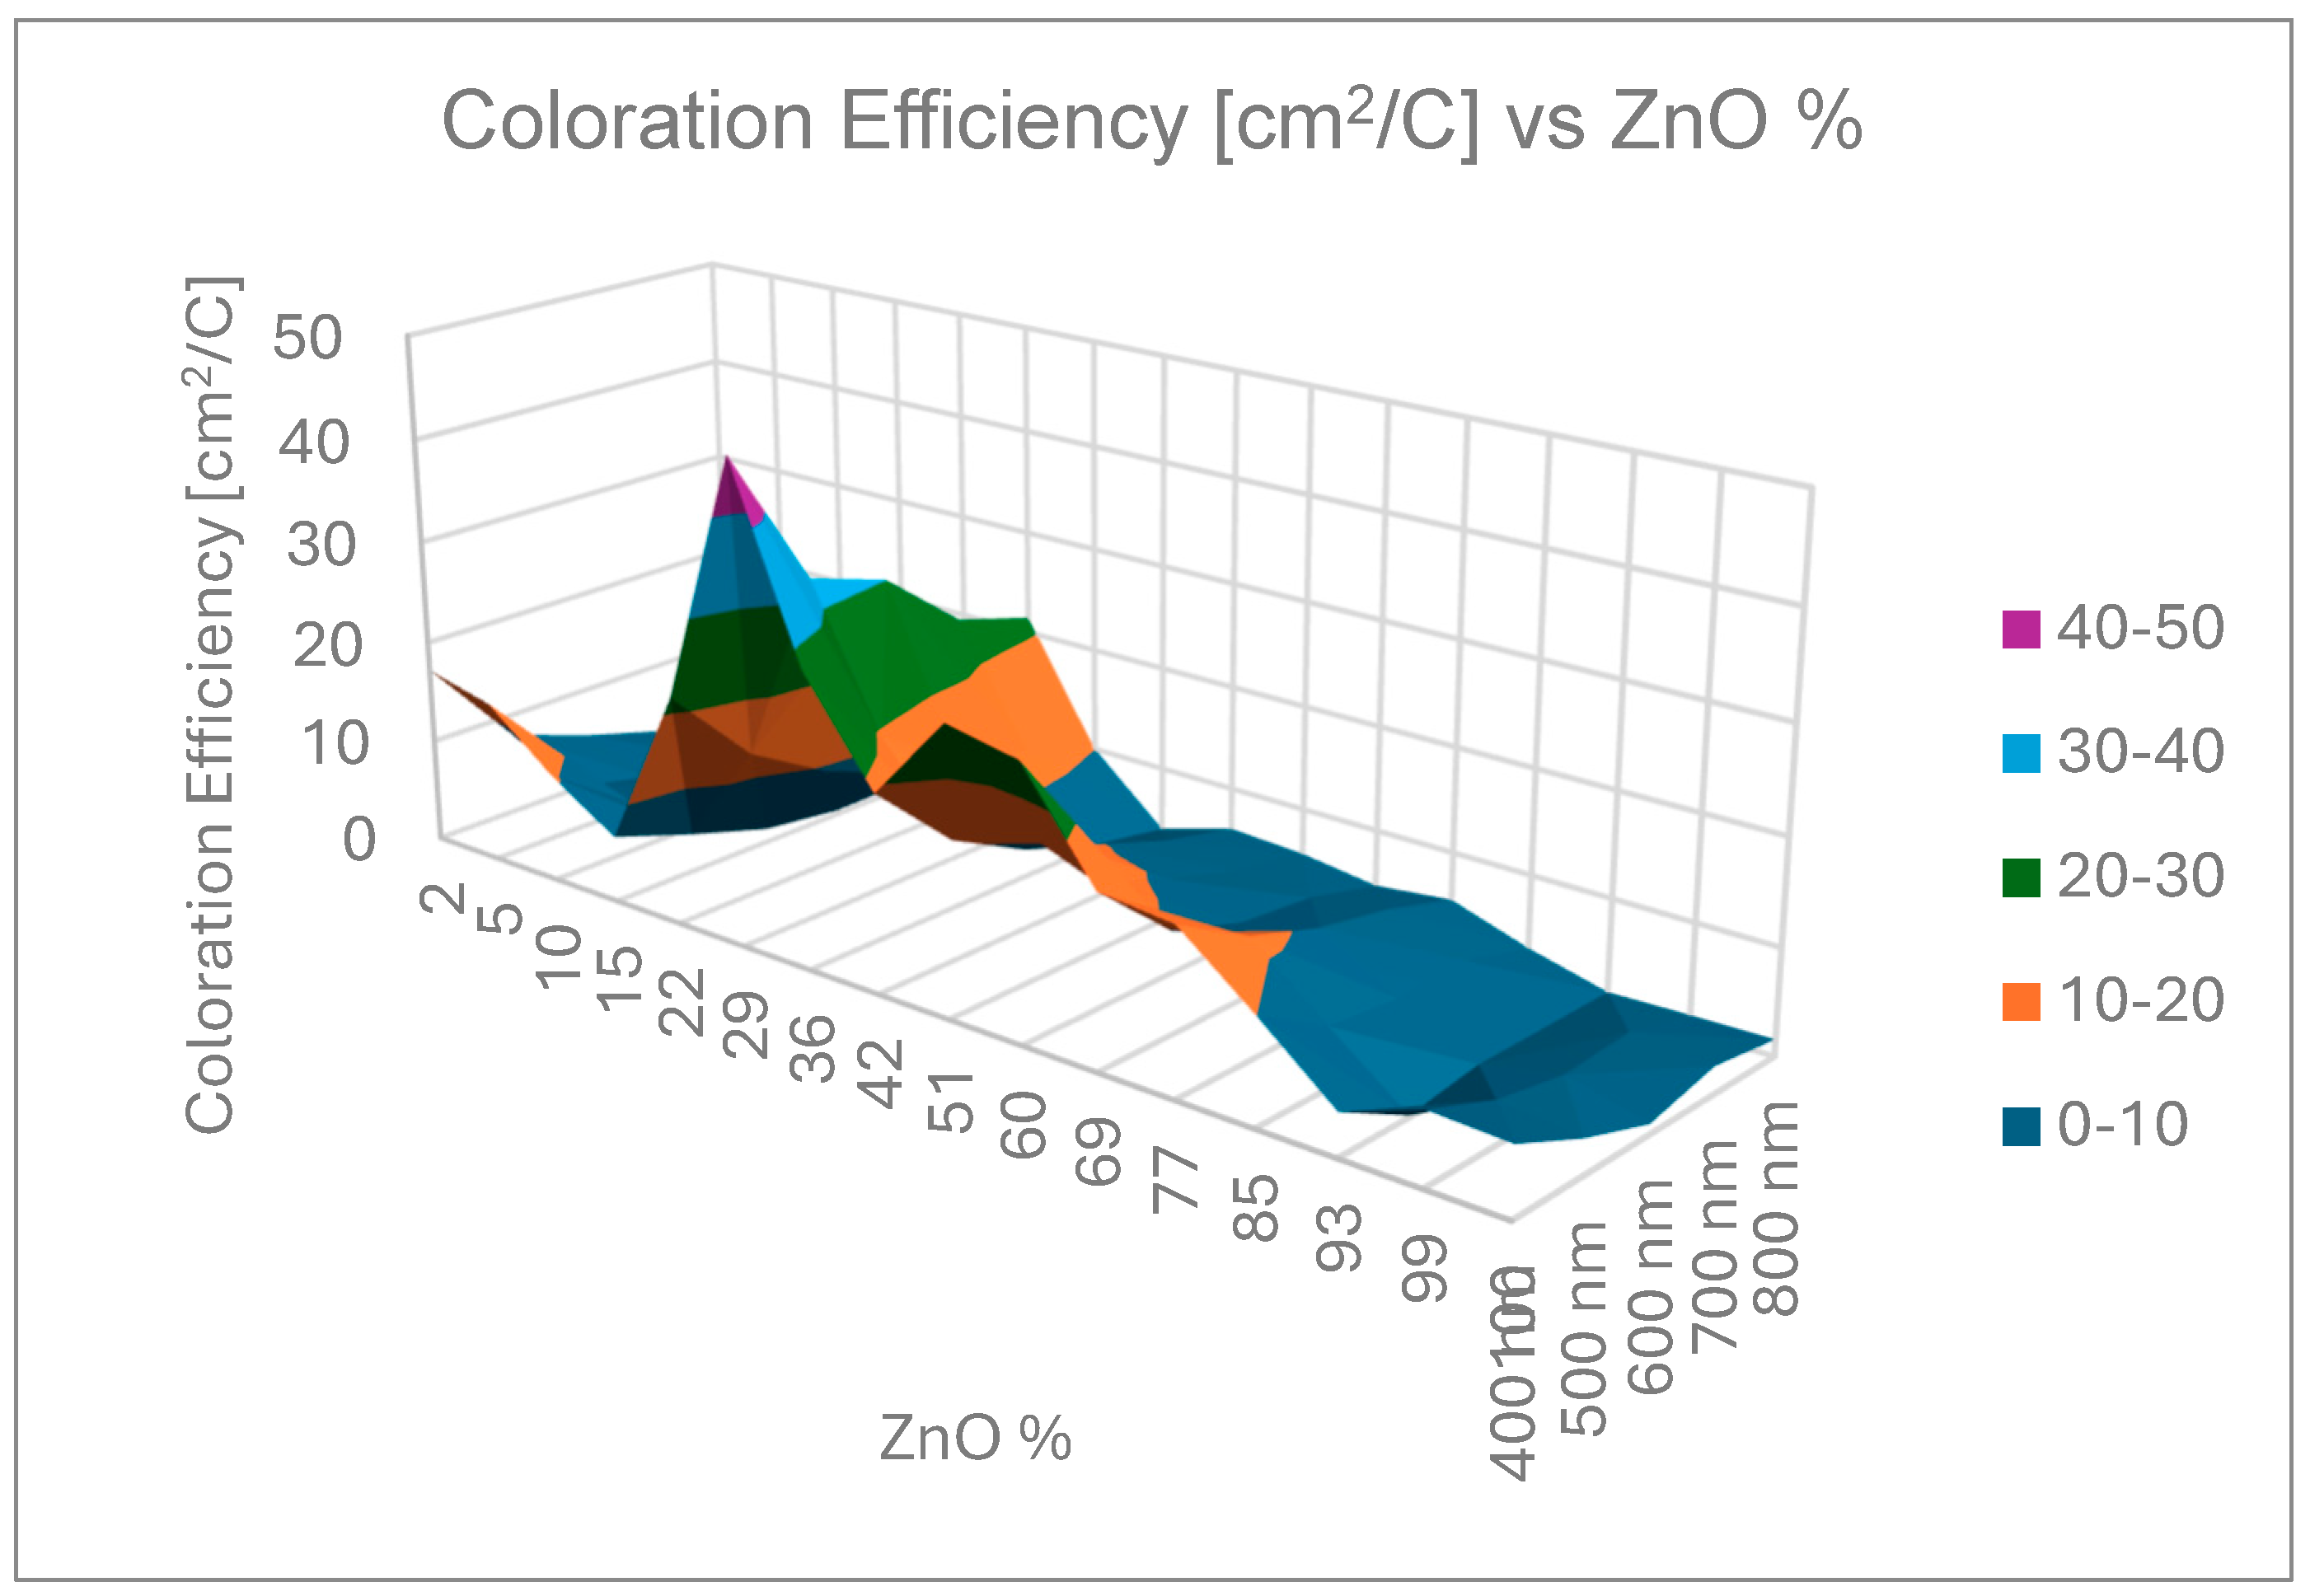
Figure 5 is a 3D representation of the data. Individual points were calculated from the average of three independent measurements. Error is estimated as 3 %, calculated on the basis of the accuracy of sample positioning in the measuring cell and the spot size of the optical beam. The calculated data are given in
Table 1 according to equation (1).
To check the position dependent composition, SEM with EDS has been used, see
Figure 3.
4. Discussion
The CE maximum have been founded at 29 % Zn for each wavelength between 20-50 cm
2/C. This 29 % is very close to optimum value of 30 % in the case of TiO
2-SnO
2 mixture which was investigated in our earlier paper [
2]. We expected that mixing metal atoms with different diameters in the layers can enhance the CE. This 70-30 % mixture of different metal oxides seems to be the optimum for the Li-diffusion in these sputtered materials.
5. Conclusions
We could optimize the CE of mixed Tin oxide and Zn oxide (SnO2-ZnO) layer deposited by reactive magnetron sputtering. We prepared combinatorial samples by moving the samples under the Sn and Zn sputtering targets in a reactive Argon-Oxygen (Ar-O2) gas mixture.
By using this combinatorial process, every compositions (from 0 to 100%) were achieved in the same chamber after one sputtering. The mixed metal oxides showed at least 3 times better CE values than the pure oxides.
CE has been considered as the important parameter in this study. The maximum value of the CE is between 46 and 21 cm2/C between the wavelength 400 and 800 nm at ~ 71 % - 29 % Sn-Zn ratio.
Author Contributions
Conceptualization, Z.L., N.T.I. and M.F.; Methodology, Z.L.; Software, P.P.; Investigation, N.T.I., Z.L., P.P. and M.F.; Resources, P.P.; Data curation, N.T.I., Z.L. and M.F.; Writing—original draft, Z.L., N.T.I.; Writing—review & editing, P.P. and M.F.; Supervision, Z.L.; Funding acquisition, P.P. and M.F. All authors have read and agreed to the published version of the manuscript.
Funding
Authors are grateful to Noemi Szasz and Tamas Kolonits for the SEM–EDS measurements. This work has been funded by NKFIH OTKA K 143216 and 146181 projects. Project TKP2021-EGA-04 has been implemented with the support provided by the Ministry of Innovation and Technology of Hungary from the National Research, Development, and Innovation Fund, financed under the TKP2021 funding scheme. The work in frame of the 20FUN02 ‘‘POLight’’ project has received funding from the EMPIR programme, co-financed by the Participating States and from the European Union’s Horizon 2020 research and innovation programme. Noor Taha Ismaeel is grateful for the Stipendium Hungaricum scholarship.
Institutional Review Board Statement
Not applicable
Informed Consent Statement
Not applicable
References
- Granqvist, C.G. Electrochromics for smart windows: oxide-based thin films and devices. Thin Solid Films 2014, 564, 1–38. [Google Scholar] [CrossRef]
- Ismaeel, N.T.; Lábadi, Z.; Petrik, P.; Fried, M. Investigation of Electrochromic, Combinatorial TiO2-SnO2 Mixed Layers by Spectroscopic Ellipsometry Using Different Optical Models. Materials 2023, 16, 4204. [Google Scholar] [CrossRef] [PubMed]
- Zoltán Lábadi, Dániel Takács, Zsolt Zolnai, Péter Petrik and Miklós Fried, Compositional Optimization of Sputtered WO3/MoO3 Films for High Coloration Efficiency, Materials 2024, 17(5), 1000. [CrossRef]
- Zimmer, A.; Gilliot, M.; Broch, L.; Boulanger, C.; Stein, N.; Horwat, D. Morphological and chemical dynamics upon electrochemical cyclic sodiation of electrochromic tungsten oxide coatings extracted by in situ ellipsometry. Applied Optics 2020, 59, 3766–3772. [Google Scholar] [CrossRef] [PubMed]
- Hale, J.S.; DeVries, M.; Dworak, B.; Woollam, J.A. Visible and infrared optical constants of electrochromic materials for emissivity modulation applications. Thin Solid Film 1998, 313, 205–209. [Google Scholar] [CrossRef]
- Sauvet, K.; Rougier, A.; Sauques, L. Electrochromic WO3 thin films active in the IR region. Sol. Energy Mater. Sol. Cells 2008, 92, 209–215. [Google Scholar] [CrossRef]
- Shan, A.; Fried, M.; Juhasz, G.; Major, C.; Polgár, O.; Németh, Á.; Petrik, P.; Dahal, L.R.; Chen, J.; Huang, Z. High-speed imaging/mapping spectroscopic ellipsometry for in-line analysis of roll-to-roll thin-film photovoltaics. IEEE J. Photovolt. 2014, 4, 355–361. [Google Scholar] [CrossRef]
- Koirala, P.; Tan, X.; Li, J.; Podraza, N.J.; Marsillac, S.; Rockett, A.; Collins, R.W. Mapping spectroscopic ellipsometry of CdTe solar cells for property-performance correlations. In Proceedings of the 2014 IEEE 40th Photovoltaic Specialist Conference (PVSC), Denver, CO, USA, 8–13 June 2014; pp. 674–679. [Google Scholar] [CrossRef]
- Dahal, L.R.; Li, J.; Stoke, J.A.; Huang, Z.; Shan, A.; Ferlauto, A.S.; Wronski, C.R.; Collins, R.W.; Podraza, N.J. Applications of real-time and mapping spectroscopic ellipsometry for process development and optimization in hydrogenated silicon thin-film photovoltaics technology. Sol. Energy Mater. Sol. Cells 2014, 129, 32–56. [Google Scholar] [CrossRef]
- Aryal, P.; Pradhan, P.; Attygalle, D.; Ibdah, A.-R.; Aryal, K.; Ranjan, V.; Marsillac, S.; Podraza, N.J.; Collins, R.W. Real-time, in-line, and mapping spectroscopic ellipsometry for applications in Cu (in Ga) Se metrology. IEEE J. Photovolt. 2014, 4, 333–339. [Google Scholar] [CrossRef]
- Petrik, P.; Fried, M. Mapping and Imaging of Thin Films on Large Surfaces: A review. Phys. Status Solidi 2022, 219, 2100800. [Google Scholar] [CrossRef]
- Fried, M.; Bogar, R.; Takacs, D.; Labadi, Z.; Horvath, Z.E.; Zolnai, Z. Investigation of Combinatorial WO3-MoO3 Mixed Layers by Spectroscopic Ellipsometry Using Different Optical Models. Nanomaterials 2022, 12, 2421. [Google Scholar] [CrossRef] [PubMed]
- Fei Wang, Jia Jia, Wei Zhao, Lan Zhang, Huizhong Ma, Na Li, Yunlong Chen, Preparation and electrochromic properties of NiO and ZnO-doped NiO thin films, Materials Science in Semiconductor Processing, Volume 151, 15 November 2022, 106986. [CrossRef]
- Sharma, S.; Kumar, N.; Makgwane, P.R.; Chauhan, N.S.; Kumari, K.; Rani, M.; Maken, S. TiO2/SnO2 nano-composite: New insights in synthetic, structural, optical and photocatalytic aspects. Inorg. Chim. Acta 2022, 529, 120640. [Google Scholar] [CrossRef]
- Rajput, R.B.; Jamble, S.N.; Kale, R.B. A review on TiO2/SnO2 heterostructures as a photocatalyst for the degradation of dyes and organic pollutants. J. Environ. Manag. 2022, 307, 114533. [Google Scholar] [CrossRef] [PubMed]
- Fujiwara, H. Spectroscopic Ellipsometry Principles and Applications; John Wiley & Sons: Hoboken, NJ, USA, 2007, Print ISBN 9780470016084; Online ISBN 9780470060193.
|
Disclaimer/Publisher’s Note: The statements, opinions and data contained in all publications are solely those of the individual author(s) and contributor(s) and not of MDPI and/or the editor(s). MDPI and/or the editor(s) disclaim responsibility for any injury to people or property resulting from any ideas, methods, instructions or products referred to in the content. |
© 2024 by the authors. Licensee MDPI, Basel, Switzerland. This article is an open access article distributed under the terms and conditions of the Creative Commons Attribution (CC BY) license (http://creativecommons.org/licenses/by/4.0/).

