1. Introduction
The global push towards sustainable development has placed Zero-Energy Buildings (ZEBs) [
1] at the forefront of efforts to reduce energy consumption in the built environment. ZEBs [
2] are designed to produce as much energy as they consume over a given period, typically on an annual basis, primarily through on-site renewable energy sources [
3]. Achieving such a balance requires the integration of advanced energy systems, including photovoltaic (PV) solar panels, energy storage solutions, and intelligent energy management systems [
4] that collectively contribute to energy self-sufficiency [
5].
1.1. Background and Significance
Energy consumption in buildings accounts for a substantial portion of global energy use, with commercial and residential buildings responsible for nearly 40% of total energy demand [
6]. This high level of consumption underscores the critical need for energy-efficient buildings that can operate independently of the grid or minimize their reliance on external energy sources. In this context, ZEBs emerge as a key solution, not only for reducing energy consumption but also for mitigating the impact of volatile energy prices and enhancing energy security [
7].
The building which serves as focal point of this study is a 4,600 square meter office building with approximately 2,300 square meter of air conditioned space. The building itself is designed as energy efficiency building according to Thailand Building Energy Code regulation an operational office building. Locate in northern Thailand with and annual average of 17-19 MJ/m2.day. This building is equipped with a 160kW solar photovoltaic (PV) system and a 50kW energy storage system (ESS). These systems provide a practical setting for exploring the dynamic interplay between energy generation, storage, and consumption within a ZEB framework [
8]. The building exemplifies the potential of ZEBs to contribute to regional and global energy goals [
9], particularly in areas with favorable conditions for renewable energy generation.
Despite the promising potential of ZEBs, achieving and maintaining energy balance in such buildings presents several challenges. Energy generation from renewable sources, particularly solar PV, is inherently variable and dependent on environmental conditions such as sunlight availability, weather patterns, and seasonal changes. Simultaneously, energy consumption in buildings fluctuates based on occupant behavior, time of day, and operational demands. These fluctuations necessitate the integration of intelligent energy management systems capable of optimizing energy use and storage to ensure that energy generation matches or exceeds consumption over time [
8,
9,
10,
11].
1.2. Research Objectives
The primary objective of this research is to optimize the performance of the building as a ZEB by integrating advanced solar energy systems with battery storage and behavioral analysis for predictive analysis. This study seeks to explore the following specific goals:
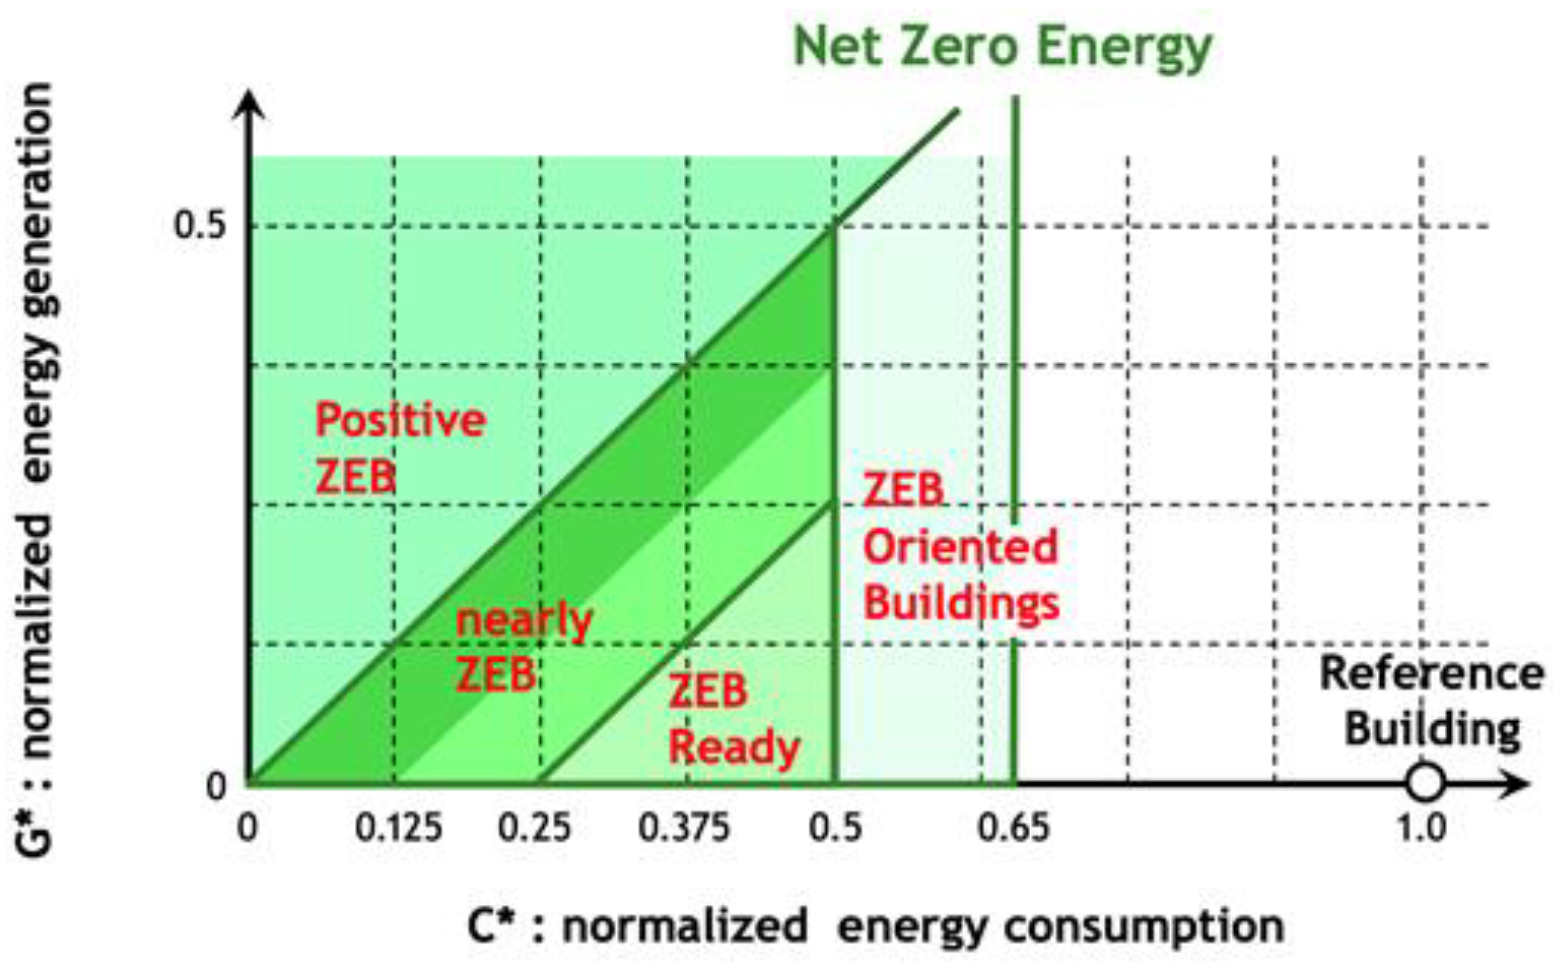
1. Optimization of Energy Storage Systems (ESS): The research aims to optimize the Energy Storage System (ESS) capacity within the building to enhance overall energy efficiency and minimize energy losses. This optimization process is closely aligned with the energy performance classification system developed by the Guideline for ZEB definition and evaluation by SHASE Japan [
12], which categorizes buildings into four distinct zones based on energy usage reduction: ZEB Oriented Buildings (35%-50%), ZEB Ready (50%-75%), Nearly ZEB Level 2 (75%-87.5%), and Nearly ZEB Level 1 (87.5%-100%). By simulating various ESS capacities ranging from 0 to 500 kWh, the study seeks to identify the optimal capacity that will propel the building towards the highest level of energy performance, Nearly ZEB Level 1, where the building becomes nearly self-sufficient with minimal energy losses.
Figure 1.
Net Zero Energy Classification from the SHASE (The Society of Heating, Air-Conditioning and Sanitary Engineers of Japan).
Figure 1.
Net Zero Energy Classification from the SHASE (The Society of Heating, Air-Conditioning and Sanitary Engineers of Japan).
2. Impact of Solar PV System and Energy Storage Capacity: In addition to optimizing the ESS, the study examines the impact of different solar PV system capacities (160, 180, 200, and 250kW) on the building’s energy management. The SHASE classification system is also applied here to evaluate how varying the PV system size influences the building’s progress through the energy performance zones. The goal is to determine the most effective combination of solar PV capacity and ESS that will maximize energy efficiency and allow the building to achieve Nearly ZEB Level 1 status. By understanding the interaction between solar generation and storage, the research provides insights into how different system configurations can either hinder or advance the building’s journey towards optimal energy performance.
3. Behavioral Analysis: The research aggregates energy consumption data to simulate appliance usage patterns based on typical working day behaviors and appliance percentage ratios. This analysis aims to uncover critical insights into the consumption patterns of HVAC systems [
13], lighting [
14], and electronic devices [
15], thereby enabling targeted energy-saving interventions [
16].
1.3. Methodological Approach
To achieve these objectives, the research employs a comprehensive methodological approach that integrates simulation, predictive analysis, and behavioral modeling [
17]. The study begins with a detailed analysis of the existing energy systems within the building, focusing on identifying inefficiencies and potential areas for optimization. This analysis serves as the foundation for a series of simulations aimed at exploring the impact of varying ESS capacities and solar PV system sizes [
18] on the building’s energy balance.
The behavioral analysis of energy consumption breaks down the data into specific contributions from HVAC systems [
19], lighting [
20], and electronic devices [
21,
22,
23]. By simulating appliance usage patterns based on typical working day behaviors, the research provides a detailed understanding of the building’s energy consumption dynamics. These simulation results are then validated against actual energy consumption data, ensuring both accuracy and reliability.
The study also incorporates the SHASE classification system to evaluate the building’s energy performance across different zones. This classification provides a clear framework for assessing the building’s progress towards achieving Nearly ZEB Level 1 status and identifies key areas for further improvement [
24].
1.4. Significance of the Study
This research significantly contributes to the growing body of knowledge on Zero-Energy Buildings (ZEBs) by offering valuable insights into the optimization of energy systems. The findings are expected to inform the design and management of future ZEBs, particularly in regions with similar climatic and environmental conditions. By demonstrating the effectiveness of integrating solar photovoltaic (PV) systems, energy storage systems (ESS), and Behavioral usage patterns, the research highlights the potential for ZEBs to achieve high levels of energy efficiency and self-sufficiency.
Moreover, this study underscores the importance of behavioral analysis in understanding and managing energy consumption within buildings. By analyzing the contributions of various appliances based on their percentage usage ratios, the research provides critical insights into how specific appliances, such as HVAC systems, lighting, and electronics, contribute to overall energy consumption. The results are particularly relevant for building managers, engineers, and policymakers aiming to optimize energy use and reduce the environmental impact of buildings.
2. Material and Methods
2.1. Case Study Building
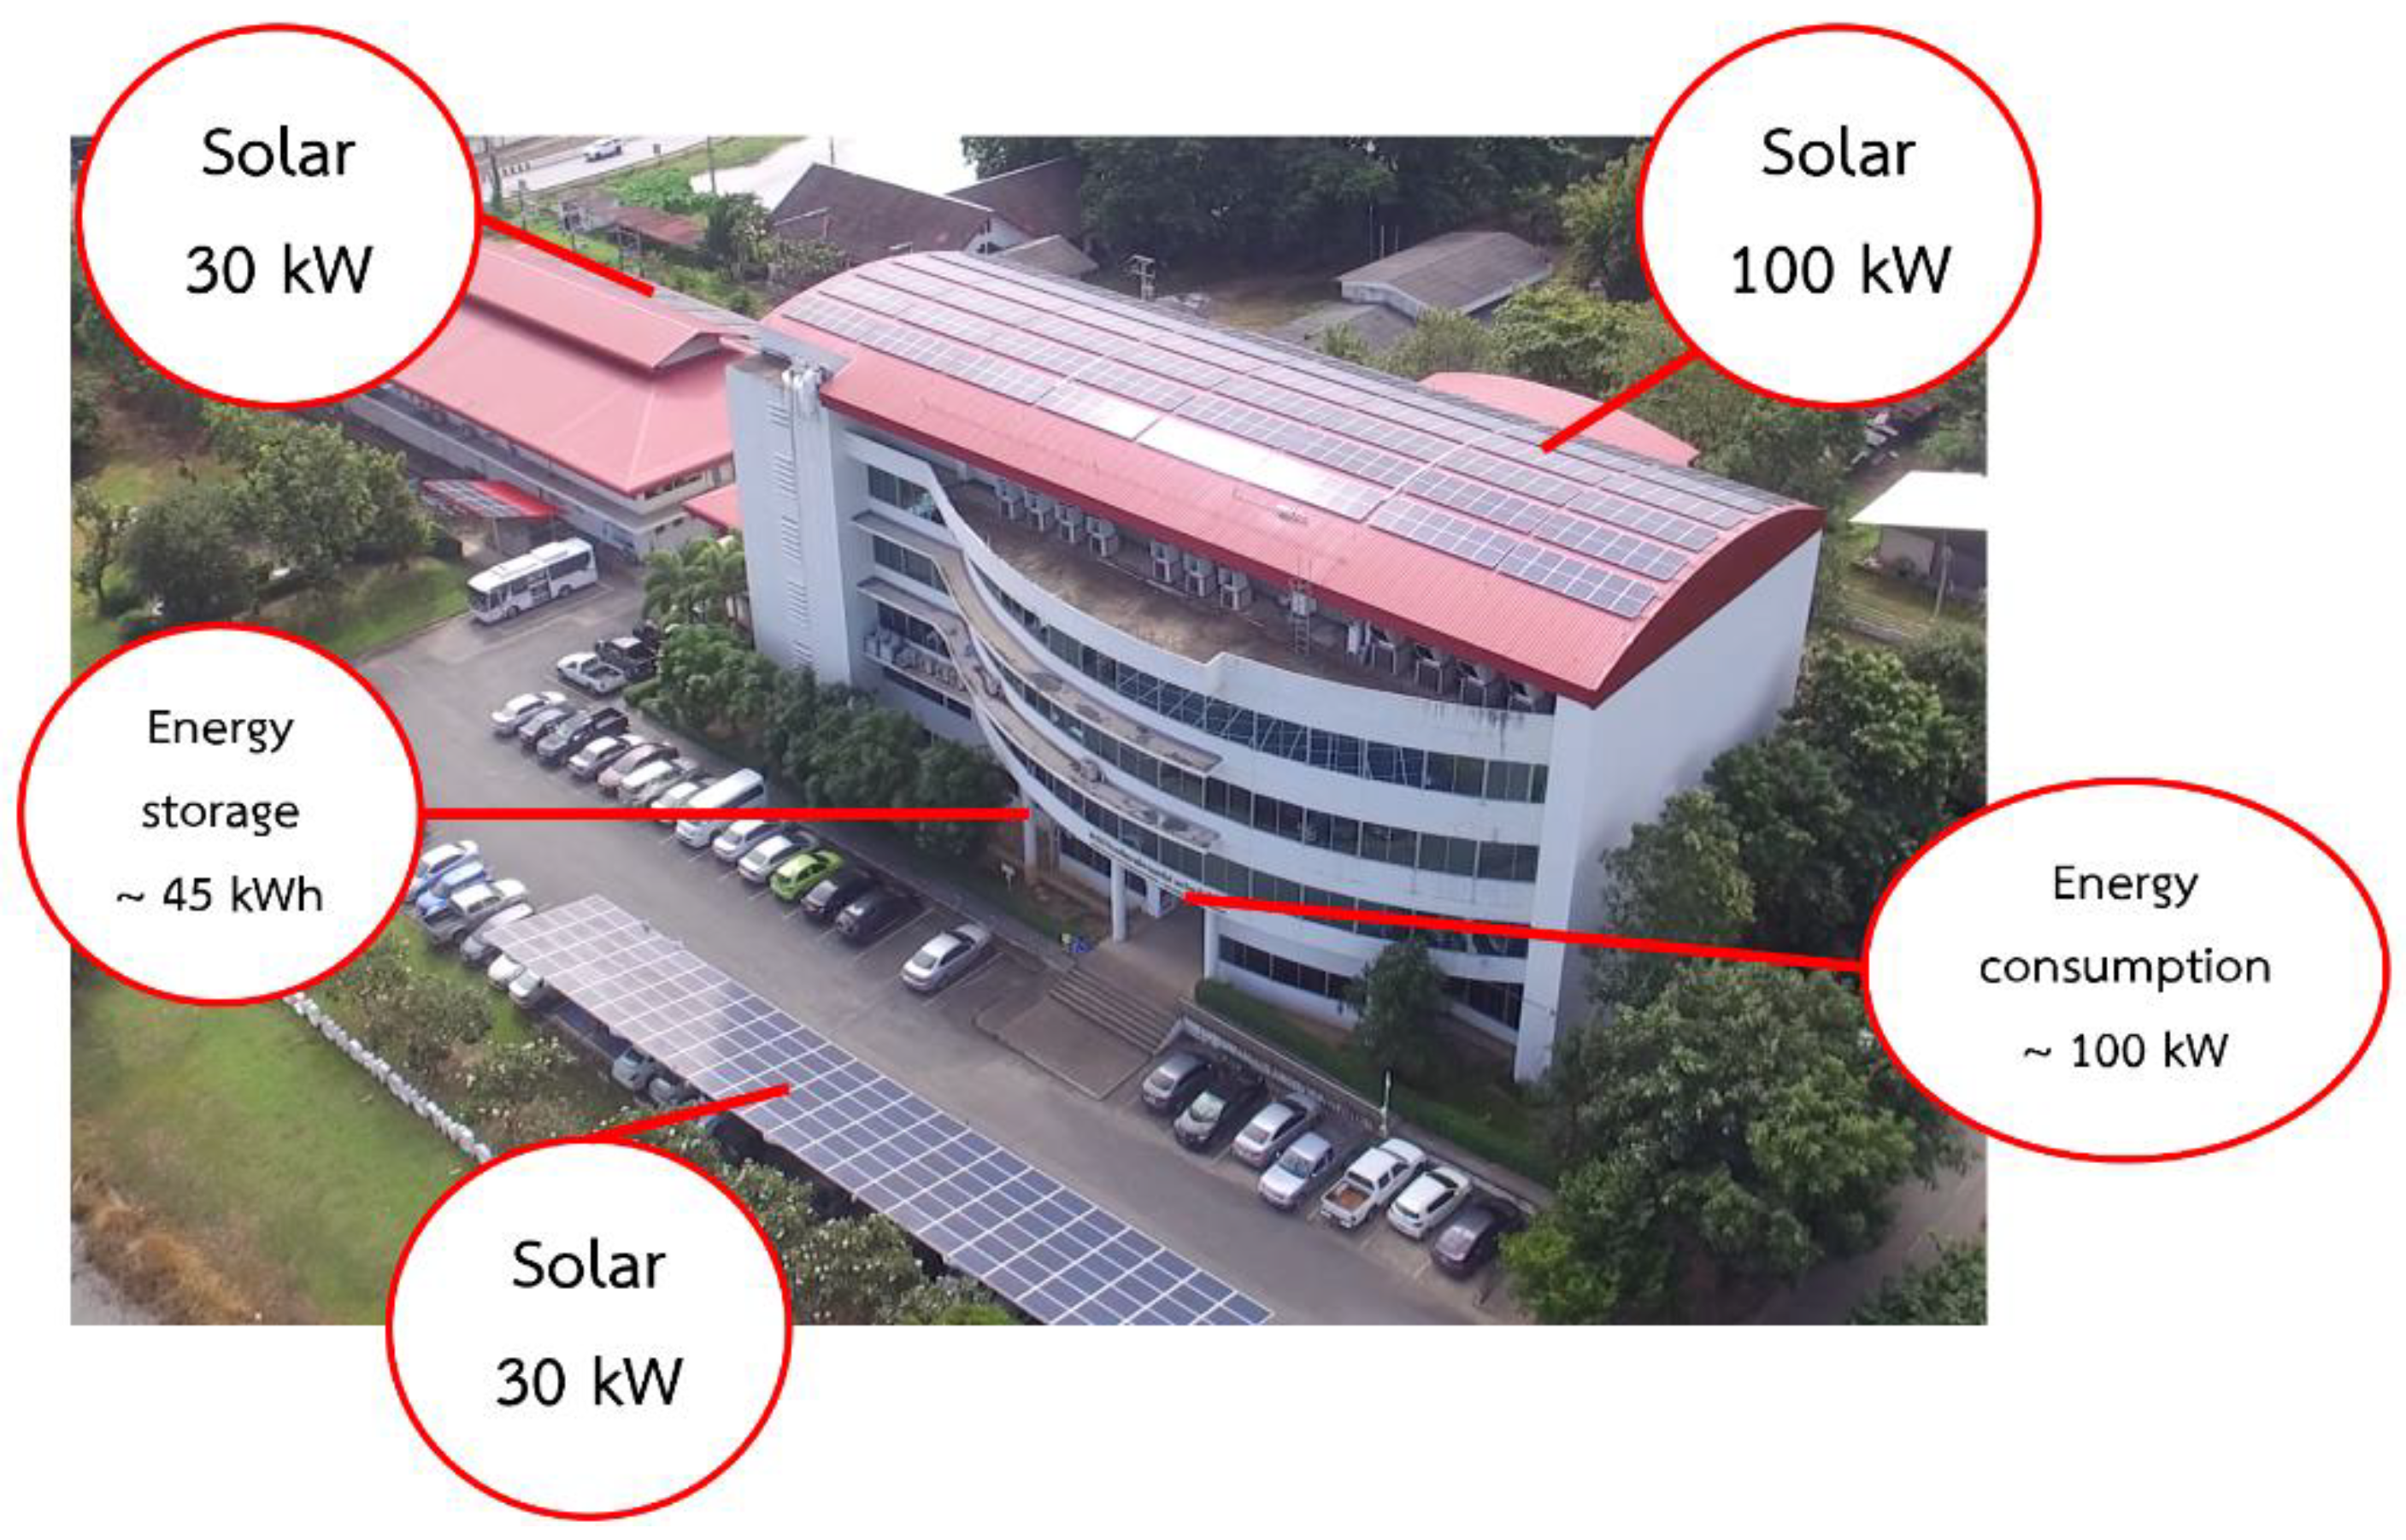
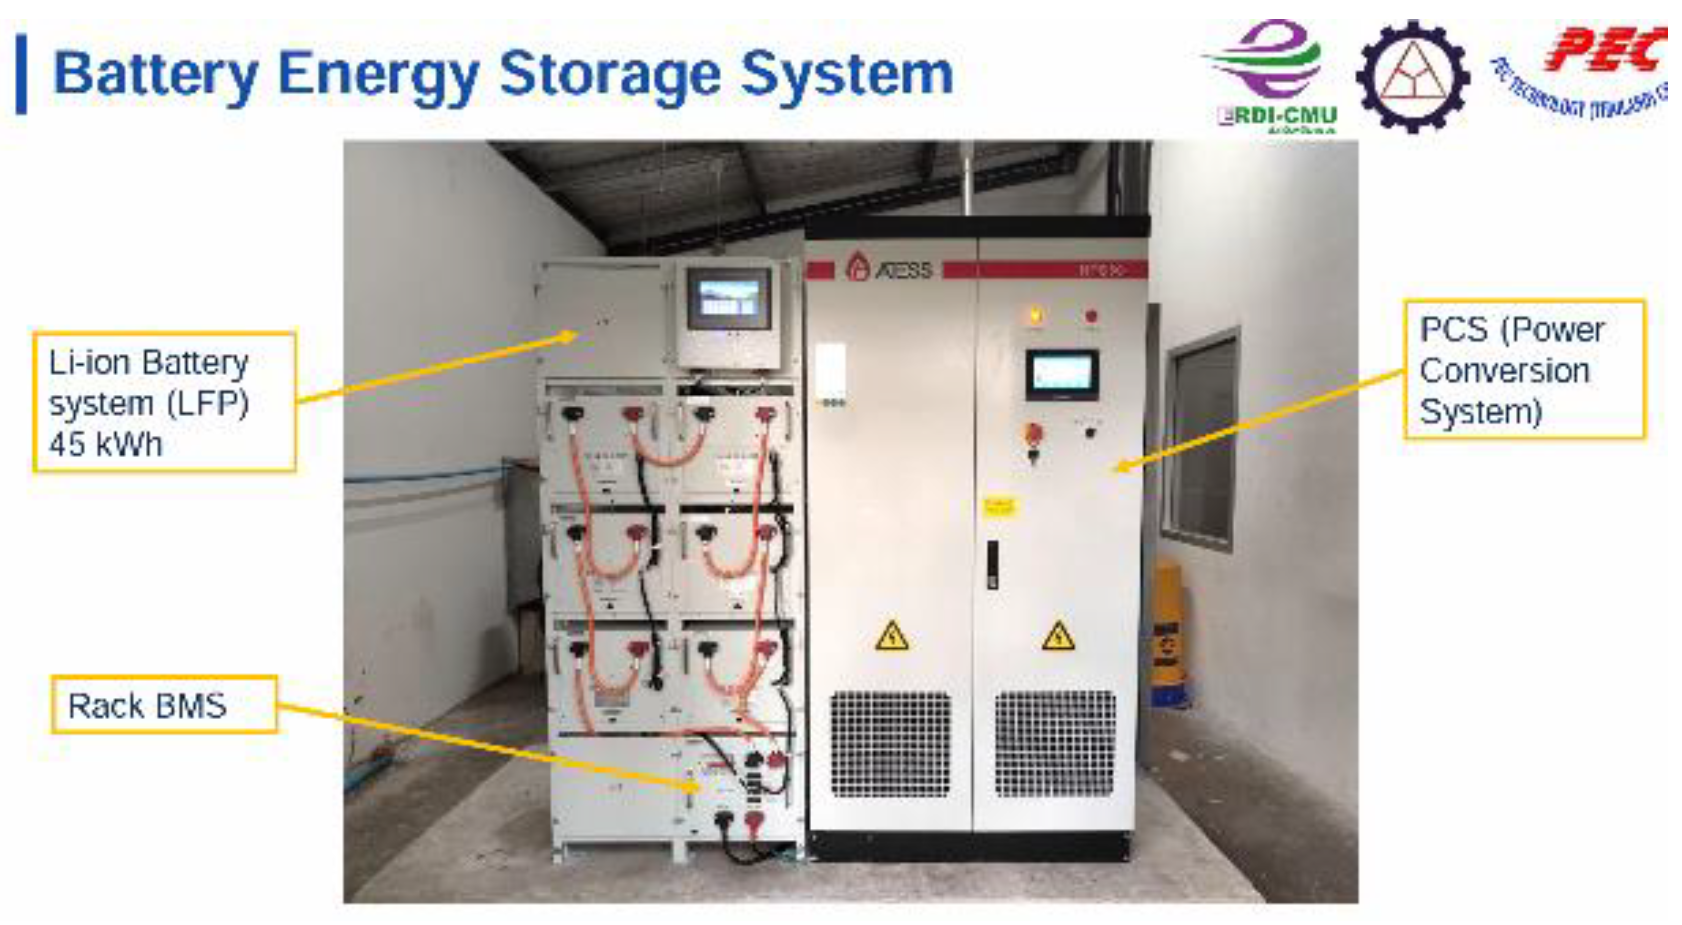
The ERDI Chiangmai building, functioning as an office facility of 100kW Size, is equipped with a 160kW solar photovoltaic (PV) system and a 50kW-45kWh energy storage system (ESS) intended to meet its energy demands sustainably as illustrated in
Figure 2 and 3.
Despite this setup, significant energy losses have been identified within the current solar generation and storage system, hindering the building’s progression toward Nearly Zero-Energy Building (ZEB) Level 1 status.
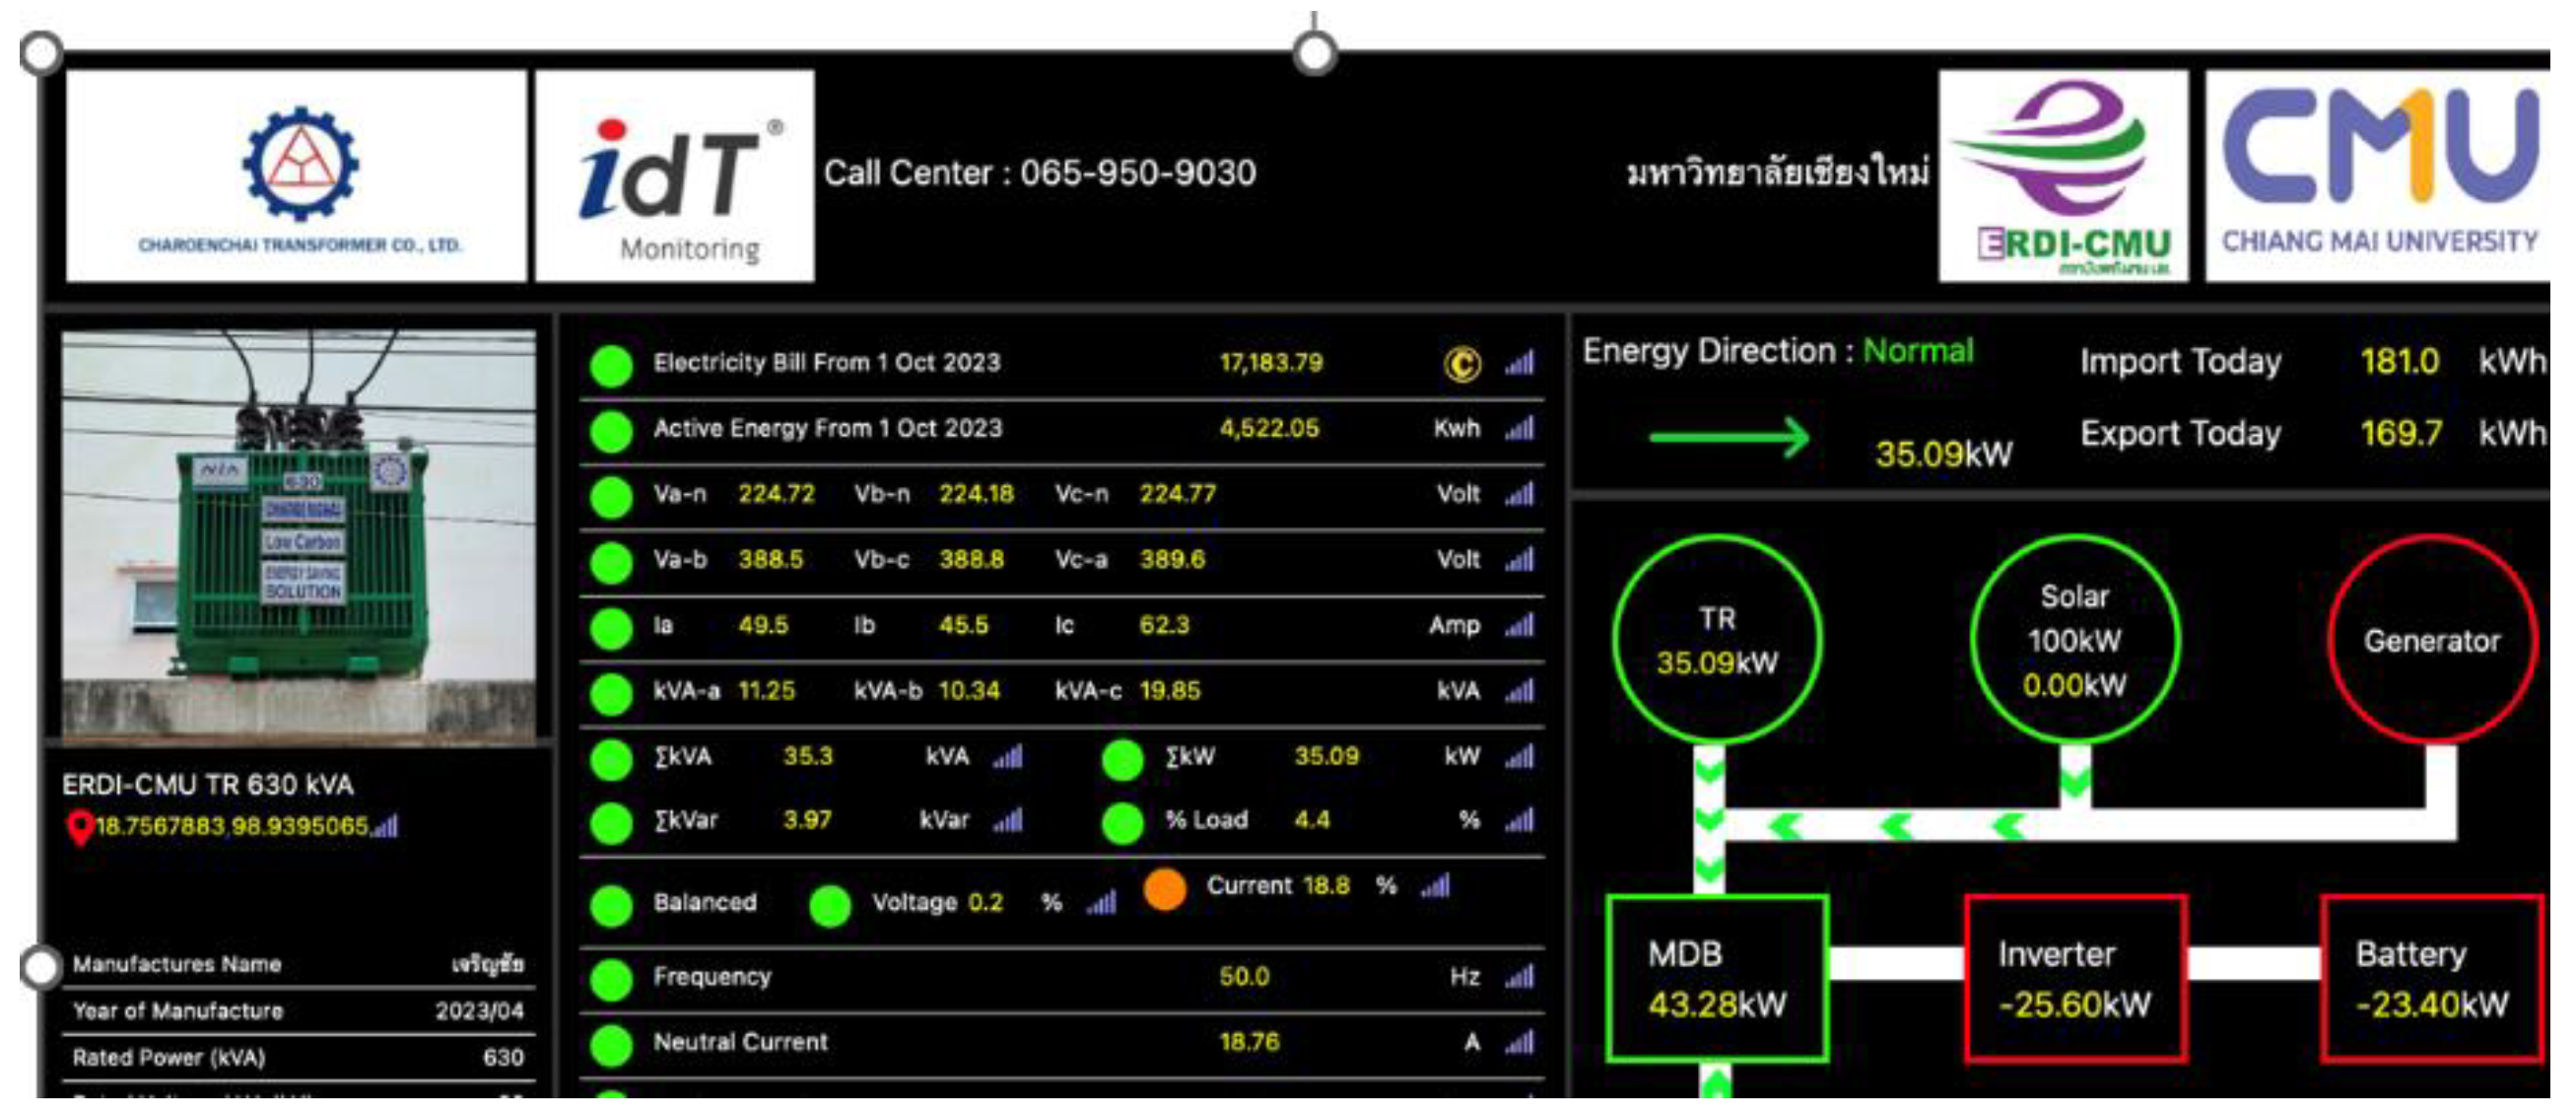
This building aims to address these energy inefficiencies through comprehensive analysis and optimization strategies under the Sustainable Green Energy Management System program. The project also incorporates advancements in IoT-enabled transformers and collected data energy management from private application shown in
Figure 4.
2.2. Problem Formulation
The primary objectives of this study are:
Quantify and Analyze Energy Losses: Identify and evaluate the magnitude and causes of energy losses within the current 160kW Solar PV and 50kW ESS configuration.
Optimize Energy Storage Capacity: Determine the optimal ESS capacity between 0 to 500 kWh that minimizes energy losses and maximizes efficiency under existing operational conditions.
Assess Impact of Varying PV Capacities: Explore how different solar PV capacities (160kW, 180kW, 200kW, and 250kW) affect overall energy performance and contribute to reducing energy losses.
Analyze Behavioral Energy Consumption Patterns: Focus on typical office building behaviors and grouped appliance percentage ratios to dissect energy usage patterns. Develop targeted interventions for key systems such as HVAC, lighting, and electronics to further enhance energy efficiency.
By systematically addressing these objectives, the research seeks to develop effective strategies for reducing energy losses, optimizing renewable energy utilization, and advancing the ERDI Chiangmai building toward achieving Nearly ZEB Level 1 status. The findings are expected to contribute valuable insights into sustainable energy management practices applicable to similar office buildings and contexts.
2.3. Data Preparation
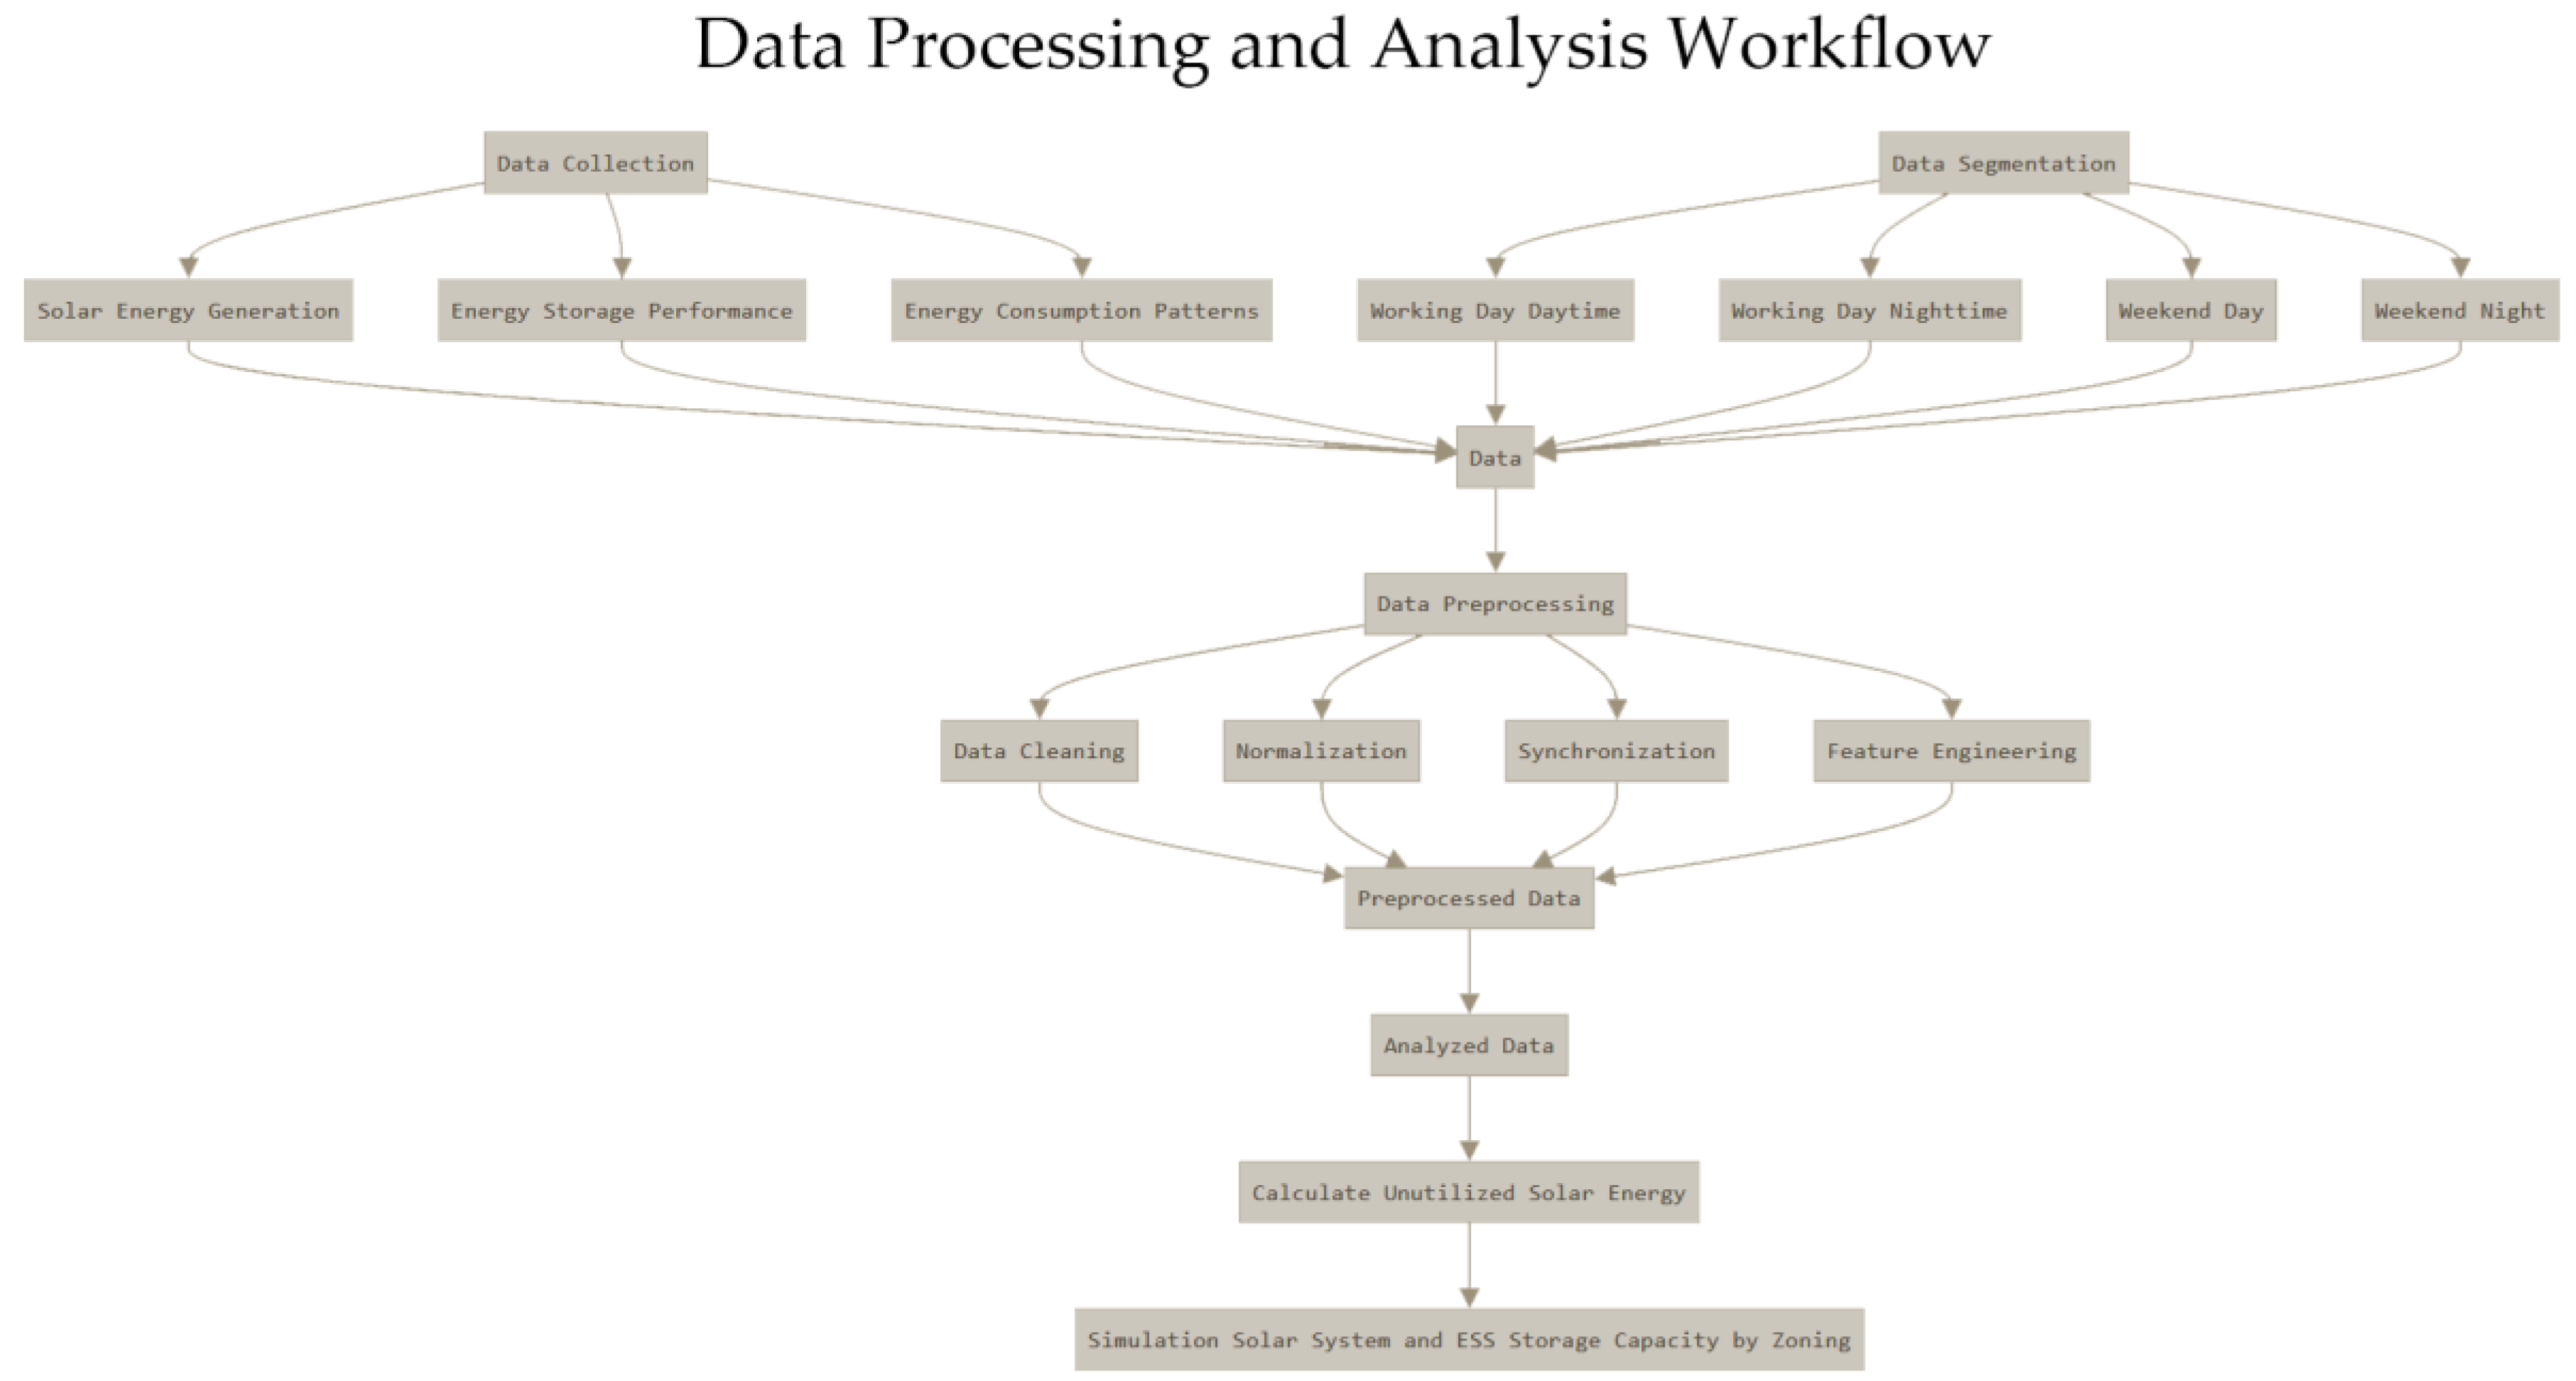
To facilitate this analysis, an extensive dataset was collected over a 6-month period from the ERDI Chiangmai building, encompassing comprehensive operational data of the current energy systems as shown in
Figure 5.
2.4. Method
|
Algorithm 1: Simulation Solar System and ESS Storage Capacity
Optimization |
Prepare Current Data of total energy consumption of building, 160kW Solar system and 50kW ESS. Calculate Unutilized Solar Energy Select a range of potential solar size, 160 (Ref),180,200,250kW. Select a range of potential ESS storage capacities, 0–500kWh with increments of 25kWh. Simulation System and Evaluate Performance by Zone |
Figure 6.
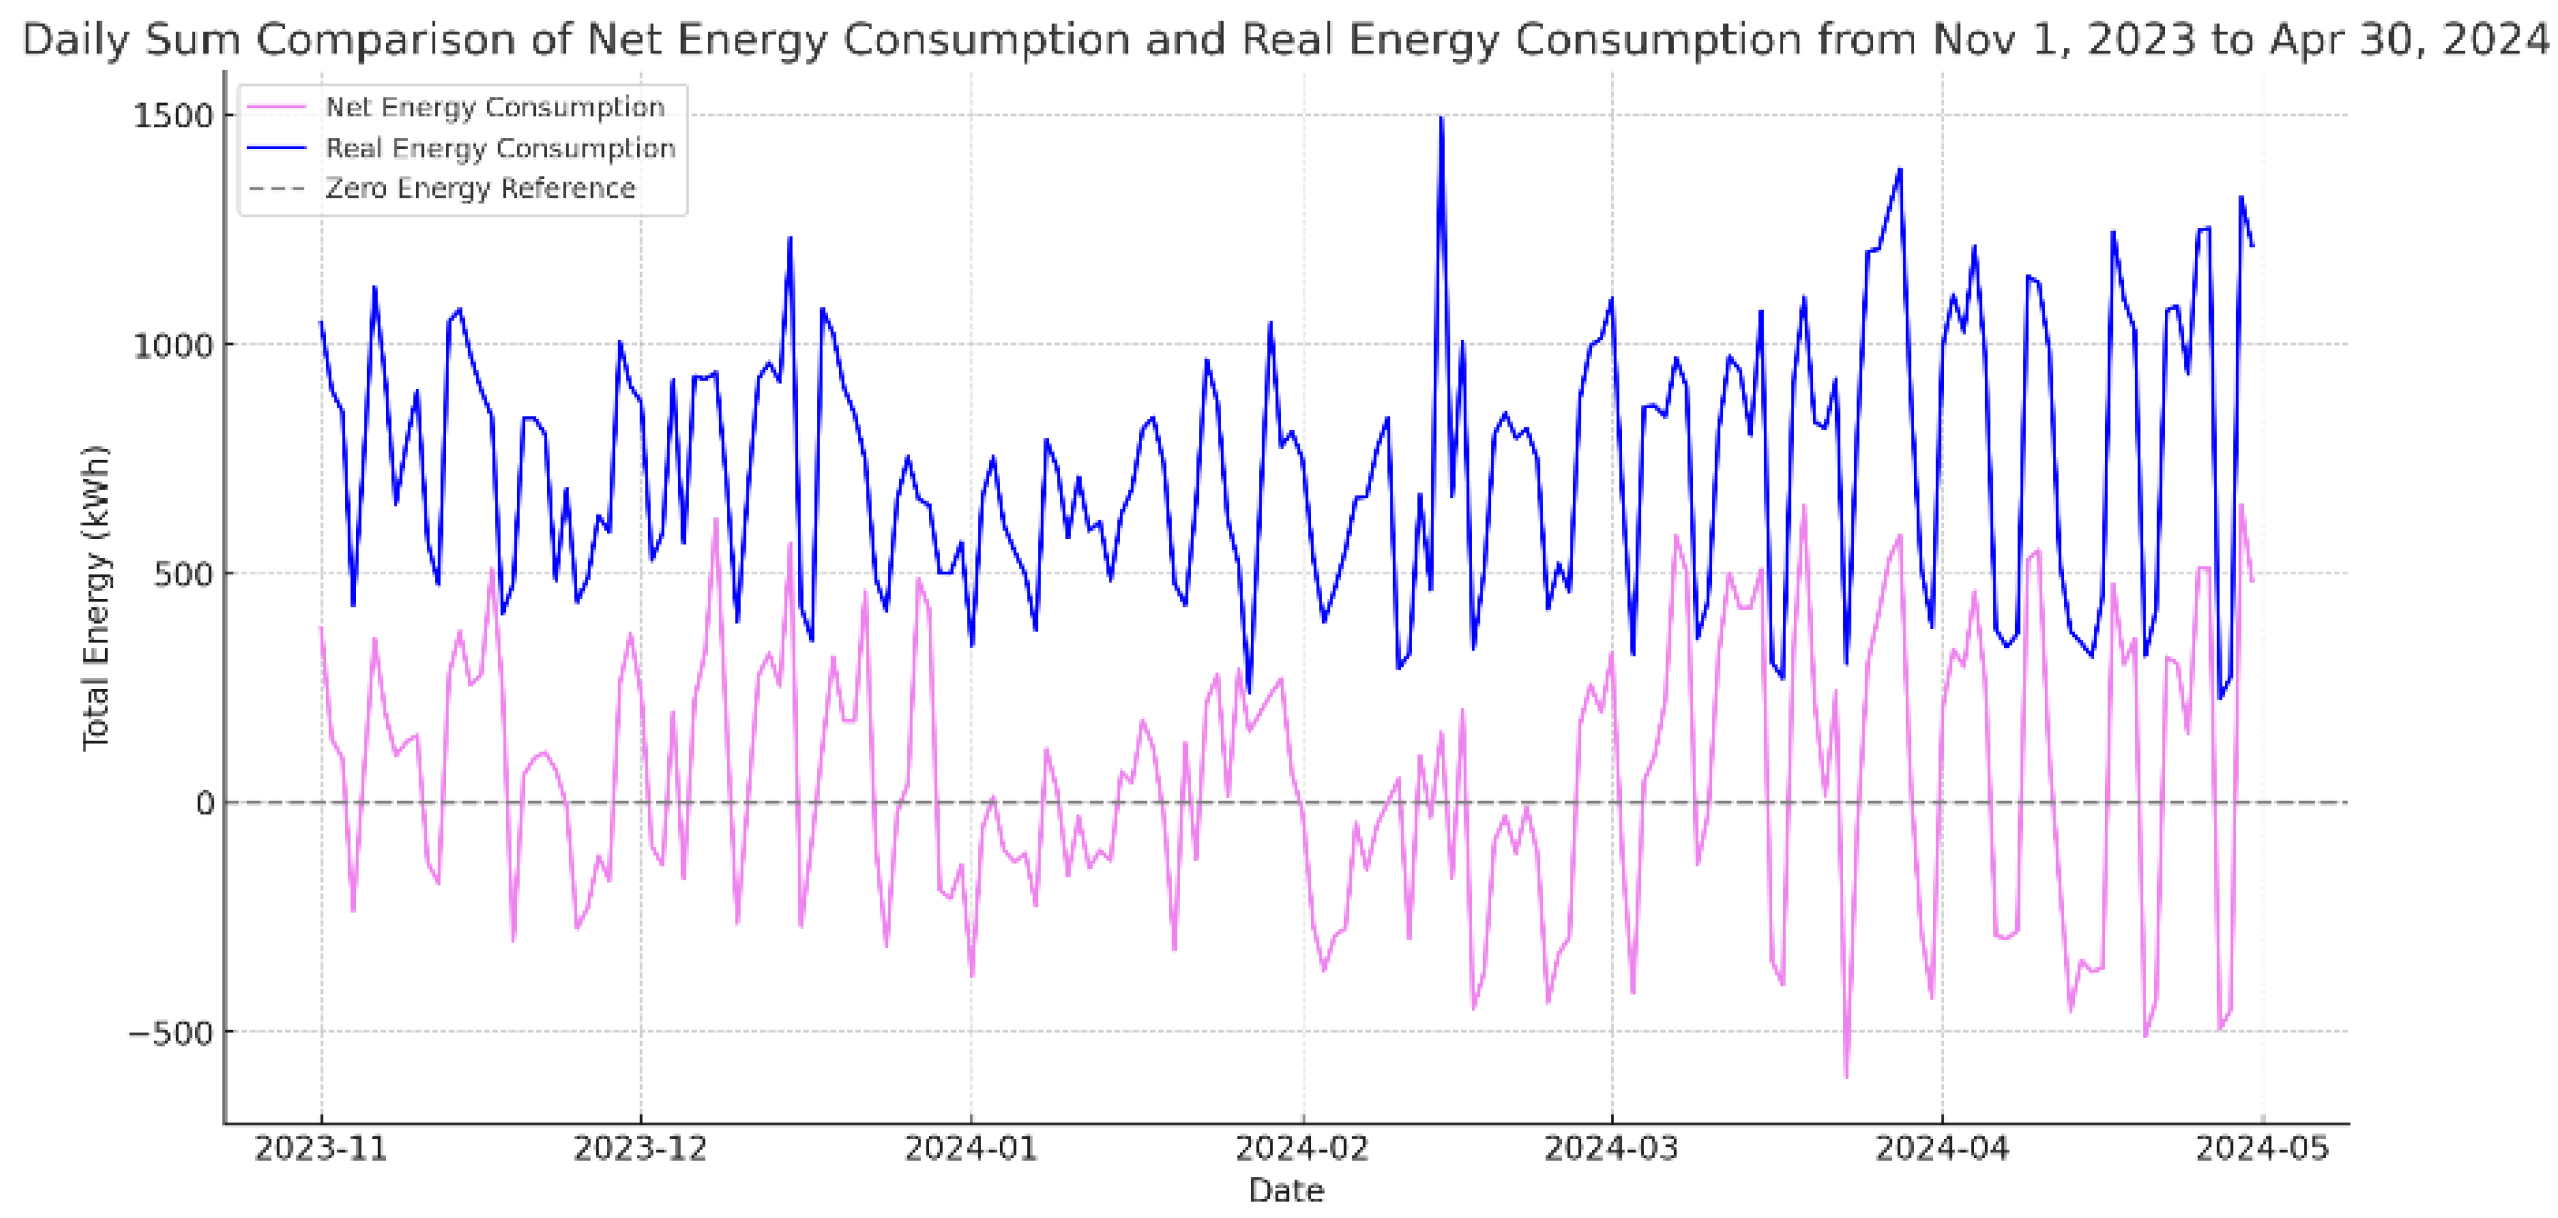
The figure compares daily data between real energy consumption (blue line) with net energy consumption (pink line) from November 1, 2023, to April 30, 2024. The real energy consumption remains consistently positive, indicating total energy use, while the pink line in the figure represents the net energy consumption for a system with a 160kW solar array and a 50 kW energy storage system (ESS) shows more variability, sometimes dipping below zero, suggesting that energy generation exceeded consumption on certain days. The dashed gray line represents the zero-energy baseline for reference.
Unutilized Solar Energy (%) Calculation
Step 1: Identify Net Energy Demand
Calculate the net energy demand at each time step:
Where:
If is negative, it indicates that the solar system is generating more energy than the building consumes.
Step 2: Charge the Energy Storage System (ESS)
If
is negative and the ESS has available capacity, the excess solar energy can be used to charge the ESS:
Where:
is the amount of energy used to charge the ESS.
is the total capacity of the ESS.
is the current charge level of the ESS.
This step ensures that any excess solar energy is stored in the ESS until it reaches its capacity limit.
Step 3: Calculate Unutilized Solar Energy
Unutilized solar energy is the portion of excess solar energy that cannot be stored in the ESS:
This value represents the energy that is generated but not utilized by the building or stored in the ESS.
Step 4: Sum Across Time
Perform the above calculations for each time step (e.g., hourly or daily) and sum up the unutilized solar energy over the entire period:
Step 5: Calculate Unutilized Solar Energy (%)
Finally, calculate the percentage of unutilized solar energy relative to the total solar energy generated:
Where:
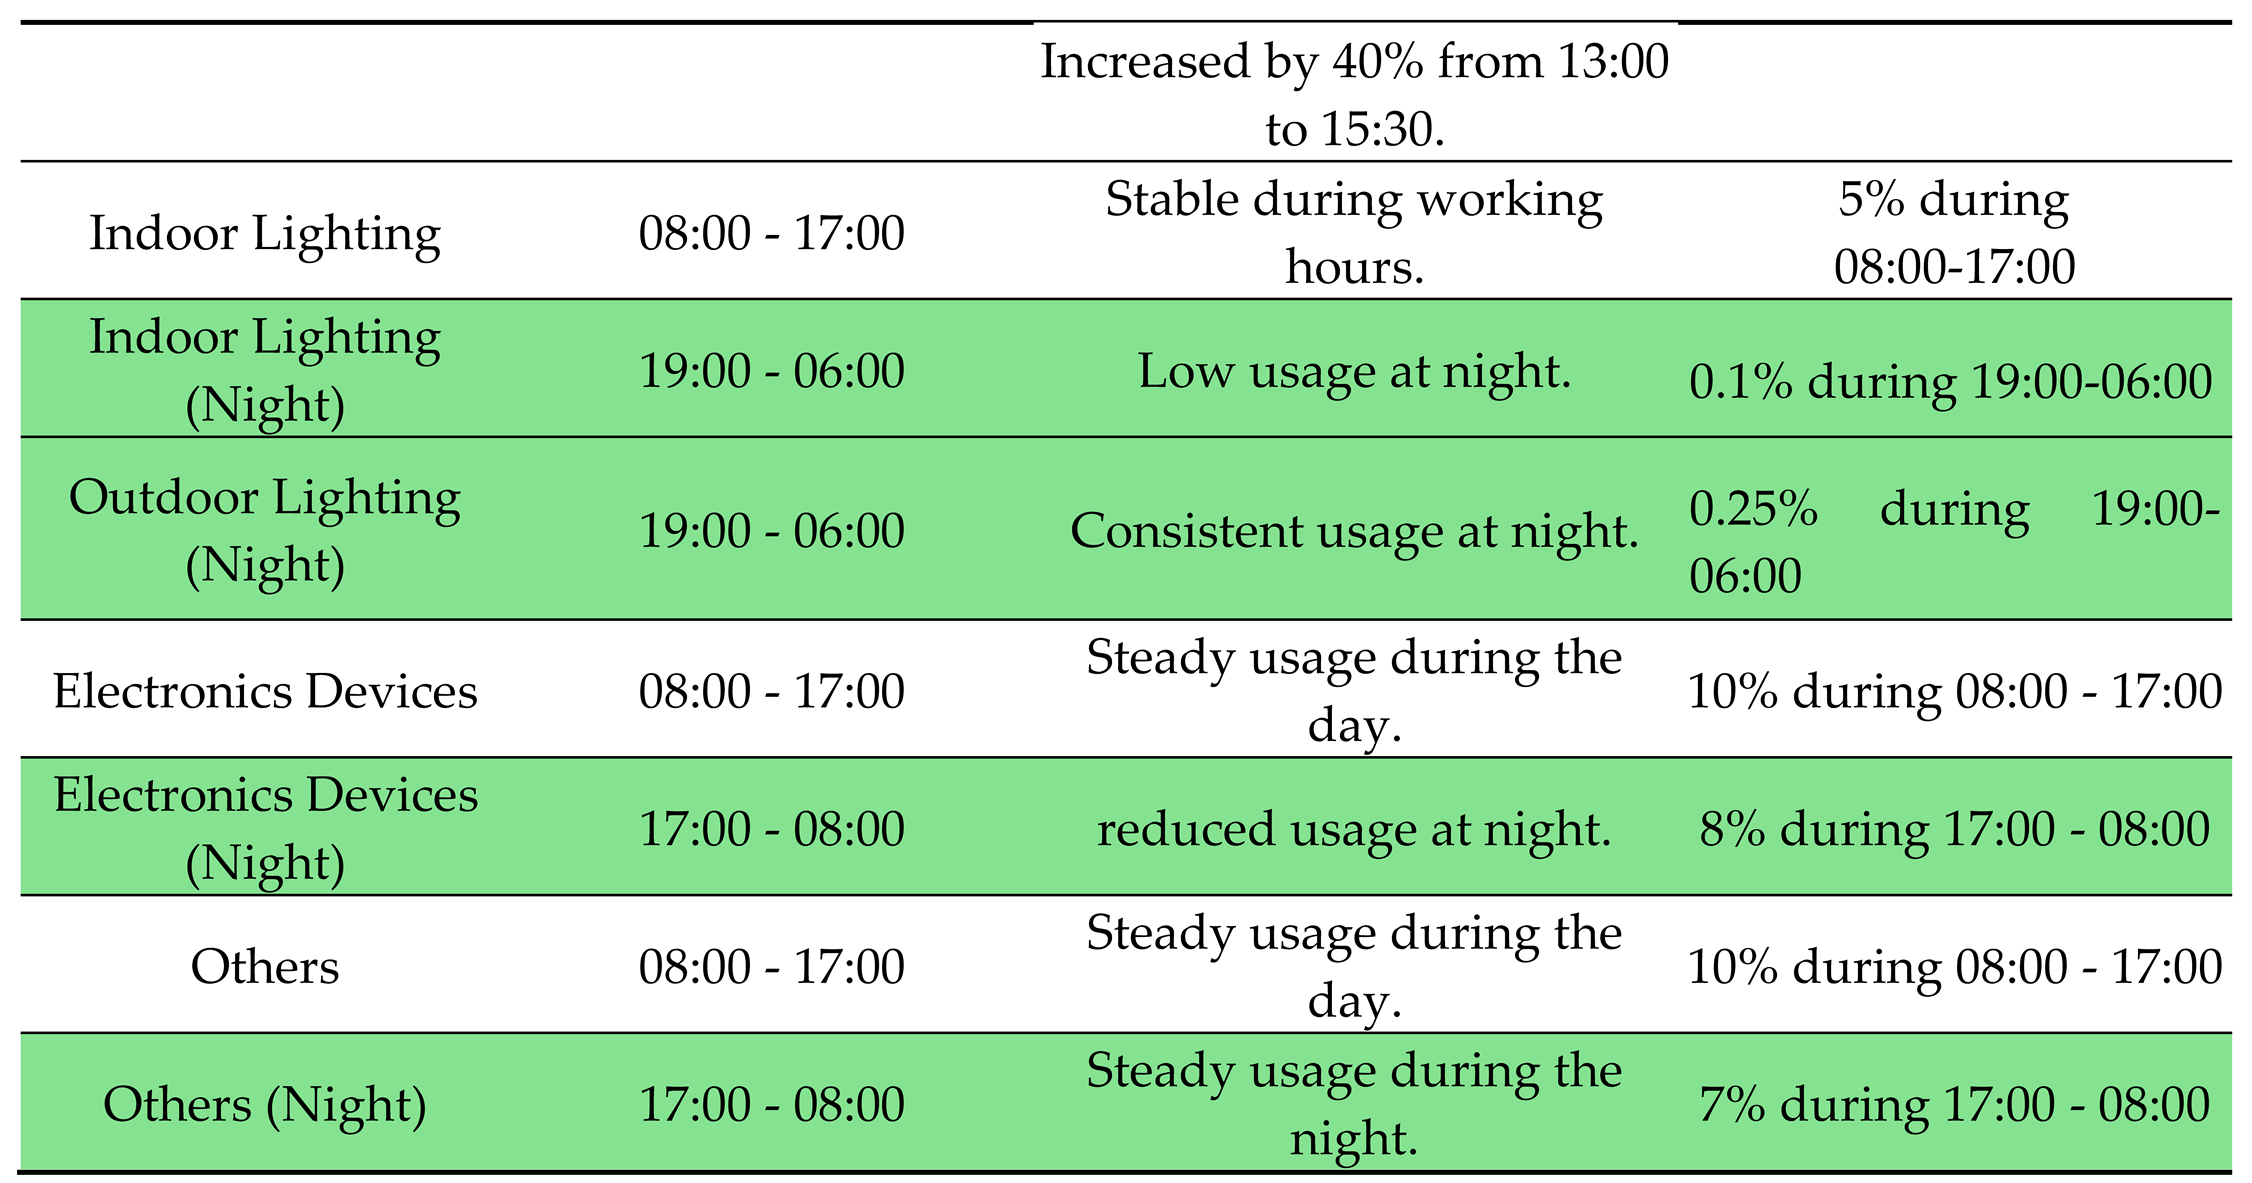
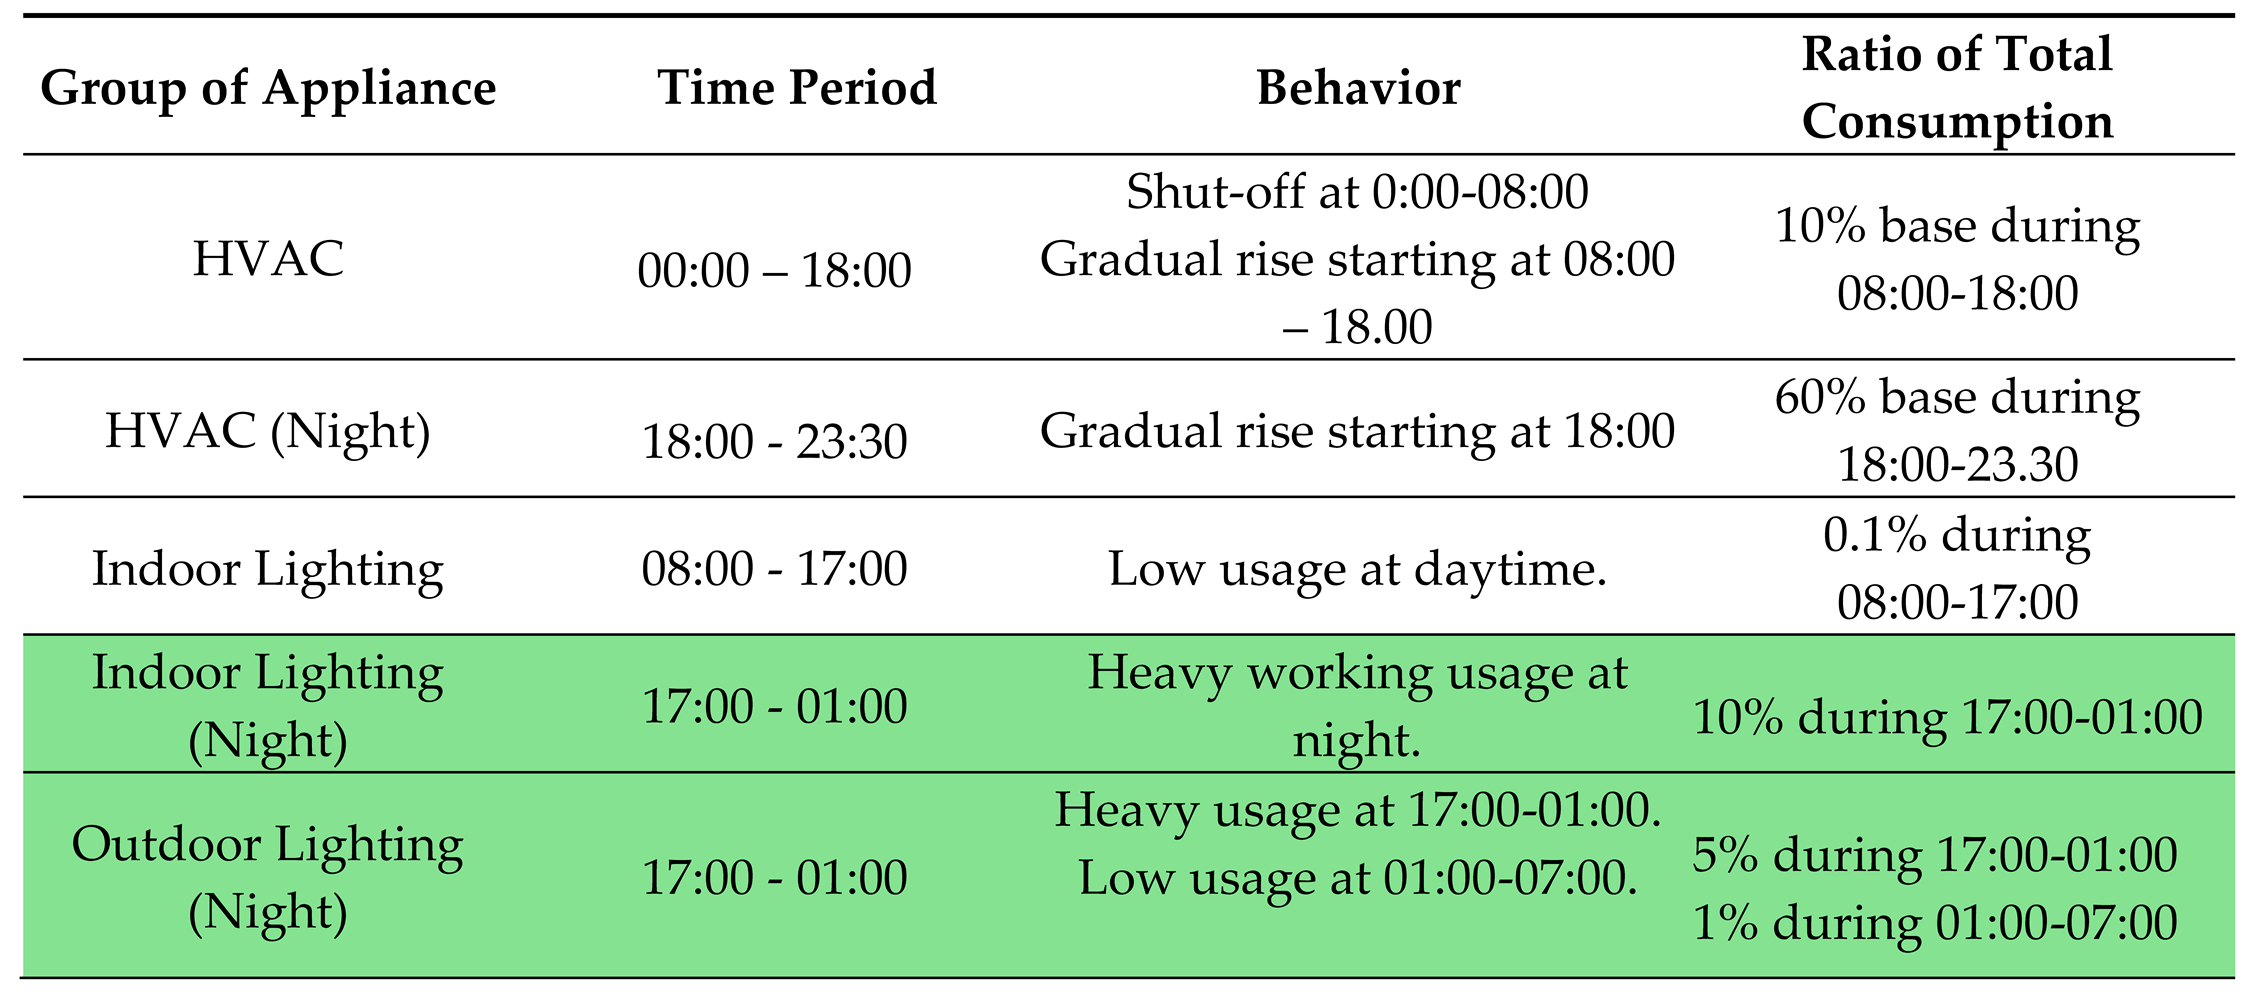
In the second step of the method, the data presented in the table were collected from the energy usage behavior of appliances within the ERDI building at Chiang Mai University. The data collection process involved monitoring the usage patterns of various appliances during different time periods, categorized into working hours and non-working hours, both during the day and night. The total energy consumption was analyzed by breaking it down into individual appliance contributions, such as HVAC systems, lighting, and electronics, based on predefined percentage ratios derived from historical data. The following table summarizes the behavior of each appliance group and their respective ratios of total energy consumption during working hours in the office building.
|
Algorithm 2: Behavioral Analysis and Appliance Ratio Method |
Record typical building behaviors (e.g., working hours, occupancy). Classify appliances (HVAC, lighting, electronics) and Assign percentage ratios to each category based on historical data. Break down total energy consumption into individual appliances based on predefined ratios. Generate usage patterns for each appliance category reflecting behavior and ratios. |
Additionally, Simulate Nightly Energy Usage in the building to understand how energy is consumed during non-working hours. Use this simulation to assess the effectiveness of the current ESS and explore optimization strategies. By analyzing the simulated nightly energy consumption patterns, identify the optimal ESS capacity that minimizes energy waste and maximizes energy efficiency, ensuring the building meets its Nearly ZEB Level 1 targets.
3. Results
This section presents the results of the simulation and analysis performed on the ERDI Chiangmai building’s energy performance, focusing on the optimization of the solar PV system and energy storage system (ESS), as well as the analysis based on behavior and appliance ratios.
3.1. Unutilized Solar Energy
Unutilized Solar Energy is the portion of solar energy that is generated but not utilized by the building. This occurs when the energy generated by the solar PV system exceeds the building’s consumption, and the excess energy cannot be stored in the ESS due to capacity limitations as clearly shown in
Figure 7.
3.2. Energy Performance by Solar PV and ESS Capacity
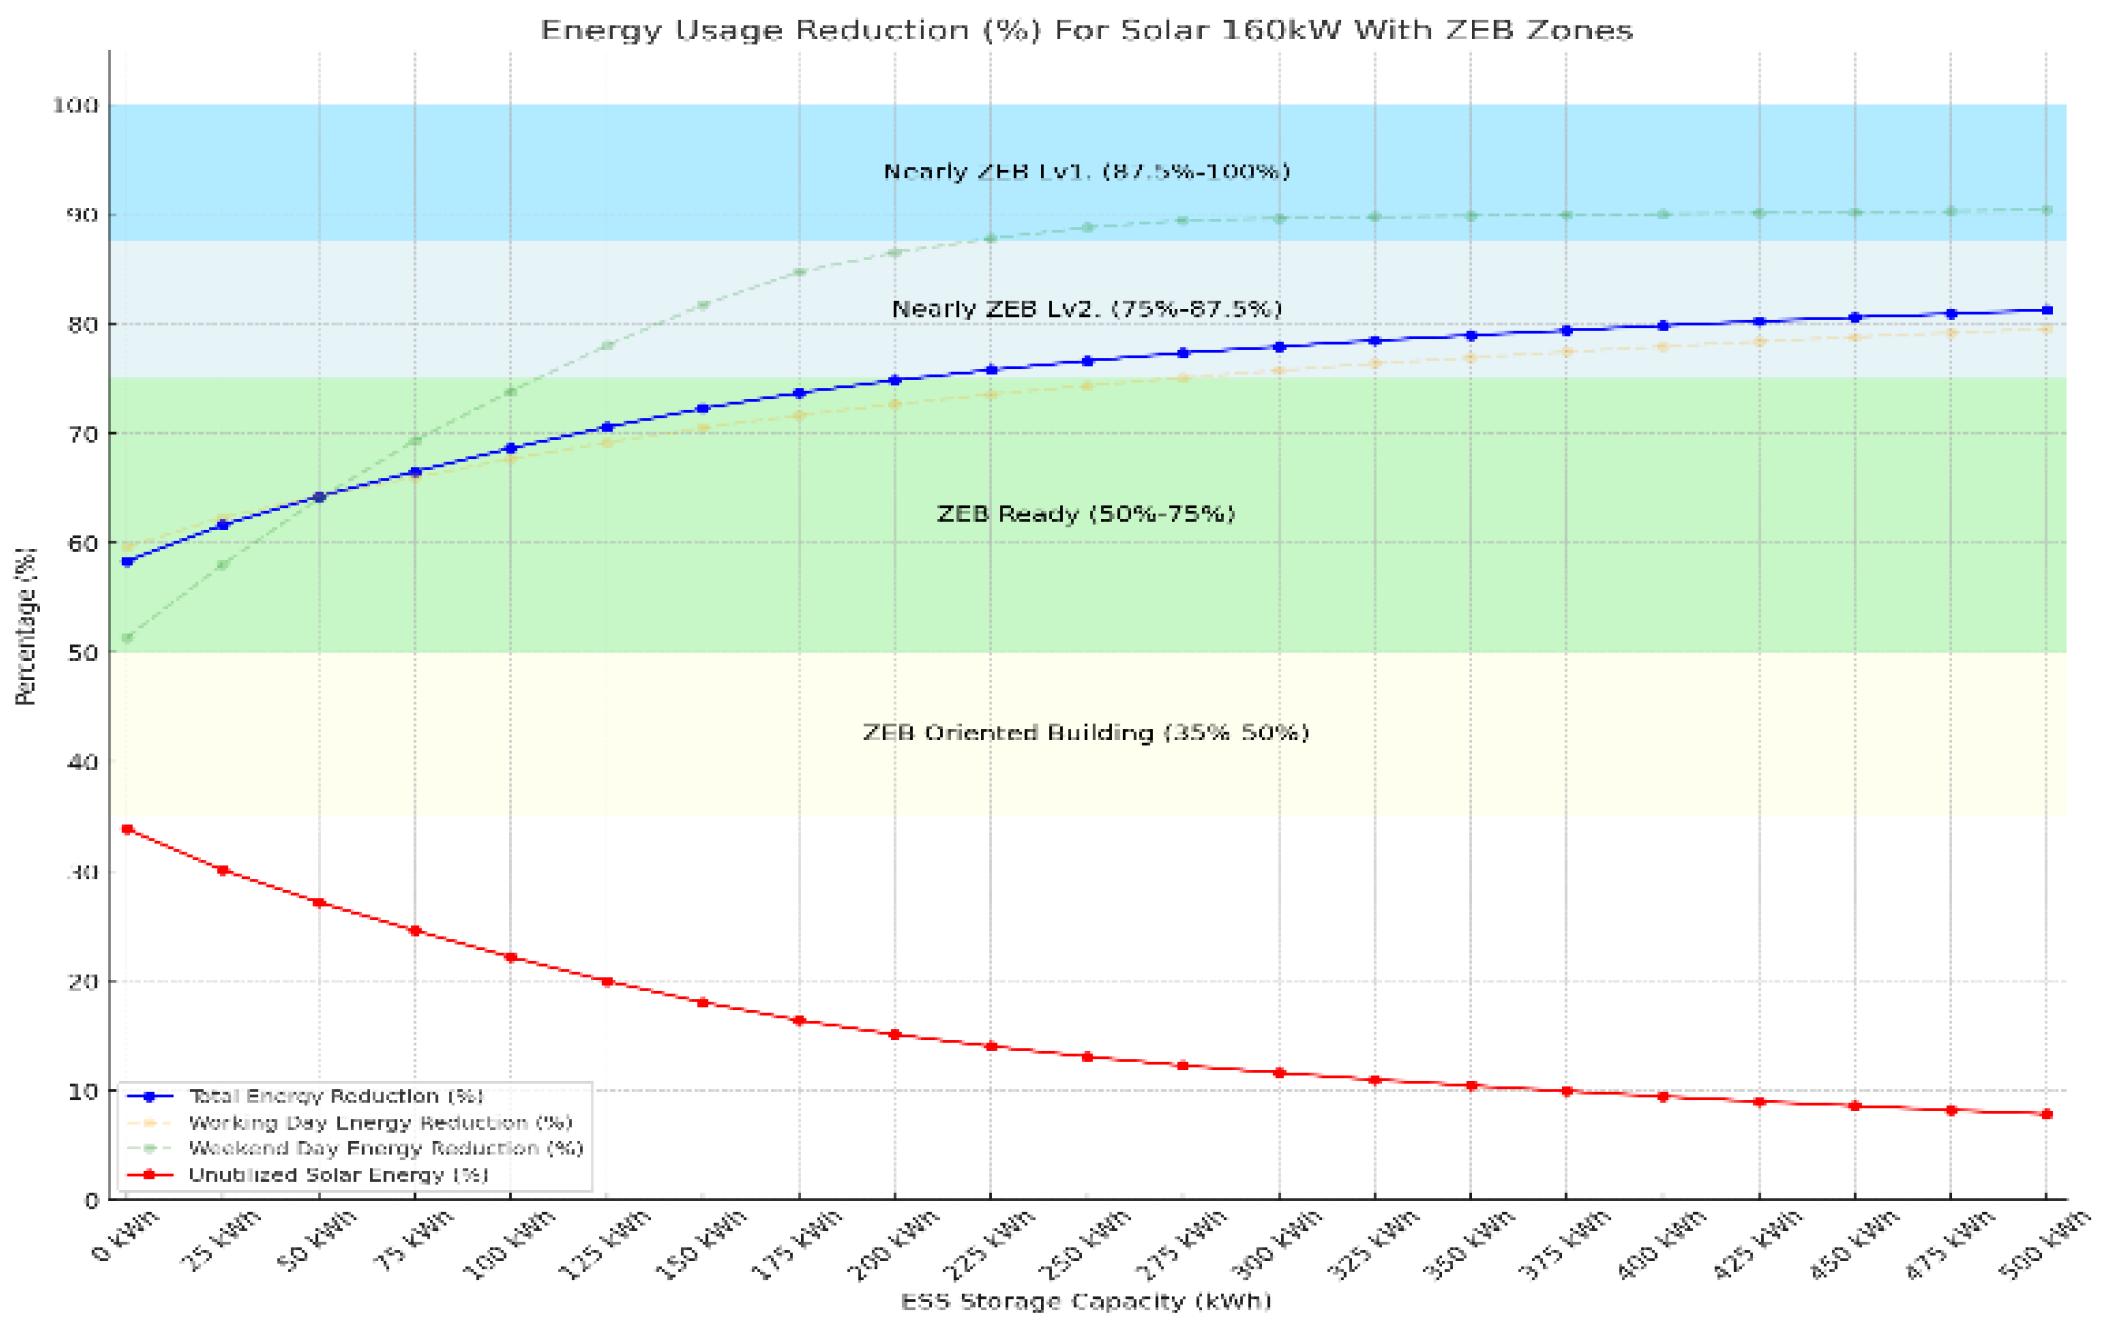
Current Position in ZEB Zones: With the existing 160kW solar PV system and 50kWh ESS, the building achieves an energy usage reduction that places it within the ZEB Ready zone (50%-75% energy reduction). The current setup does not yet reach the Nearly ZEB Level 1 zone (87.5%-100%) described in
Figure 8.
ESS Capacity Enhancement: Increasing the ESS capacity beyond 50kWh could potentially reduce the percentage of unutilized solar energy, pushing the building’s performance closer to the Nearly ZEB Level 1 zone. For instance, moving from 50kWh to 150-200 kWh could reduce unutilized solar energy significantly while also increasing the total energy reduction percentage.
3.3. Comparative Simulation of Enhanced Solar PV Systems
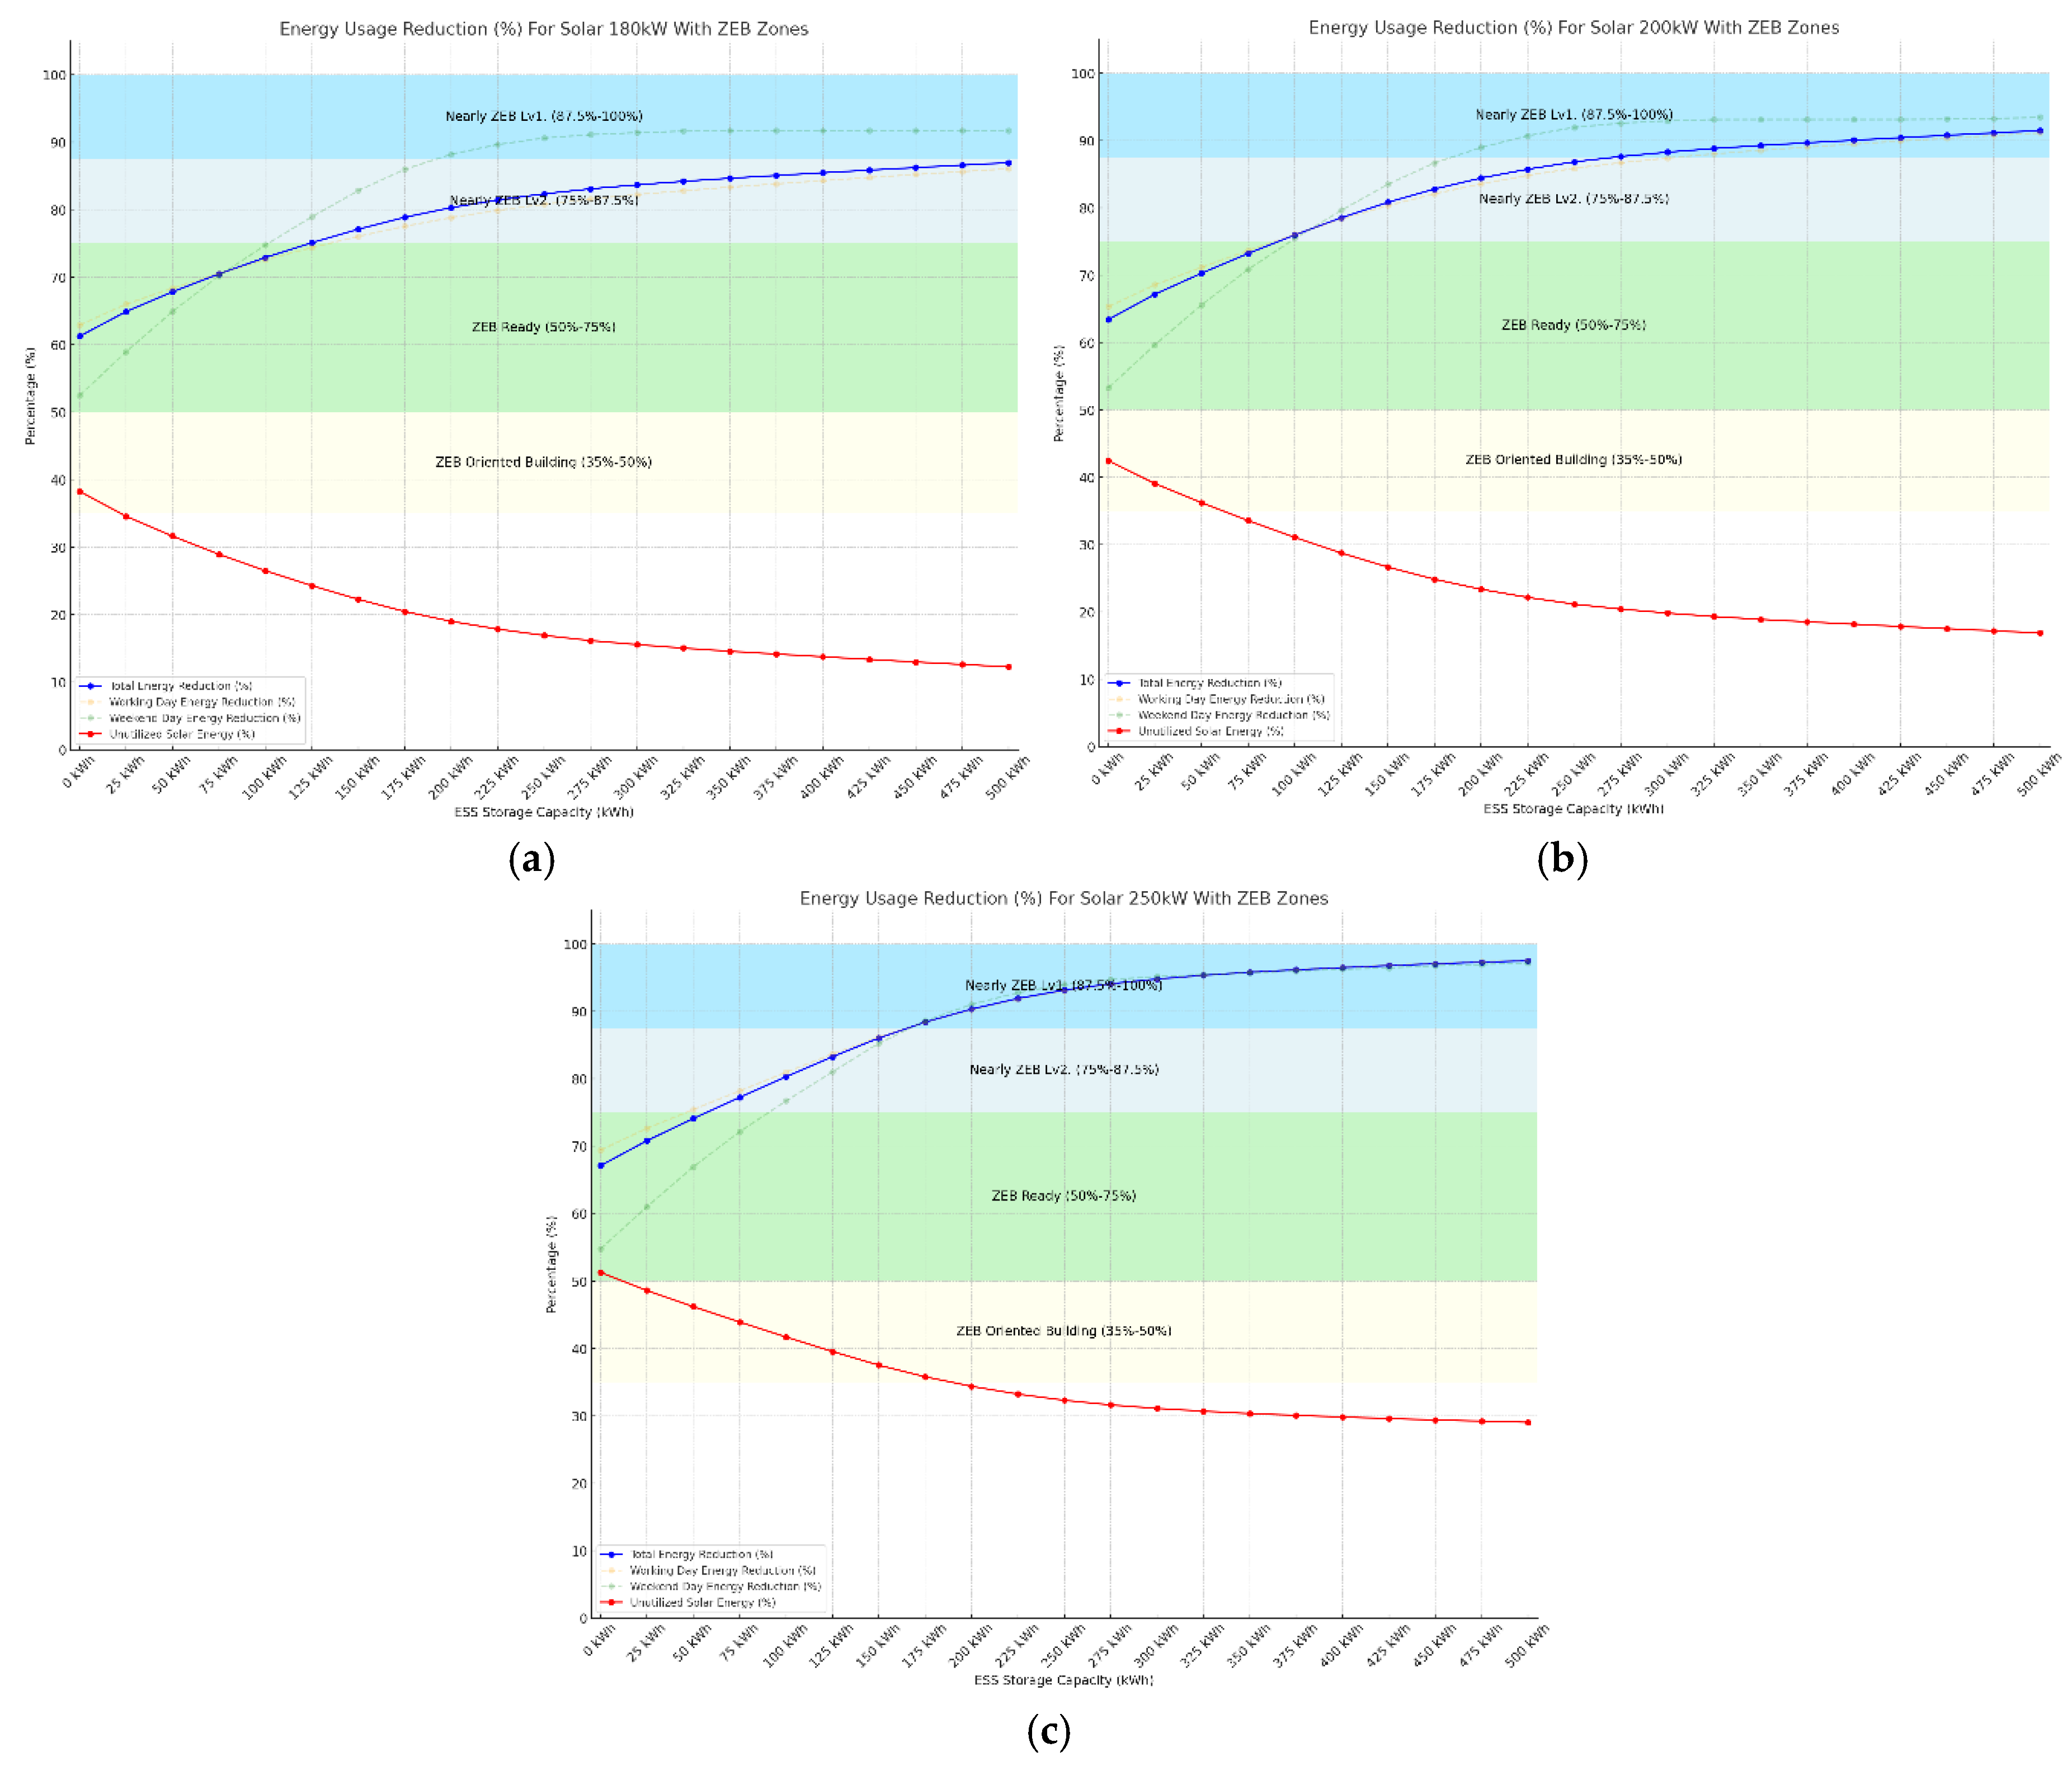
The simulation was conducted across a range of solar PV capacities (180kW, 200kW, 250kW) and ESS storage capacities (0kWh to 500kWh, in increments of 25kWh) as demonstrated in
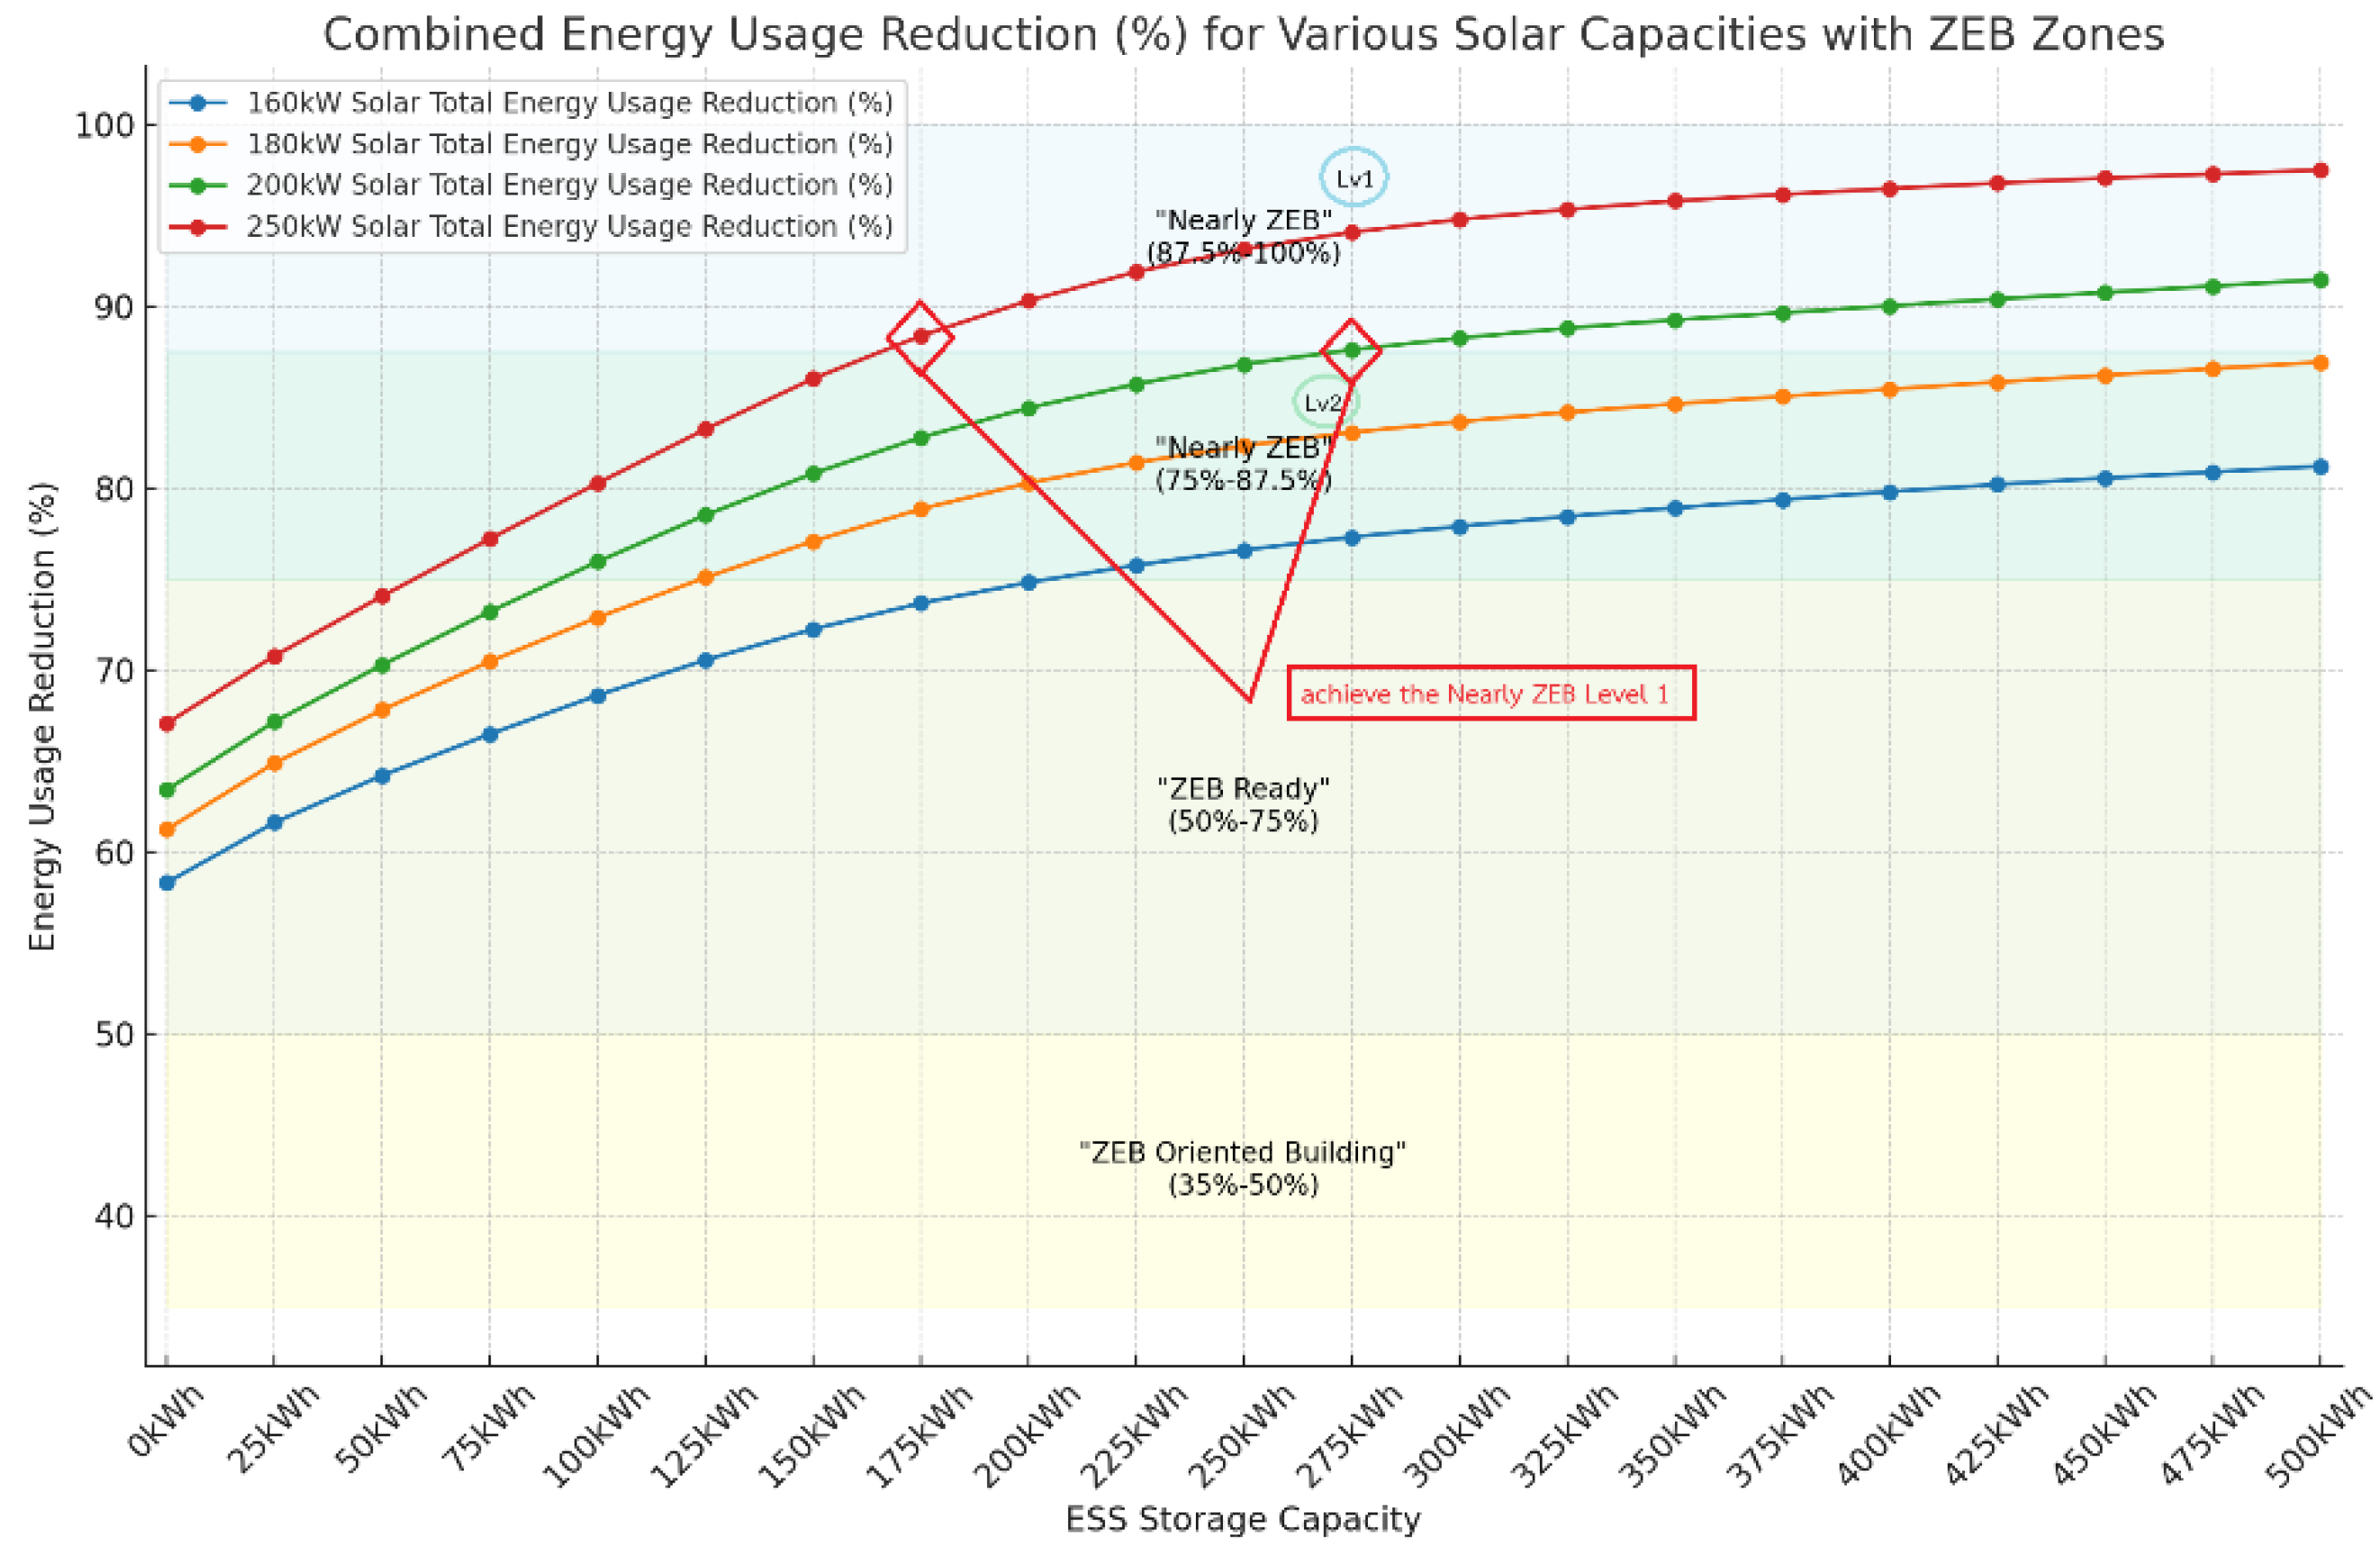
Figure 9. The primary metrics analyzed included energy efficiency, unutilized solar energy, and alignment with the Nearly Zero-Energy Building (ZEB) performance zones defined by the SHASE Japan.
Trends Observed Across Different Solar PV Capacities
General Observation: Across all configurations, as ESS storage capacity increases, the total energy usage reduction also increases, while the percentage of unutilized solar energy decreases. The movement from ZEB Oriented Building (35%-50%) to Nearly ZEB Level 1 (87.5%-100%) zones indicate progressive improvements in energy efficiency as both solar PV and ESS capacities increase.
160kW Solar PV System: Increasing the ESS capacity beyond 50kWh could potentially reduce the percentage of unutilized solar energy, pushing the building’s performance closer to the Nearly ZEB Level 1 zone but the current setup does not yet reach the Nearly ZEB Level 1 zone (87.5%-100%).
180kW Solar PV System: The energy usage reduction shows improvement compared to the 160kW system, advancing further into the ZEB Ready zone. However, it still falls short of achieving the Nearly ZEB Level 1 zone (87.5%-100%), indicating that while performance has improved, additional enhancements in either ESS capacity or PV system size are required to reach the highest energy efficiency levels. Unutilized solar energy decreases faster as ESS capacity increases, indicating better alignment between generation and storage.
200kW Solar PV System: The total energy reduction begins to reach the Nearly ZEB Level 1 zone at ESS capacities around 275kWh. There is a consistent decrease in unutilized solar energy, making the system significantly more efficient at utilizing the generated solar energy. This configuration represents a more balanced approach, improving both energy efficiency and solar energy utilization compared to lower-capacity systems.
250kW Solar PV System: The 250kW system is the most efficient in terms of energy usage reduction, achieving Nearly ZEB Level 1 at ESS capacities starting from 175 kWh. Unutilized solar energy is minimized more effectively, even at lower ESS capacities, making this configuration potentially the most balanced and optimal for maximizing energy efficiency and solar energy utilization.
Key Simulation Insights for Optimization
Figure 10.
This figure demonstrates that the 200 kW system reaches the Nearly ZEB Level 1 zone with an ESS capacity of approximately 275 kWh, while the 250 kW system achieves Nearly ZEB Level 1 with an ESS capacity starting from 175 kWh.
Figure 10.
This figure demonstrates that the 200 kW system reaches the Nearly ZEB Level 1 zone with an ESS capacity of approximately 275 kWh, while the 250 kW system achieves Nearly ZEB Level 1 with an ESS capacity starting from 175 kWh.
In both cases, unutilized solar energy is effectively minimized, particularly in the 250 kW configuration, which optimally balances solar generation with storage capabilities. These findings suggest that strategically increasing both solar PV capacity and ESS storage is essential for advancing the building towards the Nearly ZEB Level 1 zone, where energy losses are minimized, and energy self-sufficiency is maximized.
This approach should be a primary focus for building managers and energy planners who aim to achieve the highest levels of energy efficiency and sustainability in Zero-Energy Buildings.
Analyze Behavioral Energy Consumption Patterns
The analysis of total energy consumption involves breaking down the data into contributions from individual appliances, such as HVAC systems, lighting, and electronics, based on predefined percentage ratios derived from historical data. This method allows us to transform the daily energy consumption data into patterns that accurately reflect the energy usage of different appliance groups, enabling more targeted energy management strategies.
Table 1.
Group of Appliance Behavior and Ratios on Working day Office Building.
Table 1.
Group of Appliance Behavior and Ratios on Working day Office Building.
The table above summarizes the behavior and energy consumption ratios of different appliance groups within the office building during a typical working day. The data were collected based on specific time periods, categorizing usage into daytime working hours and nighttime non-working hours. The HVAC system, for example, shows a gradual increase in consumption starting at 08:00 AM, peaking between 13:00 and 16:00 with a 40% increase in usage. Indoor lighting maintains steady usage during working hours, while outdoor lighting and nighttime indoor lighting have minimal usage. Electronics and other devices exhibit steady consumption during the day with a slight reduction at night. This detailed breakdown is crucial for understanding how different appliances contribute to overall energy consumption and for optimizing energy management strategies.
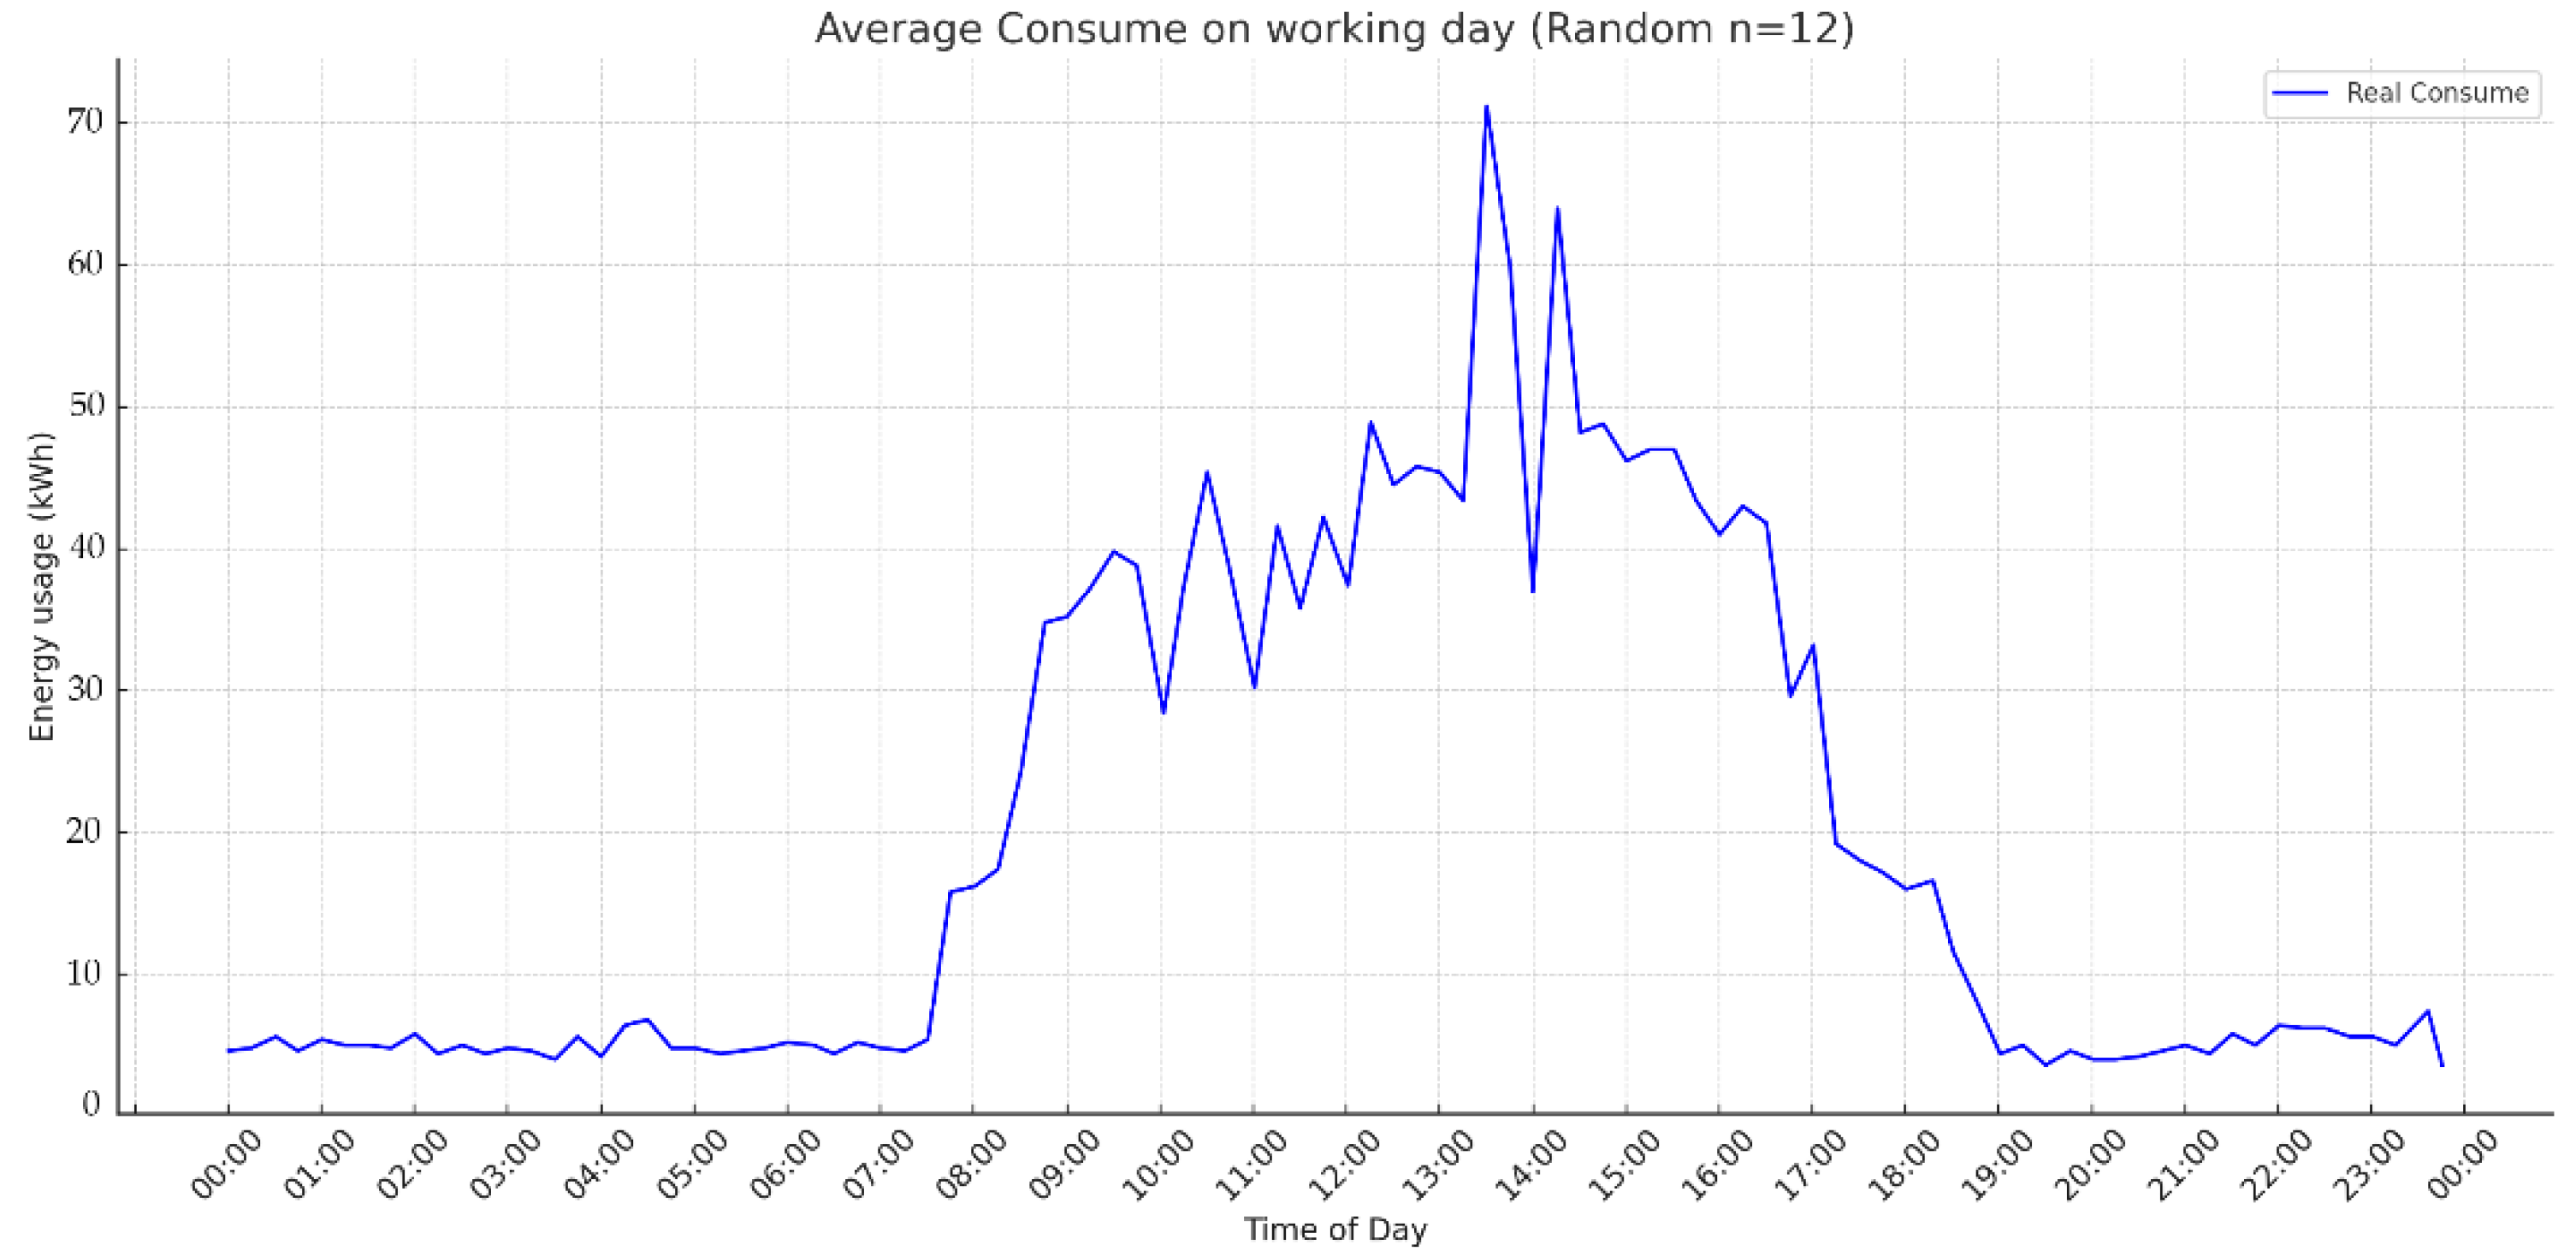
The graph illustrated in
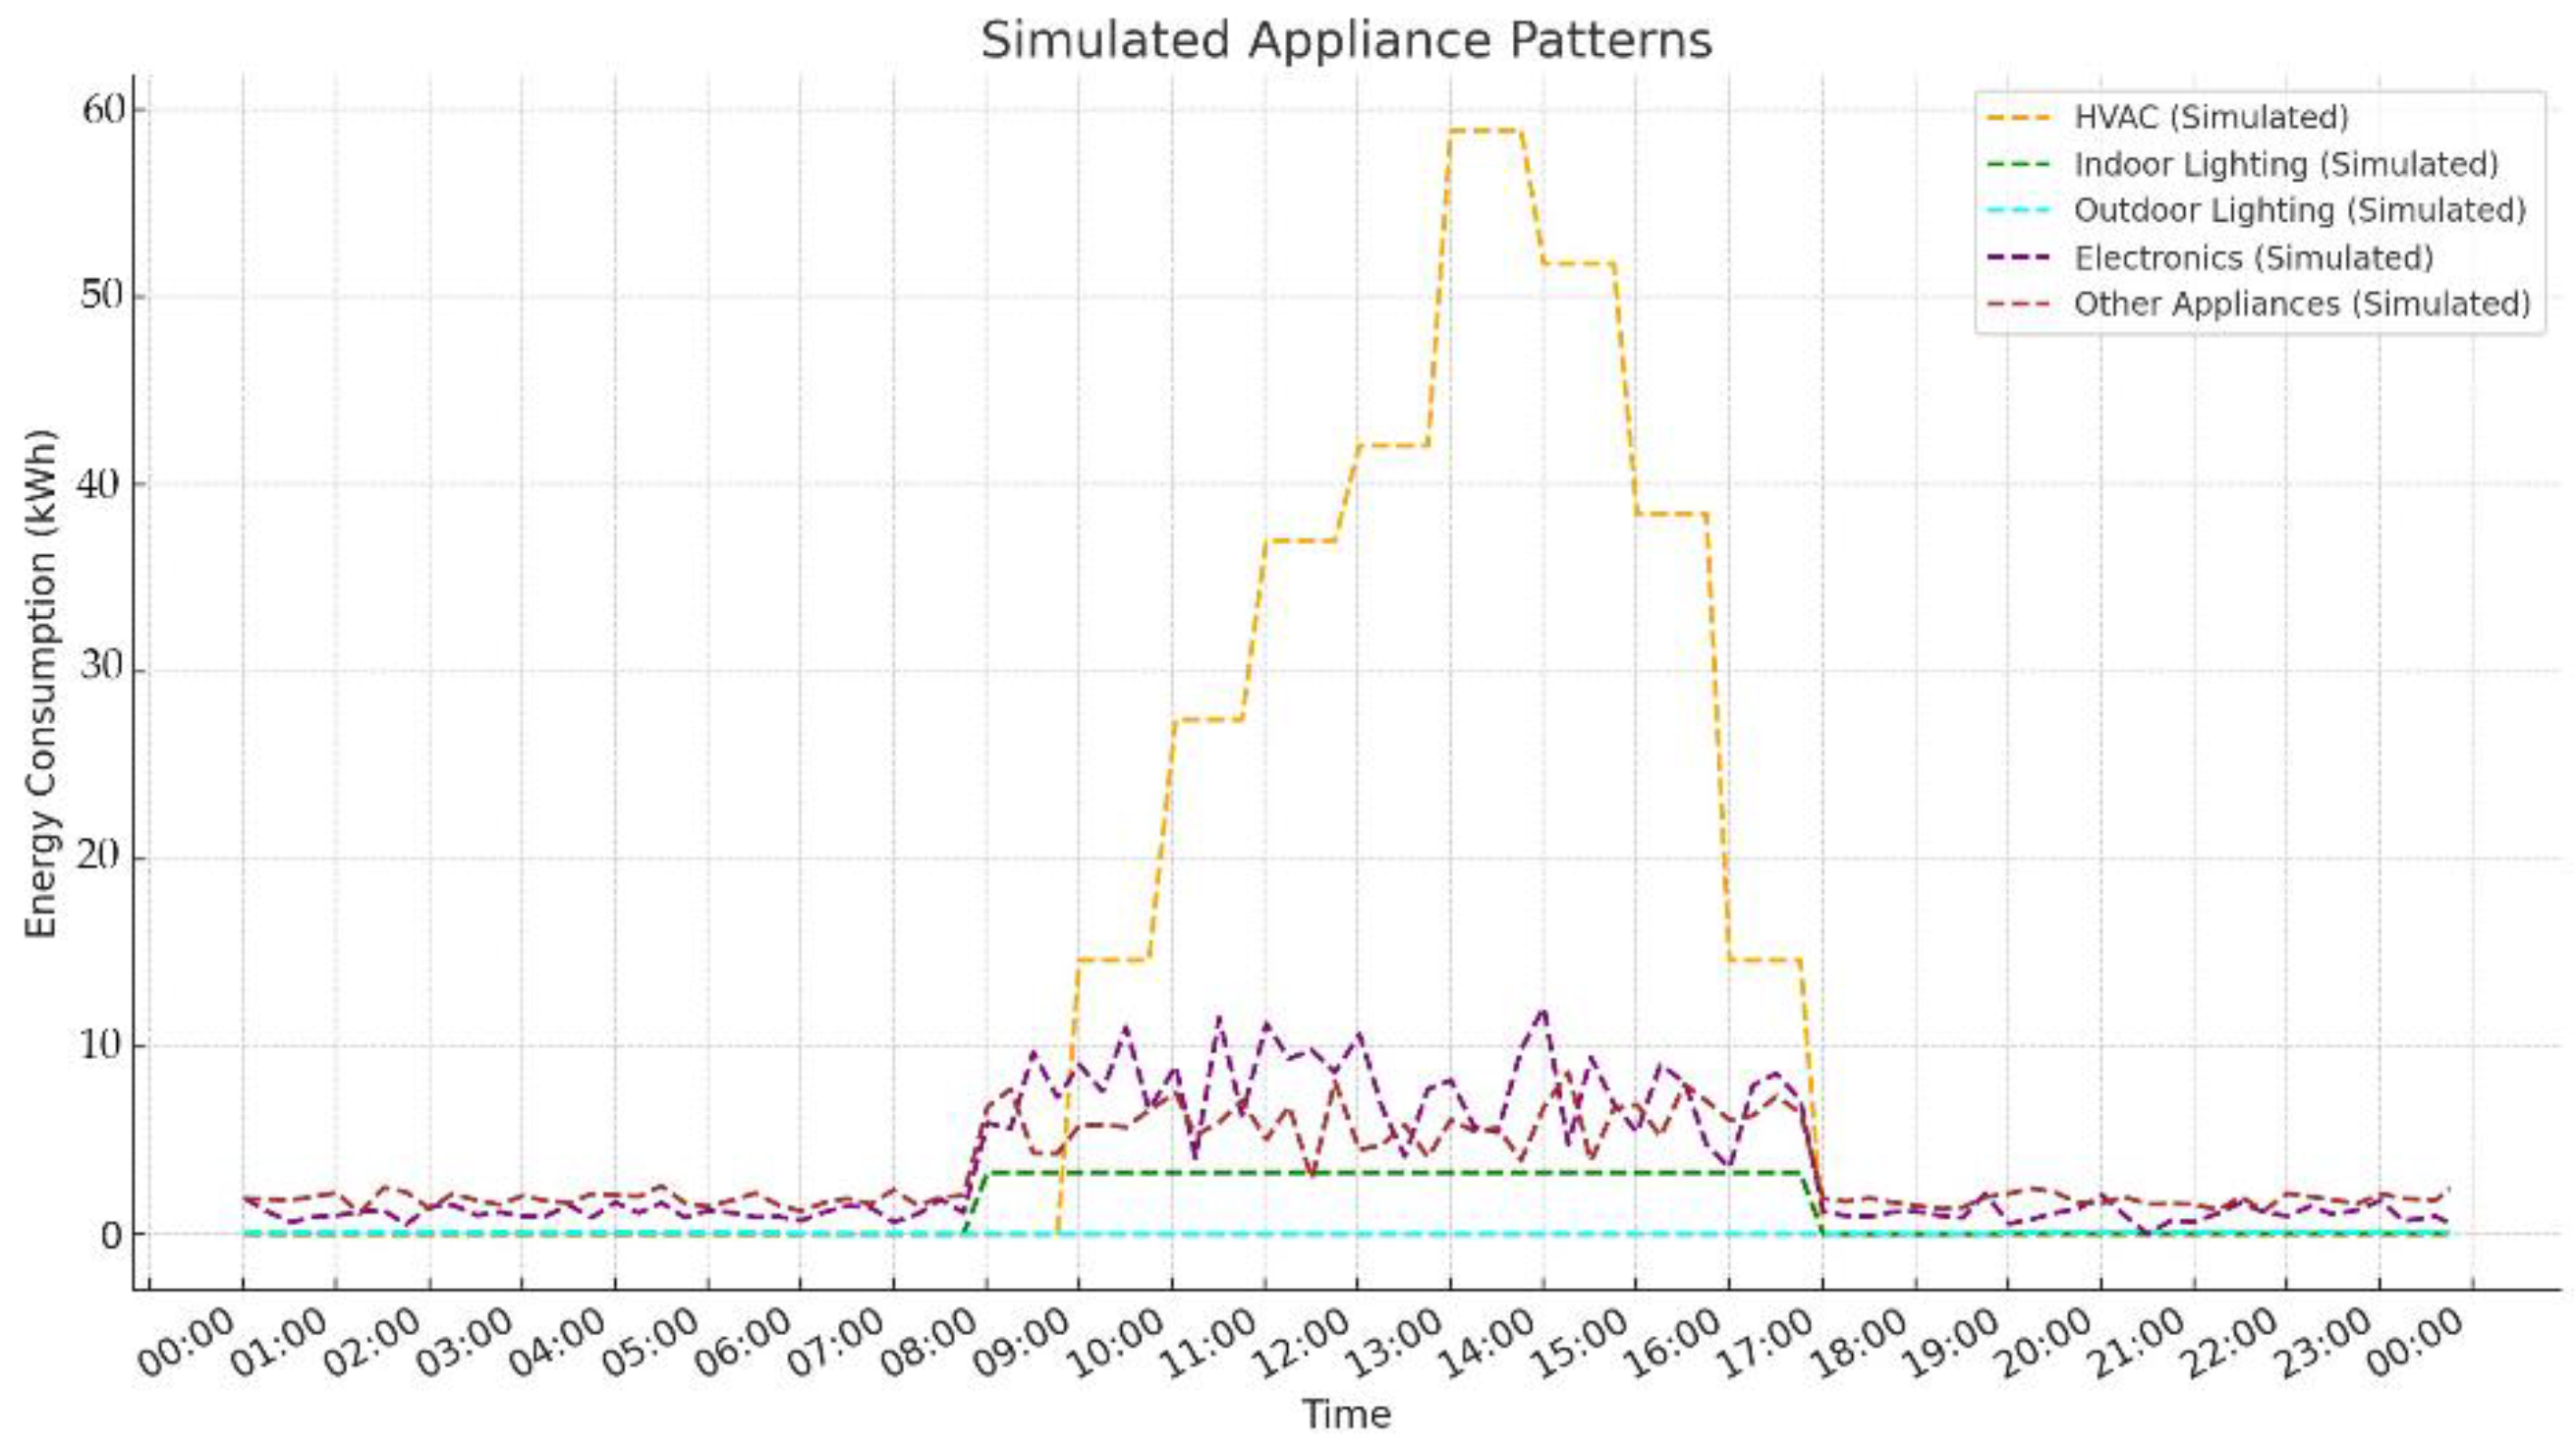
Figure 11 highlights the energy consumption patterns throughout a typical working day, with noticeable increases during the late morning and early afternoon, peaking around midday. It indicates that energy usage is lowest during the early morning hours and after working hours in the evening, consistent with reduced activity in the building during those times. This detailed daily pattern is crucial for understanding the building’s energy needs and for optimizing energy management strategies as disaggregation shown in
Figure 12.
Simulate Appliance Patterns form Behavioral Data and Appliance Ratios
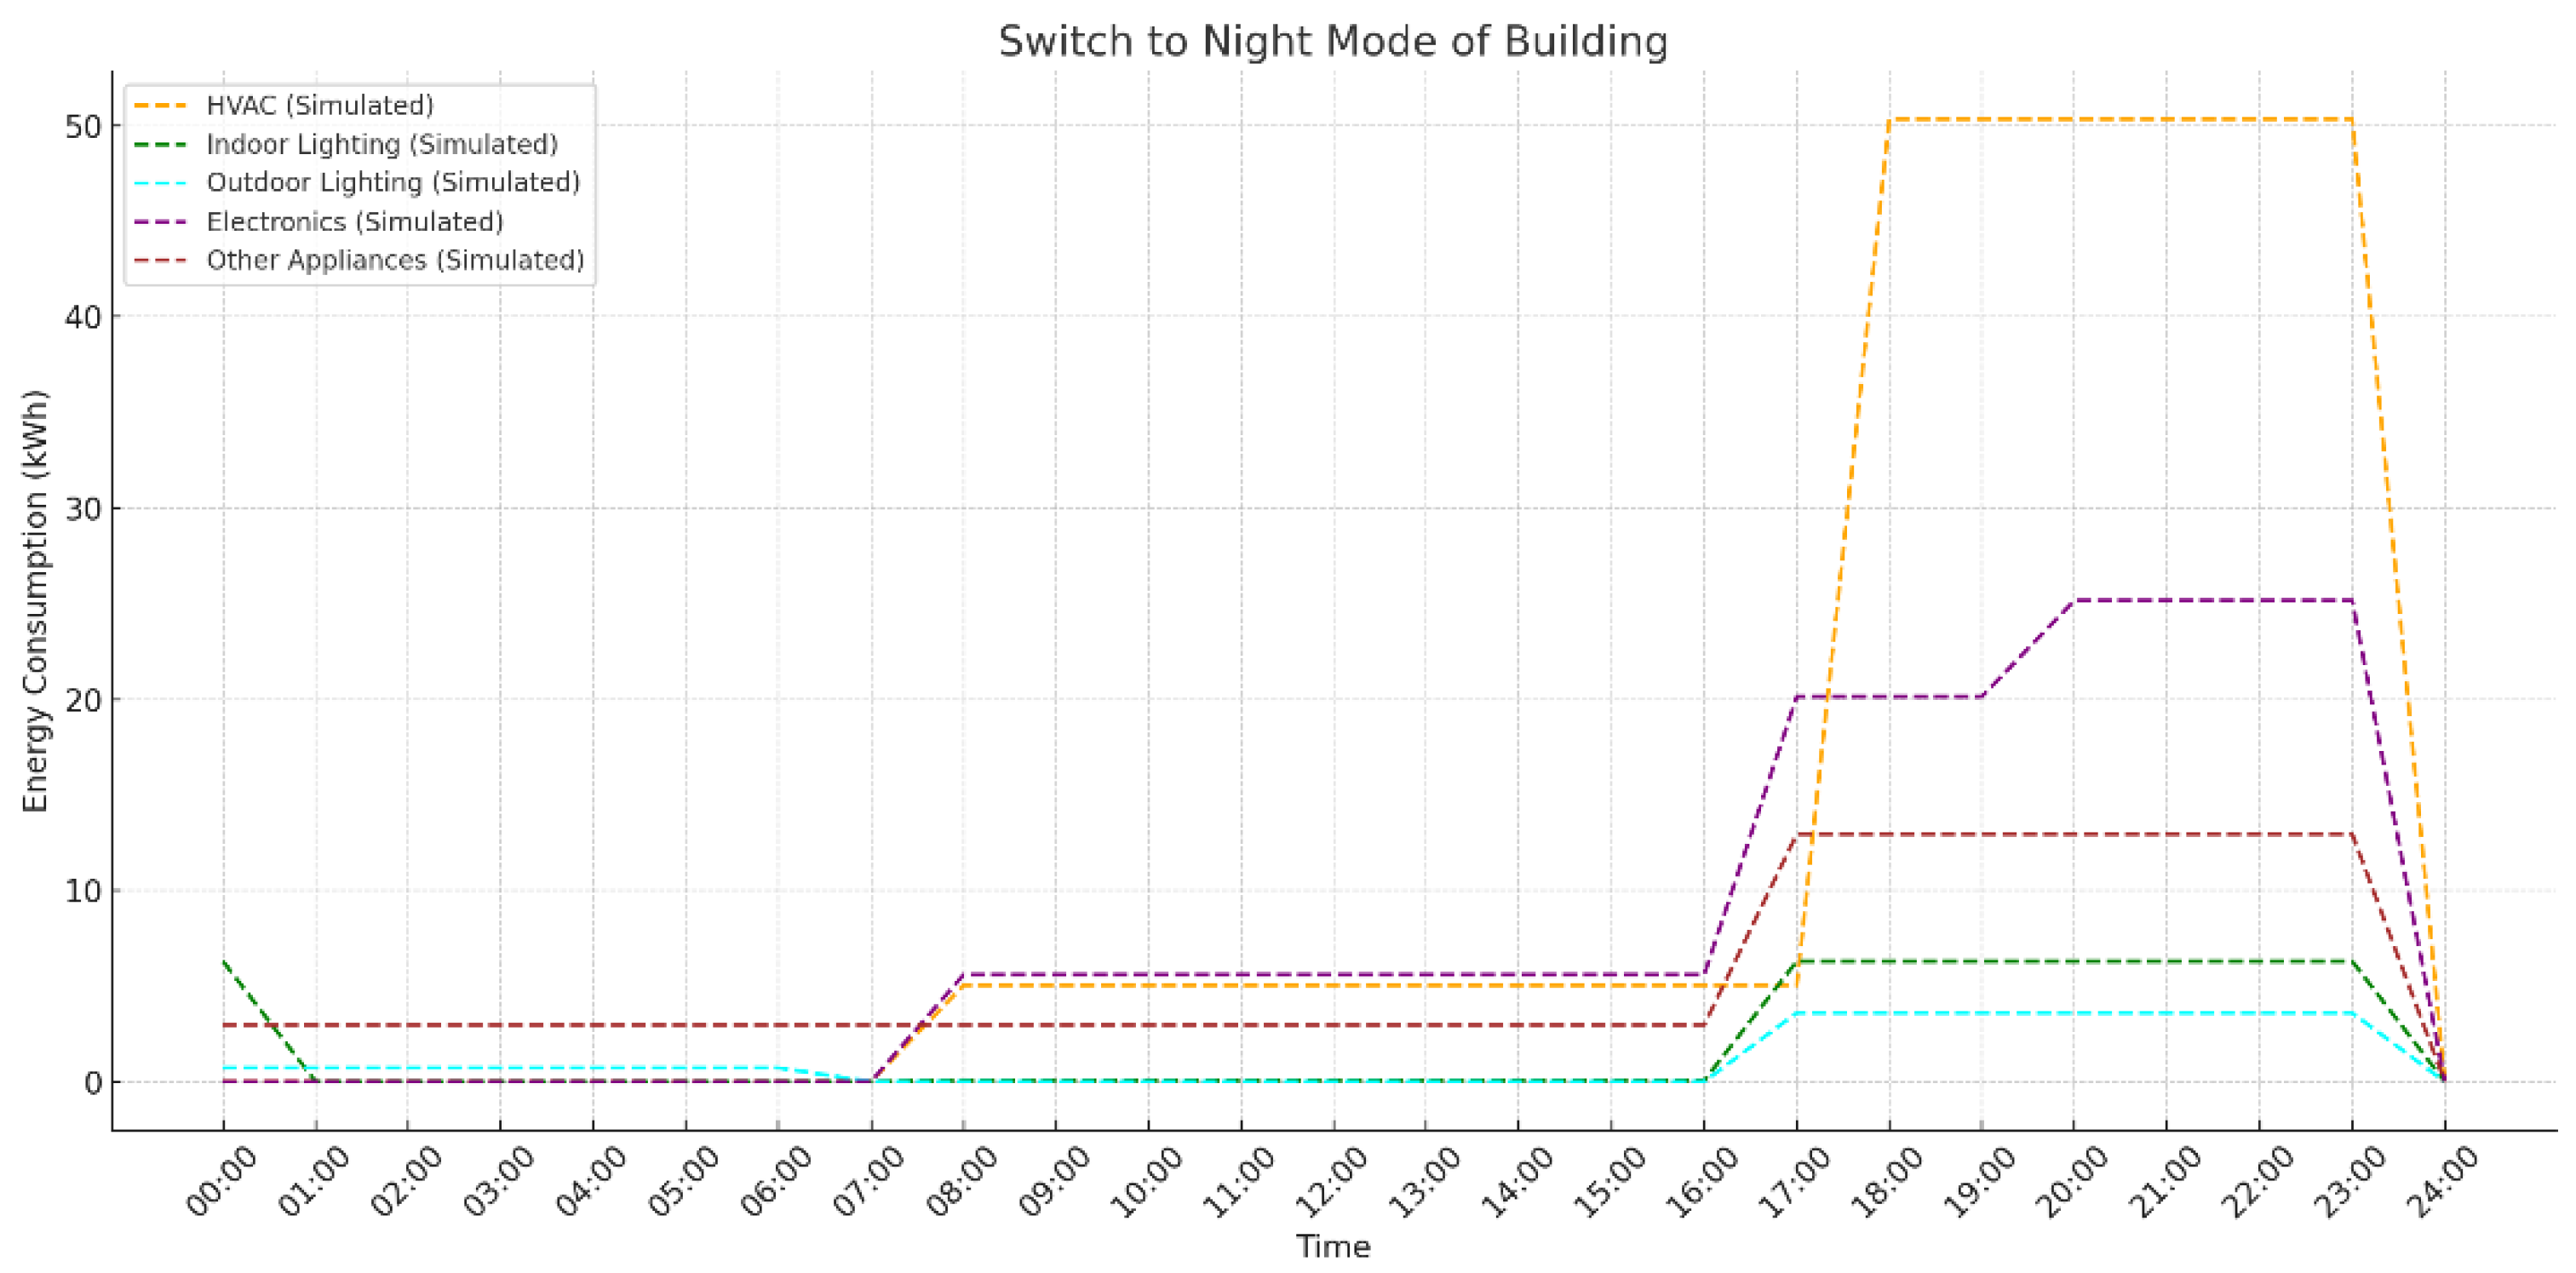
Switch to Nightly Building Consumption Mode Based on Appliance Ratios and Behavioral Data
Nightly building consumption patterns using switch to night mode scenario based on appliance ratios, behavior, and total consumption data, with an assumed total daily energy consumption of 786 kWh. This simulation is conducted with the same 160 kW solar system as the basis. By applying the predefined appliance ratios and considering typical building behaviors during nighttime hours, the simulation models the contribution of different appliances to the overall energy usage at night. This analysis helps to understand how energy is distributed among various appliances and identifies opportunities for optimizing energy management, particularly in reducing consumption during low-activity periods. The findings can be used to refine energy strategies, such as adjusting appliance operation schedules or enhancing the efficiency of the solar system and energy storage usage during the night.
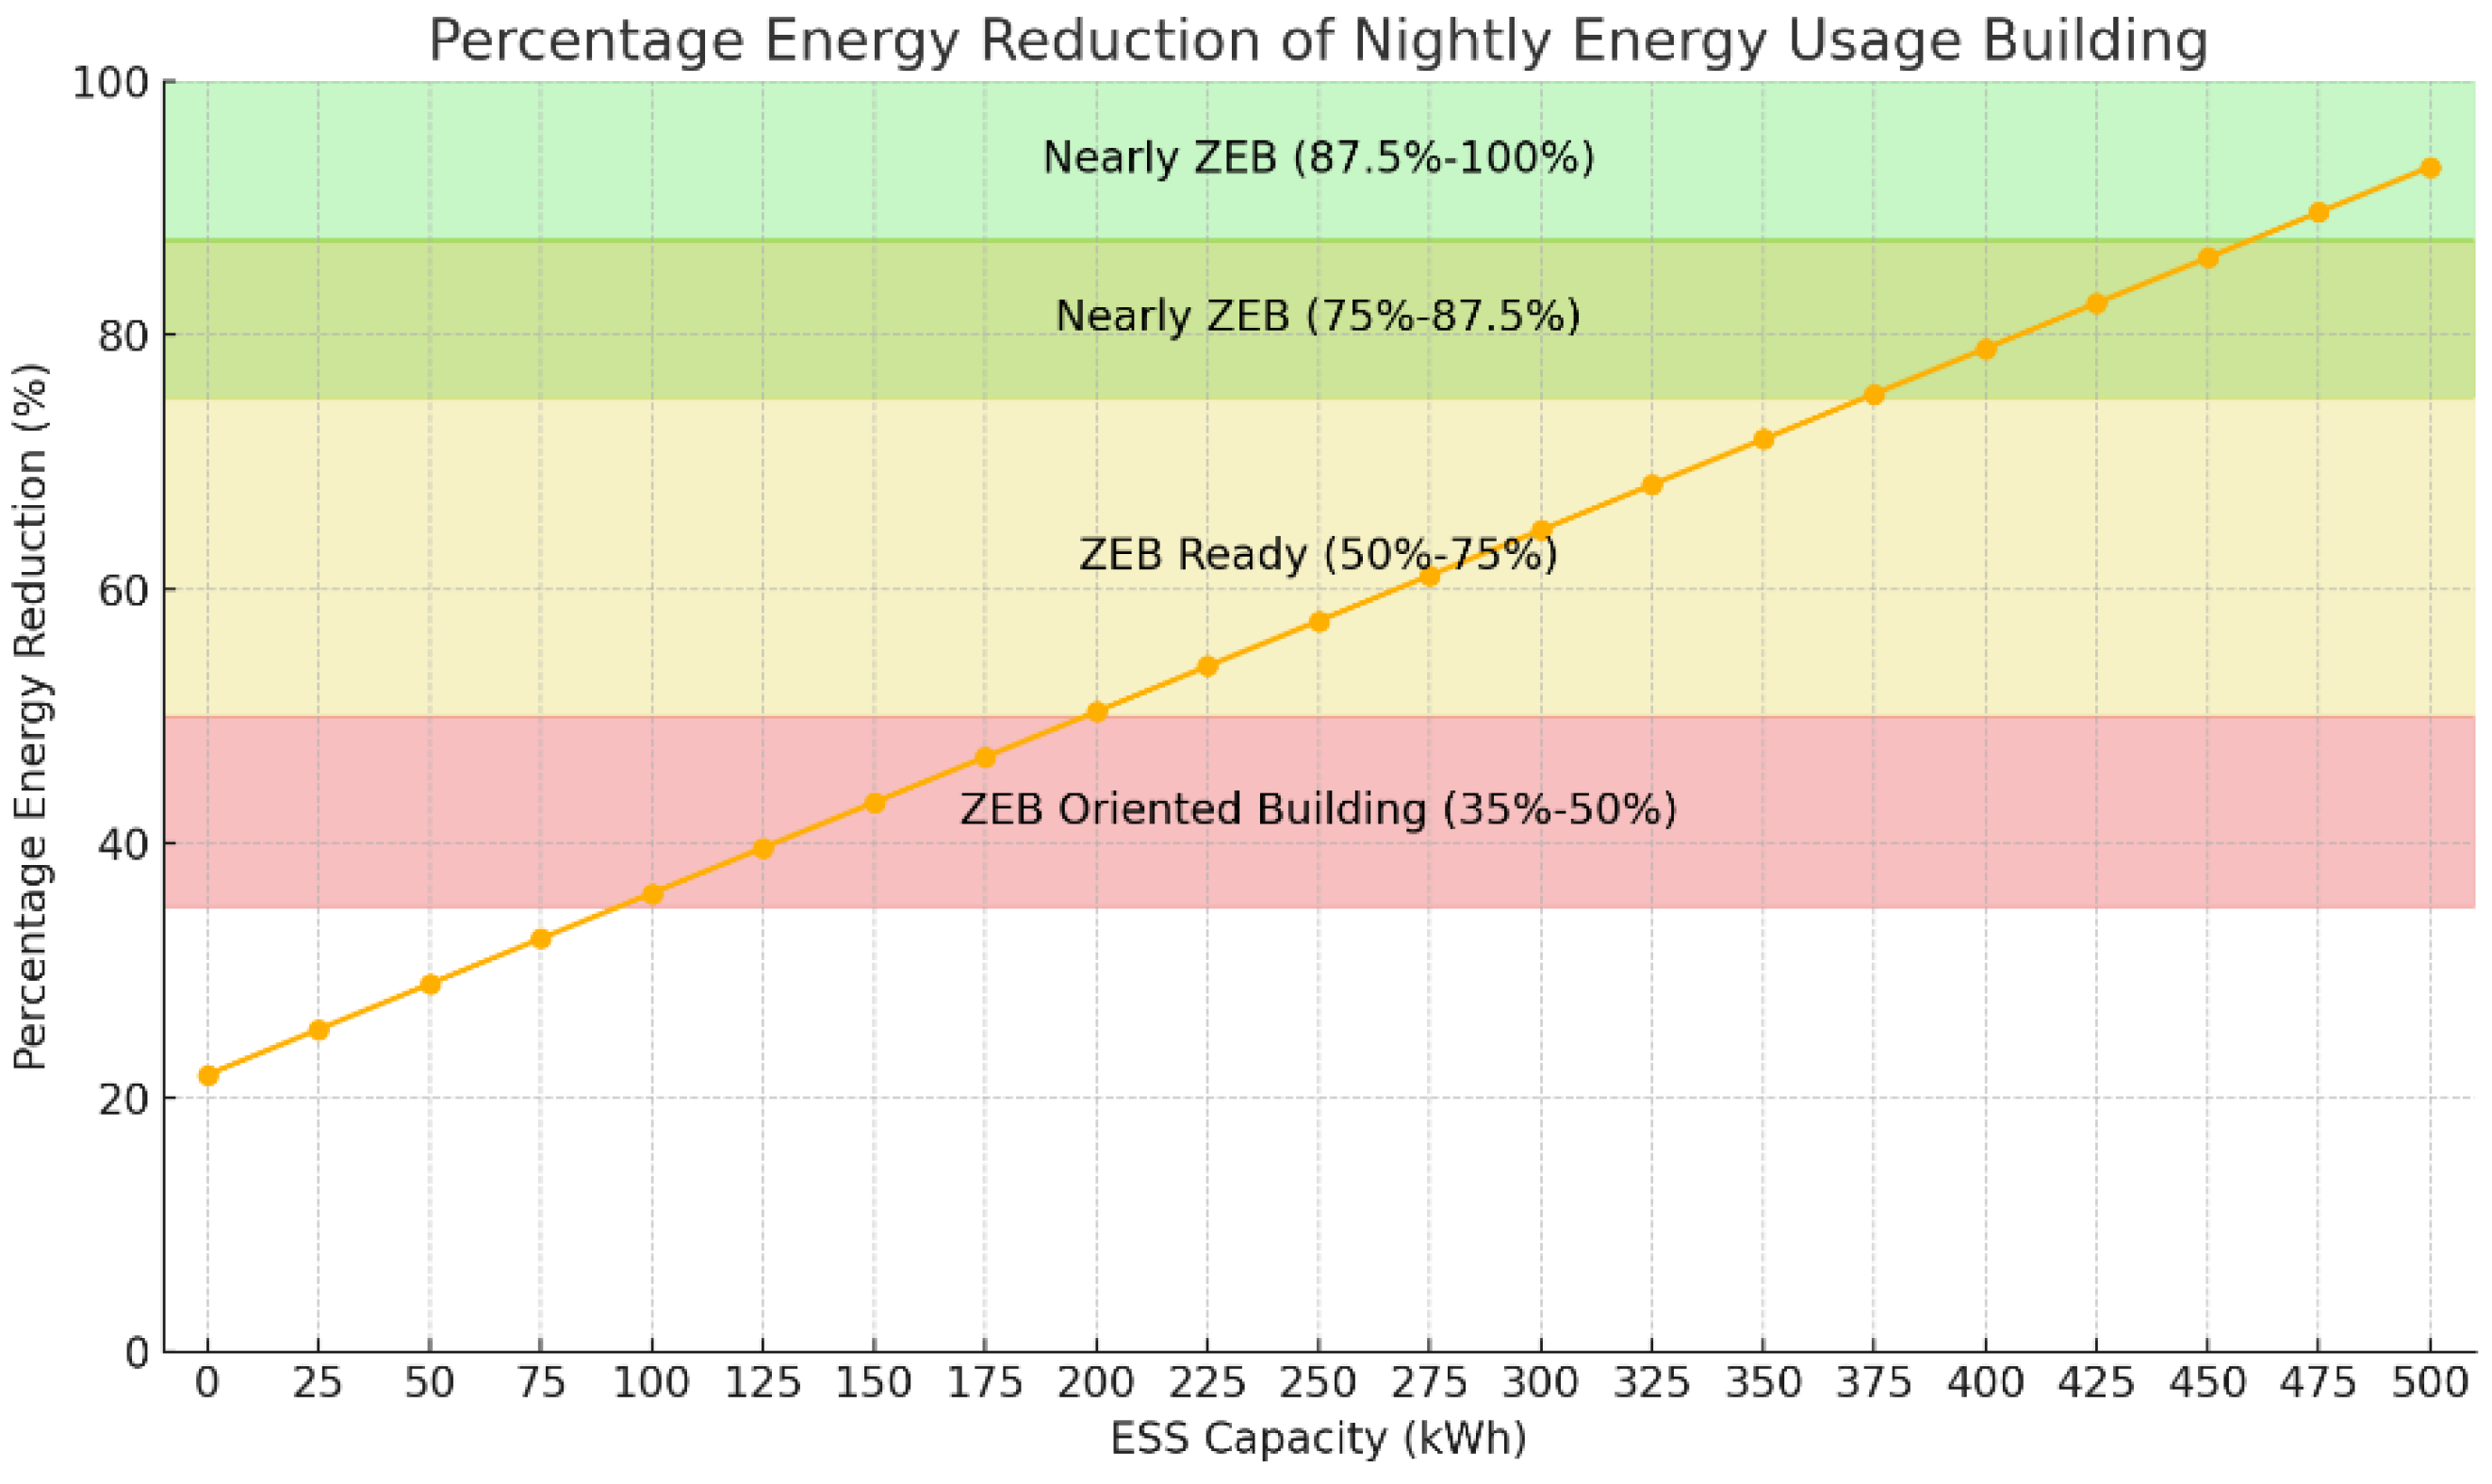
Figure 14.
This figure illustrates the energy usage reduction for a building primarily consuming energy during night hours, simulated with a 160kW solar system and varying ESS (Energy Storage System) capacities.
Figure 14.
This figure illustrates the energy usage reduction for a building primarily consuming energy during night hours, simulated with a 160kW solar system and varying ESS (Energy Storage System) capacities.
The goal is to identify the point at which the building’s energy efficiency reaches the Nearly ZEB (Zero Energy Building) Level 1 zone, characterized by an energy reduction of 87.5% to 100%. As shown in the graph, the energy reduction percentage increases as the ESS capacity is expanded. The transition into the Nearly ZEB Level 1 zone occurs at an ESS capacity of 475 kWh. At this point, the energy efficiency of the building has been optimized to a level where nearly all of the solar energy generated is utilized effectively, minimizing energy losses and aligning with the Nearly ZEB Level 1 criteria. This analysis indicates that for a building with substantial night-time energy consumption, a 160kW solar system paired with a 475kWh ESS is necessary to achieve the highest energy efficiency standards.
4. Conclusions
This study provides a comprehensive analysis of how varying solar generation capacities and energy storage system (ESS) sizes can impact the energy efficiency and overall performance of Zero-Energy Buildings (ZEBs).
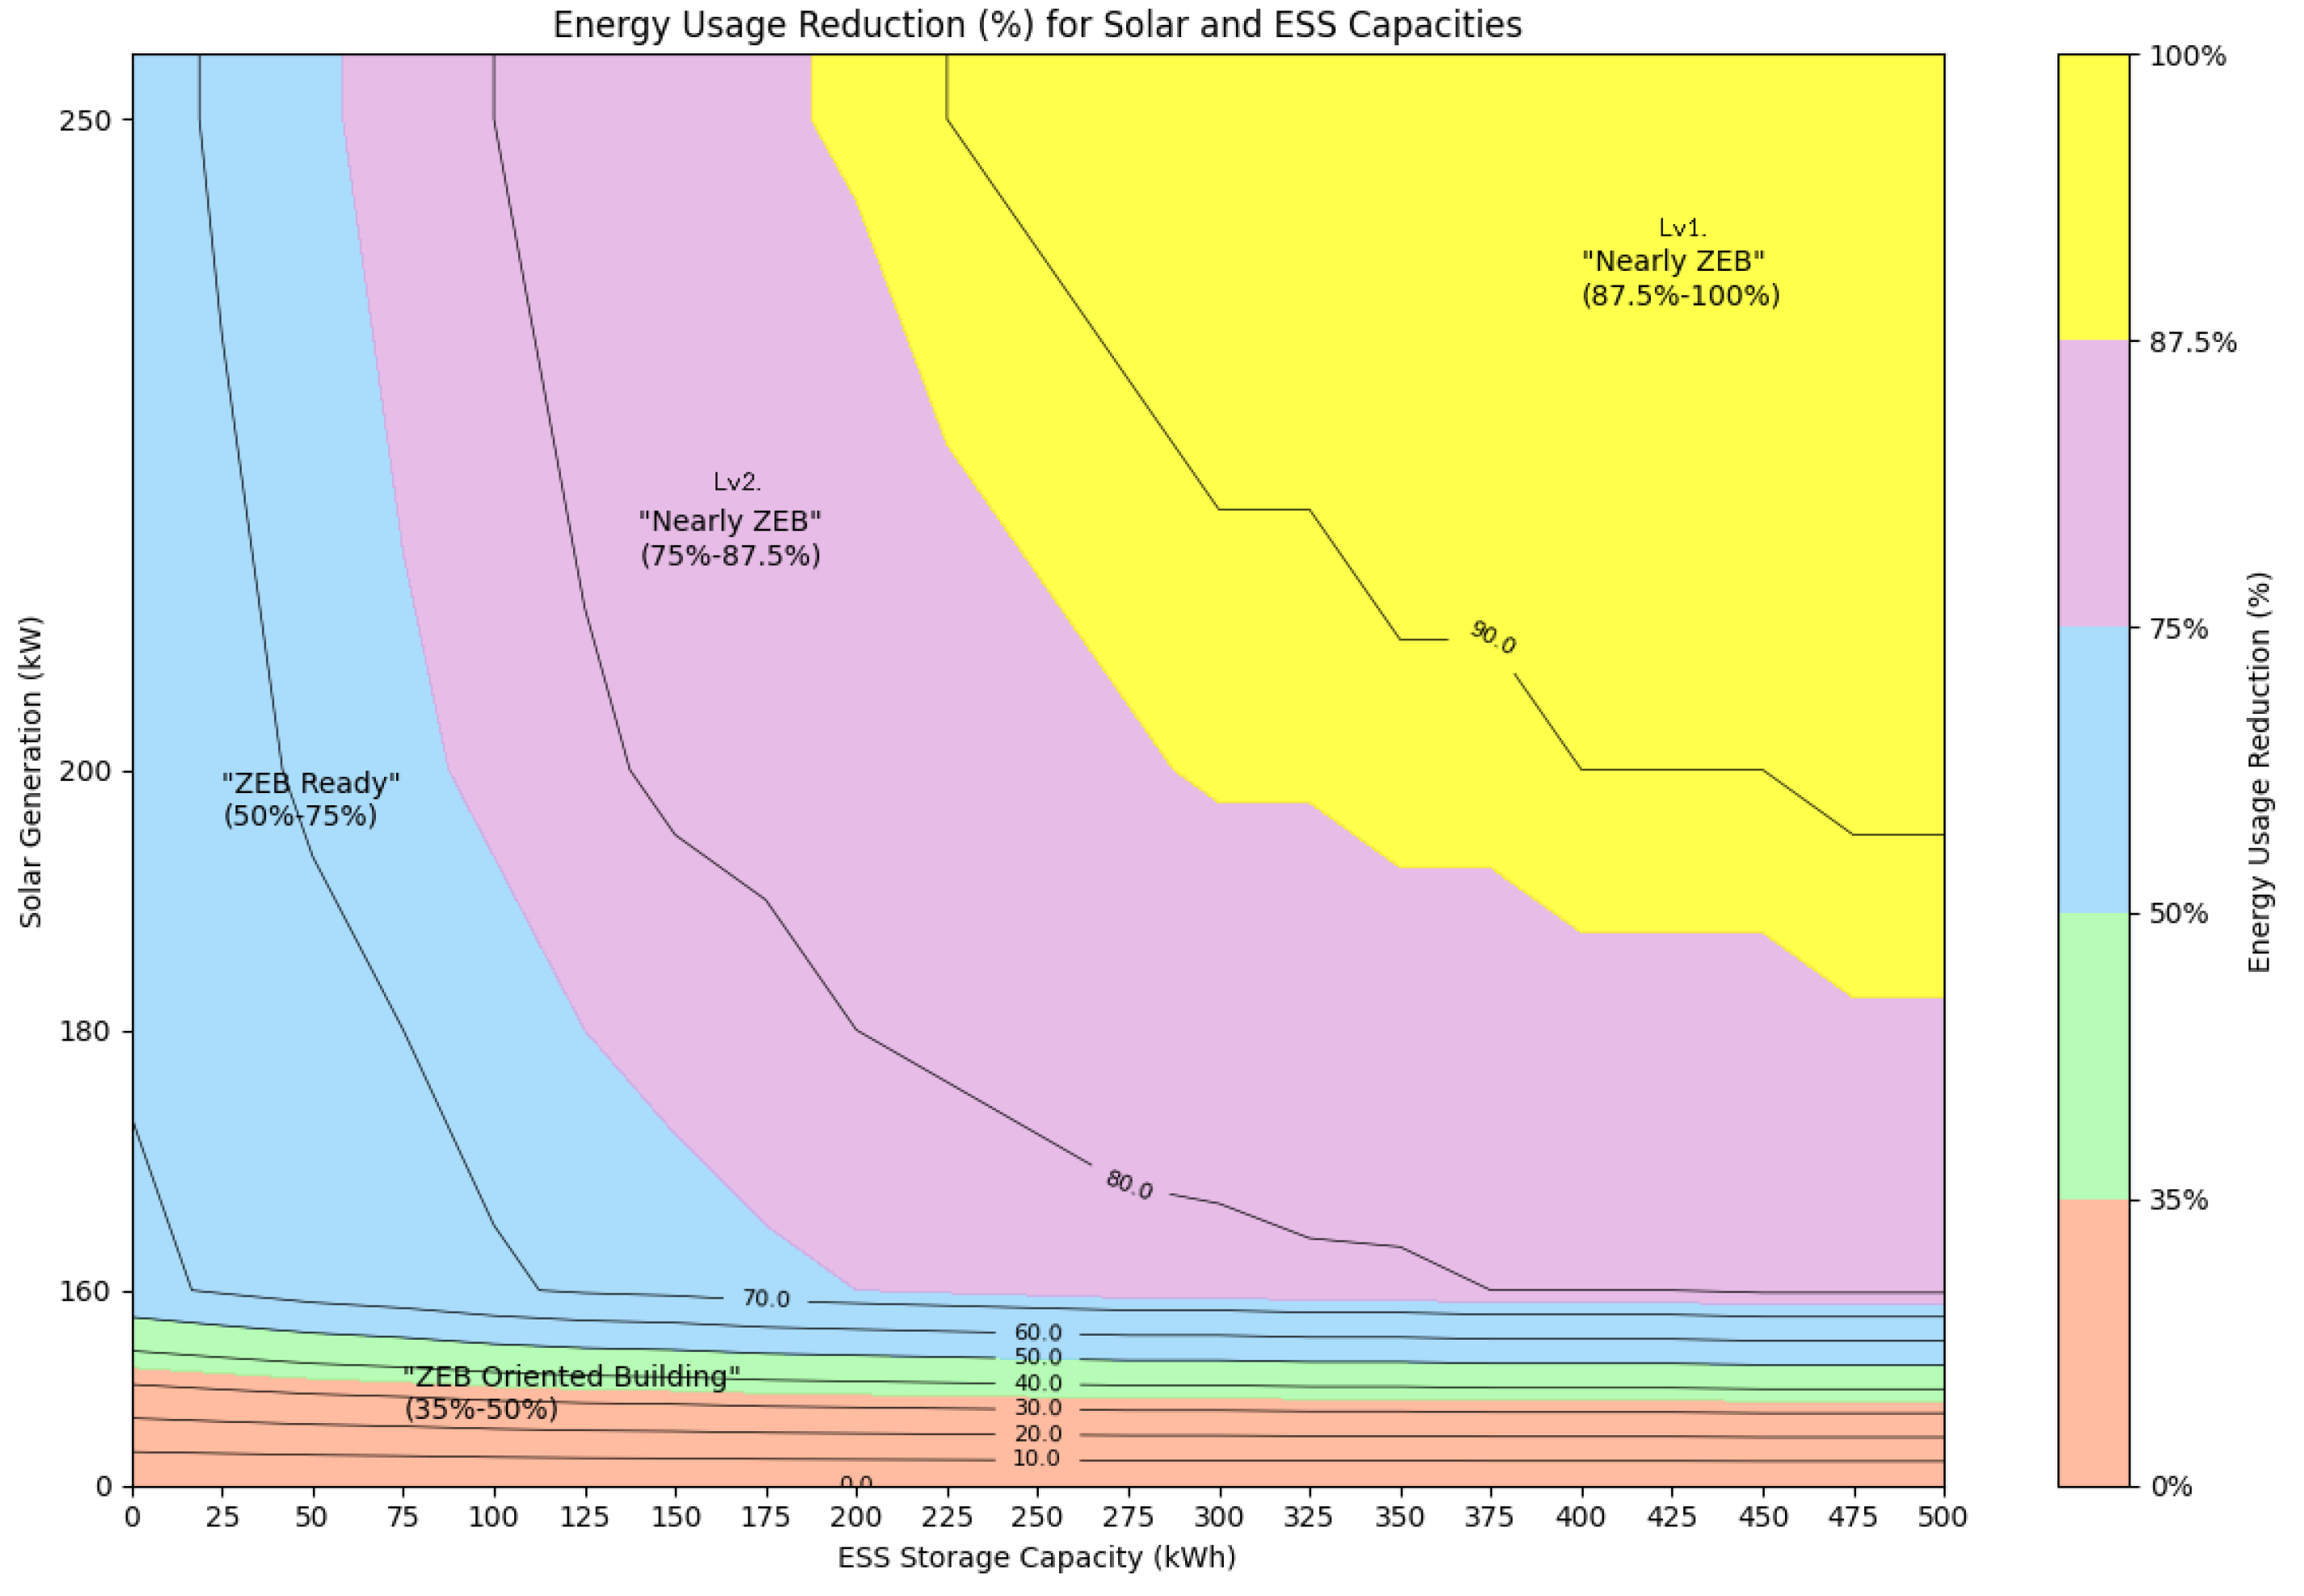
Figure 15.
The contour plot presented in this research illustrates that achieving the Nearly ZEB Level 1 zone (87.5%-100% energy reduction) is feasible with the right combination of solar PV capacity and ESS storage.
Figure 15.
The contour plot presented in this research illustrates that achieving the Nearly ZEB Level 1 zone (87.5%-100% energy reduction) is feasible with the right combination of solar PV capacity and ESS storage.
Key findings indicate that larger solar generation capacities, particularly those of 200kW and above, paired with appropriately scaled ESS capacities of 275kWh and higher, are essential to approach or achieve Nearly ZEB Level 1 status. Specifically, the 200kW system reaches the Nearly ZEB Level 1 zone with an ESS capacity of approximately 275kWh, while the 250kW system achieves Nearly ZEB Level 1 with an ESS capacity starting from 175kWh. The study also highlights that increasing the ESS capacity significantly enhances the building’s ability to reduce energy usage, transitioning from ZEB Oriented Building zones to ZEB Ready, and finally to Nearly ZEB Level 1.
When change mode to night activity behavior of the building has on the energy performance of different systems, as demonstrated by the nightly energy usage in a building and the simulated appliance patterns. This figure shows how various appliances, such as HVAC systems, lighting, and electronics, contribute to the overall energy consumption throughout the night. The HVAC system, with its peak consumption during the late evening, plays a crucial role in the building’s energy profile, especially in systems designed for nightly operation. Achieving the Nearly ZEB Level 1 zone (87.5%-100% energy reduction) of nightly activity, the simulation is entering to Nearly ZEB Level 1 zone at 475kWh of Solar 160kW (Current System)
Notably, the building achieves the “Nearly ZEB Level 1” classification (87.5%-100% energy reduction) when the ESS capacity reaches higher levels, indicating that sufficient energy storage is crucial for maximizing energy efficiency in a building that primarily operates at night. This emphasizes the importance of appropriately scaling ESS capacity to meet the specific energy demands of different building types and usage patterns, ensuring optimal energy performance and progression towards Zero-Energy Building (ZEB) status.
5. Discussion
The findings of this research underscore the critical importance of optimizing both solar photovoltaic (PV) system capacity and energy storage system (ESS) size to achieve the highest levels of energy efficiency in Zero-Energy Buildings (ZEBs). This study offers practical insights into the relationship between ESS capacity and energy reduction performance, demonstrating that as the ESS capacity increases, the building’s energy usage reduction significantly improves, moving from the ZEB Oriented Building zone (35%-50% energy reduction) to the ZEB Ready zone (50%-75% energy reduction), and eventually approaching the Nearly ZEB Level 1 zone (87.5%-100% energy reduction).
However, achieving Nearly ZEB Level 1 is not solely about technical optimization; it also requires careful consideration of cost, feasibility, and financial implications [
25]. The deployment of larger ESS capacities or more extensive solar PV systems involves significant capital investment. Therefore, a comprehensive cost-benefit analysis is essential to determine the financial viability of these systems. This includes assessing the payback period or break-even point, where the savings in energy costs offset the initial investment. The feasibility of scaling up these systems must also be evaluated, considering available space, grid compatibility, and regulatory considerations [
26].
In practical terms, this means that while a well-sized solar PV system and an adequately scaled ESS are essential for reaching Nearly ZEB Level 1, the decision to implement these systems should be guided by a detailed financial model. This model should include not only the initial costs but also ongoing maintenance expenses, potential incentives or rebates, and the projected energy savings over the system’s lifetime [
27]. Additionally, factors such as the location of the building, local temperature variations, solar intensity, and seasonal changes should be considered for optimization, as these elements significantly influence energy generation and consumption patterns [
28]. Incorporating other types of renewable energy, such as biowaste, could also be explored as an alternative or supplementary approach [
29]. These renewable sources could complement solar energy, particularly in regions where solar intensity varies seasonally, thereby enhancing the overall resilience and efficiency of the building’s energy system [
30].
Moreover, the research emphasizes the importance of tailoring energy strategies to specific building behaviors, especially in buildings with distinct day and night energy usage patterns. Future work could expand on this by employing Non-Intrusive Load Monitoring (NILM) techniques [
31] to analyze overall energy consumption at the appliance or system level. This approach would provide a more granular understanding of how different behaviors influence energy usage, enabling even more precise interventions [
32].
NILM-based behavioral analysis offers several advantages, including the ability to provide detailed insights into the energy consumption patterns of different appliances and systems, which can reveal opportunities for further optimization [
33]. For example, understanding the exact times when HVAC or lighting systems consume the most energy could lead to more effective scheduling and control strategies, further reducing energy waste. Integrating NILM data with emerging technologies such as AI-driven energy management systems could enable real-time optimization of energy consumption, enhancing building performance even further [
34,
35].
Author Contributions
Conceptualization, B.H. and P.A.; methodology, B.H.; software, N.J.; validation, P.A.; formal analysis, B.H.; investigation, B.H.; writing—original draft preparation, B.H.; writing—review and editing, P.A.; supervision, P.A.; project administration, B.H. All authors have read and agreed to the published version of the manuscript.
Funding
This research project was supported by Fundamental Fund 2023, Chiang Mai University (FF66/055) and also Thailand Science Research and Innovation (TSRI) [Grant numbers FRB660046/0162] and National Innovation Agency, Thailand.
Data Availability Statement
Not applicable.
Acknowledgments
This research is partially supported by Transformer and Application: Charoenchai M&E Co., Ltd.
Conflicts of Interest
The authors declare no conflict of interest.
Abbreviations
The following abbreviations are used in this manuscript:
| Acronyms Description |
| nZEB |
Nearly zero energy building |
| ZEB |
Zero energy building |
| ESS |
Energy Storage System |
| HVAC |
Heating, ventilation, and air conditioning |
| PV |
Photovoltaic |
| SHASE |
The Society of Heating, Air-Conditioning and Sanitary Engineers of Japan |
| NILM |
Non-Intrusive Load Monitoring |
References
- Marszal, A.J.; Heiselberg, P.; Bourrelle, J.S.; Musall, E.; Voss, K.; Sartori, I.; Napolitano, A. Zero energy buildings: A critical review of definitions and calculation methodologies. Energy and Buildings 2011, 43, 971–979. [Google Scholar] [CrossRef]
- Liu, Z.; Zhou, Q.; Tian, Z.; He, B.; Jin, G. A comprehensive analysis on definitions, development, and policies of nearly zero energy buildings in China. Renewable and Sustainable Energy Reviews 2019, 114. [Google Scholar] [CrossRef]
- Khashehchi, M.; Thangavel, S.; Rahmanivahid, P.; Heidari, M.; Kumar, A. Net zero energy buildings. Sustainable Technologies for Energy Efficient Buildings 2024, 1, 20. [Google Scholar]
- Mischos, S.; Dalagdi, E.; Vrakas, D. Intelligent energy management systems: a review. Artificial Intelligence Review 2023, 56, 11635–11674. [Google Scholar] [CrossRef]
- Sharma, V. Integrating Renewable Energy with Building Management Systems: Pathways to Sustainable Infrastructure. Journal of Waste Management & Recycling Technology 2024, 2. [Google Scholar]
- UNEP. (n.d.). Energy Efficiency in Buildings: UNEP Information Sheet. United Nations Environment Programme. Retrieved from https://renewableinstitute.org/images/unep info sheet - ee buildings.pdf (accessed on 2021).
- Loh, J.R.; Bellam, S. Towards net zero: Evaluating energy security in Singapore using system dynamics modelling. Applied Energy 2024, 358. [Google Scholar] [CrossRef]
- Liu, J.; Wu, H.; Huang, H.; Yang, H. Renewable energy design and optimization for a net-zero energy building integrating electric vehicles and battery storage considering grid flexibility. Energy Conversion and Management 2023, 298. [Google Scholar] [CrossRef]
- Goal 7 Affordable and Clean Energy. Sustainable Development GOALS. Available online: https://www.un.org/sustainabledevelopment/energy/.
- Xu, X.; Feng, G.; Chi, D.; Liu, M.; Dou, B. Optimization of Performance Parameter Design and Energy Use Prediction for Nearly Zero Energy Buildings. Energies 2018, 11. [Google Scholar] [CrossRef]
- Aranzabal, I.; Cornejo, J.G.; López, I.; Zubiria, A.; Mazón, J.; Arostegui, A.F.; Gaztañaga, H. Optimal Management of an Energy Community with PV and Battery-Energy-Storage Systems. Energies 2023, 16. [Google Scholar] [CrossRef]
- Guideline for ZEB (Net-Zero-Energy-Building) definition and evaluation method, SHASE.J 2015. Available online: https://www.rehva.eu/rehva-journal/chapter/current-situation-and-actions-for-zeb-in-japan.
- Capozzoli, A.; Piscitelli, M.S.; Gorrino, A.; Ballarini, I.; Corrado, V. Data analytics for occupancy pattern learning to reduce the energy consumption of HVAC systems in office buildings. Sustainable Cities and Society 2017, 35, 198–208. [Google Scholar] [CrossRef]
- Yun, G.Y.; Kim, H.; Kim, J.T. Effects of occupancy and lighting use patterns on lighting energy consumption. Energy and Buildings 2012, 46, 152–158. [Google Scholar] [CrossRef]
- Cruz, C. Behavioral Analysis and Pattern Validation. Sustainable Energy Efficient Communities 2024, 61–92. [Google Scholar]
- Venturi, E.; Ochs, F.; Dermentzis, G. Identifying the influence of user behaviour on building energy consumption based on model-based analysis of in-situ monitoring data. Journal of Building Engineering 2024, 64. [Google Scholar] [CrossRef]
- Zhou, K.; Yang, S. Understanding household energy consumption behavior: The contribution of energy big data analytics. Renewable and Sustainable Energy Reviews 2016, 56. [Google Scholar] [CrossRef]
- Babacan, O.; Torre, W.; Kleissl, J. Siting and sizing of distributed energy storage to mitigate voltage impact by solar PV in distribution systems. Solar Energy 2017, 146, 199–208. [Google Scholar] [CrossRef]
- MB Kane. Modeling Human-in-the-Loop Behavior and Interactions with HVAC Systems. Annual American Control Conference (ACC) 2018, 4628-4633.
- Reveiu, A.; Smeureanu, I.; Dardala, M.; Kanala, R. Modelling Domestic Lighting Energy Consumption in Romania by Integrating Consumers Behavior. Procedia Computer Science 2015, 52, 812–818. [Google Scholar] [CrossRef]
- Somavat, P.; Namboodiri, V. Energy Consumption of Personal Computing Including Portable Communication Devices. Journal of Green Engineering 2011, 447–475. [Google Scholar]
- Roth, K.W.; Goldstein, F.; Kleinman, J. Energy Consumption by Office and Telecommunications Equipment in Commercial Buildings. Energy Consumption Baseline 2002, 1. [Google Scholar]
- Cauwer, C.; Mierlo, J.; Coosemans, T. Energy Consumption Prediction for Electric Vehicles Based on Real-World Data. Energies 2015, 8, 8573–8593. [Google Scholar] [CrossRef]
- Ito, T.; Fukuda, H.; Shimaoka, H. Definition of Zero Energy Buildings and Efforts of Obayashi Corp. 大林組技術研究所報 2016, 80 .
- Abadie, L.M. Valuation of Long-Term Investments in Energy Assets under Uncertainty. Energies 2009, 2, 738–768. [Google Scholar] [CrossRef]
- Zakis, J.; Suzdalenko, A.; Krievs, O.; Ribickis, L. Feasibility Study of Renewable Energy Systems in Households. IEEE 60th International Scientific Conference on Power and Electrical Engineering of Riga Technical University (RTUCON) 2019, 1–6. [Google Scholar]
- Imelda, *!!! REPLACE !!!*; Fripp, M.; Roberts, M.J. Variable pricing and the cost of renewable energy. NBER WORKING PAPER SERIES 2018. [Google Scholar]
- Polcyn, J.; Us, Y.; Lyulyov, O.; Pimonenko, T.; Kwilinski, A. Factors Influencing the Renewable Energy Consumption in Selected European Countries. Energies 2022, 15. [Google Scholar] [CrossRef]
- Córdova, R.S.; Ortega, R.R. Renewable Energy Sources and Energy Production: A Bibliometric Analysis of the Last Five Years. Sustainability 2023, 2023. 15, 10499. [Google Scholar] [CrossRef]
- Araújo, N. M. F. T. S.; Medeiros, S.E.L.; Abrahão, R. Variability and Sensitivity of Models Used to Estimate Photovoltaic Production. Energies 2024, 17, 4177. [Google Scholar] [CrossRef]
- Sonwani, P. K.; Swarnkar, M.; Singh, G.; Soni, A.; Swarnkar, A.; Niazi, K.R. A Review on Non-Intrusive Load Monitoring. International Conference on Power, Instrumentation, Energy and Control (PIECON) 2023, 1-4.
- Mari, S.; Bucci, G.; Ciancetta, F.; Fiorucci, E.; Fioravant, A. A Review of Non-Intrusive Load Monitoring Applications in Industrial and Residential Contexts. Energies 2022, 15, 9011. [Google Scholar] [CrossRef]
- Peng, C.; Lin, G.; Zhai, S.; Ding, Y.; He, G. Non-Intrusive Load Monitoring via Deep Learning Based User Model and Appliance Group Model. Energies 2020, 13, 5629. [Google Scholar] [CrossRef]
- Hernández, Á.; Ruano, A.; Ureña, J.; Ruano, M.G.; Garcia, J.J. Applications of NILM Techniques to Energy Management and Assisted Living. IFAC-PapersOnLine 2019, 52, 164–171. [Google Scholar] [CrossRef]
- Monteiro, R.V.A.; Santana, J.C.R.; Teixeira, R.F.S.; Bretas, A.S.; Aguiar, R.; Poma, C.E.P. Non-intrusive load monitoring using artificial intelligence classifiers: Performance analysis of machine learning techniques. Electric Power Systems Research 2021, 198. [Google Scholar] [CrossRef]
|
Disclaimer/Publisher’s Note: The statements, opinions and data contained in all publications are solely those of the individual author(s) and contributor(s) and not of MDPI and/or the editor(s). MDPI and/or the editor(s) disclaim responsibility for any injury to people or property resulting from any ideas, methods, instructions or products referred to in the content. |
© 2024 by the authors. Licensee MDPI, Basel, Switzerland. This article is an open access article distributed under the terms and conditions of the Creative Commons Attribution (CC BY) license (http://creativecommons.org/licenses/by/4.0/).
