Submitted:
31 August 2024
Posted:
02 September 2024
You are already at the latest version
Abstract
Keywords:
1. Introduction
2. Materials and Methods
2.1. Methodology
- i)
-
High-Resolution 3D Data Capture:
- dense point clouds are generated through techniques such as LiDAR (Light Detection and Ranging), laser scanning, and photogrammetry. These methods provide high resolution spatial data, capturing millions of points that represent the surface geometry of the scanned object or site. The resulting point clouds contain precise information about the position, shape, and texture of the surface, making them ideal for detailed analysis and change detection [21,22];
- alignment and registration of point clouds: the accurate alignment and registration of point clouds from different time periods is a crucial step in the change detection process. Octree data structures and iterative closest point algorithms are effective methods for organizing and aligning the point clouds, ensuring a high level of accuracy in the spatial integration of the datasets [23].
- ii)
-
Temporal Comparisons:
- change detection involves comparing point clouds captured at different times (temporal snapshots) to identify changes. This requires accurate alignment (registration) of the point clouds to ensure that comparisons are made between corresponding points in the data sets [24];
- temporal comparisons help in understanding how the site or object has evolved, providing insights into processes such as erosion, structural deformation, and material loss [25].
- iii)
-
Mathematical and Statistical Analysis:
- the comparison of point clouds involves mathematical and statistical techniques to quantify differences, these methods measure changes in distance, volume, and surface characteristics between the data sets [26];
- commonly used metrics include Euclidean distances, volumetric changes, and surface deviation measures. These metrics provide quantitative assessments of changes, which are critical for objective analysis and decision making [19].
2.2. Case study
2.4. Tools and Dataset
- used in numerous industrial applications, this software lends itself very well to research needs; its main features are as follows
- reliability and precision in the functions of alignment, registration, filtering, cleaning, analysis and measurement of three-dimensional elements thanks to numerous manual, semi-automatic and automatic tools;
- flexibility in handling heterogeneous data (LAS, PLY, E57, OBJ, GeoTiff, etc.), integrating them with each other and converting their formats;
- ability to handle remarkably large data (even billions of points);
- open-source license offering a source code that can be easily modified and implemented, even with different customised plug-ins, depending on specific needs.
- advanced user interface and visualisation tools to facilitate the interpretation of data and results;
- an active documentation and community that not only provides a range of educational resources and continuous software updates, but also allows for easy resolution of problems.
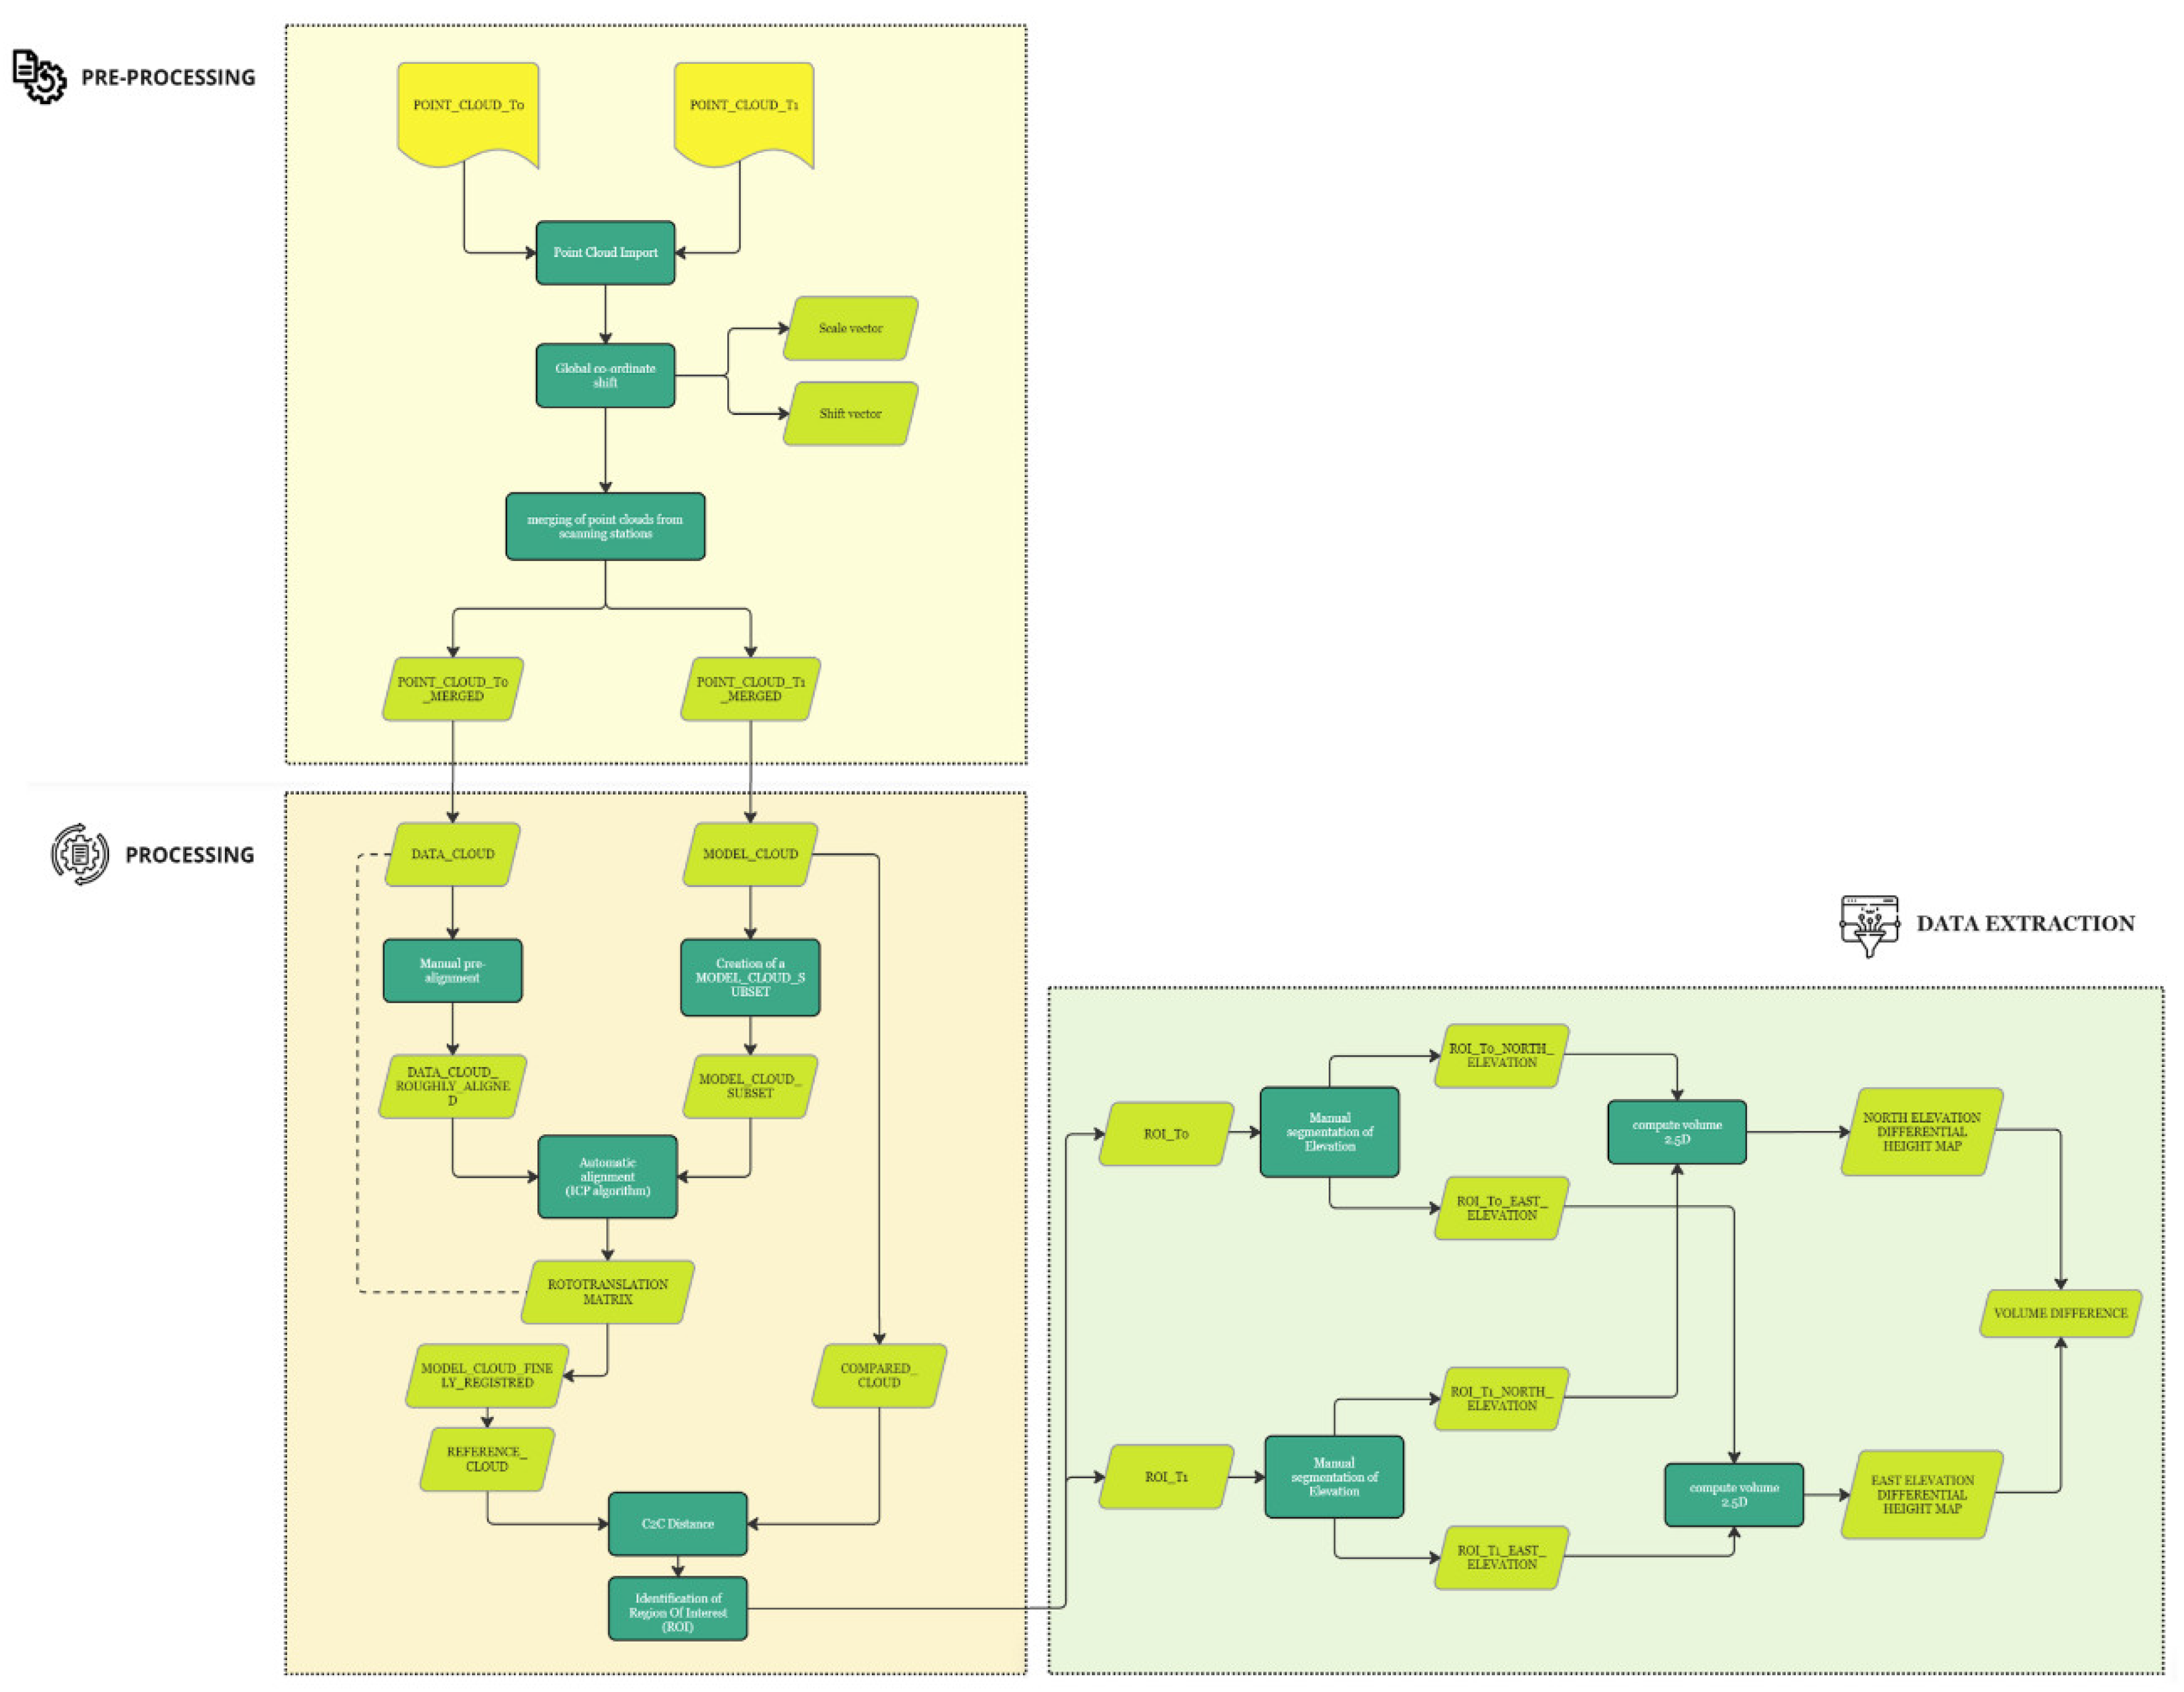
- point clouds import and data pre-processing;
- alignment of the point clouds;
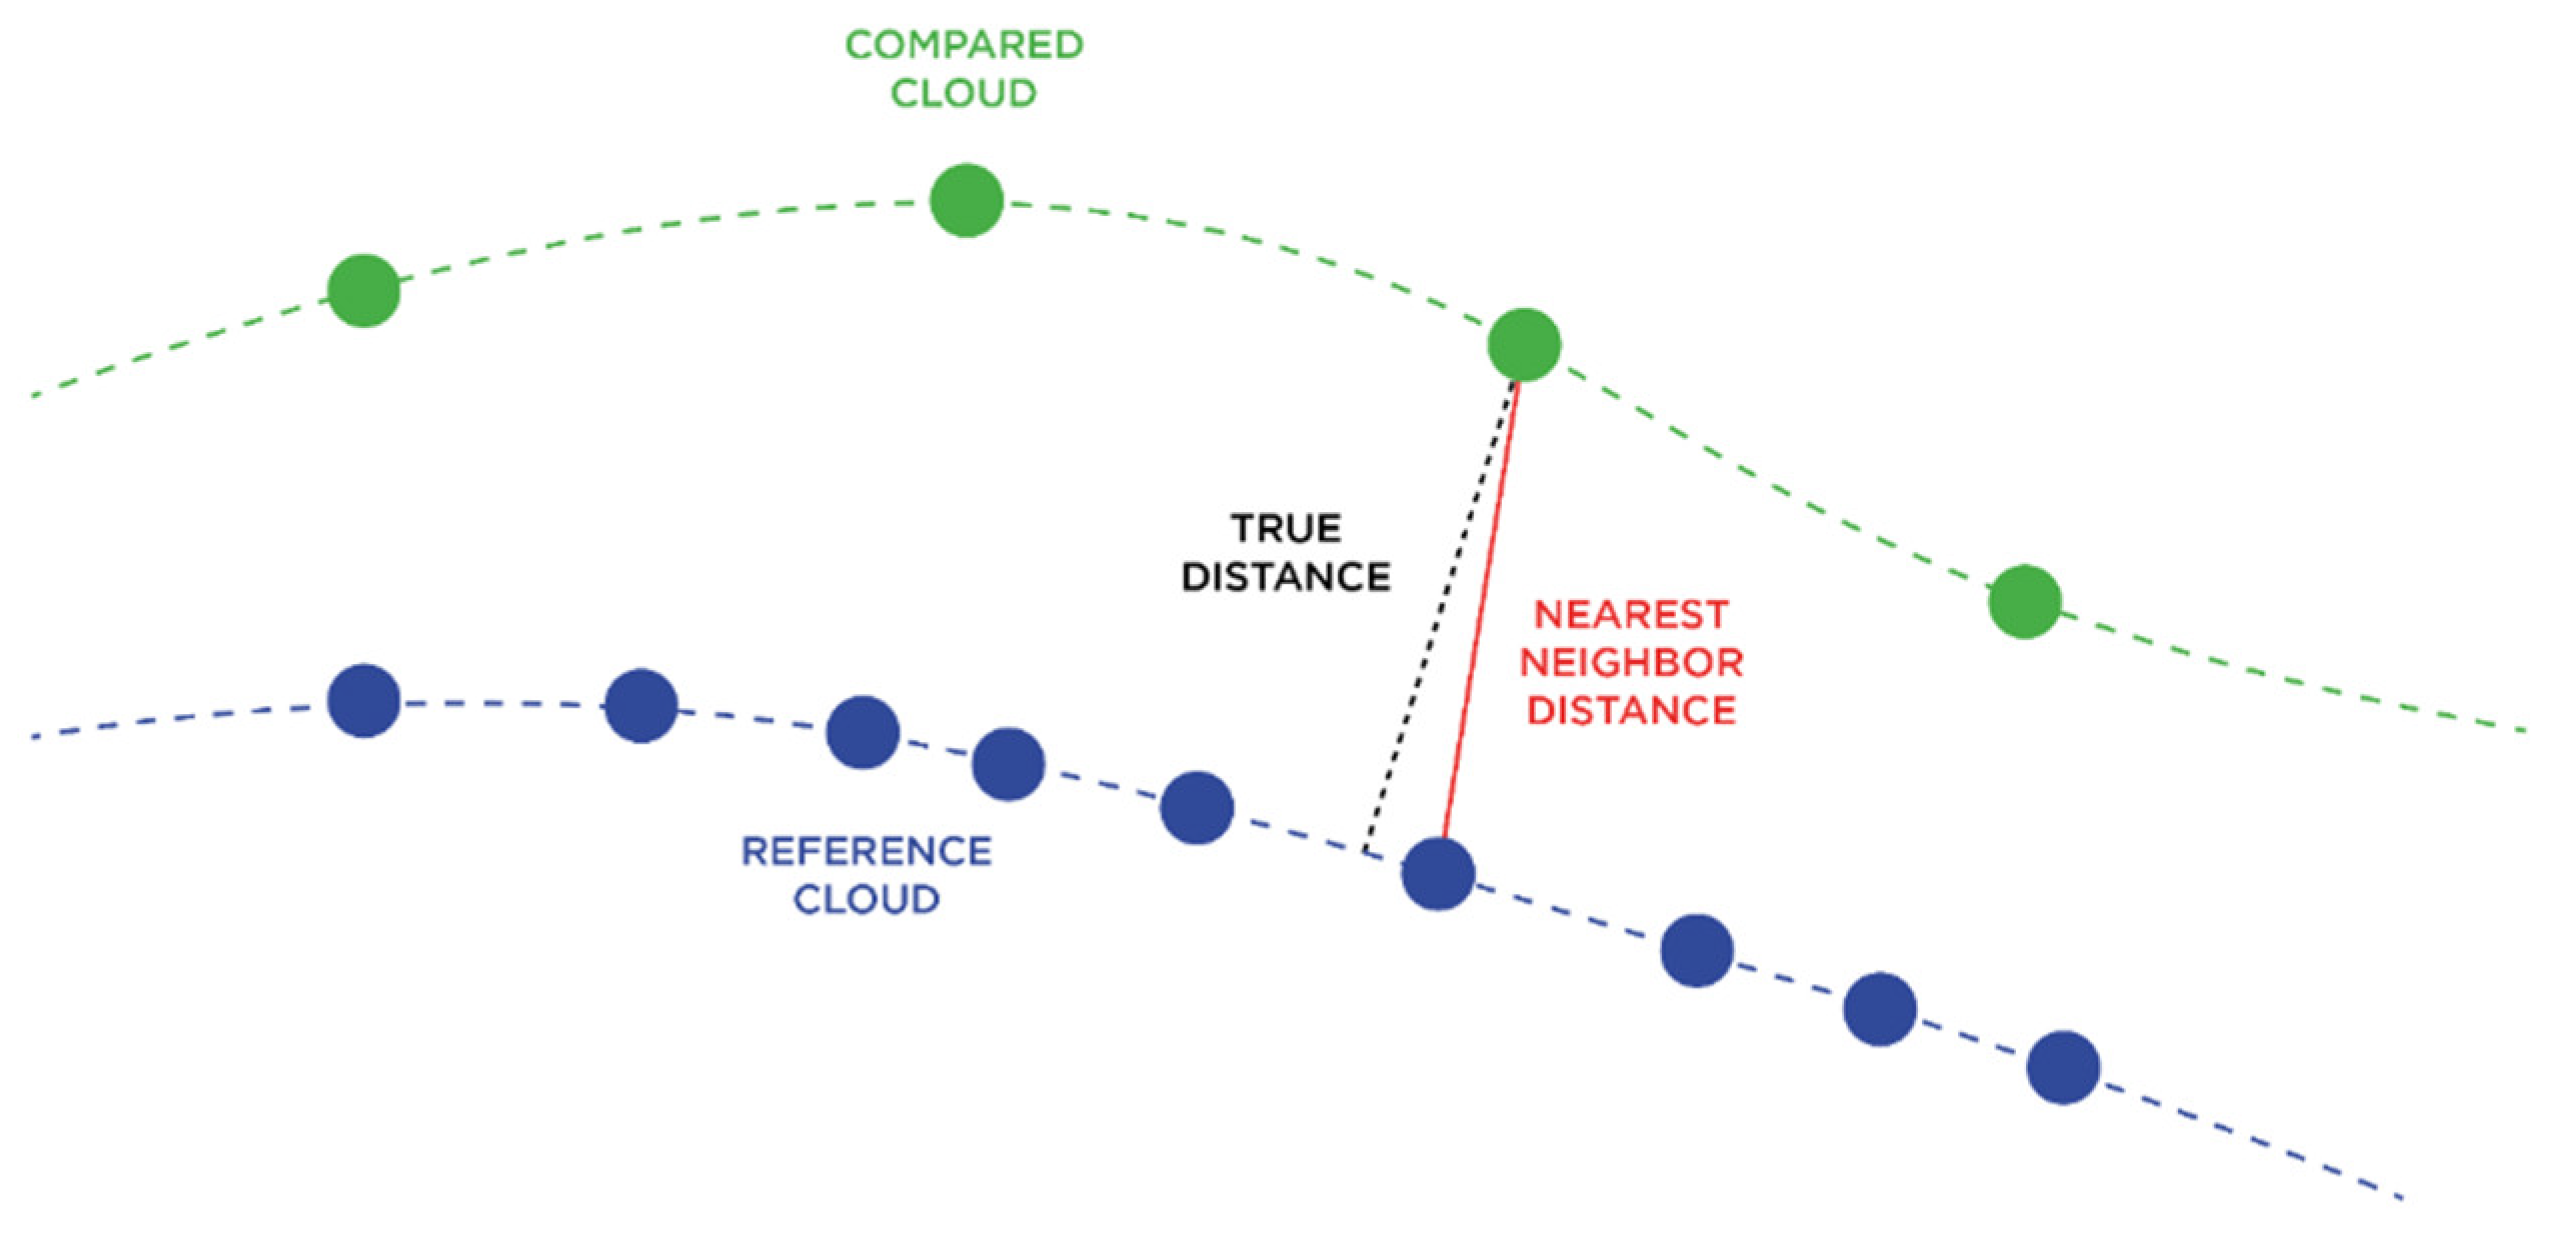
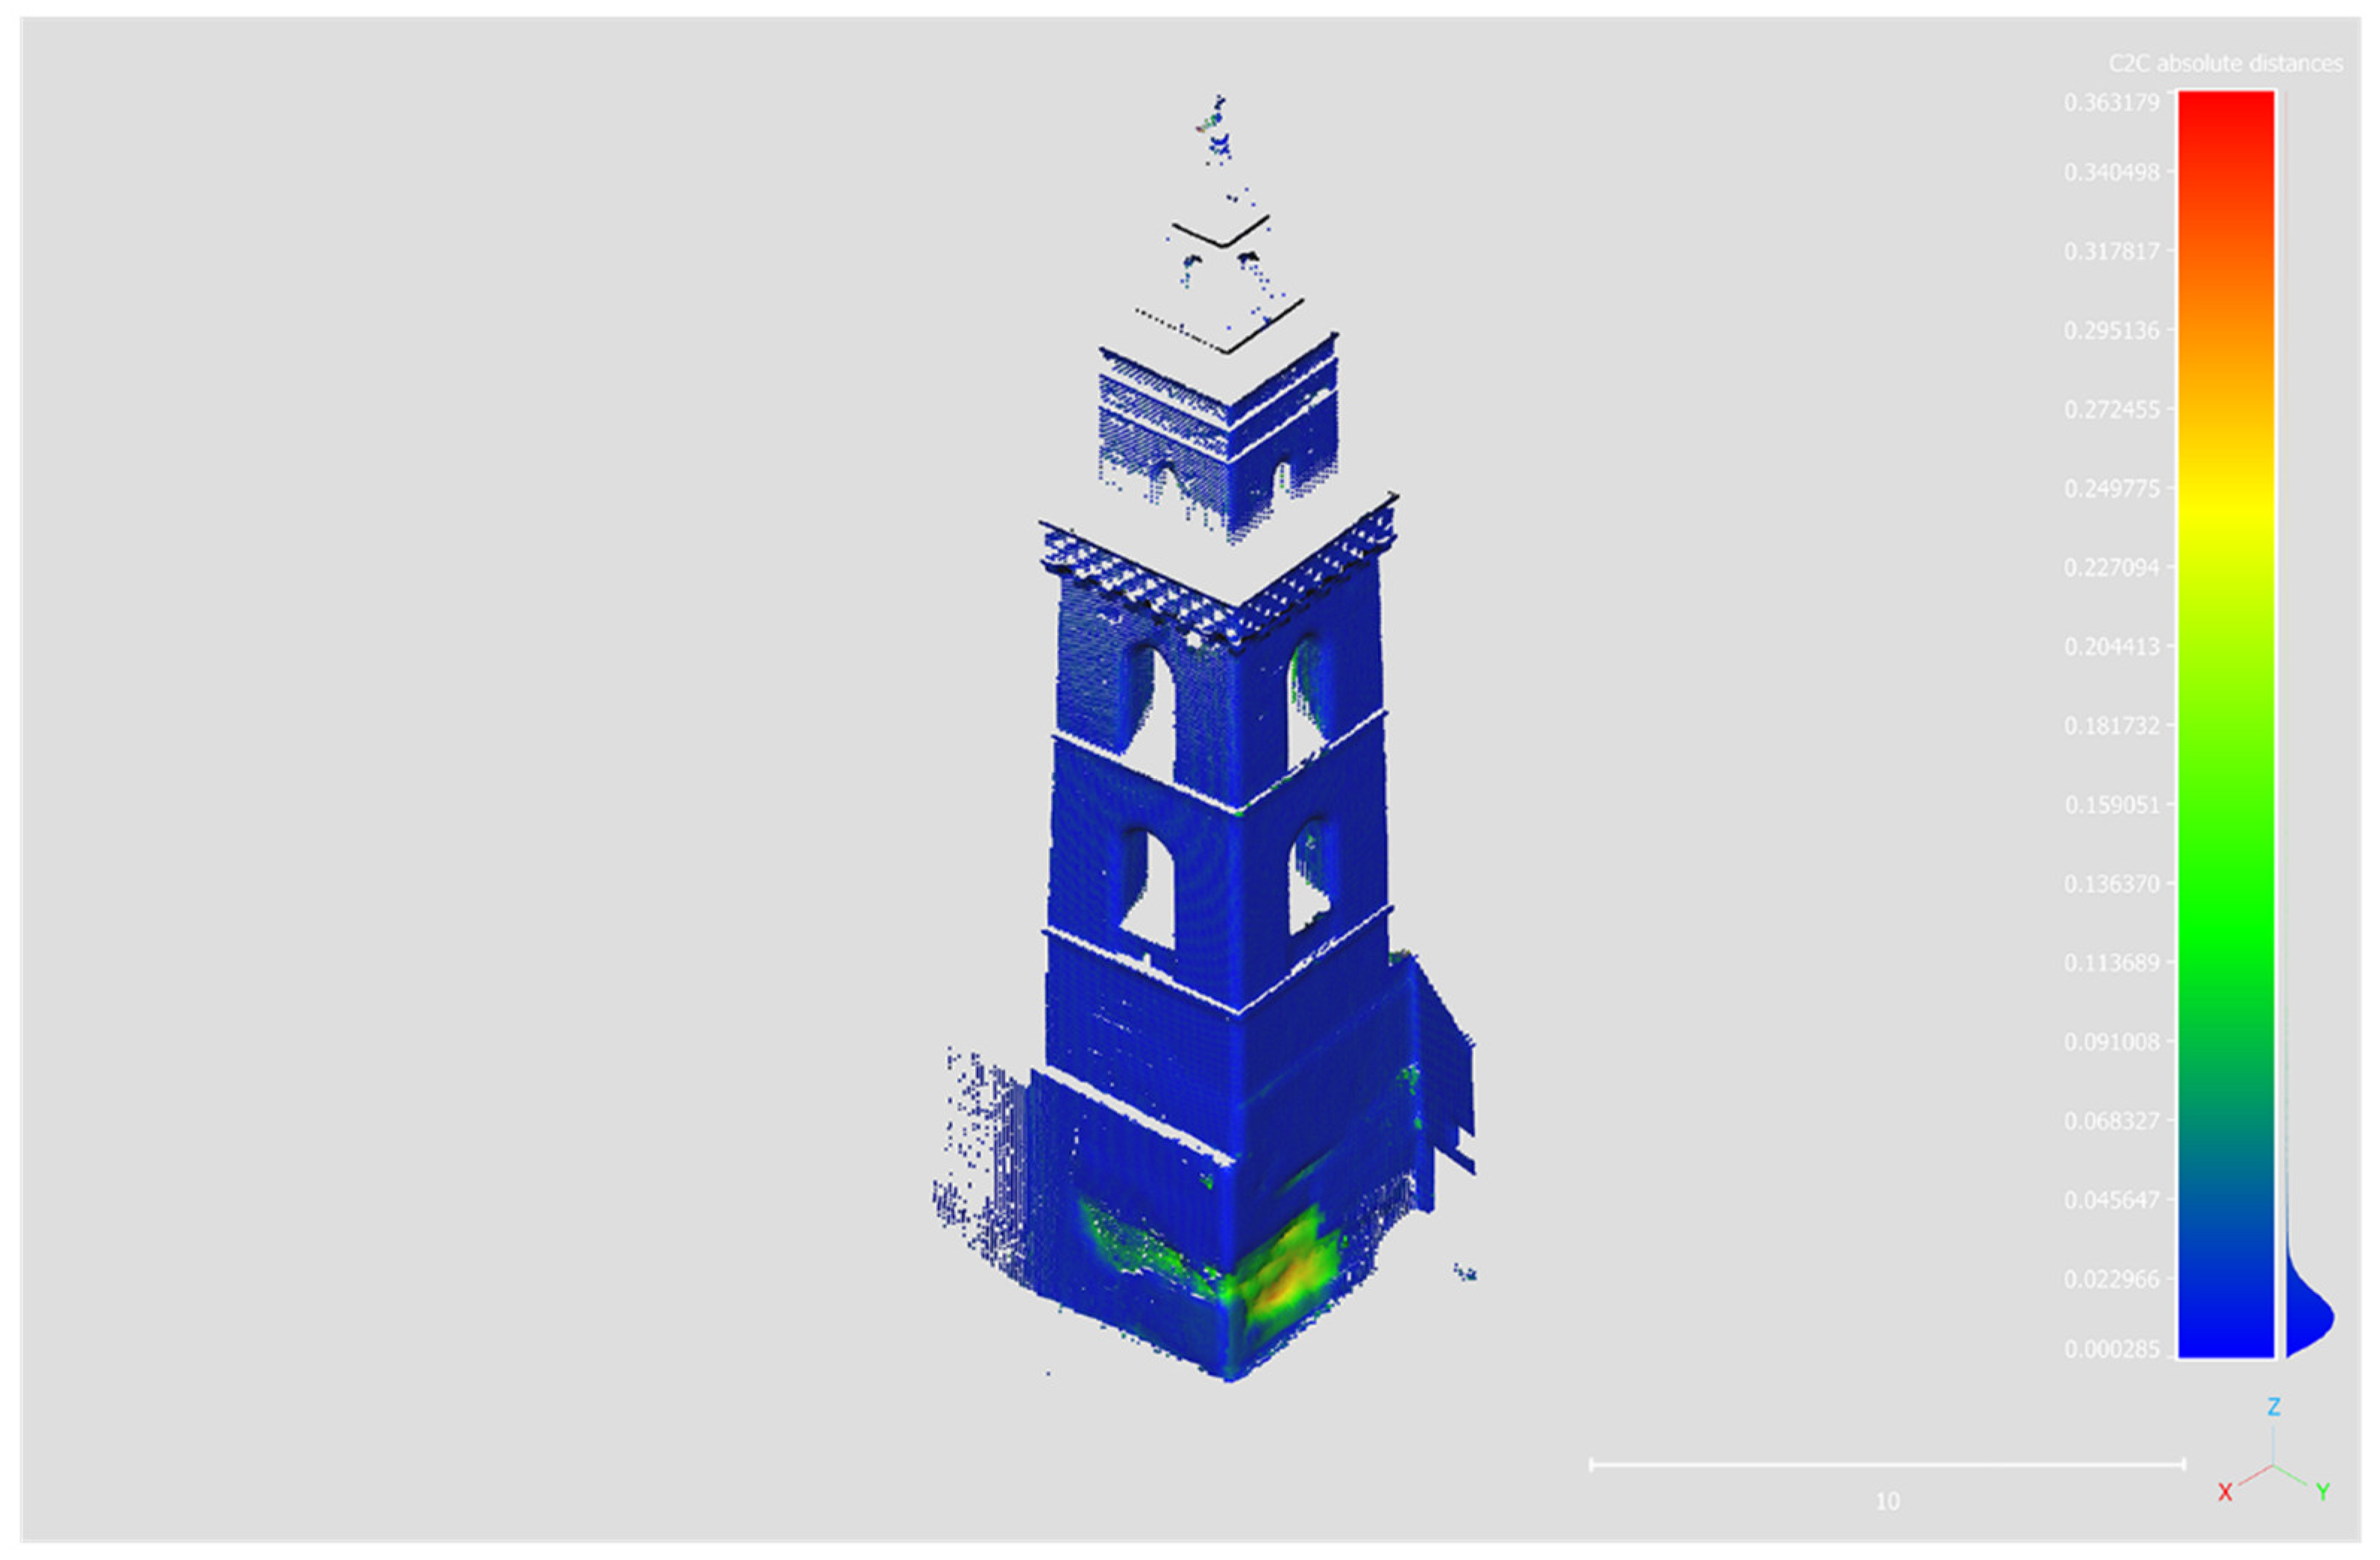
- calculation of distances between the two point clouds;
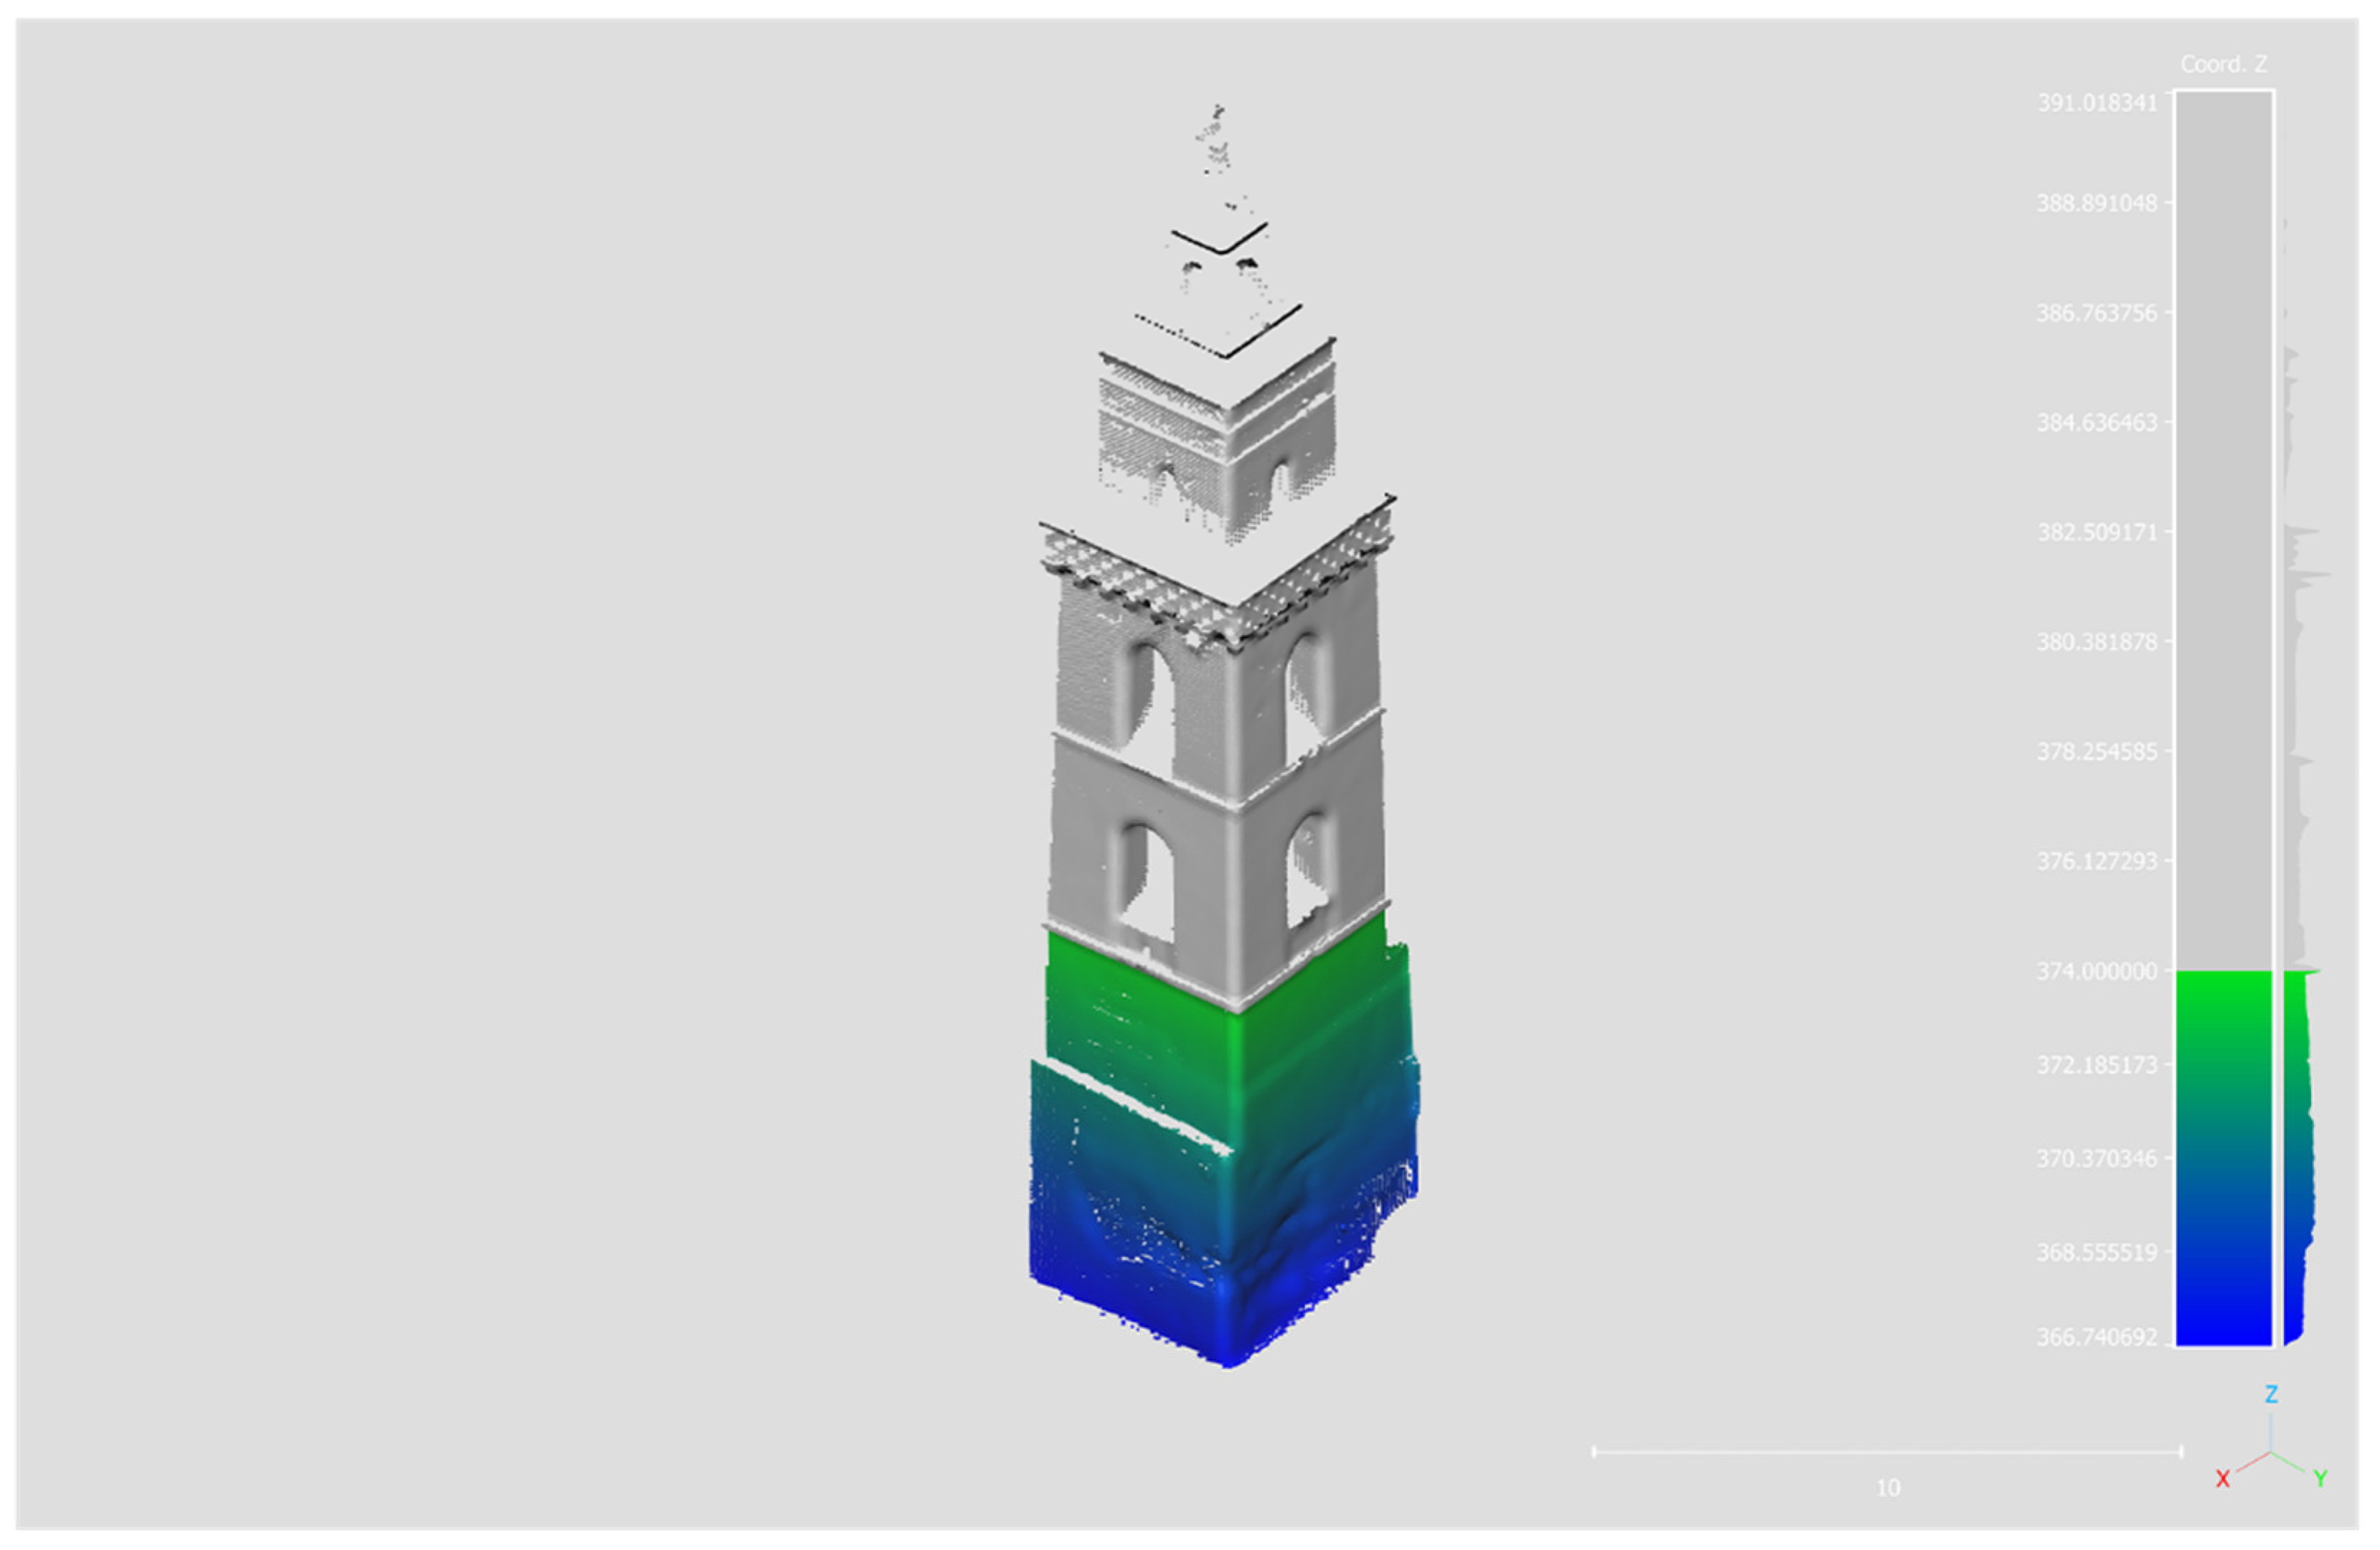
- selection of the region of interest (ROI);
- calculation of the volume difference between the two point clouds.
3. Results and Discussions
- Root Mean Square (RMS): error difference between two iterations. With each iteration, the discrepancy between the two clouds is reduced. Once a pre-established threshold is reached, the process is terminated. The specified root mean square (RMS) value for the process is 1.0 × 10^(−5).
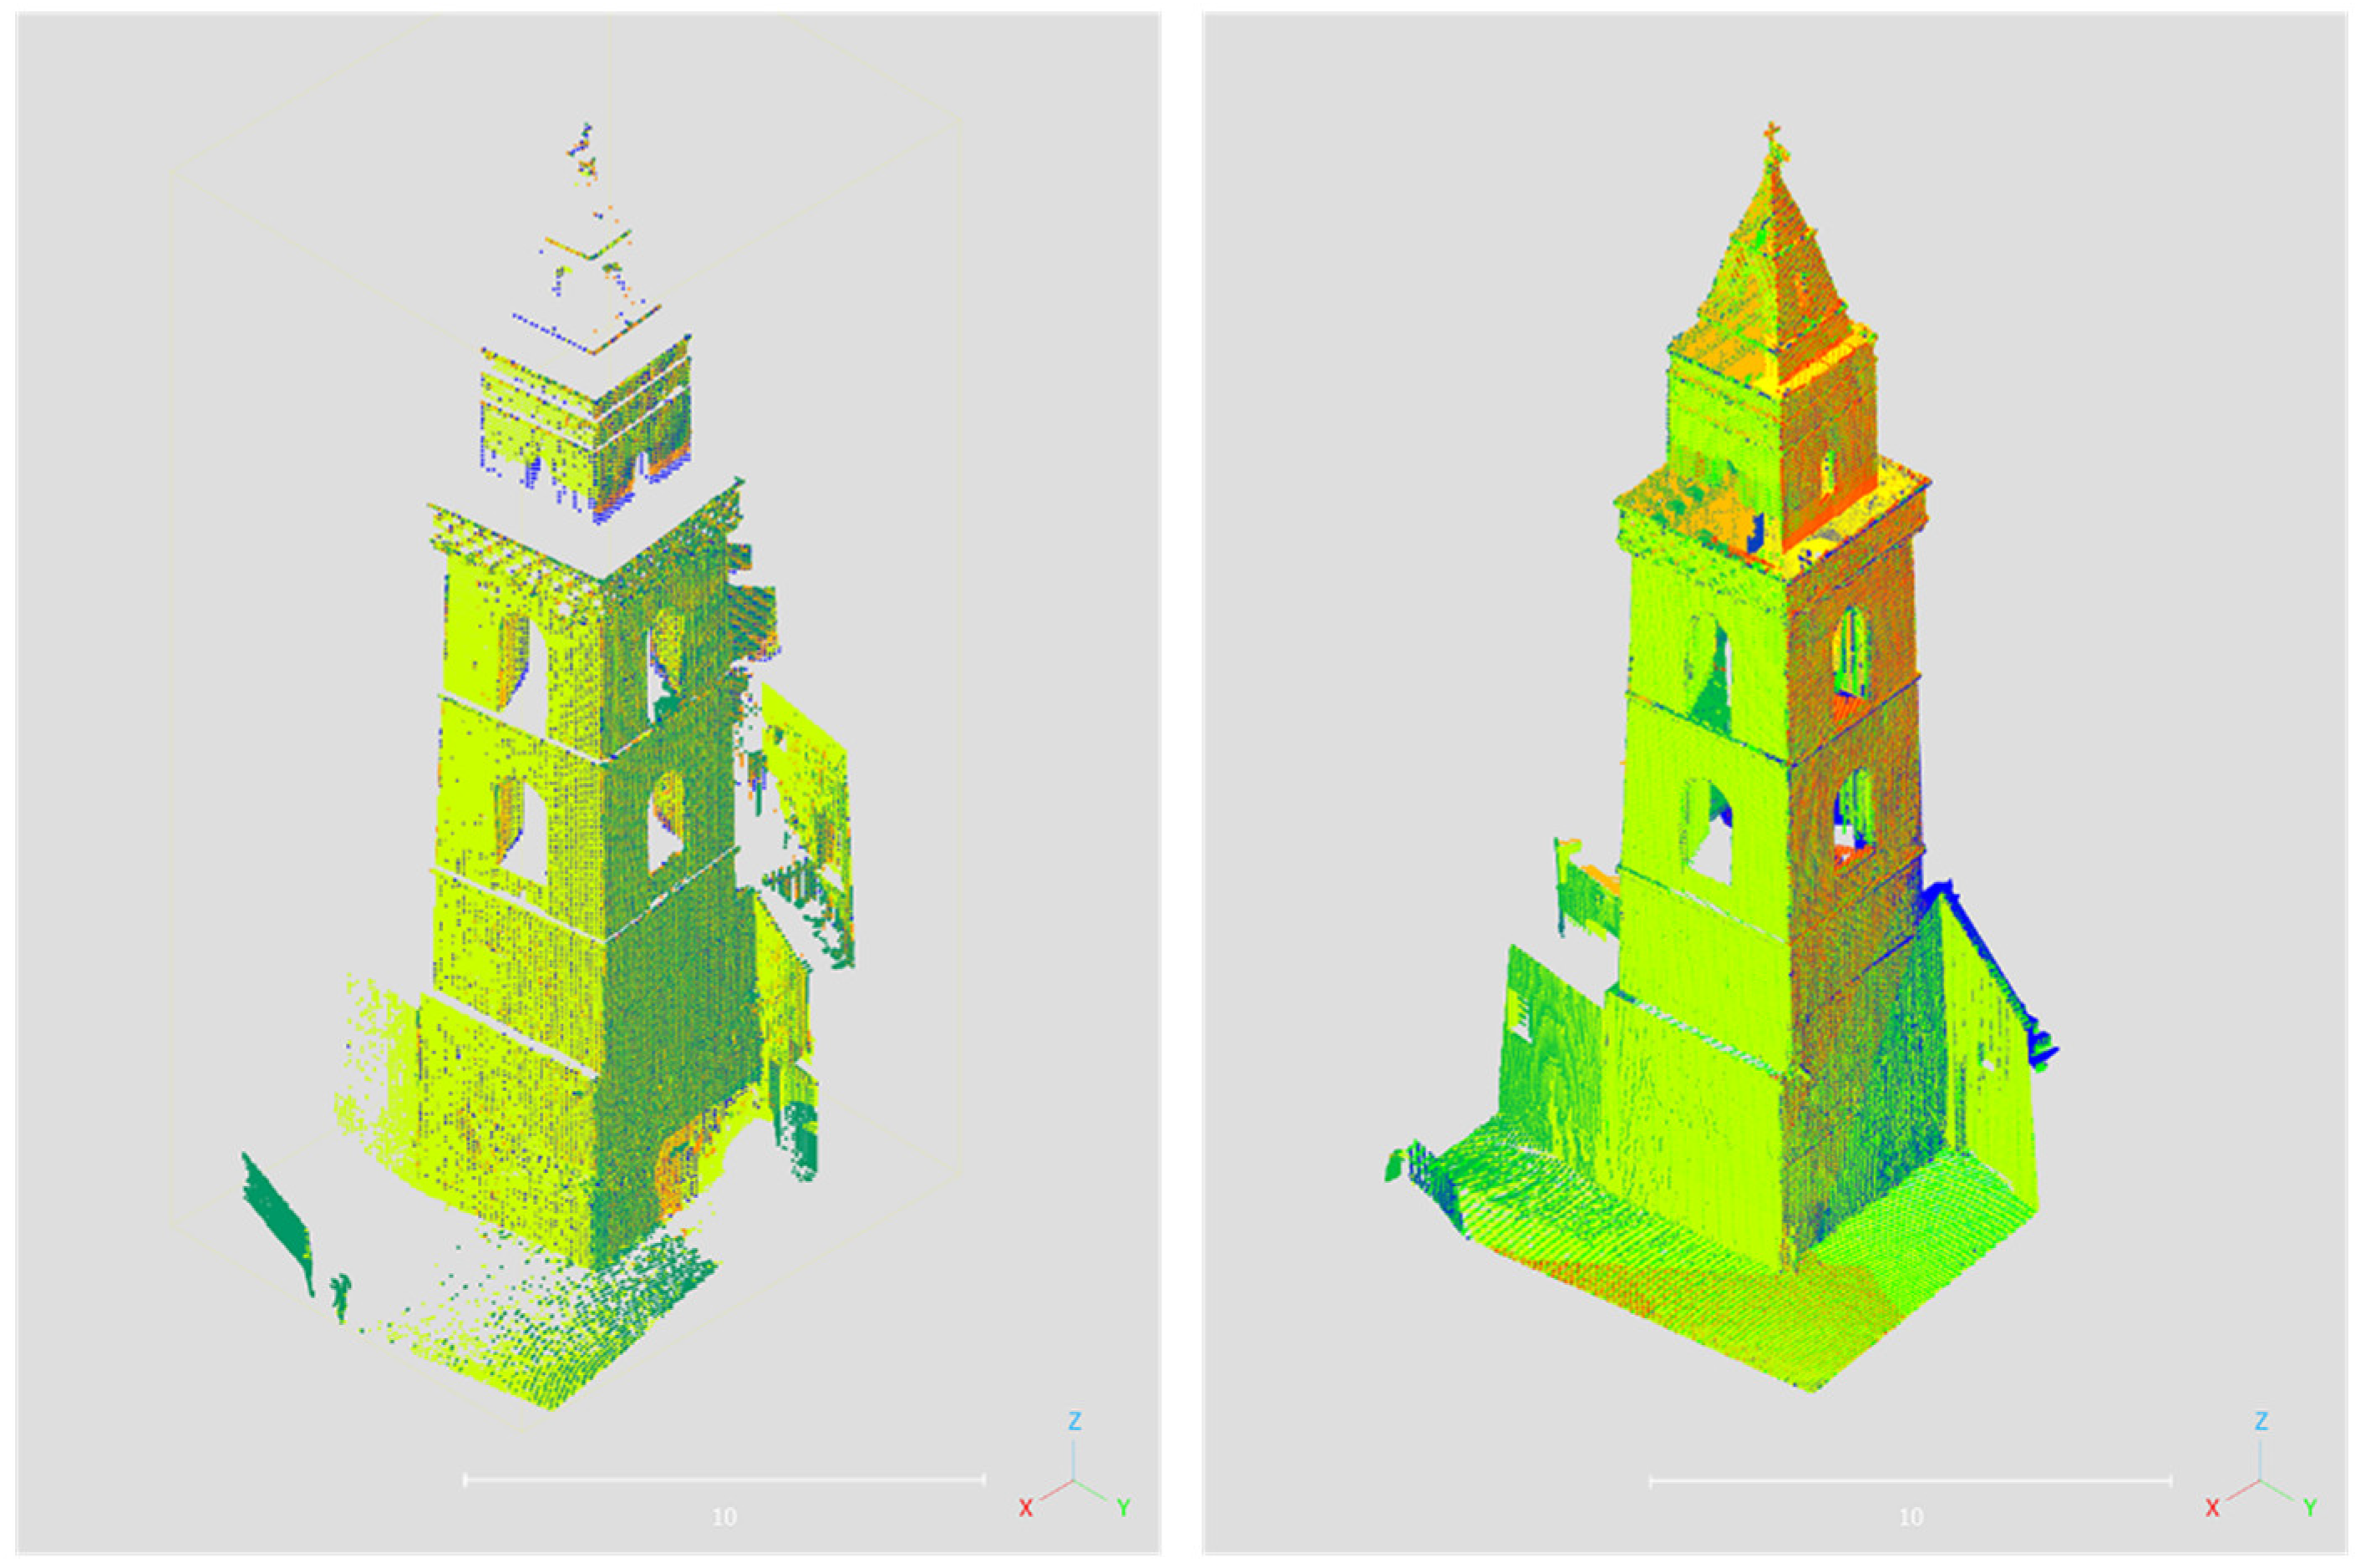
- Desired final overlap: determined based on an estimate of the homologous points between the two clouds under consideration. Despite the model cloud being segmented to compensate for the lack of data in the data cloud, the two acquisitions exhibit disparate point densities (average density data cloud = 16,355 points/m³, average density subset model cloud = 110,505 points/m³). The final overlap set is 50% considering the data cloud points (141,914 points) and the model cloud points (280,440 points).
- Random Sampling Limit (RSL): a parameter that enables the random selection of a subset of points from a large cloud during each iteration of the registration process. A value of RSL = 300,000, which exceeds the number of points in the largest cloud (in this case, the model cloud), was employed to enhance the registration accuracy.
- Enable Farthest Point Removal: optimal to maintain active during the alignment phases in order to disregard the most distant points, thus will minimise the probability of errors occurring [36].
- -
- r11, r12, r13: represent the rotations along the x-axis;
- -
- r21, r22, r23: represent the rotations along the y-axis;
- -
- r31, r32, r33: represent the rotations along the z-axis.
- -
- maximum distance, left as default value at 0.426m;
- -
- octree level: set to 8;
- -
- Multi-threaded: left as default 10/12.
- a)
- Manual segmentation of the two basement elevations: this was a necessary step to ensure the accuracy and precision of volume difference calculations.
- b)
-
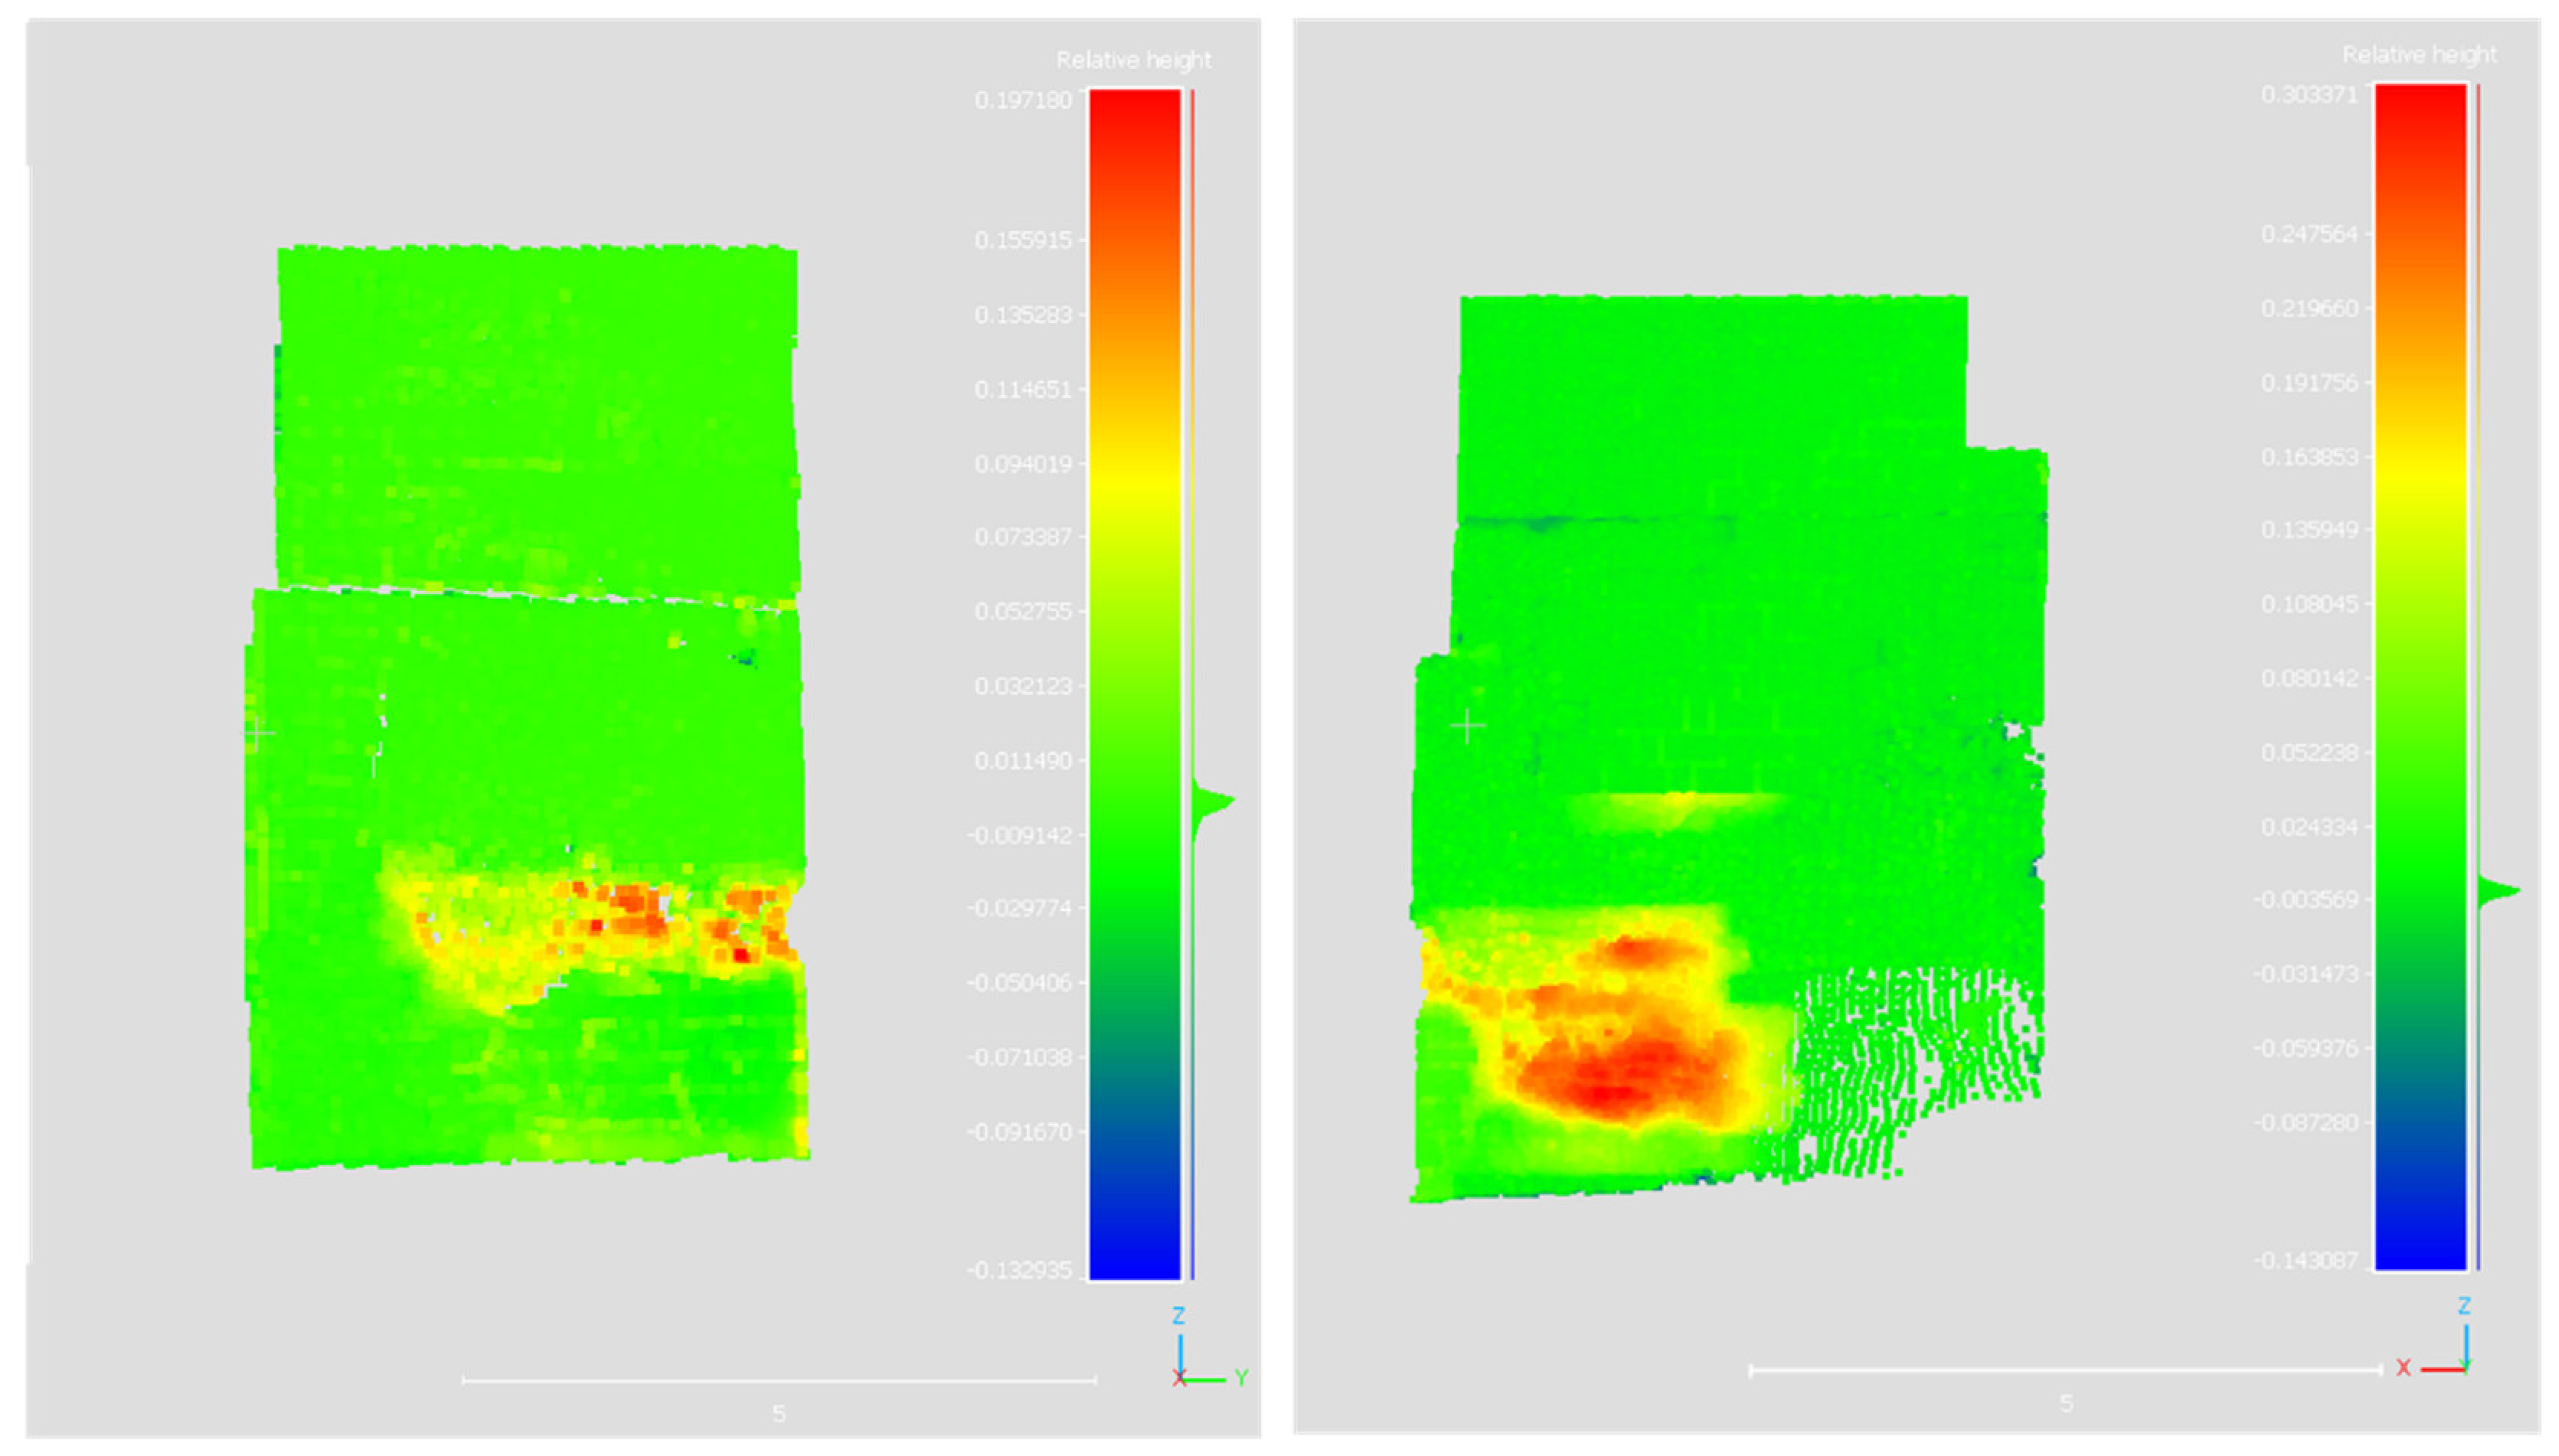
The volume calculation for both segmented elevations is performed by setting the pre-intervention scan as the ‘Before’ scan, leaving the no-date cells empty, and the post-intervention scan as the ‘After’ scan. In this case, an interpolation is set for the no-date cells. The selection of the appropriate interpolation method, which is unavoidably necessary in at least one instance where data is absent, was made on the basis of the post-intervention scan, which is the most dense of the two. Consequently, the application of processes such as interpolation would result in the generation of more accurate results. The differential height map was produced by setting the following parameters:
- -
- Grid step = 0.01m
- -
- Cell height = average height
- -
- Projection direction = x for the east elevation and y for the north elevation of the basament.
- c)
- The depth maps, the outcome of the aforementioned analysis, were exported as point clouds (for details, please refer to Figure 9). The regularity observable in the xz and yz planes permitted the calculation of the volume without the presence of geometric irregularities in the basement having an adverse effect on the results.
5. Conclusions
Author Contributions
Funding
Acknowledgments
Conflicts of Interest
References
- Palčák, M.; Kudela, P.; Fandáková, M.; Kordek, J. Utilization of 3D Digital Technologies in the Documentation of Cultural Heritage: A Case Study of the Kunerad Mansion (Slovakia). Applied Sciences 2022, 12, 4376. [Google Scholar] [CrossRef]
- Agapiou, A.; Lysandrou, V.; Hadjimitsis, D.G. Earth Observation Contribution to Cultural Heritage Disaster Risk Management: Case Study of Eastern Mediterranean Open Air Archaeological Monuments and Sites. Rem. Sen. 2020, 12, 1330. [Google Scholar] [CrossRef]
- Valagussa, A.; Frattini, P.; Crosta, G.; Spizzichino, D.; Leoni, G.; Margottini, C. Multi-risk analysis on European cultural and natural UNESCO heritage sites. Natural Hazards 2021, 105, 2659–2676. [Google Scholar] [CrossRef]
- Morero, L.; Guida, A.; Porcari, V.D.; Masini, N. Knowledge and big data: New approaches to the anamnesis and diagnosis of the architectural heritage’s conservation status. State of art and future perspectives. In O. Gervasi, B. Murgante, S. Misra, C. Garau, I. Blečić, D. Taniar, B.O. Apduhan, A.M.A.C. Rocha, E. Tarantino, & C. M. Torre (Eds.), Computational science and its applications 2021 – ICCSA 2021 (pp. 109-124). Springer.
- Cecchi, R.; Gasparoli, P. In Prevenzione e manutenzione per i Beni Culturali edificati. Procedimenti scientifici per lo sviluppo delle attività ispettive. Il caso studio delle aree archeologiche di Roma e Ostia Antica. Publisher: Alinea, Firenze, Italy, 2010, pp. 46-62.
- Porcari, V.D.; Guida, A. Modernity and tradition in the Sassi of Matera (Italy). Smart community and underground (hypogeum) city, Journal of Architectural Conservation 2022.
- Cecchi, R.; Gasparoli, P. La manutenzione programmata dei beni culturali edificati: Procedimenti scientifici per lo sviluppo di piani e programmi di manutenzione; casi studio su architetture di interesse archeologico a Roma e Pompei. Publisher: Alinea, Firenze, Italy, 2011; pp. 111–145. [Google Scholar]
- Gasparoli, P. Dalla manutenzione preventiva e programmata alla “Smart Preservation”. In Riscoprendo Arnolfo II e il suo tempo. Arsago Seprio e la sua Pieve. Storia di una Comunità in De Marchi, P.M., Rosso, M. Publisher: SAP, Società Archeologica Srl Editore, Mantova, Italy, 2019, pp. 85-96.
- Mishra, M.; Lourenço, P.B. Artificial intelligence-assisted visual inspection for cultural heritage: State-of-the-art review. Journal of Cultural Heritage 2024, 66, 536–550. [Google Scholar] [CrossRef]
- Aterini, B.; Giuricin, S. The integrated survey for the recovery of the former hospital/monastery of San Pietro in Luco di Mugello. SCIRES-IT - SCIentific RESearch and Information Technology 2020, 10. [CrossRef]
- Martín-Lerones, P.; Olmedo, D.; López-Vidal, A.; Gómez-García-Bermejo, J.; Zalama, E. BIM Supported Surveying and Imaging Combination for Heritage Conservation. Rem. Sens. 2021, 13, 1584. [Google Scholar] [CrossRef]
- Wood, R.L.; Mohammadi, M.E. Feature-Based Point Cloud-Based Assessment of Heritage Structures for Nondestructive and Noncontact Surface Damage Detection. Heritage 2021, 4, 775–793. [Google Scholar] [CrossRef]
- Pu, X.; Gan, S.; Yuan, X.; Li, R. Feature Analysis of Scanning Point Cloud of Structure and Research on Hole Repair Technology Considering Space-Ground Multi-Source 3D Data Acquisition. Sensors 2022, 22, 9627. [Google Scholar] [CrossRef] [PubMed]
- Sánchez-Aparicio, L.J.; Blanco-García, F.L.D.; Mencías-Carrizosa, D.; Villanueva-Llauradó, P.; Aira-Zunzunegui, J.R.; Sanz-Arauz, D.; Pierdicca, R.; Pinilla-Melo, J.; Garcia-Gago, J. Detection of damage in heritage constructions based on 3D point clouds. A systematic review. Journal of Building Engineering 2023, 77, 107440. [Google Scholar] [CrossRef]
- Abate, D. Built-Heritage Multi-temporal Monitoring through Photogrammetry and 2D/3D Change Detection Algorithms. Studies in Conservation 2019, 64, 423–434. [Google Scholar] [CrossRef]
- Sun, X.; Li, Q.; Yang, B. Compositional Structure Recognition of 3D Building Models Through Volumetric Analysis. IEEE Access 2018, 6, 33953–33968. [Google Scholar] [CrossRef]
- De Gélis, I.; Corpetti, T.; Lefèvre, S. Change detection needs change information: Improving deep 3D point cloud change detection (Version 2), 2023. arXiv. [CrossRef]
- Dai, C.; Zhang, Z.; Lin, D. An Object-Based Bidirectional Method for Integrated Building Extraction and Change Detection between Multimodal Point Clouds. Remote Sensing, 2020, 12, 1680. [Google Scholar] [CrossRef]
- Qin, R.; Tian, J.; Reinartz, P. 3D change detection – Approaches and applications. ISPRS J. of Photogram. and Rem. Sens. 2016, 122, 41–56. [Google Scholar] [CrossRef]
- Chai, J.X.; Zhang, Y.S.; Yang, Z.; Wu, J. 3D CHANGE DETECTION OF POINT CLOUDS BASED ON DENSITY ADAPTIVE LOCAL EUCLIDEAN DISTANCE. The International Archives of the Photogrammetry, Remote Sensing and Spatial Information Sciences, 2022; XLIII-B2-2022, 523–530. [Google Scholar] [CrossRef]
- Xu, Y.; Stilla, U. Toward Building and Civil Infrastructure Reconstruction From Point Clouds: A Review on Data and Key Techniques. IEEE Journal of Selected Topics in Applied Earth Observations and Remote Sensing 2021, 14, 2857–2885. [Google Scholar] [CrossRef]
- Daneshmand, M.; Helmi, A.; Avots, E.; Noroozi, F.; Alisinanoglu, F.; Arslan, H.S.; Gorbova, J.; Haamer, R.E.; Ozcinar, C.; Anbarjafari, G. 3D Scanning: A Comprehensive Survey (Version 1) 2018, arXiv. [CrossRef]
- He, Y.; Liang, B.; Yang, J.; Li, S.; He, J. An Iterative Closest Points Algorithm for Registration of 3D Laser Scanner Point Clouds with Geometric Features. Sensors 2017, 17, 1862. [Google Scholar] [CrossRef] [PubMed]
- Denayer, M.; De Winter, J.; Bernardes, E.; Vanderborght, B.; Verstraten, T. Comparison of Point Cloud Registration Techniques on Scanned Physical Objects. Sensors 2024, 24, 2142. [Google Scholar] [CrossRef]
- Stathoulopoulos, N.; Koval, A.; Nikolakopoulos, G. Irregular Change Detection in Sparse Bi-Temporal Point Clouds using Learned Place Recognition Descriptors and Point-to-Voxel Comparison. IEEE/RSJ International Conference on Intelligent Robots and Systems (IROS 2023). [CrossRef]
- Stilla, U.; Xu, Y. Change detection of urban objects using 3D point clouds: A review. ISPRS Journal of Photogrammetry and Remote Sensing 2023, 197, 228–255. [Google Scholar] [CrossRef]
- Rodolico, F. In Le pietre delle città d’Italia, Publisher: Le Monnier, Firenze, Italia, 1953; p.352.
- Restucci, A. Matera: i Sassi. Manuale del recupero, 1st ed.; Publisher: Elemond Editori Associati, Electa, Milano, Italia, 1998. [Google Scholar]
- Bernardo, G.; Guida, A. Heritages of stone: materials degradation and restoration works, Proceedings of ReUSO 2015 - III Congreso Internacional sobre Documentación, Conservación y Reutilización del Patrimonio Arquitectónico, 2015, pp. 299-306. Editorial Universitat Politecnica de Valencia, Spagna.
- Bernardo, G.; Guida, A.; Porcari, V.D.; Campanella, L.; Dell’Aglio, E.; Reale, R.; Cardellicchio, F.; Salvi, A.M.; Casieri, C.; Cerichelli, G.; Gabriele, F.; Spreti, N. Culture Economy: innovative strategies to sustainable restoration of artistic heritage. Part II - New materials and diagnostic techniques to prevent and control calcarenite degradation, 2021, pp.325- 334. In XII CONVEGNO INTERNAZIONALE-Diagnosis for the Conservation and Valorization of Cultural Heritage.
- Andriani, G.F.; Walsh, N. Physical properties and textural parameters of calcarenitic rocks: qualitative and quantitative evaluations, Engineering Geology 2002, 67(1-2), pp. 5-15. [CrossRef]
- Bonomo, A.E.; Lezzerini, M.; Prosser, G.; Munnecke, A.; Koch, R.; Rizzo, G. Matera Building Stones: Comparison between Bioclastic and Lithoclastic Calcarenites. Materials Science Forum, 2019, 972, 40–49. [Google Scholar] [CrossRef]
- Bernardo, G.; Guida, A.; Porcari, V.D.; Visone, F. The preventive maintenance of the religious heritage of the city of matera, italy. In: 12th european symposium on religious art, restoration & conservation - ESRARC 2022. Edited by Franco Palla, Iulian Rusu, Luca Lanteri, Claudia Pelosi and Nicolae Apostolescu. 2020, pp. 190-194. Editore: KERMES, Torino.
- CloudCompare Project Team: R&D.; EDF, 2015, accessed on 30/08/2024.
- CloudCompare Project Team: R&D.; EDF, 2015, p.51.
- CloudCompare Project Team: R&D.; EDF, 2015, p. 104.
- CloudCompare Project Team: R&D.; EDF, 2015, p. 44.
- Goldberger, J.; Roweis, S.; Hinton, G.; Salakhutdinov, R. Neighbourhood Components Analysis. In Advances in Neural Information Processing Systems, 2004 (NIPS 2004) Vancouver Canada: Dec., 17.
- Roussopoulos, N.; Kelley, S.; Vincent, F. (1995). Nearest neighbor queries. Proceedings of the 1995 ACM SIGMOD International Conference on Management of Data - SIGMOD ’95, 71–79. [CrossRef]
- CloudCompare Project Team: R&D.; EDF, 2015, p. 29.
| Acquisition | TLS acquisition stations |
Number Points | Cloud Density (point/m3) |
|---|---|---|---|
| pre-intervention | 4 | 141914 | 16355,5 |
| post-intervention | 12 | 631825 | 98323,6 |
| Cartesian Axes |
Shift Vector | Scale Vector |
|---|---|---|
| x | -89000,00 | 1 |
| y | 0 | 1 |
| z | 0 | 1 |
| Parameters | Results | ||||
|---|---|---|---|---|---|
| Threads | 10/12 | ||||
| Final RMS | 0.0096 | ||||
| Transformation matrix | 0.999994874001 | 0.003031035885 | 0.001053750631 | -0.360297352076 | |
| -0.003031449392 | 0.999995350838 | 0.000390967762 | -0.115164496005 | ||
| -0.001052560634 | -0.000394160132 | 0.999999344349 | 0.002090910217 | ||
| 0.000000000000 | 0.000000000000 | 0.000000000000 | 1.000000000000 | ||
Disclaimer/Publisher’s Note: The statements, opinions and data contained in all publications are solely those of the individual author(s) and contributor(s) and not of MDPI and/or the editor(s). MDPI and/or the editor(s) disclaim responsibility for any injury to people or property resulting from any ideas, methods, instructions or products referred to in the content. |
© 2024 by the authors. Licensee MDPI, Basel, Switzerland. This article is an open access article distributed under the terms and conditions of the Creative Commons Attribution (CC BY) license (http://creativecommons.org/licenses/by/4.0/).


