Submitted:
01 September 2024
Posted:
02 September 2024
You are already at the latest version
Abstract

Keywords:
1. Introduction
2. Materials and Methods
3. Results and Discussion
3.1. Correlation of GPX2 Levels in Tumors and Cell Lines
3.2. The Choice of CRC-Derived Cell Lines for a Case Study: GPX2 and NOX1
3.3. Remaining Uncertainties in GPX2 Expression in Normal Colon/Rectum
3.4. The Problems with Databases Combined with the Issues of Normal Cell Expression
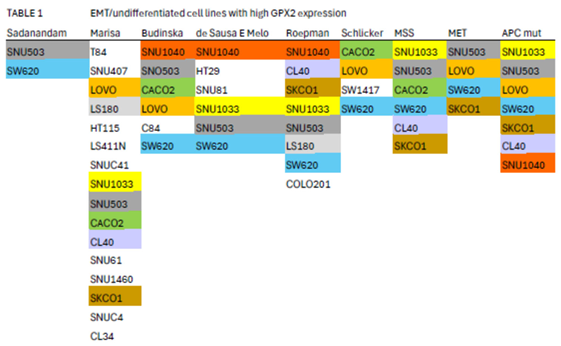
3.5. Efforts to Assist Investigators in Selection of Cell Lines
3.6. The Issue of Low GPX2 Expressing CRC-Derived Cell Lines and Circumvention
3.7. How Different are CRC-Derived Cell Lines Sorted into Classes by Medico et al for Expression Levels of Genes Encoding Proteins with Reactive Sulfhydryl Groups?
3.8. Intratumor Variation, Plasticity of Cell Components, Stromal Cell Interactions and GPX2
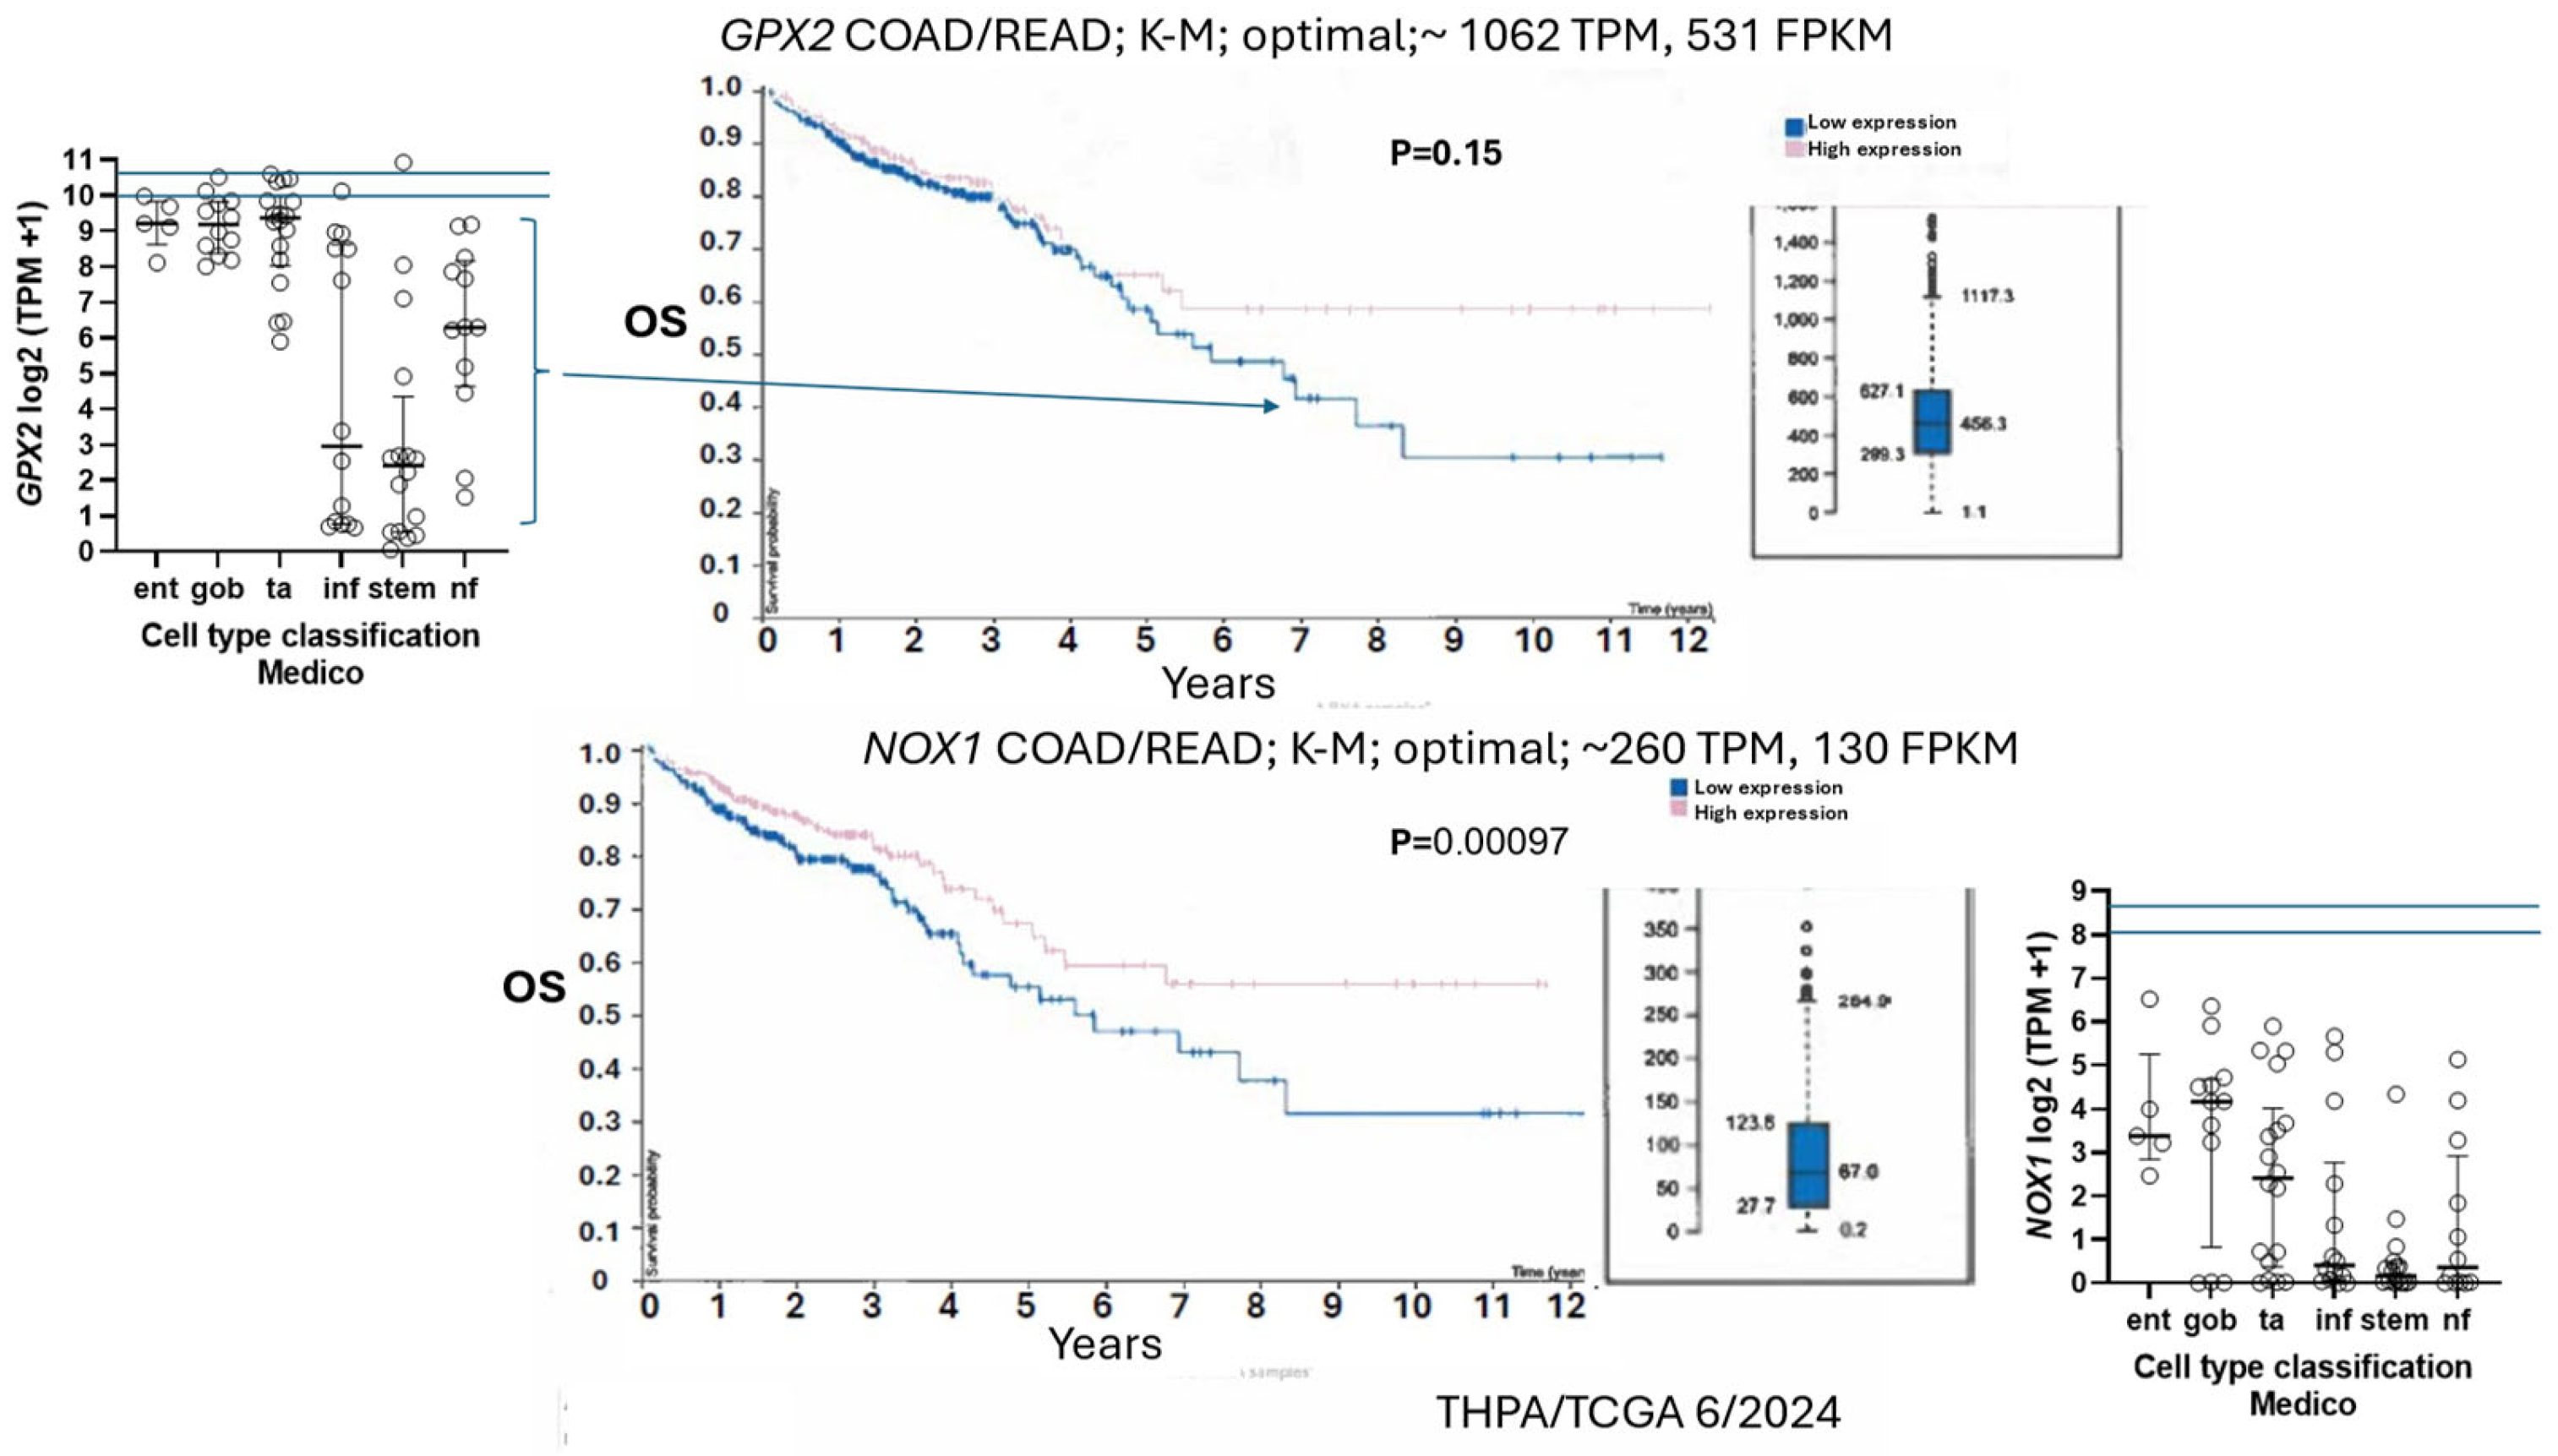
3.9. NOX1 in CRC and Links to GPX2
3.10. Low GPX2 Expression in Cell Lines, Redux
4. Summary
5. Conclusions
Author Contributions
Funding
IRB
Data Availability
Acknowledgements
Conflicts of Interest
References
- Esworthy, RS, Chu, FF Using Information from Public Databases to Critically Evaluate Studies Linking the Antioxidant Enzyme Selenium-Dependent Glutathione Peroxidase 2 (GPX2) to Cancer. BioMedInformatics. 2023 Nov; 3: 985-1014. [CrossRef]
- Esworthy RS, Doroshow JH, Chu FF. The beginning of GPX2 and 30 years later. Free Radic Biol Med. 2022 Aug 1;188:419-433. Epub 2022 Jul 5. PMID: 35803440; PMCID: PMC9341242. [CrossRef]
- Averill-Bates D. Reactive oxygen species and cell signaling. Review. Biochim Biophys Acta Mol Cell Res. 2024 Feb;1871(2):119573. Epub 2023 Nov 8. PMID: 37949302. [CrossRef]
- Villar SF, Corrales-González L, Márquez de Los Santos B, Dalla Rizza J, Zeida A, Denicola A, Ferrer-Sueta G. Kinetic and structural assessment of the reduction of human 2-Cys peroxiredoxins by thioredoxins. FEBS J. 2024 Feb;291(4):778-794. Epub 2023 Dec 7. PMID: 37985387. [CrossRef]
- Xu H, Hu C, Wang Y, Shi Y, Yuan L, Xu J, Zhang Y, Chen J, Wei Q, Qin J, Xu Z, Cheng X. Glutathione peroxidase 2 knockdown suppresses gastric cancer progression and metastasis via regulation of kynurenine metabolism. Oncogene. 2023 Jun;42(24):1994-2006. Epub 2023 May 3. PMID: 37138031; PMCID: PMC10256612. [CrossRef]
- Medico E, Russo M, Picco G, Cancelliere C, Valtorta E, Corti G, Buscarino M, Isella C, Lamba S, Martinoglio B, Veronese S, Siena S, Sartore-Bianchi A, Beccuti M, Mottolese M, Linnebacher M, Cordero F, Di Nicolantonio F, Bardelli A. The molecular landscape of colorectal cancer cell lines unveils clinically actionable kinase targets. Nat Commun. 2015 Apr 30;6:7002. PMID: 25926053. [CrossRef]
- Sadanandam A, Lyssiotis CA, Homicsko K, Collisson EA, Gibb WJ, Wullschleger S, Ostos LC, Lannon WA, Grotzinger C, Del Rio M, Lhermitte B, Olshen AB, Wiedenmann B, Cantley LC, Gray JW, Hanahan D. A colorectal cancer classification system that associates cellular phenotype and responses to therapy. Nat Med. 2013 May;19(5):619-25. Epub 2013 Apr 14. PMID: 23584089; PMCID: PMC3774607. [CrossRef]
- Marisa L, de Reyniès A, Duval A, Selves J, Gaub MP, Vescovo L, Etienne-Grimaldi MC, Schiappa R, Guenot D, Ayadi M, Kirzin S, Chazal M, Fléjou JF, Benchimol D, Berger A, Lagarde A, Pencreach E, Piard F, Elias D, Parc Y, Olschwang S, Milano G, Laurent-Puig P, Boige V. Gene expression classification of colon cancer into molecular subtypes: characterization, validation, and prognostic value. PLoS Med. 2013;10(5):e1001453. Epub 2013 May 21. PMID: 23700391; PMCID: PMC3660251. [CrossRef]
- Budinska E, Popovici V, Tejpar S, D'Ario G, Lapique N, Sikora KO, Di Narzo AF, Yan P, Hodgson JG, Weinrich S, Bosman F, Roth A, Delorenzi M. Gene expression patterns unveil a new level of molecular heterogeneity in colorectal cancer. J Pathol. 2013 Sep;231(1):63-76. Epub 2013 Jul 8. PMID: 23836465; PMCID: PMC3840702. [CrossRef]
- De Sousa E Melo F, Wang X, Jansen M, Fessler E, Trinh A, de Rooij LP, de Jong JH, de Boer OJ, van Leersum R, Bijlsma MF, Rodermond H, van der Heijden M, van Noesel CJ, Tuynman JB, Dekker E, Markowetz F, Medema JP, Vermeulen L. Poor-prognosis colon cancer is defined by a molecularly distinct subtype and develops from serrated precursor lesions. Nat Med. 2013 May;19(5):614-8. Epub 2013 Apr 14. PMID: 23584090. [CrossRef]
- Roepman P, Schlicker A, Tabernero J, Majewski I, Tian S, Moreno V, Snel MH, Chresta CM, Rosenberg R, Nitsche U, Macarulla T, Capella G, Salazar R, Orphanides G, Wessels LF, Bernards R, Simon IM. Colorectal cancer intrinsic subtypes predict chemotherapy benefit, deficient mismatch repair and epithelial-to-mesenchymal transition. Int J Cancer. 2014 Feb 1;134(3):552-62. Epub 2013 Sep 13. PMID: 23852808; PMCID: PMC4234005. [CrossRef]
- Schlicker A, Beran G, Chresta CM, McWalter G, Pritchard A, Weston S, Runswick S, Davenport S, Heathcote K, Castro DA, Orphanides G, French T, Wessels LF. Subtypes of primary colorectal tumors correlate with response to targeted treatment in colorectal cell lines. BMC Med Genomics. 2012 Dec 31;5:66. PMID: 23272949; PMCID: PMC3543849. [CrossRef]
- Berg KCG, Eide PW, Eilertsen IA, Johannessen B, Bruun J, Danielsen SA, Bjørnslett M, Meza-Zepeda LA, Eknæs M, Lind GE, Myklebost O, Skotheim RI, Sveen A, Lothe RA. Multi-omics of 34 colorectal cancer cell lines - a resource for biomedical studies. Mol Cancer. 2017 Jul 6;16(1):116. PMID: 28683746; PMCID: PMC5498998. [CrossRef]
- Hu FJ, Li YJ, Zhang L, Ji DB, Liu XZ, Chen YJ, Wang L, Wu AW. Single-cell profiling reveals differences between human classical adenocarcinoma and mucinous adenocarcinoma. Commun Biol. 2023 Jan 23;6(1):85. PMID: 36690709; PMCID: PMC9870908. [CrossRef]
- Joanito I, Wirapati P, Zhao N, Nawaz Z, Yeo G, Lee F, Eng CLP, Macalinao DC, Kahraman M, Srinivasan H, Lakshmanan V, Verbandt S, Tsantoulis P, Gunn N, Venkatesh PN, Poh ZW, Nahar R, Oh HLJ, Loo JM, Chia S, Cheow LF, Cheruba E, Wong MT, Kua L, Chua C, Nguyen A, Golovan J, Gan A, Lim WJ, Guo YA, Yap CK, Tay B, Hong Y, Chong DQ, Chok AY, Park WY, Han S, Chang MH, Seow-En I, Fu C, Mathew R, Toh EL, Hong LZ, Skanderup AJ, DasGupta R, Ong CJ, Lim KH, Tan EKW, Koo SL, Leow WQ, Tejpar S, Prabhakar S, Tan IB. Single-cell and bulk transcriptome sequencing identifies two epithelial tumor cell states and refines the consensus molecular classification of colorectal cancer. Nat Genet. 2022 Jul;54(7):963-975. Epub 2022 Jun 30. PMID: 35773407; PMCID: PMC9279158. [CrossRef]
- Ranganathan P, Agrawal A, Bhushan R, Chavalmane AK, Kalathur RK, Takahashi T, Kondaiah P. Expression profiling of genes regulated by TGF-beta: differential regulation in normal and tumour cells. BMC Genomics. 2007 Apr 11;8:98. PMID: 17425807; PMCID: PMC1858692. [CrossRef]
- Kurundkar AR, Kurundkar D, Rangarajan S, Locy ML, Zhou Y, Liu RM, Zmijewski J, Thannickal VJ. The matricellular protein CCN1 enhances TGF-β1/SMAD3-dependent profibrotic signaling in fibroblasts and contributes to fibrogenic responses to lung injury. FASEB J. 2016 Jun;30(6):2135-50Epub 2016 Feb 16. PMID: 26884454; PMCID: PMC4871800. . [CrossRef]
- Oshi M, Roy AM, Yan L, Kinoshita S, Tamura Y, Kosaka T, Akiyama H, Kunisaki C, Takabe K, Endo I. Enhanced epithelial-mesenchymal transition signatures are linked with adverse tumor microenvironment, angiogenesis and worse survival in gastric cancer. Cancer Gene Ther. 2024 May;31(5):746-754. Epub 2024 Mar 26. PMID: 38532115. [CrossRef]
- Chu FF, Doroshow JH, Esworthy RS. Expression, characterization, and tissue distribution of a new cellular selenium-dependent glutathione peroxidase, GSHPx-GI. J Biol Chem. 1993 Feb 5;268(4):2571-6. PMID: 8428933.
- Cheung HW, Cowley GS, Weir BA, Boehm JS, Rusin S, Scott JA, East A, Ali LD, Lizotte PH, Wong TC, Jiang G, Hsiao J, Mermel CH, Getz G, Barretina J, Gopal S, Tamayo P, Gould J, Tsherniak A, Stransky N, Luo B, Ren Y, Drapkin R, Bhatia SN, Mesirov JP, Garraway LA, Meyerson M, Lander ES, Root DE, Hahn WC. Systematic investigation of genetic vulnerabilities across cancer cell lines reveals lineage-specific dependencies in ovarian cancer. Proc Natl Acad Sci U S A. 2011 Jul 26;108(30):12372-7. Epub 2011 Jul 11. PMID: 21746896; PMCID: PMC3145679].. [CrossRef]
- Leist M, Raab B, Maurer S, Rösick U, Brigelius-Flohé R. Conventional cell culture media do not adequately supply cells with antioxidants and thus facilitate peroxide-induced genotoxicity. Free Radic Biol Med. 1996;21(3):297-306. PMID: 8855440. [CrossRef]
- Touat-Hamici Z, Bulteau AL, Bianga J, Jean-Jacques H, Szpunar J, Lobinski R, Chavatte L. Selenium-regulated hierarchy of human selenoproteome in cancerous and immortalized cells lines. Biochim Biophys Acta Gen Subj. 2018 Nov;1862(11):2493-2505. Epub 2018 Apr 13. PMID: 29660373. [CrossRef]
- Parant F, Mure F, Maurin J, Beauvilliers L, Chorfa C, El Jamali C, Ohlmann T, Chavatte L. Selenium Discrepancies in Fetal Bovine Serum: Impact on Cellular Selenoprotein Expression. Int J Mol Sci. 2024 Jul 1;25(13):7261. PMID: 39000368; PMCID: PMC11242189. [CrossRef]
- Esworthy RS, Kim BW, Chow J, Shen B, Doroshow JH, Chu FF. Nox1 causes ileocolitis in mice deficient in glutathione peroxidase-1 and -2. Free Radic Biol Med. 2014 Mar;68:315-25. Epub 2013 Dec 25. PMID: 24374371; PMCID: PMC3943970. [CrossRef]
- Chu FF, Esworthy RS, Doroshow JH, Grasberger H, Donko A, Leto TL, Gao Q, Shen B. Deficiency in Duox2 activity alleviates ileitis in GPx1- and GPx2-knockout mice without affecting apoptosis incidence in the crypt epithelium. Redox Biol. 2017 Apr;11:144-156. Epub 2016 Nov 22. PMID: 27930931; PMCID: PMC5148781. [CrossRef]
- Jones RM, Luo L, Ardita CS, Richardson AN, Kwon YM, Mercante JW, Alam A, Gates CL, Wu H, Swanson PA, Lambeth JD, Denning PW, Neish AS. Symbiotic lactobacilli stimulate gut epithelial proliferation via Nox-mediated generation of reactive oxygen species. EMBO J. 2013 Nov 27;32(23):3017-28. Epub 2013 Oct 18. PMID: 24141879; PMCID: PMC3844951. [CrossRef]
- Kato M, Marumo M, Nakayama J, Matsumoto M, Yabe-Nishimura C, Kamata T. The ROS-generating oxidase Nox1 is required for epithelial restitution following colitis. Exp Anim. 2016 Jul 29;65(3):197-205. Epub 2016 Feb 15. PMID: 26876598; PMCID: PMC4976233. [CrossRef]
- Matsumoto M, Katsuyama M, Iwata K, Ibi M, Zhang J, Zhu K, Nauseef WM, Yabe-Nishimura C. Characterization of N-glycosylation sites on the extracellular domain of NOX1/NADPH oxidase. Free Radic Biol Med. 2014 Mar;68:196-204. Epub 2013 Dec 19. PMID: 24361341. [CrossRef]
- Brzozowa-Zasada M, Ianaro A, Piecuch A, Michalski M, Matysiak N, Stęplewska K. Immunohistochemical Expression of Glutathione Peroxidase-2 (Gpx-2) and Its Clinical Relevance in Colon Adenocarcinoma Patients. Int J Mol Sci. 2023 Sep 27;24(19):14650. PMID: 37834097; PMCID: PMC10572251. [CrossRef]
- Komatsu H, Okayasu I, Mitomi H, Imai H, Nakagawa Y, Obata F. Immunohistochemical detection of human gastrointestinal glutathione peroxidase in normal tissues and cultured cells with novel mouse monoclonal antibodies. J Histochem Cytochem. 2001 Jun;49(6):759-66. PMID: 11373322. [CrossRef]
- Florian S, Wingler K, Schmehl K, Jacobasch G, Kreuzer OJ, Meyerhof W, Brigelius-Flohé R. Cellular and subcellular localization of gastrointestinal glutathione peroxidase in normal and malignant human intestinal tissue. Free Radic Res. 2001 Dec;35(6):655-63. PMID: 11811519. [CrossRef]
- Becker WR, Nevins SA, Chen DC, Chiu R, Horning AM, Guha TK, Laquindanum R, Mills M, Chaib H, Ladabaum U, Longacre T, Shen J, Esplin ED, Kundaje A, Ford JM, Curtis C, Snyder MP, Greenleaf WJ. Single-cell analyses define a continuum of cell state and composition changes in the malignant transformation of polyps to colorectal cancer. Nat Genet. 2022 Jul;54(7):985-995. Epub 2022 Jun 20. PMID: 35726067; PMCID: PMC9279149. [CrossRef]
- Sasaki N, Sachs N, Wiebrands K, Ellenbroek SI, Fumagalli A, Lyubimova A, Begthel H, van den Born M, van Es JH, Karthaus WR, Li VS, López-Iglesias C, Peters PJ, van Rheenen J, van Oudenaarden A, Clevers H. Reg4+ deep crypt secretory cells function as epithelial niche for Lgr5+ stem cells in colon. Proc Natl Acad Sci U S A. 2016 Sep 13;113(37):E5399-407. Epub 2016 Aug 29. PMID: 27573849; PMCID: PMC5027439. [CrossRef]
- Pilat JM, Brown RE, Chen Z, Berle NJ, Othon AP, Washington MK, Anant SA, Kurokawa S, Ng VH, Thompson JJ, Jacobse J, Goettel JA, Lee E, Choksi YA, Lau KS, Short SP, Williams CS. SELENOP modifies sporadic colorectal carcinogenesis and WNT signaling activity through LRP5/6 interactions. J Clin Invest. 2023 Jul 3;133(13):e165988. PMID: 37166989; PMCID: PMC10313376. [CrossRef]
- Schmitt M, Schewe M, Sacchetti A, Feijtel D, van de Geer WS, Teeuwssen M, Sleddens HF, Joosten R, van Royen ME, van de Werken HJG, van Es J, Clevers H, Fodde R. Paneth Cells Respond to Inflammation and Contribute to Tissue Regeneration by Acquiring Stem-like Features through SCF/c-Kit Signaling. Cell Rep. 2018 Aug 28;24(9):2312-2328.e7. PMID: 30157426. [CrossRef]
- Yu S, Tong K, Zhao Y, Balasubramanian I, Yap GS, Ferraris RP, Bonder EM, Verzi MP, Gao N. Paneth Cell Multipotency Induced by Notch Activation following Injury. Cell Stem Cell. 2018 Jul 5;23(1):46-59.e5. Epub 2018 Jun 7. PMID: 29887318; PMCID: PMC6035085. [CrossRef]
- Mei X, Gu M, Li M. Plasticity of Paneth cells and their ability to regulate intestinal stem cells. Stem Cell Res Ther. 2020 Aug 12;11(1):349. PMID: 32787930; PMCID: PMC7425583. [CrossRef]
- Fumagalli A, Oost KC, Kester L, Morgner J, Bornes L, Bruens L, Spaargaren L, Azkanaz M, Schelfhorst T, Beerling E, Heinz MC, Postrach D, Seinstra D, Sieuwerts AM, Martens JWM, van der Elst S, van Baalen M, Bhowmick D, Vrisekoop N, Ellenbroek SIJ, Suijkerbuijk SJE, Snippert HJ, van Rheenen J. Plasticity of Lgr5-Negative Cancer Cells Drives Metastasis in Colorectal Cancer. Cell Stem Cell. 2020 Apr 2;26(4):569-578.e7. Epub 2020 Mar 12. PMID: 32169167; PMCID: PMC7118369. [CrossRef]
- Hong Y, Liew SC, Thean LF, Tang CL, Cheah PY. Human colorectal cancer initiation is bidirectional, and cell growth, metabolic genes and transporter genes are early drivers of tumorigenesis. Cancer Lett. 2018 Sep 1;431:213-218. Epub 2018 Jun 6. PMID: 29885515. [CrossRef]
- Yuan K, Liu Y, Chen HN, Zhang L, Lan J, Gao W, Dou Q, Nice EC, Huang C. Thiol-based redox proteomics in cancer research. Proteomics. 2015 Jan;15(2-3):287-99. Epub 2014 Dec 15. PMID: 25251260. [CrossRef]
- Nguyen Huu T, Park J, Zhang Y, Park I, Yoon HJ, Woo HA, Lee SR. Redox Regulation of PTEN by Peroxiredoxins. Antioxidants (Basel). 2021 Feb 16;10(2):302. PMID: 33669370; PMCID: PMC7920247. [CrossRef]
- Esworthy RS, Swiderek KM, Ho YS, Chu FF. Selenium-dependent glutathione peroxidase-GI is a major glutathione peroxidase activity in the mucosal epithelium of rodent intestine. Biochim Biophys Acta. 1998 Jul 23;1381(2):213-26. PMID: 9685647. [CrossRef]
- Peng F, Xu Q, Jing X, Chi X, Zhang Z, Meng X, Liu X, Yan J, Liu X, Shao S. GPX2 promotes EMT and metastasis in non-small cell lung cancer by activating PI3K/AKT/mTOR/Snail signaling axis. FASEB Bioadv. 2023 Apr 8;5(6):233-250. PMID: 37287867; PMCID: PMC10242197. [CrossRef]
- Haider S, Tyekucheva S, Prandi D, Fox NS, Ahn J, Xu AW, Pantazi A, Park PJ, Laird PW, Sander C, Wang W, Demichelis F, Loda M, Boutros PC; Cancer Genome Atlas Research Network. Systematic Assessment of Tumor Purity and Its Clinical Implications. JCO Precis Oncol. 2020 Sep 4;4:PO.20.00016PMID: 33015524; PMCID: PMC7529507. . [CrossRef]
- Hiller F, Besselt K, Deubel S, Brigelius-Flohé R, Kipp AP. GPx2 Induction Is Mediated Through STAT Transcription Factors During Acute Colitis. Inflamm Bowel Dis. 2015 Sep;21(9):2078-89. PMID: 26115075. [CrossRef]
- Florian S, Krehl S, Loewinger M, Kipp A, Banning A, Esworthy S, Chu FF, Brigelius-Flohé R. Loss of GPx2 increases apoptosis, mitosis, and GPx1 expression in the intestine of mice. Free Radic Biol Med. 2010 Dec 1;49(11):1694-702. Epub 2010 Sep 7. PMID: 20828612; PMCID: PMC4132893. [CrossRef]
- Mouradov D, Sloggett C, Jorissen RN, Love CG, Li S, Burgess AW, Arango D, Strausberg RL, Buchanan D, Wormald S, O'Connor L, Wilding JL, Bicknell D, Tomlinson IP, Bodmer WF, Mariadason JM, Sieber OM. Colorectal cancer cell lines are representative models of the main molecular subtypes of primary cancer. Cancer Res. 2014 Jun 15;74(12):3238-47. Epub 2014 Apr 22. PMID: 24755471. [CrossRef]
- Isella C, Brundu F, Bellomo SE, Galimi F, Zanella E, Porporato R, Petti C, Fiori A, Orzan F, Senetta R, Boccaccio C, Ficarra E, Marchionni L, Trusolino L, Medico E, Bertotti A. Selective analysis of cancer-cell intrinsic transcriptional traits defines novel clinically relevant subtypes of colorectal cancer. Nat Commun. 2017 May 31;8:15107. PMID: 28561063; PMCID: PMC5499209. [CrossRef]
- Guinney J, Dienstmann R, Wang X, de Reyniès A, Schlicker A, Soneson C, Marisa L, Roepman P, Nyamundanda G, Angelino P, Bot BM, Morris JS, Simon IM, Gerster S, Fessler E, De Sousa E Melo F, Missiaglia E, Ramay H, Barras D, Homicsko K, Maru D, Manyam GC, Broom B, Boige V, Perez-Villamil B, Laderas T, Salazar R, Gray JW, Hanahan D, Tabernero J, Bernards R, Friend SH, Laurent-Puig P, Medema JP, Sadanandam A, Wessels L, Delorenzi M, Kopetz S, Vermeulen L, Tejpar S. The consensus molecular subtypes of colorectal cancer. Nat Med. 2015 Nov;21(11):1350-6. Epub 2015 Oct 12. PMID: 26457759; PMCID: PMC4636487. [CrossRef]
- Ziskin JL, Dunlap D, Yaylaoglu M, Fodor IK, Forrest WF, Patel R, Ge N, Hutchins GG, Pine JK, Quirke P, Koeppen H, Jubb AM. In situ validation of an intestinal stem cell signature in colorectal cancer. Gut. 2013 Jul;62(7):1012-23. Epub 2012 May 25. PMID: 22637696. [CrossRef]
- Kipp AP, Müller MF, Göken EM, Deubel S, Brigelius-Flohé R. The selenoproteins GPx2, TrxR2 and TrxR3 are regulated by Wnt signalling in the intestinal epithelium. Biochim Biophys Acta. 2012 Oct;1820(10):1588-96. Epub 2012 Jun 7. PMID: 22683372. [CrossRef]
- Ahmed KM, Veeramachaneni R, Deng D, Putluri N, Putluri V, Cardenas MF, Wheeler DA, Decker WK, Frederick AI, Kazi S, Sikora AG, Sandulache VC, Frederick MJ. Glutathione peroxidase 2 is a metabolic driver of the tumor immune microenvironment and immune checkpoint inhibitor response. J Immunother Cancer. 2022 Aug;10(8):e004752. PMID: 36002187; PMCID: PMC9413193. [CrossRef]
- Smiraglia DJ, Rush LJ, Frühwald MC, Dai Z, Held WA, Costello JF, Lang JC, Eng C, Li B, Wright FA, Caligiuri MA, Plass C. Excessive CpG island hypermethylation in cancer cell lines versus primary human malignancies. Hum Mol Genet. 2001 Jun 15;10(13):1413-9. PMID: 11440994. [CrossRef]
- Suter CM, Norrie M, Ku SL, Cheong KF, Tomlinson I, Ward RL. CpG island methylation is a common finding in colorectal cancer cell lines. Br J Cancer. 2003 Feb 10;88(3):413-9. PMID: 12569385; PMCID: PMC2747532. [CrossRef]
- Auman JT, McLeod HL. Colorectal cancer cell lines lack the molecular heterogeneity of clinical colorectal tumors. Clin Colorectal Cancer. 2010 Jan;9(1):40-7. PMID: 20100687. [CrossRef]
- Emmink BL, Laoukili J, Kipp AP, Koster J, Govaert KM, Fatrai S, Verheem A, Steller EJ, Brigelius-Flohé R, Jimenez CR, Borel Rinkes IH, Kranenburg O. GPx2 suppression of H2O2 stress links the formation of differentiated tumor mass to metastatic capacity in colorectal cancer. Cancer Res. 2014 Nov 15;74(22):6717-30. Epub 2014 Sep 26. PMID: 25261240. [CrossRef]
- Yang J, Antin P, Berx G, Blanpain C, Brabletz T, Bronner M, Campbell K, Cano A, Casanova J, Christofori G, Dedhar S, Derynck R, Ford HL, Fuxe J, García de Herreros A, Goodall GJ, Hadjantonakis AK, Huang RYJ, Kalcheim C, Kalluri R, Kang Y, Khew-Goodall Y, Levine H, Liu J, Longmore GD, Mani SA, Massagué J, Mayor R, McClay D, Mostov KE, Newgreen DF, Nieto MA, Puisieux A, Runyan R, Savagner P, Stanger B, Stemmler MP, Takahashi Y, Takeichi M, Theveneau E, Thiery JP, Thompson EW, Weinberg RA, Williams ED, Xing J, Zhou BP, Sheng G; EMT International Association (TEMTIA). Guidelines and definitions for research on epithelial-mesenchymal transition. Nat Rev Mol Cell Biol. 2020 Jun;21(6):341-352. Epub 2020 Apr 16. Erratum in: Nat Rev Mol Cell Biol. 2021 Dec;22(12):834. PMID: 32300252; PMCID: PMC7250738. [CrossRef]
- Loeser H, Scholz M, Fuchs H, Essakly A, Damanakis AI, Zander T, Büttner R, Schröder W, Bruns C, Quaas A, Gebauer F. Integrin alpha V (ITGAV) expression in esophageal adenocarcinoma is associated with shortened overall-survival. Sci Rep. 2020 Oct 27;10(1):18411. PMID: 33110104; PMCID: PMC7591891. [CrossRef]
- Kurundkar AR, Kurundkar D, Rangarajan S, Locy ML, Zhou Y, Liu RM, Zmijewski J, Thannickal VJ. The matricellular protein CCN1 enhances TGF-β1/SMAD3-dependent profibrotic signaling in fibroblasts and contributes to fibrogenic responses to lung injury. FASEB J. 2016 Jun;30(6):2135-50. Epub 2016 Feb 16. PMID: 26884454; PMCID: PMC4871800. [CrossRef]
- Huet C, Sahuquillo-Merino C, Coudrier E, Louvard D. Absorptive and mucus-secreting subclones isolated from a multipotent intestinal cell line (HT-29) provide new models for cell polarity and terminal differentiation. J Cell Biol. 1987 Jul;105(1):345-57. PMID: 3611191; PMCID: PMC211493. [CrossRef]
- Bravard A, Beaumatin J, Dussaulx E, Lesuffleur T, Zweibaum A, Luccioni C. Modifications of the antioxidant metabolism during proliferation and differentiation of colon tumor cell lines. Int J Cancer. 1994 Dec 15;59(6):843-7. PMID: 7989127. [CrossRef]
- Godtliebsen G, Larsen KB, Bhujabal Z, Opstad IS, Nager M, Punnakkal AR, Kalstad TB, Olsen R, Lund T, Prasad DK, Agarwal K, Myrmel T, Birgisdottir AB. High-resolution visualization and assessment of basal and OXPHOS-induced mitophagy in H9c2 cardiomyoblasts. Autophagy. 2023 Oct;19(10):2769-2788. Epub 2023 Jul 5. PMID: 37405374; PMCID: PMC10472865. [CrossRef]
- Hewitt RE, McMarlin A, Kleiner D, Wersto R, Martin P, Tsokos M, Stamp GW, Stetler-Stevenson WG. Validation of a model of colon cancer progression. J Pathol. 2000 Dec;192(4):446-54. Erratum in: J Pathol 2001 Aug;194(4):507. Tsoskas M [corrected to Tsokos M]. PMID: 11113861. [CrossRef]
- Xu Y, Zhang L, Wang Q, Zheng M. Comparison of Different Colorectal Cancer With Liver Metastases Models Using Six Colorectal Cancer Cell Lines. Pathol Oncol Res. 2020 Oct;26(4):2177-2183Epub 2020 Mar 14. PMID: 32172478. . [CrossRef]
- Sun MA, Wang Y, Cheng H, Zhang Q, Ge W, Guo D. RedoxDB--a curated database for experimentally verified protein oxidative modification. Bioinformatics. 2012 Oct 1;28(19):2551-2. Epub 2012 Jul 25. PMID: 22833525. [CrossRef]
- Merkley ED, Metz TO, Smith RD, Baynes JW, Frizzell N. The succinated proteome. Mass Spectrom Rev. 2014 Mar-Apr;33(2):98-109. Epub 2013 Sep 30. PMID: 24115015; PMCID: PMC4038156. [CrossRef]
- Dustin CM, Heppner DE, Lin MJ, van der Vliet A. Redox regulation of tyrosine kinase signalling: more than meets the eye. J Biochem. 2020 Feb 1;167(2):151-163. PMID: 31599960; PMCID: PMC6988750. [CrossRef]
- Welsh CL, Madan LK. Protein Tyrosine Phosphatase regulation by Reactive Oxygen Species. Adv Cancer Res. 2024;162:45-74. Epub 2024 May 24. PMID: 39069369.]. [CrossRef]
- Han L, Wang S, Wei C, Fang Y, Huang S, Yin T, Xiong B, Yang C. Tumour microenvironment: a non-negligible driver for epithelial-mesenchymal transition in colorectal cancer. Expert Rev Mol Med. 2021 Nov 11;23:e16. PMID: 34758892. [CrossRef]
- Catalano V, Turdo A, Di Franco S, Dieli F, Todaro M, Stassi G. Tumor and its microenvironment: a synergistic interplay. Semin Cancer Biol. 2013 Dec;23(6 Pt B):522-32. Epub 2013 Sep 4. PMID: 24012661. [CrossRef]
- Ernst M, Ramsay RG. Colorectal cancer mouse models: integrating inflammation and the stroma. J Gastroenterol Hepatol. 2012 Jan;27(1):39-50. PMID: 22188027. [CrossRef]
- Hirsch D, Seyfried S, Staib T, Fiedler D, Sauer C, Ried T, Witt S, Rueckert F, Gaiser T. Newly established gastrointestinal cancer cell lines retain the genomic and immunophenotypic landscape of their parental cancers. Sci Rep. 2020 Oct 21;10(1):17895. PMID: 33087752; PMCID: PMC7578805. [CrossRef]
- Tompkins WA, Watrach AM, Schmale JD, Schultz RM, Harris JA. Cultural and antigenic properties of newly established cell strains derived from adenocarcinomas of the human colon and rectum. J Natl Cancer Inst. 1974 Apr;52(4):1101-10. PMID: 4826581. [CrossRef]
- Calon A, Espinet E, Palomo-Ponce S, Tauriello DV, Iglesias M, Céspedes MV, Sevillano M, Nadal C, Jung P, Zhang XH, Byrom D, Riera A, Rossell D, Mangues R, Massagué J, Sancho E, Batlle E. Dependency of colorectal cancer on a TGF-β-driven program in stromal cells for metastasis initiation. Cancer Cell. 2012 Nov 13;22(5):571-84. PMID: 23153532; PMCID: PMC3512565. [CrossRef]
- Fagundes RR, Belt SC, Bakker BM, Dijkstra G, Harmsen HJM, Faber KN. Beyond butyrate: microbial fiber metabolism supporting colonic epithelial homeostasis. Trends Microbiol. 2024 Feb;32(2):178-189. Epub 2023 Aug 16. PMID: 37596118. [CrossRef]
- Tomé D. The Roles of Dietary Glutamate in the Intestine. Ann Nutr Metab. 2018;73 Suppl 5:15-20. Epub 2018 Dec 3. PMID: 30508814. [CrossRef]
- Gomes S, Baltazar F, Silva E, Preto A. Microbiota-Derived Short-Chain Fatty Acids: New Road in Colorectal Cancer Therapy. Pharmaceutics. 2022 Nov 1;14(11):2359. PMID: 36365177; PMCID: PMC9698921. [CrossRef]
- Teeli AS, Łuczyńska K, Haque E, Gayas MA, Winiarczyk D, Taniguchi H. Disruption of Tumor Suppressors HNF4α/HNF1α Causes Tumorigenesis in Liver. Cancers (Basel). 2021 Oct 26;13(21):5357. PMID: 34771521; PMCID: PMC8582545. [CrossRef]
- D'Angelo A, Bluteau O, Garcia-Gonzalez MA, Gresh L, Doyen A, Garbay S, Robine S, Pontoglio M. Hepatocyte nuclear factor 1alpha and beta control terminal differentiation and cell fate commitment in the gut epithelium. Development. 2010 May;137(9):1573-82. PMID: 20388655. [CrossRef]
- Qu X, Yan X, Kong C, Zhu Y, Li H, Pan D, Zhang X, Liu Y, Yin F, Qin H. c-Myb promotes growth and metastasis of colorectal cancer through c-fos-induced epithelial-mesenchymal transition. Cancer Sci. 2019 Oct;110(10):3183-3196. Epub 2019 Aug 13. PMID: 31338937; PMCID: PMC6778643. [CrossRef]
- Fu M, Hu Y, Lan T, Guan KL, Luo T, Luo M. The Hippo signalling pathway and its implications in human health and diseases. Signal Transduct Target Ther. 2022 Nov 8;7(1):376. [CrossRef]
- Huang H, Zhang W, Pan Y, Gao Y, Deng L, Li F, Li F, Ma X, Hou S, Xu J, Li P, Li X, Hu G, Li C, Chen H, Zhang L, Ji H. YAP Suppresses Lung Squamous Cell Carcinoma Progression via Deregulation of the DNp63-GPX2 Axis and ROS Accumulation. Cancer Res. 2017 Nov 1;77(21):5769-5781. Epub 2017 Sep 15. [CrossRef]
- Soo HC, Chung FF, Lim KH, Yap VA, Bradshaw TD, Hii LW, Tan SH, See SJ, Tan YF, Leong CO, Mai CW. Cudraflavone C Induces Tumor-Specific Apoptosis in Colorectal Cancer Cells through Inhibition of the Phosphoinositide 3-Kinase (PI3K)-AKT Pathway. PLoS One. 2017 Jan 20;12(1):e0170551PMID: 28107519; PMCID: PMC5249192. . [CrossRef]
- Coant N, Ben Mkaddem S, Pedruzzi E, Guichard C, Tréton X, Ducroc R, Freund JN, Cazals-Hatem D, Bouhnik Y, Woerther PL, Skurnik D, Grodet A, Fay M, Biard D, Lesuffleur T, Deffert C, Moreau R, Groyer A, Krause KH, Daniel F, Ogier-Denis E. NADPH oxidase 1 modulates WNT and NOTCH1 signaling to control the fate of proliferative progenitor cells in the colon. Mol Cell Biol. 2010 Jun;30(11):2636-50. Epub 2010 Mar 29. PMID: 20351171; PMCID: PMC2876517. [CrossRef]
- Chu FF, Esworthy RS, Shen B, Doroshow JH. Role of the microbiota in ileitis of a mouse model of inflammatory bowel disease-Glutathione peroxide isoenzymes 1 and 2-double knockout mice on a C57BL background. Microbiologyopen. 2020 Oct;9(10):e1107. Epub 2020 Aug 18. PMID: 32810389; PMCID: PMC7568258. [CrossRef]
- Chu FF, Esworthy RS, Chu PG, Longmate JA, Huycke MM, Wilczynski S, Doroshow JH. Bacteria-induced intestinal cancer in mice with disrupted Gpx1 and Gpx2 genes. Cancer Res. 2004 Feb 1;64(3):962-8. PMID: 14871826. [CrossRef]
- Lu J, Jiang G, Wu Y, Antony S, Meitzler JL, Juhasz A, Liu H, Roy K, Makhlouf H, Chuaqui R, Butcher D, Konaté MM, Doroshow JH. NADPH oxidase 1 is highly expressed in human large and small bowel cancers. PLoS One. 2020 May 19;15(5):e0233208. PMID: 32428030; PMCID: PMC7237001. [CrossRef]
- Dunne PD, McArt DG, Bradley CA, O'Reilly PG, Barrett HL, Cummins R, O'Grady T, Arthur K, Loughrey MB, Allen WL, McDade SS, Waugh DJ, Hamilton PW, Longley DB, Kay EW, Johnston PG, Lawler M, Salto-Tellez M, Van Schaeybroeck S. Challenging the Cancer Molecular Stratification Dogma: Intratumoral Heterogeneity Undermines Consensus Molecular Subtypes and Potential Diagnostic Value in Colorectal Cancer. Clin Cancer Res. 2016 Aug 15;22(16):4095-104. Epub 2016 May 5. PMID: 27151745. [CrossRef]
- Leibovitz A, Stinson JC, McCombs WB 3rd, McCoy CE, Mazur KC, Mabry ND. Classification of human colorectal adenocarcinoma cell lines. Cancer Res. 1976 Dec;36(12):4562-9. PMID: 1000501.
- Solic N, Collins JE, Richter A, Holt SJ, Campbell I, Alexander P, Davies DE. Two newly established cell lines derived from the same colonic adenocarcinoma exhibit differences in EGF-receptor ligand and adhesion molecule expression. Int J Cancer. 1995 Jul 4;62(1):48-57. PMID: 7601566. [CrossRef]
- Ohata H, Shiokawa D, Obata Y, Sato A, Sakai H, Fukami M, Hara W, Taniguchi H, Ono M, Nakagama H, Okamoto K. NOX1-Dependent mTORC1 Activation via S100A9 Oxidation in Cancer Stem-like Cells Leads to Colon Cancer Progression. Cell Rep. 2019 Jul 30;28(5):1282-1295.e8. PMID: 31365870. [CrossRef]
- van der Post S, Birchenough GMH, Held JM. NOX1-dependent redox signaling potentiates colonic stem cell proliferation to adapt to the intestinal microbiota by linking EGFR and TLR activation. Cell Rep. 2021 Apr 6;35(1):108949. PMID: 33826887; PMCID: PMC10327654. [CrossRef]
- Chen M, Mainardi S, Lieftink C, Velds A, de Rink I, Yang C, Kuiken HJ, Morris B, Edwards F, Jochems F, van Tellingen O, Boeije M, Proost N, Jansen RA, Qin S, Jin H, Koen van der Mijn JC, Schepers A, Venkatesan S, Qin W, Beijersbergen RL, Wang L, Bernards R. Targeting of vulnerabilities of drug-tolerant persisters identified through functional genetics delays tumor relapse. Cell Rep Med. 2024 Mar 19;5(3):101471. PMID: 38508142; PMCID: PMC10983104. [CrossRef]
- Oren Y, Tsabar M, Cuoco MS, Amir-Zilberstein L, Cabanos HF, Hütter JC, Hu B, Thakore PI, Tabaka M, Fulco CP, Colgan W, Cuevas BM, Hurvitz SA, Slamon DJ, Deik A, Pierce KA, Clish C, Hata AN, Zaganjor E, Lahav G, Politi K, Brugge JS, Regev A. Cycling cancer persister cells arise from lineages with distinct programs. Nature. 2021 Aug;596(7873):576-582. Epub 2021 Aug 11. PMID: 34381210; PMCID: PMC9209846. [CrossRef]
- Barry CJ, Pillay CS, Rohwer JM. Modelling the Decamerisation Cycle of PRDX1 and the Inhibition-like Effect on Its Peroxidase Activity. Antioxidants (Basel). 2023 Sep 1;12(9):1707. PMID: 37760010; PMCID: PMC10525498. [CrossRef]
- Portillo-Ledesma S, Randall LM, Parsonage D, Dalla Rizza J, Karplus PA, Poole LB, Denicola A, Ferrer-Sueta G. Differential Kinetics of Two-Cysteine Peroxiredoxin Disulfide Formation Reveal a Novel Model for Peroxide Sensing. Biochemistry. 2018 Jun 19;57(24):3416-3424. Epub 2018 Mar 30. PMID: 29553725; PMCID: PMC6383210. [CrossRef]
- Low FM, Hampton MB, Peskin AV, Winterbourn CC. Peroxiredoxin 2 functions as a noncatalytic scavenger of low-level hydrogen peroxide in the erythrocyte. Blood. 2007 Mar 15;109(6):2611-7. Epub 2006 Nov 14. PMID: 17105810. [CrossRef]
- Buetler TM, Krauskopf A, Ruegg UT. Role of superoxide as a signaling molecule. News Physiol Sci. 2004 Jun;19:120-3. PMID: 15143206. [CrossRef]
- Barbáchano A, Fernández-Barral A, Bustamante-Madrid P, Prieto I, Rodríguez-Salas N, Larriba MJ, Muñoz A. Organoids and Colorectal Cancer. Cancers (Basel). 2021 May 28;13(11):2657. PMID: 34071313; PMCID: PMC8197877. [CrossRef]
- Müller MF, Florian S, Pommer S, Osterhoff M, Esworthy RS, Chu FF, Brigelius-Flohé R, Kipp AP. Deletion of glutathione peroxidase-2 inhibits azoxymethane-induced colon cancer development. PLoS One. 2013 Aug 19;8(8):e72055. PMID: 23977205; PMCID: PMC3747154. [CrossRef]
- Banning A, Kipp A, Schmitmeier S, Löwinger M, Florian S, Krehl S, Thalmann S, Thierbach R, Steinberg P, Brigelius-Flohé R. Glutathione Peroxidase 2 Inhibits Cyclooxygenase-2-Mediated Migration and Invasion of HT-29 Adenocarcinoma Cells but Supports Their Growth as Tumors in Nude Mice. Cancer Res. 2008 Dec 1;68(23):9746-53. PMID: 19047153. [CrossRef]


Disclaimer/Publisher’s Note: The statements, opinions and data contained in all publications are solely those of the individual author(s) and contributor(s) and not of MDPI and/or the editor(s). MDPI and/or the editor(s) disclaim responsibility for any injury to people or property resulting from any ideas, methods, instructions or products referred to in the content. |
© 2024 by the authors. Licensee MDPI, Basel, Switzerland. This article is an open access article distributed under the terms and conditions of the Creative Commons Attribution (CC BY) license (http://creativecommons.org/licenses/by/4.0/).


