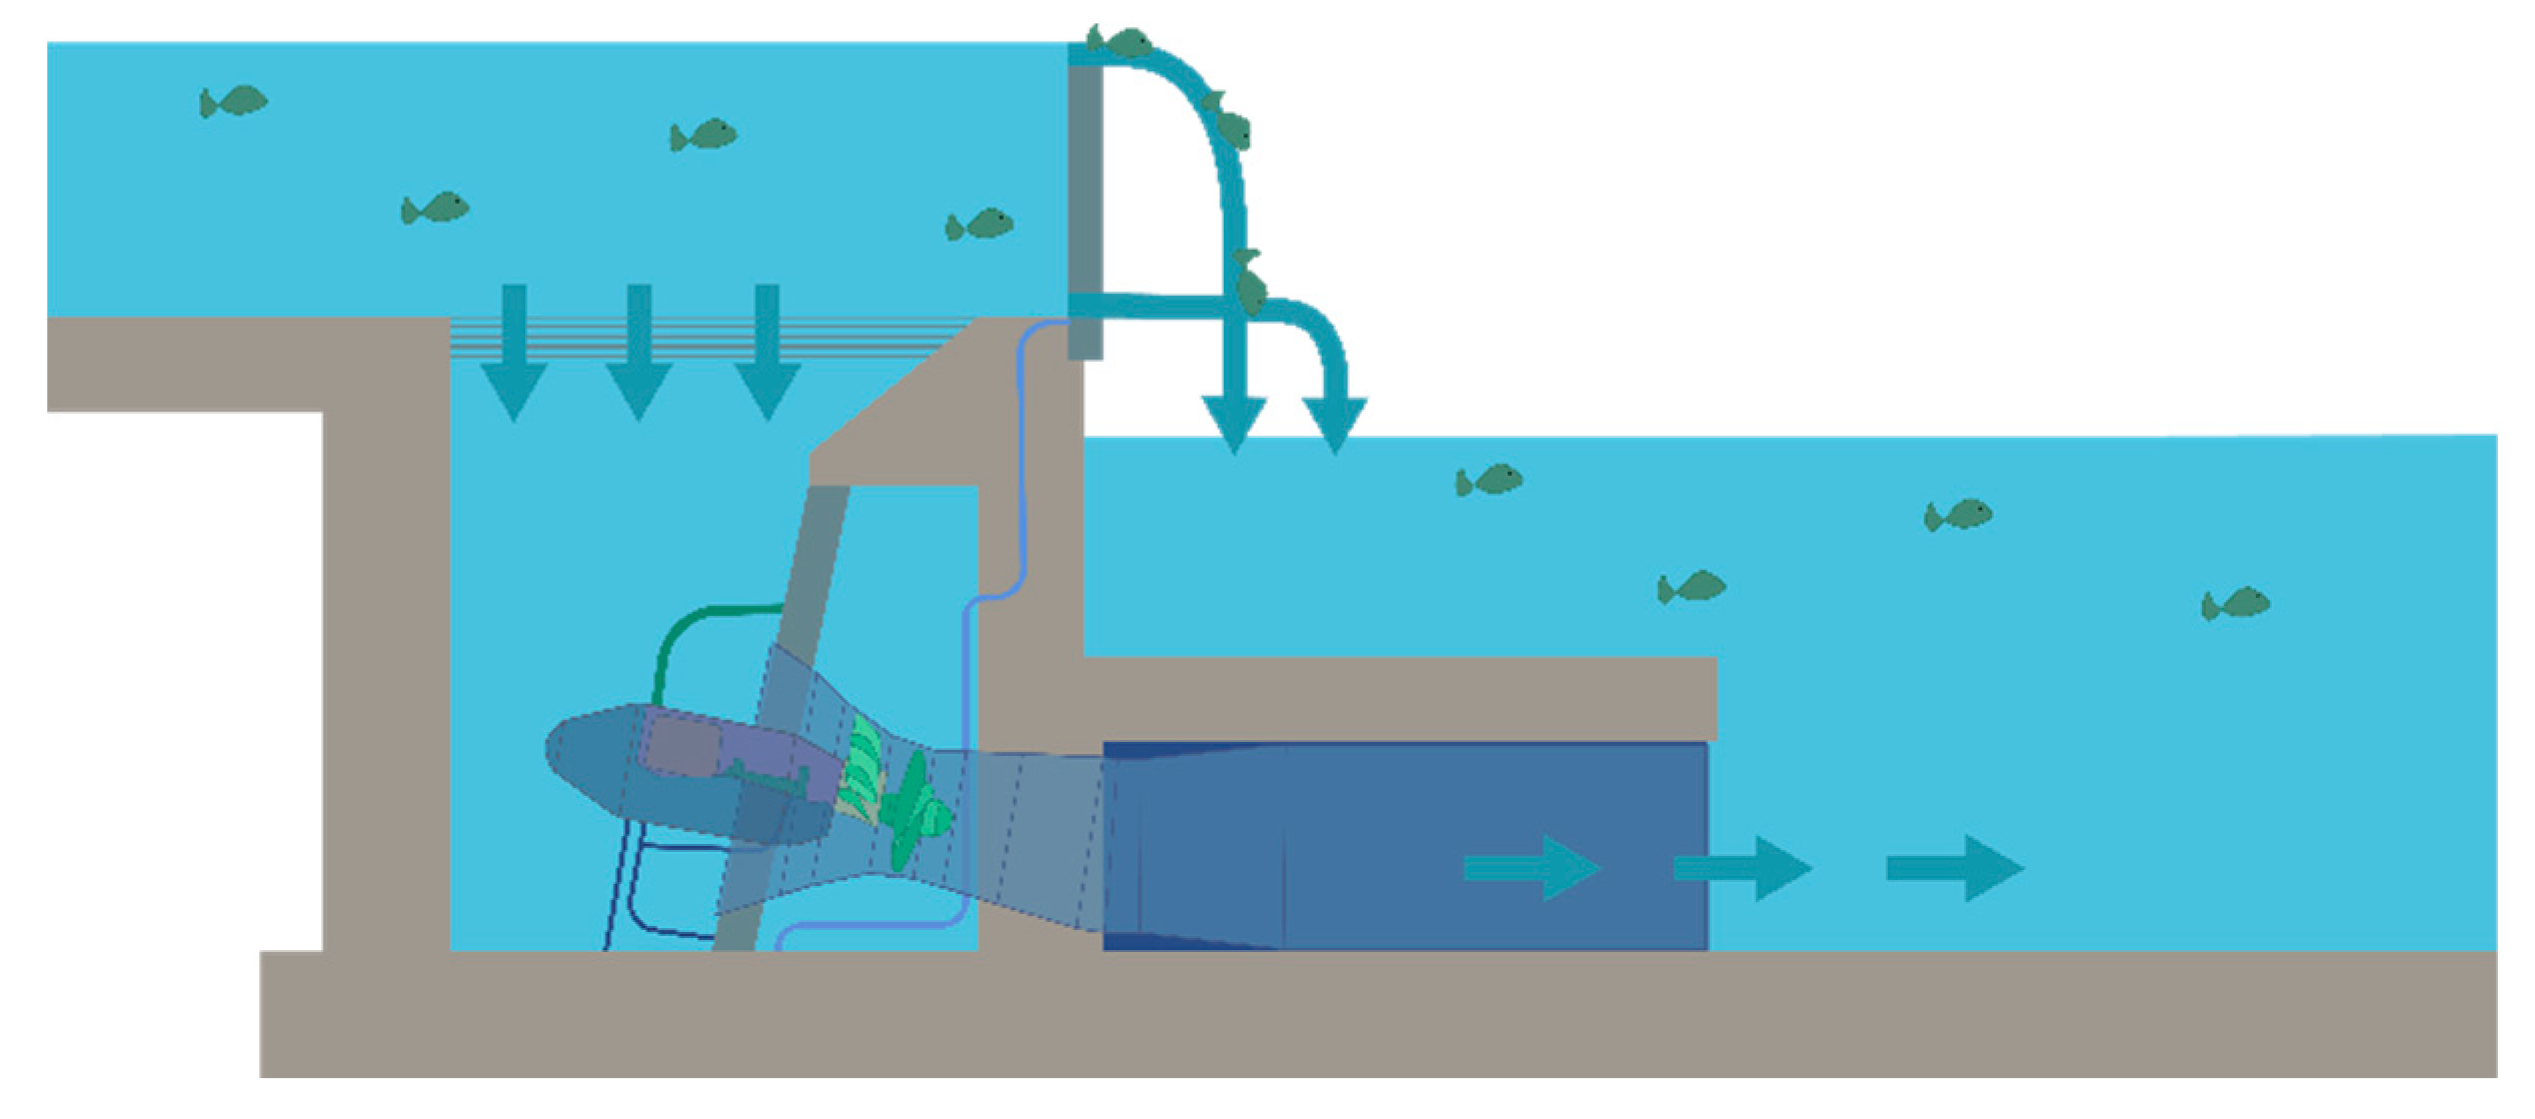
2.1. Physical Model Testing
The presented study is centered around previous physical model testing at the prototype SHPP facility built and commissioned at the Oskar-von-Miller Hydraulic Research Institute of TUM in 2013. In accordance with objective (1) of our study, we are using the data and observations made during two different experimental setups for which we chose the following nomenclature for our study:
Experimental setup 01 (E01) is referred to when we describe observations with the basic hydraulic configuration of the prototype with a three-sided upstream approach flow.
Experimental setup 02 (E02) is referred to when we describe observations with a modified configuration of the prototype with a one-sided upstream approach flow.
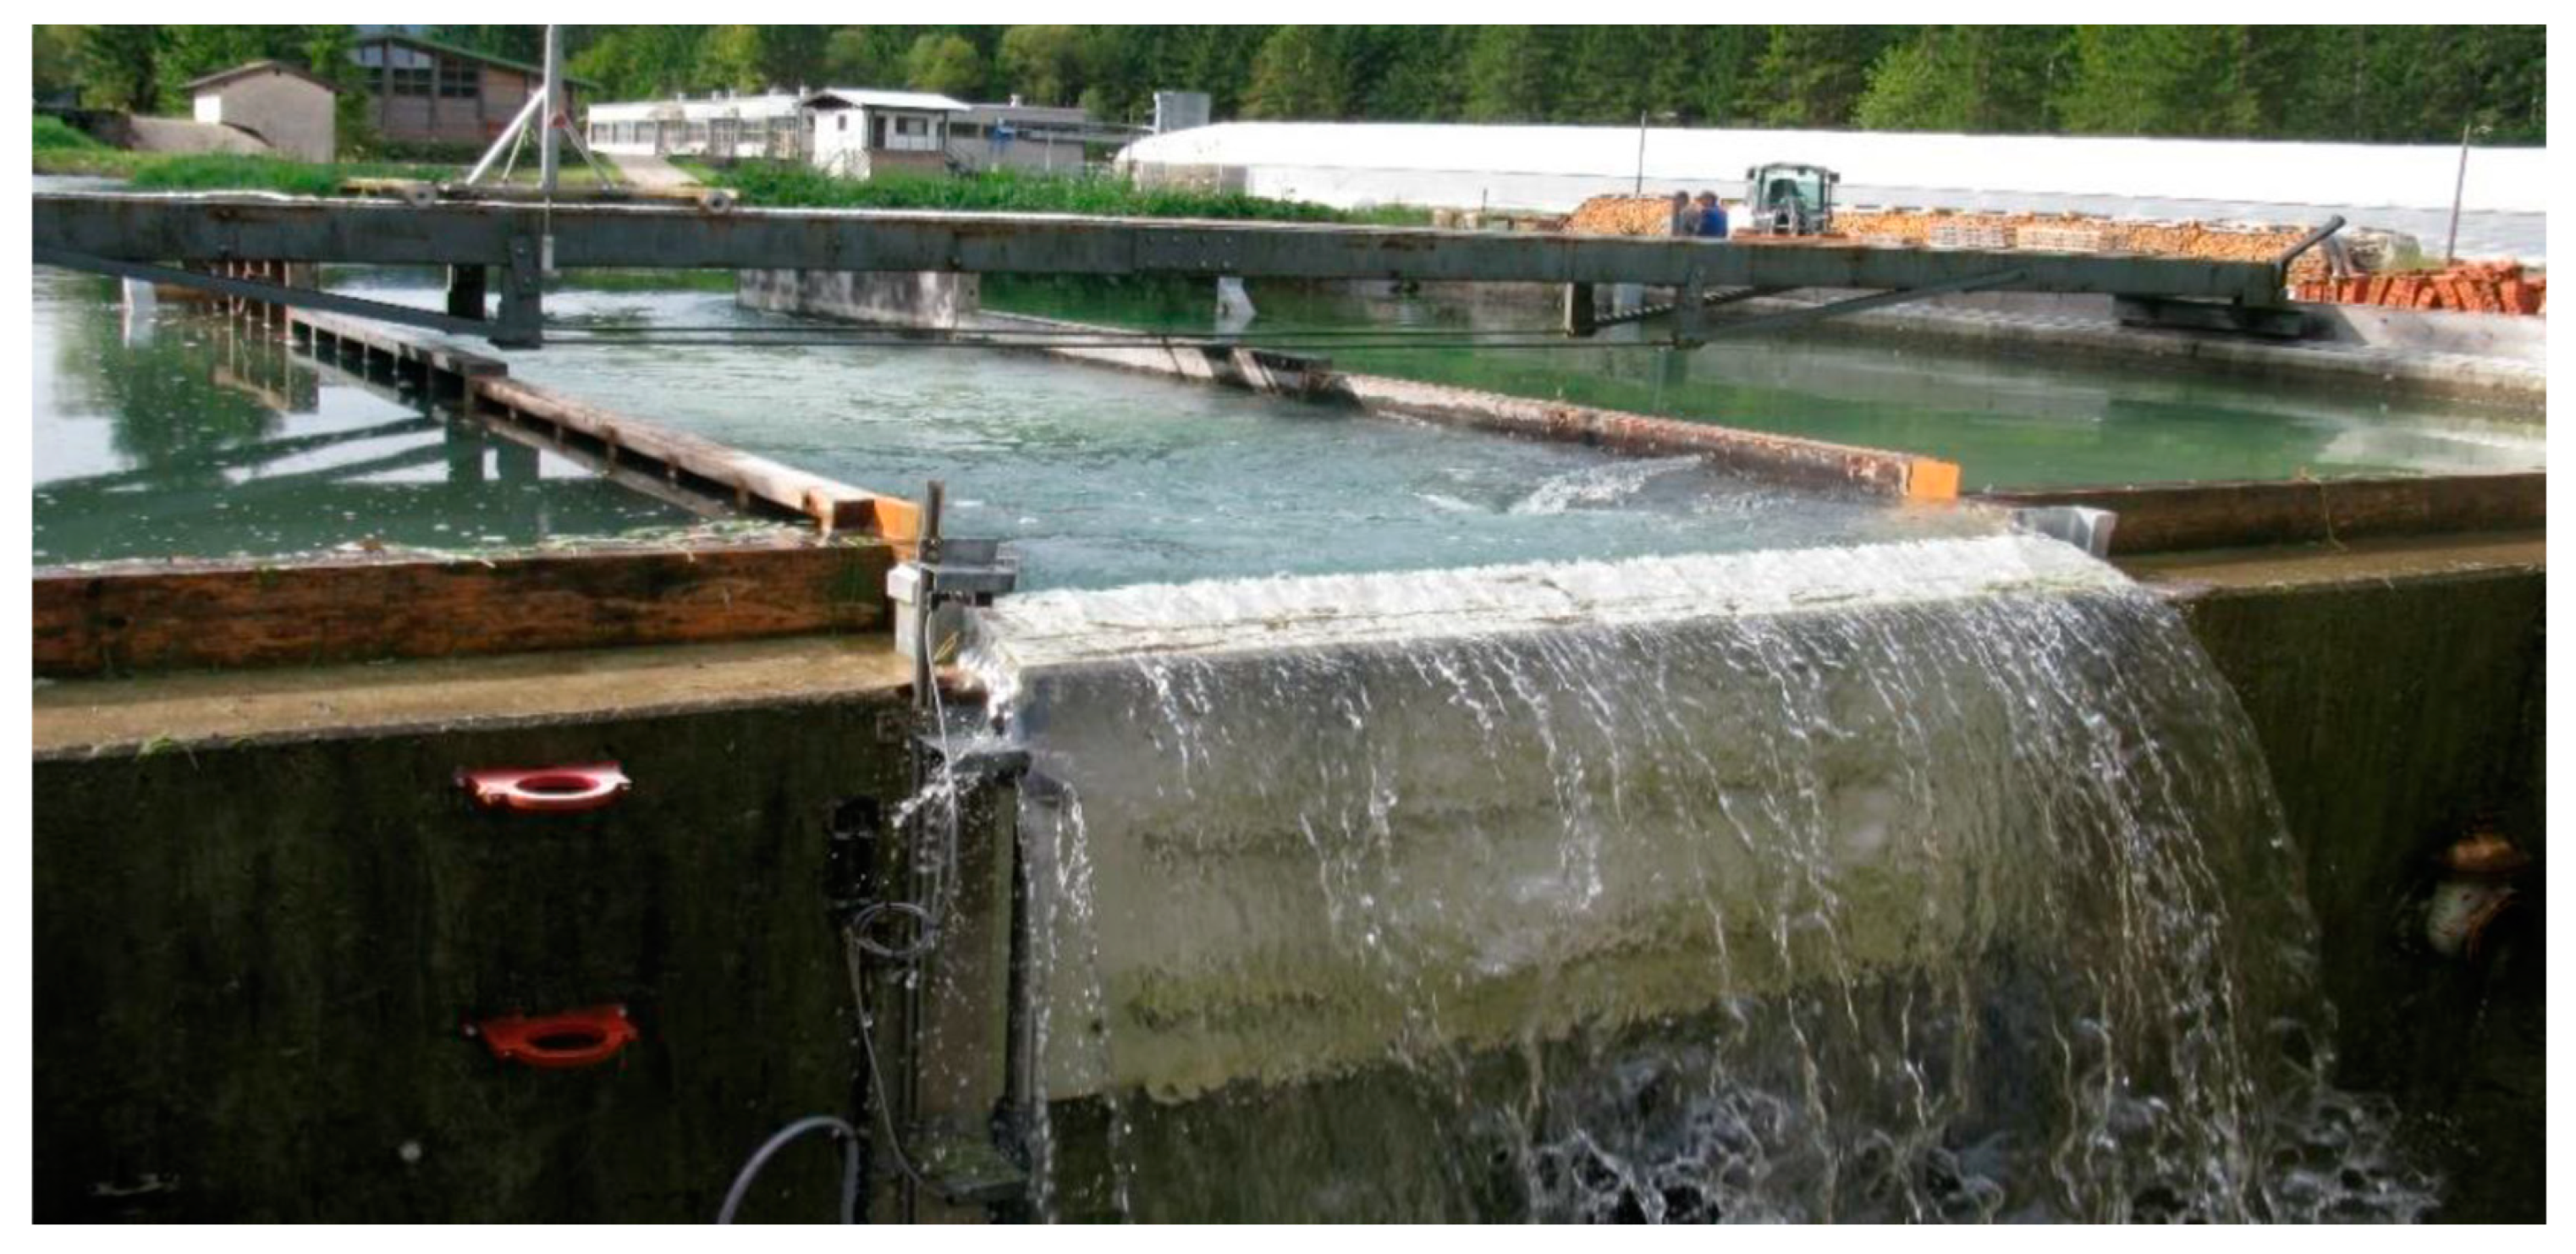
The overall arrangement of the prototype facility is displayed in
Figure 2.
At this facility, experiments focused on analyzing fish behavior and assessing bypass functionality (
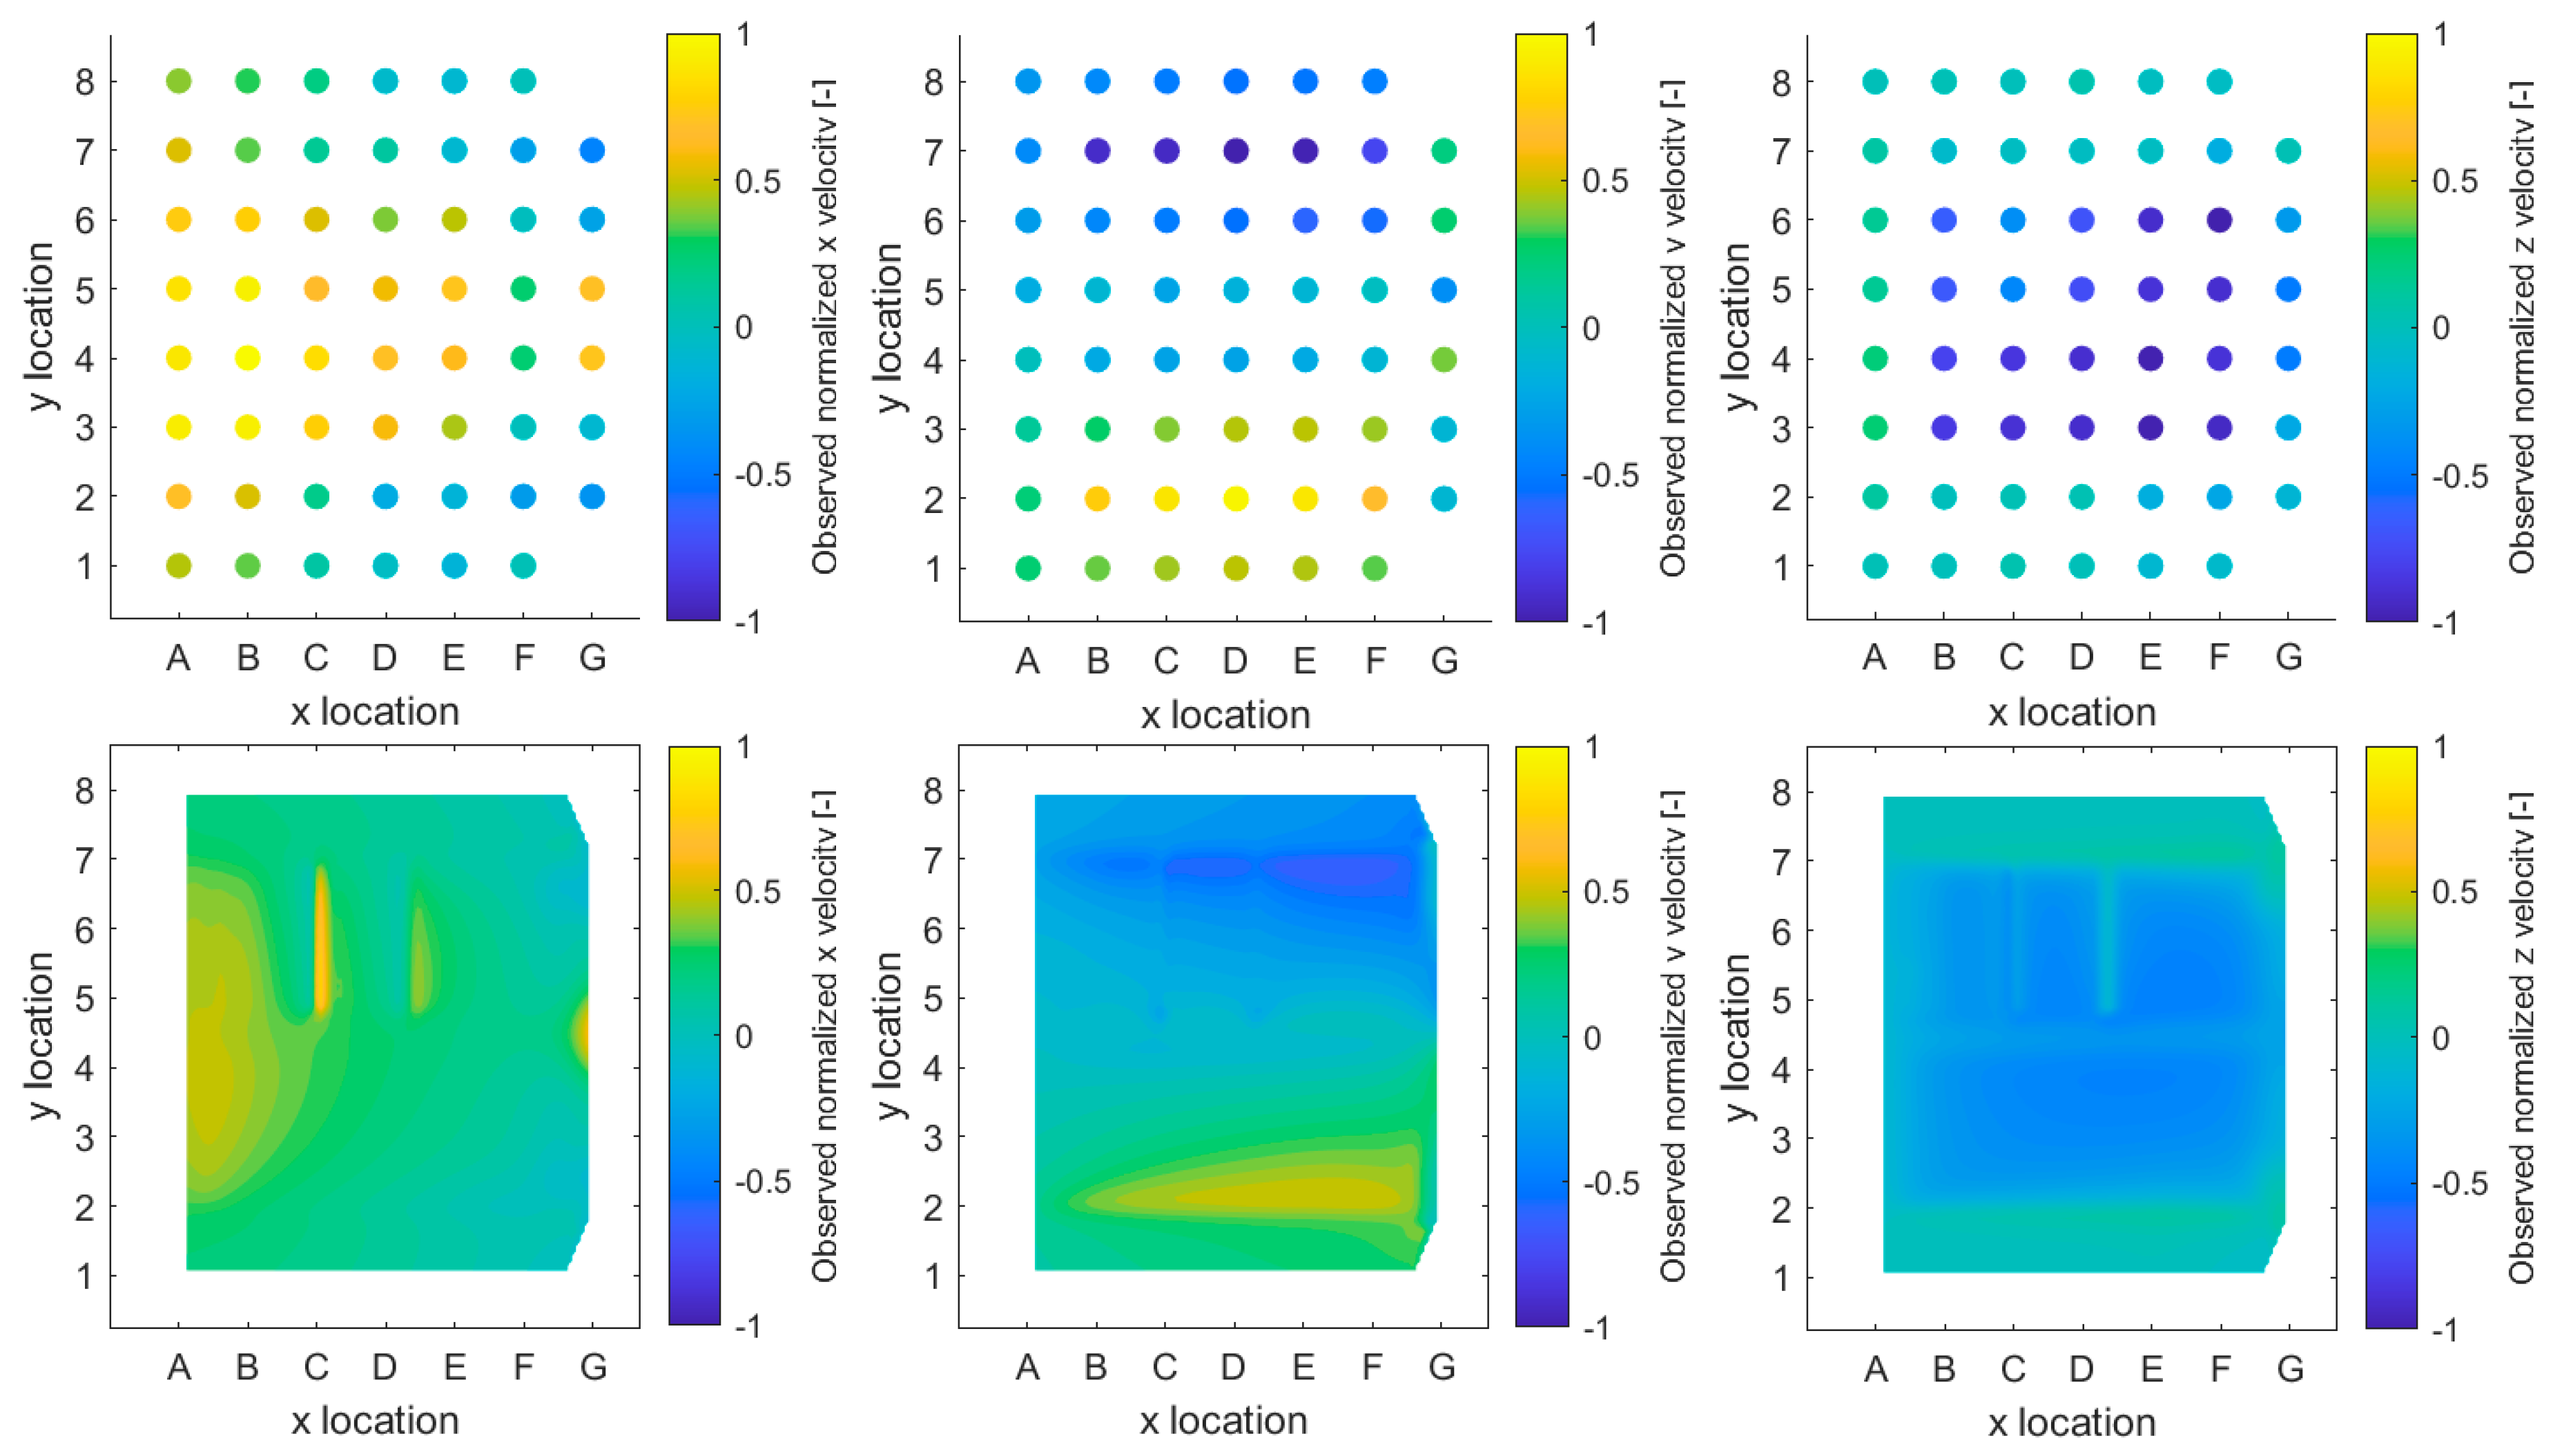
E01) were carried out in 2013 using the basic arrangement of the SHPP concept with a three-sided upstream approach flow towards the shaft intake. As part of these experiments, flow velocity measurements were carried out to confirm the maximum velocities at the screen and the flow field distribution. These measurements utilized a 3D Nortek Field Acoustic Doppler Velocimeter (ADV) probe. The measurement grid had a lateral resolution of 39 cm in both directions (x and y), covering the entire intake plane, and was positioned 4.6 cm above the trash rack (see
Figure 3). At each point, velocities for all three dimensions (x, y, z) were recorded for 60 seconds, and the time-averaged velocities were calculated [
7].
Several discharges and configurations (i.e., with top or bottom bypass opening) were tested with this experimental setup. For the first objective of our study, only the case with full turbine discharge of 1.5 m
3/s, an overflow height at the gate of 7.3 cm, and the bottom bypass in operation is relevant – as the physical measurements from this case are used for validation of the numerical model results. In the course of E01, the intake area exhibited a relatively smooth flow surface with minimal vortex activity. Irregular local vortices appeared sporadically in the areas where the sluice gate connected to the weir's corners. Nevertheless, this undesirable geometric feature did not impact the overall hydraulics of the intake [
7]. Further data from the
E01 setup includes measured head losses at the intake, including losses resulting both from the three-dimensional flow deflection above the intake as well as the losses resulting from the increased flow velocities and friction during the flow through the trash rack [
16].
One further experiment (
E02) was conducted at the same prototype facility in 2017. The objective of this experiment
E02 was to find out how the inflow conditions and the overall efficiency of the power plant will change in the case of a one-sided upstream approach flow instead of the original design with a three-sided approach flow. For this experiment, they installed channel guide walls parallel to the main flow direction starting at the gate of the SHPP and reaching 7.5 m upstream, therefore creating a channeled approach flow towards the SHPP intake, as shown in
Figure 4. The experiment was conducted at different flow rates, and the resulting conditions were recorded qualitatively by photos and quantitatively by ADV measurements following the same principle as during the experiments of E01 in 2013. The findings showed that the one-sided approach flow leads to an increased approach velocity and inhomogeneous flow patterns above the intake with the risk of vortex formation [
17].
2.2. Numerical Model Testing
According to the first objective of the present study, the physically determined data from the two experimental setups, E01 and E02, at the prototype facility was used to set up, calibrate, and validate a numerical model of the two presented geometrically different arrangements. Following validation, the geometry of the model was modified to assess different configurations and their impact on the flow field. This forms the foundation for further design optimization of the SHPP concept. The numerical model testing process is organized into three simulation sets.
Simulation set M01 refers to all simulations we conducted to generate a calibrated and validated numerical model of the experimental setup E01 with a three-sided upstream approach flow.
In simulation set M02 we used the calibrated and validated model of the set M01 and added lateral guide walls in accordance with the experimental setup E02 with a one-sided up-stream approach flow.
Finally, in the simulation set M03, we conducted three further simulations with a one-sided upstream approach flow and additionally varying one relevant design parameter during each of them in order to determine their relevance and for subsequent hydraulic design optimization according to the second objective of our study.
For the 3D-CFD simulations, the commercial software FLOW-3D® HYDRO (Version 2023R1) was applied. It employs the finite difference and finite volume methods to solve the equations of motion for fluids and obtain three-dimensional solutions to flow problems. The software utilizes structured rectangular grids (i.e., computational mesh) to discretize the problem into a numerical model following the immersed boundary method, simplifying the process of importing diverse solid geometries and integrating the solid model into the software, as the base mesh can remain unchanged when importing an altered geometry. Within the computational mesh, the software solves the Reynolds-averaged Navier-Stokes equations, consisting of three-dimensional mass and momentum conservation equations to replicate the flow field. It also addresses the challenge of modeling free surfaces in computational environments by neglecting the inertia of gas adjacent to the liquid and replacing it with an empty space represented only by uniform pressure and temperature, defined as the Volume of Fluid (VOF) method [
18,
19]. The software offers the further advantage that sub-models can be easily added to the basic hydraulic-numerical model. For the presented cases, this is relevant for two reasons.
First, simulating the flow through the trash-rack with 20 mm bar spacing and 12 mm bar thickness would require an extremely fine resolution of the computational mesh with correspondingly long and unfeasible computation times. Instead, the trash rack was defined here as a porous medium with directional porosity characteristics, allowing the simplified yet accurate representation of the flow through it. The porous-media model is implemented as a sub-grid process by applying volume-averaged quantities to the porous region and calculating bulk fluid velocity and pressure drop with an appropriate drag model [
13,
18].
Second, the rotation of the turbine runner is represented in a simplified way as a fan model, which imparts momentum to the fluid in a region defined by a special type of geometry component. This model induces both swirl and axial velocity components to the fluid that enters the volume inside the fan component, which is defined by a cylinder of the actual turbine runner's dimensions (diameter, thickness) [
18].
For the presented numerical model tests the following basic settings have been chosen within the software:
The turbulence model chosen was the Renormalized Group (RNG) k-epsilon model with dynamically computed mixing length.;
To represent the trash rack as a porous medium, the Forchheimer saturated drag model was applied with constant drag coefficient
A throughout all simulations and variable drag coefficient
B, which was modified for model calibration during simulation set
M01 by varying the underlying
-value. The drag coefficient
B is calculated according to equation (1):
with
being a roughness factor typically ranging between 1.8 and 4.0 (representing smooth through rough fibers), and
the average equivalent spherical diameter of the porous medium´s fibers – i.e., in our case the trash rack bar depth of 6.5 mm [
13,
14,
18]. The porosity, defined as the open volume divided by the total volume in each direction as well as the specific surface area, was determined based on the actual geometry of the trash rack (i.e., number of bars, their length, depth, thickness, and spacing). Once the numerical model during set
M01 was calibrated and validated, we did not further vary the porosity settings for the subsequent sets
M02 and
M03.
For the representation of the turbine runner in motion, the fan model properties were set as follows: Spin rate 34.87 rad/s (333 rpm); Thickness 0.16 m; Blade tip thickness 0.014 m; Number of blades: 4.
2.2.1. Simulation Set M01–SHPP with Three-Sided Approach Flow
The first set of simulations, M01, aimed at determining the suitable numerical settings that are needed to replicate the physically measured flow fields as accurately as possible, aligning with objective (1) of this study. The geometry is generated as a 3D-CAD Model based on the technical drawings included in the Annex of [
2]. The small-scale components not depicted with sufficient detail in these drawings (trash rack with cleaning mechanism, gate with bypass openings) were modeled based on their description and figures presented within that report.
The measured head loss from the experimental setup
E01 [
16] was used for primary grid independence analysis and model calibration. The recorded (unpublished) data containing ADV-measured flow velocities of
E01 has been made available by the authors of [
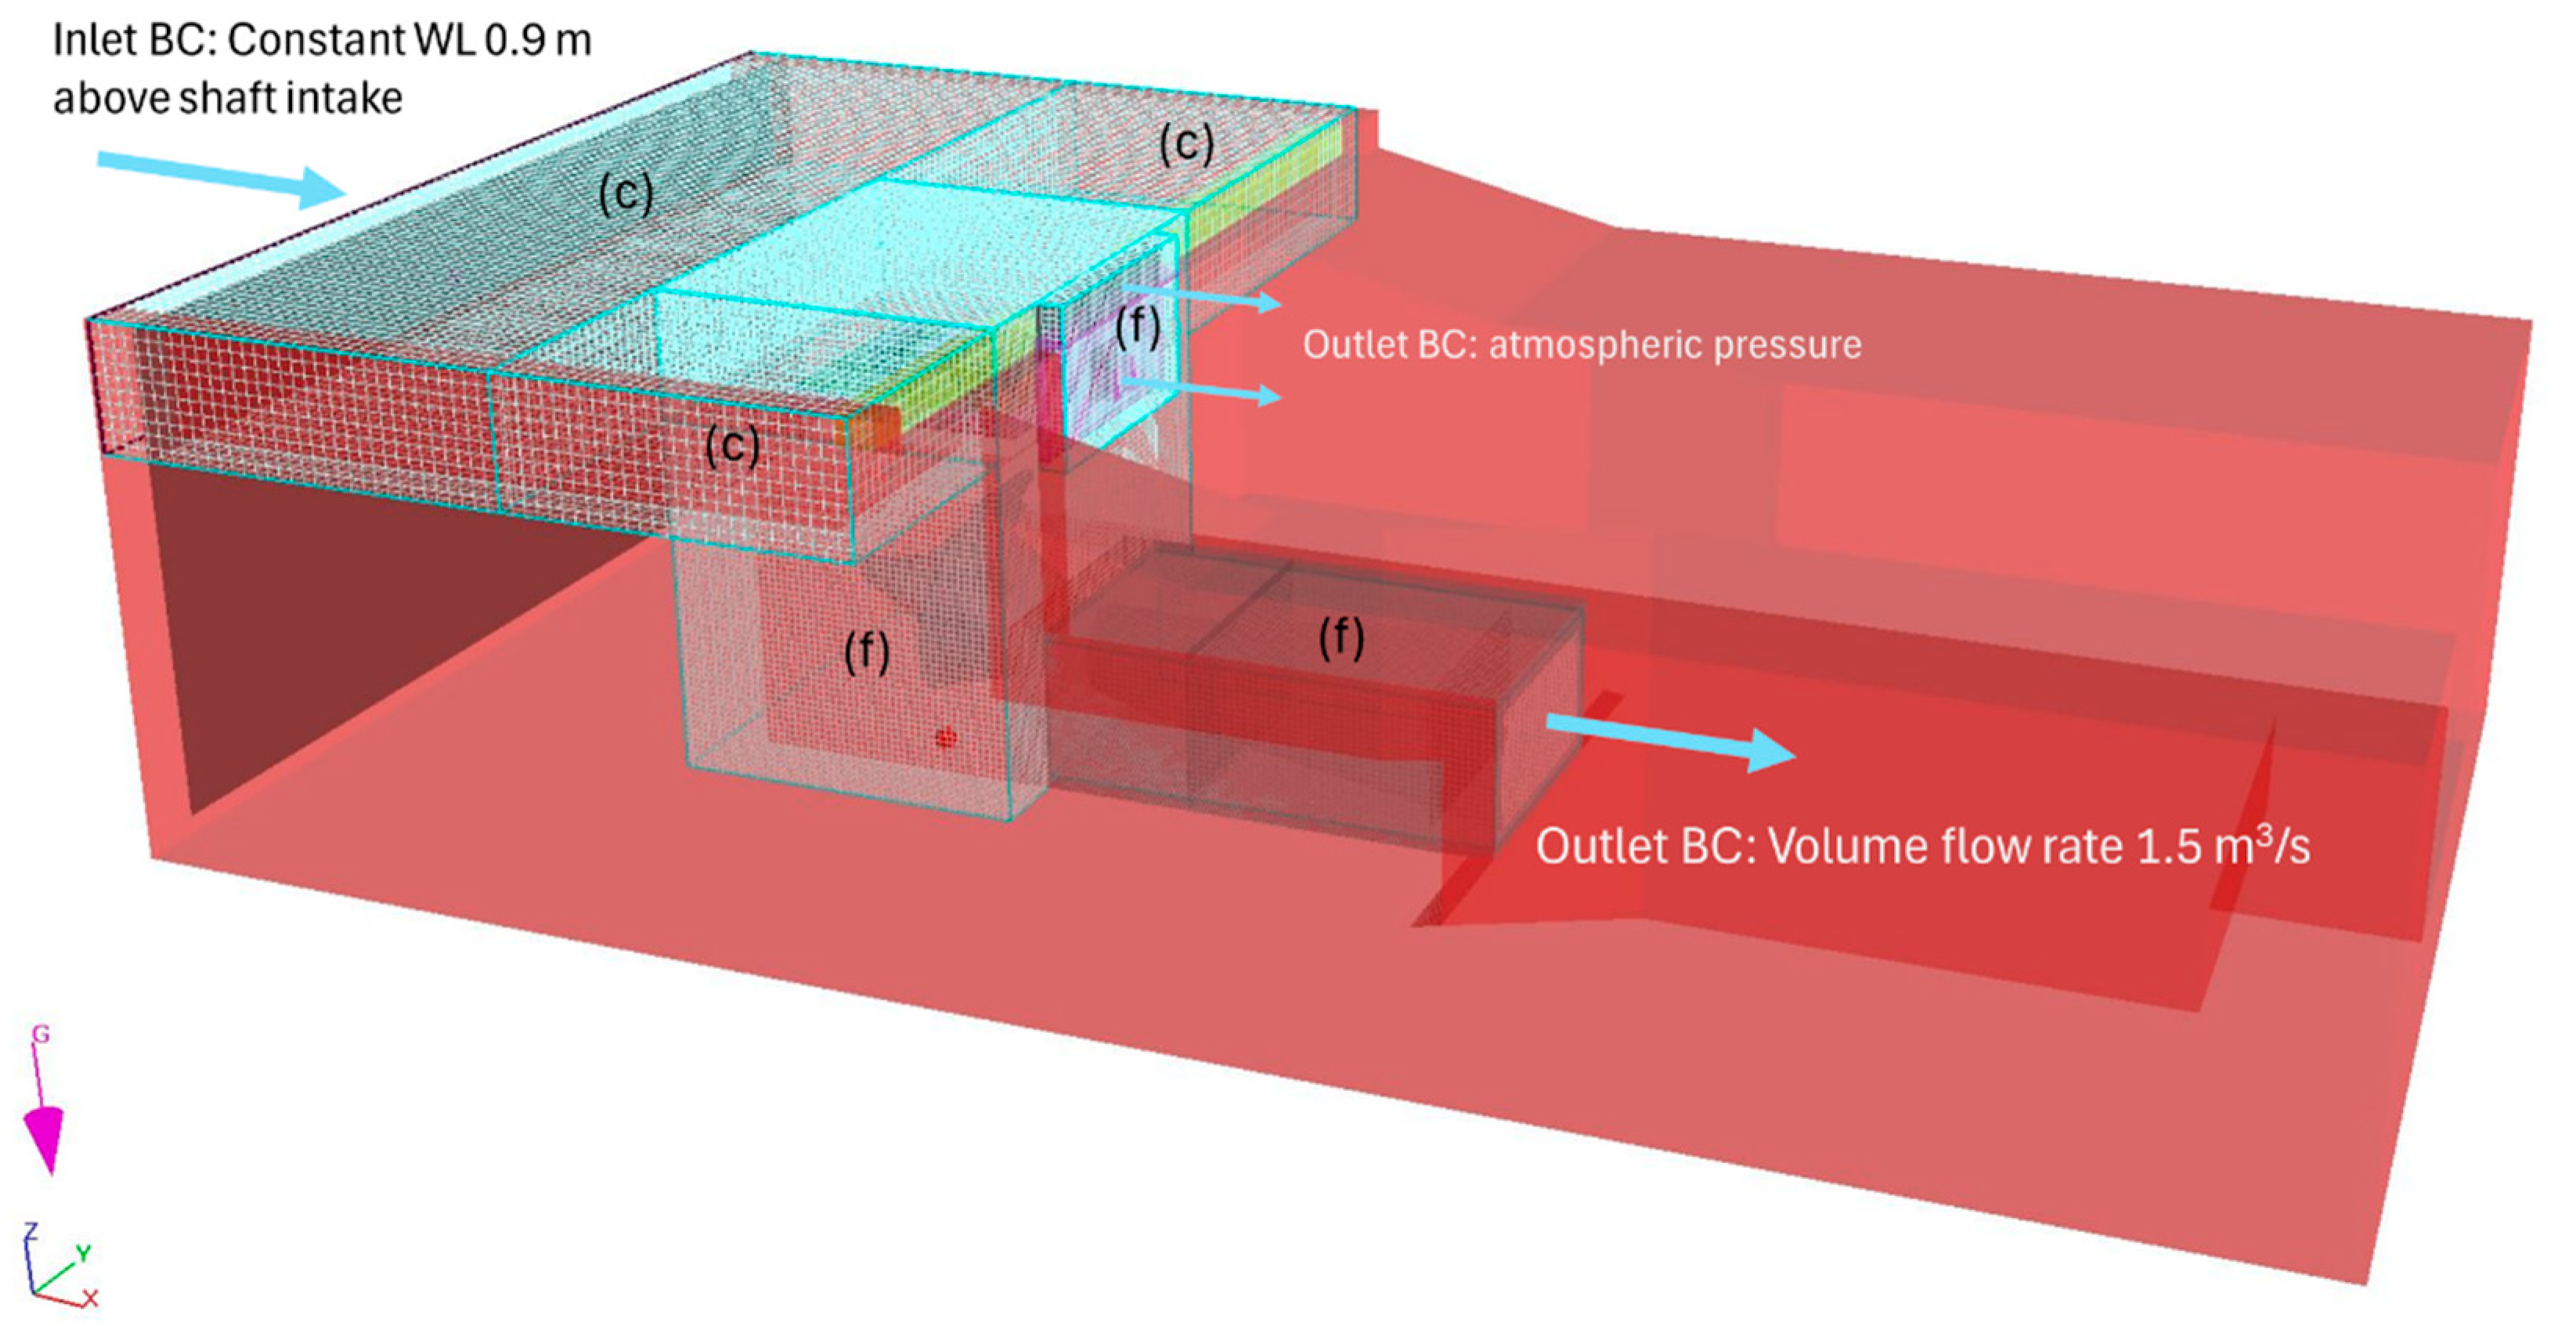
7] and was subsequently used to validate the calibrated numerical model. The model was established using three mesh blocks with a coarser resolution for the upstream area and three mesh blocks with a finer resolution (factor 0.5 of the coarser resolution) surrounding the shaft, the gate, and the draft tube. To reduce the computation times during the calibration process, an initial model was simulated for 600 seconds in order to reach steady-state flow conditions. All further simulations were restarted using this first one as the initial hydraulic condition. The configuration of the
M01 setup with mesh regions and relevant boundary conditions is shown in
Figure 5:
The subsequently computed simulation set
M01 contains five simulations and serves three purposes: to analyze the grid dependency, to calibrate the model by means of changing the drag coefficient B, and to validate the results of the calibrated model by means of statistical analysis. The five simulations with their decisive differences are listed in
Table 1.
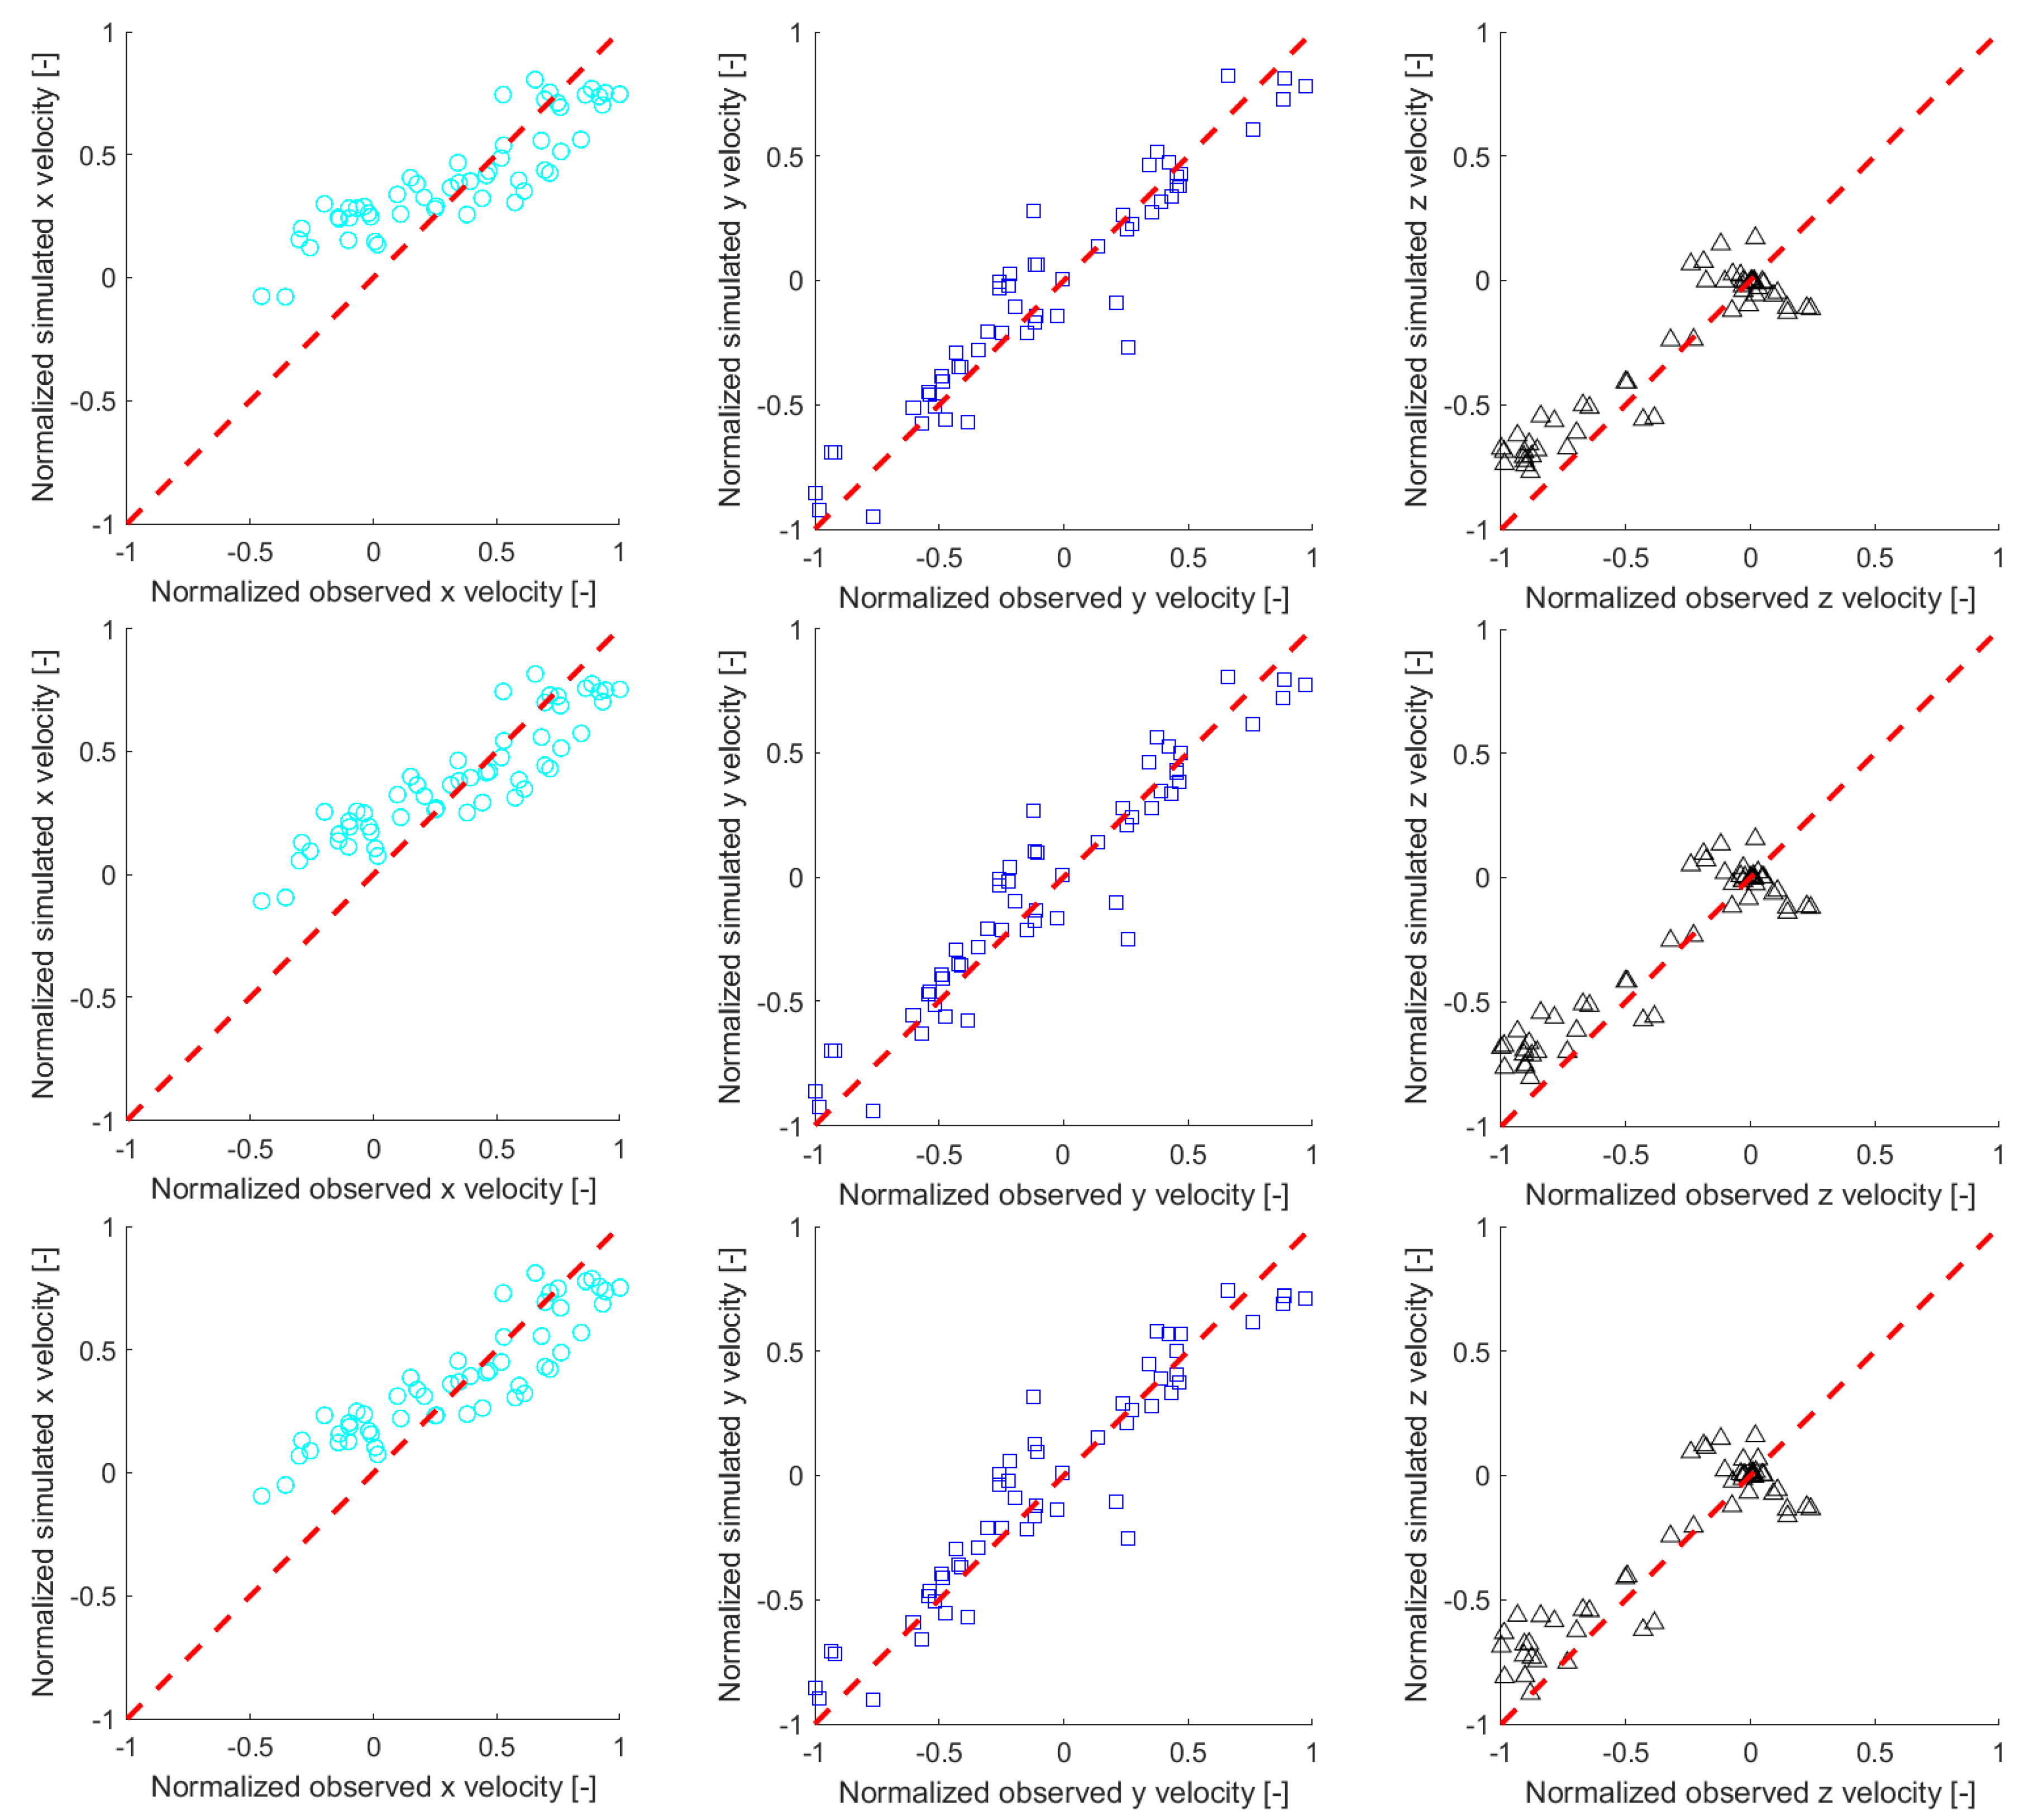
We chose the head loss along the flow section from the headwater area on the orographic left side to after the trash rack as the parameter for determining the grid dependency, as this value was also recorded at the prototype SHPP for different discharges. Further, the simulated head loss is also used to determine which porosity configuration, i.e., the simulation with which drag coefficient B, can approximate the measured head loss the closest. Within the simulation results, we then extracted velocities in x, y, and z directions along the prototype's measurement grid points (
Figure 3), averaging the values within a 5 cm radius of each point. Additionally, we averaged the simulated velocities over time (60 s), similar to the ADV measurements at the physical prototype, to enable a better direct comparison between the measured and simulated velocities.
We compared the simulated and measured velocities both qualitatively and quantitatively. We assessed velocity deviations using statistical methods such as standard deviation and mean absolute error (MAE) for the quantitative analysis. These metrics provided insights into the absolute deviations between the two velocity datasets. We also used statistical evaluation metrics that normalize the datasets, including R-squared (R²) and Nash-Sutcliffe-Efficiency (NSE) to further contextualize the model results.
To enhance comparability, we normalized the x, y, and z velocities of both observed and simulated data against the respective maximum measured velocities. Scatter plots and 2D velocity plots were used to visually highlight the discrepancies between the simulated and observed velocities above the trash rack.
2.2.2. Simulation Set M02–SHPP with One-Sided Approach Flow
The second set of simulations (
M02) within this study focused on reproducing the flow conditions at the SHPP prototype facility that were observed during the experimental setup
E02 with a one-sided, channel-type approach flow. Our specific objective with this set was to prove that the calibrated model of the initial set
M01 can also be used for a strongly modified upstream approach flow condition by only changing the relevant geometry – in this case, adding the two lateral channel walls – but leaving all other relevant settings (i.e., mesh resolution, hydraulic boundary conditions, porosity parameters) unchanged, therefore using the same simulation settings as in the simulation
M01-mesh02-por02 (
Table 1). Using these settings and the updated geometry with lateral walls for the simulations, we then qualitatively compared the resulting flow fields to the flow conditions recorded during experiment E02 at the prototype facility.
We simulated two cases with the following hydraulic boundary conditions per the physically tested settings during experiment
E02 as shown in
Table 2.
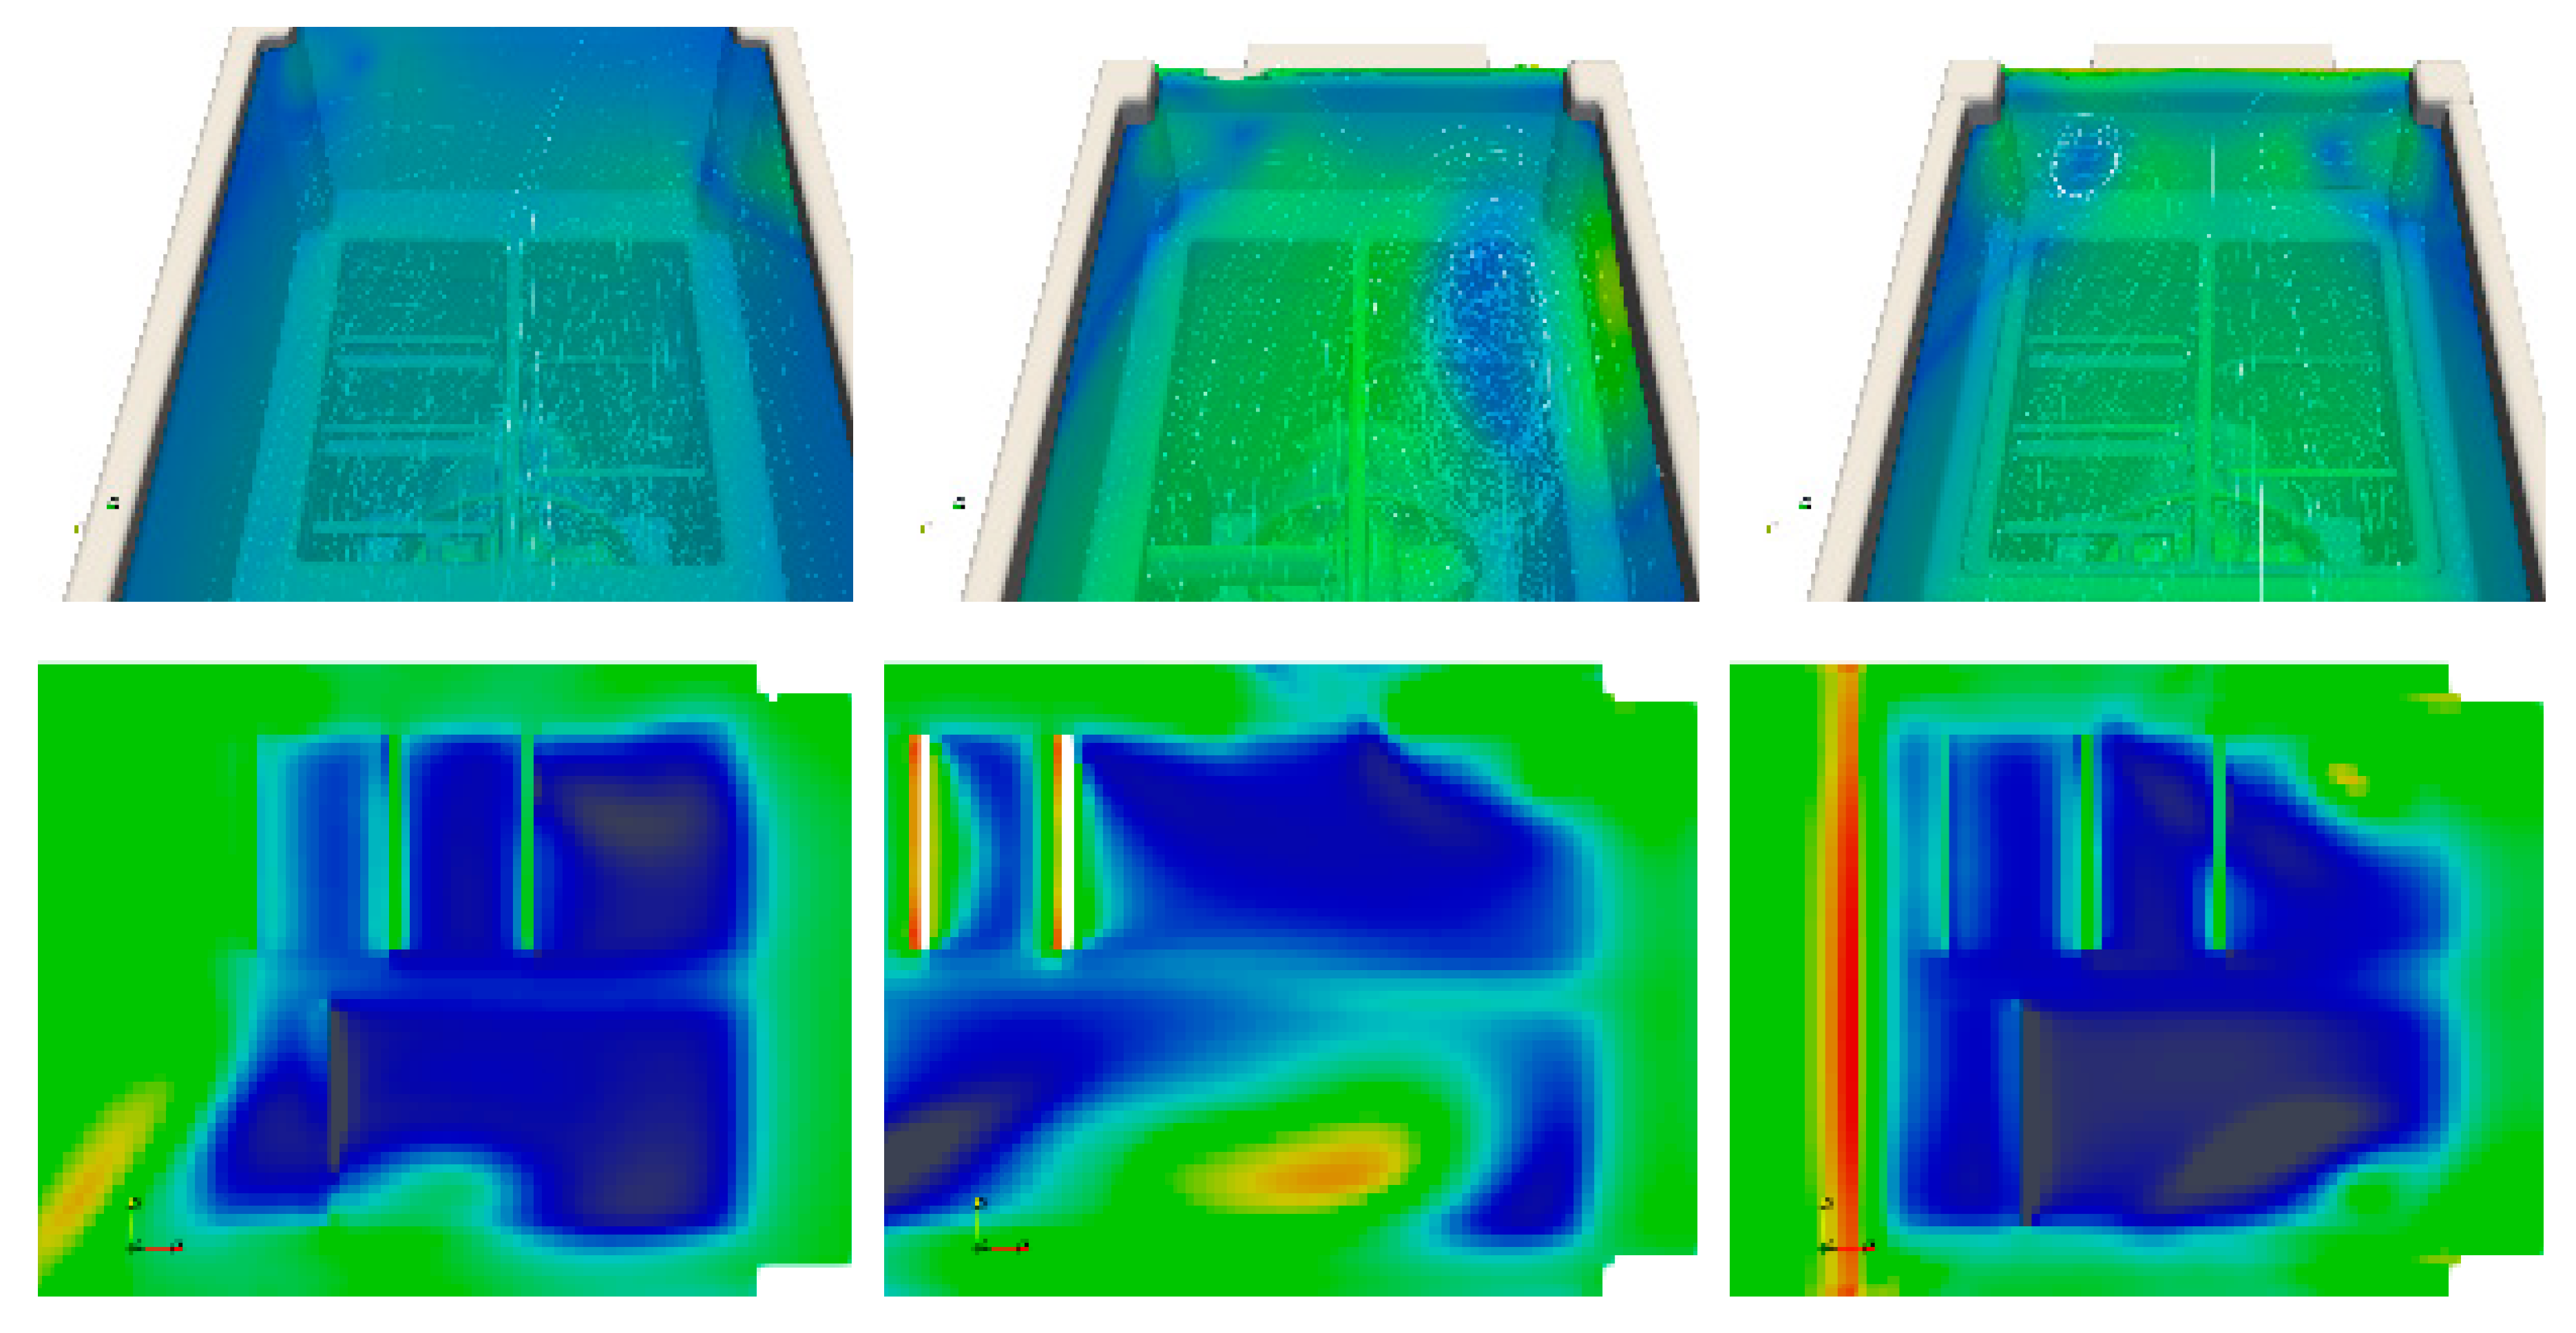
As the raw dataset containing the ADV measurements during E02 was unavailable for comparison with the simulation results, we only conducted a qualitative assessment based on the photos available in [
17] related to
E02. For this purpose, the flow field for the case with full turbine discharge (
M02-C02) was visualized from a similar position and angle to compare the simulated and photo-documented case.
2.2.3. Simulation Set M03–One-Sided Approach Flow and Modified Design Parameters
With the third set of simulations (
M03), we aimed to analyze alternative hydraulic designs for the case of a one-sided upstream approach flow previously not tested with physical experiments. The relevant settings (mesh resolution, porosity configuration, turbine discharge) within the numerical simulation setup remained unchanged compared to
M02-C02-mesh02-por02 (
Table 2). At the same time, three design parameters that are assumed to significantly influence the flow fields at the area of interest (i.e., at the shaft inlet) were individually increased by a factor of 1.5, targeting to reach optimized flow conditions. That means one parameter was increased while the other two remained unchanged in order to identify resulting effects individually, avoiding multiplier effects. The three chosen design parameters (DP) are:
DP01 = The length of the shaft intake (i.e., trash rack length). It is assumed that increasing the length and, therefore, the horizontal inlet area will lead to decreased z-velocities with more homogeneous, low-loss inflow conditions.
DP02 = The flow depth in the approach channel and above the shaft inlet. It is assumed that increasing the flow depth and, therefore, the cross-section of the channel will lead to reduced x-velocities and, therefore, more homogeneous, low-loss inflow conditions.
DP03 = The overflow height (and therefore discharge) over the front gate. It is assumed that increasing the permanent overflow height at the gate will lead to a decreased risk of vortex formation above the intake due to increased x-velocities in the surface near water layers towards the gate. This assumption is based on the findings during the experimental development of the initial three-sided approach flow variant, where the developers resumed that a permanent overflow over the spill gate contributes to a vortex-free inflow into the shaft [
5].
In the same way as the previous two sets, we conducted an initial simulation using a coarse mesh setup for each case. We then restarted the simulation, running it for 90 seconds with a more detailed mesh configuration (
mesh02). We evaluated the results based on the data captured at the final time step. The analyzed simulations in set
M03 are shown in
Table 3 with the modified
DPs below
M02-mesh02-por02 in the first row for comparison.
To classify the significance of the individual design modifications, we compared relevant resulting hydraulic parameters of the simulations within set M03 but for reference, also with those of the calibrated cases of M01 (three-sided approach flow) and M02 (one-sided approach flow. We chose the following parameters for the classification:
Head loss [m] – a lower value indicates optimized inflow conditions;
Average z-velocity above the trash rack vz-mean [m/s] – a lower value indicates optimized inflow conditions;
The share of the inlet area with z-velocities vz below a benchmark value [%] – a higher percentage indicates optimized inflow conditions;
Qualitative visual classification with focus on the tendency for vortex formation.
