1. Introduction
Efficiency is an important topic in the energy sector, and consideration of energy consumption was because of the global energy crisis in 1970 [
1]. Recently, there has been a new wave of energy crisis in the UK and Europe. This was triggered by the Russia’s invasion of Ukraine, as well as an increase in world population leading to the rapid increase in demand. In addition, the need to reduce greenhouse emissions, extreme weather conditions, etc., all of which have impacted the surge in demand for energy [
2], prompting many countries to embark on campaign to minimize energy [
3]. According to the World Energy Council, climate change has been one of the biggest challenges affecting all regions of the world. For instance, the European Climate Action listed the negative effects of this and aims to decrease greenhouse emissions and improve energy efficiency by reducing primary energy consumption. Leading the energy consumption according to [
4] are buildings, contributing most of the total energy consumptions and carbon emissions in the world. Similarly, energy demands are projected to increase by 55% from 2005 to 2030 with buildings accounting for 40% of the total energy consumed [
5]. Due to this huge challenge, more attention is being paid to smart buildings by providing comfortable, economical, and sustainable operations for occupants.
In recent years, emerging and disruptive technologies such as Artificial Intelligence (AI) and the Internet of Things (IoT) have been shaping the energy management future, building a world of smart and connected agents that needs minimal or no human intervention. These technologies are being integrated into building automation systems to create smart buildings [
6]. Smart buildings have been widely adopted by developed countries due to the popularity of intelligent technologies such as smart grid [
7], and its ability for sustainable and efficient energy management system (EEMS). EEMS is the main feature of a smart building for managing energy use, hence the need (as an integral part of the EEMS) for accurate consumption predictions to aid occupants in managing, planning, and minimizing energy waste and cost [
8].
Due to the current global increase in energy prices, smart buildings have become paramount because of their inbuilt sensors to help monitor the occupants’ behaviors and regulate their energy consumption. Currently, UK policy advises installing sustainable technologies in houses. Hence, prediction of smart building energy consumption is important in improving consumption. However, the main challenge in smart building energy management systems is low prediction accuracy [
9].
Energy consumption prediction in smart buildings is essential and it represents an important piece of information for efficient set points of critical loads (such as Heating, Ventilation and Air Conditioning (HVACs) and scheduling of energy-producing assets. Studies have shown that predicting the consumption of each appliance will improve the attitude of the occupants towards energy saving [
10]. The ability to forecast energy consumption can aid occupants in adjusting the operation of buildings thus, leading to improved energy efficiency management, sustainable development, reducing energy cost, environmental influence and reducing expenses on energy [
11]. Energy from the power plant is instantly consumed as it is generated, hence, predicting accurate energy consumption in advance is important for the stability of the power supply.
Energy management at home has received a lot of attention in recent times because the final consumers basically must drastically reduce the overall electricity consumed as the cost-of-living continues to skyrocket. Therefore, more technology-based approaches are being applied to automate energy management. Several intelligent approaches, such as mathematical models and classical machine learning models, for energy consumption prediction have been explored in the past by researchers. However, approaches based on deep neural networks are considered more accurate and robust than other previously used methods [
12,
13,
14].
This article makes the following contributions to the state of the art.
•Providing a comprehensive review of existing energy prediction approaches in smart buildings
•The study investigates the use of a hybrid Convolutional Neural Network, CNN-Gated Recurrent Unit, Long Short-Term Memory, and CNN-Bidirectional LSTM in predicting smart buildings’ energy consumption.
• Extensive performance comparisons of the proposed models with other state-of-the-art deep learning models.
2. Related Works
Predicting energy usage has become an important topic and a notable low-cost approach to energy efficiency which has progressed quickly [
15]. Over the last decade, the increasing energy demand has prompted researchers to find the best approaches to reducing energy consumption, making energy decisions, and improving energy utilization.
Several methods have been implemented for the prediction of energy consumption, this includes time series [
16], ARIMA [
17], regression models [
18], support vector machine and support vector regressor [
19], and deep neural network [
20]. These prediction models are categorized into four major groups namely: statistical models, machine learning models, deep learning models, and hybrid models. The study in [
21] implemented a clustering method to analyze a building’s electricity consumption daily, although an autoencoder algorithm was used, it failed to detect outliers, especially in the large dataset where outliers are present. Another study in [
22] utilized a multiple regression model to predict energy demand of heating systems. An accuracy of 0.9744 root square was recorded by the model and found 90 percent of the computed value have errors below 20%. From the study, it is learned that the regression model is best for quality and speed when used with a smaller number of variables.
In [
23] a study was performed to analyze and predict the energy consumed in smart buildings in Malaysia. In that study, the hourly consumption data were collected from commercial smart buildings and K–Nearest Neighbour (KNN) method was used for energy consumption prediction. The result depicts high accuracy with k =5. However, new research presented in [
24] argues that the proposed method in [
23] used only KNN to predict energy consumption, and since no other model was compared against, it was difficult to ascertain if KNN was the best method. Thus, researchers in [
24] added ANN and SVM to compare against KNN. The study demonstrates that despite ANN and SVN being more complex than KNN, SVN still showed the most promising result in analyzing and predicting consumption.
Another study in [
25] introduced a forecasting method that implements a 2-stage procedure. The first stage performance has a MAPE of 5.21 percent which was considered average. However, SVM appeared unsuitable for large data because as the dataset increased the training time also increased linearly. In [
26], researchers wanted to prove that SVR can aid energy-saving decision-making when applied to energy consumption prediction. The result of the SVR study confirmed their hypothesis that SVR can produce good accuracy with r2 more than 0.99 and MSE less than 0.001, hence making it ideal for predicting building energy consumption, especially where there is the unavailability of data or missing data.
Comparatively, experimental results from previous machine learning studies show that every method performed better or worse depending on factors such as the size of dataset, data pre-processing, duration of training etc. Therefore, several authors decided to use more advanced deep learning technologies to make the prediction. For instance, [
11] used a multilayer perceptron to forecast heating and cooling loads in a residential building, in which the model was trained on the parameter data. The authors reported a high coefficient of 0.993. Researchers in [
27] used a residual neural network to forecast electrical energy consumption which provides a day-ahead estimation in a residential building, the forecast was tested individually on several residential buildings, and the model obtained an accurate result with an error rate of 8% which was better than the base model. The significant increase in performance of the energy model was due to the use of hybrid machine learning.
Apart from the use of conventional machine learning algorithms for energy consumption prediction, recent developments and successes in the use of deep learning for solving complex forecasting problems based on time series data has gained focus by researchers [
45]. For example, the study in [
28] made use of various deep learning methods (Gated Recurrent Unit (GRU), LSTM, and RNN) to predict the energy consumption of three smart buildings. The result proved that hyperparameter tuning improved the prediction accuracy of energy consumption in all three buildings. The study presented in [
29] developed a hybrid CNN-GRU model to predict energy consumption in a residential building, the model performed well when compared to other base models. However, GRU had a shortcoming, it was not as versatile as LSTM.
Over the past decade, Convolutional Neural Network (CNN) has achieved ground-breaking results for performing excellently well in solving computer vision problems. This has prompted both developers and researchers to solve more complex tasks that the classic artificial neural network (ANN) could not solve [
30].
A novel Multi-Channel and Multi-Scale Convolutional Neural Network - Long Short-Term Memory (MCSCNN-LSTM) was presented by [
19] to predict energy consumption using only historical data. The proposed hybrid model is compared against other deep learning models. The authors confirmed that the hybrid model has superior performance when predicting irregular trends and patterns of energy consumption.
Overall, there have been several efforts to predict energy consumption in smart buildings. Several popular techniques including KNN, support vector machine (SVN), ANN, convolution neural network (CNN), and long-term short memory (LSTM) had been successfully applied in the prediction of energy consumption with moderate performance, poor data processing, little or no parameter tuning, and the dataset size was also found to be the major contributors to the poor result of the model. Although Bi-directional LSTM had the best performance in accuracy when implemented in smart buildings, in this article, we combined CNN-LSTM to produce a better energy prediction in the buildings because of the ability of CNN to exploit spatial correlation and automatic extraction of discriminating features from input data. However, the structure of the CNN does not consider the temporal dependence between past and future data and that is where the LSTM comes in. The LSTM layers can capture and remember long term and short-term seasonality such as yearly and weekly patterns thus eradicating vanishing gradient problems leading to faster and accurate modelling.
3. Methodology
3.1. Proposed Hybrid Framework for Energy Consumption Predictions in Smart Buildings
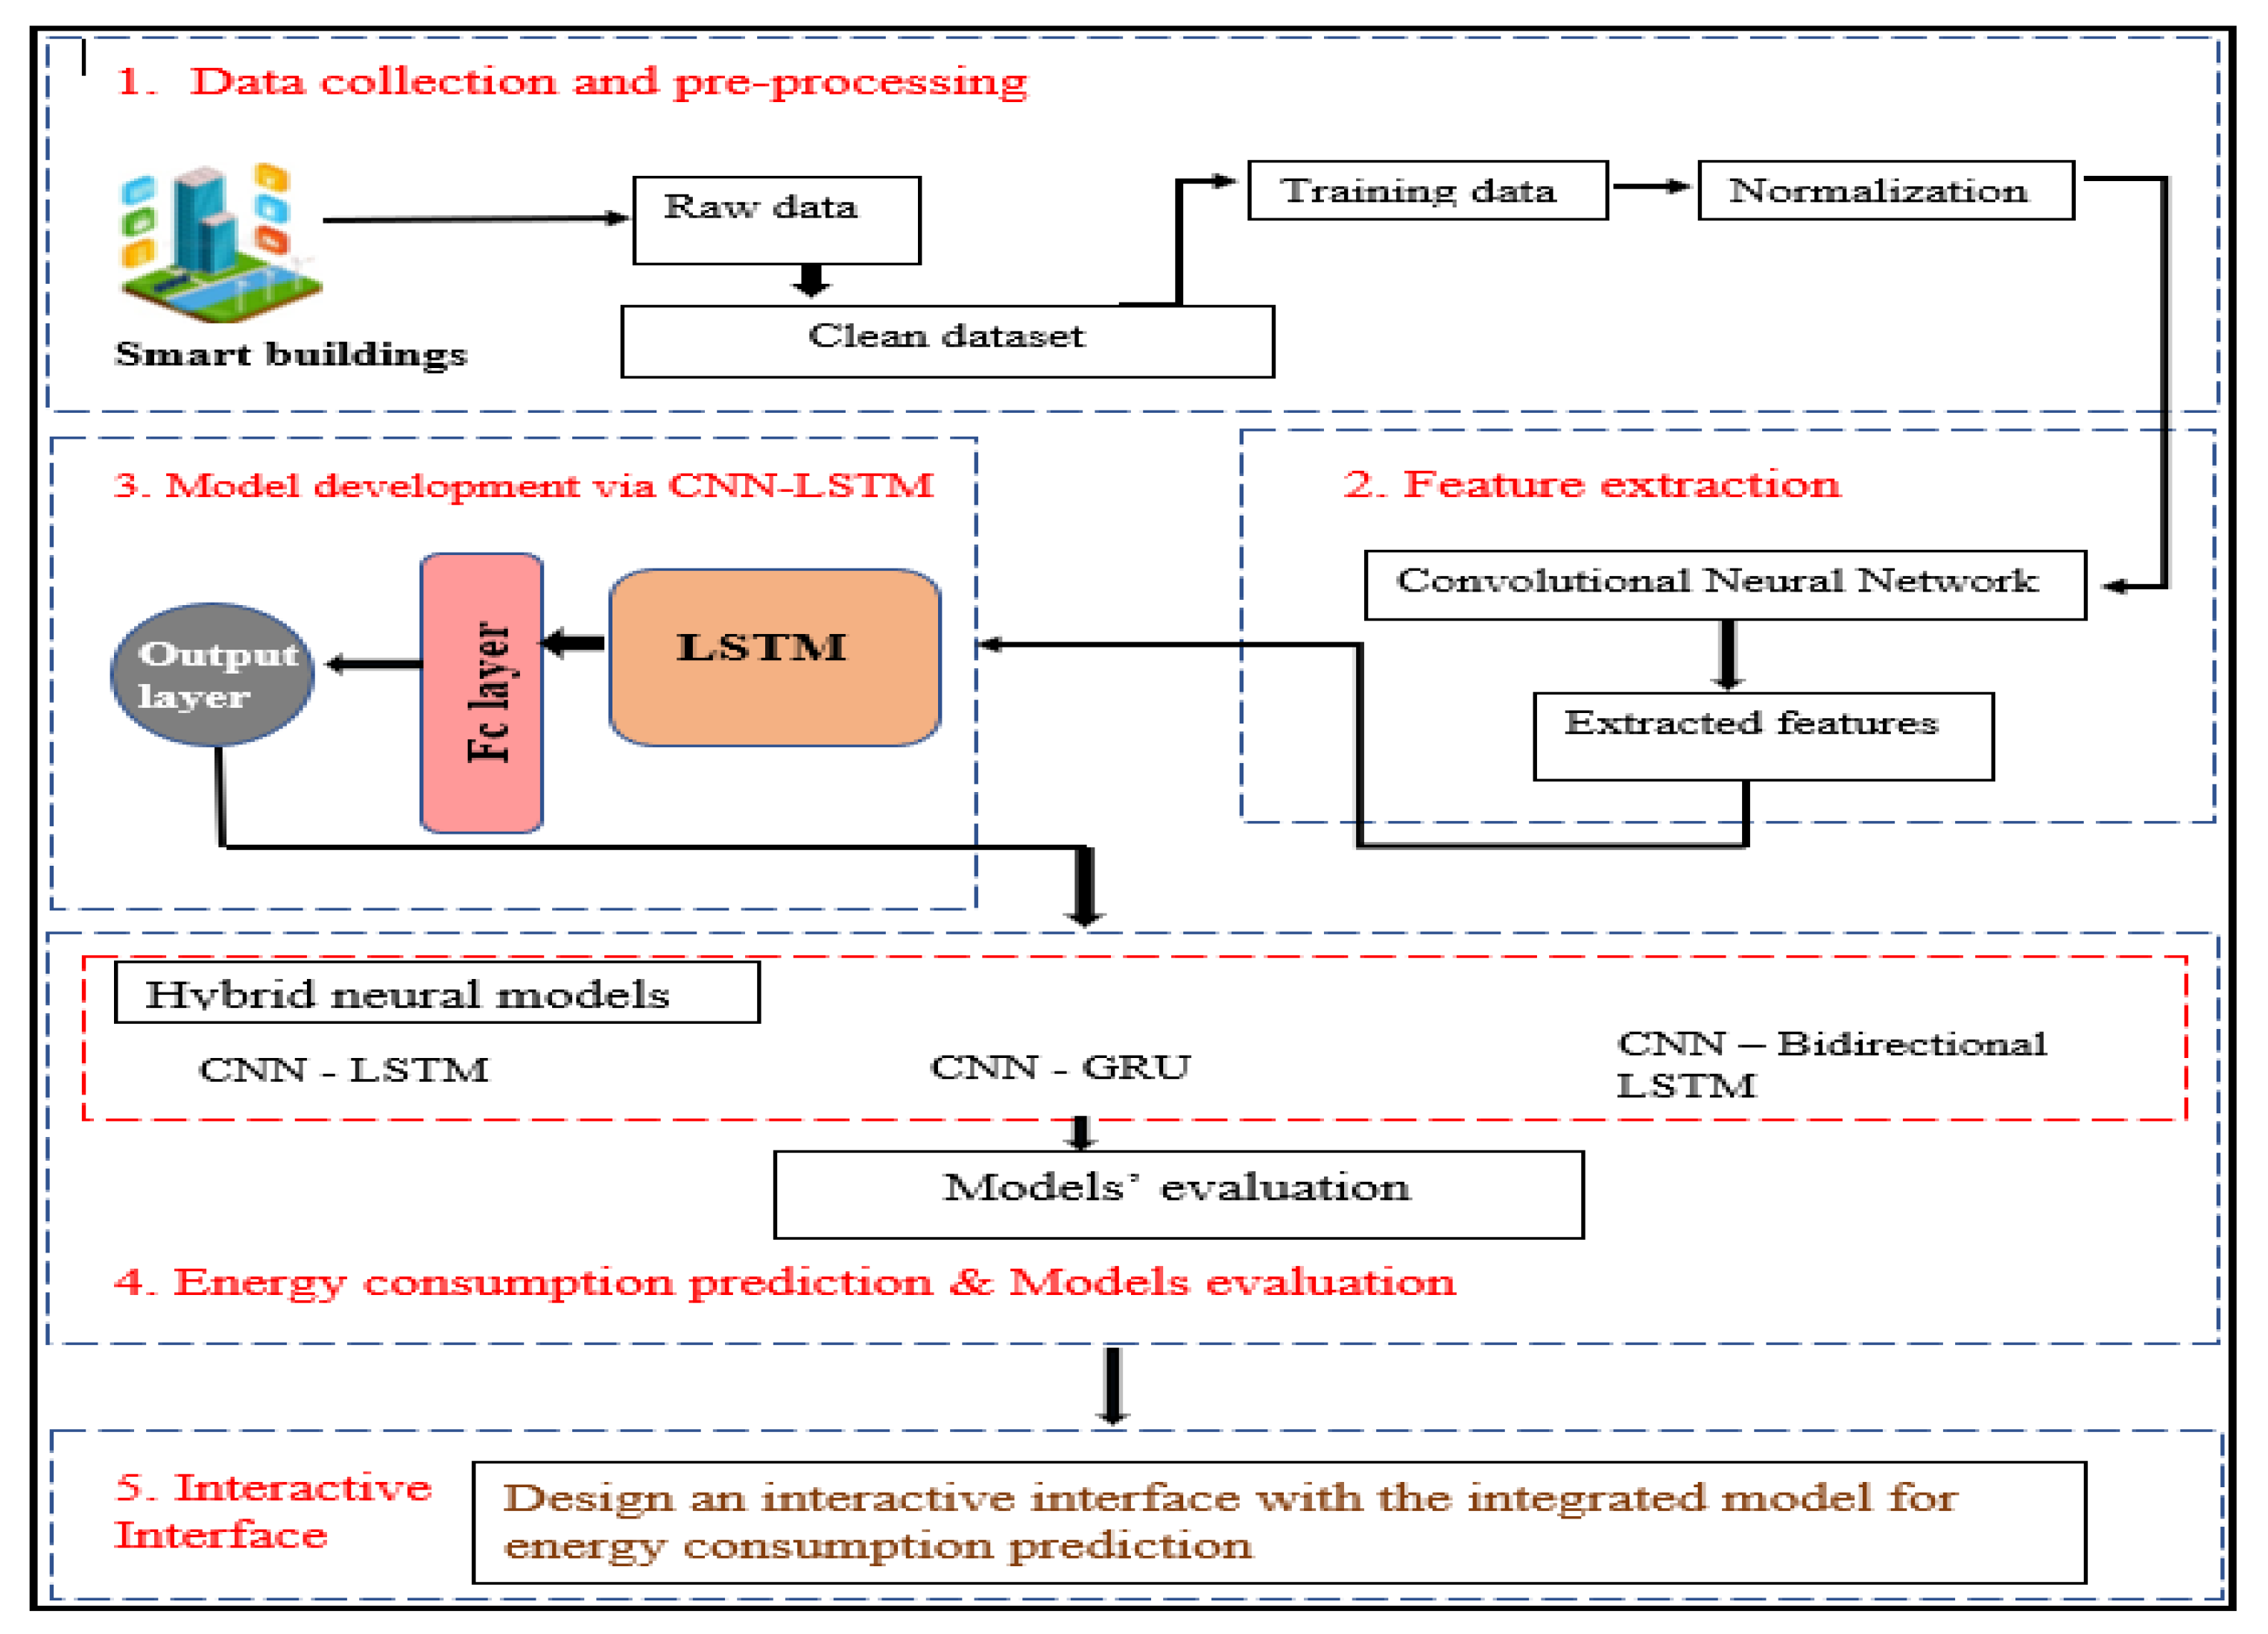
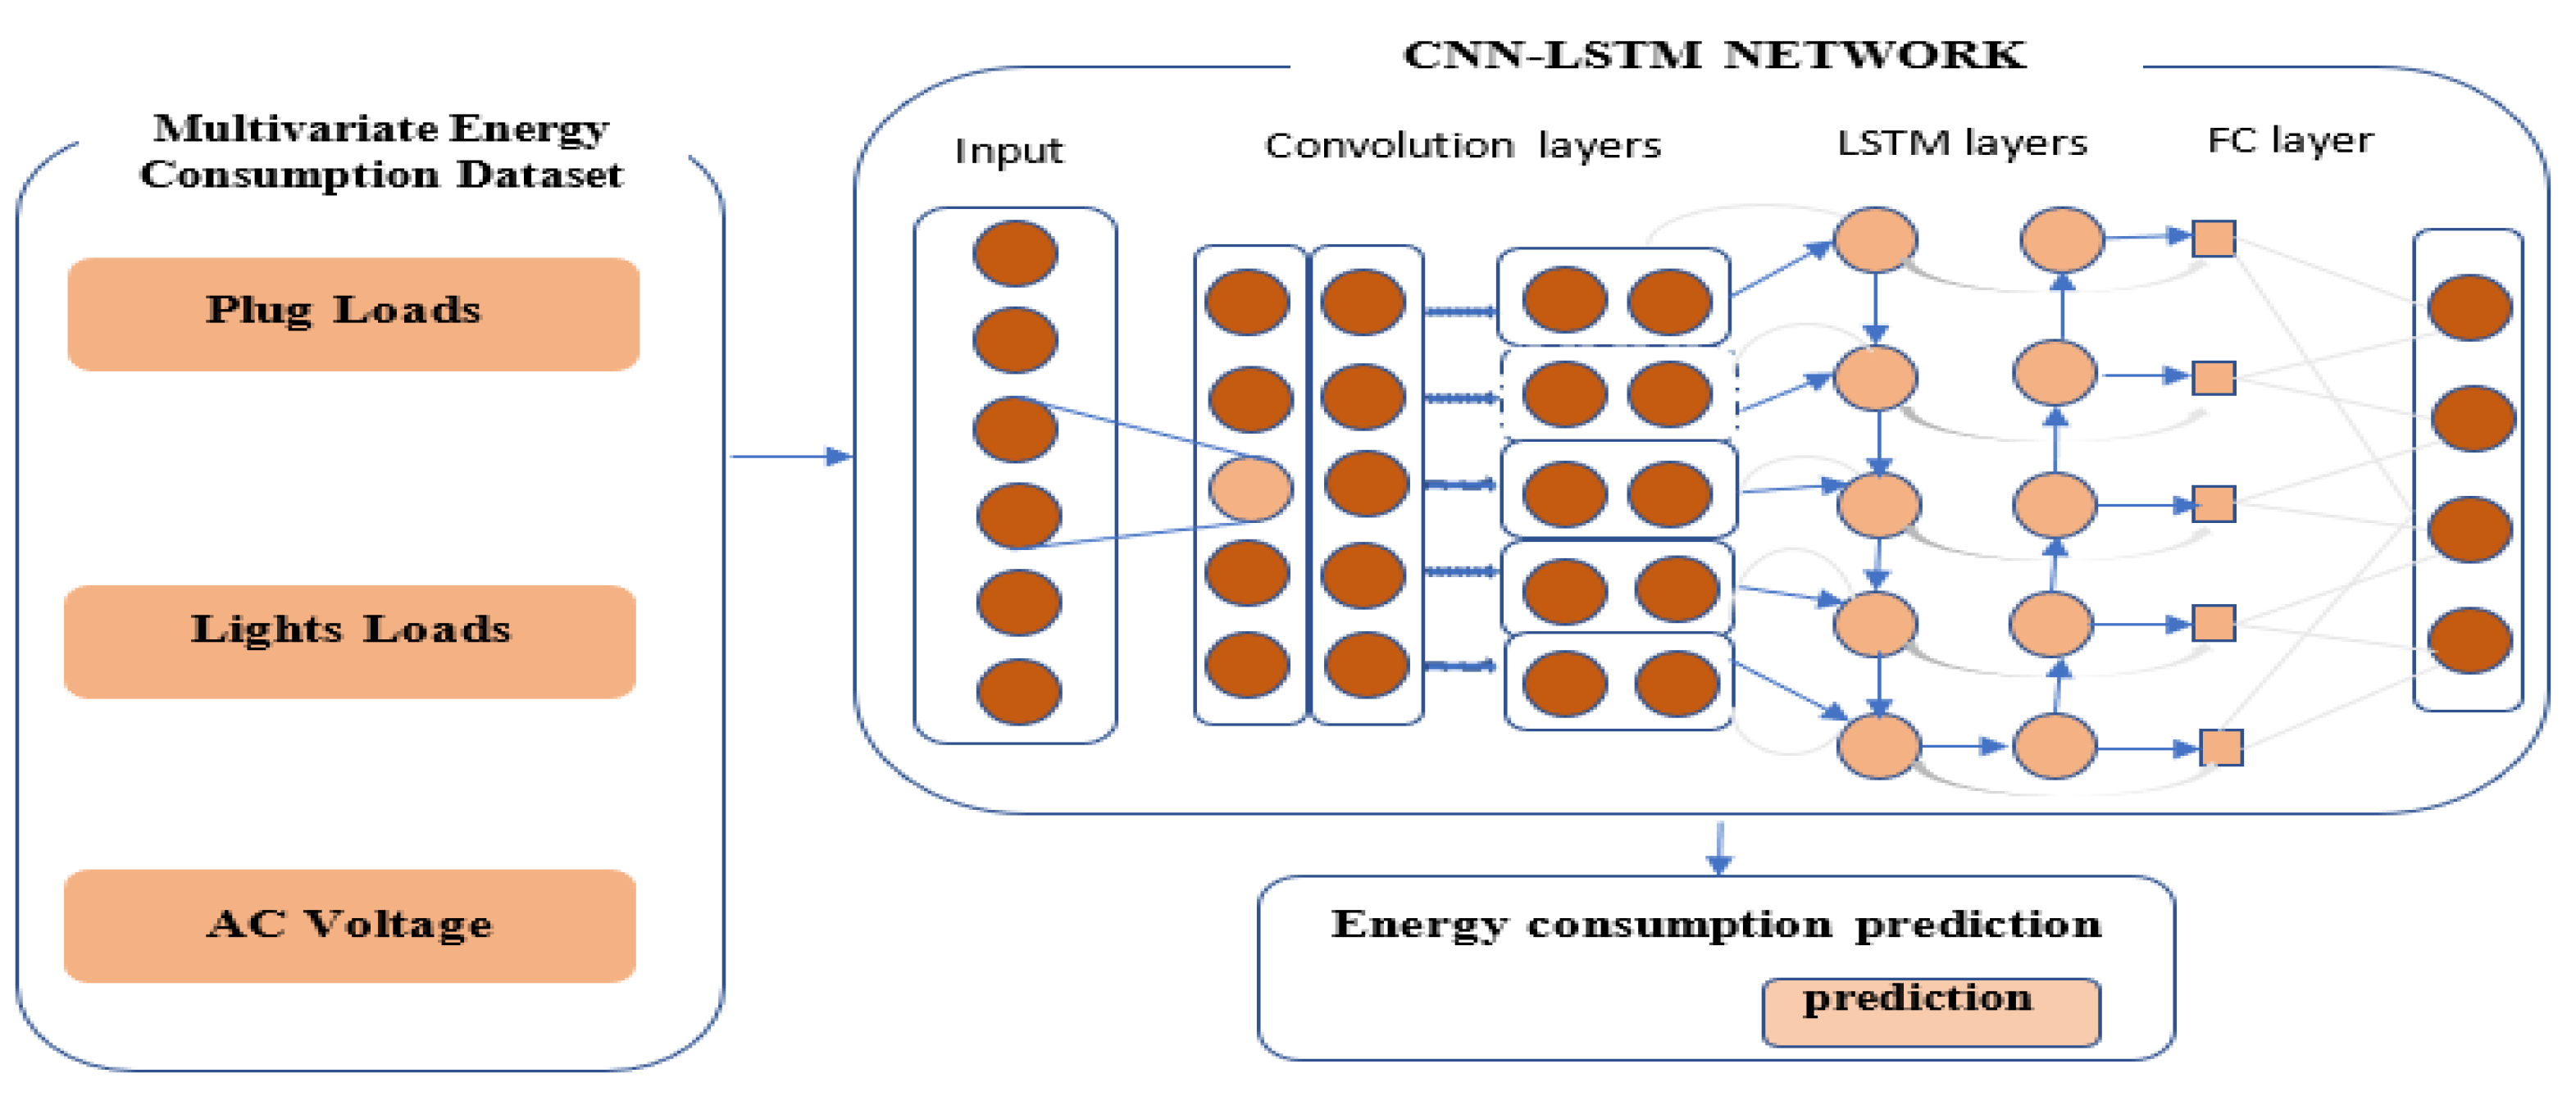
Figure 1 below illustrates the proposed hybrid method for energy consumption prediction. The study uses a real energy consumption dataset from a smart building. Spatial factors associated with the time series variables which are multivariate are extracted from the CNN convolution layer and the pooling layers and fed into LSTM layer with outliers removed. The LSTM layer uses transmitted spatial characteristics to model irregularly in the time series data such as irregular time patterns, trends, and seasonality. Lastly, the CNN-LSTM model in a fully connected state can produce predicted energy consumption. The predicted values of the energy consumption are then analyzed and evaluated by relevant performance metrics [
40].
3.2. Theoretical Overview of the Proposed Solution
In this section, the theoretical underpinnings of our methods as illustrated in
Figure 10 are presented and then discussed.
3.2.1. Convolutional Neural Network Building Blocks (layers)
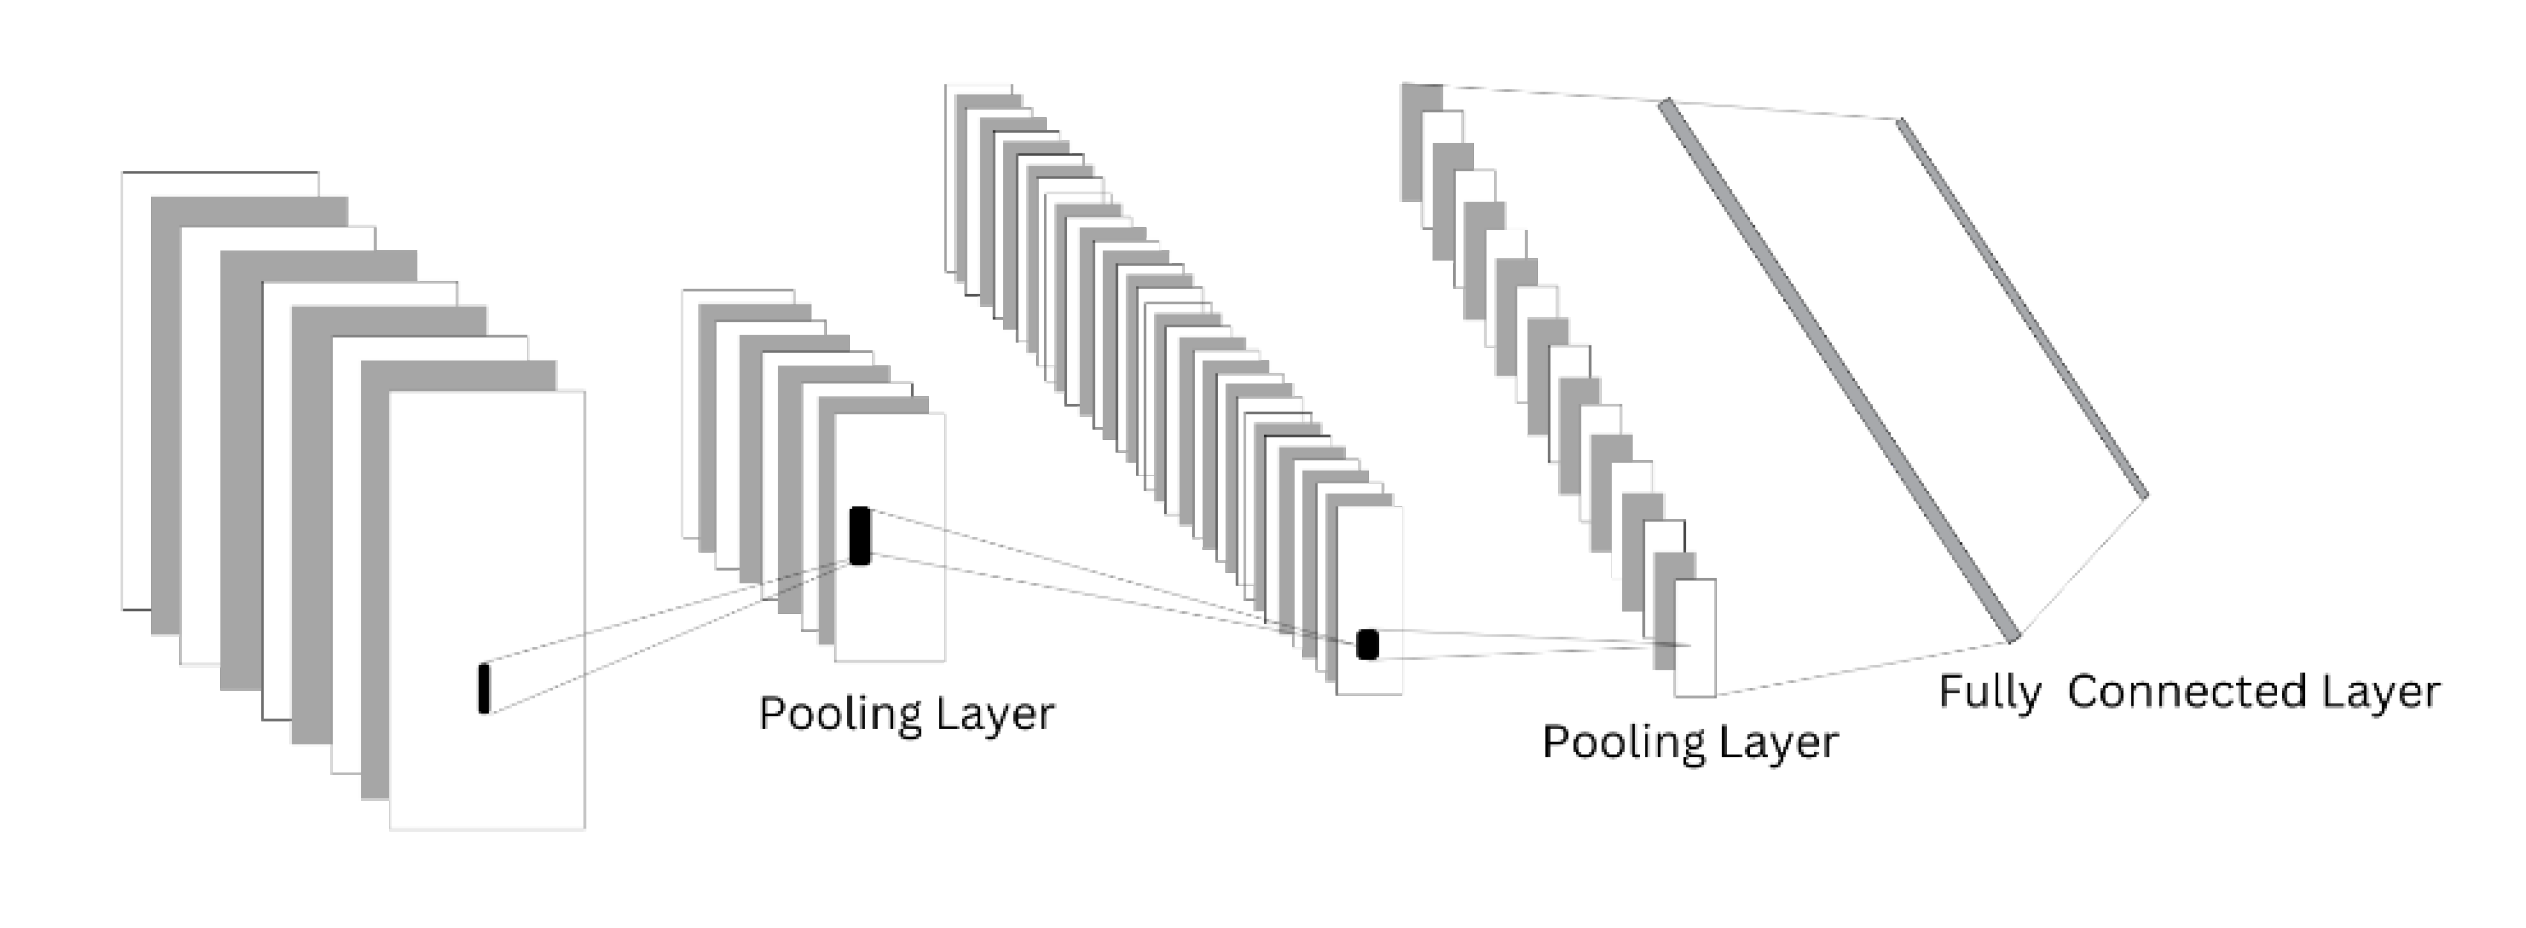
A convolutional neural network consists of multiple layers of architecture known as building blocks. CNN can transform and process time-series data using three layers namely, the convolutional layer, pooling layer, and fully connected layer [
31].
-
a.
The Convolutional Layer
This layer in the CNN architecture is the most important component that performs two types of operations such as convolution operation and non-linear operation. Convolution operation consists of the time series data and the kernel. while nonlinear operation is an activation function that is usually applied to the convolution operation’s final output. The kernel is also called a filter, it performs convolution on time series data. A kernel is like a grid of discrete numbers, each number in the grid is called the weight of the kernel. During the CNN model training process, numbers are randomly assigned to each weight of the kernel. Then, for each training period (epoch), the weights assigned to the kernel are tuned, making the kernel learn to identify and extract important features [
32].
-
b.
The pooling Layer
The pooling layer is important in a convolutional neural network, it is also called the down-sampling layer, it aids the prevention of a model getting overfitted and helps maintain invariance in a model. Pooling layers aid in reducing the size of the model layer while decreasing the neurons in networks and extracting important features. In the pooling layer, there are different pooling techniques like max polling, min pooling, gated pooling, average pooling, tree pooling, etc. Average pooling and max pooling are the most used techniques in the pooling layer. Max-pooling shows the maximum output from all units while average-pooling reports average output from all windows. Max-pooling down-samples the weights assigned to the kernel in the convolutional layer, therefore, reducing the possibility of overfitting and computational cost [
33].
-
c.
Fully Connected Layer
FC layer is the last layer of CNN architecture. In this layer, there is full connectivity of neurons in the first and last layers. This layer helps outline the representation between the input and output.
3.2.2 Long Short-Term-Memory Approach
LSTM is a type of Recurrent Neural Network that learns the hidden relationships and patterns between data points in sequence and has contributed to widely to deep learning success stories [
43]. It is built to handle long-term memory tasks, like speech recognition [
34], music generation [
35], and energy consumption prediction and forecasting [
36]. Also, long short-term memory is rained with historical time series data to make predictions of the future energy consumption of a building.
About a decade ago, long short-term memory models gained immense interest in building energy consumption prediction and forecasting domain, it has been used more frequently with other deep learning models like GRU, RNN, CNN, and DNN, this is because of the tremendous success is its capability to solve time series tasks, memorize information for a longer time in the network, and its ability to reduce exploding and vanishing problems associated with gradients present in traditional recurrent neural network units and [
37].
3.2.3. Long Short-Term Memory Block
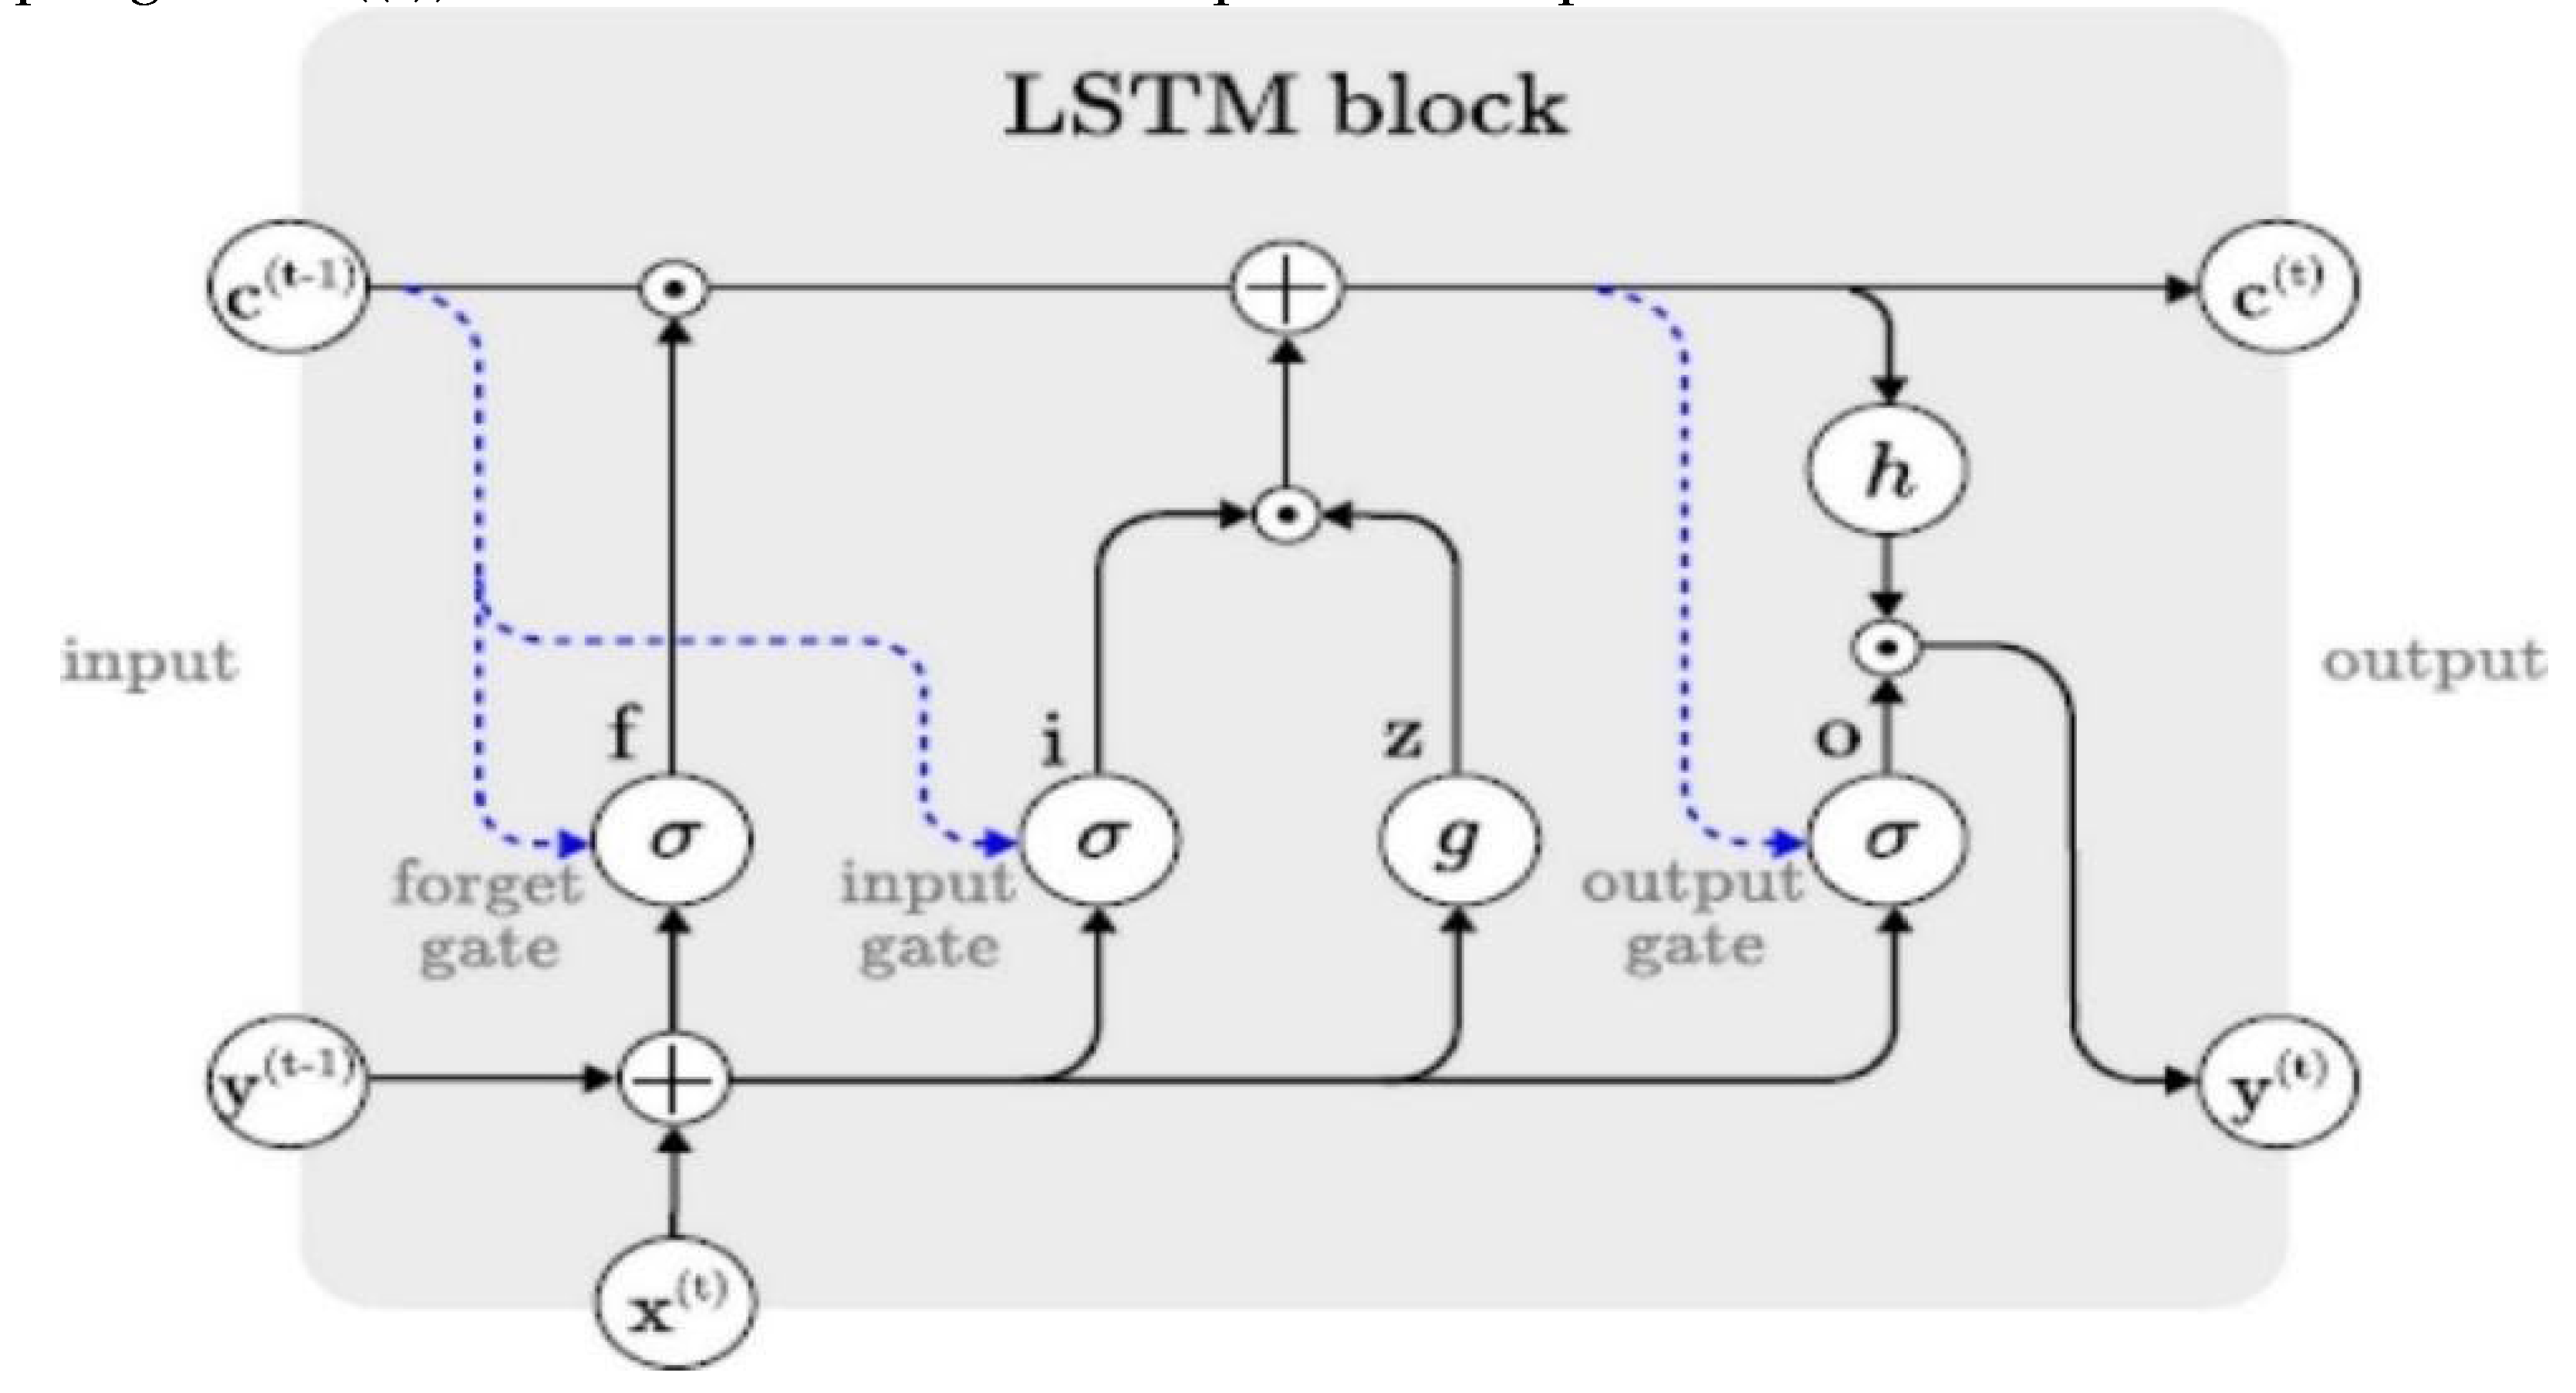
LSTM building block comprises memory cells that are self-connected. Also, these cells can remember the significant state in the past. Furthermore, three gates in the LSTM block permit the LSTM memory cell to store information over a long time [
38]. The gates are forget, input and output gates. The input gate decides on the needed information to be included and updated in the current timestamp for future prediction. Forget gate decides to what extent information should be remembered or forgotten from previous time stamps. While the output gate determines future predicted values. The operation of three gates can mathematically be expressed as follows respectively in equations (1-6) [
33].
where Equations (1)–(3) describe the forget, input and output gates. Equations (4)–(5) uses the input and the output gates of the candidate cells to compute the values for the new cell. Equation (6) uses the output gate. o^((t)) and new cell value to compute the output of the new cell.
Figure 3.
Schematic diagram of LSTM memory block [
44].
Figure 3.
Schematic diagram of LSTM memory block [
44].
3.3. The Proposed Hybrid CNN-LSTM Method
Figure 4 below shows the high-level architecture of CNN-LSTM method for energy consumption prediction in smart buildings. This study uses a real energy consumption dataset from a smart building. Spatial factors associated with the time series variables which are multivariate are extracted from the CNN convolution layer and the pooling layers and fed into LSTM layer with outliers removed. The LSTM layer uses transmitted spatial characteristics to model irregularly in the time series data such as irregular time patterns, trends, and seasonality. Lastly, the CNN-LSTM model in a fully connected state can produce predicted energy consumption. The predicted values of the energy consumption are then analyzed and evaluated by several error metrics [
39].
Predicting energy consumption using the CNN-LSTM methods requires a series of connections between CNN and LSTM. The model can keep irregular time information and extract complicated features from the building’s sensor variables collected to predict energy consumption. First, CNN-LSTM upper layer is made up of CNN. This CNN layer receives features that can affect energy consumption such as smart appliances, and voltage as well as building characteristics like the behavior of occupants, household occupancy, and data time. The CNN layer is made up of an input layer, a hidden layer, and the output layer, features, and variables from the sensor are received by the input layer, the output layer fed in the import features from input layer to LSTM, while the hidden layer is the heart of the network where the information processing mechanism happens, it usually consists of other hidden layers such as convolution layer, ReLU layer also known as the activation function. In the convolution layer, the convolution operation is applied to the incoming sequence of time series order, then the result is passed into the next layer. Visual stimulation of individual neurons is emulated by the convolution operation. The individual neuron in the convolution layer then processes only the multivariate data for the receiving field thus reducing parameters and making the proposed network deeper.
LSTM is the lower layer of the CNN-LSTM model that memorizes time information regarding significant features from the energy consumption sensor extracted from the CNN. LSTM can remember long-term information by updating the hidden state which makes it easy to understand the temporal relationship. The obtained output value from the CNN layer is passed into the LSTM gate units. LSTM is best for predicting energy consumption because it solves vanishing and explosive gradients associated with RNN. The LSTM is made up of memory cells that update their current state using each gate unit activation function. The activation function is a continuous value from 0 to 1 and it is controlled to fit into the value.
where h
t is the LSTM cell hidden state which is updated in every step t. the Equations (10)–(12) above show the individual gate units (input, output, and forget gate) operation that constitutes the LSTM, notation
i, f, and
o represent the output of the individual gate.
From the above Equations (7)–(11), the notation
c and
h are the hidden states. Also, the cell states that are determined through the gate units, the activation function such as Tanh is represented with the o notation, the activation function non-linear making it possible to squash the input into the -1,1 range. Bias vector is the b notation while w represents each gate unit weight matrix. The notation Pt stores complex features as output and the output is used in the LSTM memory cell as input. CNN-LSTM network that uses LSTM cells is superior in predicting energy consumption because it can model time information signals and provide cutting-edge results [
40].
The fully connected layer which is the last layer of CNN-LSTM architecture is a type of feed-forward ANN, it consists of neurons connected with each neuron from the pooling layer to generate energy consumption over a certain time. The fully connected layers receive input from the pooling or convolutional layer, these inputs are usually in the form of metrics like feature maps, and these metrics are fed into the LSTM to produce a final output. The output value from LSTM is flattened to produce a vector feature and this vector is passed as input into the fully connected layers. [
40].
4. Experiments and Results
In this section, we present the evaluation experiments of the proposed solution. A total of 12 models including deep learning models such as LSTM, CNN, GRU, and hybrid models including CNN-LSTM, CNN-GRU, and CNN-Bidirectional LSTM were built and evaluated for their ability to accurately predict energy consumption in smart buildings. The experiments were conducted on minutely, hourly, and daily time intervals, and the model performance was measured using the root mean square error (RMSE), mean absolute error (MAE), and mean squared error (MSE) metrics.
The proposed CNN-LSTM model was compared to other models in terms of its ability to make short-term, medium-term, and long-term predictions. The dataset was aggregated from minutely timestamps to hourly and daily timestamps to evaluate the model performance at different time intervals. A sliding window algorithm with a window size of 2 was utilized in the experiment, where the model was fed with two consecutive time steps as input and used to predict the next value.
4.1. Energy Consumption Dataset and Analysis
In this study, the energy consumption data of a seven-story office building in Thailand was adopted and used for the experiments [
46]. Several time series variables included in the dataset were used to predict the plug load energy consumption. This dataset is displayed as a one-minute time unit with real energy consumption data collected from the office building. A total of 790,558 datapoints from the year 2018 to 2019 specifically to only floor one of the office buildings was used for this experiment and a total of 49,456 missing data were recorded.
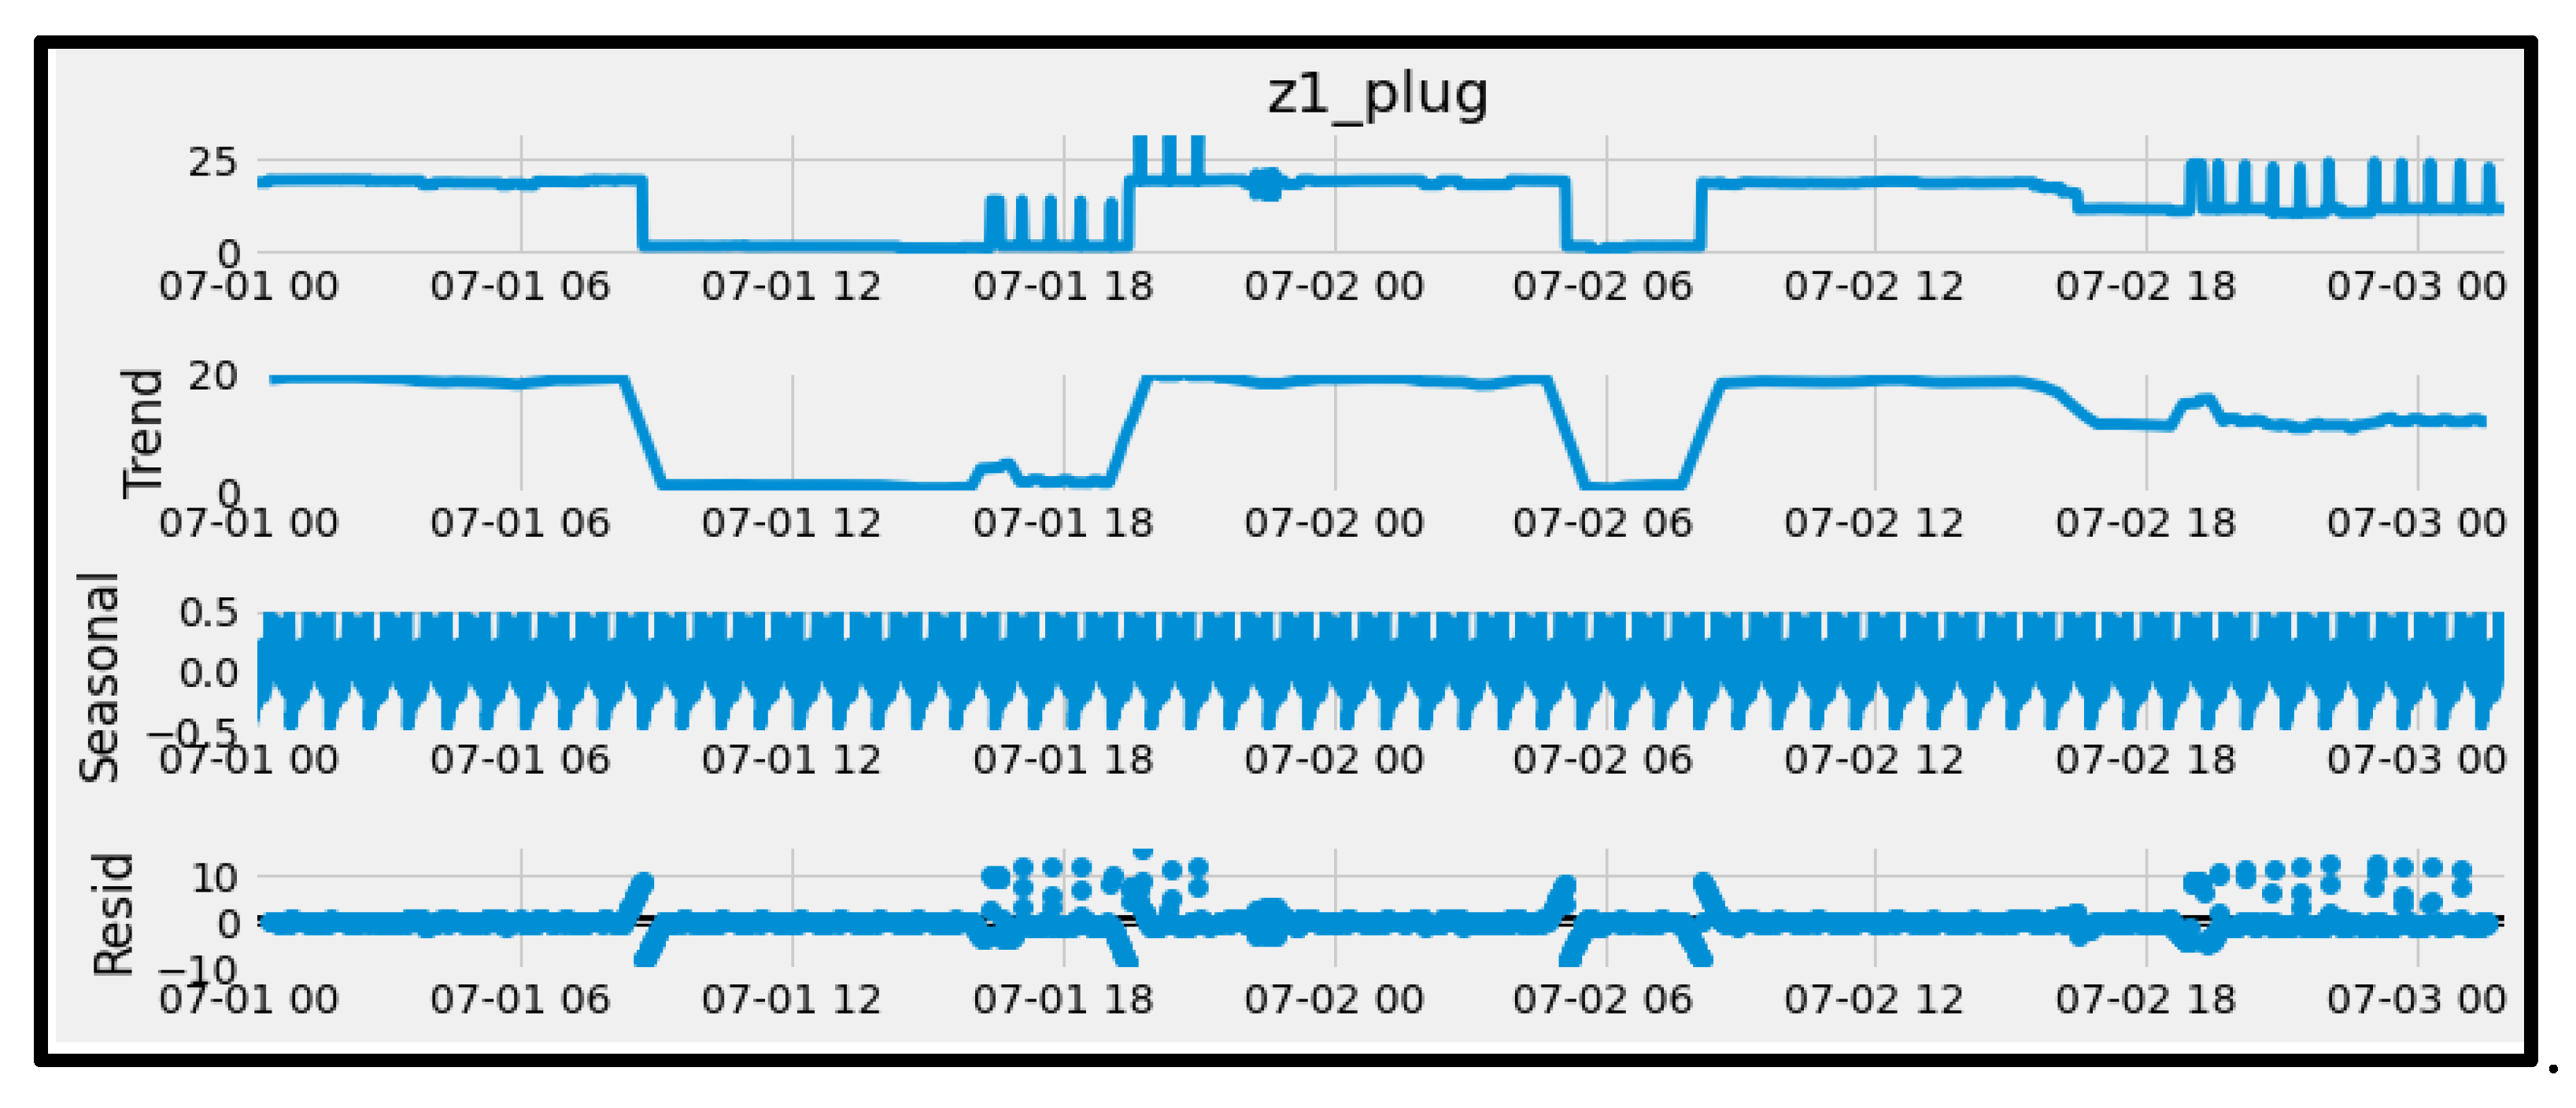
Table 1 below describes each variable contained in the dataset. In addition, the dataset was decomposed as shown in the table into these components to fully understand the data better. Seasonality is usually periodic up and down present in the dataset, trends are patterns in the data that span across the seasonal period while residual is the noise present in the data that cannot be explained.
Figure 6 shows the trends in seasonality and residual energy consumption for one of the plug loads represented as variable “z1_plug”.
Figure 5.
An Overview of the Energy Consumption Dataset. The electricity consumption dataset is of individual air conditioning units, lighting and plug loads in each of the 33 zones of the 33 zones of the building [
46].
Figure 5.
An Overview of the Energy Consumption Dataset. The electricity consumption dataset is of individual air conditioning units, lighting and plug loads in each of the 33 zones of the 33 zones of the building [
46].
Figure 6.
Insights from the time series dataset showing trends and seasonality of energy consumption for a single plug load.
Figure 6.
Insights from the time series dataset showing trends and seasonality of energy consumption for a single plug load.
4.1.1. Energy Consumption by Month
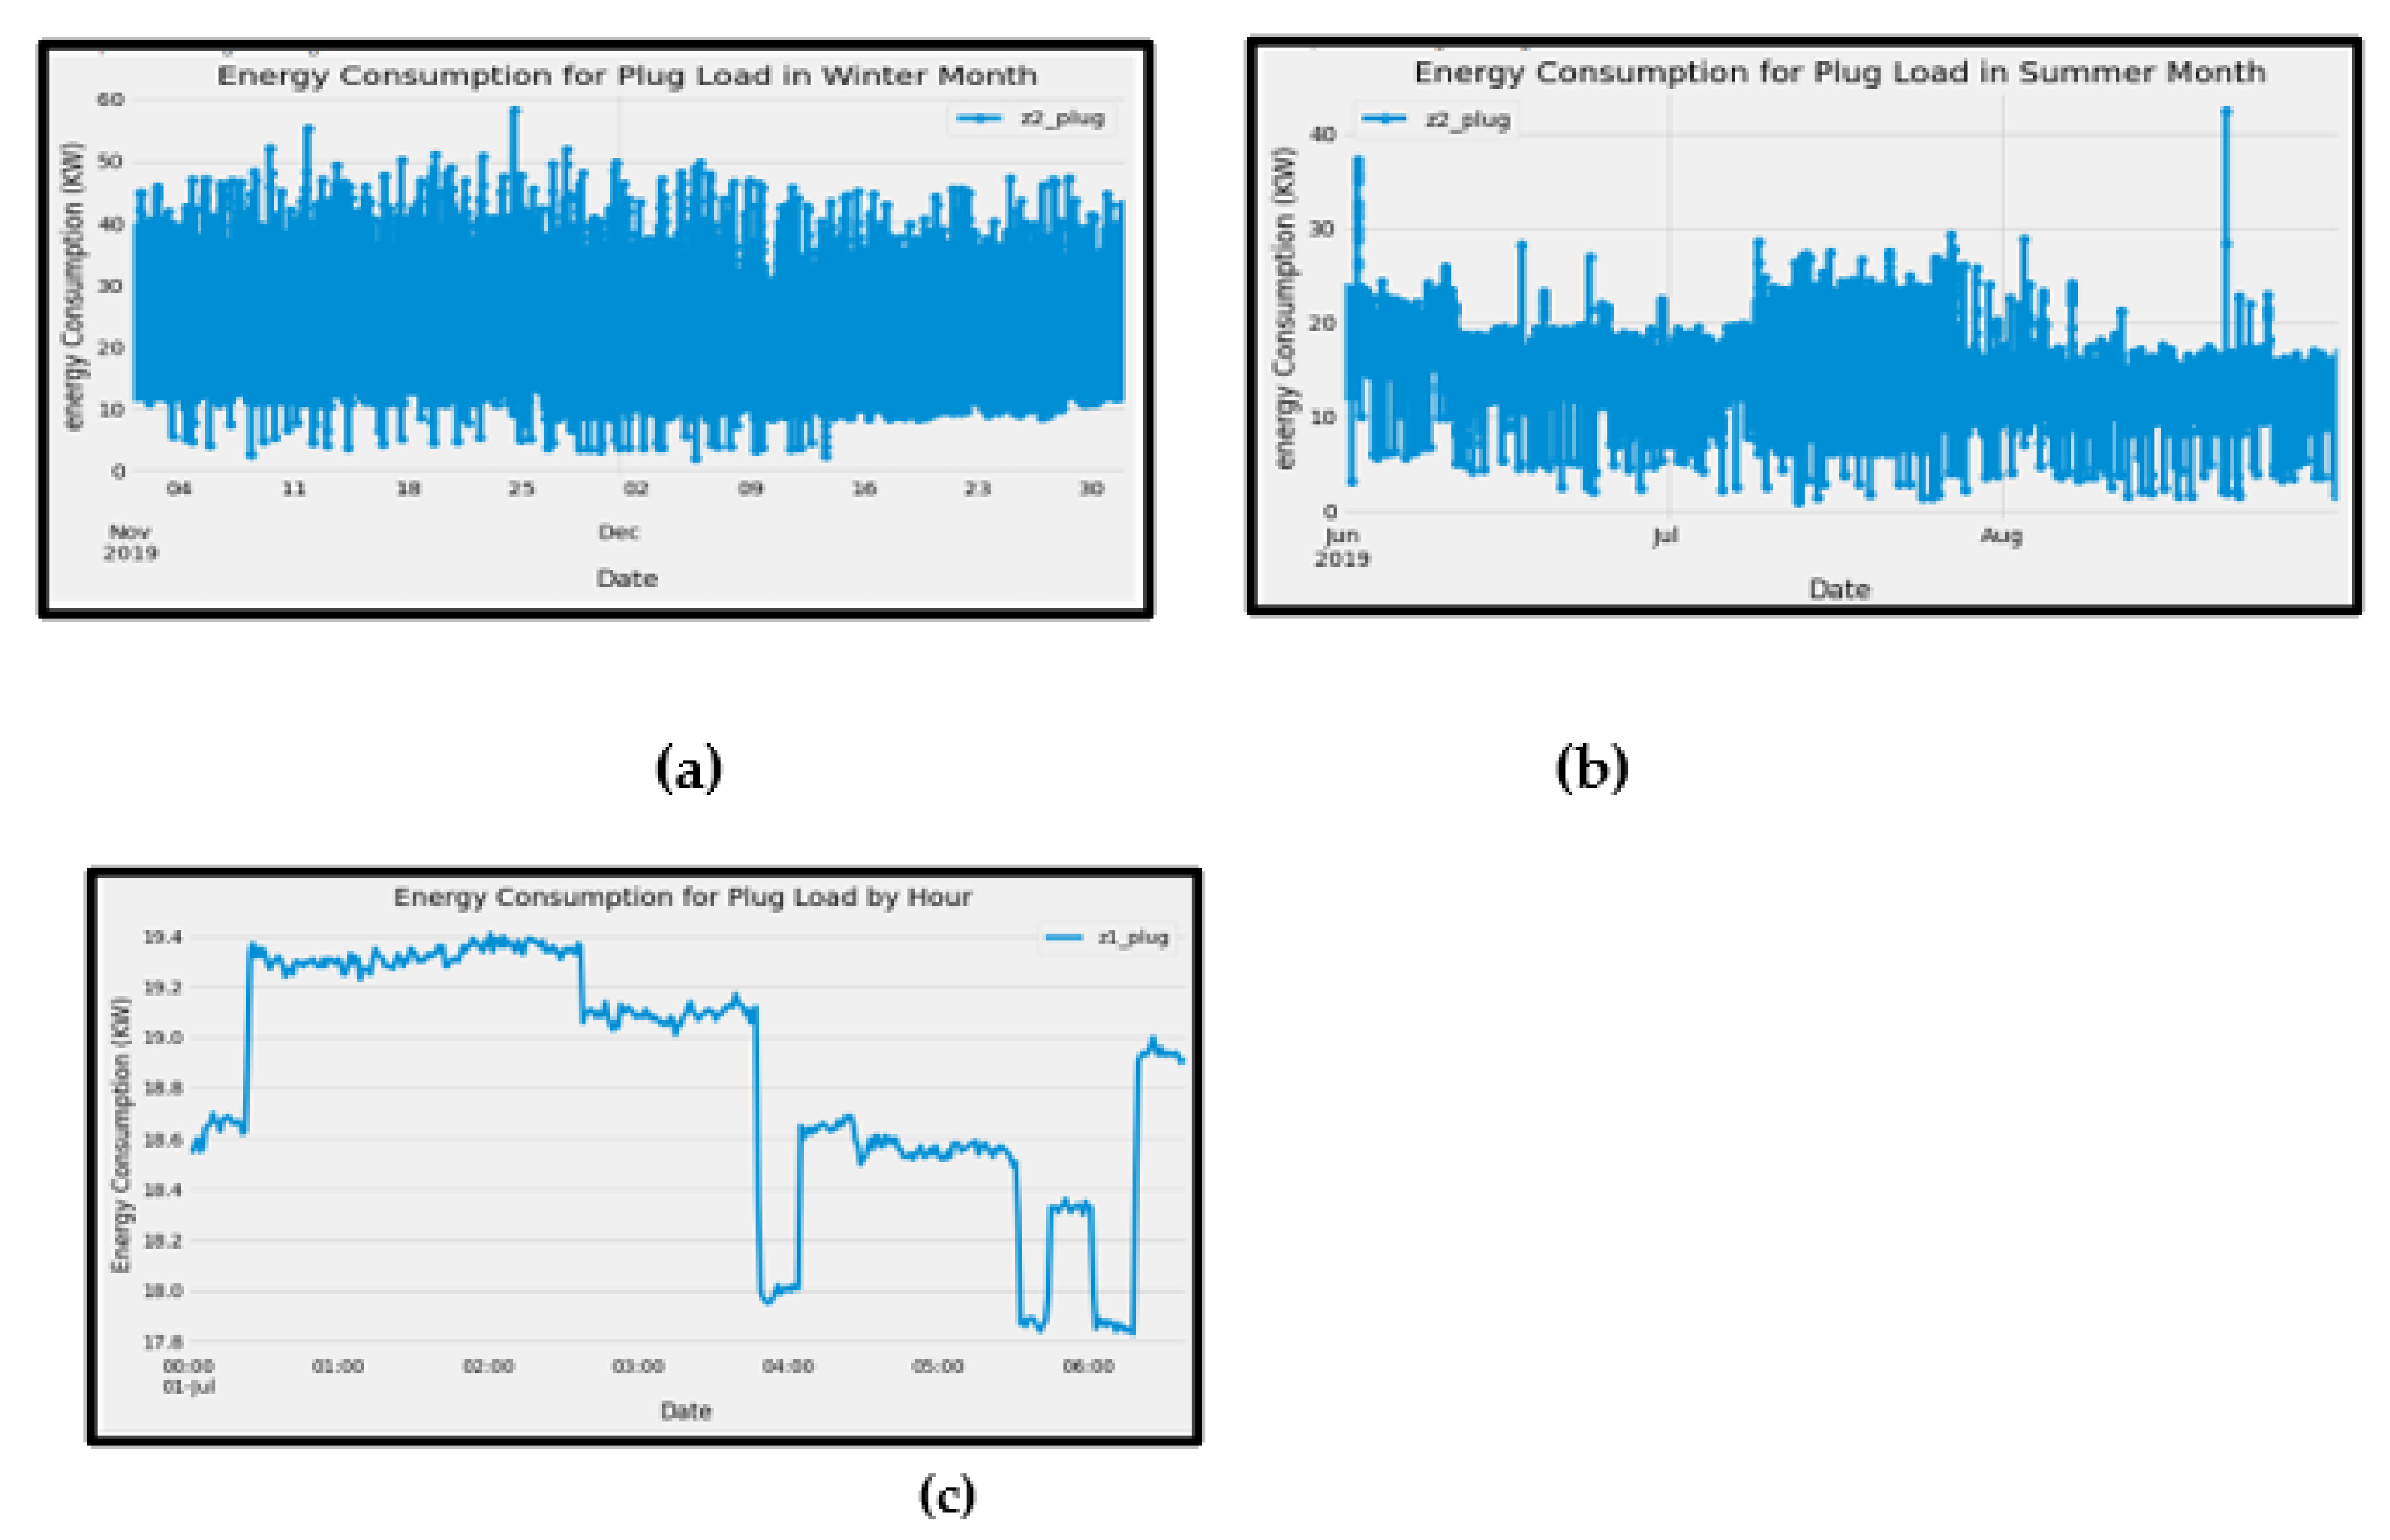
A comparison was done to see the trend of energy consumption during the summer and winter months. From
Figure 7a,b the trends show that from June to August, the energy consumed was below 40KW. This could be because, during summer, people hardly turn on the heaters which consume more energy. Also, the consumption of energy was less compared to the winter month when energy consumption was above 40KW with more plug load.
4.1.2. Energy Consumption by Hour
Figure 7c shows energy consumed per hour, 12:00 pm to 2:30 pm recorded the most energy consumed. From 3:30 pm to 4 pm, there was a drastic drop in consumed energy, this could be because the afternoon work shift was over, and staff had to turn off all loads. From 4 pm to 5:30 pm, there was a peak in energy consumed, this could also mean that staff for the evening shift has resumed office.
4.2. Model Development and training
4.2.1. Converting a Time Series Task to a Supervised Learning Task
Generally, a time-series problem needs to be formatted into a supervised learning problem to make predictions. The time series deep learning-based method requires an input and output to be given to the model to predict or forecast the next value. sliding window technique was applied to the multivariate time-series data to enable using it as input. sliding window algorithm with a window size equal to two (window size =2) was used which means the model takes a 2-time step (mins, hours, days, or months) into the future to make a prediction of energy consumption for the third minutes, hours, days or month and take the predicted value as input to predict the fourth term value.
4.2.2. Split the Data into Training, Validation, and Testing
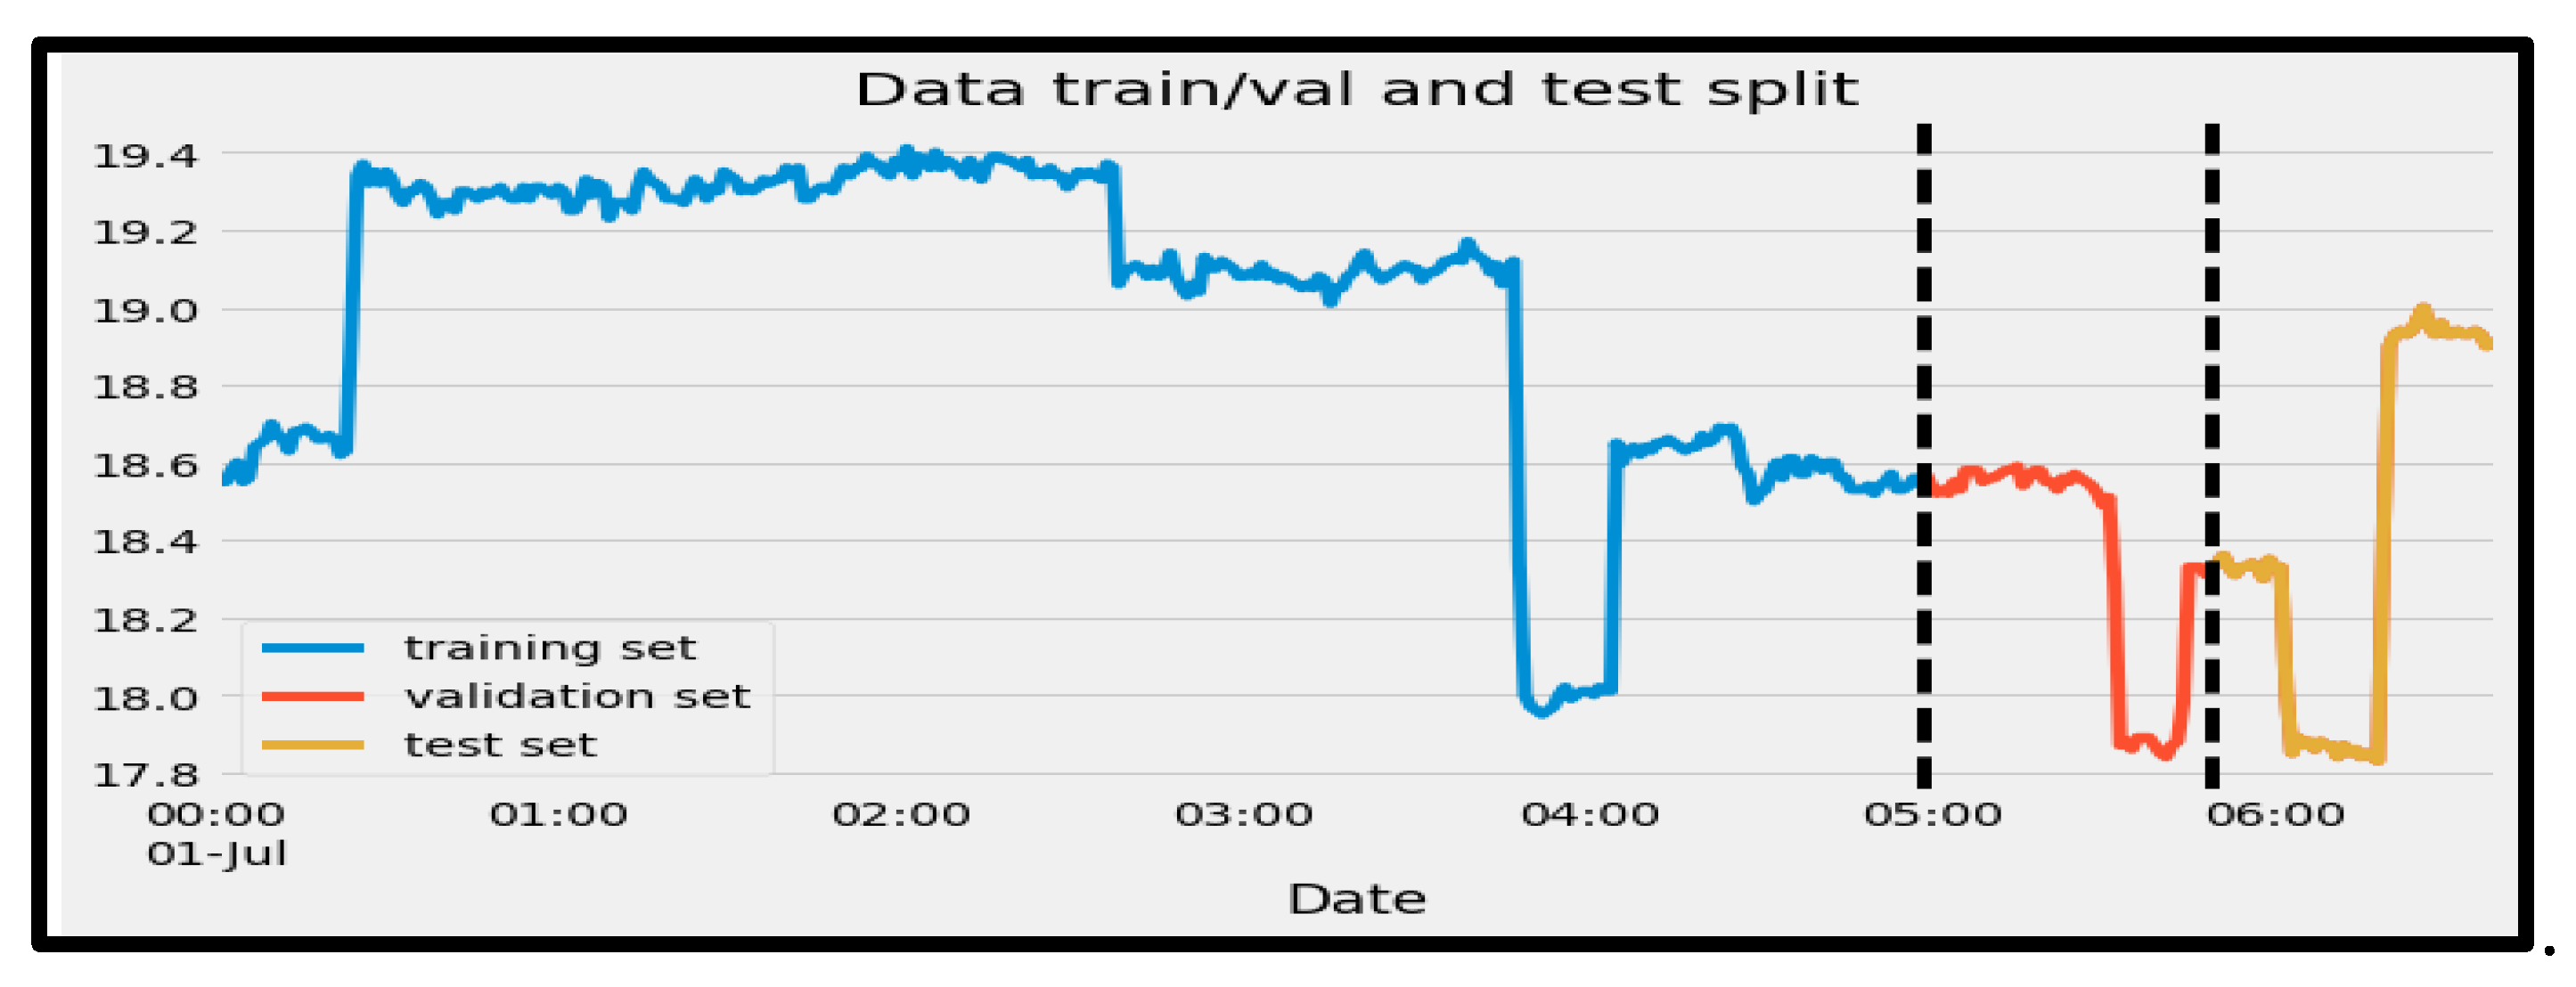
The first step was to split the data into training, validation, and testing sets. As can be seen in
Figure 8, 70 percent of the data was to train the model, 10 percent to validate the model and see how well it can generalize on the test data, and 20% was assigned to testing the model and to see how well it could accurately make a prediction. The
Figure 8 illustrates the data split.
4.2.3. Developed Models for Energy Consumption Predictions
A total of 12 models including deep learning models such as LSTM, CNN, GRU, and hybrid models including CNN-LSTM, CNN-GRU, and CNN-Bidirectional LSTM were built and evaluated for their ability to accurately predict energy consumption in smart buildings. The experiments were conducted on minutely, hourly, and daily time intervals, and the model performance was measured using the root mean square error (RMSE), mean absolute error (MAE), and mean squared error (MSE) metrics.
The proposed CNN-LSTM model was compared to other models in terms of its ability to make short-term, medium-term, and long-term predictions. The dataset was aggregated from minutely timestamps to hourly and daily timestamps to evaluate the model performance at different time intervals. A sliding window algorithm with a window size of two was utilized in the experiment, where the model was fed with two consecutive time steps as input and used to predict the next value.
4.3. Evaluation Metrics
The performance of the proposed CNN-LSTM model is evaluated by MAE, MSE, and RMSE. These performance metrics evaluate the variance between the actual and predicted values.
where
and
represent the actual time series value the predicted value respectively. MSE (equation 12) measures the average square value of the predicted and actual values, MAE (equation 13) shows the percentage variance of the predicted values, and RMSE (equation 14) estimates the percentage variance of the predicted and actual values [
41,
42].
4.4. Model Evaluation
To evaluate the developed models, several experiments were conducted. The first of these experiments is meant to validate the efficacy of CNN-LSTM hybrid model and see how well it performs in predicting energy consumption at two minutes intervals. Subsequent experiments were then conducted to compare it to LSTM, CNN, and GRU deep learning models. The results were evaluated using RMSE, MSE, and MAE as the error metrics as defined in section 4.3.
4.4.1. Performance Evaluation of the Proposed Model and Other Hybrid Deep Learning Models
The results of the hybrid models for time series energy consumption prediction are presented in the table below. The performance of the models was evaluated using the Root Mean Squared Error (RMSE), Mean Squared Error (MSE), and Mean Absolute Error (MAE) metrics. The results showed that the proposed CNN-LSTM model outperformed the other hybrid models with a MSE of 0.109, demonstrating its outstanding capability in predicting short-term energy consumption. The experiment confirms that the CNN-LSTM model is a superior choice compared to other hybrid methods for short-term energy consumption prediction.
4.5. Predicting Daily Energy Consumption
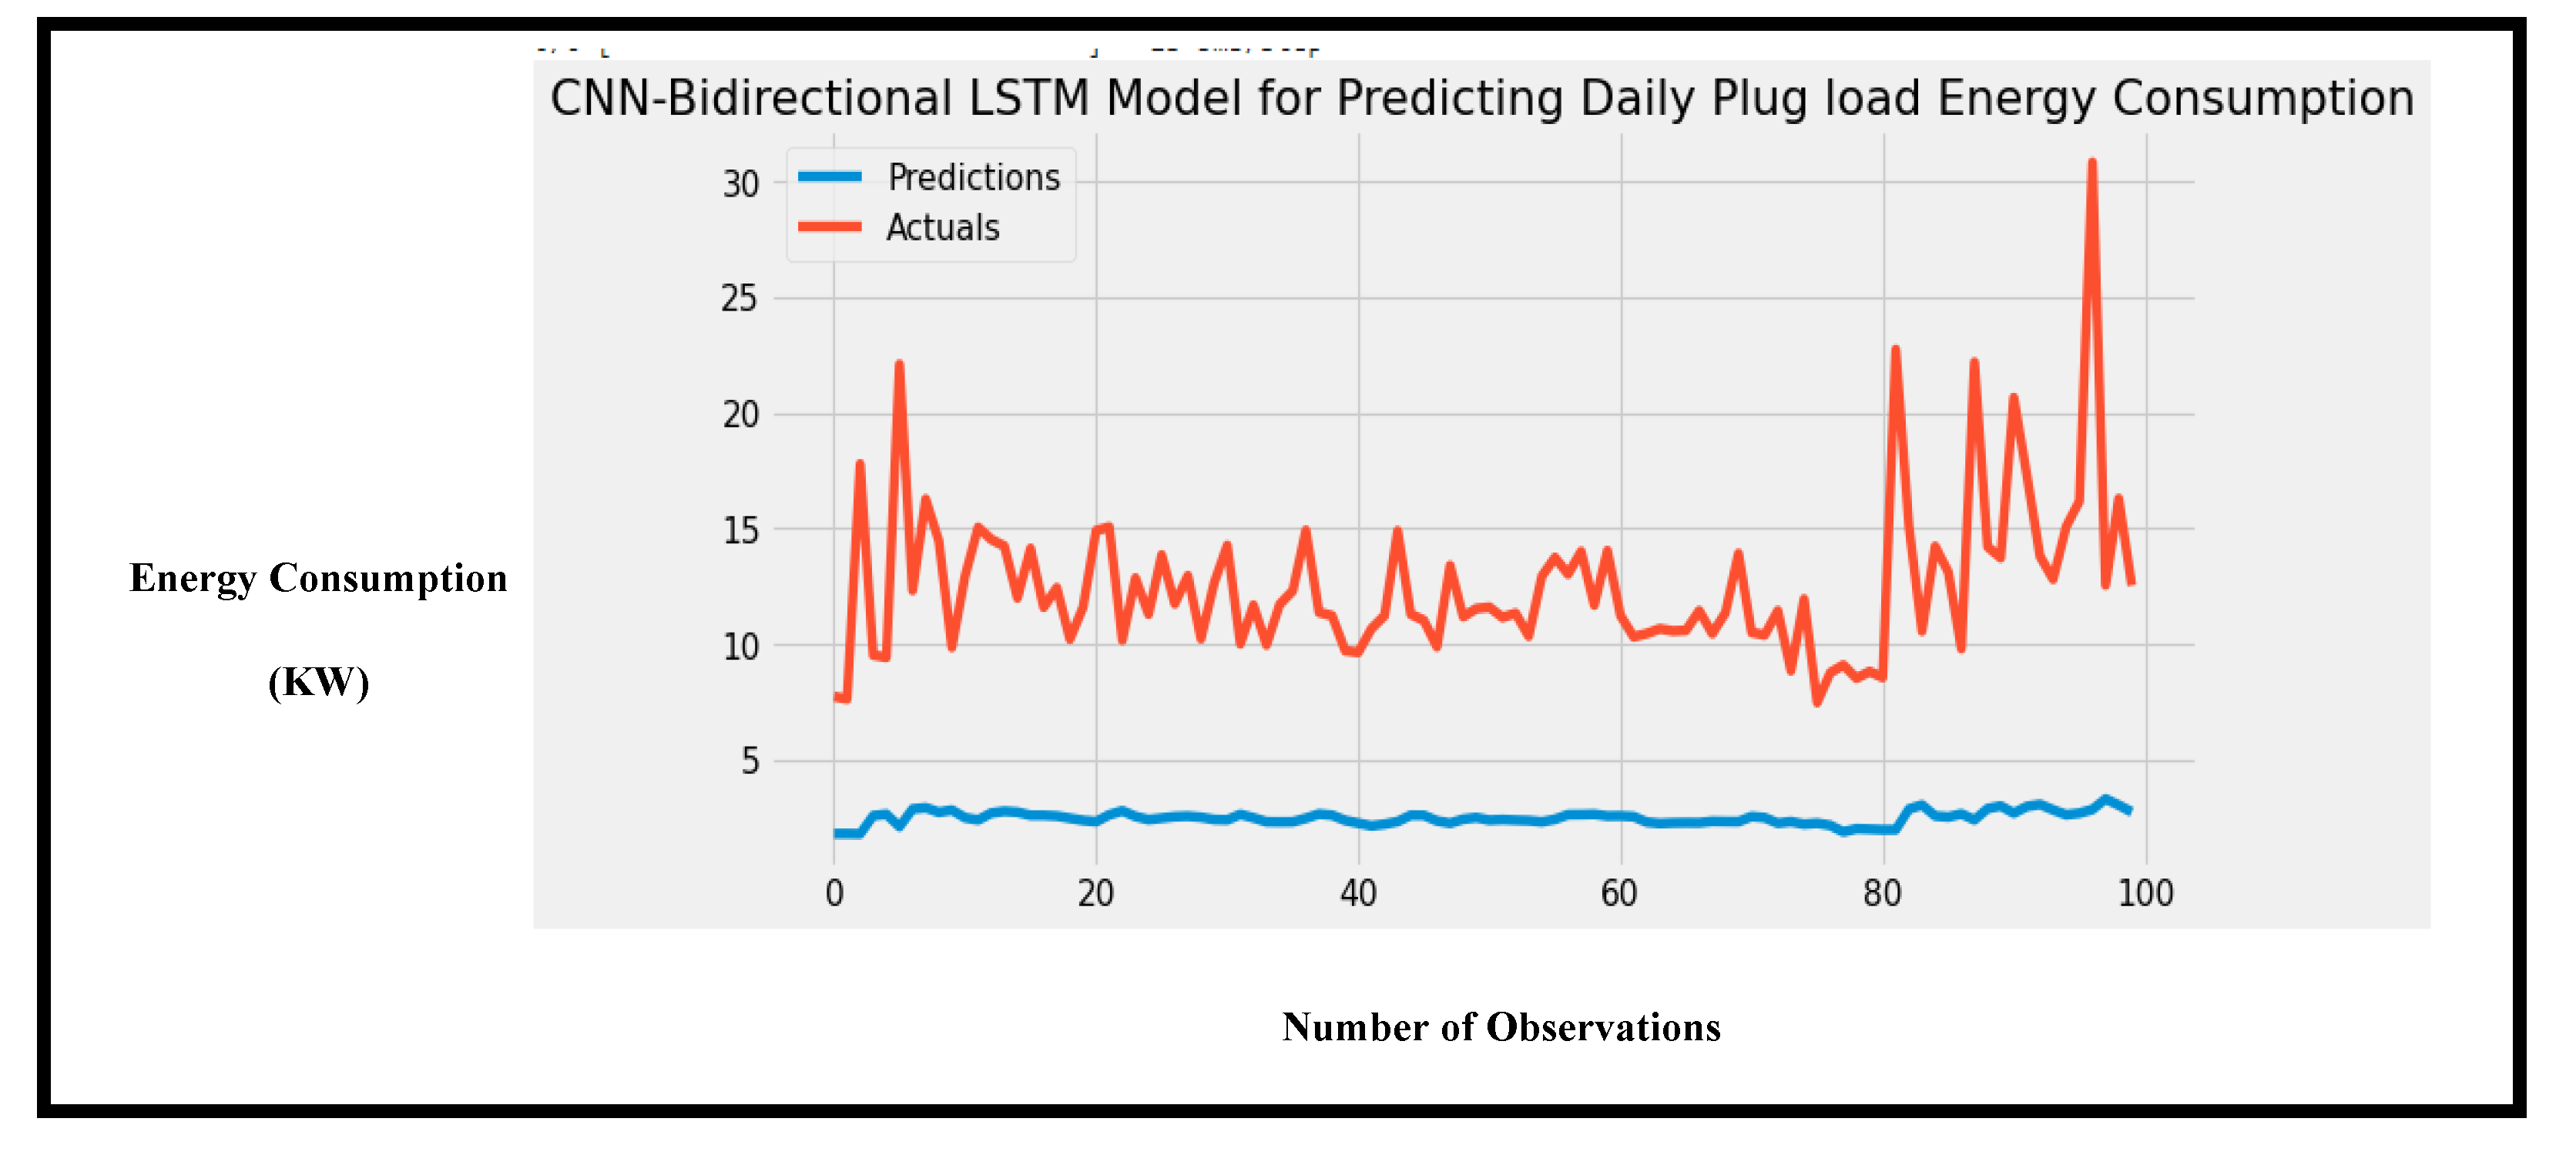
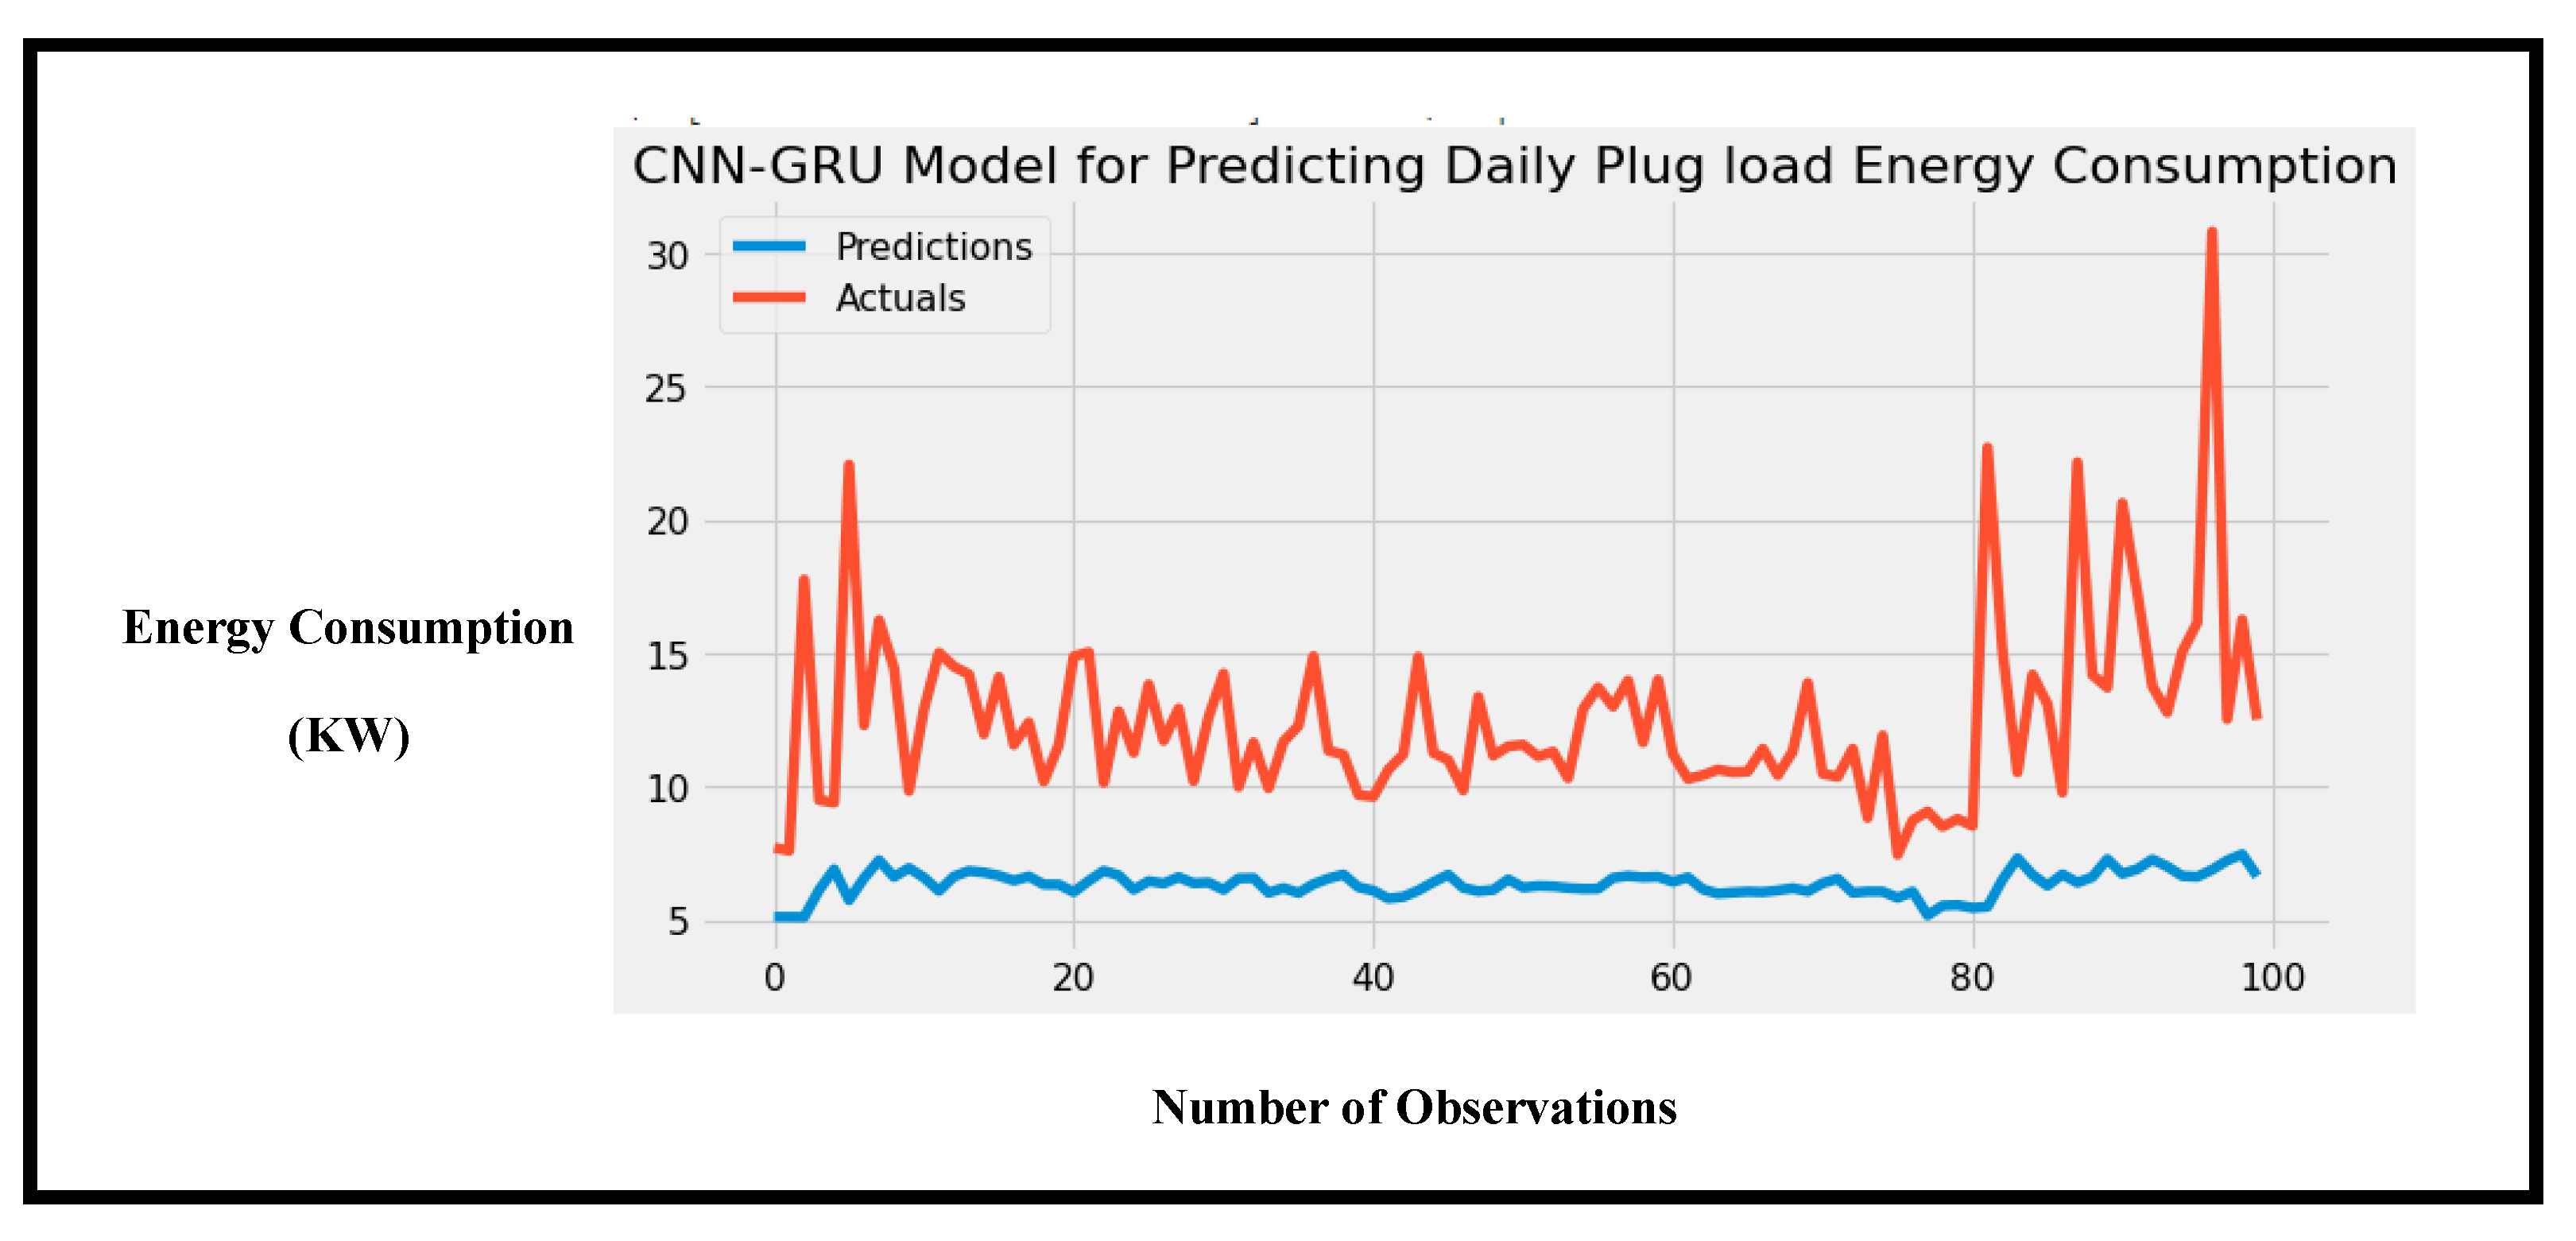
The third experiment evaluated the performance of the proposed CNN-LSTM model for predicting daily energy consumption. The dataset was pre-processed to convert it from hourly timestamps to daily time intervals, resulting in 548 observations. The proposed model was compared to other hybrid deep learning models. The results as shown in
Table 2, demonstrate that the mean square error values were higher than zero due to the small dataset used in training. Despite this, the proposed model outperformed other models (
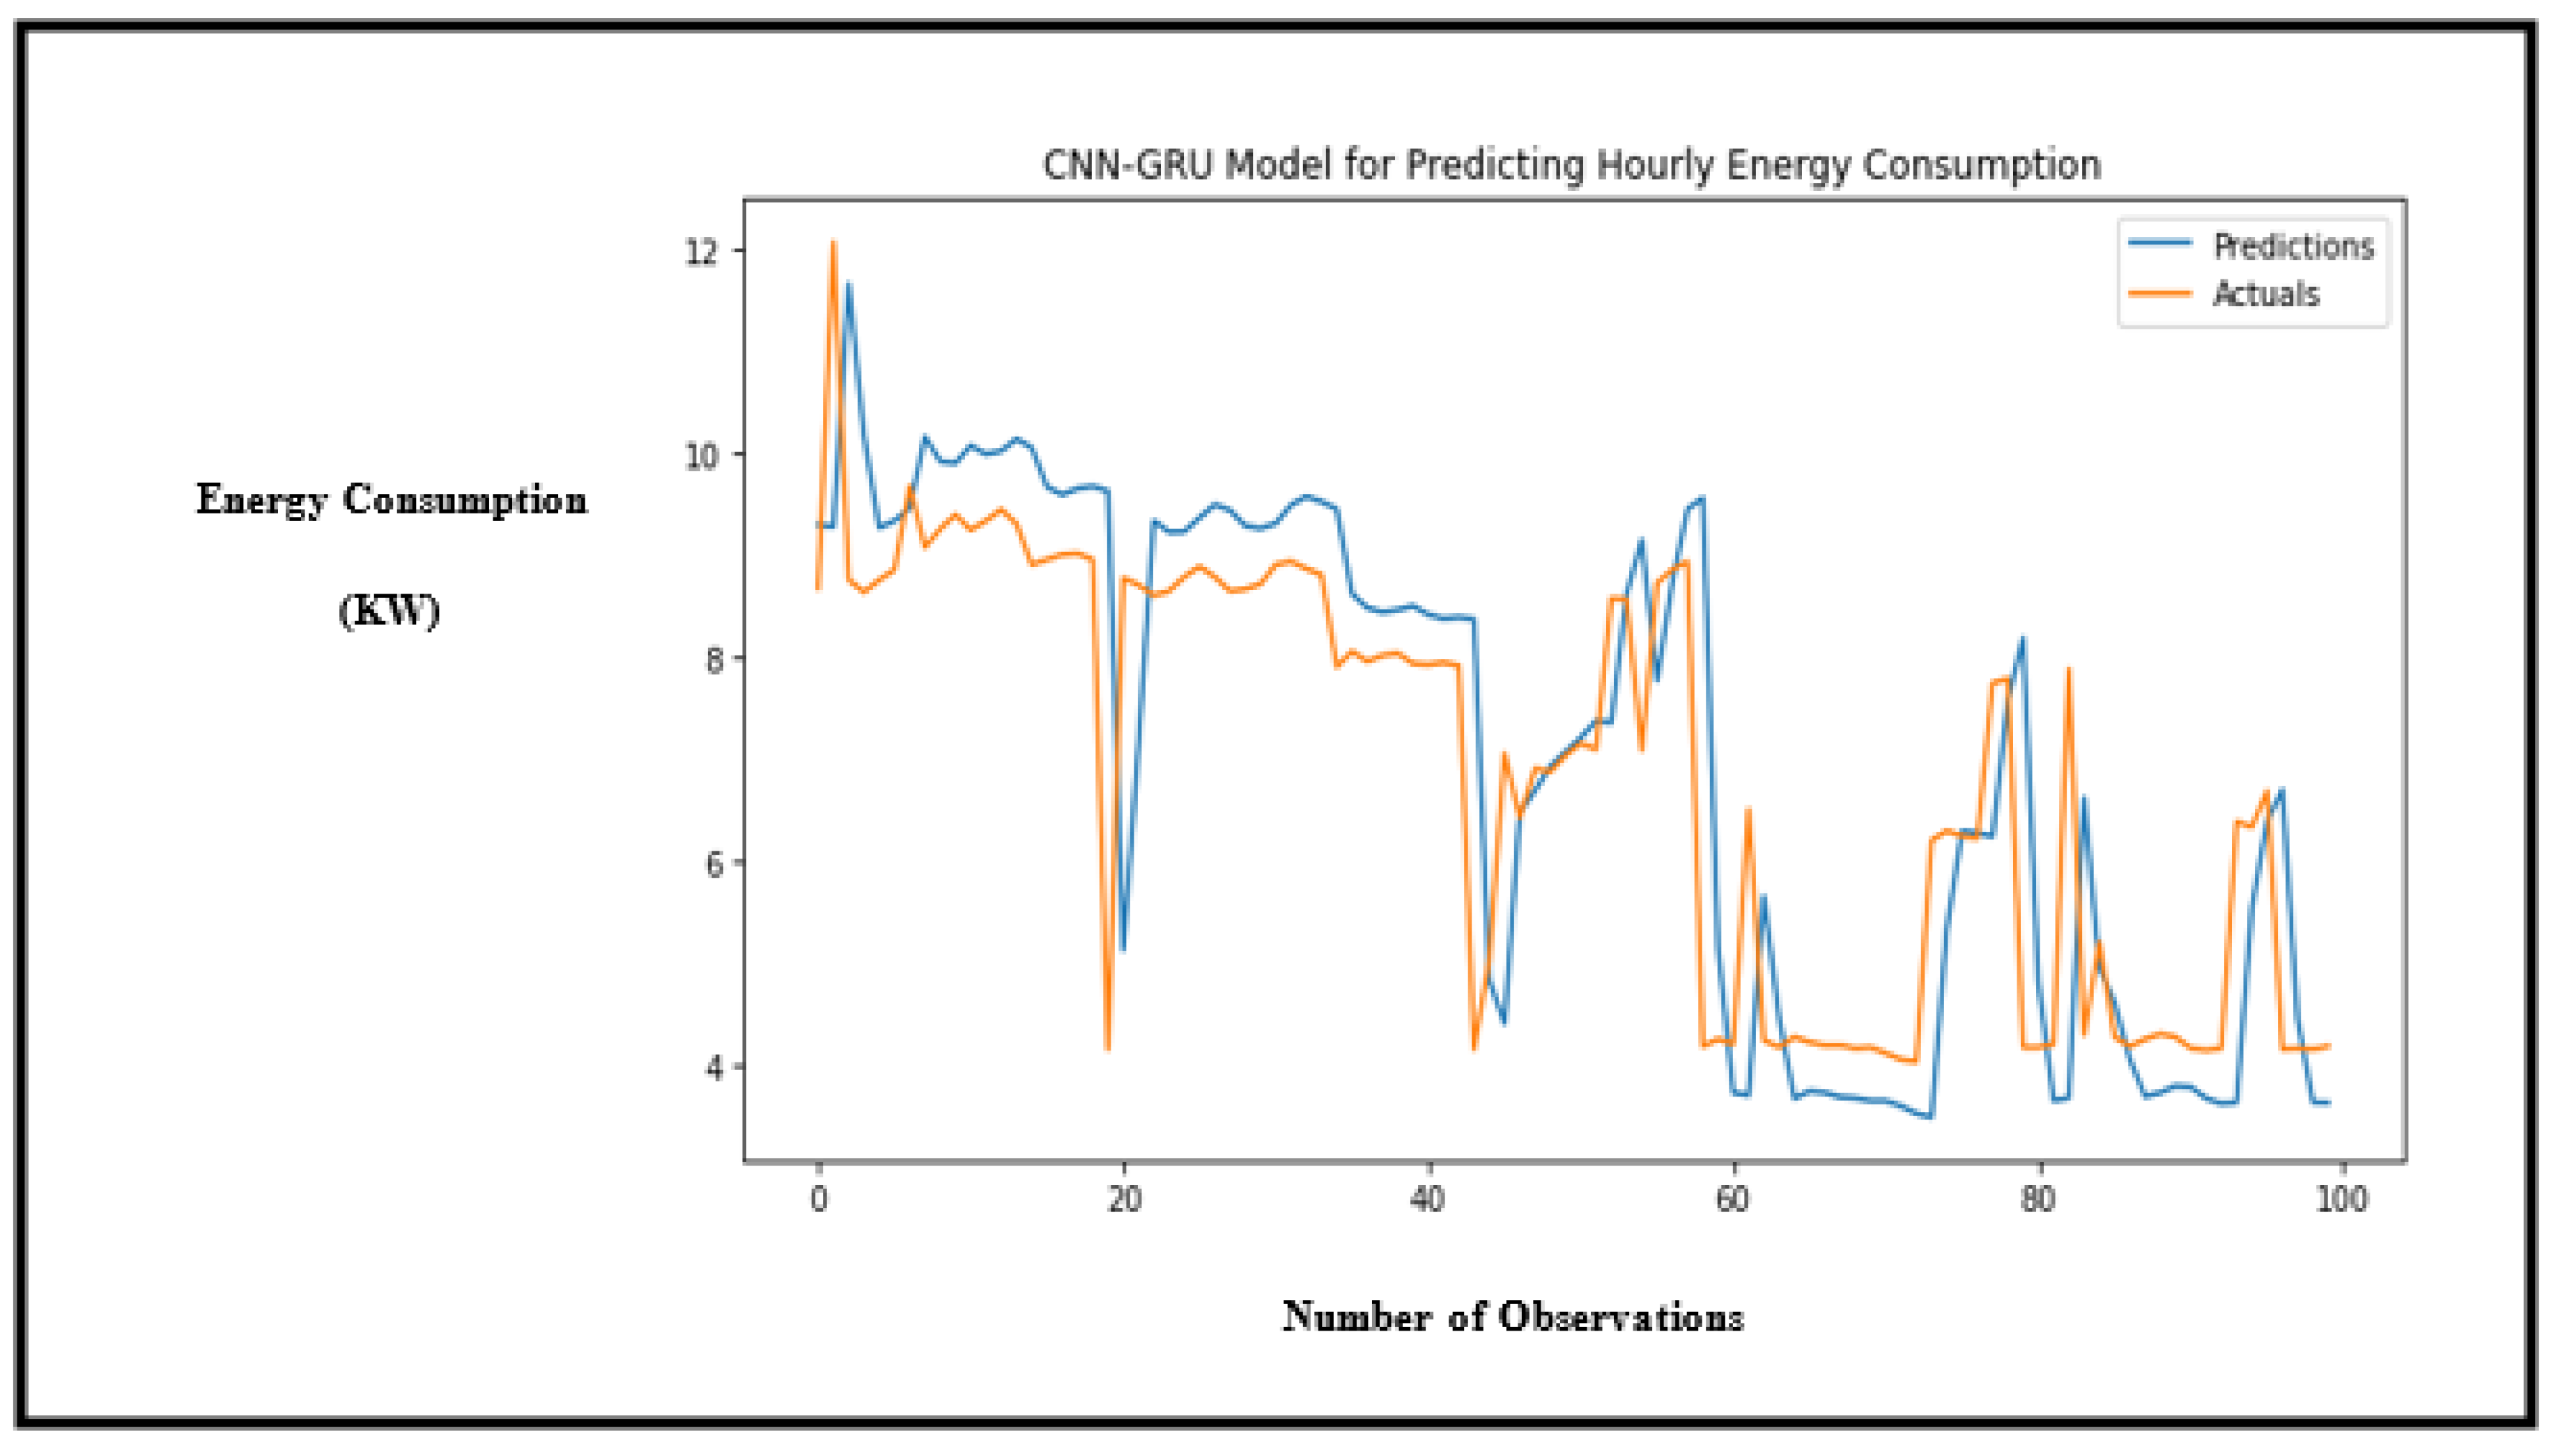
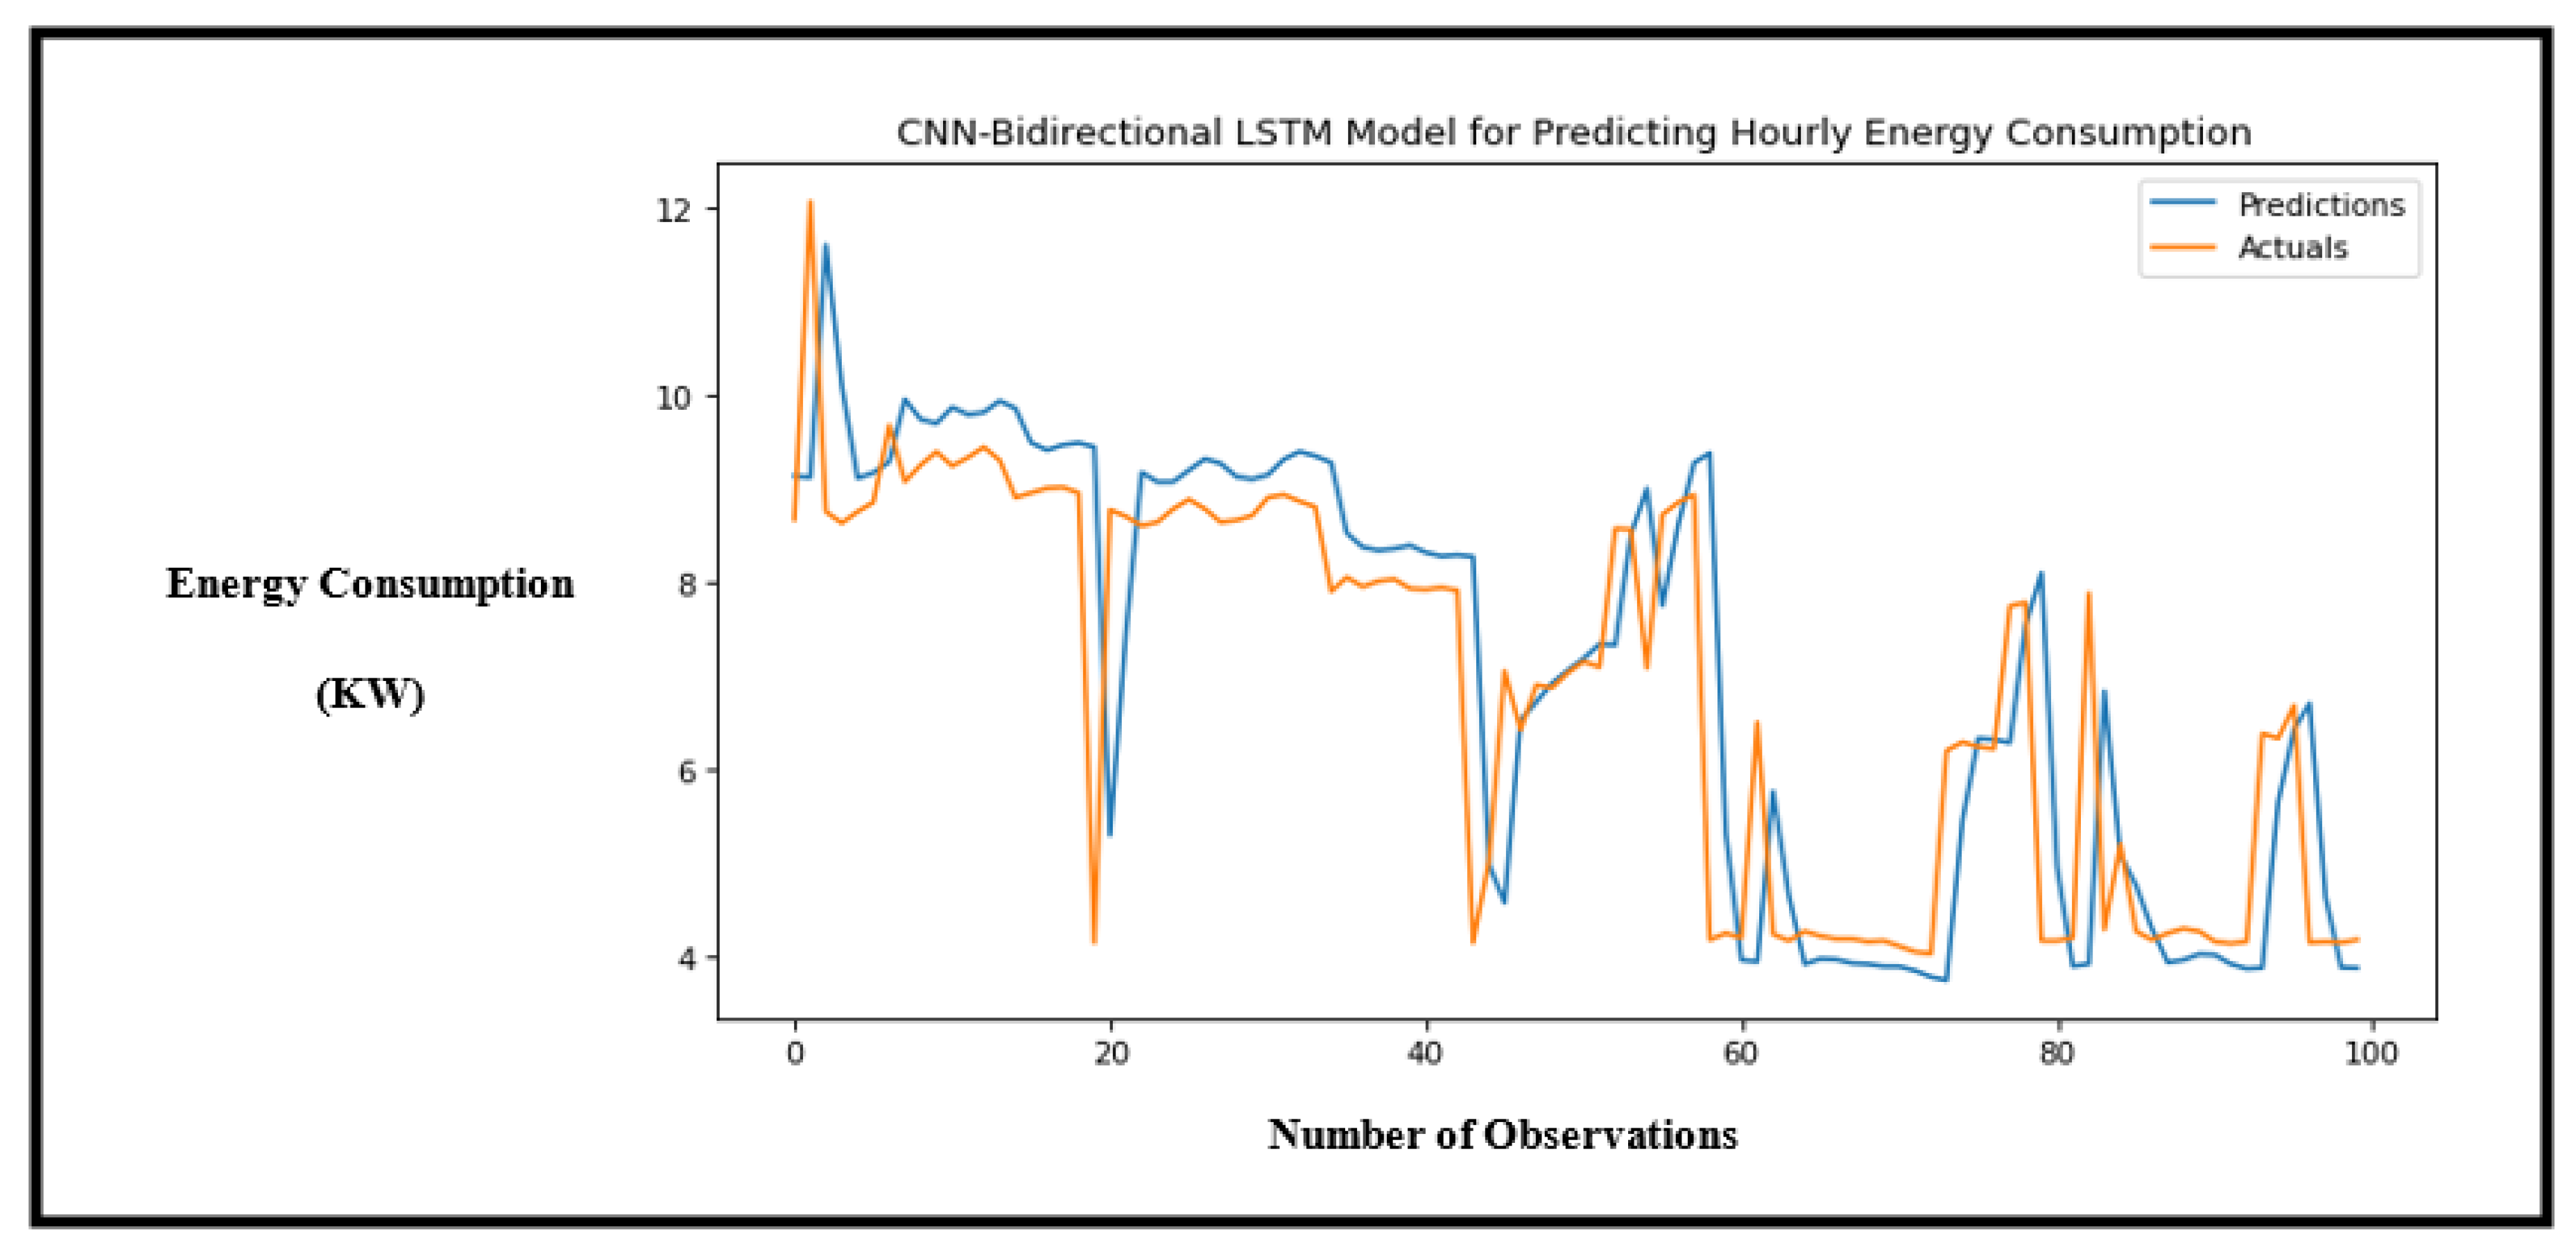
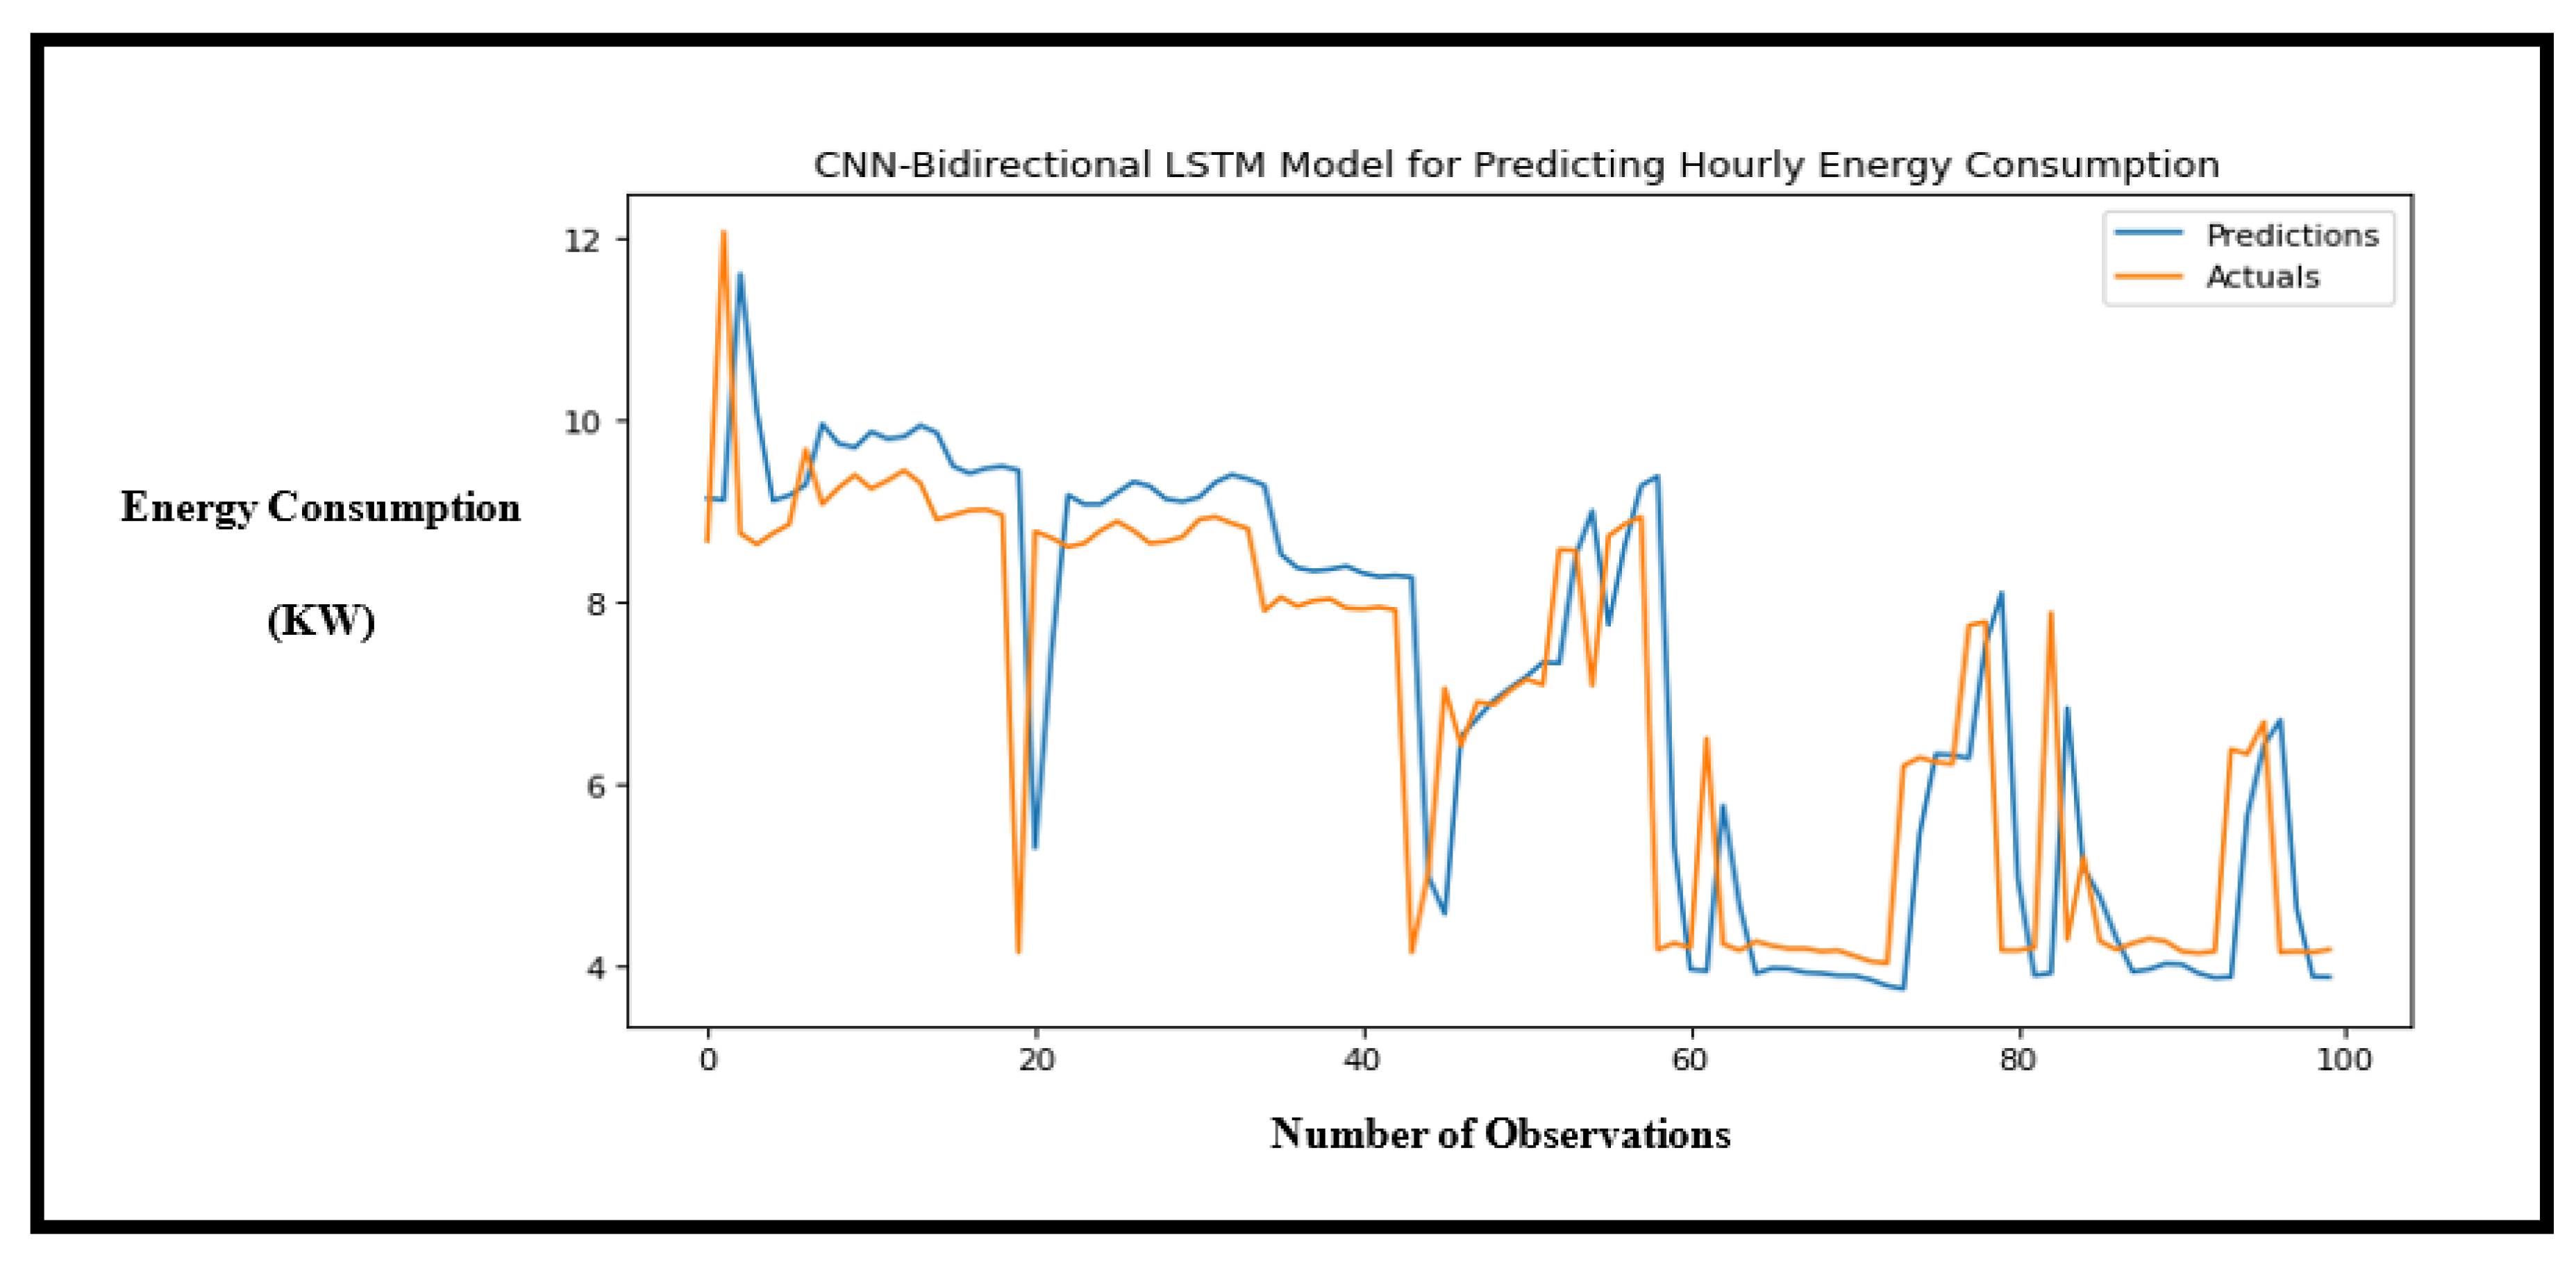
Figure 9,
Figure 10 and
Figure 11) in predicting trends in the data, achieving the lowest MSE value of 28.95, proving its superiority.
Figure 9.
Performance of the CNN-GRU hybrid model showing the accuracy of predictions for hourly energy consumption.
Figure 9.
Performance of the CNN-GRU hybrid model showing the accuracy of predictions for hourly energy consumption.
Figure 10.
Performance of the CNN-LSTM hybrid model showing the accuracy of predictions for hourly energy consumption.
Figure 10.
Performance of the CNN-LSTM hybrid model showing the accuracy of predictions for hourly energy consumption.
Figure 11.
Performance of the CNN-Bidirectional LSTM hybrid model showing the accuracy of predictions for hourly energy consumption.
Figure 11.
Performance of the CNN-Bidirectional LSTM hybrid model showing the accuracy of predictions for hourly energy consumption.
Figure 12.
Performance of the CNN- LSTM hybrid model showing the accuracy of predictions for daily energy consumption.
Figure 12.
Performance of the CNN- LSTM hybrid model showing the accuracy of predictions for daily energy consumption.
Figure 13.
Performance of the CNN-Bidirectional LSTM hybrid model showing the accuracy of predictions for daily energy consumption.
Figure 13.
Performance of the CNN-Bidirectional LSTM hybrid model showing the accuracy of predictions for daily energy consumption.
Figure 14.
Performance of the CNN-GRU hybrid model showing the accuracy of predictions for hourly energy consumption.
Figure 14.
Performance of the CNN-GRU hybrid model showing the accuracy of predictions for hourly energy consumption.
4.6. Model Prediction Performance with Time Change Resolution
The energy consumption prediction experiment was categorized into short-, medium-, and long-term prediction. The experiment was carried out by aggregating the data by minutes, hours, and days’ time resolution.
Table 4 shows each model’s performance according to changes in time. As the time resolution decreases the error rate increases. This is because, at each stage of aggregating the dataset, the number of observations keeps decreasing leaving smaller data to be trained by the model. Furthermore, a deep neural network requires a larger amount of data to increase performance. However, at each stage of the time change, the proposed model outperformed the other models which proves that the proposed model is superior.
5. Discussion
This research aimed to see how well CNN-LSTM can make predictions accurately, a total of 12 deep neural networks and hybrid neural networks was built and compared with the proposed model. The models were built to make predictions for minutes, hourly, and daily energy consumption with window size set to 2. From experiments, all models performed well in predicting trends and patterns present in the dataset.
For minutes interval prediction, the proposed CNN-LSTM model had the best MSE loss error of 0.109 which proved that CNN-LSTM is a superior model in predicting energy consumption for short term. The error metrics for the other models were not highly significantly different from the proposed model, however, the proposed model was able to predict the peak load in the data set that the other models could rarely predict.
The second experiment on hourly prediction proved that the proposed model is superior compared to the other models. with the decrease in number of observations, the proposed model was able to predict trends regardless and achieved the least MSE of 2.530. CNN-Bi LSTM followed with a MSE of 2.678.
The last experiment used the daily dataset to predict energy consumption. The number of observations when converted from hourly data to daily data decreased to 548, which is notably small to train a hybrid deep learning model. However, the experiment was performed regardless, and this experiment proved that CNN-LSTM is indeed a superior model. Only the proposed model was able to predict the trends in the dataset. The proposed model achieved the least MSE of 28.95.
6. Conclusions
The proposed CNN-LSTM models and its variants proved to be robust and efficient for predicting energy consumption in smart buildings. The model outperformed other deep learning models in predicting energy consumption and energy trends on short term and medium term. The model’s performance was evaluated using energy consumption data aggregated at different time resolutions ranging from minutes to daily. Results showed that as the time resolution decreased, the error rate increased due to insufficient model training data. However, the proposed model still achieved the least error rate and accurately predicted daily energy consumption even with a small dataset. The use of the proposed model in energy management can lead to effective and efficient energy utilization.
However, the model’s accuracy decreased when predicting hourly and daily energy consumption due to the aggregation of data and resulting smaller dataset for training the model. To achieve a more robust and optimal performance, larger datasets are required. Additionally, collecting data from multiple sources would enhance the generalizability of the model and validate its performance.
Author Contributions
Conceptualization, Abayomi Otebolaku and Favour Ibude; Data curation, Favour Ibude; Formal analysis, Abayomi Otebolaku, Favour Ibude, Jude Ameh and Augustine Ikpehai; Investigation, Abayomi Otebolaku, Favour Ibude, Jude Ameh and Augustine Ikpehai; Methodology, Abayomi Otebolaku and Favour Ibude; Project administration, Abayomi Otebolaku and Favour Ibude; Resources, Favour Ibude; Software, Favour Ibude; Supervision, Abayomi Otebolaku; Validation, Abayomi Otebolaku and Favour Ibude; Visualization, Abayomi Otebolaku, Favour Ibude, Jude Ameh and Augustine Ikpehai; Writing – original draft, Abayomi Otebolaku and Favour Ibude; Writing – review & editing, Abayomi Otebolaku, Favour Ibude, Jude Ameh and Augustine Ikpehai.
Funding
This research received no external funding.
Data Availability Statement
Conflicts of Interest
The authors declare no conflicts of interest.
References
- Olu-Ajayi, R., Alaka, H., Sulaimon, I., Sunmola, F., & Ajayi, S. (2022a). Building energy consumption prediction for residential buildings using deep learning and other machine learning techniques. Journal of Building Engineering, 45, 103406. [CrossRef]
- Ozili, P. K. (2021). Sustainability accounting. SSRN Electronic Journal. [CrossRef]
- Pérez-Lombard, L., Ortiz, J., & Pout, C. (2008). A review on buildings energy consumption information. Energy and Buildings, 40(3), 394–398. [CrossRef]
- Hu, S., Hoare, C., Raftery, P., & O’Donnell, J. (2019). Environmental and energy performance assessment of buildings using scenario modelling and fuzzy analytic network process. Applied Energy, 255. [CrossRef]
- Sharma, S., Xu, Y., Verma, A., & Panigrahi, B. K. (2019). Time-Coordinated Multienergy Management of Smart Buildings Under Uncertainties. IEEE Transactions on Industrial Informatics, 15(8), 4788–4798. [CrossRef]
- Gupta, A., Badr, Y., Negahban, A., & Qiu, R. G. (2021). Energy-efficient heating control for smart buildings with deep reinforcement learning. Journal of Building Engineering, 34, 101739. [CrossRef]
- Bourhnane, S., Abid, M. R., Lghoul, R., Zine-Dine, K., Elkamoun, N., & Benhaddou, D. (2020a). Machine learning for energy consumption prediction and scheduling in smart buildings. SN Applied Sciences, 2(2), 1–10. [CrossRef]
- Xu, D., Yang, S., Zhang, H., Xu, Q., Li, Z., Lu, Z., & Chen, W. (2018). A Classified Identification Deep-Belief Network for Predicting Electric-Power Load; A Classified Identification Deep-Belief Network for Predicting Electric-Power Load. 2018 2nd IEEE Conference on Energy Internet and Energy System Integration (EI2).
- Dai, X., Liu, J. and Zhang, X. (2020) ‘A review of studies applying machine learning models to predict occupancy and window-opening behaviours in smart buildings’, Energy and Buildings, 223, p. 110159. [CrossRef]
- Zhao, C., Zhang, M. and Wang, W. (2019) ‘Exploring the influence of severe haze pollution on residents’ intention to purchase energy-saving appliances’, Journal of Cleaner Production, 212, pp. 1536–1543. [CrossRef]
- Mariano-Hernández, D., Hernández-Callejo, L., Solís, M., Zorita-Lamadrid, A., Duque-Perez, O., Gonzalez-Morales, L., & Santos-García, F. (2021). A Data-Driven Forecasting Strategy to Predict Continuous Hourly Energy Demand in Smart Buildings. [CrossRef]
- Afzal, S. et al. (2023) ‘Building energy consumption prediction using multilayer perceptron neural network-assisted models; comparison of different optimization algorithms’, Energy, 282, p. 128446. [CrossRef]
- Sekhar, C. and Dahiya, R. (2023) ‘Robust framework based on hybrid deep learning approach for short term load forecasting of building electricity demand’, Energy, 268, p. 126660. [CrossRef]
- Cai, W. et al. (2023) ‘Predicting the energy consumption in buildings using the optimized support vector regression model’, Energy, 273, p. 127188. [CrossRef]
- Maghraoui, A. el, Ledmaoui, Y., Laayati, O., Hadraoui, H. el, & Chebak, A. (2022). Smart Energy Management: A Comparative Study of Energy Consumption Forecasting Algorithms for an Experimental Open-Pit Mine. Energies, 15(13). [CrossRef]
- Wang, M., Wang, W., & Wu, L. (2022). Application of a new grey multivariate forecasting model in the forecasting of energy consumption in 7 regions of China. Energy, 243, 123024. [CrossRef]
- Gellert, A., Fiore, U., Florea, A., Chis, R., & Palmieri, F. (2022). Forecasting Electricity Consumption and Production in Smart Homes through Statistical Methods. Sustainable Cities and Society, 76, 103426. [CrossRef]
- Ma, H. (2022). Prediction of industrial power consumption in Jiangsu Province by regression model of time variable. Energy, 239, 122093. [CrossRef]
- Shao, M., Wang, X., Bu, Z., Chen, X., & Wang, Y. (2020). Prediction of energy consumption in hotel buildings via support vector machines. Sustainable Cities and Society, 57, 102128. [CrossRef]
- Olu-Ajayi, R., Alaka, H., Sulaimon, I., Sunmola, F., & Ajayi, S. (2022b). Building energy consumption prediction for residential buildings using deep learning and other machine learning techniques. Journal of Building Engineering, 45, 103406. [CrossRef]
- Jin, Y., Yan, D., Zhang, X., Han, M., Kang, X., An, J., & Sun, H. (2019). District household electricity consumption pattern analysis based on auto-encoder algorithm. IOP Conference Series: Materials Science and Engineering, 609(7). [CrossRef]
- Salmerón Gómez, R., García, C. B. G., & Pérez, J. G. (2022). The multiColl Package Versus Other Existing Packages in R to Detect Multicollinearity. Computational Economics, 60(2), 439–450. [CrossRef]
- Azuana Ramli, N., Laili Mazlan, N., Jamilatul Awalin, L., Badrulhisham Ismail, M., Kassim, A., & Menon, A. (2020). A Smart Building Energy Management using Internet of Things (IoT) and Machine Learning. https://www.researchgate.net/publication/342956749.
- Shapi, M. K. M., Ramli, N. A., & Awalin, L. J. (2021). Energy consumption prediction by using machine learning for smart building: Case study in Malaysia. Developments in the Built Environment, 5. [CrossRef]
- Wang, Y., Wang, L., Yang, F., Di, W., & Chang, Q. (2021). Advantages of direct input-to-output connections in neural networks: The Elman network for stock index forecasting. Information Sciences, 547, 1066–1079. [CrossRef]
- Zhang, J., Li, Z., Pu, Z., & Xu, C. (2018). Comparing prediction performance for crash injury severity among various machine learning and statistical methods. IEEE Access, 6, 60079–60087. [CrossRef]
- Kiprijanovska, I., Stankoski, S., Ilievski, I., Jovanovski, S., Gams, M., & Gjoreski, H. (2020). Houseec: Day-ahead household electrical energy consumption forecasting using deep learning. Mdpi.Com. [CrossRef]
- Palak, M., Revati, G., & Sheikh, A. (2021). Smart Building Energy Management using Deep Learning Based Predictions. 2021 North American Power Symposium, NAPS 2021. [CrossRef]
- Sajjad, M., Khan, Z. A., Ullah, A., Hussain, T., Ullah, W., Lee, M. Y., & Baik, S. W. (2020a). A Novel CNN-GRU-Based Hybrid Approach for Short-Term Residential Load Forecasting. IEEE Access, 8, 143759–143768. [CrossRef]
- Albawi, S., Mohammed, T. A., & Al-Zawi, S. (2018). Understanding of a convolutional neural network. Proceedings of 2017 International Conference on Engineering and Technology, ICET 2017, 2018-January, 1–6. [CrossRef]
- Dauphin, Y. N., Fan, A., Auli, M., & Grangier, D. (2017). Language modeling with gated convolutional networks. 34th International Conference on Machine Learning, ICML 2017, 2, 1551–1559.
- Li, Z., Friedrich, D., & Harrison, G. P. (2020). Demand Forecasting for a Mixed-Use Building Using Agent-Schedule Information with a Data-Driven Model. Energies 2020, Vol. 13, Page 780, 13(4), 780. [CrossRef]
- Khalil, M., McGough, A. S., Pourmirza, Z., Pazhoohesh, M., & Walker, S. (2022). Machine Learning, Deep Learning and Statistical Analysis for forecasting building energy consumption — A systematic review. Engineering Applications of Artificial Intelligence, 115, 105287. [CrossRef]
- Graves, A., Jaitly, N., on, A. M.-2013 I. workshop, & 2013, undefined. (n.d.). Hybrid speech recognition with deep bidirectional LSTM. Ieeexplore.Ieee.Org. Retrieved November 29, 2022, from https://ieeexplore.ieee.org/abstract/document/6707742/.
- Shah, F., Naik, T., & Vyas, N. (2019). LSTM based music generation. Proceedings - International Conference on Machine Learning and Data Engineering, ICMLDE 2019, 48–53. [CrossRef]
- Yan, K., Li, W., Ji, Z., Qi, M., & Du, Y. (2019). A Hybrid LSTM Neural Network for Energy Consumption Forecasting of Individual Households. IEEE Access, 7, 157633–157642. [CrossRef]
- Ookura, S., & Mori, H. (2020). An efficient method for wind power generation forecasting by LSTM in consideration of overfitting prevention. IFAC-PapersOnLine, 53(2), 12169–12174. [CrossRef]
- Sherstinsky, A. (2020). Fundamentals of Recurrent Neural Network (RNN) and Long Short-Term Memory (LSTM) network. Physica D: Nonlinear Phenomena, 404, 132306. [CrossRef]
- Kim, C. H. A. (2020). Machine Learning to Predict Cardiovascular Mortality from Electrocardiogram Data.
- Kim, T. Y., & Cho, S. B. (2019). Predicting residential energy consumption using CNN-LSTM neural networks. Energy, 182, 72–81. [CrossRef]
- Liu, T., Xu, C., Guo, Y., & Chen, H. (2019). A novel deep reinforcement learning based methodology for short-term HVAC system energy consumption prediction. International Journal of Refrigeration, 107, 39–51. [CrossRef]
- Sajjad, M., Khan, Z. A., Ullah, A., Hussain, T., Ullah, W., Lee, M. Y., & Baik, S. W. (2020b). A Novel CNN-GRU-Based Hybrid Approach for Short-Term Residential Load Forecasting. IEEE Access, 8, 143759–143768. [CrossRef]
- Beck, M., Pöppel, K., Spanring, M., Auer, A., Prudnikova, O., Kopp, M., Klambauer, G., Brandstetter, J., and Hochreiter, S, 763 xlstm: Extended long short-term memory. arXiv preprint arXiv:2405.04517, 2024. 764.
- Van Houdt, G., Mosquera, C., and Nápoles, G., A review on the long short-term memory model, Artif. Intell. Rev., vol. 53, 765 no. 8, pp. 5929-5955, 2020.
- Morcillo-Jimenez, R., Mesa, J., Gómez-Romero, J., Vila, M. A., & Martin-Bautista, M. J. (2024). Deep learning for prediction of energy consumption: an applied use case in an office building. Applied Intelligence, 54(7), 5813–5825. [CrossRef]
- Pipattanasomporn, M., Chitalia, G., Songsiri, J. et al. CU-BEMS, smart building electricity consumption and indoor environmental sensor datasets. Sci Data 7, 241 (2020). [CrossRef]
|
Disclaimer/Publisher’s Note: The statements, opinions and data contained in all publications are solely those of the individual author(s) and contributor(s) and not of MDPI and/or the editor(s). MDPI and/or the editor(s) disclaim responsibility for any injury to people or property resulting from any ideas, methods, instructions or products referred to in the content. |
© 2024 by the authors. Licensee MDPI, Basel, Switzerland. This article is an open access article distributed under the terms and conditions of the Creative Commons Attribution (CC BY) license (http://creativecommons.org/licenses/by/4.0/).
