Submitted:
25 October 2024
Posted:
25 October 2024
You are already at the latest version
Abstract
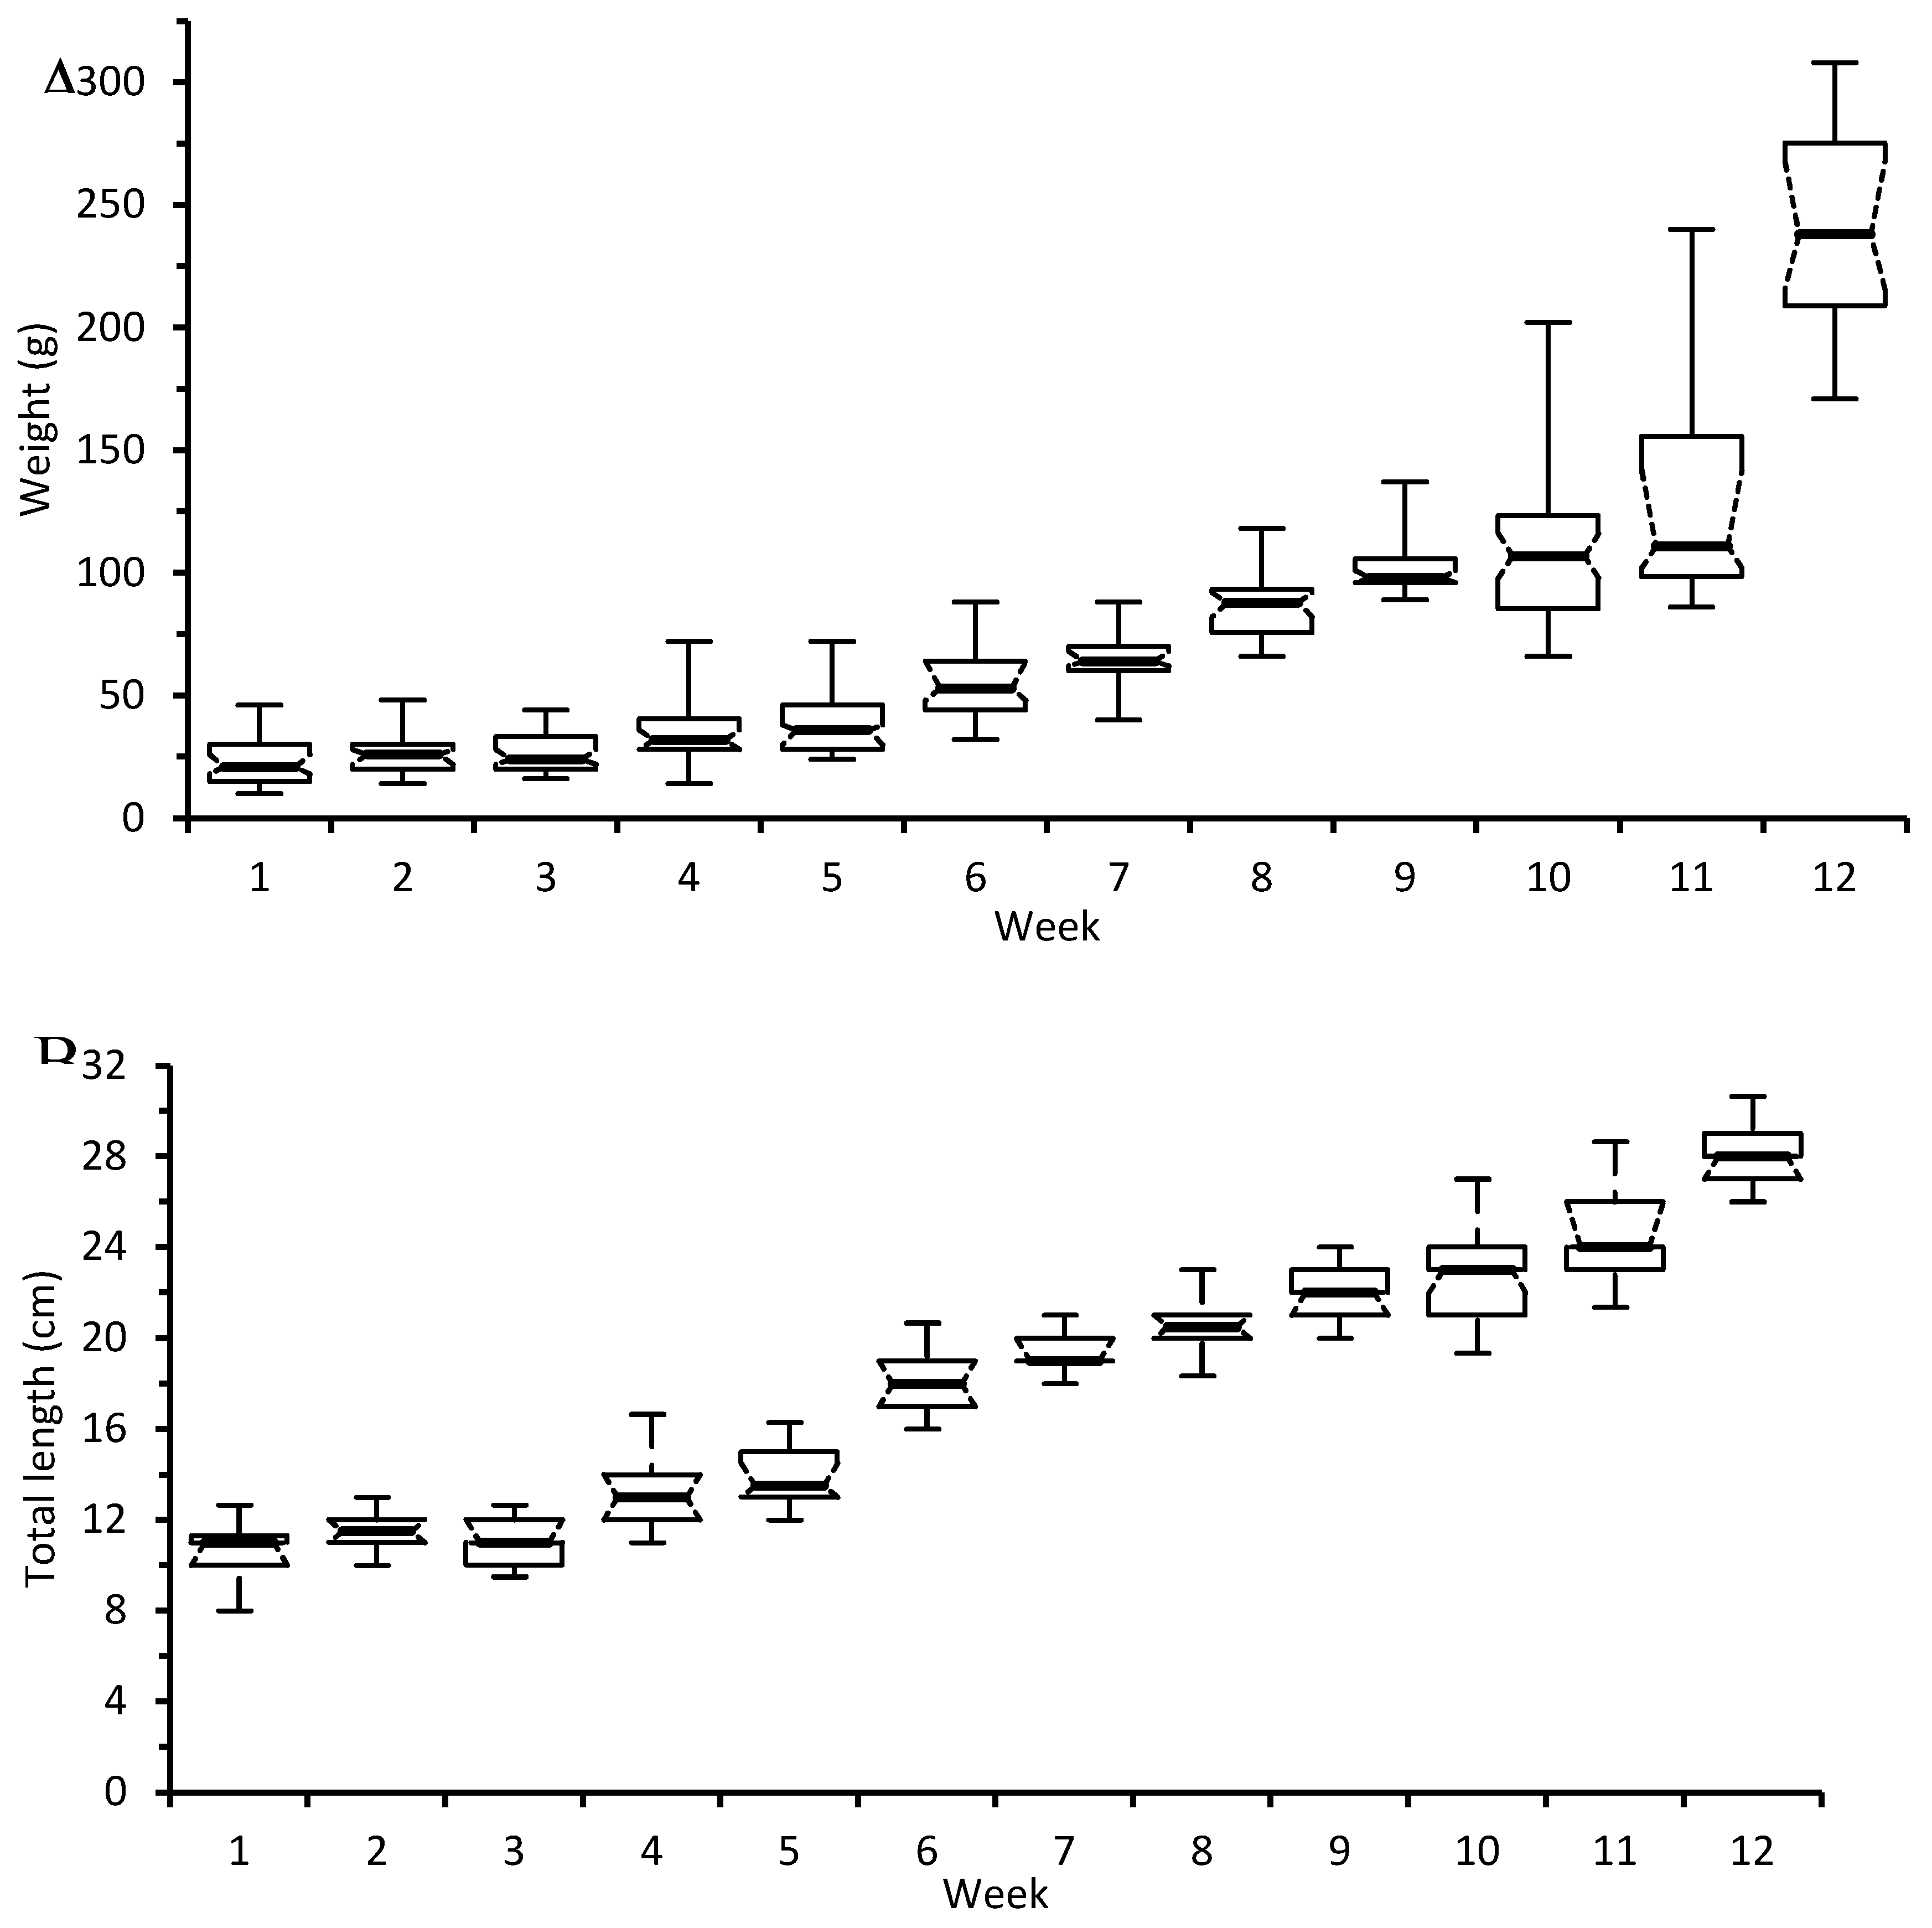
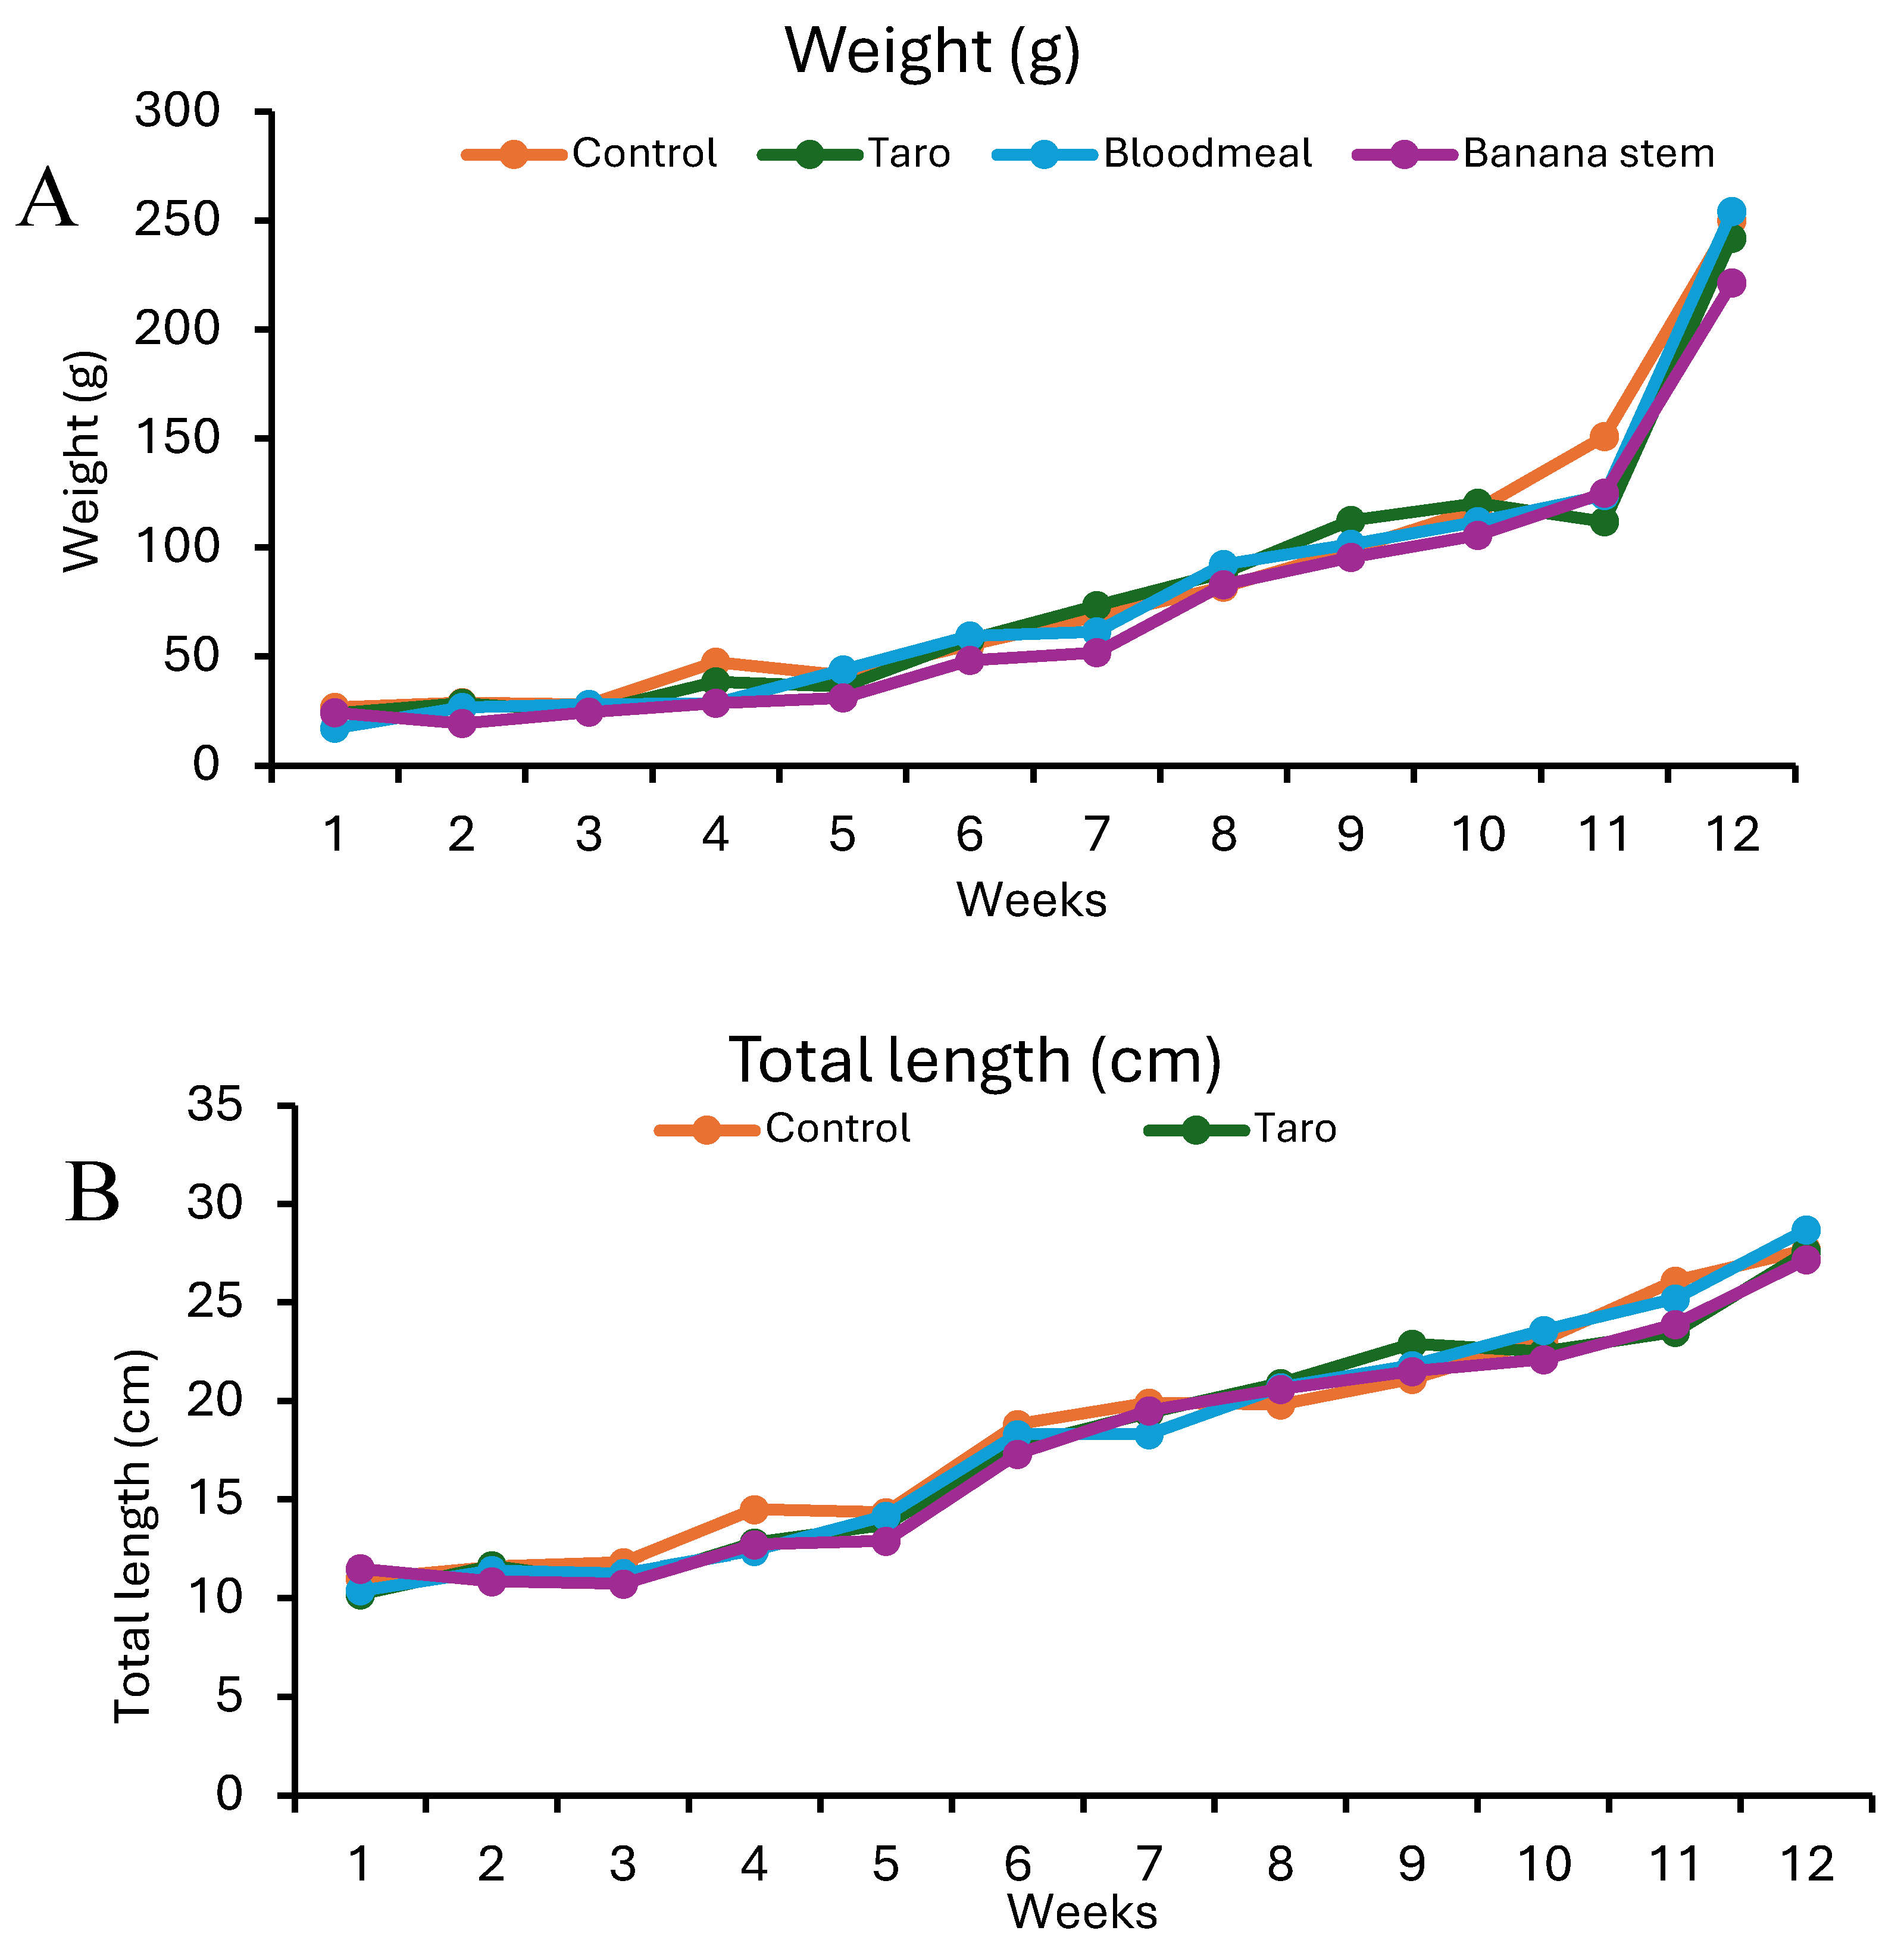
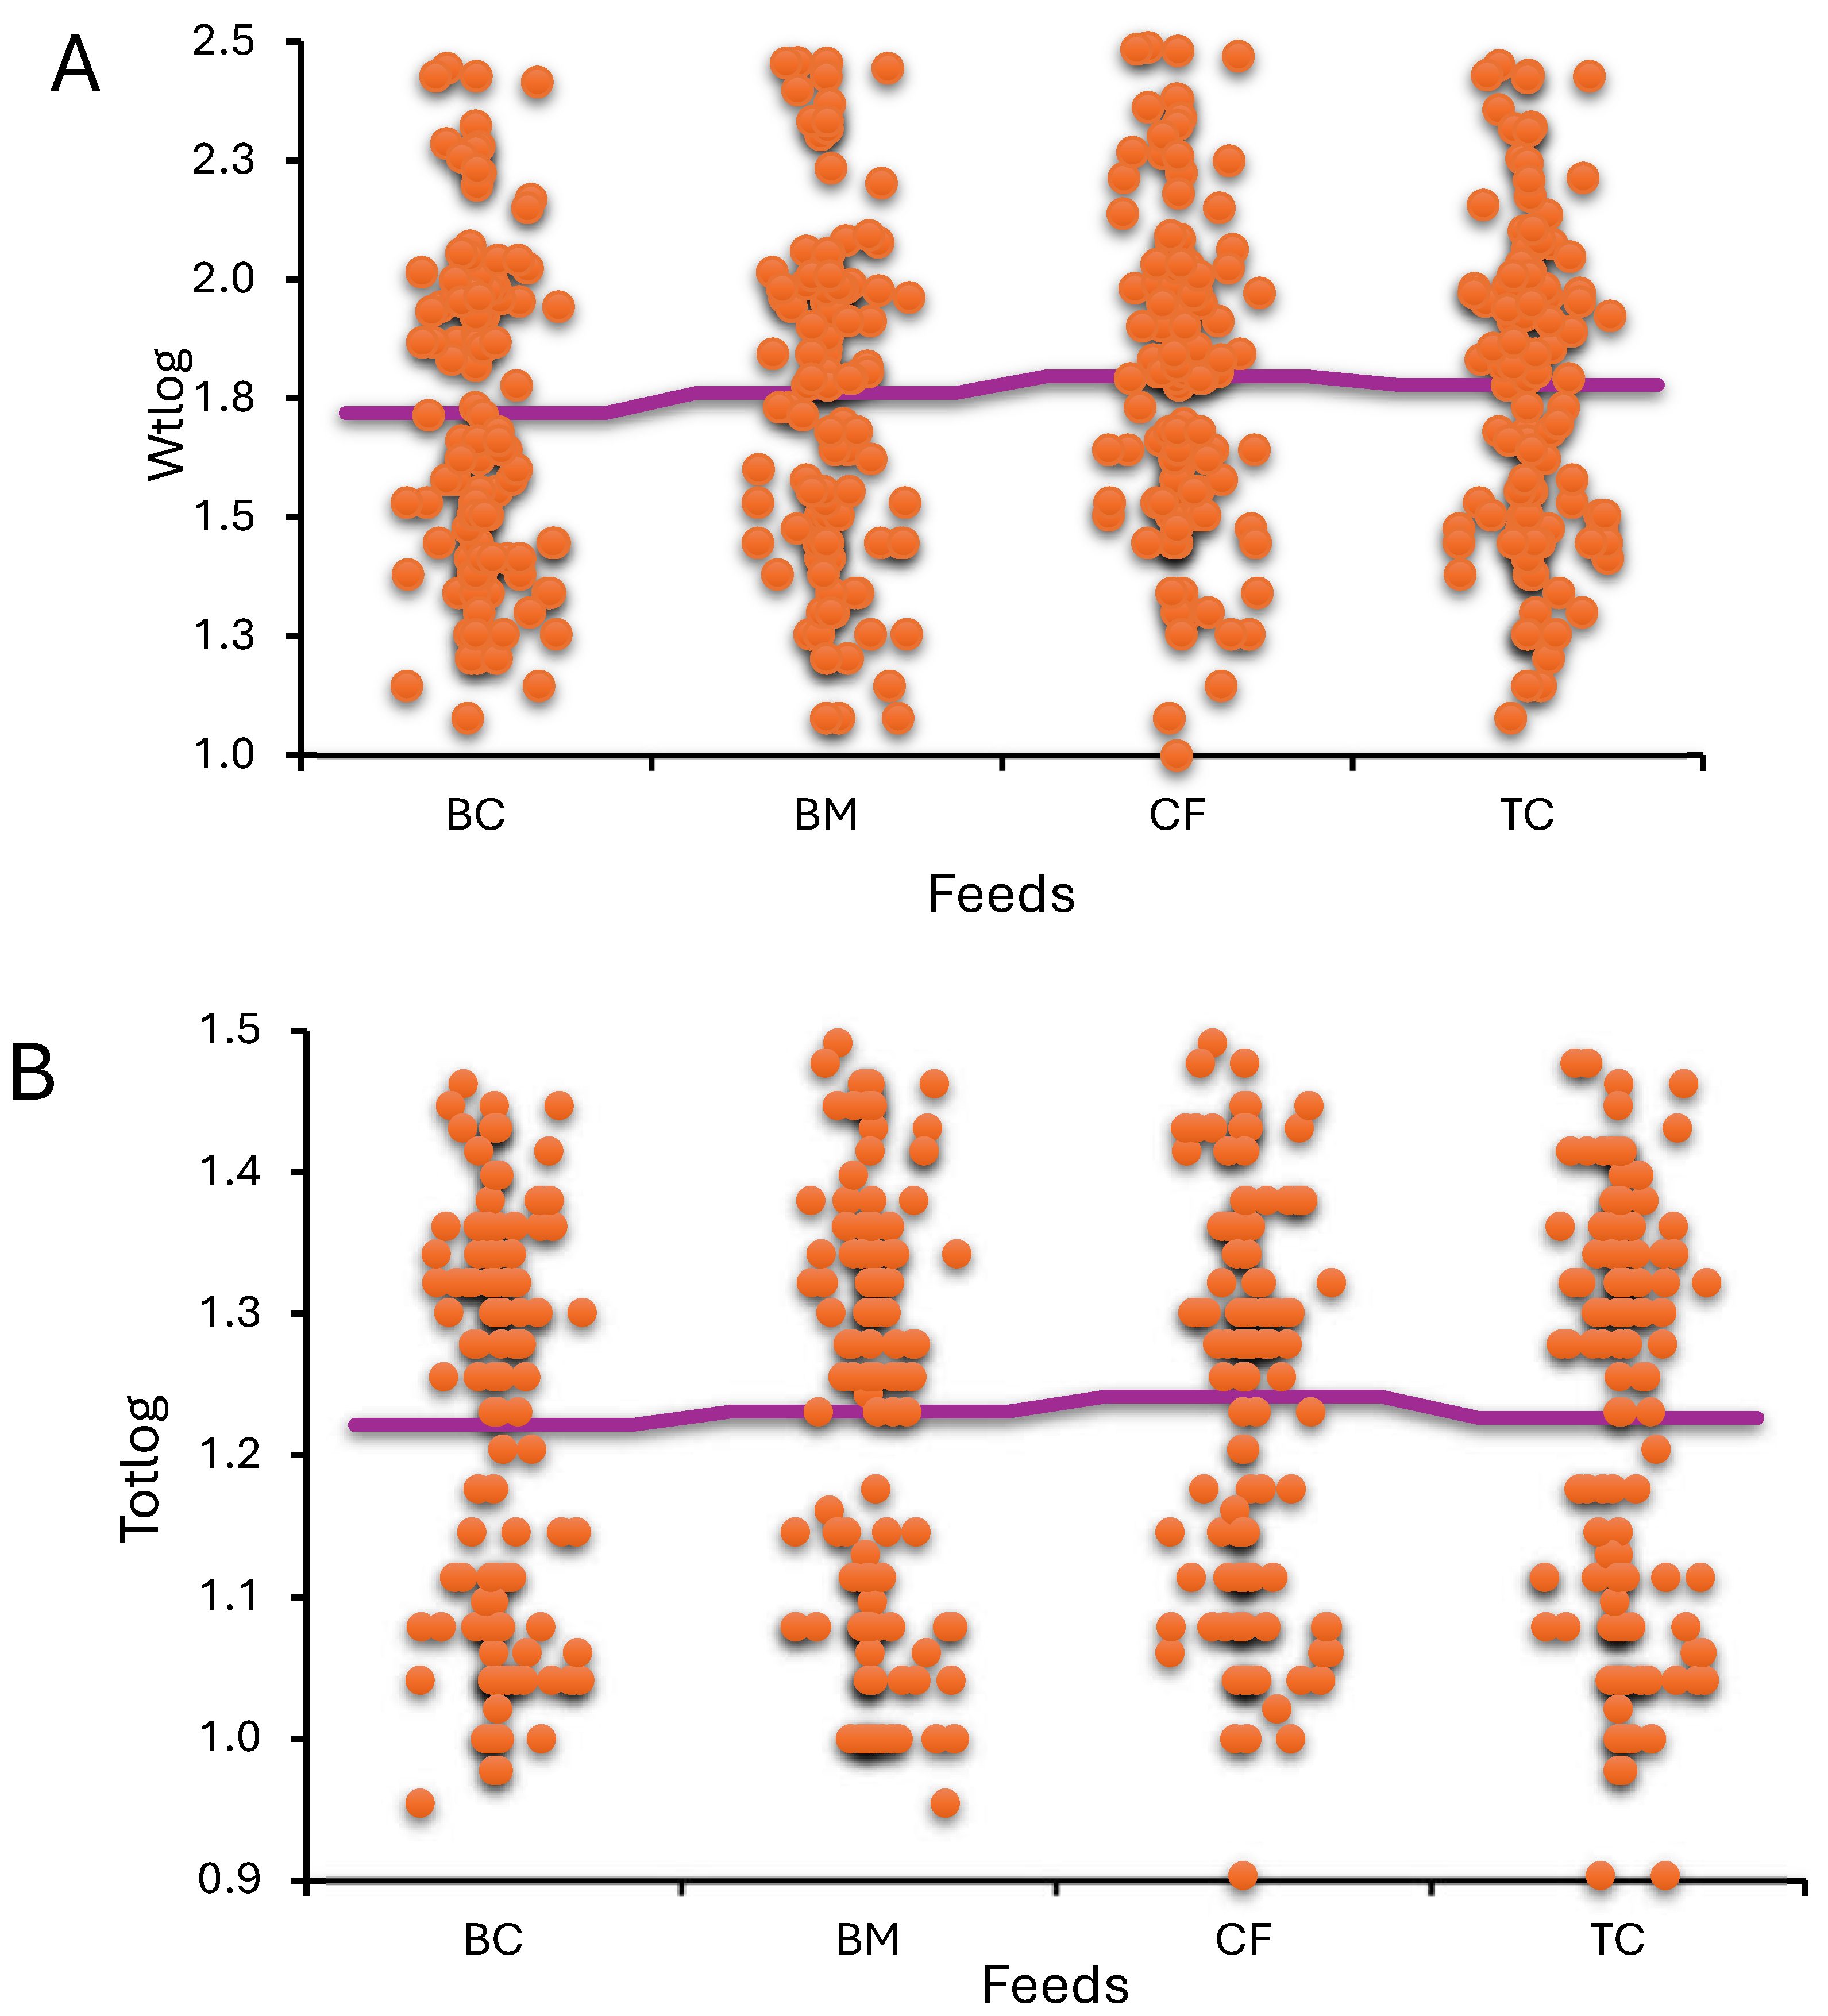
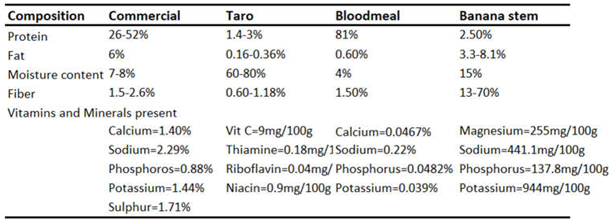
This study aimed to find alternative feeds or supplementary feeds that can perform similarly to the existing commercial feeds thereby reducing farmer expense and cutting down their cost of production and increasing their profitability. The formulations for the study included four grow-out treatments mainly: control (commercial feed), taro+control (powdered Colocasia esculenta+commercial fish feed), bloodmeal (formulated fish feed based on bloodmeal), banana stem+control (chopped banana stem+commercial fish feed). A total of 12,000 fingerlings initially weighing 16 g (TL=10 cm) individually were assigned randomly to the four treatments (3000 in each cage measuring 6 x 6 m). The result of the study showed no significant differences between feed treatments from 6th week onwards, whether with weight [MS=0.130, df=3, F=1.14, P=0.333] or total length of the treatments [MS=0.008, df=3, F=0.40, P=0.75]. The FCR ratio showed bloodmeal (1.60) as lowest, followed by the control (1.65), and taro+commercial (1.71) and then banana stem+commercial (2.18). In terms of weight gain, fish from the bloodmeal treatment gained the highest (236.97 g), followed by control (223.33 g), then taro (217.67 g) and banana stem (196.99 g). As a result, we find that any of the tested treatments can serve as an alternative feed to using purely commercial fish feeds. Cost-benefit analysis showed that a better gross profit margin of 42% and cost-benefit ratio of 1.37 was observed in taro+commercial feed diet.
Keywords:
Introduction
Materials and Methods
Description of Treatments
Description of Sampling
Data Analyses
Feed Ingredients and Proximate Analysis
Results of the Study
Cost-Benefit Analysis of Locally Sourced Alternative Feeds
Discussion
Feed Comparison
Contribution to Circular Economy
Cost-Effective Alternative Feeds
Conclusion
Appendix
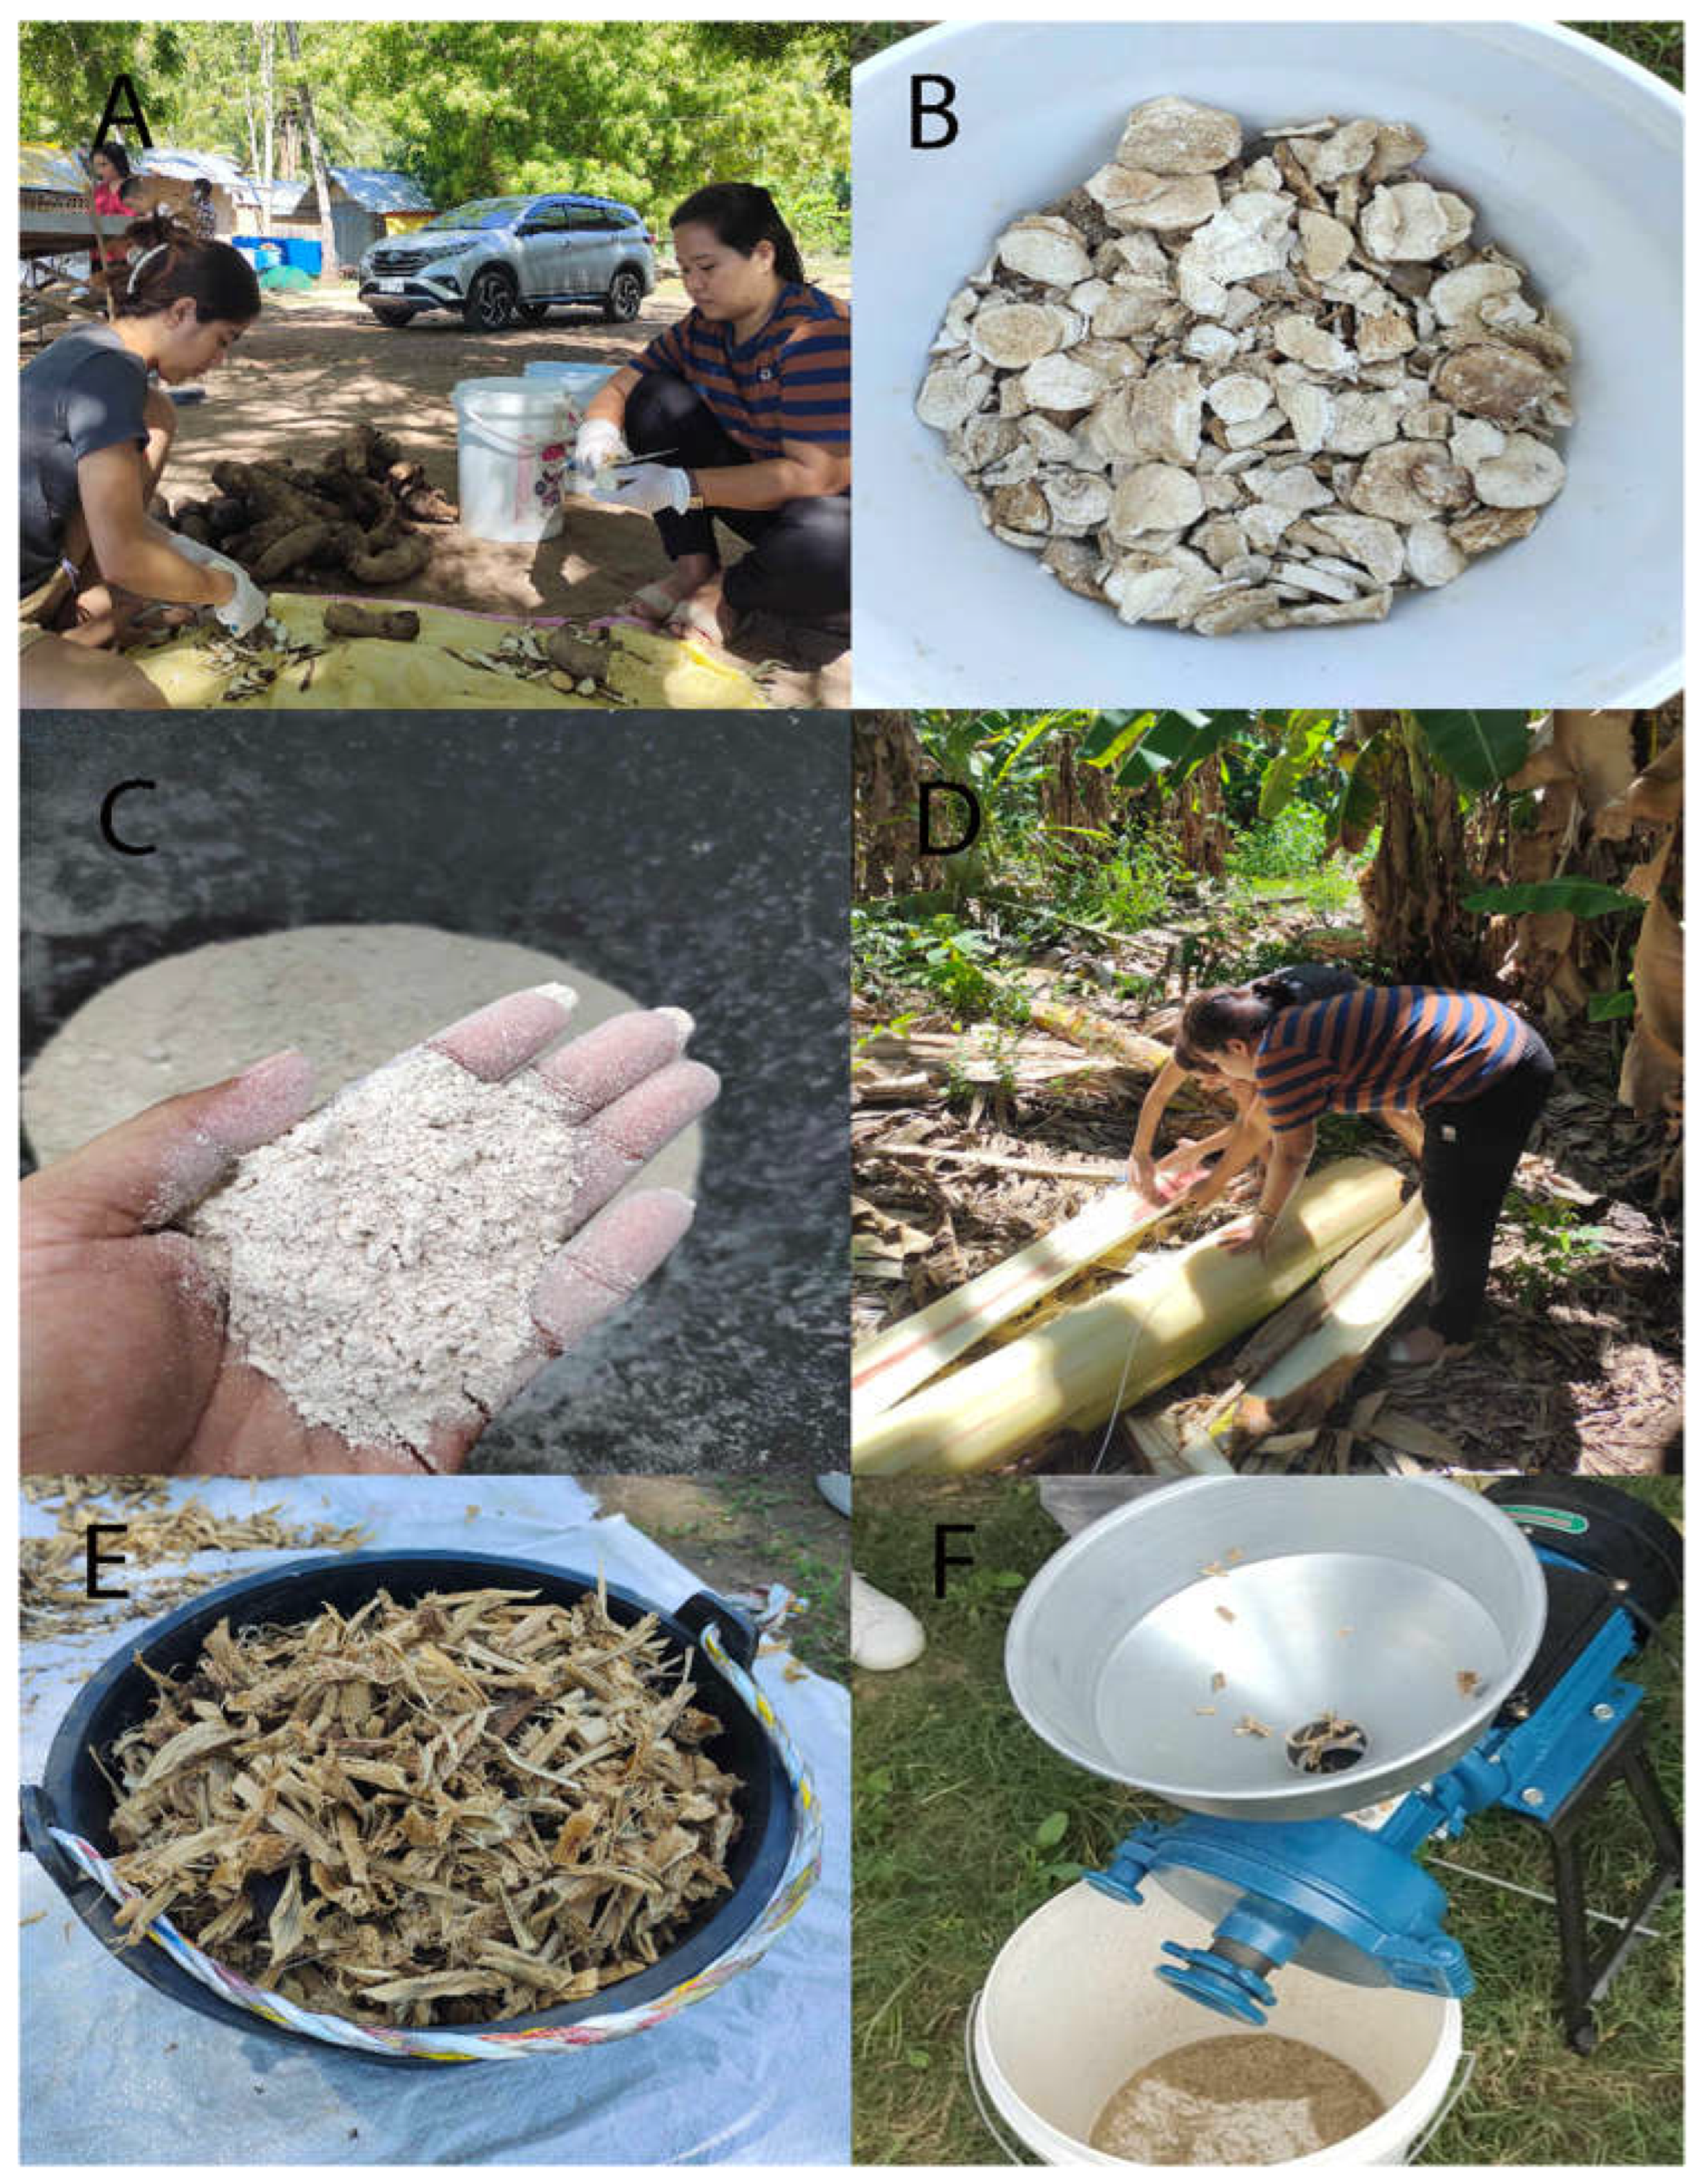
Appendix
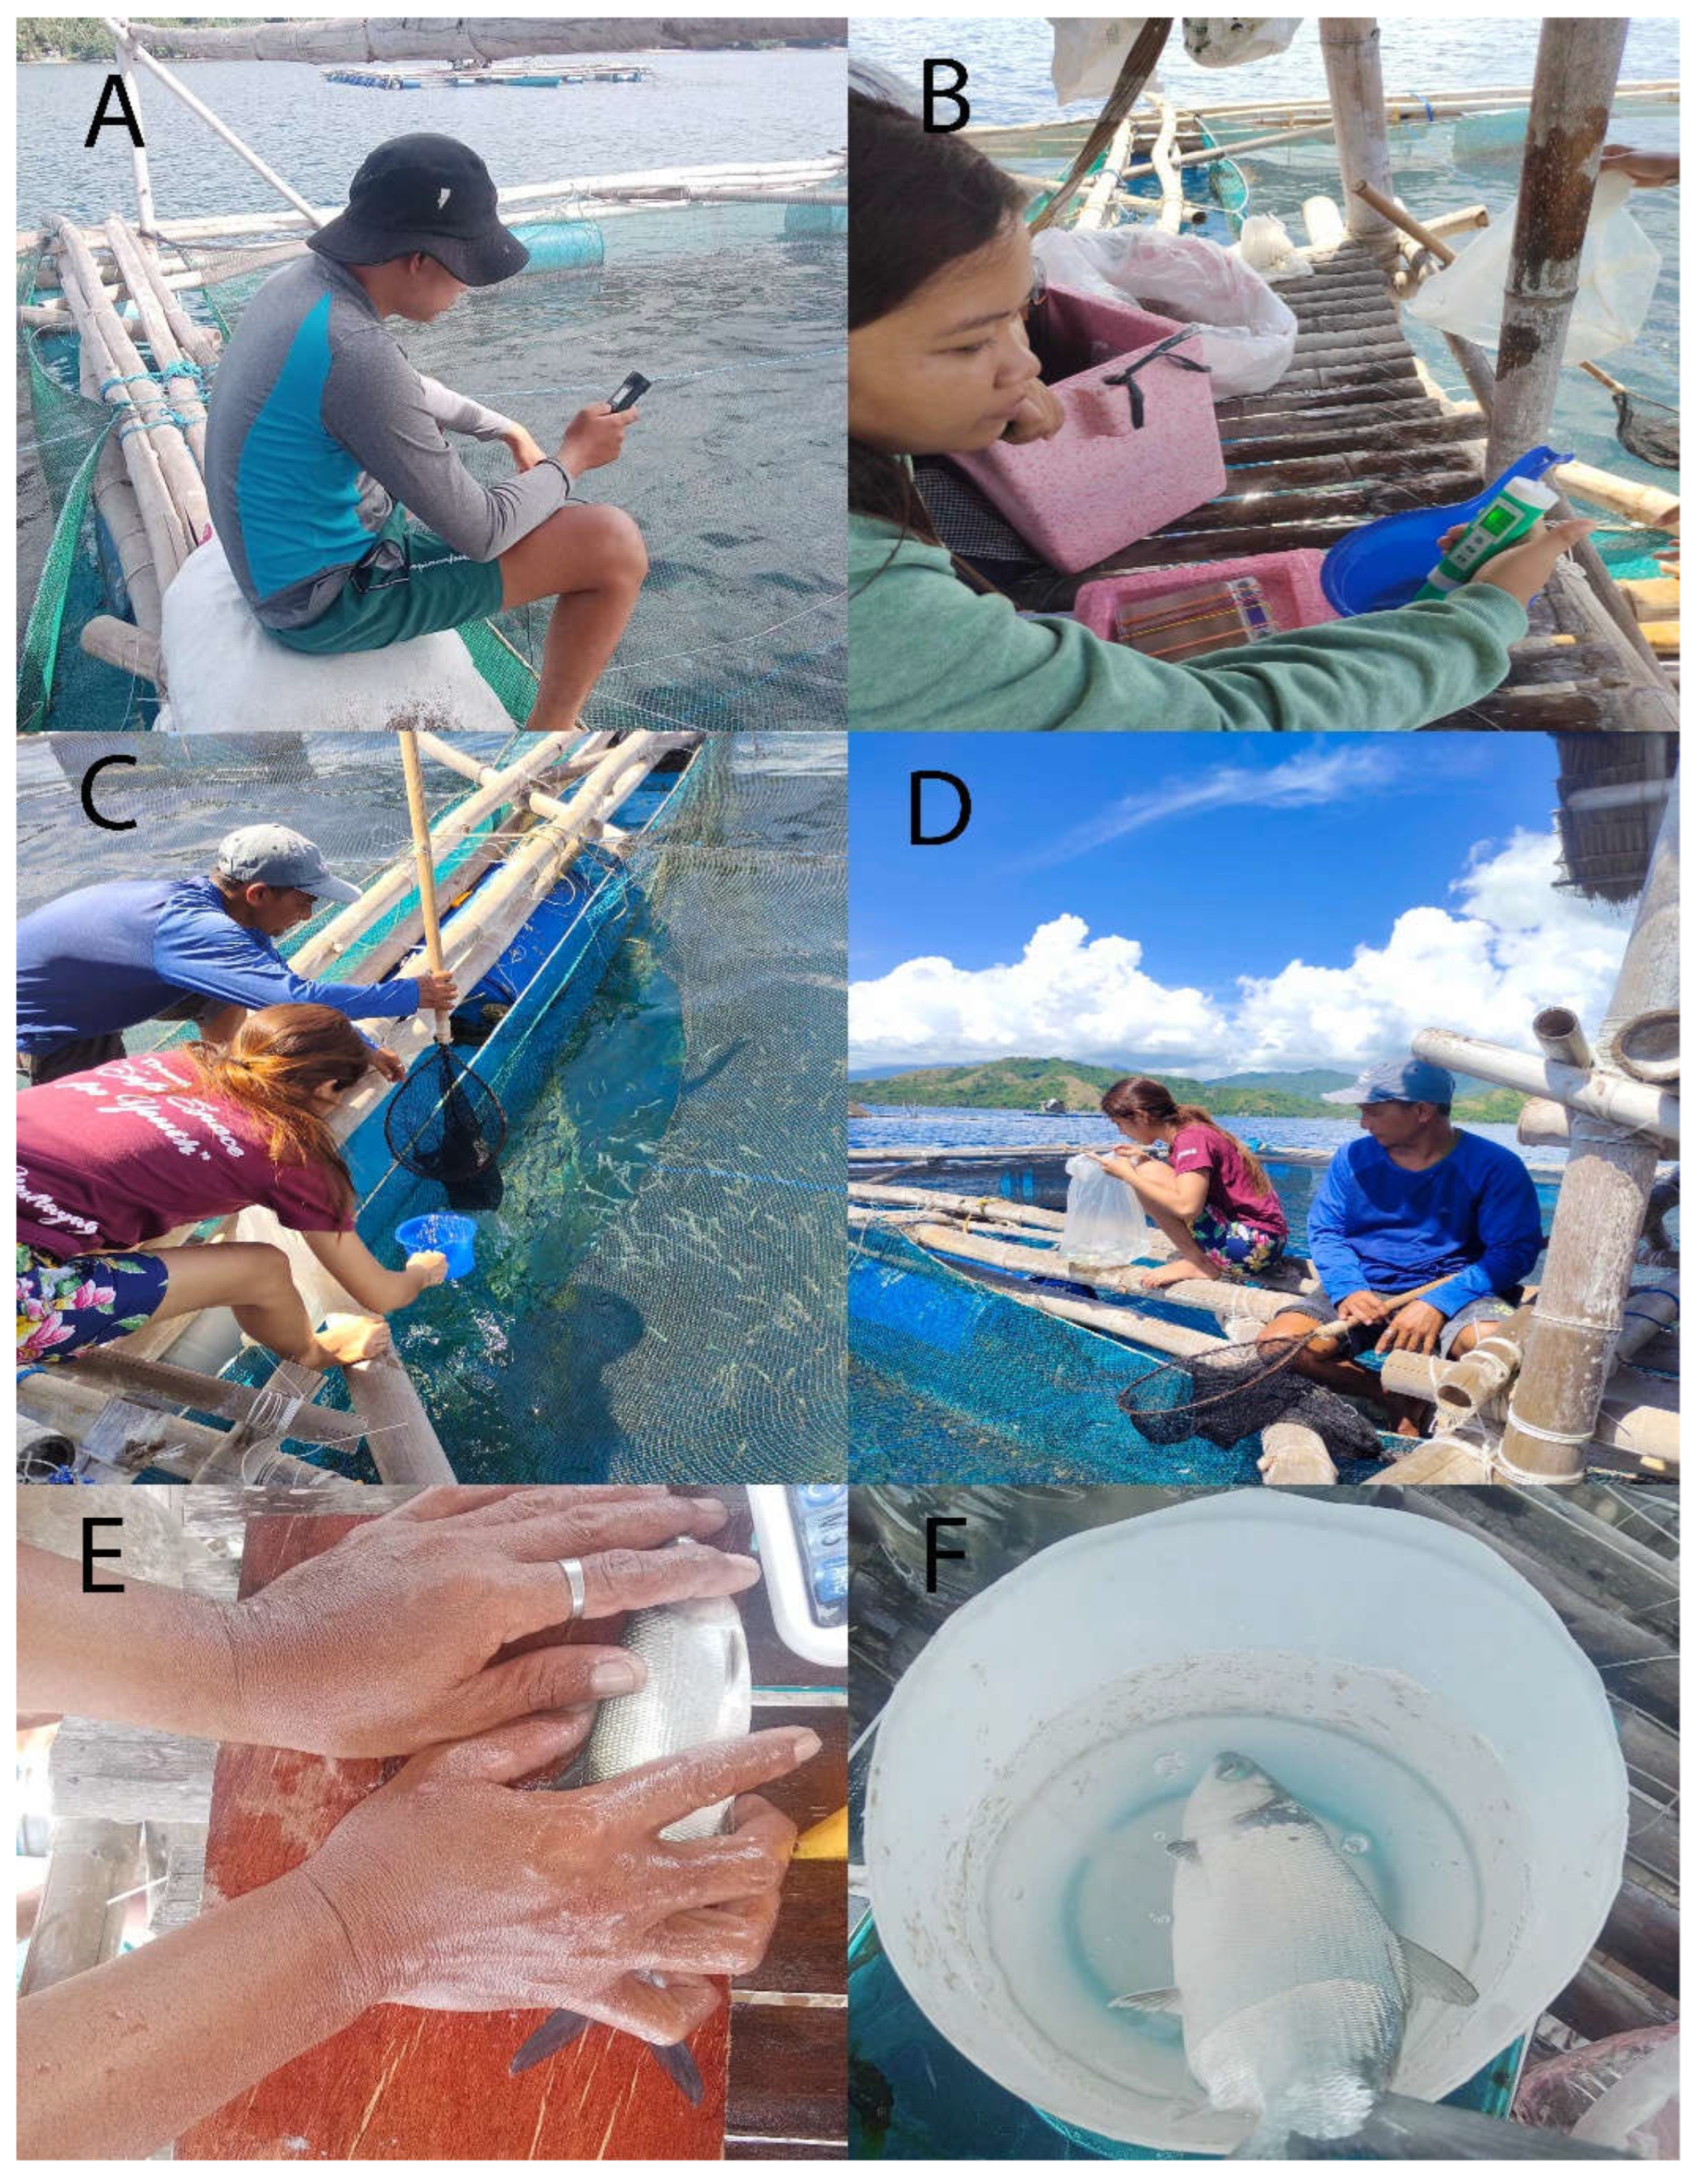
References
- Abreo, N.A.S.; Siblos, S.K.V.; Macusi, E.D. Anthropogenic Marine Debris (AMD) in Mangrove Forests of Pujada Bay, Davao Oriental, Philippines. Journal of Marine and Island Cultures 2020, 9, 38–53. [Google Scholar] [CrossRef]
- Aditika, S.; Kapoor, B.; Singh, S.; Kumar, P. Taro (Colocasia esculenta): Zero wastage orphan food crop for food and nutritional security. South African Journal of Botany 2021, 145, 1–13. [Google Scholar] [CrossRef]
- Agbo, N.W.; Adjei-Boateng, D.; Jauncey, K. The Potential of Groundnut (Arachis hypogaea L.) By-Products as Alternative Protein Sources in the Diet of Nile Tilapia (Oreochromis niloticus). Journal of Applied Aquaculture 2011, 23, 367–378. [Google Scholar] [CrossRef]
- Alzate Acevedo, S.; Díaz Carrillo, Á.J.; Flórez-López, E.; Grande-Tovar, C.D. Recovery of Banana Waste-Loss from Production and Processing: A Contribution to a Circular Economy. Molecules 2021, 26, 5282. [Google Scholar] [CrossRef]
- Audu, R.; Yola, I.A. Contemporary issues in fisheries and aquaculture: a review of conventional feed ingredients for fish feed in Nigeria. Bayero Journal of Pure and Applied Sciences 2020, 13, 22–28. [Google Scholar] [CrossRef]
- Aya, F.A. Utilizing alternative ingredients in aquafeeds for sustainable aquaculture. Fish for the People 2017, 15, 37–44. [Google Scholar]
- Bagarinao, T. 1999. Ecology and Farming of Milkfish. Southeast Asia Fisheries Aquaculture Department (SEAFDEC), Tigbauan, Iloilo.
- De Giosa, M.; Czerniejewski, P.; Rybczyk, A. Seasonal changes in condition factor and weight-length relationship of invasive carassius gibelio (Bloch, 1782) from Leszczynskie Lakeland, Poland. Advances in Zoology 2014. [Google Scholar] [CrossRef]
- Dou, Z.; Dierenfeld, E.S.; Wang, X.; Chen, X.; Shurson, G.C. A critical analysis of challenges and opportunities for upcycling food waste to animal feed to reduce climate and resource burdens. Resources, Conservation and Recycling 2024, 203, 107418. [Google Scholar] [CrossRef]
- Dou, Z.; Toth, J.D.; Westendorf, M.L. Food waste for livestock feeding: Feasibility, safety, and sustainability implications. Global Food Security 2018, 17, 154–161. [Google Scholar] [CrossRef]
- El-Sayed, A.-F.M. 2004. Protein nutrition of farmed Tilapia: Searching for unconventional sources, in: Bolivar, R.B.; Mair, G.C.; Fitzsimmons, K. (Eds.), Proceedings of the 6th international symposium on tilapia in aquaculture ISTA Publications, Manila, Philippines, pp. 364–378.
- Ewald, N.; Vidakovic, A.; Langeland, M.; Kiessling, A.; Sampels, S.; Lalander, C. Fatty acid composition of black soldier fly larvae (Hermetia illucens) - possibilities and limitations for modification through diet. Waste Management 2020, 102, 40–47. [Google Scholar] [CrossRef]
- FAO, 2009. State of world fisheries and aquaculture 2008. Food and Agriculture Organization of the United Nations, Rome, Italy.
- Froese, R. 2006. Cube law, condition factor, and weight–length relationships: history, meta-analysis, and recommendations. Journal of Applied Ichthyology, 22(4), 241-253. [CrossRef]
- Ganesan, A.R.; Mohan, K.; Kandasamy, S.; Surendran, R.P.; Kumar, R.; Rajan, D.K.; Rajarajeswaran, J. Food waste-derived black soldier fly (Hermetia illucens) larval resource recovery: A circular bioeconomy approach. Process Safety and Environmental Protection 2024, 184, 170–189. [Google Scholar] [CrossRef]
- Gasco, L.; Biancarosa, I.; Liland, N.S. From waste to feed: A review of recent knowledge on insects as producers of protein and fat for animal feeds. Current Opinion in Green and Sustainable Chemistry 2020, 23, 67–79. [Google Scholar] [CrossRef]
- Gatto, A.; Kuiper, M.; van Middelaar, C.; van Meijl, H. Unveiling the economic and environmental impact of policies to promote animal feed for a circular food system. Resources, Conservation and Recycling 2024, 200, 107317. [Google Scholar] [CrossRef]
- Gueco, L. 2022. The Philippine Banana Industry Roadmap (2021-2025). Department of Agriculture-Bureau of Agricultural Research, Quezon City, Philippines.
- Guerrero, R.D. 2019. Farmed tilapia production in the Philippines is declining: What has happened and what can be done. Philippine Journal of Science 148, XI-XV.
- Hoof, B.V.; Solano, A.; Riaño, J.; Mendez, C.; Medaglia, A.L. Decision-making for circular economy implementation in agri-food systems: A transdisciplinary case study of cacao in Colombia. J Clean Prod 2024, 434, 140307. [Google Scholar] [CrossRef]
- Jisr, N.; Younes, G.; Sukhn, C.; El-Dakdouki, M.H. Length-weight relationships and relative condition factor of fish inhabiting the marine area of the Eastern Mediterranean city, Tripoli-Lebanon. Egyptian Journal of Aquatic Research 2018, 44, 299–305.
- Lawal, M.O.; Aderolu, A.Z.; Ajayi, J.A.; Soyinka, O.O. Dietary effects of yam peels on the growth and haematology of Clarias gariepinus (Burchell, 1822) juveniles. Zoologist 2012, 10, 13–17. [Google Scholar]
- Lebot, V. 2020. Tropical root and tuber crops: cassava, sweet potato, yams, and aroids, 2nd ed. CABI.
- Liguez, A.K. Engine size and proportion of catch kept affects fish catch in Pujada Bay, Davao Oriental. Davao Research Journal 2021, 12, 22–33. [Google Scholar] [CrossRef]
- Loy, T.H.; Spriggs, M.; Wickler, S. Direct evidence for human use of plants 28,000 years ago-starch residues on stone artifacts from the northern Solomon Islands. Antiquity 1992, 66, 898–912. [Google Scholar] [CrossRef]
- Lukuyu, B.; Okike, I.; Duncan, A.; Beveridge, M.; Blümmel, M. 2014. Use of cassava in livestock and aquaculture feeding programs. International Livestock Research Institute (ILRI) Addis Ababa, Ethiopia, pp. 1–83.
- Macusi, E.D. 2017. Fish Aggregating Devices and the Role of Socio-economic Factors in Driving Spatial Effort Allocation of Fishers. SOUTHEAST ASIAN REGIONAL CENTER FOR GRADUATE STUDY AND RESEARCH IN AGRICULTURE, Los Banos, Laguna Philippines.
- Macusi, E.D.; Cayacay, M.A.; Borazon, E.Q.; Sales, A.C.; Habib, A.; Fadli, N.; Santos, M.D. Protein Fishmeal Replacement in Aquaculture: A Systematic Review and Implications on Growth and Adoption Viability. Sustainability 2023, 15, 12500. [Google Scholar] [CrossRef]
- Macusi, E.D.; Macusi, E.S.; Bongas, H.P.; Cayacay, M.A. Typology of milkfish (Chanos chanos) farms: Their operations, socio-economic viability, and challenges. Preprints 2023, 2023120507. [Google Scholar]
- Macusi, E.D.; Macusi, E.S.; Jimenez, L.A.; Catam-isan, J.P. Climate change vulnerability and perceived impacts on small-scale fisheries in eastern Mindanao. Ocean & Coastal Management 2020, 189, 105143. [Google Scholar]
- Macusi, E.D.; Morales, I.D.; Abreo, N.A.S.; Jimenez, L.A. Perception of solid waste management and rate of accumulation in schools in Mati City, Mindanao island, Philippines. Journal of Marine and Island Cultures 2019, 8, 113–131. [Google Scholar] [CrossRef]
- Macusi, E.D.; Siblos, S.K.V.; Betancourt, M.E.S.; Macusi, E.S.; Calderon, M.N.; Bersaldo, M.J.I.; Digal, L.N. Impacts of COVID-19 on the catch of small-scale fishers and their families due to restriction policies in Davao Gulf, Philippines. Frontiers in Marine Science 2022, 8, 770543. [Google Scholar] [CrossRef]
- Macusi, E.S.; Sales, A.C.; Macusi, E.D.; Bong-as, H.P.; Cayacay, M.A.; Omandam, J.L.; Schüler, M.; Vidal, C. . Indigenous Knowledge Systems and Practices (IKSP), Livelihood Resources and Aspirations of the Matigsalog and Ata Tribes. Sustainability 2023, 15, 1–15. [Google Scholar] [CrossRef]
- Matthews, P.J.; Agoo, E.M.G.; Tandang, D.N.; Madulid, D.A. 2012. Ethnobotany and ecology of wild taro (Colocasia esculenta) in the Philippines: implications for domestication and dispersal, in: Spriggs, M.; Addison, D.; Matthews, P.J. (Eds.), Irrigated Taro (Colocasia esculenta) in the Indo-Pacific. National Museum of Ethnology, Osaka, Japan, p. 363.
- Maynawang, I.; Peralez, C.; Lorenzo, H.; Macusi, E. Role of women and coastal livelihood in the small-scale fisheries (SSF) of Lupon and Governor Generoso, Davao Oriental. Davao Research Journal 2021, 12, 10–21. [Google Scholar] [CrossRef]
- McLean, E. 2023. 4.23 - Feed Ingredients for Sustainable Aquaculture, in: Ferranti, P. (Ed.), Sustainable Food Science - A Comprehensive Approach. Elsevier, Oxford, pp. 392–423.
- Medhekar, A. 2024. Chapter 2 - Circular economy in agriculture and sustainable development, in: Machado, C.F.; Davim, J.P. (Eds.), Circular Economy and Manufacturing. Woodhead Publishing, pp. 15–31.
- Molina-Poveda, C.I. edited by 2016. Nutrient requirements, in: Nates, S.F. (Ed.), Aquafeed formulation. Academic Press, Walthan, Massachussets, p. 279.
- Morato, T.; Afonso, P.; Loirinho, P.; Barreiros, J.P.; Sanstos, R.S.; Nash, R.D.M. Length-weight relationships for 21 costal fish species of the Azores, North-eastern Atlantic. Fisheries Research 2001, 50, 297–302. [Google Scholar] [CrossRef]
- Mujtaba, M.; Fernandes Fraceto, L.; Fazeli, M.; Mukherjee, S.; Savassa, S.M.; Araujo de Medeiros, G.; do Espírito Santo Pereira, A.; Mancini, S.D.; Lipponen, J.; Vilaplana, F. Lignocellulosic biomass from agricultural waste to the circular economy: a review with focus on biofuels, biocomposites and bioplastics. J Clean Prod 2023, 402, 136815. [Google Scholar] [CrossRef]
- Munguti, J.; Charo-Karisa, H.; Opiyo, M.A.; Ogello, E.O.; Marijani, E.; Nzayisenga, L.; Liti, D. Nutritive value and availability of commonly use feed ingredients for farmed Nile Tilapia (Oreochromis niloticus) and African catfish (Clarias gariepinus) in Kenya, Rwanda and Tanzania. African Journal of Food, Agriculture, Nutrition and Development 2012, 12. [Google Scholar] [CrossRef]
- Najar, I.N.; Sharma, P.; Das, R.; Tamang, S.; Mondal, K.; Thakur, N.; Gandhi, S.G.; Kumar, V. From waste management to circular economy: Leveraging thermophiles for sustainable growth and global resource optimization. J Environ Manage 2024, 360, 121136. [Google Scholar] [CrossRef]
- Onsay, E.A.; Baltar, K.C.; Galicia, E.R.; Pesino, I.R.C. 2022. The Dynamics of Taro (Colocasia esculenta) through Value Chain Analysis and Crop Accounting in Partido District, Camarines Sur, the Philippines, in: Orhan, Ö. (Ed.), Sustainable Rural Development Perspective and Global Challenges. IntechOpen, Rijeka, p. Ch. 8.
- Pratiwi, D.Y.; Andhikawati, A. Utilization of Water Hyacinth (Eichhornia crassipes) as Fish Feed Ingredient. Asian Journal of Fisheries Aquatic Resources 2021, 35–42. [Google Scholar] [CrossRef]
- Provin, A.P.; Medeiros d’Alva, A.; de Aguiar Dutra, A.R.; Salgueirinho Osório de Andrade Guerra, J.B.; Leal Vieira Cubas, A. Closing the cycle: Circular economy strategies for the textile industry using banana farming waste. J Clean Prod 2024, 470, 143352. [Google Scholar] [CrossRef]
- Quintero-Herrera, S.; Zwolinski, P.; Evrard, D.; Cano-Gómez, J.J.; Rivas-García, P. Turning food loss and waste into animal feed: A Mexican spatial inventory of potential generation of agro-industrial wastes for livestock feed. Sustainable Production and Consumption 2023, 41, 36–48. [Google Scholar] [CrossRef]
- Rana, K.J.; Siriwardena, S.; Hasan, M.R. 2009. Impact of rising feed ingredient prices on aquafeeds and aquaculture production, FAO Fisheries and Aquaculture Technical Paper 541. Food and Agriculture Organization (FAO), Rome.
- Sehgal, H.S.; Sharma, S. A note on evaluation of some wastes and by-products from agriculture and animal husbandry as feed ingredients for Cirrhina mrigala (Ham. ). Bioresource Technology 1993, 44, 9–11. [Google Scholar] [CrossRef]
- Siddique, S.; Grassauer, F.; Arulnathan, V.; Sadiq, R.; Pelletier, N. 2024. A review of life cycle impacts of different pathways for converting food waste into livestock feed. Sustainable Production and Consumption.
- Sun, X.; Dou, Z.; Shurson, G.C.; Hu, B. Bioprocessing to upcycle agro-industrial and food wastes into high-nutritional value animal feed for sustainable food and agriculture systems. Resources, Conservation and Recycling 2024, 201, 107325. [Google Scholar] [CrossRef]
- Tahamtani, F.M.; Ivarsson, E.; Wiklicky, V.; Lalander, C.; Wall, H.; Rodenburg, T.B.; Tuyttens, F.A.M.; Hernandez, C.E. Feeding live Black Soldier Fly larvae (Hermetia illucens) to laying hens: effects on feed consumption, hen health, hen behavior, and egg quality. Poultry Sci 2021, 100, 101400. [Google Scholar] [CrossRef]
- Ulloa, J.B.; van Weerd, J.H.; Huisman, E.A.; Verreth, J.A.J. Tropical agricultural residues and their potential uses in fish feeds: the Costa Rican situation. Waste Management 2004, 24, 87–97. [Google Scholar] [CrossRef]
- Upadhyay, S.K.; Singh, G.; Rani, N.; Rajput, V.D.; Seth, C.S.; Dwivedi, P.; Minkina, T.; Wong, M.H.; Show, P.L.; Khoo, K.S. Transforming bio-waste into value-added products mediated microbes for enhancing soil health and crop production: Perspective views on circular economy. Environmental Technology & Innovation 2024, 34, 103573. [Google Scholar]
- van Huis, A.; van Itterbeeck, J.; Klunder, H.; Mertens, E.; Halloran, A.; Muir, G.; Vantomme, P. 2013. Edible Insects: Future Prospects for Food and Feed Security. FAO, Rome, Italy.
- Wanapat, M.; Suriyapha, C.; Dagaew, G.; Prachumchai, R.; Phupaboon, S.; Sommai, S.; Matra, M. The recycling of tropical fruit peel waste-products applied in feed additive for ruminants: Food manufacturing industries, phytonutrient properties, mechanisms, and future applications. Journal of Agriculture and Food Research 2024, 17, 101234. [Google Scholar] [CrossRef]
- Windarto, S.; Nengsi, D.R.; Putro, S.P.; Widowati, W.; Adi, S.; Anggraeni, N.; Herawati, V.E. Effect of Fish Meal Substitution Using Maggot Flour (Hermetia illucens) on Growth Performance, Feed Utilization Efficiency, Protein Retention and Body Composition of the Milkfish (Chanos chanos). Egyptian Journal of Aquatic Biology & Fisheries 2023, 27, 933–953. [Google Scholar]
- Wong, M.-H.; Mo, W.-Y.; Choi, W.-M.; Cheng, Z.; Man, Y.-B. Recycle food wastes into high quality fish feeds for safe and quality fish production. Environmental Pollution 2016, 219, 631–638. [Google Scholar] [CrossRef]

| Technical basis | Treatments | ||||
|---|---|---|---|---|---|
| Commercial | Taro+Commercial | Bloodmeal | Banana Stem+Commercial | SEM |
|
| Stocking density | 3000 | 3000 | 3000 | 3000 | - |
| Culture period (days) | 84 | 84 | 84 | 84 | - |
| Initial ABW (g) | 18 | 19.2 | 17 | 19.6 | 0.49 |
| Final ABW (g) | 249.93 | 241.67 | 253.965 | 221.185 | 7.30 |
| Weight gain (g) | 223.33 | 217.67 | 236.97 | 196.99 | 8.31 |
| % Ave. weight gain | 1053.34 | 1103.71 | 1476.35 | 898.62 | - |
| Ave daily weight gain (g) | 2.66 | 2.59 | 2.82 | 2.35 | 0.10 |
| Specific growth rate (%) | 3.93 | 3.96 | 4.55 | 3.72 | 0.18 |
| Survival Rate (%) | 90 | 89 | 87 | 77 | 2.98 |
| Feed Conversion Ratio | 1.65 | 1.71 | 1.60 | 2.18 | 0.13 |
| Protein Efficiency Ratio | 1.31 | 3.21 | 0.97 | 1.36 | 0.51 |
| Fulton’s Condition Factor | 1.17 | 1.15 | 1.07 | 1.09 | 0.02 |
| Yield (kg) | 674.81 | 645.26 | 662.85 | 510.94 | 37.99 |
| Operational Cost (Php) | |||||
| Cost of fingerlings | 16,250 | 16,250 | 16,250 | 16,250 | - |
| Labor expense | 7,500 | 7,500 | 7,500 | 7,500 | - |
| Cost of feed consumed | 52,109.76 | 32,140.80 | 44,461.44 | 27,190.77 | - |
| Cost per kilogram of feeds | 52.53 | 32.4 | 44.82 | 27.41 | 5.73 |
| Total cost of production | 75,857.78 | 55,894.77 | 68,191.60 | 50,934.77 | 7.76 |
| Return (Php) | |||||
| Revenue | 101,221.65 | 96,788.84 | 99,427.30 | 76,641.00 | 5.76 |
| Gross Profit | 25,363.87 | 40,894.07 | 31,235.70 | 25,706.23 | 3.54 |
| Gross Profit Margin (%) | 25.06 | 42.25 | 31.42 | 33.54 | 3.55 |
| Cost-Benefit Ratio | 2.99 | 1.37 | 2.18 | 1.98 | 0.33 |
| *Note: Buying price at 150/kg | |||||
Disclaimer/Publisher’s Note: The statements, opinions and data contained in all publications are solely those of the individual author(s) and contributor(s) and not of MDPI and/or the editor(s). MDPI and/or the editor(s) disclaim responsibility for any injury to people or property resulting from any ideas, methods, instructions or products referred to in the content. |
© 2024 by the authors. Licensee MDPI, Basel, Switzerland. This article is an open access article distributed under the terms and conditions of the Creative Commons Attribution (CC BY) license (http://creativecommons.org/licenses/by/4.0/).


