
Submitted:
31 August 2024
Posted:
03 September 2024
You are already at the latest version
Abstract
This study examines the combined influence of both meteorological and non-climatic factors on rice production in Bangladesh between 1990 and 2020, using the Autoregressive Distributed Lag (ARDL) model. The key variables consist of temperature, precipitation, urbanisation, fertiliser management (specifically potassium levels), and the area of permanent crops. The findings highlight the substantial detrimental impact of temperature on rice output over a prolonged period, whereas precipitation and urbanisation have a favourable affect on rice productivity. However, the utilisation of potassium fertiliser has a detrimental effect on crop productivity. Furthermore, it has been demonstrated that the development of permanent crop fields has a beneficial effect on rice output. These findings provide important information for policymakers and agricultural stakeholders, highlighting the need for adaptive strategies to improve the ability of rice production to withstand the impacts of climate change and urbanisation. The significance of these discoveries applies to rice-producing regions worldwide, offering a strategic blueprint for sustainable cultivation of rice and ensuring food security.
Keywords:
Temperature
; Precipitation
; Rice cultivation
; Food security
; Climate Change
; Bangladesh
1. Introduction
Climate change represents a mounting global challenge with significant implications for agriculture in both developed and developing nations (Mackay, 2008). In Bangladesh, where agriculture is critical for national food security and rural livelihoods, rice production is particularly vulnerable to climatic variations, which exacerbate food insecurity (Islam & Nursey-Bray, 2017). Climate change has wide-ranging repercussions that go beyond agriculture and impact other industries across the worldwide economy (Chandio et al., 2020; Wang et al., 2018), with increasing occurrence and strength of climatic phenomena further compromising food security through adverse impacts on agricultural outputs (Beggs, 2009; Ziska et al., 2016). Temperature fluctuations significantly influence rice production, where initial increases might boost yields but prolonged high temperatures reduce productivity (Dutta, 2014; Gunathilaka et al., 2017; Marx et al., 2017). Rice cultivation is extremely susceptible to climatic changes due to the intricate interplay of heat, humidity, and water. Bangladesh has been particularly affected by extreme climatic events, including droughts, heavy rainfall, and cold spells. Additionally, the daily average temperatures in the country have increased by 0.103 °C over the last four decades (Shahid et al., 2012). Precipitation variability also affects rice growth cycles and yields, with shifting rainfall patterns disrupting productivity (Mallik & Ghosh, 2021).
Rural-to-urban migration, motivated by financial prospects, education, and healthcare access, has altered Bangladesh’s demographic landscape, with around 36% of the people living now residing in urban areas, impacting agricultural labor and productivity (USDA, 2023). Effective nutrient management, such as using both natural and man-made fertilisers, and the cultivation of permanent crops, such as perennial fruit trees, are essential for enhancing rice yields and sustaining agricultural productivity (USDA, 2023). Globally, rice is a staple for over 3 billion people, with Bangladesh being a major consumer with an average per capita consumption of 160-200 kg per year, resulting in a national consumption of 27-34 million metric tons annually. Bangladesh imports between 0.5 to 2 million metric tons of rice annually during production shortfalls and exports 0.1 to 0.3 million metric tons (FAO, 2021, 2023; USDA, 2023). The country’s rice food security policy emphasizes production enhancement through research and technology, market regulation, food security programs, climate adaptation, and sustainable agricultural practices (USDA, 2023).
The significance of the study for rice production lies innumerous critical components:
- (a)
- Investigating the effects of climate change factors including precipitation and temperature on rice production is crucial for comprehensively assessing the vulnerabilities and opportunities within the rice industry. By focusing on these specific climatic variables, this research expands our understanding of how changes in climate patterns influence rice cultivation practices, yields, and overall agricultural sustainability.
- (b)
- In addition to climate change factors, examining non-climatic factors such as urbanization, nutrient management (potassium levels), and the extent of permanent crops area provides valuable insights into the multifaceted dynamics shaping rice production. These non-climatic factors, influenced by human activities and land-use changes, interact with climatic variables to affect rice cultivation practices and productivity. Understanding their impacts is essential for developing holistic strategies to address challenges and capitalize on opportunities within the rice industry.
- (c)
- This research equips policymakers, stakeholders, and agricultural practitioners with evidence-based perspectives on the intricate interactions between climate change factors and non-climatic variables on rice production. This study elucidates the immediate and long-term impacts of these elements, so facilitating the formulation of focused policies and interventions to strengthen the resilience of the rice industry. Such evidence-based decision-making is crucial for ensuring economic stability, safeguarding livelihoods, and promoting sustainable rice production practices in geographic regions where rice cultivation is prevalent.
- (d)
- While the fundamental focus of this research is Bangladesh, its findings have broader relevance for rice-growing regions worldwide facing similar agricultural challenges. The knowledge generated from this study can be adapted and applied to various rice-producing areas globally, offering a strategic roadmap for mitigating climate-related and non-climatic obstacles to rice production. By sharing insights and best practices, this research contributes to international efforts aimed at securing a sustainable future for rice cultivation and ensuring food security on a global scale.
Expanding on the background information provided, this study aims to examine the possible reciprocal impacts of climate change factors and non-climatic factors on rice production in Bangladesh. In order to accomplish this, the analysis utilises Autoregressive Distributed Lag (ARDL) models, generating use of time series data from 1990 to 2020. In addition, the analysis includes an examination of the Pairwise Granger causality test. In addition to the introductory section, the following sections are organised in the following manner: In Part 2, we will delve into the literature review, examining the existing research and theories. Moving on to Section 3, we will discuss the methodology used in this study, outlining the approach taken to gather and analyse data. Section 4 focusses on the empirical findings and analysis, providing a thorough examination of the study’s results. Moving forward, Section 5 delves into a comprehensive discussion of the policy implications that arise from these outcomes.
2. Literature Review
A variety of factors, including both climatic and non-climatic elements, influence the productivity of rice, an essential food source for a significant portion of the worldwide population. Weather conditions, like temperature and rainfall, have significant effects on rice growth, as they directly affect the physiological processes of rice plants. Non-climatic factors, including urban expansion and land use changes, also significantly impact agricultural productivity. Understanding the interplay between these factors is essential for developing strategies to ensure sustainable rice production amidst changing environmental conditions.
Various estimation techniques have been employed in numerous studies to investigate the impact of factors such as climate on rice yield over a variety of time periods. Consequently, Tiamiyu (2015) employed OLS regression to examine the influence of rainfall variability on rice yield in Nigeria from 1992 to 2013. The results suggest that rice productivity is favourably impacted by rainfall in the majority of agro-ecological zones, with the exception of the Sudan Savanna. Agba (2017) employed ARDL and ECM models to examine the influence of climate and non-climate elements on yields of crops in Nigeria from 1980 to 2013. The short-term results of their study indicate that agricultural productivity is significantly enhanced by rainfall.
Conversely, Olufemi (2020) implemented the OLS estimation methodology to assess the impact of temperature variations on rice production in the state of Nasarawa, Nigeria, from 1997 to 2017. Their research demonstrated that rice production is detrimentally impacted by the highest temperature, while the lowest temperature has a beneficial effect. Bhardwaj (2022) conducted a district-level analysis in India from 1981 to 2017 using Pedroni cointegration, FMOLS, and DOLS methods, which corroborates these findings. The findings indicated that rice production is detrimentally impacted by the maximum temperature, while the minimum temperature has a beneficial impact. Nevertheless, it was determined that rainfall did not have a substantial impact on rice production. Van Oort & Zwart (2018) conducted simulation analyses to investigate the effects of climate change on rice cultivation in both rainfed and irrigated systems, further emphasising this point. Their results suggest that the productivity of rice could be significantly reduced as a result of the reduced photosynthesis that occurs at exceptionally high temperatures as a result of increasing temperatures. In the same vein, Bamiro (2020) employed maximum likelihood estimation and Cobb Douglas to examine the impact of climate change on rice yield in Nigeria from 1970 to 2014. The results suggest that rainfall has a favourable impact on rice yield, but temperature has a negative impact.
Akinbile (2020) employed the statistical methods of Mann-Kendall Sens’ and multiple linear regression models to examine the patterns and geographical variations in the influence of rainfall as well as temperature on rice cultivation in major Nigerian cities between 1970 and 2010. Their research suggests that there was an overall increase in rice output and temperature in the studied locations. However, a statistically significant correlation between rainfall and yield was observed in certain locations, such as Calabar and Enugu, while it was not observed in others, such as Ilorin and Maiduguri. The OLS estimation method was implemented by Abbas and Mayo (2021) to investigate the impact of temperature and rainfall on rice production in the Punjab region of Pakistan from 1981 to 2017. The study revealed that the maximum and lowest temperatures had adverse and favourable effects on rice output, respectively, whereas rainfall had a detrimental impact.
In contrast, Ali (2017) employed feasible generalised least squares (FGLS) and HAC consistent standard error estimation techniques to investigate the impact of climate change on main food crops in Pakistan from 1989 to 2015. This included rice. The findings suggest that rice production is substantially and positively influenced by the maximum temperature, whereas the minimum temperature has a negative impact. Rainfall, relative humidity, and sunlight each had non-significant negative, positive, and negative effects. In agreement with this, Gul (2022) employed the ARDL technique and time-series data from 1985 to 2016 to examine the influence of climatic change on rice production in Pakistan. The results indicate that rice yield is negatively impacted by temperature in the long term, while rainfall has a non-significant impact. In contrast, temperature has a negative impact on rice yield in the short term, while rainfall has a negative but insignificant influence.
Kumar (2023) conducted a study in India to evaluate the influence of warming temperatures and additional environmental variables on rice production. The study utilised ARDL, FMOLS, and CCR approaches to analyse data from 1982 to 2016. The results of all models consistently indicate that rainfall has a positive short-term impact on rice output, but a negative long-term impact. Conversely, temperature has a short-term adverse impact and a long-term insignificant impact. Guntukula (2020) employed a model with multiple linear regression to analyse the impact of climate variables on rice and other notable crop yields in India from 1961 to 2017. The study revealed a favourable correlation between lowest temperature and rice yield, but the impact of rainfall and maximum temperature was determined to be negligible.
In addition to climatic variables, non-climatic Various elements like as urban expansion, land use changes, and farming techniques significantly influence rice production. These factors often interact with climatic conditions, compounding their effects on crop yields. Urbanization, in particular, drives substantial agricultural land loss, transforming cropland into urban areas and affecting food security. Moreover, Barrios et al. (2010) employed panel data analysis to investigate the enduring impact of urbanization on rainfall patterns, economic development, and agricultural productivity across Africa, spanning multiple decades. Their study underscored that urbanization facilitates improved market access for agricultural products, thereby augmenting farmers’ income and fostering higher crop yields. Similarly, Ruttan (2002) conducted historical analysis and case studies to elucidate urban areas’ pivotal role as centers for technological innovation and knowledge diffusion in global agriculture over several decades. His findings highlighted that urbanization significantly contributes to agricultural productivity growth by promoting advancements in farming techniques and technology adoption.
Likewise, Gollin et al. (2014) utilized regression models and panel data analysis to examine the consequence of urban-related infrastructure development on crop yields across diverse regions. Their analysis over an extended period revealed that infrastructure enhancements associated with urban expansion, such as improved transportation and irrigation systems, are critical in enhancing agricultural productivity by reducing costs and enhancing resource management efficiency. Moreover, agricultural practices, including fertilizer use and land management, as well as socio-economic variables such as labor availability and credit access, are critical in determining agricultural productivity.
The potential crop yield of China from 1990 to 2010 was assessed by Liu and Bae (2018) using the Global Agro-Ecological Zones (GAEZ) model. Their results suggest that urban expansion reduced the prospective rice yield by 34.90 million tonnes, which is equivalent to 6.52% of China’s total actual production. Likewise, Andrade (2022) employed soil-climate databases, robust spatial upscaling techniques, and crop simulation models to investigate the influence of urbanisation trends on the production of essential staple commodities from 1966 to 2016. Compared to new cropland, the results indicate that converted cropland is 30–40% more productive. Moreover, in order to compile a summary of the characteristics of urban expansion and the consequent loss of cropland in 145 major cities in China, Tan (2005) employed land use data from Landsat-TM. Concurrently, Yan (2009) and Deng (2006) conducted an analysis of the influence of land use change, specifically cropland circumstances, on yields from agriculture in China from 1990 to 2000. On the other hand, Tian and Qiao (2014) assessed the reduction in Net Primary Yield that resulted from the conversion of agricultural land to urbanised areas.
Abbas (2022) conducted a new study that comprehensively examined the influence of average annual temperature and other factors on the production of ten major crops, including rice, in Pakistan from 2000 to 2019. The data was analysed using advanced statistical models such as panel pooled mean group (PMG), panel fully modified ordinary least squares (PFMOLS), and panel dynamic ordinary least squares (PDOLS). Based on the findings, it is evident that changes in temperature have a substantial and adverse effect on long-term agricultural cultivation. However, no notable influence was observed in the short term. Furthermore, the process of cultivating land and the use of fertilisers yield beneficial effects on crop output, both in the immediate and extended periods. Using analysis of variance (ANOVA) as the statistical tool, Atapattu (2018) investigated how potassium fertiliser affected rice harvests in Sri Lanka’s low country dry zone. The findings indicate that a higher rate of potassium fertiliser usage had a positive impact on the overall quality of direct-seeded rice, particularly during the heading stage.
In a comprehensive study, Chandio (2018) examined the factors influencing rice yields in Pakistan from 1998 to 2014. The researcher employed advanced statistical techniques for example, the ARDL model for data analysis and the Johansen cointegration test. Based on the findings, it is evident that the cultivation area and fertiliser application contribute significantly to the overall increase in the immediate and distant futures of rice cultivation. In a recent study, Chandio (2021) discovered that certain factors, including harvested area, fertiliser use, and funding, positively affect rice output in the long run. Similarly, Chandio and Gokmenoglu (2021) demonstrate a positive link between the area harvested and production. It has been observed that the presence of labour has an adverse effect on wheat and rice harvests.
In a study conducted by Kumar (2023), it was discovered that the area harvested has a beneficial effect on rice production, both in the short and long term. On the other hand, a study by Gul (2022) revealed that the size of the harvested area does not have a significant effect on the long-term yields of major food crops. Nevertheless, the utilisation of fertilisers was determined to have an advantageous but insignificant impact. In the short term, the consumption of fertiliser and access to formal credit have a significant impact on increasing the produce significant food commodities. In a recent study by Gul and Xiumin (2022), it was demonstrated that certain factors, including the magnitude of the rice harvest, utilisation of fertilisers, workforce, and access to water have a beneficial impact on rice production in the long run.
Furthermore, a study conducted by Tanko (2016) delved into the factors influencing rice production in the northern region of Ghana between 1970 and 2012, employing a multiple linear regression model. Based on the findings, it can be observed that a larger harvested area and elevated fertiliser prices have a detrimental impact on rice yield. On the other hand, a study conducted by Hartati (2018) uncovered a beneficial relationship between the development and yield of rice in Indonesia and the application of potassium fertiliser. In a study conducted in Hubei Province, China, field trials were carried out between 2017 and 2018 to investigate the influence of potassium, phosphorous, and nitrogen fertilisers on rice crops (Ye, 2019). Based on the findings, it is evident that the application of nitrogen fertiliser has a retarding effect on the flowering of rice. Conversely, the use of phosphorus and potassium fertilisers has been shown to stimulate early flowering and enhance rice production.
It is widely acknowledged in the literature that various factors, both related to climate and not related to climate, have a substantial effect on rice production. It is crucial to implement adaptive measures in order to mitigate negative consequences and enhance productivity. After thoroughly reviewing existing literature, this study aims to clarify the following research question: How much of climatic change affects Bangladesh’s rice output? Do these effects exhibit consistency across the several phases of rice farming and maturation?
2.1. Identified Gaps in the Related Literature
Through an in-depth review of current scholarly work, this study seeks to pinpoint topics of inquiry that have not yet been adequately explored. These areas are outlined as follows:
- (a)
- The paper emphasises a lack of research on the use of the ARDL model in understanding the immediate and the long-term implications for paddy production in Bangladesh. Despite the abundance of research on climate change effects, little focus has been given to using the ARDL model in the specific context of Bangladesh, particularly when considering other non-climatic factors like urbanisation. This offers a promising opportunity for groundbreaking research.
- (b)
- The current academic discussion primarily focusses on various factors such as temperature, rainfall, urbanisation, nutrient management (specifically potassium levels), and the amount of land dedicated to permanent crops. There is a noticeable lack of research on how these variables collectively impact rice production in Bangladesh.
- (c)
- The scholarly investigation highlights a significant oversight regarding micro-climatic factors, known for their temperature, precipitation, and unpredictable characteristics. Furthermore, it is clear that there are certain factors that have been left out of consideration, such as urbanisation, nutrient management, and the presence of permanent crops. These factors encompass both natural and human influences. A comprehensive understanding of these characteristics and their impact on various phases of rice production is essential for establishing a thorough comprehension.
- (d)
- The lack of agreement within empirical literature has important Implications for policy for agricultural systems that rely on the climate. Consequently, it is imperative to conduct a thorough analysis of the overall impact of the environment and additional variables on the production of agricultural crops.
- (e)
- There is a gap in research when it comes to conducting an comparative examination that is tailored to the production of rice, despite some studies providing insights into the imapcts of climate change on major food grains. Examining the impacts of climate change on rice in comparison to other crops can offer policymakers vital insights and those involved in agriculture.
Exploring these research gaps would greatly enhance our knowledge of the effects of climatic factors, specifically temperature and rainfall, on rice production. By considering various non-climatic variables like urbanisation, nutrient management, and the extent of permanent crops area, we can gain valuable insights into the impact on rice production in Bangladesh. This information would be invaluable for those involved in decision-making and interested parties in the rice sector. In addition, the study’s findings could be valuable to other countries facing similar challenges related to climate change, particularly those involved in rice production.
3. Econometric Methodology
3.1. Conceptual Framework
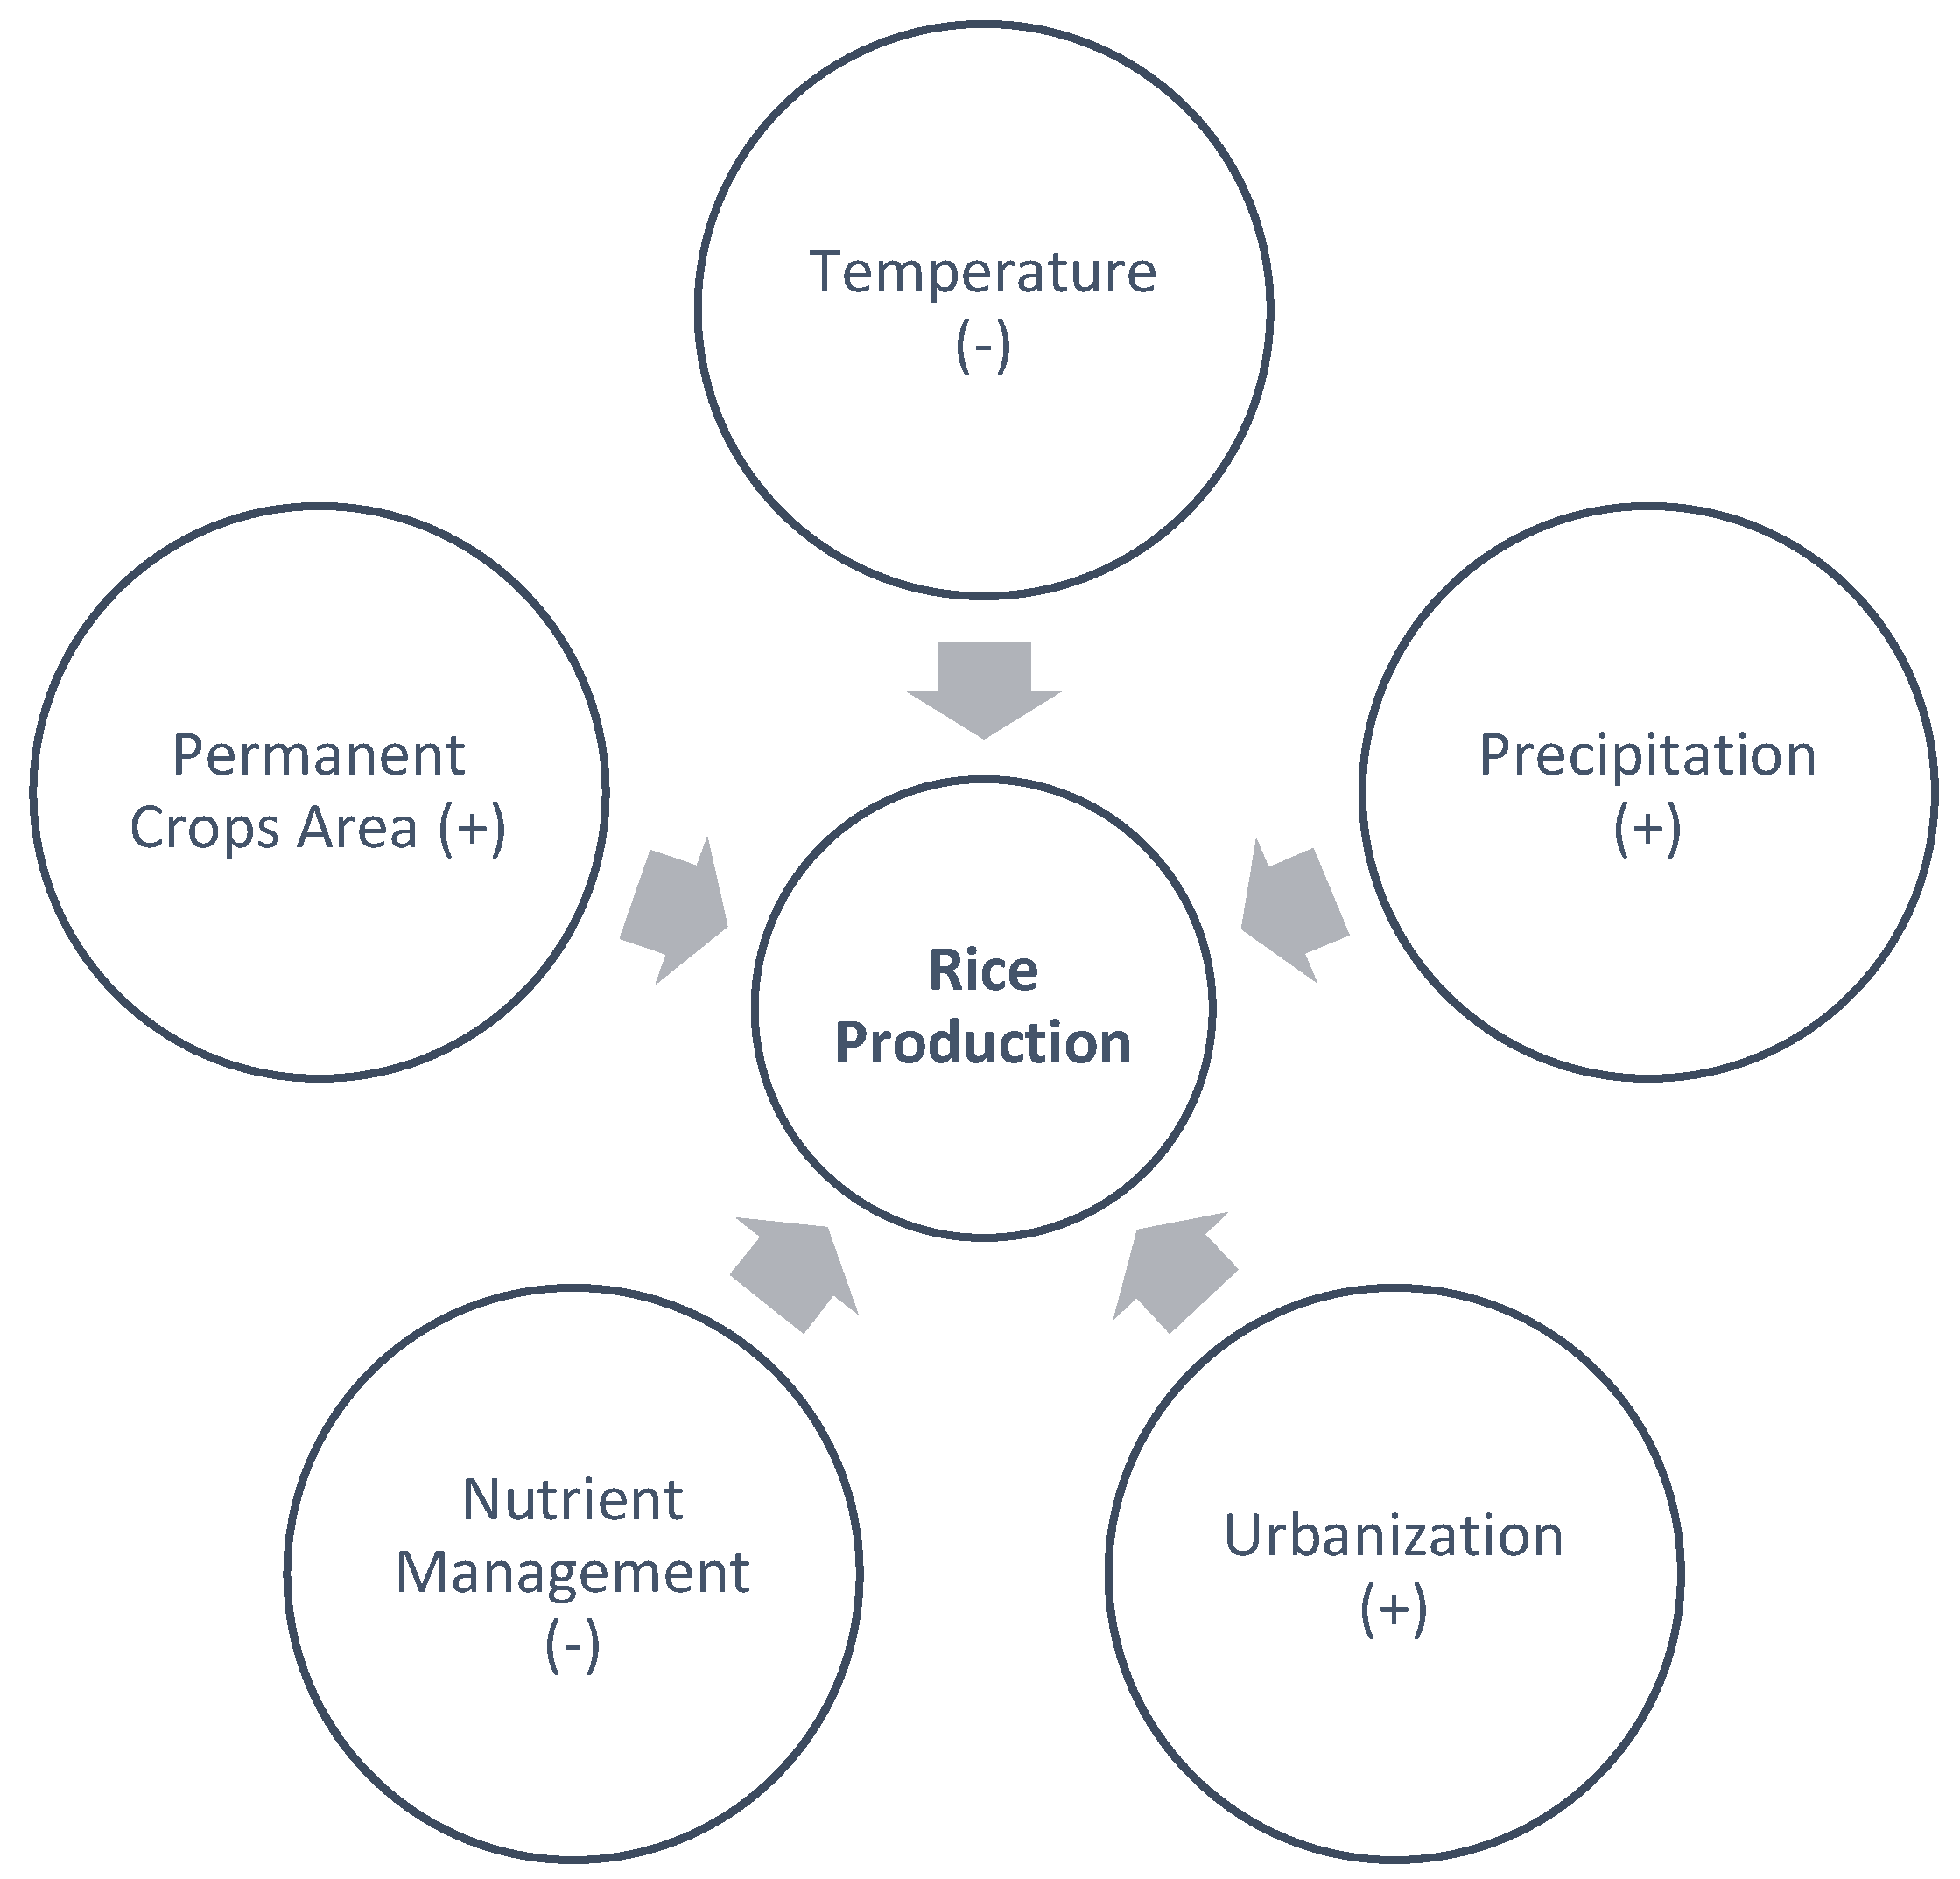
This research explores the multifaceted influences of temperature, precipitation, urbanization, nutrient management, and permanent crop area on rice and other crop yields. The framework integrates theories and empirical findings to understand the complex interactions affecting rice productivity, which is elaborated in Figure 1. Firstly, temperature significantly affects crop growth. Moderate temperatures enhance photosynthesis and crop growth, potentially increasing yields and allowing for multiple harvests per year (Lobell & Field, 2007). Conversely, high temperatures can cause heat stress, reduce grain filling, and lead to lower yields or crop failure (Peng et al., 2004). Further, precipitation is essential for optimal crop growth. Adequate and well-distributed rainfall ensures sufficient soil moisture, enhancing growth and productivity (Trnka et al., 2014). However, drought conditions can severely reduce yields, while excessive rainfall can cause flooding, waterlogging, and soil erosion, negatively impacting crops (Godfray et al., 2010). Furthermore, urbanization influences agriculture both positively and negatively. It can lead to better infrastructure, increased market access, and improved agricultural practices (Seto et al., 2012). In addition, urban expansion often reduces agricultural land and raises local temperatures, negatively affecting crops.
Moreover, nutrient management is crucial for plant health, enhancing drought resistance and increasing yields by promoting better water and nutrient uptake (Pettigrew, 2008). However, overuse can lead to nutrient imbalances, affecting crop health. Lastly, permanent crops area contributes to soil stability, improved soil health, and increased biodiversity, providing consistent yields over many years (Ramankutty et al., 2008). However, it can be expensive and compete with annual crops for resources.
3.2. Data Description
This study utilised time-series data spanning from 1990 to 2020 to enquire about the symmetric causal relationship between temperature, precipitation, urbanisation, nutrient management, extent of permanent crops area, and rice production in Bangladesh. The data were obtained from four primary sources such as the Bangladesh Bureau of Statistic (BBS, 2022) website, The World Development Indicators online database, provided by the World Bank (WDI, 2024), the Food and Agriculture Organisation Corporate Statistical Database (FAOSTAT, 2022), and the International Food and Agriculture Organisation (IFASTAT, 2021). Temperature and precipitation play crucial roles in understanding the consequences of climate change on agriculture. This study expands upon previous research that has investigated the effects of climate change on rice cultivation. Numerous investigations have been carried out regarding this subject matter, including those by Abbas (2022), Agba et al., (2017), Bamiro et al., (2020), Kumar et al., (2023), and Olufemi et al., (2020). In addition, this study expands on previous research by considering factors beyond climate, such as urbanisation, nutrient management, and the amount of land dedicated to permanent crops, in the examination of rice production in Bangladesh. Several studies have been referenced to support these findings (Andrade et al., 2022; Deng et al., 2006; Hartati et al., 2018; Tanko et al., 2016; Tian & Qiao, 2014; Yan et al., 2009; Ye et al., 2019). The variables utilised in the analysis, along with their respective sources, are thoroughly outlined in Table 1.
3.2. Model Specification
Adopting the approach detailed by Kumar (2023), the general model specification used in this study is presented in Equation (1) as follows:
where RicePro represents rice production, Temp represents the average annual temperature, and RainFall represents the annual precipitation. Urban represents the complete area of urbanisation, K20 represents the management of nutrients, and CropsLand represents the permanent crop area.
In an alternative form, Equation (1) can be expressed as follows:
Where, t represents the time period, refers to the parameters that need to be determined, and represents the error correction term.
The study utilized the ARDL approach to estimate both long-term and short-term effects (Agba et al., 2017; Ali Chandio et al., 2018; Kumar et al., 2023; Pesaran et al., 2001). The following equation outlines the ARDL bounds testing methodology:
In the econometric equation mentioned earlier, the value assigned to the drift parameter is represented by . In the model equation, the symbol represents the first difference estimates.
Here is the estimation for the unrestricted error correction model (ECM):
In the previously given econometric model, is recognised as the parameter that represents the pace at which adjustments occur, while refers to the residual values of the estimated equation.
3.3. Econometric Strategy
In this study, we utilize an econometric approach to analyze time series data related to rice production, focusing on variables such as temperature, precipitation, urbanization, potassium use, and the extent of permanent crop areas. Traditional econometric techniques like Vector Auto Regression (VAR), Engle and Granger causality, Ordinary Least Squares (OLS), and Johansen co-integration have known limitations that can affect the reliability of results. The ARDL model, which was devised by Pesaran et al. (2001), is implemented to mitigate these constraints. This model is particularly well-suited for our research due to its numerous significant benefits.
Firstly, the ARDL method is effective with limited sample sizes. Statistically, it is comparable to the standard error correction model, though it calculates standard errors differently, leading to unbiased estimates. Secondly, the ARDL approach, through linear transformation, allows us to evaluate both long- and short-term relationships between the variables of interest. Thirdly, the ARDL model assesses the stationarity of variables using unit root tests to identify level I(0) and first difference I(1) values. This method ensures no variable is stationary at the second difference I (2), as supported by Brown et al. (1975). Secondly, the linear transformation of the ARDL technique serves to evaluate the long-term and short-term associations between the relevant variables. Additionally, the ARDL model examines the stationarity of variables by conducting unit root tests to determine if they are at level I (0) or first difference I (1) values. This method guarantees that there is no stationary variable at the second difference, I (2), as evidenced by the research conducted by Brown et al. (1975).
At the beginning of using the ARDL technique, we first focus on identifying whether there is cointegration among the variables we are studying. It is important to thoroughly test the null hypothesis of absence of cointegration is being tested against an alternative hypothesis in order to make meaningful conclusions. Our analysis utilises statistical forms to verify the hypothesis, ensuring robustness and reliability.
According to Narayan et al. (2005), a key factor in determining cointegration is the F-statistic exceeding critical upper and lower bounds. This crucial data point is essential for assessing the existence of cointegration. If the F-statistic above the crucial thresholds, it indicates a strong indication of cointegration among the variables. Alternatively, if the F-statistic falls between these limits, the results are considered inconclusive. This calls for more investigation and analysis to understand the relationship between the variables being studied.
Additionally, the Zivot and Andrews (2002) test is implemented to consider fundamental discontinuities in the data, which may result in inaccurate conclusions. This test is essential for the identification of structural breaks at unknown locations in the time series, thereby reducing their impact and improving the reliability and accuracy of our findings. Furthermore, we implement unit root tests, including the Phillips-Perron test and the ADF test, to evaluate the stationarity of the time series data. The ADF test augments the Dickey-Fuller test incorporates lagged variations of the dependent variable, thereby compensating for higher-order serial correlation. To operate this test, the presence of a unit root in the time series is investigated by testing the null hypothesis. The series is stationary, as evidenced by the rejection of this null hypothesis. In contrast, the Phillips-Perron test modifies the Dickey-Fuller test to account for heteroskedasticity and autocorrelation in the error terms without the necessity of lagged difference terms. The null hypothesis of a unit root is also tested, but non-parametric statistical methods are employed to compensate for serial correlation and heteroskedasticity in the residuals. This modification offers a more comprehensive evaluation of stationarity, particularly when the time series data exhibit heteroskedasticity or autocorrelation that the ADF test may not be able to adequately address.
Once we have analysed the long- and short-term effects of the variables, we conduct various diagnostic methods to guarantee the dependability of outcomes. Various statistical tests are commonly used in economics research to analyse different aspects of regression models. These tests include the R-squared statistic, which measures the goodness of fit of the model; the Jarque-Bera normality test, which checks if the residuals are normally distributed; the Breusch-Godfrey LM test, which detects serial correlation; the ARCH test, which examines heteroskedasticity; White’s test, which assesses homoskedasticity; the Ramsey RESET test, which evaluates model stability; the Durbin-Watson test, which detects autocorrelation in residuals; and the CUSUM and CUSUM Square tests, which assess the stability of regression coefficients over time. Figure 2 showcases the comprehensive methodological framework utilised in this study.
H0: No co-integration exists. .
: Co-integration exists. .
H1: Temperature results in a positive connection with rice production.
H2: Precipitation outcomes in positive linkage with rice production.
H3: Urbanization causes positive findings with rice production.
H4: Nutrient management holds a positive relationship with rice production.
H5: Permanent crops area showed a positive link with rice production.
4. Results and Discussion
4.1. Descriptive Statistics
Prior to delving into data analysis, it is crucial to present a thorough review of the summary statistics for each variable utilised in the research. Table 2 presents the descriptive statistics for five important variables: Temperature (Temp), precipitation (RainFall), urbanisation (Urban), nutrient management (K20), and permanent cropland area (CropsLand), all of which have been studied for their impact on rice production in Bangladesh. These descriptive statistics provide a comprehensive summary of the variables, indicating their average, minimum, and maximum values, as well as their standard deviation, skewness, and kurtosis.
According to the findings, rice production has the highest mean value, while urbanisation has the lowest. Urbanization also exhibits the highest skewness (1.078) and kurtosis (3.227), whereas precipitation has the lowest skewness (0.013), and rice production shows the lowest kurtosis (1.698). All variables are positively skewed, indicating that future data points are likely to exceed the mean. However, the kurtosis values suggest that all variables are platykurtic, as their values are below 3, indicating a distribution that is flatter than the normal distribution. Figure 3 illustrates the patterns of these variables.
Additionally, Table 3 presents the correlation matrix among RicePro, Temp, RainFall, Urban, K20, and CropsLand. The analysis indicates a modest beneficial relationship between RicePro and Temp, K20, and CropsLand, while a negative correlation exists between RicePro and both RainFall and Urban. This correlation analysis provides initial insights into the associations between rice production and the other variables examined, setting the stage for more comprehensive statistical analysis in the following sections of the study.
4.2. Stationary Test
It is crucial to maintain the stationarity of time series data when conducting econometric modelling in order to minimise the possibility of obtaining misleading regression results. The study employs rigorous statistical tests, including the Augmented Dickey-Fuller (ADF), Phillips-Perron (PP), and Zivot and Andrews (Z & A) tests, to examine the stationarity of significant variables. RicePro, Temp, RainFall, Urban, K20, and CropsLand. Table 3 presents the results, indicating that RicePro, Temp, and RainFall exhibit stationary behavior at their levels, while Urban, K20, and CropsLand display non-stationarity initially but achieve stationarity after first differencing. Furthermore, the Z & A test reveals that RicePro, Temp, and RainFall maintain stationarity in the presence of structural fractures, thereby emphasising their durability over time. The ARDL approach is justified by the mixed integration orders (I (0) and I (1)) observed among these variables, which enables a comprehensive analysis of the long-term relationships and short-term dynamics that influence rice production in Bangladesh. A solid foundation for subsequent econometric modelling is established by these findings, which are detailed in Table 4. This ensures accurate estimation and inference.
4.3. Cointegration Test Using ARDL Bounds
The ARDL bound test, which tests the null hypothesis and looks for a long-term association between the variables, is shown in Table 5. The table presents the computed values of the F-statistic and the T-statistic, along with their corresponding significance levels at 1%, 5%, and 10%. Additionally, it provides the requisite value bounds for I(0) and I(1). Both the F-statistic and T-statistic results are statistically significant at all three levels of significance. More precisely, the minimum value for I(0) falls between 2.26 and 3.41, while the maximum value for I(1) extends from 3.35 to 4.68. These findings provide evidence of a long-term connection between the variables.
4.4. Empirical Results of the ARDL Model
4.4.1. Long-Run ARDL Result
The results of the long-run ARDL model highlight the lasting effects of various factors, examining the impact of both meteorological and non-climatic factors on rice production in Bangladesh. These findings are presented in Table 6. This comprehensive analysis elucidates how prolonged changes in temperature, precipitation, urbanization, nutrient management, and land use intricately affect rice yields over an extended period. These findings are illustrated in Figure 3, highlighting the enduring influences of these variables on rice productivity.
Over the long run, higher average annual temperatures negatively impact rice production in Bangladesh, aligning with the conclusions made by recent research (Ali et al., 2017; Gul, Chandio, et al., 2022; Guntukula, 2020; Kumar et al., 2023). The negative coefficient indicates that sustained temperature increases lead to prolonged heat stress on rice plants. This stress disrupts physiological processes critical for growth and reproduction, such as photosynthesis and grain development.
Consequently, higher temperatures reduce overall yield potential and increase production variability, posing challenges to maintaining consistent and sustainable rice production in a warming climate. likewise, higher annual precipitation has a positive effects on rice production in the long run, which aligns with the findings of recent studies. (Abbas & Mayo, 2021; Agba et al., 2017; Bamiro et al., 2020; Van Oort & Zwart, 2018) . The positive coefficient suggests that adequate and well-distributed rainfall supports optimal rice growth by ensuring sufficient soil moisture levels. Adequate precipitation reduces the reliance on irrigation and helps mitigate drought risks, supporting stable and productive yields across different growing seasons. This underscores the importance of water availability in sustaining long-term rice production in the region.
Moreover, urban population growth positively affects rice production over time, supporting the conclusions of recent research (Barrios et al., 2010; Gollin et al., 2014; Ruttan, 2002). The positive coefficient indicates that as urban areas grow, there are accompanying benefits to rice production. Urbanization typically improves infrastructure, market access, and agricultural practices, which collectively enhance productivity and efficiency within the rice sector. Urban areas also provide better access to inputs like fertilizers and machinery, facilitate knowledge transfer through extension services, and offer diverse marketing opportunities, all contributing positively to rice cultivation.
In contrast, the negative coefficient indicates that nutrient management, specifically potassium (K20), has a negative effects on rice production in the long term, supporting the conclusions of recent research (Tanko et al., 2016; Ye et al., 2019). This could be due to improper or excessive application of potassium, which may lead to nutrient imbalances in the soil, affecting plant health and yield. Overuse of potassium can also result in nutrient leaching and environmental degradation, further complicating its effectiveness and leading to reduced long-term productivity of rice crops.
However, expansion of permanent crop areas positively influences rice production over the long term, validating the findings of recent studies (Ali Chandio et al., 2018; Gokmenoglu et al., 2021; Kumar et al., 2023). The positive coefficient indicates that maintaining or increasing the area under permanent crops enhances soil fertility and stability. Permanent crops contribute to soil conservation, reduce erosion risks, and improve overall soil health, providing a favorable environment for sustained rice cultivation. This supports agricultural sustainability and resilience by maintaining productive land resources for rice farming amidst evolving environmental and land-use challenges.
Figure 3.
Graphical representation of long-run results from ARDL.
4.4.2. Short-Run ARDL Result
The short-run ARDL model results offer helpful insights into the immediate effects of different factors affecting rice production in Bangladesh. This analysis provides insights into the impact of various factors on rice production, as shown in Table 6. It examines the effects of short-term temperature fluctuations, precipitation patterns, urbanisation, nutrient management, and land use changes.
Temperature fluctuations directly affect rice production. The negative coefficient signifies that higher temperature reduce yields by inducing heat stress, which impairs photosynthesis, disrupts reproductive processes, and increases susceptibility to pests and diseases. These conditions lead to lower overall productivity and potential crop failures during extreme heat events. Similarly, precipitation levels significantly impact rice yields. The negative coefficient indicates that while rainfall is generally beneficial for rice production, excessive rainfall can lead to waterlogging, root damage, and nutrient leaching, which negatively impact overall crop health and productivity. Insufficient rainfall also hinders growth, emphasizing the need for balanced precipitation levels.
Alternatively, urbanization plays a role in enhancing rice production. The positive coefficient suggests that urban growth improves agricultural infrastructure, market access, and technological adoption. Urban areas provide better access to inputs like fertilizers and machinery, facilitate knowledge transfer through extension services, and offer diverse marketing opportunities, all of which contribute to increased productivity and efficiency in rice farming. Likewise, effective nutrient management practices, such as potassium application, positively influence rice yields. The positive coefficient indicates that optimized nutrient levels enhance plant health, improve stress tolerance, and increase yield potential. Proper nutrient balance ensures that rice plants receive essential elements such as nitrogen, phosphorus, and potassium, which are essential for growth, development, and grain formation, leading to higher overall productivity.
On the other hand, expansion of permanent crop areas negatively impacts rice production. The negative coefficient reflects competition for facilities such as land, water, and labour between permanent crops and rice cultivation. Increased permanent crop areas reduce available land for rice farming, limiting expansion opportunities and potentially decreasing overall rice yields due to reduced cultivation areas and resource allocation.
4.5. Robustness Test
The purpose of the robustness test is to verify the dependability of the long-run ARDL model outcomes by using various estimating methodologies, namely the FMOLS and CCR methods, as explained in Table 7. These methods provide additional confirmation of the significance and stability of the variables influencing rice production in Bangladesh. Consistent findings across these methodologies reinforce the robustness of the initial ARDL results, particularly highlighting the enduring negative impact of temperature, the mixed but generally positive effect of precipitation, and the beneficial influence of urbanization. Additionally, the robustness test underscores the nuanced effects of nutrient management and land use changes, confirming their critical roles in determining long-term rice productivity. This comprehensive validation ensures that the conclusions drawn from the ARDL model are both reliable and credible, providing a solid foundation for policy recommendations and future research.
4.6. Diagnostic Test
Several diagnostic tests were carried out to ensure the reliability and robustness of our econometric model. Various statistical tests were used to investigate the presence of heteroscedasticity, including the Breusch-Pagan-Godfrey test, the ARCH test, and White’s test for homoskedasticity. The tests conducted produced chi-square values with insignificant probabilities, as described in the diagnostic test findings are located at the bottom of Table 8. This resulted in the null hypothesis of homoscedasticity being rejected.
Additional diagnostic checks were conducted to confirm the overall adequacy of the model. The R-square value of the model was determined to be 0.9291, suggesting a strong level of explanatory power. Various statistical tests were conducted to examine serial correlation, normality, model specification, and the Durbin-Watson statistic. In light of the test results, it is possible to infer that the probability chi-square values were statistically insignificant. This indicates that the residuals were normally distributed and serial correlation was not demonstrated.
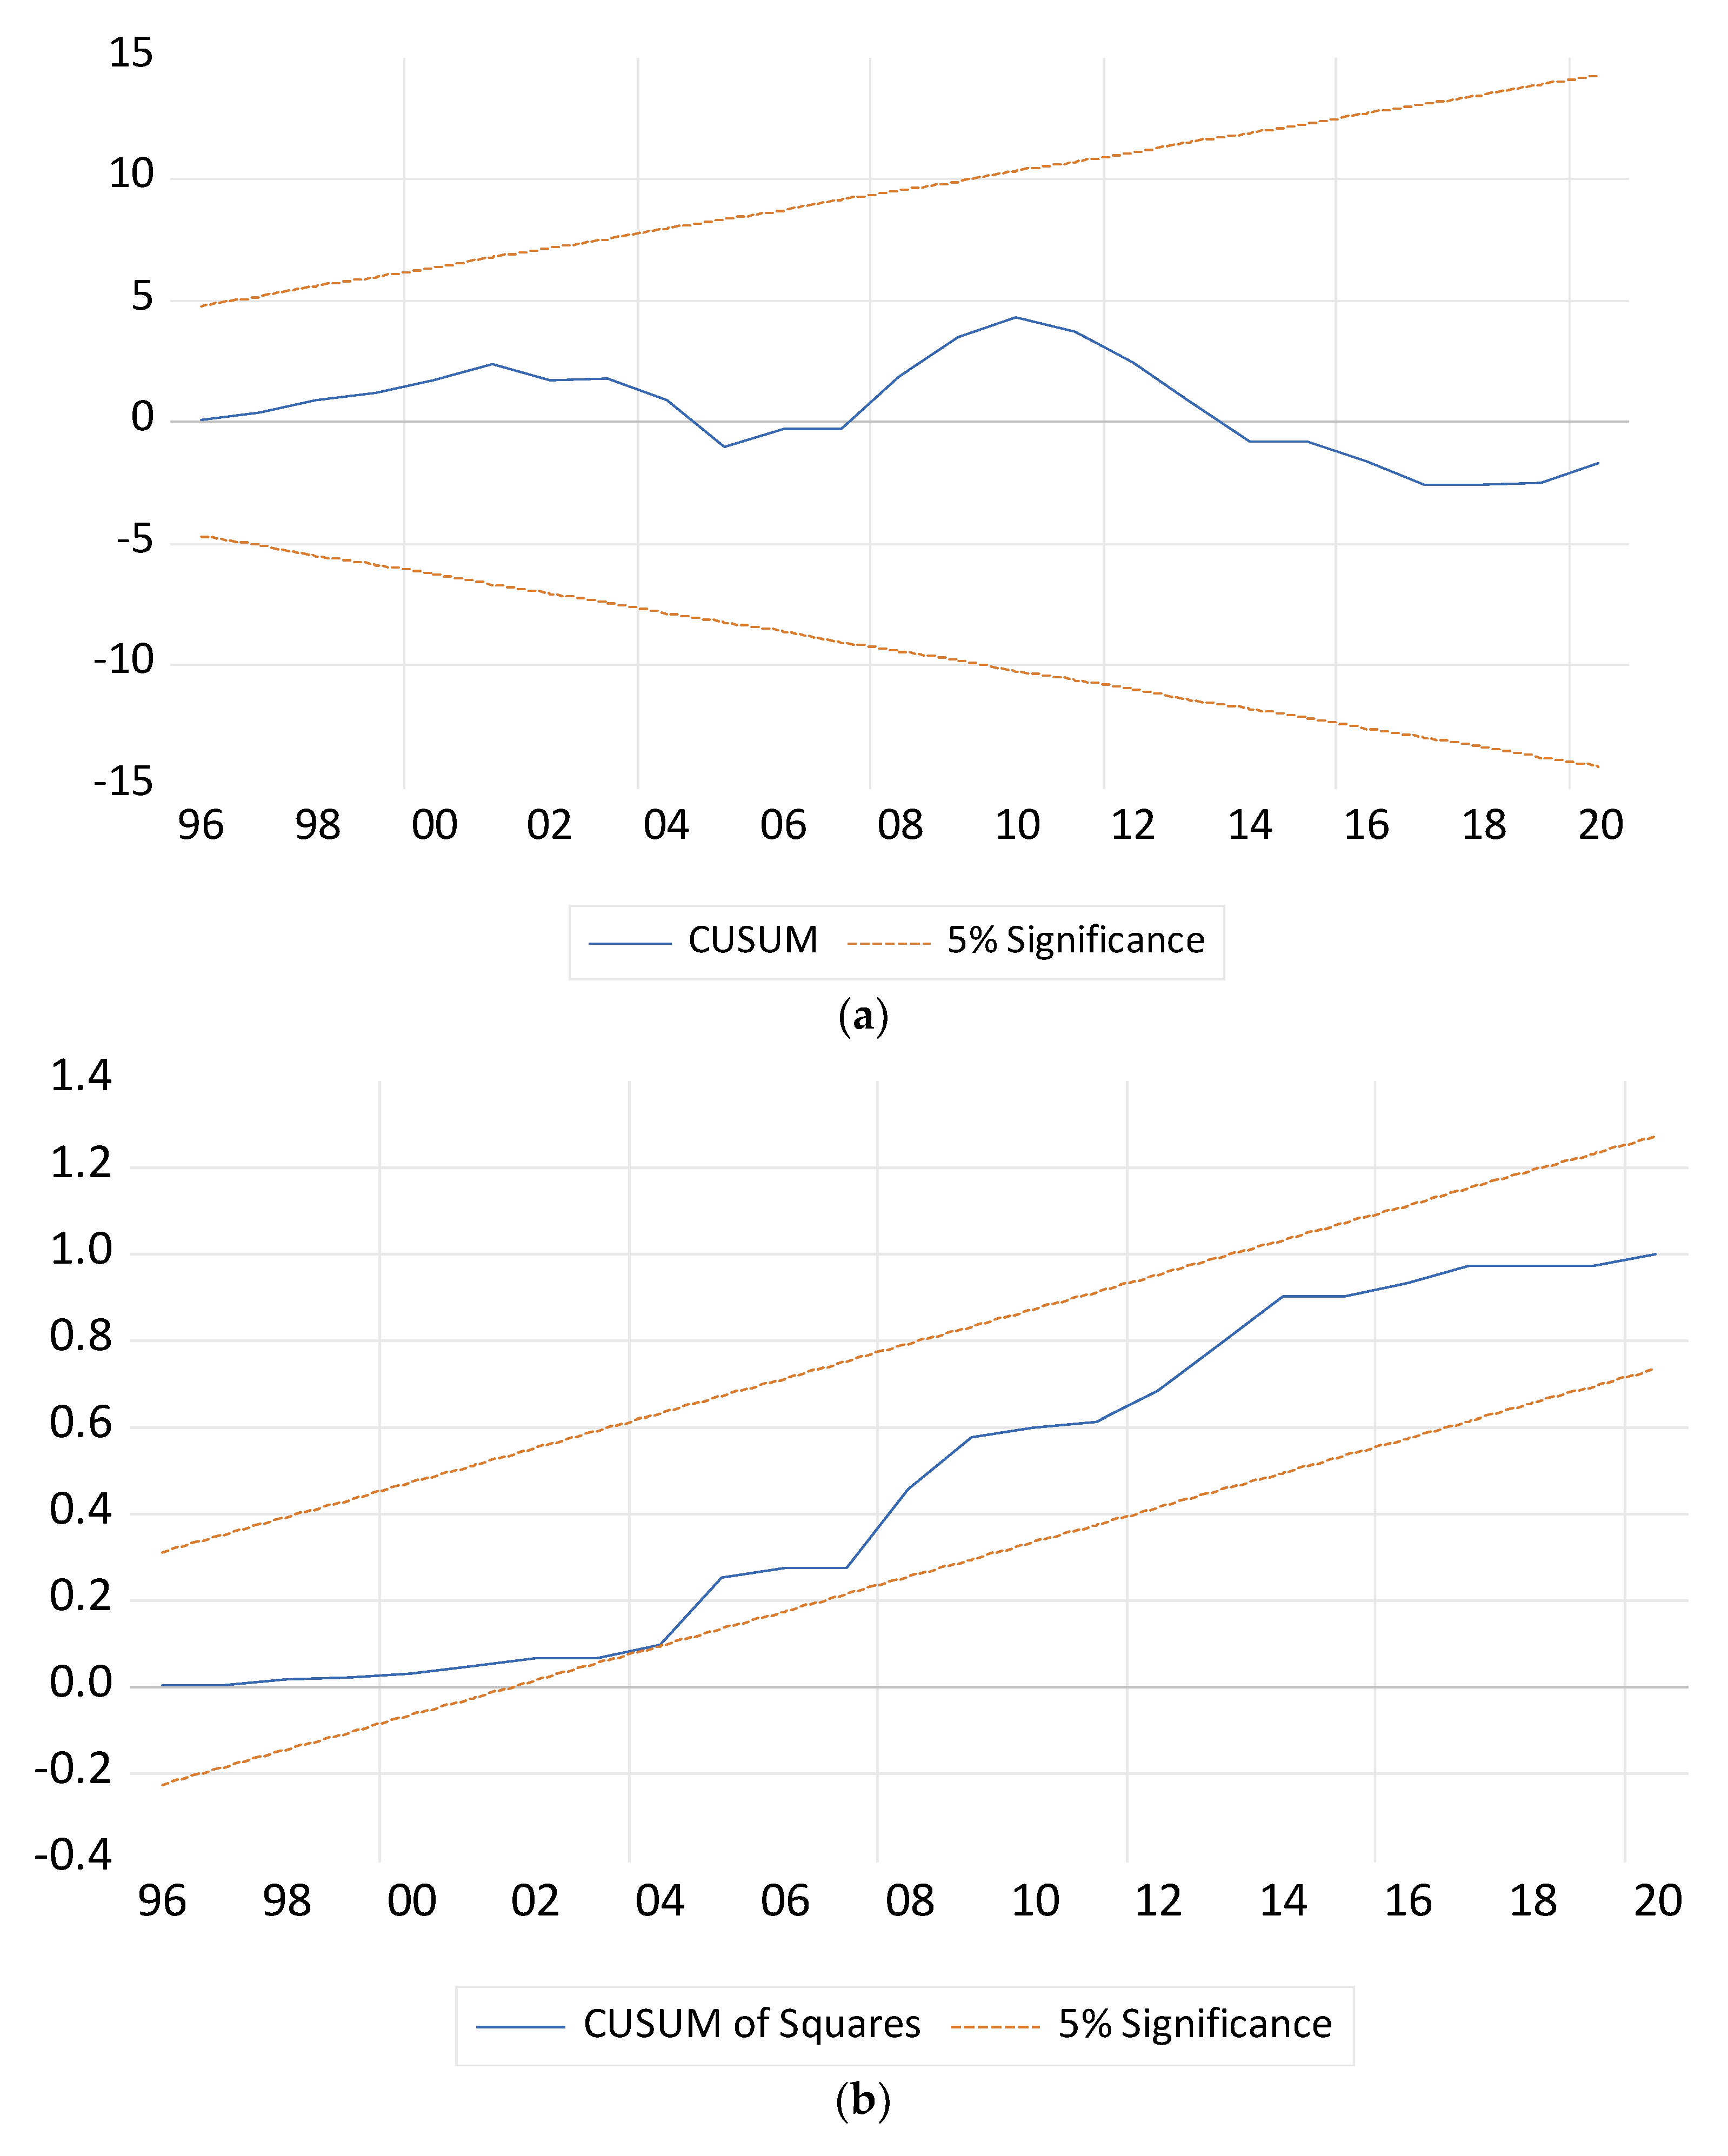
In order to evaluate the model’s dynamic stability over time, the CUSUM and CUSUMsq tests were employed. Based on the results shown in Figure 4a and Figure 4b, it is evident that the model parameters remain consistent, which further strengthens the reliability of our findings. Through a series of comprehensive diagnostic tests, it has been determined that the model is accurately specified and dependable for analysing the various factors that impact rice production in Bangladesh.
4.8. Pairwise Granger Causality Test
In this this study, we utilise the Pairwise Granger causality test to evaluate the existence of a short-term causal connection between rice production and various independent variables in Bangladesh. This test is particularly useful as it addresses heterogeneity concerns within the data. The findings, as shown in Table 9, suggest that the production of rice in Bangladesh is not significantly impacted by temperature. Nevertheless, other factors such as precipitation, urbanization, nutrient management, and land use are found to play crucial roles. Specifically, precipitation is vital for rice growth as it directly affects water availability, while urbanization influences agricultural practices and market dynamics. Effective management of nutrients is crucial for preserving soil fertility and optimising crop productivity, while the allocation and arrangement of land directly influence the size and effectiveness of rice growing zones. These results highlight the importance of managing these variables effectively to maintain and improve rice production in Bangladesh.
5. Conclusions and Policy Implications
5.1. Conclusions
This study examines the possible symmetric effects of both climate change factors (temperature and precipitation) and non-climatic factors (nutrient management and the extension of permanent crop areas) on rice production in Bangladesh. To achieve this, the study employed ARDL models, utilizing time series data covering the years 1990 to 2020. The major outcomes from the econometric analysis revealed significant relationships, offering valuable insights for policymakers. Firstly, higher average annual temperatures decrease rice production. Secondly, increased annual precipitation increases rice production. Thirdly, urban population growth increases rice production. Fourthly, potassium (K20) application decreases rice production. Finally, the expansion of permanent crop areas increases rice production.
5.2. Policy Implications
The results of this study shed light on various important aspects that require policy intervention in order to improve rice production in Bangladesh. According to the findings, the following policy implications are recommended:
Firstly, develop and implement climate adaptation strategies to address the adverse effects of temperature on rice production. This includes promoting heat-tolerant rice varieties, improving irrigation infrastructure to mitigate heat stress, and enhancing weather forecasting systems to help farmers prepare for extreme weather events.
Secondly, establish effective water management policies to leverage the positive long-term effect of precipitation on rice yields. Investments in efficient irrigation systems, rainwater harvesting, and sustainable water use practices can ensure consistent water availability and reduce dependency on erratic rainfall patterns.
Thirdly, improve urbanization and infrastructure development to benefit rice production. Policies that facilitate urban-rural linkages, enhance transportation networks, and provide access to modern agricultural technologies can significantly boost productivity and profitability for rice farmers.
Fourthly, implement balanced and precise nutrient management practices. Educating farmers about the proper use of fertilizers, particularly potassium, through extension services can help avoid nutrient imbalances and environmental degradation, ensuring optimal crop health and yields. Lastly, promote sustainable land use practices to maintain soil fertility and ensure long-term agricultural sustainability. Policies encouraging crop rotation, agroforestry, and conservation agriculture can support a stable and productive agricultural system.
5.3. Limitations and Future Research
Despite conducting a thorough analysis, It is imperative to acknowledge specific constraints that may influence the interpretation and practicality of the results: Firstly, the study faces data constraints as it relies on available data from 1995 to 2019, potentially missing recent changes in climate patterns, agricultural practices, and socio-economic developments. This limitation could affect the robustness and generalizability of the findings. Secondly, the ARDL model and robustness tests assume linear relationships between variables, potentially oversimplifying the complex interactions in agricultural systems. Non-linearities and threshold effects, which might exist, were not accounted for, suggesting the need for alternative modeling approaches. Thirdly, influential variables such as pest and disease incidence, soil health, and farmer behavior were omitted from the analysis, despite their potential significant impacts on rice production. Future research should take into account incorporating these variables to enhance the comprehensiveness of the analysis. Lastly, conducting the analysis at a national level masks potential regional variations within Bangladesh. Different regions may experience diverse climatic and socio-economic conditions, potentially leading to heterogeneous impacts on rice production across the country.
Identifying critical avenues for future research is pivotal for advancing our understanding and enhancing rice production in Bangladesh. Firstly, leveraging advanced non-linear modeling approaches such as threshold regression and Nonlinear Autoregressive Distributed Lag (NARLD) model can better elucidate the intricate interactions between climatic and non-climatic factors that affect rice yields. Secondly, conducting in-depth regional and micro-level analyses will unveil localized impacts, enabling the formulation of tailored policy recommendations that account for diverse regional dynamics within Bangladesh. Thirdly, employing longitudinal studies with panel data will provide valuable insights into the dynamic nature of rice production systems over time, crucial for addressing variability and unobserved factors. Fourthly, delving into the prospective consequences of climate change scenarios on rice production will provide valuable insights for developing adaptive strategies and risk management practices to mitigate future climatic risks. Lastly, by conducting empirical studies and field experiments, we can gain evidence-based insights to enhance the resilience and productivity of Bangladesh’s rice production systems.
Author Contributions
The authors’ contributions are as follows: MHR was responsible for the writing of the original draft, including the conceptual framework, introduction, literature review, Data collection, analysis, technique, table layout, debate, and conclusion, policy implications, and critical review. ZA and MK participated in the review and critically revised the manuscript.
Funding
This article was written, published, and researched without funding.
Institutional Review Board Statement
Not applicable
Informed Consent Statement
Not applicable
Data Availability Statement
Data will be made available on reasonable request.
Consent to Publish
Not applicable.
Conflicts of Interest
The authors declare no competing interests
References
- Abbas, S. (2022). Climate change and major crop production: Evidence from Pakistan. Environmental Science and Pollution Research, 29(4), 5406–5414. [CrossRef]
- Abbas, S., & Mayo, Z. A. (2021). Impact of temperature and rainfall on rice production in Punjab, Pakistan. Environment, Development and Sustainability, 23(2), 1706–1728. [CrossRef]
- Agba, D. Z., Adewara, S. O., Adama, J. I., Adzer, K. T., & Atoyebi, G. O. (2017). Analysis of the Effects of Climate Change on Crop Output in Nigeria. American Journal of Climate Change, 06(03), 554–571. [CrossRef]
- Akinbile, C. O., Ogunmola, O. O., Abolude, A. T., & Akande, S. O. (2020). Trends and spatial analysis of temperature and rainfall patterns on rice yields in Nigeria. Atmospheric Science Letters, 21(3), e944. [CrossRef]
- Ali Chandio, A., Jiang, Y., Rehman, A., Dunya, R., 1 College of Economics, Sichuan Agricultural University, Chengdu, China, 2 Research Center of Agricultural-Rural-Peasants, Anhui University, Hefei, China, & 3 College of Management, Sichuan Agricultural University Chengdu, China. (2018). The linkage between fertilizer consumption and rice production: Empirical evidence from Pakistan. AIMS Agriculture and Food, 3(3), 295–305. [CrossRef]
- Ali, S., Liu, Y., Ishaq, M., Shah, T., Abdullah, Ilyas, A., & Din, I. (2017). Climate Change and Its Impact on the Yield of Major Food Crops: Evidence from Pakistan. Foods, 6(6), 39. [CrossRef]
- Andrade, J. F., Cassman, K. G., Rattalino Edreira, J. I., Agus, F., Bala, A., Deng, N., & Grassini, P. (2022). Impact of urbanization trends on production of key staple crops. Ambio, 51(5), 1158–1167. [CrossRef]
- Atapattu, A. J., Prasantha, B. D. R., Amaratunga, K. S. P., & Marambe, B. (2018). Increased rate of potassium fertilizer at the time of heading enhances the quality of direct seeded rice. Chemical and Biological Technologies in Agriculture, 5(1), 22. [CrossRef]
- Bamiro, O. M., Adeyonu, G. A., Babatunde, A., Solaja, S. O., Sanni, S. A., Faronbi, O. A., & Awe, T. E. (2020). Effects of climate change on grain productivity in Nigeria (1970-2014). IOP Conference Series: Earth and Environmental Science, 445(1), 012058. [CrossRef]
- Barrios, S., Bertinelli, L., & Strobl, E. (2010). Trends in Rainfall and Economic Growth in Africa: A Neglected Cause of the African Growth Tragedy. Review of Economics and Statistics, 92(2), 350–366. [CrossRef]
- Bangladesh Bureau of Statistics (BBS), 4331.
- Beggs, P. J. (2009). Climate change and plant food allergens. Journal of Allergy and Clinical Immunology, 123(1), 271–272. [CrossRef]
- Bhardwaj, M., Kumar, P., Kumar, S., Dagar, V., & Kumar, A. (2022). A district-level analysis for measuring the effects of climate change on production of agricultural crops, i.e., wheat and paddy: Evidence from India. Environmental Science and Pollution Research, 29(21), 31861–31885. [CrossRef]
- Brown, R. L., Durbin, J., & Evans, J. M. (1975). Techniques for Testing the Constancy of Regression Relationships Over Time. Journal of the Royal Statistical Society Series B: Statistical Methodology, 37(2), 149–163. [CrossRef]
- Chandio, A. A., Gokmenoglu, K. K., & Ahmad, F. (2021). Addressing the long- and short-run effects of climate change on major food crops production in Turkey. Environmental Science and Pollution Research, 28(37), 51657–51673. [CrossRef]
- Chandio, A. A., Jiang, Y., Ahmad, F., Adhikari, S., & Ain, Q. U. (2021). Assessing the impacts of climatic and technological factors on rice production: Empirical evidence from Nepal. Technology in Society, 66, 101607. [CrossRef]
- Chandio, A. A., Ozturk, I., Akram, W., Ahmad, F., & Mirani, A. A. (2020). Empirical analysis of climate change factors affecting cereal yield: Evidence from Turkey. Environmental Science and Pollution Research, 27(11), 11944–11957. [CrossRef]
- Deng, X., Huang, J., Rozelle, S., & Uchida, E. (2006). Cultivated land conversion and potential agricultural productivity in China. Land Use Policy, 23(4), 372–384. [CrossRef]
- Dutta, R. (2014). Climate change and its impact on tea in Northeast India. Journal of Water and Climate Change, 5(4), 625–632. [CrossRef]
- FAOSTAT Statistical Database. Food and Agriculture Organization of the United Nations, /: from [FAO](https.
- FAOSTAT Statistical Database. Food and Agriculture Organization of the United Nations, /: from [FAO](https.
- Food and Agriculture Organization corporate statistical database.
- Godfray, H. C. J., Beddington, J. R., Crute, I. R., Haddad, L., Lawrence, D., Muir, J. F., Pretty, J., Robinson, S., Thomas, S. M., & Toulmin, C. (2010). Food Security: The Challenge of Feeding 9 Billion People. Science, 327(5967), 812–818. [CrossRef]
- Gokmenoglu, K. K., Taspinar, N., & Rahman, M. M. (2021). Military expenditure, financial development and environmental degradation in Turkey: A comparison of CO 2 emissions and ecological footprint. International Journal of Finance & Economics, 26(1), 986–997. [CrossRef]
- Gollin, D., Lagakos, D., & Waugh, M. E. (2014). The Agricultural Productivity Gap *. The Quarterly Journal of Economics, 129(2), 939–993. [CrossRef]
- Gul, A., Chandio, A. A., Siyal, S. A., Rehman, A., & Xiumin, W. (2022). How climate change is impacting the major yield crops of Pakistan? An exploration from long- and short-run estimation. Environmental Science and Pollution Research, 29(18), 26660–26674. [CrossRef]
- Gul, A., Xiumin, W., Chandio, A. A., Rehman, A., Siyal, S. A., & Asare, I. (2022). Tracking the effect of climatic and non-climatic elements on rice production in Pakistan using the ARDL approach. Environmental Science and Pollution Research, 29(21), 31886–31900. [CrossRef]
- Gunathilaka, R. P. D., Smart, J. C. R., & Fleming, C. M. (2017). The impact of changing climate on perennial crops: The case of tea production in Sri Lanka. Climatic Change, 140(3–4), 577–592. [CrossRef]
- Guntukula, R. (2020). Assessing the impact of climate change on Indian agriculture: Evidence from major crop yields. Journal of Public Affairs, 20(1), e2040. [CrossRef]
- Hartati, S., Suryono, & Purnomo, D. (2018). Effectiveness and efficiency of potassium fertilizer application to increase the production and quality of rice in entisols. IOP Conference Series: Earth and Environmental Science, 142, 012031. [CrossRef]
- International Food and Agriculture Organization.
- Islam, M. T., & Nursey-Bray, M. (2017). Adaptation to climate change in agriculture in Bangladesh: The role of formal institutions. Journal of Environmental Management, 200, 347–358. [CrossRef]
- Kumar, P., Sahu, N. C., Ansari, M. A., & Kumar, S. (2023). Climate change and rice production in India: Role of ecological and carbon footprint. Journal of Agribusiness in Developing and Emerging Economies, 13(2), 260–278. [CrossRef]
- Liu, X., & Bae, J. (2018). Urbanization and industrialization impact of CO2 emissions in China. Journal of Cleaner Production, 172, 178–186. [CrossRef]
- Lobell, D. B., & Field, C. B. (2007). Global scale climate–crop yield relationships and the impacts of recent warming. Environmental Research Letters, 2(1), 014002. [CrossRef]
- Mackay, A. (2008). Climate Change 2007: Impacts, Adaptation and Vulnerability. Contribution of Working Group II to the Fourth Assessment Report of the Intergovernmental Panel on Climate Change. Journal of Environmental Quality, 37(6), 2407–2407. [CrossRef]
- Mallik, P., & Ghosh, T. (2021). Impact of Climate on Tea Production: A Study of the Dooars Region in India. [CrossRef]
- Marx, W., Haunschild, R., & Bornmann, L. (2017). Global Warming and Tea Production—The Bibliometric View on a Newly Emerging Research Topic. Climate, 5(3), 46. [CrossRef]
- Narayan, P. K. (2005). The saving and investment nexus for China: Evidence from cointegration tests. Applied Economics, 37(17), 1979–1990. [CrossRef]
- Olufemi, O. S., Joshua, M. I., & Abraham Salamatu, E. (2020). Assessment of Temperature Variability Effect on Rice Production in Nasarawa State, Nigeria. International Journal of Environment and Climate Change, 91–100. [CrossRef]
- Peng, S., Huang, J., Sheehy, J. E., Laza, R. C., Visperas, R. M., Zhong, X., Centeno, G. S., Khush, G. S., & Cassman, K. G. (2004). Rice yields decline with higher night temperature from global warming. Proceedings of the National Academy of Sciences, 101(27), 9971–9975. [CrossRef]
- Pesaran, M. H., Shin, Y., & Smith, R. J. (2001). Bounds testing approaches to the analysis of level relationships. Journal of Applied Econometrics, 16(3), 289–326. [CrossRef]
- Pettigrew, W. T. (2008). Potassium influences on yield and quality production for maize, wheat, soybean and cotton. Physiologia Plantarum, 133(4), 670–681. [CrossRef]
- Ramankutty, N., Evan, A. T., Monfreda, C., & Foley, J. A. (2008). Farming the planet: 1. Geographic distribution of global agricultural lands in the year 2000. Global Biogeochemical Cycles, 22(1), 2007GB002952. [CrossRef]
- Ruttan, V. W. (2002). Productivity Growth in World Agriculture: Sources and Constraints. Journal of Economic Perspectives, 16(4), 161–184. [CrossRef]
- Seto, K. C., Güneralp, B., & Hutyra, L. R. (2012). Global forecasts of urban expansion to 2030 and direct impacts on biodiversity and carbon pools. Proceedings of the National Academy of Sciences, 109(40), 16083–16088. [CrossRef]
- Shahid, S., Harun, S. B., & Katimon, A. (2012). Changes in diurnal temperature range in Bangladesh during the time period 1961–2008. Atmospheric Research, 118, 260–270. [CrossRef]
- Tan, M., Li, X., & Lu, C. (2005). Urban land expansion and arable land loss of the major cities in China in the 1990s. Science in China Series D: Earth Sciences, 48(9), 1492–1500. [CrossRef]
- Tanko, M., Iddrisu, A., & Alidu, A. (2016). Determinants of Rice Yield in Northern Region of Ghana, the Role of Policy. Asian Journal of Agricultural Extension, Economics & Sociology, 9(2), 1–11. [CrossRef]
- Tiamiyu, S. A., Eze, J. N., Yusuf, T. M., Maji, A. T., & Bakare, S. O. (2015). Rainfall Variability and its Effect on Yield of Rice in Nigeria. International Letters of Natural Sciences, 49, 63–68. [CrossRef]
- Tian, G., & Qiao, Z. (2014). Assessing the impact of the urbanization process on net primary productivity in China in 1989–2000. Environmental Pollution, 184, 320–326. [CrossRef]
- Trnka, M., Rötter, R. P., Ruiz-Ramos, M., Kersebaum, K. C., Olesen, J. E., Žalud, Z., & Semenov, M. A. (2014). Adverse weather conditions for European wheat production will become more frequent with climate change. Nature Climate Change, 4(7), 637–643. [CrossRef]
- Bangladesh: Rice Production and Food Security. United States Department of Agriculture, Foreign Agricultural Service. /: from [USDA](https.
- Van Oort, P. A. J., & Zwart, S. J. (2018). Impacts of climate change on rice production in Africa and causes of simulated yield changes. Global Change Biology, 24(3), 1029–1045. [CrossRef]
- Wang, J., Vanga, S., Saxena, R., Orsat, V., & Raghavan, V. (2018). Effect of Climate Change on the Yield of Cereal Crops: A Review. Climate, 6(2), 41. [CrossRef]
- World Development Indicators (WDI) online database of the World Bank.
- Yan, H., Liu, J., Huang, H. Q., Tao, B., & Cao, M. (2009). Assessing the consequence of land use change on agricultural productivity in China. Global and Planetary Change, 67(1–2), 13–19. [CrossRef]
- Ye, T., Li, Y., Zhang, J., Hou, W., Zhou, W., Lu, J., Xing, Y., & Li, X. (2019). Nitrogen, phosphorus, and potassium fertilization affects the flowering time of rice (Oryza sativa L.). Global Ecology and Conservation, 20, e00753. [CrossRef]
- Ziska, L., Crimmins, A., Auclair, A., DeGrasse, S., Garofalo, J. F., Khan, A. S., Loladze, I., Pérez De León, A. A., Showler, A., Thurston, J., & Walls, I. (2016). Ch. 7: Food Safety, Nutrition, and Distribution. The Impacts of Climate Change on Human Health in the United States: A Scientific Assessment. U.S. Global Change Research Program. [CrossRef]
- Zivot, E., & Andrews, D. W. K. (2002). Further Evidence on the Great Crash, the Oil-Price Shock, and the Unit-Root Hypothesis. Journal of Business & Economic Statistics, 20(1), 25–44. [CrossRef]
Figure 1.
Conceptual framework of study.
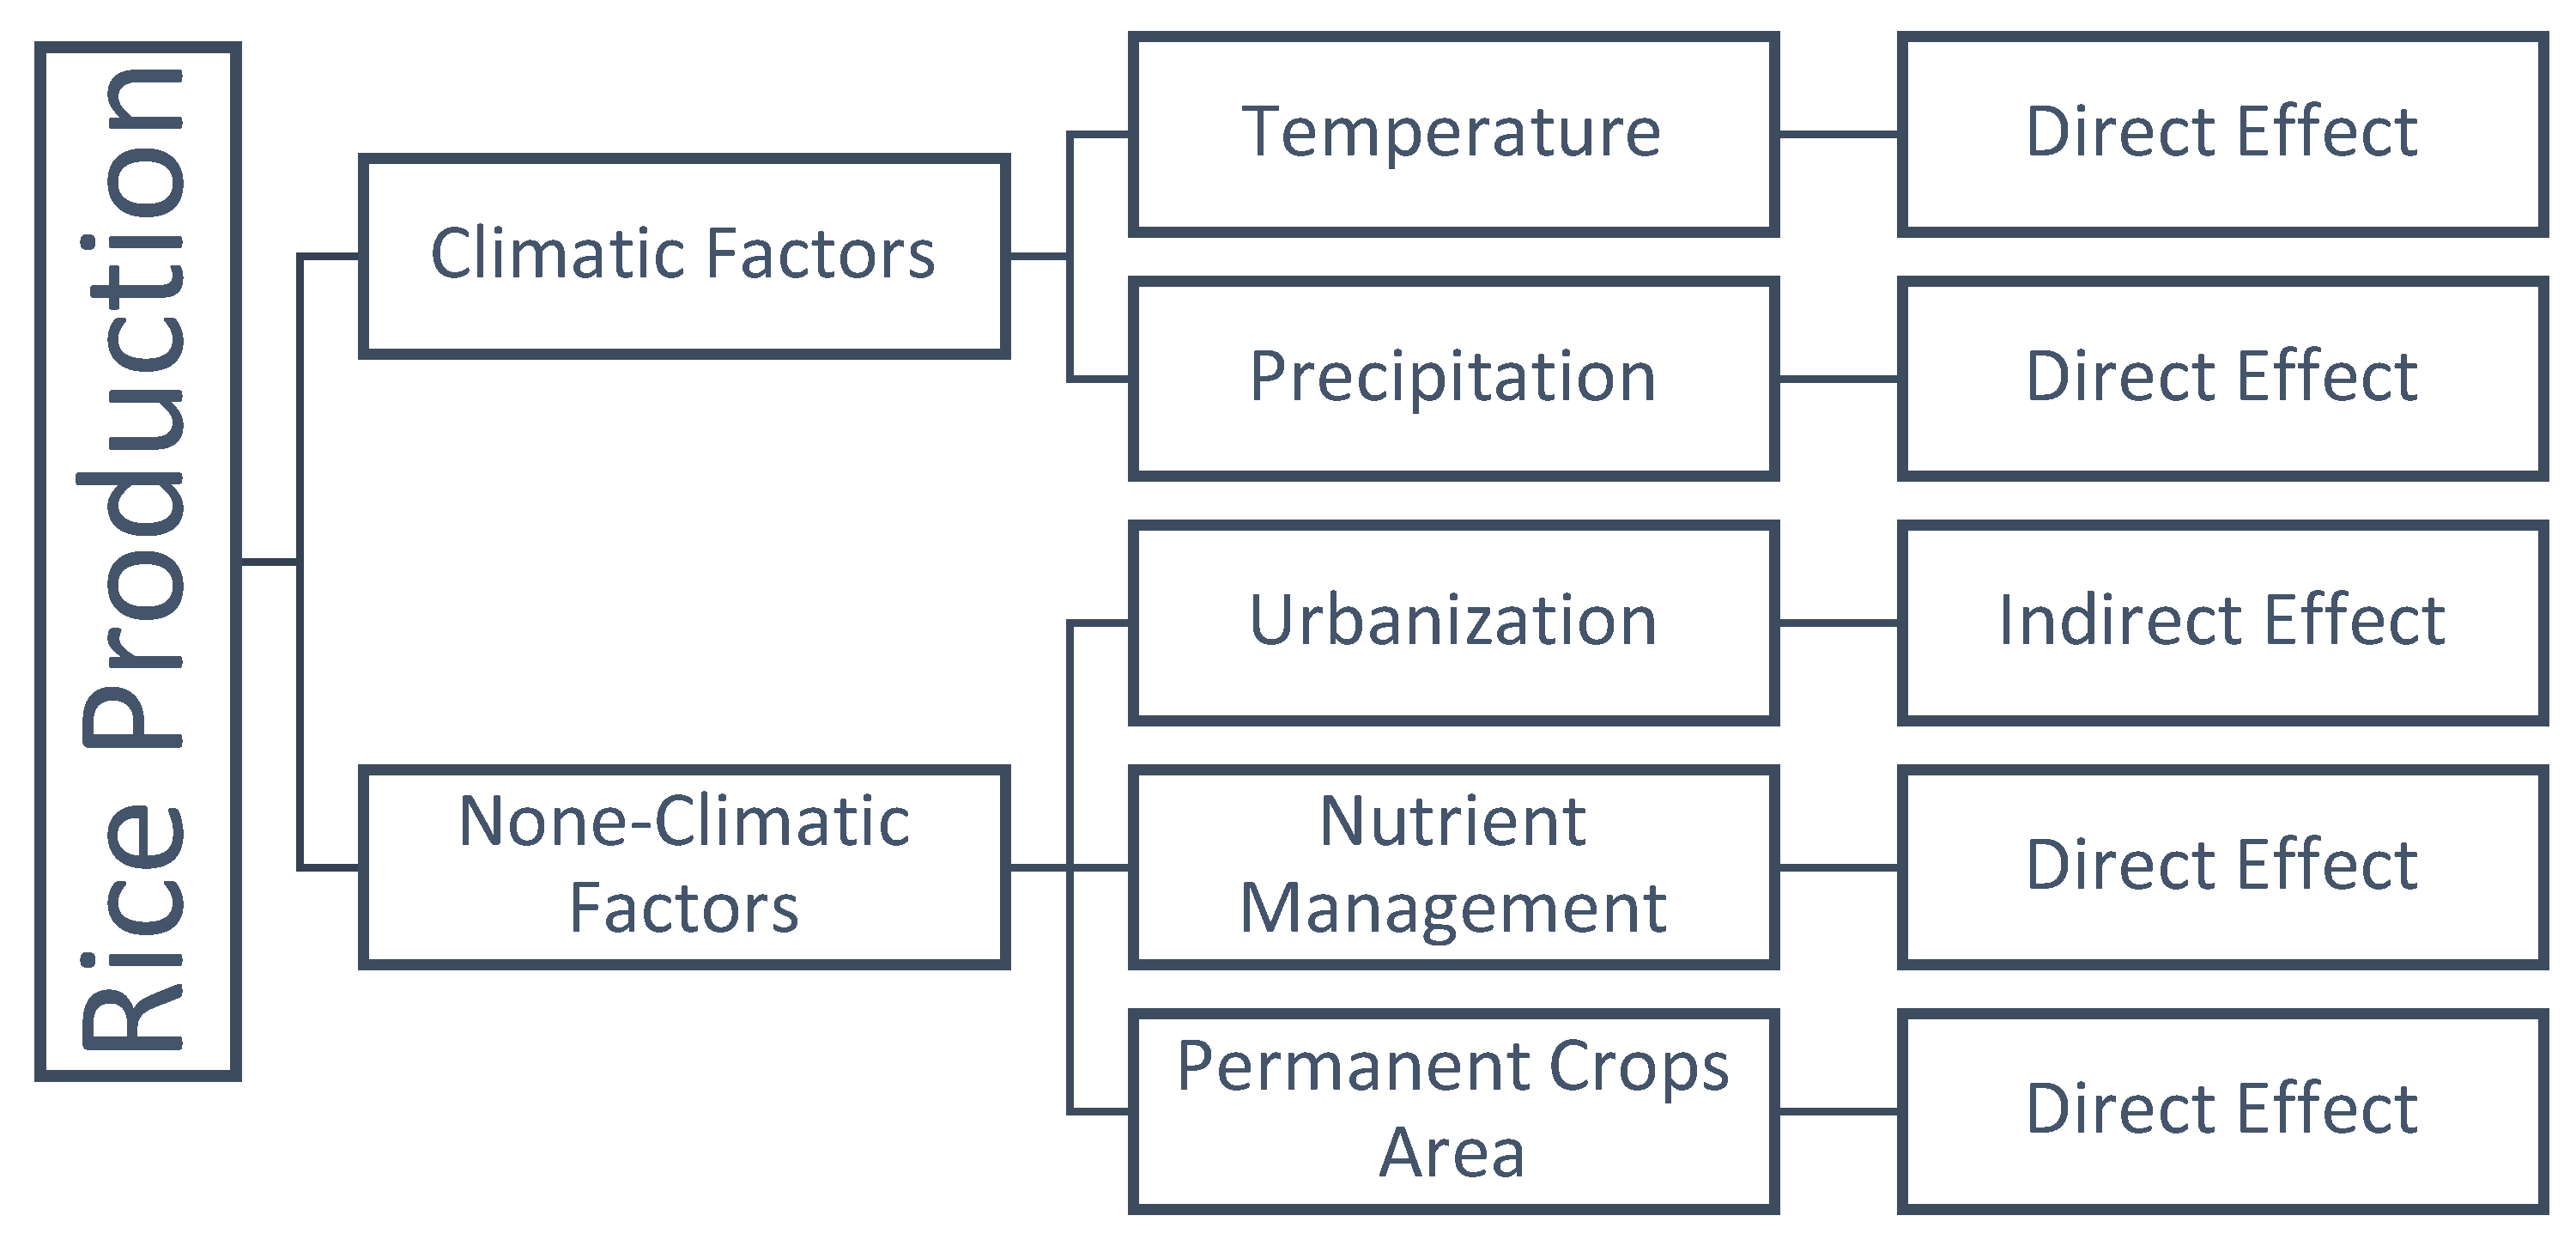
Figure 2.
Illustrates the methodological approach employed in this study.
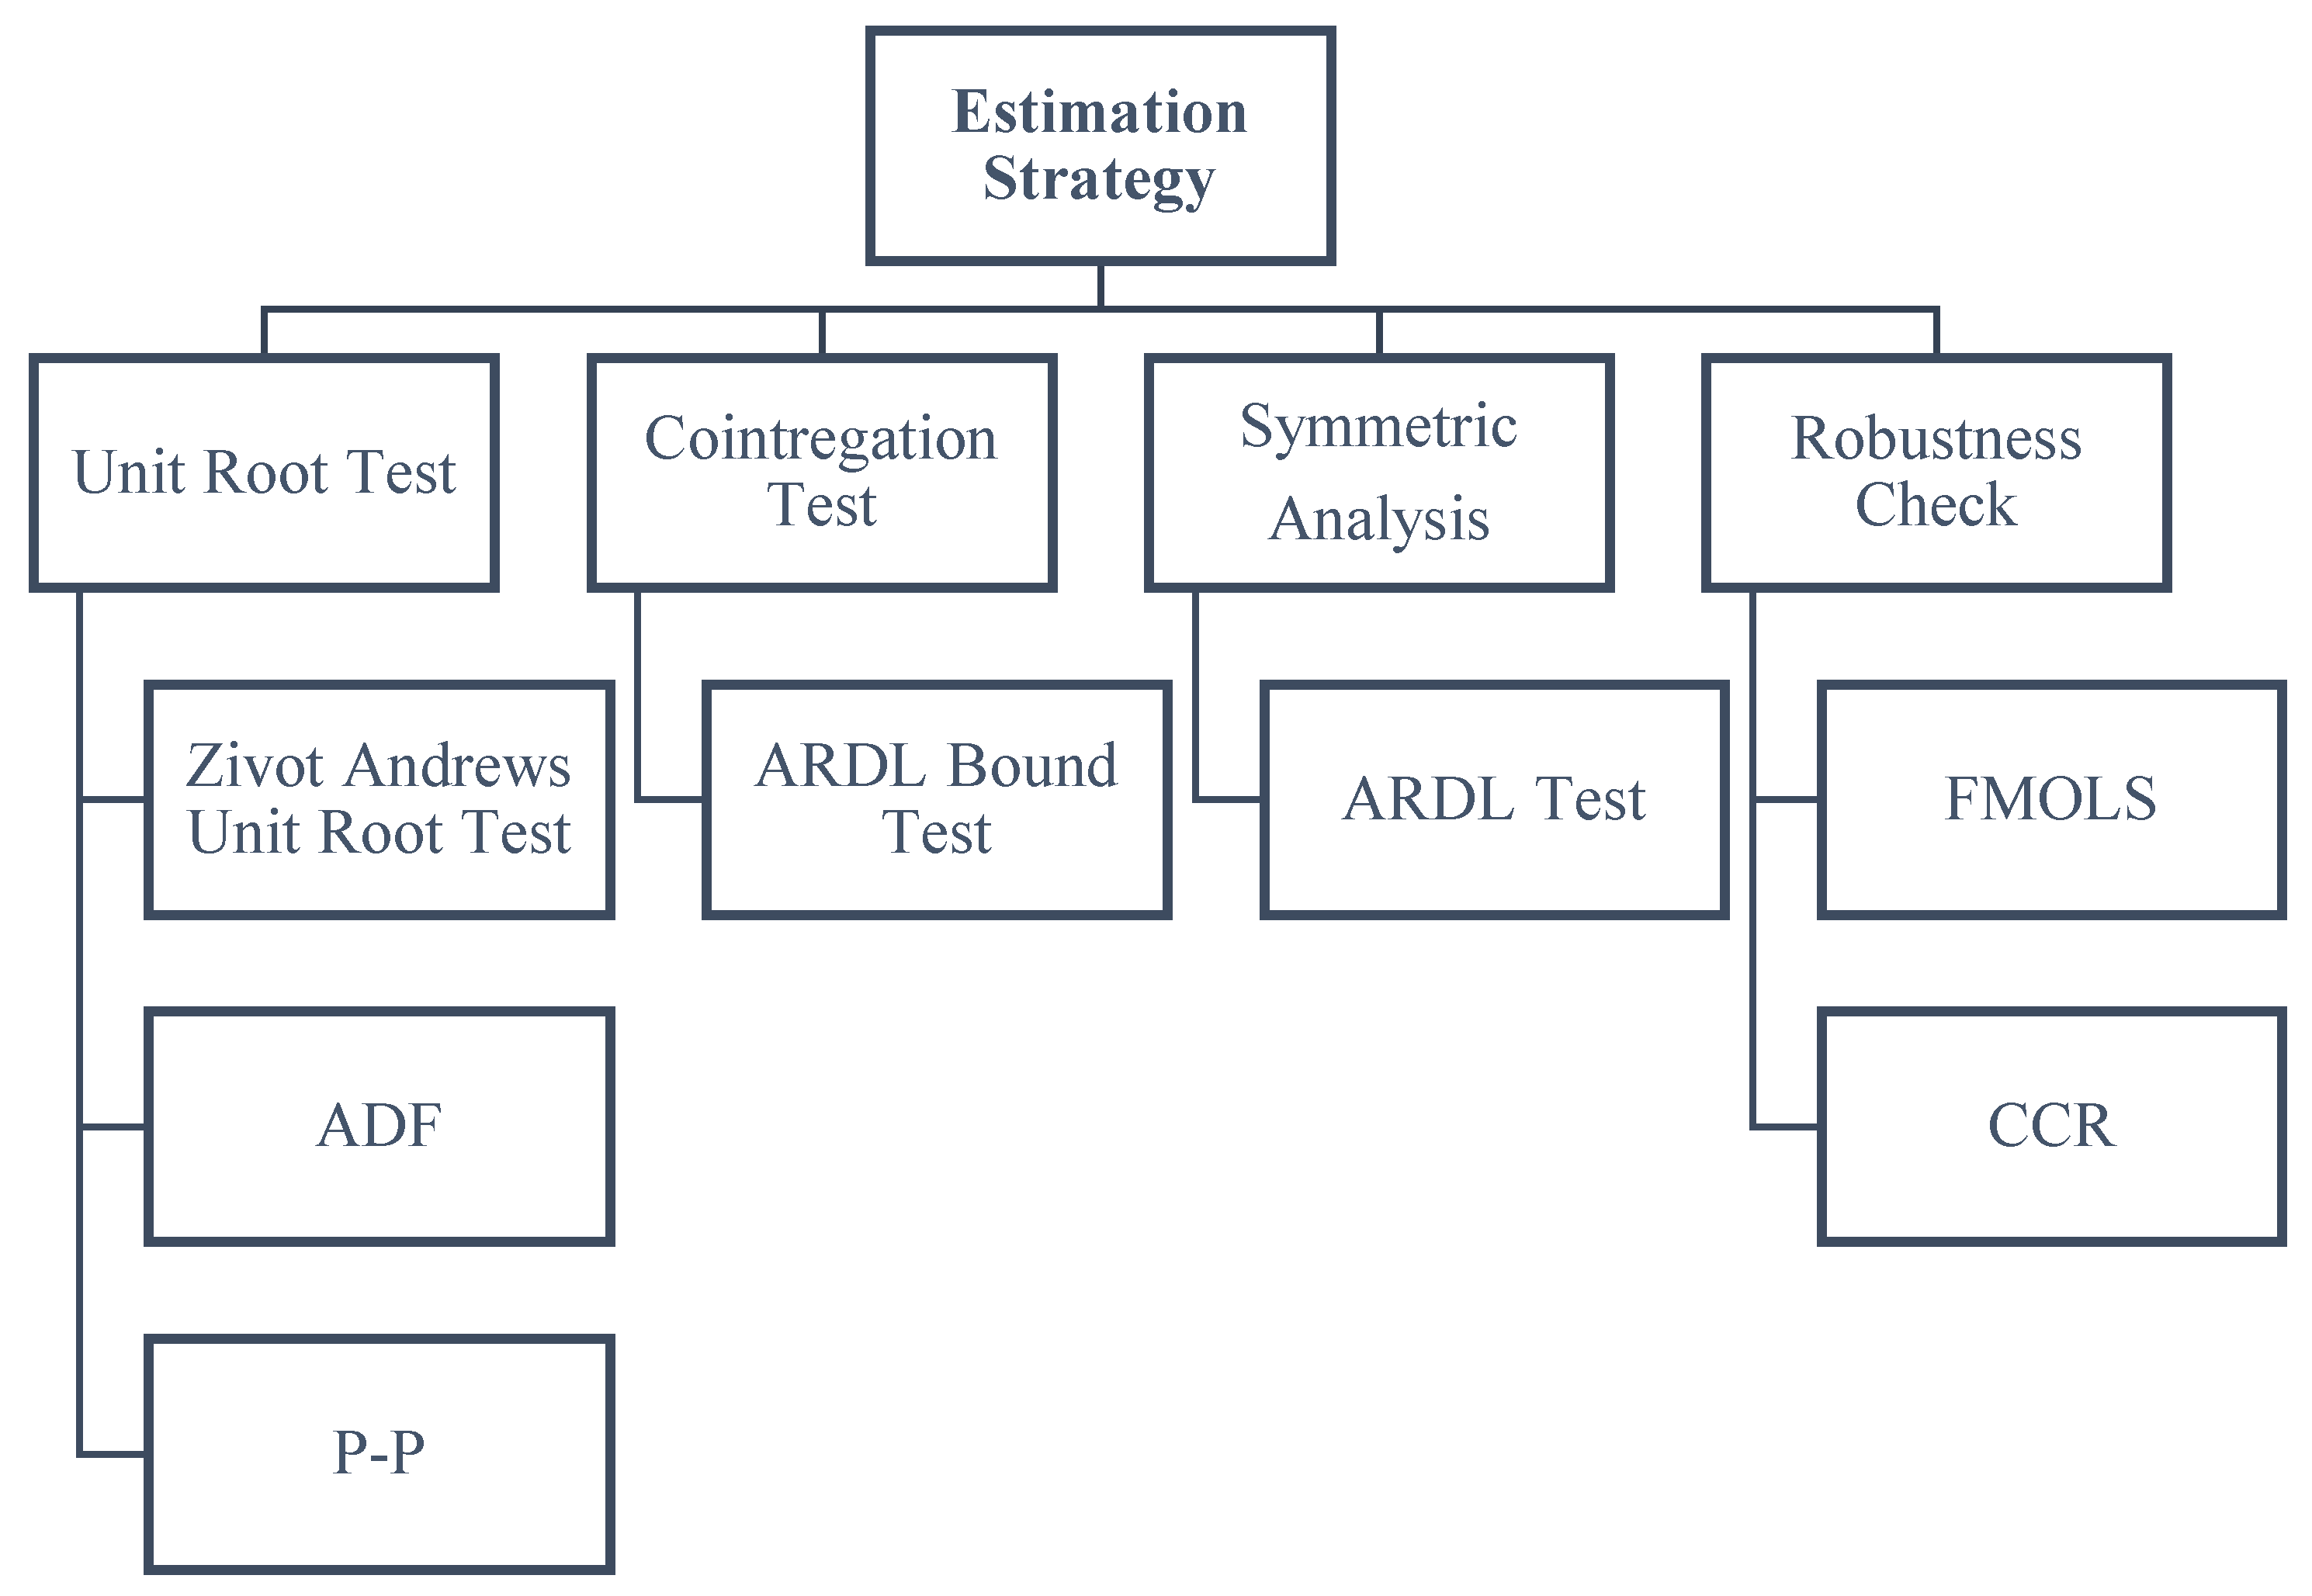
Figure 3.
Time series plots of the variables from 1990 to 2020.
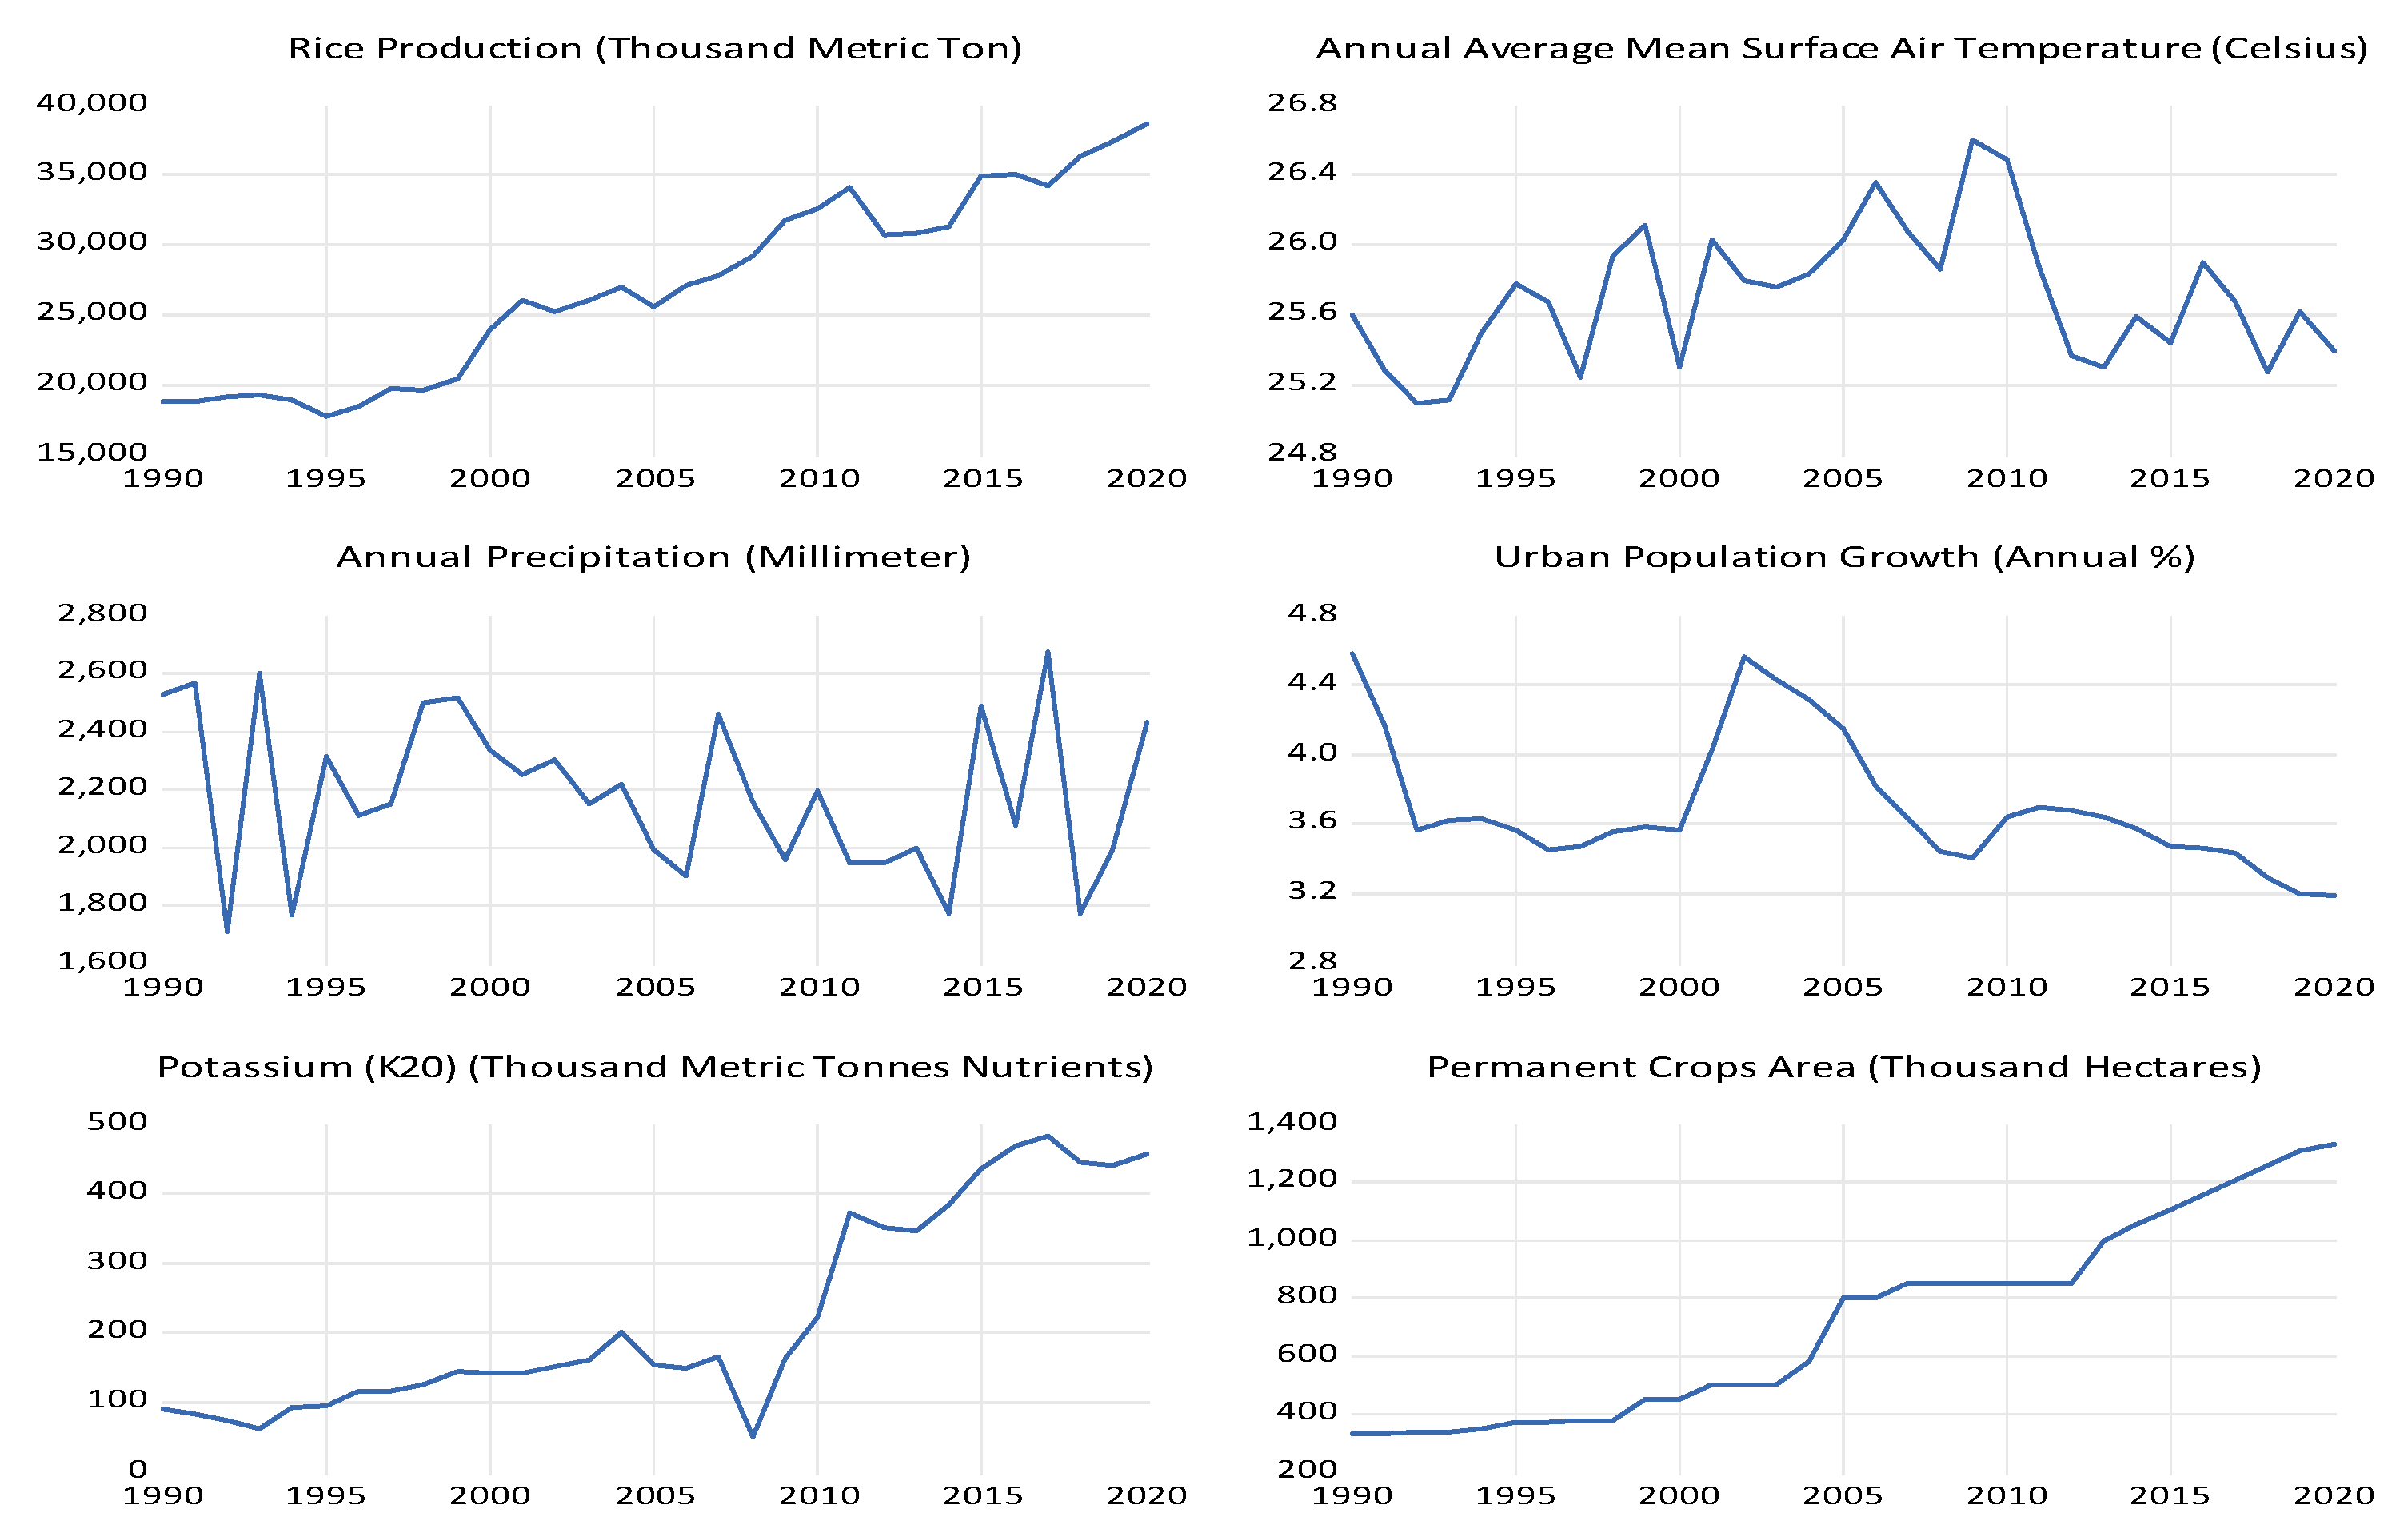
Figure 4.
(a) The cumulative sum recursive residuals plot. (b) The cumulative sum of squared recursive residuals plot.
Figure 4.
(a) The cumulative sum recursive residuals plot. (b) The cumulative sum of squared recursive residuals plot.
| Description: | Statistic | p-values |
| R-square | 0.9291 | |
| Jarque-Bera normality test | 2.446 | 0.294 |
| Breusch-Godfrey LM test for serial correlation | 3.167 | 0.034 |
| ARCH Test for heteroskedasticity | 0.268 | 0.605 |
| White’s test for homoskedasticity | 18.95 | 0.525 |
| Ramsey RESET test | 2.404 | 0.134 |
| Durbin-Watson | 1.137379 | |
| CUSUM | Stable | |
| CUSUM square | Stable |
| Variables | FMOLS | CCR | ||
| Coefficient | Probability | Coefficient | Probability | |
| Temp | -1.29e+04 | 0.000 | -2596.125 | 0.000 |
| RainFall | -6.378 | 0.000 | -3.666 | 0.000 |
| Urban | 3664.389 | 0.000 | 2733.225 | 0.000 |
| K20 | -72.434 | 0.000 | -20.646 | 0.000 |
| CropsLand | 48.935 | 0.000 | 28.693 | 0.000 |
| _cons | 3.42e+05 | 0.000 | 75826.970 | 0.000 |
| Note: *, **, and *** denote statistical significance at the 1%, 5%, and 10% levels, accordingly | ||||

Table 1.
Specific information about the study variables.
| Variables | Abbreviation | Description | Sources |
|---|---|---|---|
| Rice Production | RicePro | Thousand metric ton | BBS |
| Temperature | Temp | Annual average mean surface air temperature in Celsius | WDI |
| Precipitation | RainFall | Annual precipitation in millimetre | WDI |
| Urbanization | Urban | Urban population growth (Annual %) | WDI |
| Nutrient Management | K20 | Potassium (K20) in thousand metric tonnes nutrients | IFASTAT |
| Permanent Crops Area | CropsLand | Permanent crops area in thousand hectares | FAO |
Table 2.
The summary statistics.
| Variables | Obs | Mean | Std. Dev. | Min | Max | Skew. | Kurt. |
|---|---|---|---|---|---|---|---|
| RicePro | 31 | 26985.095 | 6613.649 | 17736.89 | 38695.33 | 0.079 | 1.698 |
| Temp | 31 | 25.706 | 0.389 | 25.09 | 26.6 | 0.434 | 2.62 |
| RainFall | 31 | 2185.551 | 275.911 | 1710.4 | 2674.16 | 0.013 | 1.915 |
| Urban | 31 | 3.704 | 0.375 | 3.187 | 4.584 | 1.078 | 3.227 |
| K20 | 31 | 221.961 | 145.292 | 50 | 483.4 | 0.673 | 1.843 |
| CropsLand | 31 | 718.419 | 335.902 | 330 | 1328 | 0.358 | 1.76 |
| Note: *, **, and *** denote statistical significance at the 1%, 5%, and 10% levels, accordingly | |||||||
Table 3.
Pairwise correlations.
| Variables | (1) | (2) | (3) | (4) | (5) | (6) | |
|---|---|---|---|---|---|---|---|
| (1) RicePro | 1.000 | ||||||
| (2) Temp | 0.158 | 1.000 | |||||
| (3) RainFall | -0.203 | -0.012 | 1.000 | ||||
| (4) Urban | -0.383* | 0.122 | 0.173 | 1.000 | |||
| (5) K20 | 0.867* | -0.118 | -0.129 | -0.419* | 1.000 | ||
| (6)CropsLand | 0.954* | 0.094 | -0.197 | -0.485* | 0.884* | 1.000 | |
| Note: * denote statistical significance at the 1%, 5%, and 10% levels, accordingly | |||||||
Table 4.
Unit root test results.
| Variables | ADF | P-P | Structural breakUnit Root Test | |||||
| t-statistic I(0) | t-statistic I(1) | t-statistic I(0) | t-statistic I(1) | t-statistic I(0) | Break-point | t-statistic I(1) | Break-point | |
| RicePro | 0.196 | -3.074*** | 0.345 | -5.230*** | -3.218 | 1995 | -5.294*** | 2001 |
| Temp | -2.183 | -3.441** | -2.963* | -7.537*** | -4.865** | 2008 | -6.385*** | 2014 |
| RainFall | -2.776** | -4.321*** | -6.895*** | -14.841*** | -7.389*** | 2014 | -12.431*** | 1995 |
| Urban | -2.387 | -2.913* | -2.645* | -3.447** | -4.307* | 2003 | -3.912 | 1995 |
| K20 | -0.487 | -3.675** | -0.217 | -5.611*** | -2.993 | 2008 | -5.806*** | 2016 |
| CropsLand | 0.659 | -3.382** | 0.965 | -4.715*** | -2.836 | 1998 | -5.069*** | 2006 |
| Note: *, **, and *** denote statistical significance at the 1%, 5%, and 10% levels, accordingly | ||||||||
Table 5.
ARDL bound test results.
| Model | Optimal lag | F-statistic | t-statistic |
|---|---|---|---|
| AIC=4 | 6.778*** | -4.758** | |
| Critical values | 1% | 5% | 10% |
| F test: I(0) | 3.41 | 2.62 | 2.26 |
| F test: I(1) | 4.68 | 3.79 | 3.35 |
| T test: I(0) | -3.43 | -2.86 | -2.57 |
| T test: I(1) | -4.79 | -4.19 | -3.86 |
|
Notes: (1)*, **, and *** denote statistical significance at the 1%, 5%, and 10% levels, accordingly (2) AIC is an abbreviation for Akaike Information Criterion. | |||
Table 6.
Findings of the long-run and short-run asymmetry ARDL model.
| Variables | Coefficient | Std. Error | t-Statistic | Probability |
|---|---|---|---|---|
| Long-run Relationship | ||||
| Temp | -2235.629 | 723.290 | -3.090 | 0.018 |
| RainFall | 3.969 | 1.480 | 2.680 | 0.031 |
| Urban | 1589.053 | 434.098 | 3.660 | 0.008 |
| K20 | -19.528 | 4.192 | -4.660 | 0.002 |
| CropsLand | 26.838 | 1.912 | 14.040 | 0.000 |
| Short-run Relationship | ||||
| ECM (-1) | -1.894 | 0.398 | -4.760 | 0.002 |
| ∆Temp | -1822.102 | 1080.068 | -1.690 | 0.135 |
| ∆RainFall | -1.744 | 0.812 | -2.150 | 0.069 |
| ∆Urban | 6235.706 | 1626.416 | 3.830 | 0.006 |
| ∆K20 | 39.794 | 11.534 | 3.450 | 0.011 |
| ∆CropsLand | -22.375 | 5.710 | -3.920 | 0.006 |
| _cons | 1.03e+05 | 35437.380 | 2.900 | 0.023 |
| Note: *, **, and *** denote statistical significance at the 1%, 5%, and 10% levels, accordingly | ||||
Table 7.
Robustness test.
| Variables | FMOLS | CCR | ||
| Coefficient | Probability | Coefficient | Probability | |
| Temp | -1.29e+04 | 0.000 | -2596.125 | 0.000 |
| RainFall | -6.378 | 0.000 | -3.666 | 0.000 |
| Urban | 3664.389 | 0.000 | 2733.225 | 0.000 |
| K20 | -72.434 | 0.000 | -20.646 | 0.000 |
| CropsLand | 48.935 | 0.000 | 28.693 | 0.000 |
| _cons | 3.42e+05 | 0.000 | 75826.970 | 0.000 |
| Note: *, **, and *** denote statistical significance at the 1%, 5%, and 10% levels, accordingly | ||||
Table 8.
Diagnostic tests.
| Description: | Statistic | p-values |
| R-square | 0.9291 | |
| Jarque-Bera normality test | 2.446 | 0.294 |
| Breusch-Godfrey LM test for serial correlation | 3.167 | 0.034 |
| ARCH Test for heteroskedasticity | 0.268 | 0.605 |
| White’s test for homoskedasticity | 18.95 | 0.525 |
| Ramsey RESET test | 2.404 | 0.134 |
| Durbin-Watson | 1.137379 | |
| CUSUM | Stable | |
| CUSUM square | Stable |
Table 9.
Pairwise Granger causality test.
| Null Hypothesis | F-Statistic | Prob | Relationship directions |
|---|---|---|---|
| 1.10263 | 0.3855 | No Significant Effect | |
| 0.98194 | 0.4421 | ||
| 1.29059 | 0.3107 | RainFall ← RicePro | |
| 3.15339** | 0.0395 | ||
| 0.20354 | 0.9331 | Urban ← RicePro | |
| 4.88232*** | 0.0076 | ||
| 3.94570** | 0.0180 | K20 → RicePro | |
| 1.04953 | 0.4096 | ||
| 1.56530 | 0.2263 | CropsLand ← RicePro | |
| 2.54843** | 0.0750 | ||
| Note: *, **, and *** denote statistical significance at the 1%, 5%, and 10% levels, accordingly | |||
Disclaimer/Publisher’s Note: The statements, opinions and data contained in all publications are solely those of the individual author(s) and contributor(s) and not of MDPI and/or the editor(s). MDPI and/or the editor(s) disclaim responsibility for any injury to people or property resulting from any ideas, methods, instructions or products referred to in the content. |
© 2024 by the authors. Licensee MDPI, Basel, Switzerland. This article is an open access article distributed under the terms and conditions of the Creative Commons Attribution (CC BY) license (http://creativecommons.org/licenses/by/4.0/).
Copyright: This open access article is published under a Creative Commons CC BY 4.0 license, which permit the free download, distribution, and reuse, provided that the author and preprint are cited in any reuse.


