Preprint
Article

Determination of Nine Fentanyl and Six Amphetamine Drugs in Hair Samples by GC-MS/MS and LC-MS/MS

Altmetrics

Downloads

62

Views

43

Comments

0

This version is not peer-reviewed

Submitted:

02 September 2024

Posted:

03 September 2024

You are already at the latest version

Alerts
Abstract
Background: We prepared reference materials of fentanyl and amphetamines in hair, and established methods for the certification of reference materials of fentanyl and amphetamines in hair samples. Methods: Hair samples containing 15 drugs were prepared by immersion method (water-dimethylsulfoxide). On the basis of single-factor experiment, Box-Behnken design-response surface was used to optimize the pre-treatment conditions of samples. In MRM/SIM mode, 15 drugs were quantitatively analyzed by LC-MS/MS and GC-MS/MS methods. Results: The contents of 15 drugs in the mixed hair samples were: 1.050 ng mg-1~7.771 ng mg-1, RSDs<7%(n=11). The results showed that the two analytical methods developed were highly sensitive (LODs as low as 0.05 pg mg-1), reproducible (intra-day and inter-day precision RSDs were<10%) and accurate. F-test was performed on the prepared hair samples and the results showed that the homogeneity of the prepared hair samples was good. Conclusions: The established methods were used for the detection of fentanyl and amphetamine drugs in human hair, with high sensitivity, accuracy and specificity. It can be used as a certified method for the development of fentanyl and amphetamine matrix certified reference materials. The developed hair reference materials are expected to be applied in forensic drug abuse detection and laboratory quality control.
Keywords: 
Subject: Chemistry and Materials Science  -   Analytical Chemistry

1. Introduction

Fentanyl, as an opioid anesthetic and analgesic, has been widely used in surgical procedures since the 1960s. The efficacy of fentanyl is 50~100 times that of morphine, and the efficacy of many of its analogs is thousands of times that of heroin. It has unique advantages in combined anesthesia, childbirth analgesia, large-scale surgical analgesia treatment, and cancer pain management. However, fentanyl can cause adverse reactions such as respiratory depression, decreased consciousness, and coma, as well as hypercapnia, bradycardia, and pupil constriction. In addition, fentanyl can activate opioid receptors in the human body, causing excitatory and stimulating effects, with strong addiction and tolerance. The abuse of fentanyl has emerged[1,2,3,4,5,6]. Additionally, the process of synthesizing fentanyl-like substances through artificial means is both simple and convenient. By modifying the phenylalkyl and propionyl groups in the structure of fentanyl, especially the 4-piperi dine ring, many new fentanyl analogs can be derived. Most of which retain the original efficacy or have stronger pharmacological effects of fentanyl. The emergence of new fentanyl analogs necessitates that forensic and clinical laboratories around the world urgently update their analytical procedures. Blood and urine analysis can provide short-term information related to drug abuse, while long-term drug abuse history needs to be traced through hair analysis. The commonly used detection methods for fentanyl drugs and their metabolites in biological matrices mainly include immunoassay, GC-MS/MS, and LC-MS/MS [7,8,9,10,11,12,13,14,15,16,17]. Amphetamine Type Stimulants (ATS) are a collective term for amphetamines and their derivatives. According to their chemical structure and pharmacological effects, they can be divided into excitatory amphetamines, hallucinogenic amphetamines, appetite amphetamines, and mixed amphetamines. Mainly including drugs such as Amphetamine(AP), Methamphetamine(MA), 3,4-Methylenedioxy-N-ethylamphetamine(MDEA), 3,4-Methylenedioxymethamphetamine(MDMA), (±)-3,4-Methylenedioxyamphetamine(MDA) and ephedrine. ATS is a type of central nervous system stimulant with strong excitatory effects, addiction, and tolerance, making it the second most widely abused banned drug in the world [18]. The adverse reactions of ATS abuse mainly include mental damage such as causing acute and chronic mental disorders, and physiological damage such as damaging the heart and causing arrhythmia, which can seriously endanger the physical and mental health of drug users [19,20,21,22]. The commonly used detection methods for amphetamines in hair include immunoassay, chromatography, GC-MS/MS, and LC-MS/MS [23,24,25,26]. Due to the small molecular weight and easy volatility of ATS, GC-MS/MS is an important analytical method for detecting amphetamines in forensic toxicology. However, ATS structures contain polar groups, such as amino groups, and the levels of amphetamines and their metabolites in the hair are generally low. To enhance chromatographic behavior and sensitivity, derivatization is often necessary in the analysis process, typically employing acylation to transform amino groups into amides. The derivatization reagents frequently selected include PFPA, HFBA, and TFAA, among others, and the pre-treatment procedure is cumbersome and time-consuming. Compared with GC-MS/MS, LC-MS/MS features simpler sample pretreatment and does not require derivatization. This technique offers unique advantages in the qualitative and quantitative analysis of amphetamines and has seen increasing utilization.
In this study, we developed a fast, accurate, and sensitive analytical method based on GC-MS/MS and LC-MS/MS for the determination of 9 fentanyl and 6 amphetamine in hair. The sample preparation process of the method is simple, fast, and easy to operate. The LC-MS/MS method has high sensitivity and a quantification limit as low as 0.25 pg mg-1. The GC-MS/MS method obviates the need for derivatization and is immediately applicable to qualitative and quantitative analysis. The established method facilitates the detection of fentanyl and amphetamines in human hair, providing high sensitivity, accuracy, and specificity.

2. Results

2.1. Selection of Soaking Time for Hair Sample Preparation

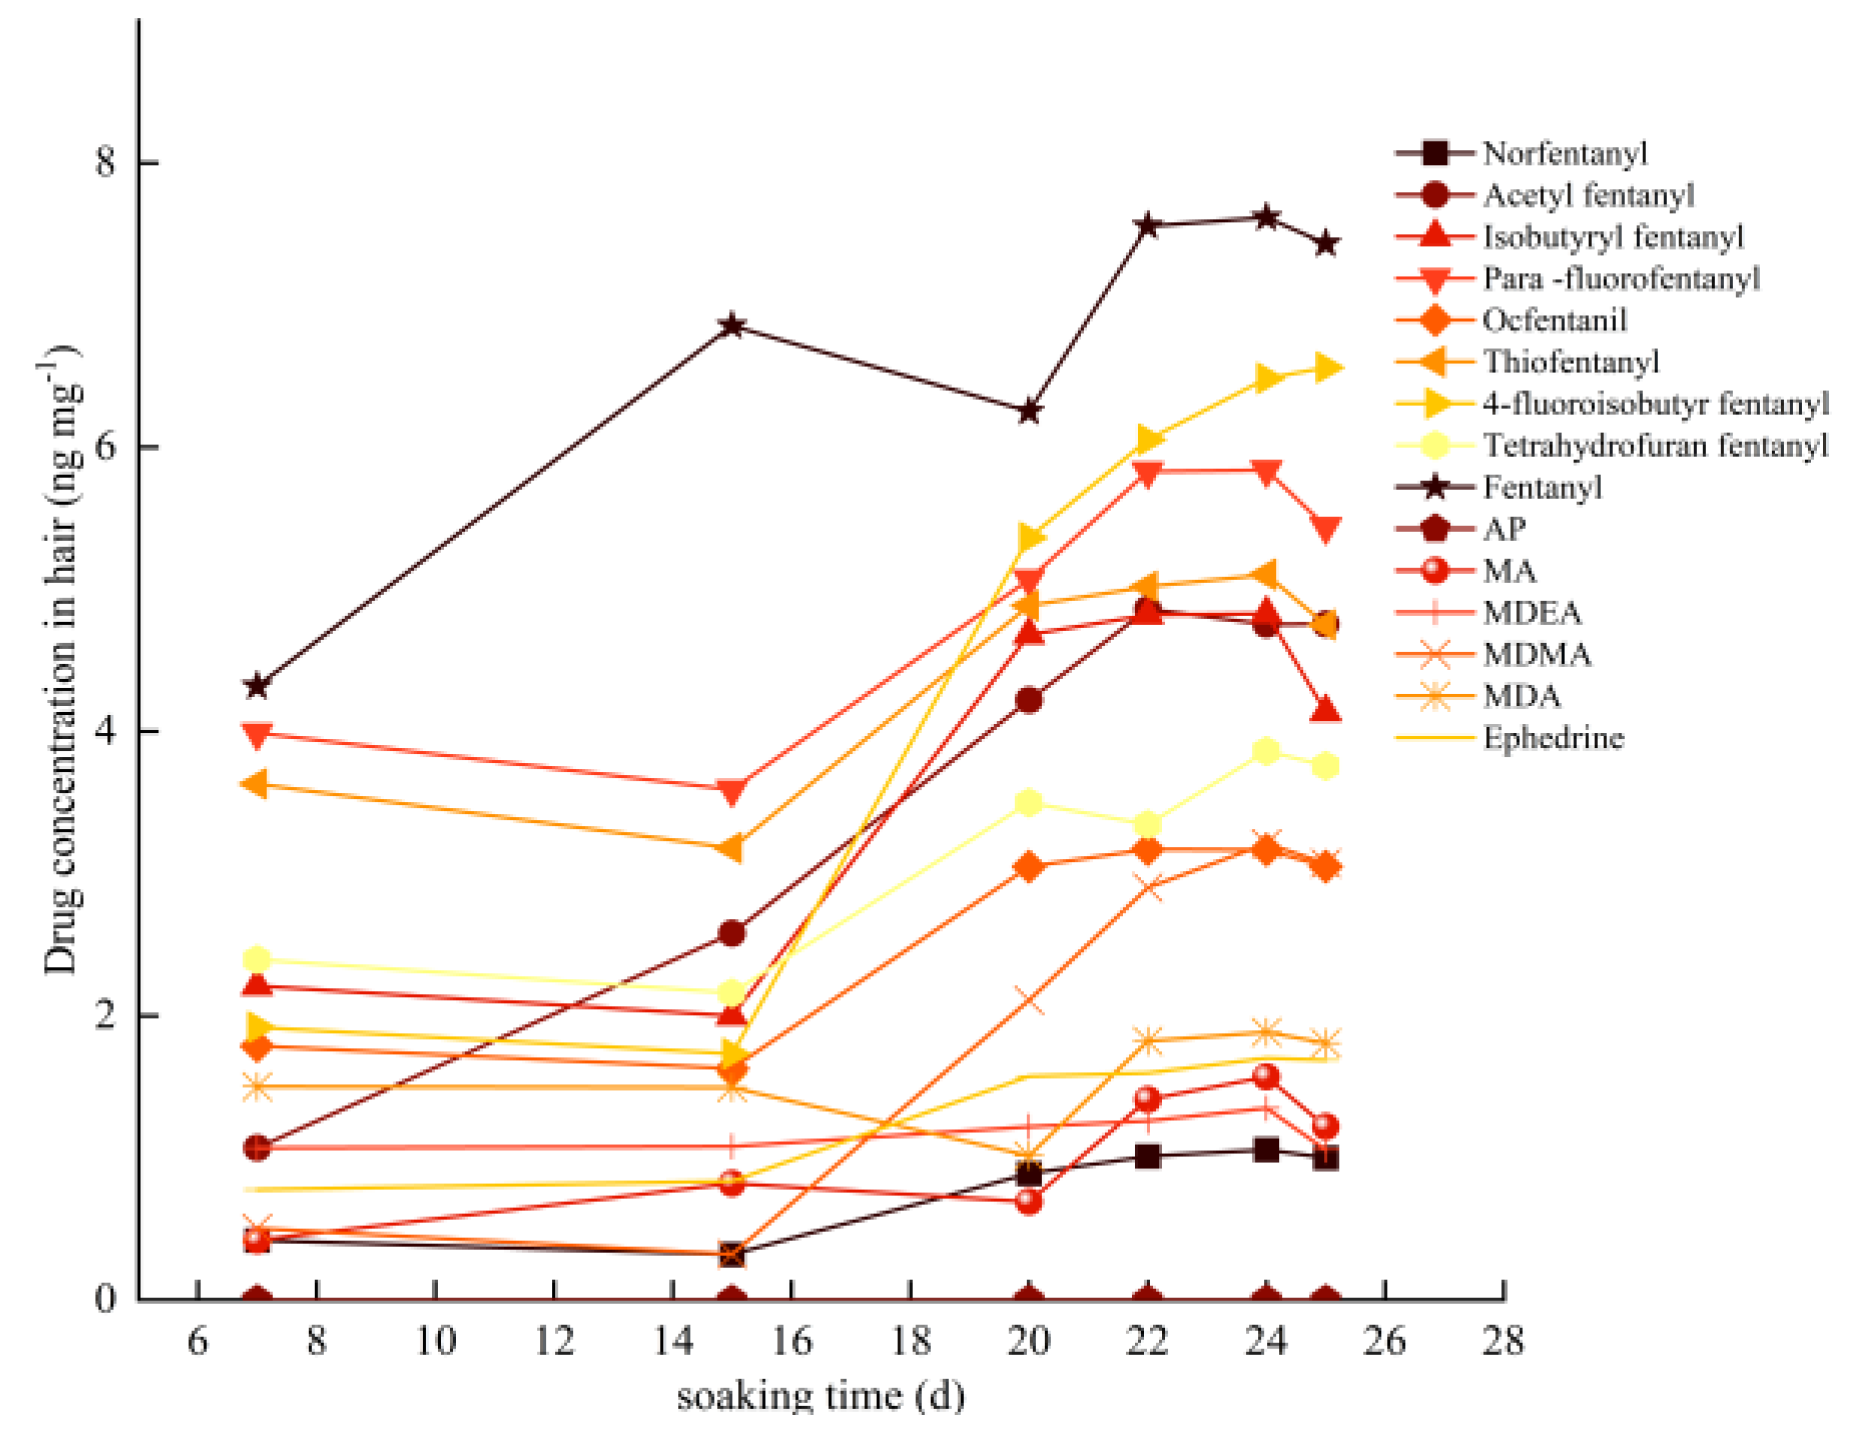
A portion of the sample was taken on days 7, 15, 20, 22, 24, and 25 after immersion in the hair sample preparation process and analyzed using LC-MS/MS. Figure 1 shows the relationship between the amounts of drugs incorporated in hairs and the time of soaking in the DMSO solution. The results showed that the amount of drug increased with the duration of immersion from 7 to 22 days, with the highest concentration of drug entering the hair when the immersion time reached 24 days. The decrease in the concentration of the drug in the hair at day 25 may be due to the fact that some of the drug may have been freed from the hair during the soaking process, resulting in a decrease in concentration. During the soaking process, the concentration of the drug in the hair may reach saturation, resulting in the precipitation of part of the drug and a decrease in the concentration.

2.2. Optimization of Sample Pretreatment Conditionsres

Based on relevant literature and the structural characteristics of drugs, an experiment was conducted to explore the effects of acid hydrolysis, alkaline hydrolysis, and methanol ultrasonic hydrolysis on drug concentration in hair. The results showed that acid hydrolysis resulted in a higher drug concentration in hair as compared to alkaline hydrolysis and methanol ultrasonic extraction. To determine the reasonable experimental factors and levels, a single-factor variable method combined with response surface analysis was used to investigate the effects of different extraction temperatures, extraction times, liquid-to-material ratios, and hydrochloric acid concentrations on drug concentration. Response surface methodology is a statistical method that is useful for solving problems that involve multiple factors. This method compensates for the limitations of orthogonal experiments, which can only combine factor levels and are unable to optimize the optimal process. In a recent experiment, Box Benhnken response surface methodology was used to optimize the ultrasound extraction conditions of 15 drugs in hair and establish a mathematical model. This experiment was based on single-factor experiments. An experiment with four factors and three levels was designed using Design Expert13.0 software to explore the optimal conditions for extracting drugs from hair. The evaluation criteria were based on the drug concentration in the hair. Extraction temperature, extraction time, liquid-to-material ratio, and hydrochloric acid concentration were used as independent variables. Taking methamphetamine as an example, the quadratic multiple regression equation between the fitted drug concentration (ng mg-1) and extraction temperature (a), extraction time (b), liquid-to-material ratio (c), and hydrochloric acid concentration (d) are drug concentration (ng mg-1) =1.56-0.2153a+0.0629b-0.0903c+0.0844d-0.0762ab+0.0209ac+0.0669ad-0.0273bc+ 0.0641bd+ 0.2007cd-0.2592a2-0.3245b2+ 0.0469c2+0.0710d2.
The Model F-value of 3.97 implies the model is significant. There is only a 0.73% chance that an F-value this large could occur due to noise. P-values less than 0.0500 indicate model terms are significant. In this case, A, CD, A², and B² are significant model terms. The impact of various factors on the extraction amount of 15 drugs in hair is extraction temperature (a) ˃ liquid-to-material ratio (c) ˃ hydrochloric acid concentration (d)˃ extraction time (b).
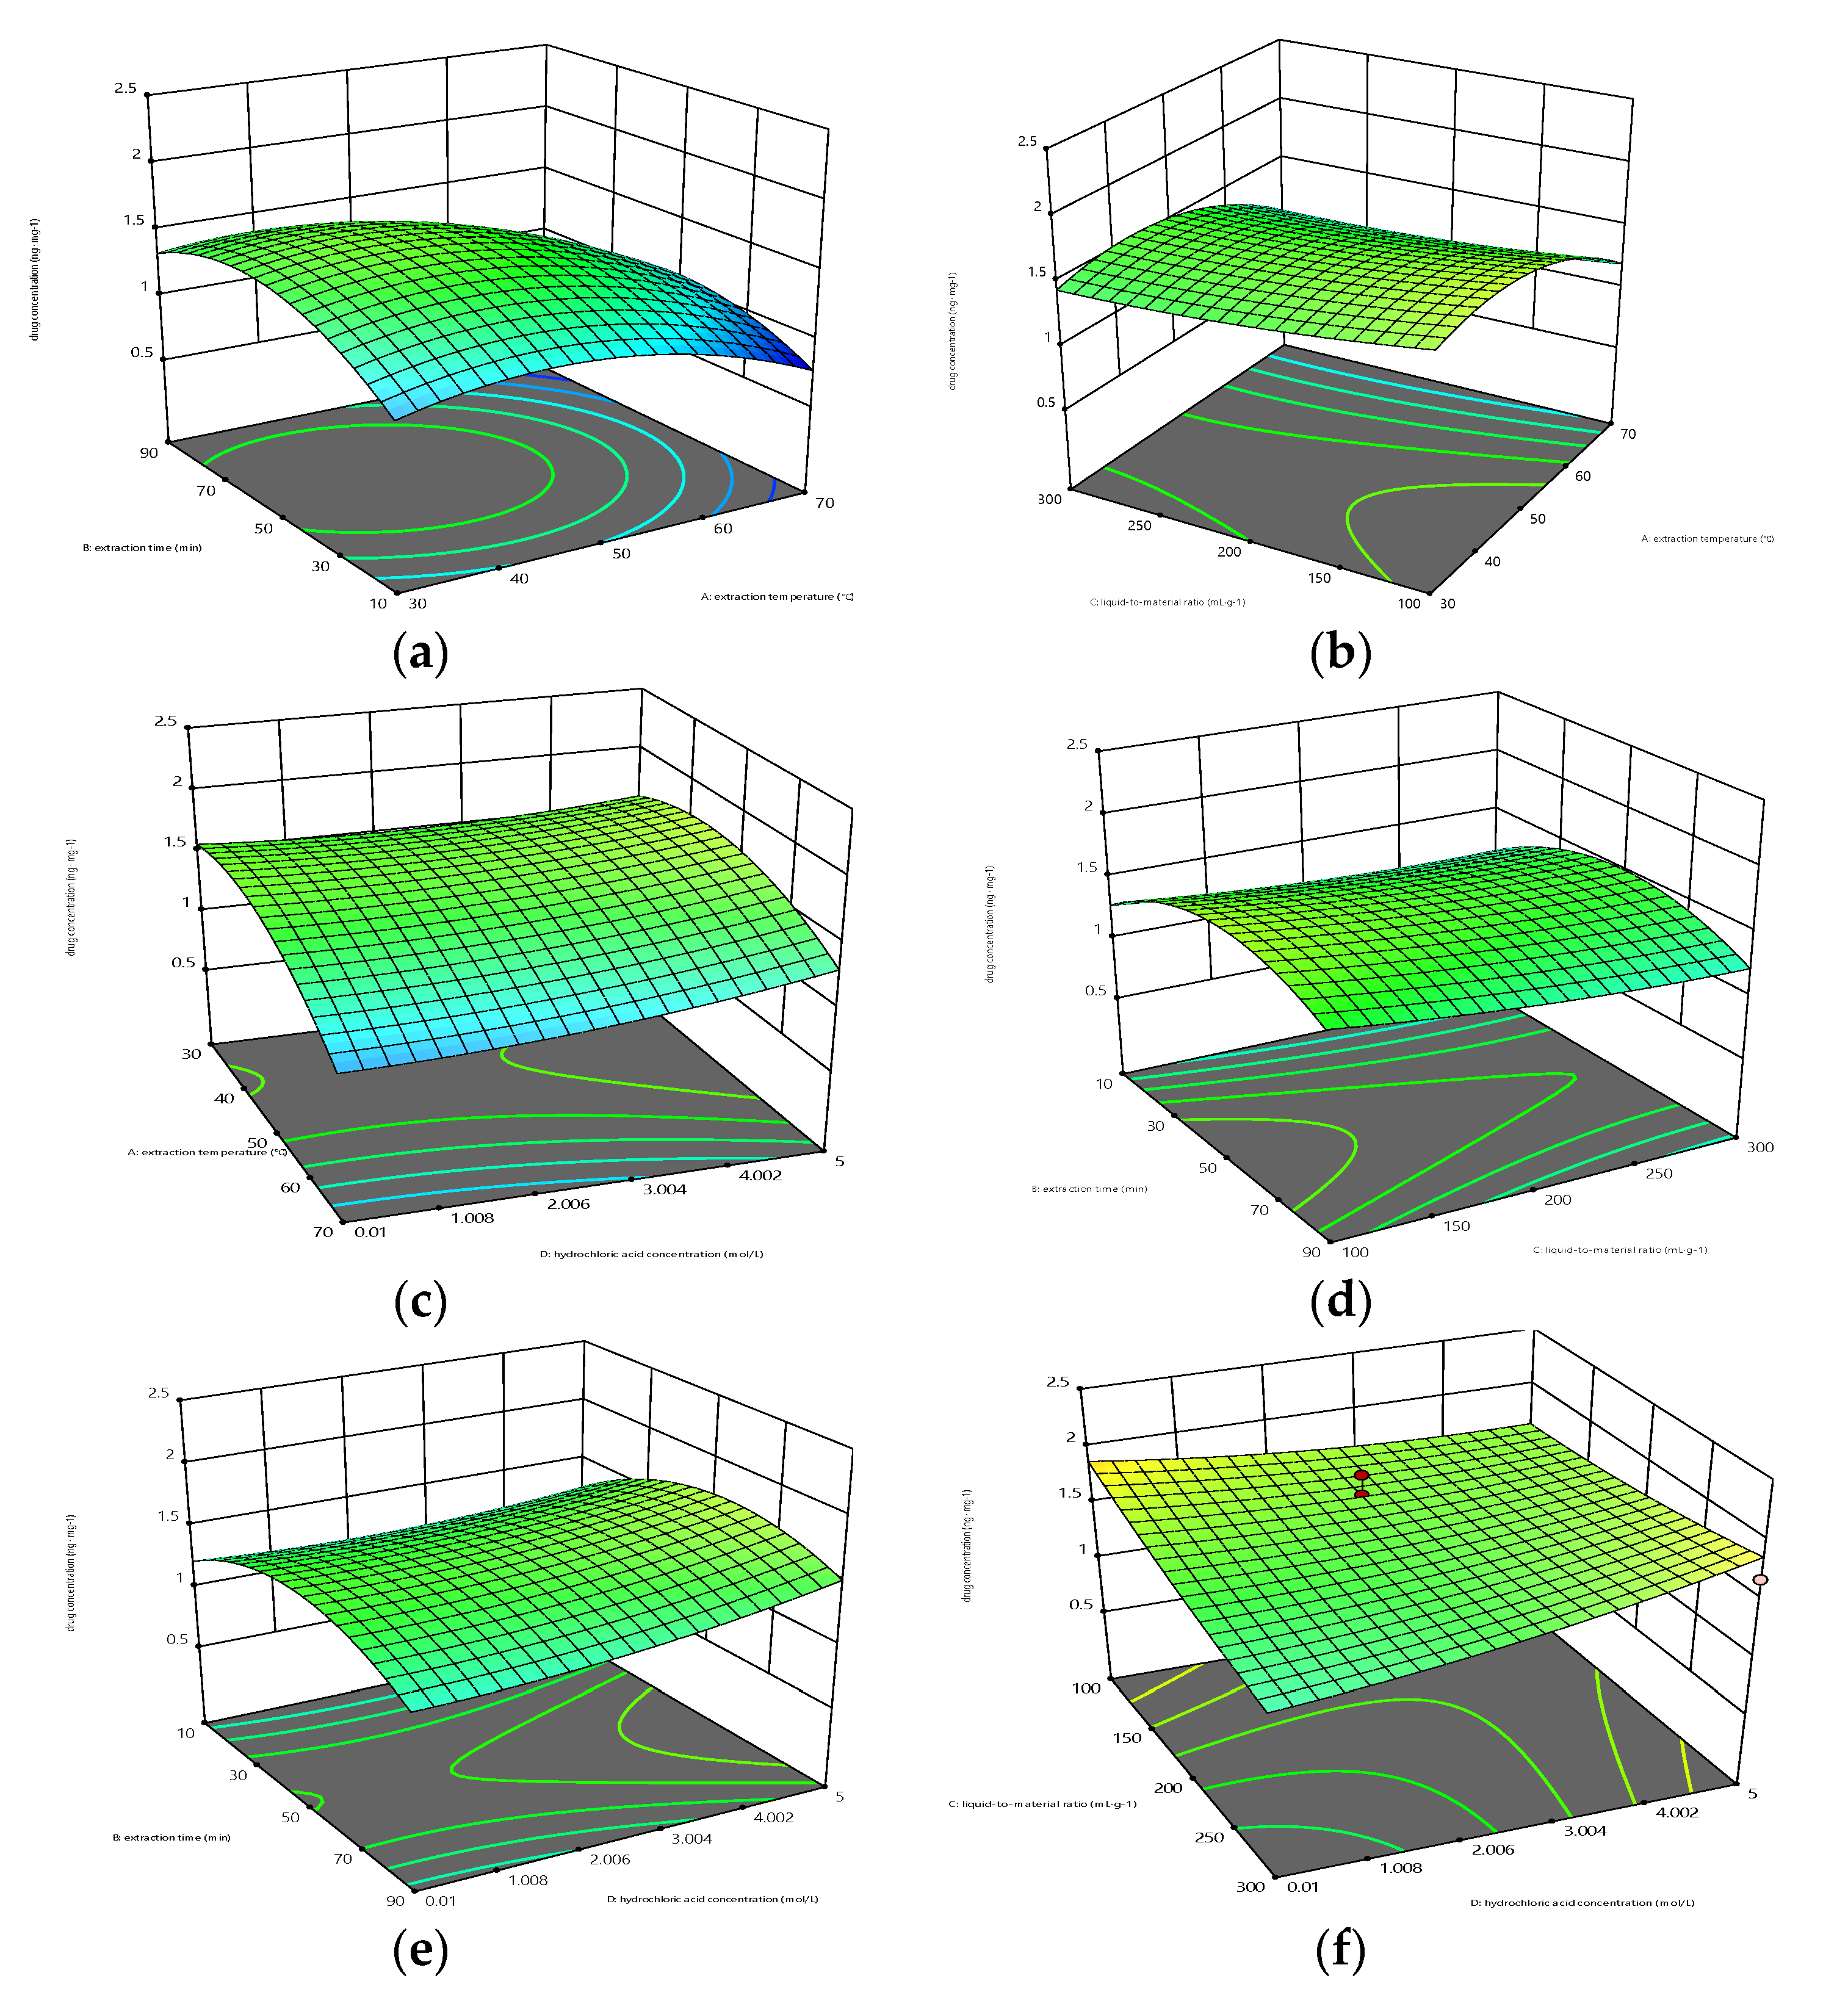
Response surface and contour maps can visually represent how different factors interact with the response value. The contour lines illustrate the magnitude of the interaction between two factors. A circular or irregular shape indicates that the interaction between two factors is not significant and has no promoting effect, while an ellipse indicates that the interaction has a significant promoting effect[27].
It is evident from Figure 2 (a) that the amount of drug extracted is affected by the extraction temperature and time. The liquid-to-material ratio is fixed at 200 mL g-1, and the hydrochloric acid concentration is fixed at 2.5 mol L-1. The trend of the extraction amount increases and then decreases as temperature and time increase. The steeper slope of the surface corresponding to temperature extraction compared to extraction time indicates that temperature has a greater impact on drug extraction than time. The contour lines are elliptical in shape, indicating a significant interaction between extraction temperature and extraction time. There is a promoting effect between the two factors, which is consistent with the results of the variance analysis of the AB term in the regression equation.
Figure 2 (b) shows that the amount of drug extracted is impacted by the extraction temperature and liquid-to-material ratio. The extraction time is fixed at 50 min, and the hydrochloric acid concentration is fixed at 2.5 mol L-1. The amount of drug extracted shows an increasing trend initially, followed by a decrease, as the extraction temperature and liquid-to-material ratio are increased. The slope of the surface corresponding to the extraction temperature is steeper than that of the liquid-to-material ratio, indicating that the influence of temperature on drug extraction is greater than that of the liquid-to-material ratio. The contour line is not a complete ellipse, indicating that there is no interaction between extraction temperature and liquid-to-material ratio. This is consistent with the analysis of variance results of the AC term in the regression equation.
Figure 2 (c) shows the effects of extraction temperature and hydrochloric acid concentration on the amount of drug extraction. The slope of the curve corresponding to the concentration of hydrochloric acid rises and sharply decreases, indicating that a high concentration of hydrochloric acid will lead to a decrease in the amount of drug extracted. The contour lines show irregular shapes, indicating that there is no interaction between extraction temperature and hydrochloric acid concentration. This is consistent with the results of the analysis of variance for the AD term in the regression equation.
Figure 2 (d) shows the effect of extraction time and liquid-to-material ratio on the extraction of drug content. The slope of the surface corresponding to the liquid-to-material ratio is steeper than the extraction time, indicating that the impact of the liquid-to-material ratio on drug extraction is greater than the extraction time. The shape of the contour line indicates that the interaction between extraction time and the liquid-to-material ratio is not significant, and there is no promoting effect between the two factors, which is consistent with the results of the variance analysis of the BC term in the regression equation.
Figure 2 (e) shows the effect of extraction time and hydrochloric acid concentration on the content of extracted drugs. The slope of the curve corresponding to hydrochloric acid concentration is steeper than the extraction time, indicating that the impact of hydrochloric acid concentration on drug extraction is greater than that of extraction time. The shape of the contour line indicates that there is no promoting effect between the two factors, which is consistent with the results of the variance analysis of the BD term in the regression equation.
Figure 2 (f) illustrates how the content of extracted drugs is affected by liquid-to-material ratio and hydrochloric acid concentration. The elliptical contour line shows a significant interaction between the liquid-to-material ratio and hydrochloric acid concentration, consistent with the analysis of variance for the CD term in the regression equation.
When using Design Expert 13.0 software to predict the extraction temperature of 38℃, extraction time of 54 minutes, the liquid-to-material ratio of 100:1 (mL g-1), and hydrochloric acid concentration of 0.01 mol L-1, the drug concentration is the highest. Under this condition, the predicted value of MA is 1.973 ng mg-1. According to the actual operating conditions, the optimal extraction process was revised to an extraction temperature of 40℃, extraction time of 50 min, liquid-to-material ratio of 100:1 (mL g-1), and hydrochloric acid concentration of 0.01 mol L-1. The measured value of MA obtained is 1.915 ng mg-1. Verified the effectiveness of the response surface model. Therefore, the optimal extraction conditions for 15 drugs in the hair are an extraction temperature of 40℃, an extraction time of 50 minutes, a liquid-to-material ratio of 100:1 (mL g-1), and a hydrochloric acid concentration of 0.01 mol L-1.

2.3. Method Validation

LOD and LOQ: Add a series of low-concentration mixed standard solutions of 15 drugs to blank hair for LC-MS/MS and GC-MS/MS analysis. The LOD value was considered the concentration value giving an S/N>3 for at least three diagnosticians for each substance, while the LOQ was the minimum concentration giving an S/N>10 for at least three diagnosticions. The results showed that the detection limit of LC-MS/MS was 0.05 pg mg-1~5.0 pg mg-1, and the quantification limit was 0.25 pg mg-1~20.0 pg mg-1, indicating good sensitivity. In the GC-MS/MS method, the detection limit is 0.02 ng mg-1~0.08 ng mg-1, and the quantification limit is 0.08 ng mg-1~0.20 ng mg-1. The LOD and the LOQ of both methods meet the requirements for detecting hair-poisoning products.
Linearity and Range: Prepare a series of 6 standard solutions with different concentrations, and add an equal amount of methamphetamine D5 internal standard solution to the standard solution to form a mixed standard solution. Add blank hair samples for analysis according to pre-processing methods, and use the internal standard working curve method for quantitative analysis. Measure each concentration level three times in parallel. Draw a standard curve using the mass concentration (x) of the drug as the x-axis and the peak area ratio (y) of the drug to methamphetamine D5 as the y-axis. The results showed that in LC-MS/MS, there was a good linear relationship among 15 drugs within the concentration range of 10.0-200.0 pg mg-1, with a correlation coefficient>0.999. In GC-MS/MS, 15 drugs showed good linear relationships within the concentration range of 0.4 ng mg-1~4.5 ng mg-1, with a correlation coefficient>0.999. Both analysis methods meet the requirements of quantitative analysis.
Intraday and daytime precision experiments: Prepare hair extract and perform quantitative analysis using LC-MS/MS and GC-MS/MS. Measure 6 consecutive injections and calculate the intra-day precision. The results showed that in LC-MS/MS, RSDs<4% (n=6). Continuous measurement for 5 days, with a daytime precision of RSDs<6.0% (n=30). In GC-MS/MS, RSDs<6% (n=6). Continuous measurement for 5 days, with daytime precision RSDs<10% (n=30). The established LC-MS/MS and GC-MS/MS methods have good repeatability and meet the analysis requirements.
Stability experiment: Prepare hair extracts and inject samples at different time intervals (1, 24, 48, 72, and 96 hours) after preparation to evaluate hair sample stability. The results showed that in LC-MS/MS, RSDs<6%, and GC-MS/MS, RSDs<10%. The prepared hair extract exhibits good stability within 96 hours at room temperature.
Recovery rate and matrix effect: Accurately weigh 9 blank hair samples, add 15 drugs at low, medium, and high concentration levels, and prepare 3 parallel portions for each concentration. Determine the recovery rate using LOCTRL, MEDCTRL, and HICTRL (n=3). Quantitative analysis was conducted using LC-MS/MS and GC-MS/MS, and recovery rates were calculated at different concentrations using regression equations. The results showed that the average recovery rates of LOCTRL, MEDCTRL, and HICTRL for 15 drugs in LC-MS/MS were 96.04%-110.8%, 84.46%-104.3%, 88.69%-100.7%, and RSD ≤ 10.2%. The average recovery rates of LOCTRL, MEDCTRL, and HICTRL in GC-MS/MS were 96.84%-116.4%, 85.50%-102.1%, and 86.14%-112.9%, respectively, with RSDs<9%. This indicates that the method has high accuracy.
Evaluate the matrix effect by analyzing the ratio of peak areas obtained from low, medium, and high concentration standard solutions in blank hair matrix and pure methanol solution. The results indicate that the matrix effect in LC-MS/MS and GC-MS/MS ranges from 80% to 120%, with an RSD<15%, which meets the analysis requirements.

2.4. Quantitative Analysis

LC-MS/MS: From the 200 bottles of hair samples, randomly select 11 bottles and measure each sample 3 times. The results showed that the content of 15 drugs in the prepared hair samples was 1.012 ng mg-1~7.830 ng mg-1. Norfentanyl: (1.012±0.03) ng mg-1; Acetylfentanyl: (4.788±0.04) ng mg-1; Isobutyryl fentanyl: (4.826±0.02) ng mg-1; P-Fluorofentanyl: (5.830±0.03) ng mg-1; Ocfentanyl: (3.188±0.05) ng mg-1; Thiofentanyl: (5.010±0.04) ng mg-1; 4-fluoroisobutyryl fentanyl: (6.303±0.03) ng mg-1; Tetrahydrofuran fentanyl: (3.444±0.01) ng mg-1; Fentanyl: (7.830±0.03) ng mg-1; MA: (1.789±0.023) ng mg-1; MDEA: (1.321±0.01) ng mg-1; MDMA: (3.284±0.03) ng mg-1; Ephedrine: (1.667±0.03) ng mg-1; MDA: (1.938±0.04) ng mg-1; Amphetamine was not detected.
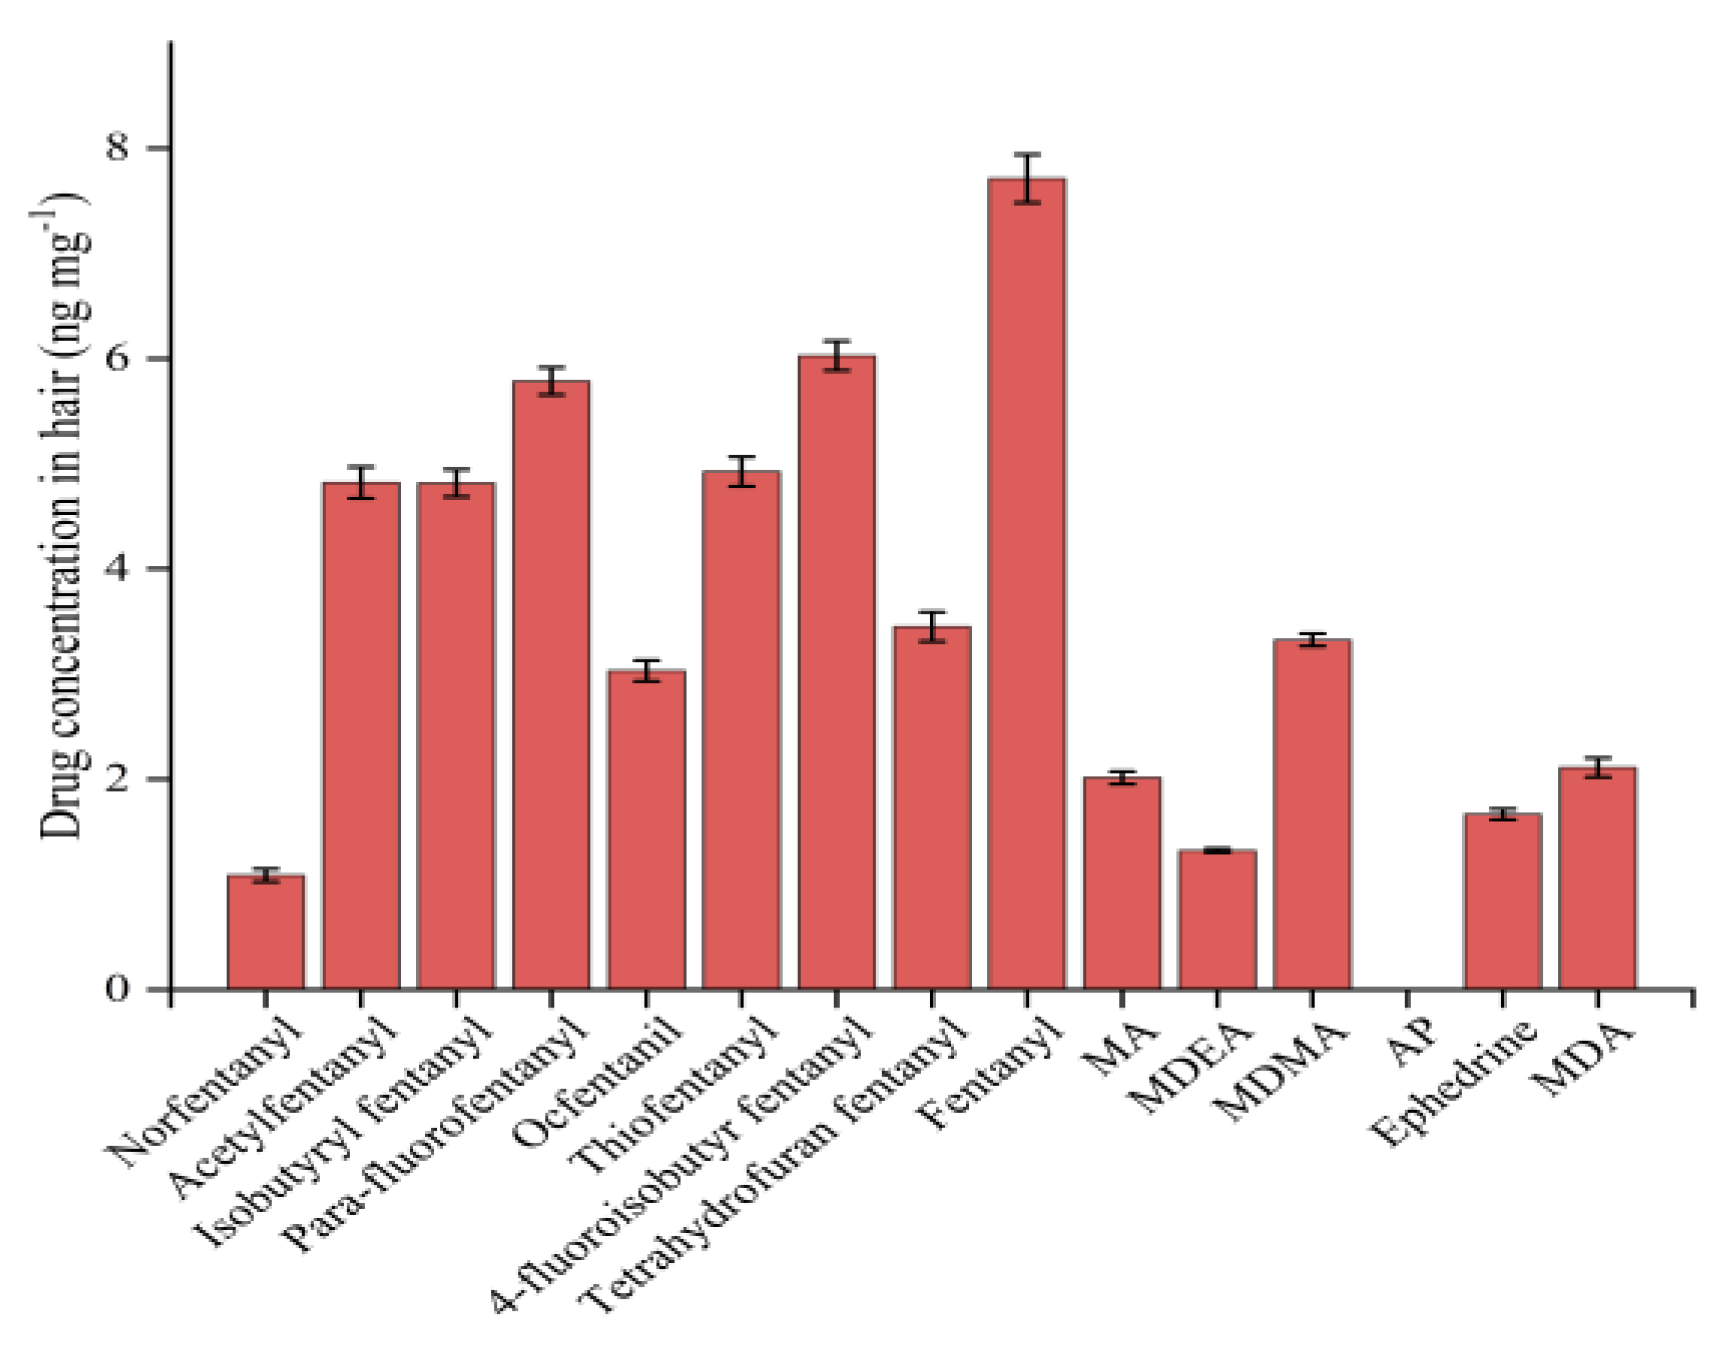
GC-MS/MS: Randomly select 11 bottles from the package of 200 hair samples and measure each bottle thrice. The results showed that the content of 15 drugs in the prepared hair samples was 1.087 ng mg-1~7.712 ng mg-1. Norfentanyl: (1.087±0.06) ng mg-1; Acetylfentanyl: (4.821±0.15) ng mg-1; Isobutyryl fentanyl: (4.816±0.13) ng mg-1; P-Fluorofentanyl: (5.786±0.13) ng mg-1; Ocfentanyl: 3.031±0.10 ng mg-1; Thiofentanyl: (4.925±0.14) ng mg-1; 4-fluoroisobutyryl fentanyl: (6.028±0.14) ng mg-1; Tetrahydrofuran fentanyl: (3.451±0.14) ng mg-1; Fentanyl: (7.712±0.23) ng mg-1; MA: (2.015±0.06) ng mg-1; MDEA: (1.322±0.02) ng mg-1; MDMA: (3.325±0.06) ng mg-1; Ephedrine: (1.667±0.05) ng mg-1; MDA: (2.112±0.09) ng mg-1; Amphetamine was not detected.
The results showed that in LC-MS/MS and GC-MS/MS, Fmeasured<F0.05 (10,22)=2.30. The prepared hair sample has good uniformity. The concentrations of 15 drugs in the prepared hair samples were 1.050 ng mg-1~7.771 ng mg-1, with RSDs<7.0%.
Table 1. Comparison of GC-MS/MS and LC-MS/MS results (ng mg-1).
Drug name LC-MS/MS GC-MS/MS ME/% Mean
Mean RSD/% Mean RSD/%
Norfentanyl 1.012 1.6 1.087 3.7 -3.8 1.050
Acetylfentanyl 4.788 0.6 4.821 2.0 -1.6 4.805
Isobutyryl fentanyl 4.826 0.3 4.816 1.9 0.5 4.821
P-Fluorofentanyl 5.830 0.2 5.786 1.6 2.2 5.808
Ocfentanyl 3.188 1.1 3.031 2.2 7.9 3.110
Thiofentanyl 5.010 0.6 4.925 2.0 4.3 4.968
4-fluoroisobutyryl fentanyl 6.303 0.4 6.028 1.7 13.8 6.166
Tetrahydrofuran fentanyl 3.444 0.2 3.451 3.0 -0.3 3.448
Fentanyl 7.830 0.3 7.712 1.9 5.9 7.771
AP - - - - - -
MA 1.789 1.3 2.015 2.0 -11.3 1.902
MDEA 1.321 0.3 1.322 1.2 -0.05 1.322
MDMA 3.284 0.7 3.325 1.2 -2.1 3.305
Ephedrine 1.667 1.3 1.667 1.6 -0.02 1.667
MDA 1.938 1.6 2.112 2.7 -8.7 2.025
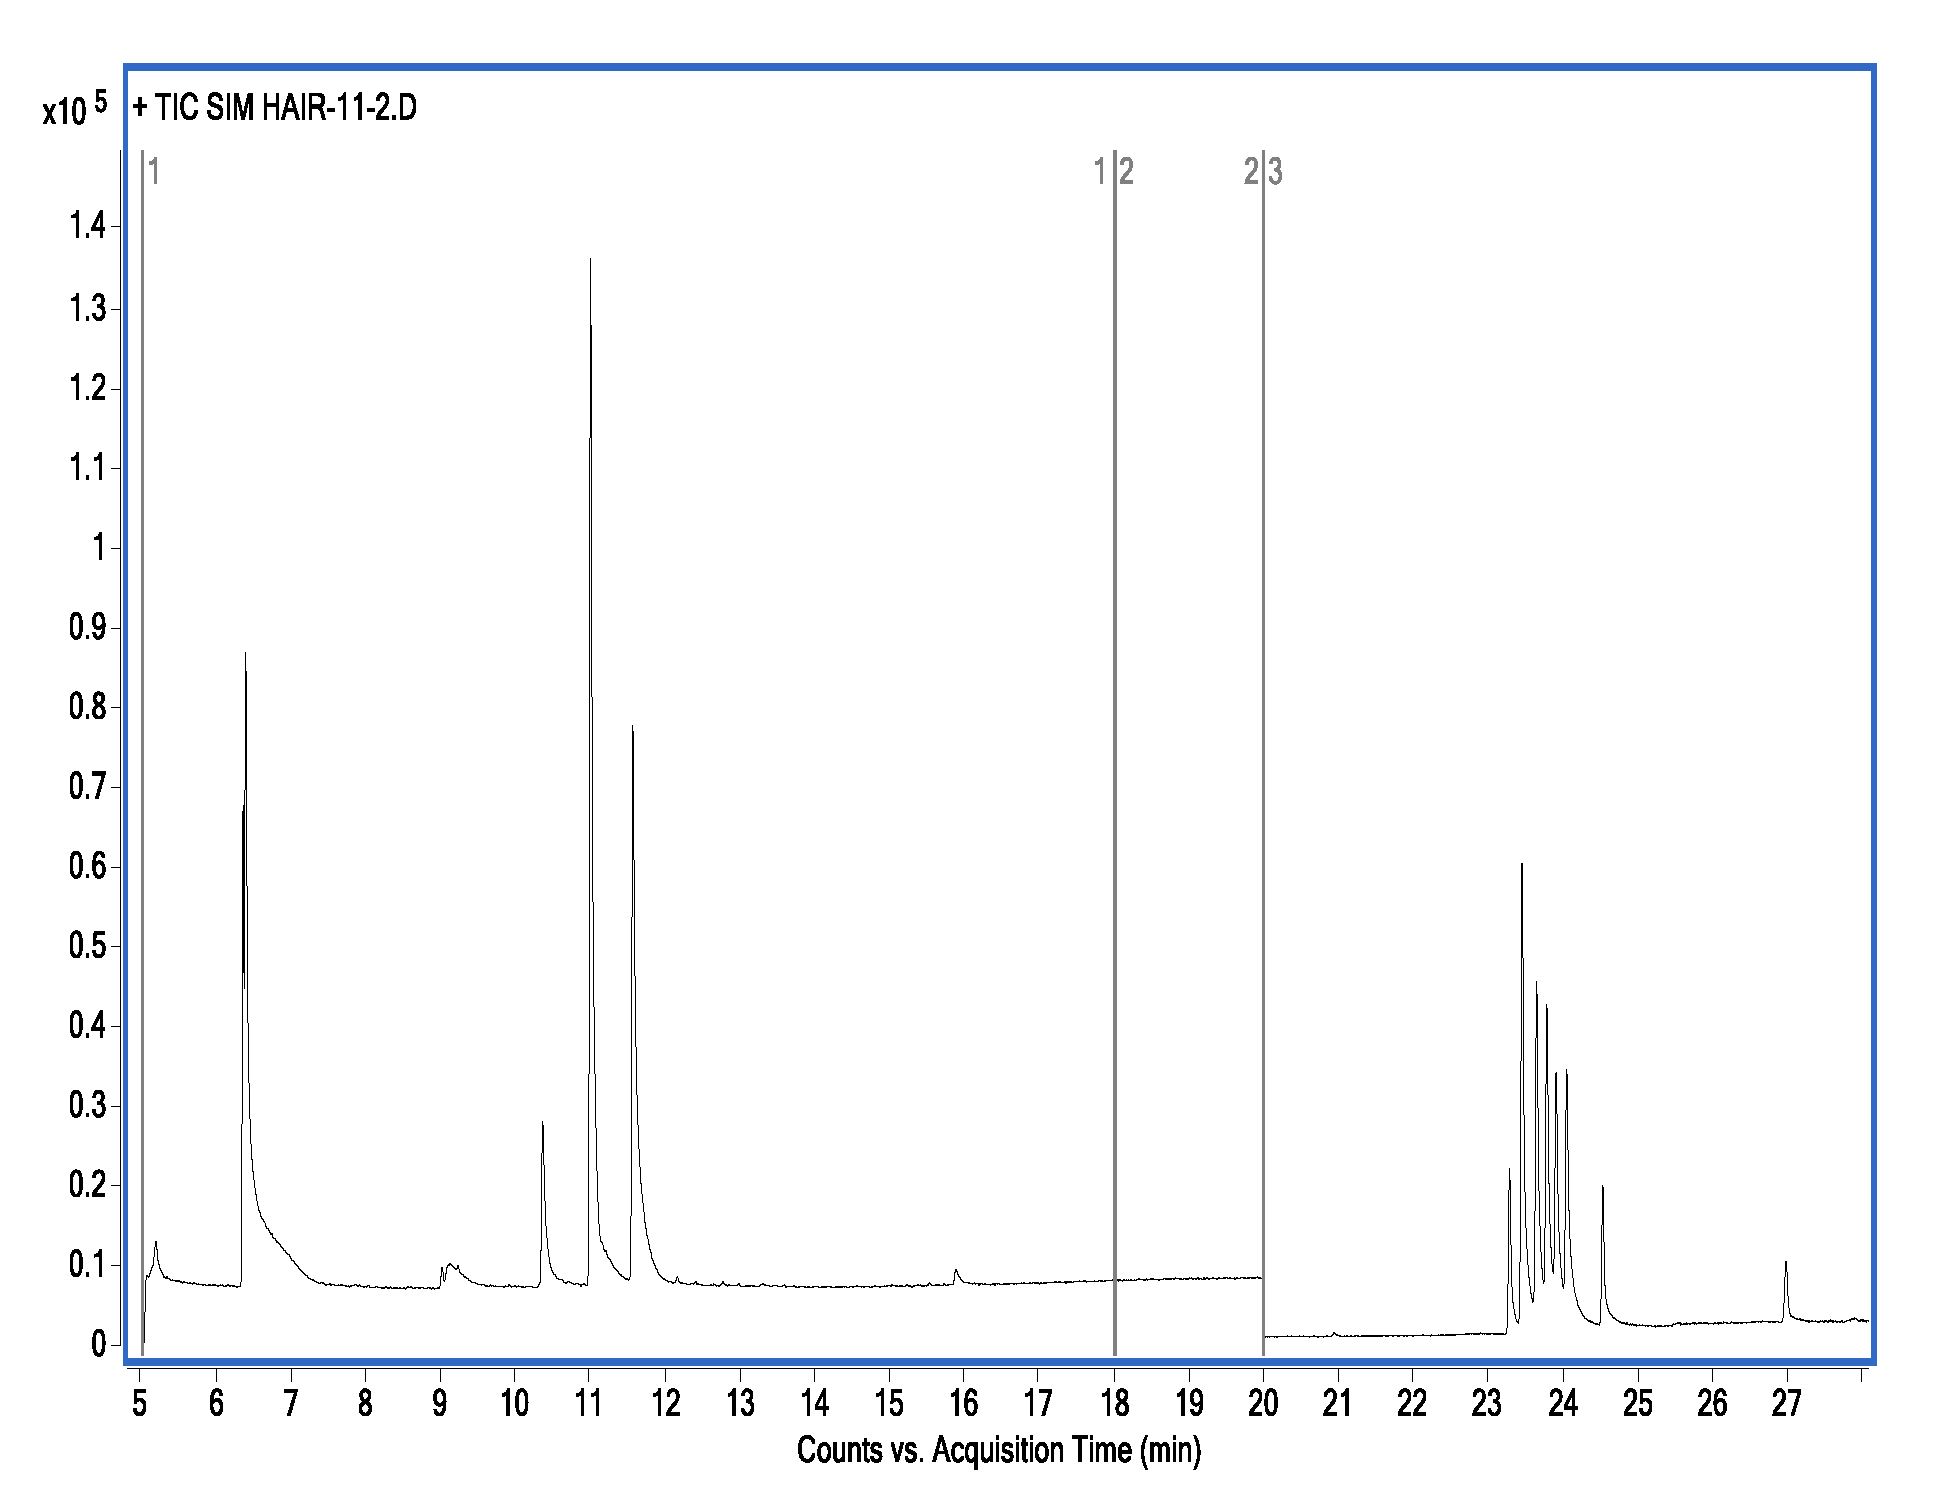
Figure 3. GC-MS/MS chromatograms of 15 drugs in hair.
Preprints 116992 g003
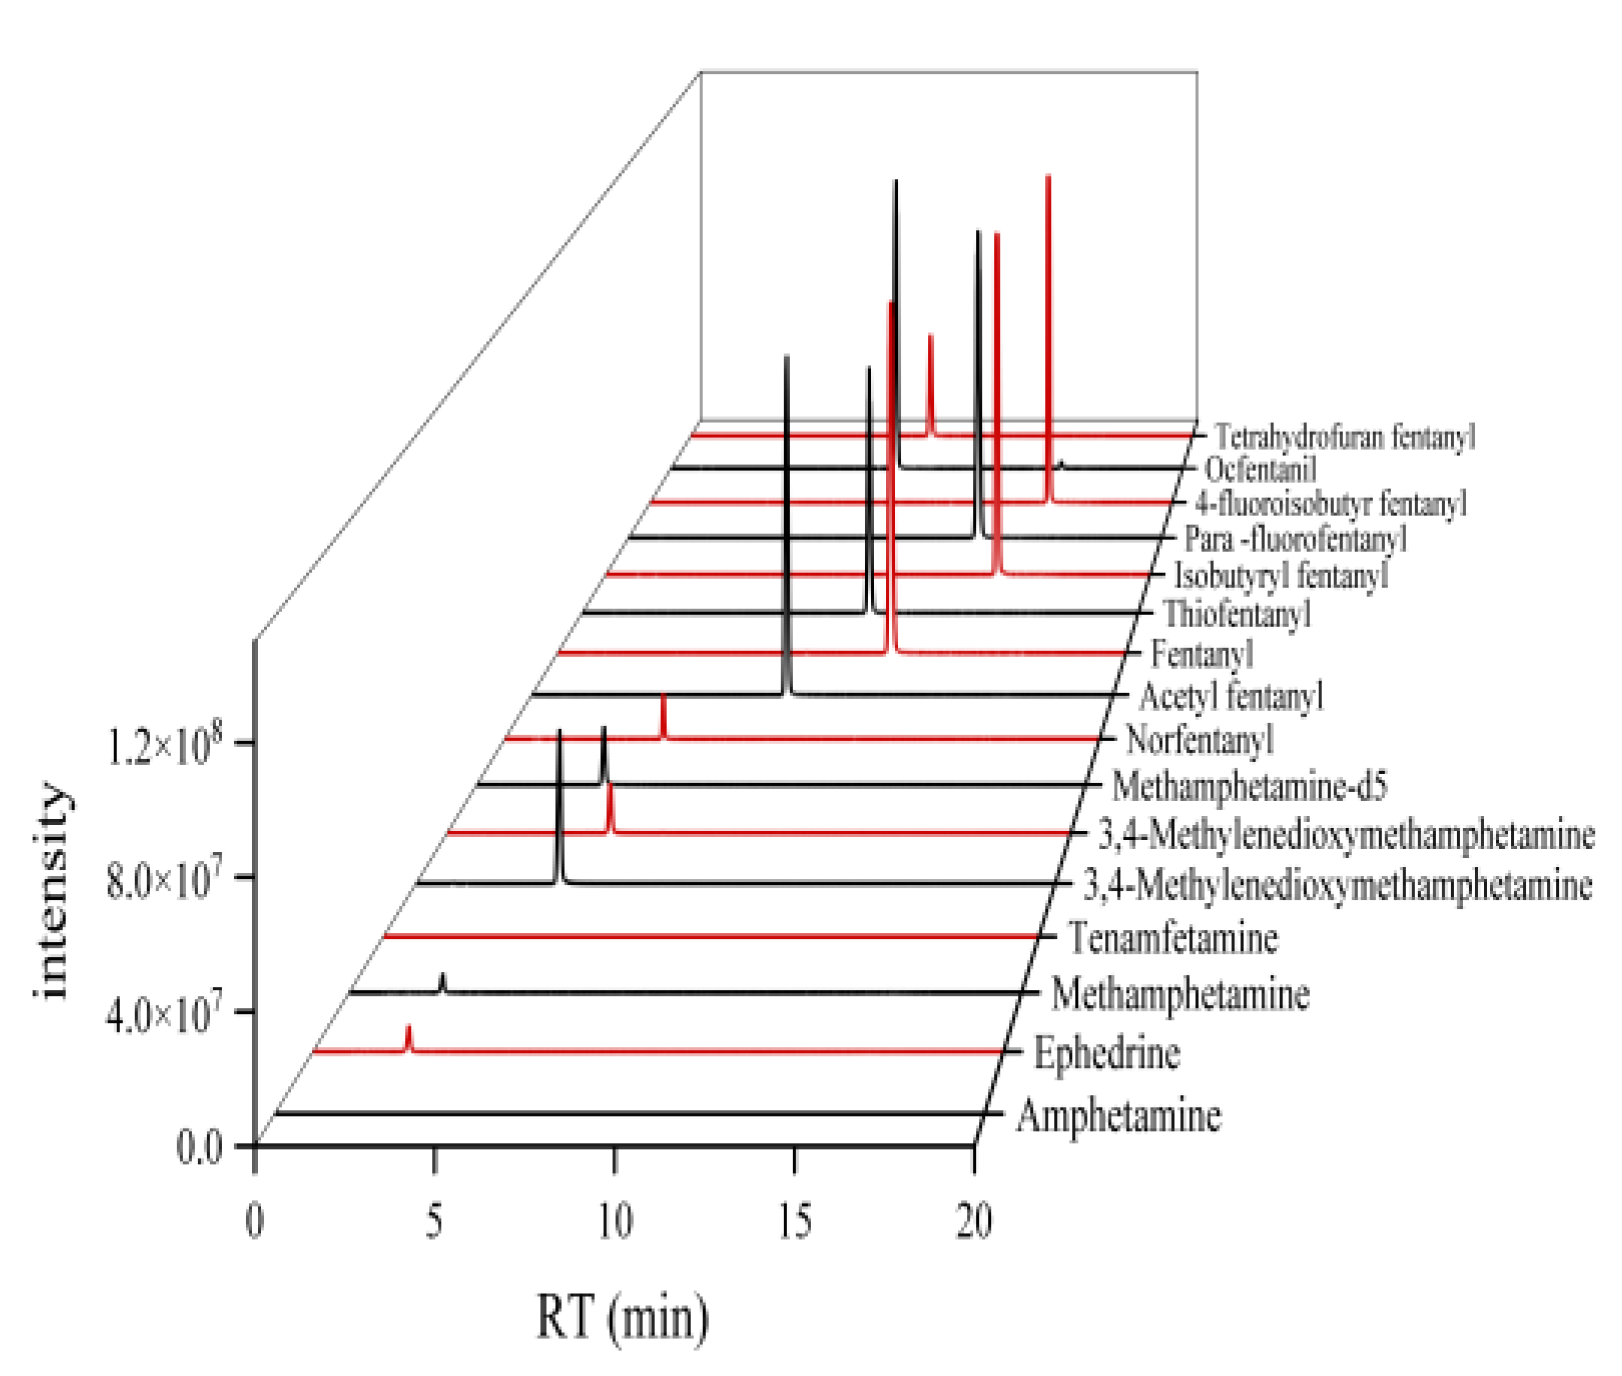
Figure 4. LC-MS/MS chromatograms of 15 drugs in hair.
Preprints 116992 g004
Figure 5. Quantitative results for 15 drugs (GC-MS/MS).
Preprints 116992 g005
Figure 6. Quantitative results for 15 drugs (LC-MS/MS).
Preprints 116992 g006

3. Discussion

Hair analysis can provide relevant information on drug addiction history or drug toxicity and is one of the hotspots in the field of forensic science research. Appropriate sample pretreatment methods and high-sensitivity analysis are required to extract drugs from hair due to their low content, thereby avoiding false negatives or missed detections. This study presents a fast, accurate, and sensitive method for detecting prohibited drugs in hair. This technique can be employed to examine and identify small amounts of drugs present in hair. It can also serve as a reference for the development of detection techniques and reference material for fentanyl and amphetamines in hair. During the experiment, it was found that no amphetamine was detected in the prepared hair samples. It is speculated that the reasons may include: (1) Amphetamine has a high polarity and is difficult to penetrate into hair through soaking. (2) After amphetamine enters the hair, the deposited drug is loose and washed off during the cleaning process, resulting in undetected substances in the hair. Further research will be conducted to improve the preparation process and detection methods. When preparing hair samples containing amphetamine in the future, it is recommended to increase the amount of amphetamine added and improve the cleaning steps.

4. Materials and Methods

4.1. Chemicals and Reagents

For information on the samples, instruments, and reagents used in the experiment, see Supporting Information. The samples used in the experiments were all greater than 99% pure.

4.2. Preparation of Hair Samples

Weigh approximately 30 mg of acetyl fentanyl, p-fluorofentanyl, isobutyryl fentanyl, fentanyl, thiofentanyl, 4-fluoroisobu-tyryl fentanyl, ocfentanyl, tetrahydrofuran fentanyl, MA, MDEA, MDMA, MDA, ephedrine, and 5 mg of norfentanyl and 5 mg of AP. A total of 15 drugs are placed in a 1000 mL bottle. Add 500 mL of distilled water and 500 mL of DMSO solution (containing 0.02 mol L-1 hydrochloric acid), and sonicate for 10 minutes to mix evenly. After cooling, soak approximately 40 g of hair in it and let it stand at room temperature in the dark. After soaking for 24 days, pour out the soaking solution, wash the hair thoroughly with chromatography-grade methanol 4 times, and retain the 4th cleaning solution. After cleaning, the hair sample is dried at room temperature for 24 hours and then dried in a vacuum drying oven for 48 hours. It is then sheared and crushed to a powder smaller than 0.5 mm using a ball mill. Mix with a mixer for 24 hours, mix well, and then bottle (approximately 200 bottles, each containing approximately 100 mg). Store at room temperature in the dark.

4.3. Sample Pretreatment

LC-MS/MS: About 15 mg of each sample was accurately weighed and placed in a reservoir and 2.0 mL 0.01 mol L-1 hydrochloric acid was added. Methamphetamine-D5 (1.0 ng mg-1; 200 μL) was added as internal standards, and ultrasound at 40℃ for 50 min. Then, the hair extract was evaporated to dryness at 45℃ under N2 gas. The residue was reconstituted with 1000 μL mobile phase, centrifuged at 15000 xg for 5 min, and the supernatant was filtered through a 0.22 μm microporous membrane and injected for analysis.
GC-MS/MS: About 100 mg of each sample was accurately weighed and placed in a reservoir and 2.0 mL 0.01 mol L-1 hydrochloric acid was added. Methamphetamine-D5 (5.0 ng mg-1; 200 μL) was added as internal standards, and the rest of the operation is the same as LC-MS/MS.

4.4. LC-MS/MS Measurement

Measurements were performed on a Waters TQS LC-MS/MS with ESI in the positive ion mode using MRM monitoring. 9 fentanyl drugs were separated by LC on an ACQUITY TM UPLC HSS T3 column(100 mm×2.1 mm, 1.8 μm). For hair samples, the analytes were separated with a gradient mobile phase consisting of 0.1% formic acid in 10 mmol/L ammonium acetate aqueous solution (A): acetonitrile (B). Flow rate: 0.2 mL min-1; column temperature: 30℃; injection volume: 2 μL; Ion source: (ESI+), temperature: 150℃; detection method: multiple reaction options ion monitoring mode (MRM); Capillary voltage: 1.52 kV; Desolventizing gas temperature: 600℃; Desolventizing gas flow rate: 800 L h-1; Cone gas flow rate: 150 L h-1; Information on the gradient elution procedure and mass spectral parameters for LC-MS/MS is provided in the Appendix Information.

4.5. GC-MS/MS Measurement

Chromatographic column: DB-5MS(30 m×0.25 mm×0.25 μm); Column temperature: 80℃(1 min)-10℃/min -300℃(5 min); The carrier gas is helium with a flow rate of 1.0 mL min-1; The inlet temperature was 280℃; Injection volume: 1 μL; Split injection, Split ratio: 10:1; The solvent delay time is 5 min. Electron impact ionization source (EI); Electron energy 70 eV; Ion source temperature: 230℃; Interface temperature: 250℃; The mass detector operated in electron ionization at 70 eV in SIM/Scan mode. The full scan acquisition range was m/z 50~450.
The selected ion monitoring mode (SIM) is used for quantitative analysis. The first group monitoring, 5.0 min-18.0 min, monitoring m/z 44, 58, 62, 72, 77, 83, 105; the second group monitoring, 20.0 min-30.0 min, monitoring m/z 164,231, 245, 259, 263, 279, 287.
Supporting information lists the diagnostic ions and relative retention times for each substance monitored in SIM mode.

5. Conclusions

The established methods were used for the detection of fentanyl and amphetamine drugs in human hair, with high sensitivity, accuracy and specificity. The developed hair reference materials are expected to be applied in forensic drug abuse detection and laboratory quality control.

Supplementary Materials

The following supporting information can be downloaded at the website of this paper posted on Preprints.org, Table S1: Information of instruments; Table S2: Laboratory reagent information sheet; Table S3: Mass spectrometry parameters of fentanyl and amphetamines in LC-MS/MS; Table S4: Linearity and range of 15 drugs; Table S5: Repeatability results of 15 drugs; Table S6: Stability test results of 15 drugs; Table S7: Recovery and matrix effect of 15 drugs; Table S8: Comparison of GC-MS/MS and LC-MS/MS results (ng mg-1).

Author Contributions

Conceptualization, Qi Wei. and Fuhai Su.; methodology, Qi Wei. and Fuhai Su.; software, Qi Wei. and Fuhai Su.; validation, Qi Wei. and Fuhai Su.; formal analysis, Qi Wei. and Fuhai Su.; investigation, Qi Wei. and Fuhai Su.; resources, Qi Wei. and Fuhai Su.; data curation, Qi Wei. and Fuhai Su.; writing—original draft preparation, Qi Wei. and Fuhai Su.; writing—review and editing, Qi Wei. and Fuhai Su.; visualization, Qi Wei. and Fuhai Su.; supervision, Qi Wei. and Fuhai Su.; project administration, Qi Wei. and Fuhai Su.; funding acquisition, Qi Wei. and Fuhai Su. All authors have read and agreed to the published version of the manuscript. Please turn to the CRediT taxonomy for the term explanation. Authorship must be limited to those who have contributed substantially to the work reported.

Funding

This research was funded by NATIONAL PLATFORM FOR REFERENCE MATERIAL RESOURCES, grant number APT2302-1”.

Institutional Review Board Statement

This study did not involve humans or animals, and ethical review and approval have been waived.

Informed Consent Statement

Informed consent was obtained from all subjects involved in the study.

Data Availability Statement

The author declares that no new data has been created or that sharing new data is inconvenient due to relevant privacy statements.

Acknowledgments

This work was supported by the National platform for Reference Material Resources [grant numbers APT2302-1].

Conflicts of Interest

The authors declare no conflicts of interest.

References

  1. Misailidi N, Papoutsis I, Nikolaou P. et al. Fentanyls continue to replace heroin in the drug arena: the cases of ocfentanil and carfentanil[J]. Forensic Toxicol, 2018, 36(1): 12-32.
  2. Uddayasankar U, Lee C, Oleschuk C. et al. The Pharmacokinetics and Pharmacodynamics of Carfentanil After Recreational Exposure: A Case Report[J]. Pharmacotherapy, 2018, 38(6): e41-e45.
  3. Suzuki J, El-Haddad S. A review: Fentanyl and non-pharmaceutical fentanyls[J]. Drug Alcohol Depend, 2017, 171: 107-116. [CrossRef] [PubMed]
  4. Müller D, Neurath H, Neukamm MA, et al. New synthetic opioid cyclopropylfentanyl together with other novel synthetic opioids in respiratory insufficient comatose patients detected by toxicological analysis[J]. Clin Toxicol (Phila), 2019, 57(9): 806-812.
  5. Burns SM, Cunningham CW, Mercer SL. DARK Classics in Chemical Neuroscience: Fentanyl[J]. ACS Chem Neurosci, 2018, 9(10): 2428-2437.
  6. Geile J, Maas A, Kraemer M. et al. Fatal misuse of transdermal fentanyl patches[J]. Forensic Sci Int, 2019, 302: 109858.
  7. Shima N, Sasaki K, Kamata T. et al. Hair Testing for Drugs in the Field of Forensics[J]. Yakugaku Zasshi, 2019, 139(5): 705-713.
  8. Orfanidis A, Mastrogianni O, Koukou. et al. A GC-MS method for the detection and quantitation of ten major drugs of abuse in human hair samples[J]. J Chromatogr B Analyt Technol Biomed Life Sci, 2017, 1047: 141-150.
  9. Salomone A, Palamar JJ, Bigiarini R. et al. Detection of Fentanyl Analogs and Synthetic Opioids in Real Hair Samples[J]. J Anal Toxicol, 2019, 43(4): 259-265.
  10. ang L, Yang R, Li G. et al. Gas chromatography-mass spectrometry tandem detection of six new psychoactive substances [J]. Guangdong Chemical, 2022, 49 (22): 223-226.
  11. Gottardo R, Fanigliulo A, Bortolotti F. et al. Broad-spectrum toxicological analysis of hair based on capillary zone electrophoresis-time-of-flight mass spectrometry[J]. J Chromatogr A, 2007, 1159(1-2): 190-197.
  12. Wang G, Huynh K, Barhate R. et al. Development of a homogeneous immunoassay for the detection of fentanyl in urine[J]. Forensic Sci Int, 2011, 206(1-3): 127-131.
  13. Qin N, Xiang P, Shen B. et al. Application of a validated UHPLC-MS/MS method for 28 fentanyl-analogue and novel synthetic opioids in whole blood in authentic forensic cases[J]. J Chromatogr B Analyt Technol Biomed Life Sci, 2019, 1124: 82-99.
  14. Strayer KE, Antonides HM, Juhascik MP. et al. LC-MS/MS-Based Method for the Multiplex Detection of 24 Fentanyl Analogues and Metabolites in Whole Blood at Sub ng mL-1 Concentrations[J]. ACS Omega, 2018, 3(1): 514-523.
  15. Adamowicz P, Bakhmut Z, Mikolajczyk A. Screening procedure for 38 fentanyl analogues and five other new opioids in whole blood by liquid chromatography-tandem mass spectrometry[J]. J Appl Toxicol, 2020, 40(8): 1033-1046. [CrossRef] [PubMed]
  16. Larabi, IA, Martin M, Fabresse N. et al. Hair testing for 3-fluorofentanyl, furanylfentanyl, methoxyacetylfentanyl, carfentanil, acetylfentanyl and fentanyl by LC-MS/MS after unintentional overdose[J]. Forensic Toxicology, 2020, 38 (4): 277-286.
  17. Ramírez Fernández MDM, Wille SMR, Jankowski D. et al. Development of an UPLC-MS/MS method for the analysis of 16 synthetic opioids in segmented hair, and evaluation of the polydrug history in fentanyl analogue users[J]. Forensic Sci Int, 2020, 307: 110137.
  18. Shi Q, Shi Y, Pan Y. et al. Colorimetric and bare eye determination of urinary methylamphetamine based on the use of aptamers and the salt-induced aggregation of unmodified gold nanoparticles[J]. Microchimica Acta, 2014, 182(3-4): 505-511.
  19. Maxwell JC, Rutkowski BA. The prevalence of methamphetamine and amphetamine abuse in North America: a review of the indicators, 1992-2007[J]. Drug Alcohol Rev, 2008, 27(3): 229-235. [CrossRef]
  20. Nath R, Kumar D, Li T. et al. Oxidative stress and the cardiovascular system[J]. Toxicology, 2000, 155(1-3): 17-26.
  21. Lu J, Xie M, Guan H. Toxic effects and detection methods of methamphetamine [J]. China Public Safety (Academic Edition), 2020 (01): 128-132.
  22. Kwon NH, Lee YR, Kim HS. et al. Hybrid Solid-Phase Extraction for Selective Determination of Methamphetamine and Amphetamine in Dyed Hair by Using Gas Chromatography-Mass Spectrometry[J]. Molecules, 2019, 24(13): 2501.
  23. Cheong JC, Suh S, Ko BJ. et al. Screening method for the detection of methamphetamine in hair using fluorescence polarization immunoassay[J]. J Anal Toxicol, 2013, 37(4): 217-221.
  24. Seo MJ, Song SH, Kim S. et al. Characteristics of Korean patients with methamphetamine use disorder based on the quantitative analysis of methamphetamine and amphetamine in hair[J]. Arch Pharm Res, 2020, 43(8): 798-807.
  25. Zhang Y, Li L, Wang Q. et al. Simultaneous determination of metabolic and elemental markers in methamphetamine-induced hepatic injury to rats using LC-MS/MS and ICP-MS[J]. Anal Bioanal Chem, 2019, 411(15): 3361-3372.
  26. Brčić Karačonji I, Brajenović N. Evaluation of amphetamine-type stimulant abuse through hair analysis: Results from 12 years of work[J]. Arh Hig Rada Toksikol, 2014, 65(2): 225-230. [CrossRef] [PubMed]
  27. Niu Q, Shen J, Liu Y. et al. Research Progress on Main Active Constituents and Pharmacological Activities of Actinidia arguta[J]. Science and Technology of Food Industry, 2019, 40(3): 333-338+344.
Figure 1. Variation of drug content in hair with soaking time.
Preprints 116992 g001
Figure 2. Effects of extraction time, extraction temperature, liquid-to-material ratio and hydrochloric acid concentration on drug. (a) Effects of extraction temperature and extraction time on drug concentration; (b) Effects of extraction temperature and liquid-to-material ratio on drug concentration; (c) Effects of extraction temperature and liquid-to-material ratio on drug concentration; (d) Effects of extraction time and liquid-to-material ratio on drug concentration; (e) Effects of extraction time and hydrochloric acid concentration on drug concentration; (f) Effects of liquid-to-material ratio and hydrochloric acid concentration on drug concentration.
Preprints 116992 g002
Disclaimer/Publisher’s Note: The statements, opinions and data contained in all publications are solely those of the individual author(s) and contributor(s) and not of MDPI and/or the editor(s). MDPI and/or the editor(s) disclaim responsibility for any injury to people or property resulting from any ideas, methods, instructions or products referred to in the content.
Copyright: This open access article is published under a Creative Commons CC BY 4.0 license, which permit the free download, distribution, and reuse, provided that the author and preprint are cited in any reuse.
Prerpints.org logo

Preprints.org is a free preprint server supported by MDPI in Basel, Switzerland.

Subscribe

© 2024 MDPI (Basel, Switzerland) unless otherwise stated