
Submitted:
02 September 2024
Posted:
04 September 2024
You are already at the latest version
Abstract
Early weaning management followed by energy supplementation can lead to metabolic alterations in the calf that exert long-term effects on the animal’s health and performance. It is believed that the main molecular basis underlying these metabolic adaptations are epigenetic mechanisms that regulate, activate, or silence genes at different stages of development and/or in response to different environmental stimuli. However, little is known about postnatal metabolic programming in Bos indicus. Therefore, this study aimed to compare the DNA methylation profile of Nellore animals submitted to conventional and early weaning and to correlate the findings with genes differentially expressed in Longissimus thoracis skeletal muscle of Bos indicus cattle. A total of 481 differentially methylated regions were identified, with 52% (250) being hypermethylated and 48% (231) hypomethylated. Functional enrichment analysis of 53 differentially methylated and differentially expressed genes was performed. The main enriched terms and pathways were associated with 3’-5’-cyclic adenosine monophosphate (cAMP) signaling which present the upregulated adenylate cyclase 3 (ADCY3) gene and significatively hypomethylated in promoter region. Alterations in cAMP signaling are involved in numerous processes, many of them related to lipid metabolism. The relative differential expression of key genes of this pathway demonstrates the relationship between cAMP signaling and de novo lipogenesis. These findings suggest an important role of postnatal metabolic programming through DNA methylation mechanisms in determining fat deposition in beef.
Keywords:
epigenetics
; early weaning
; adipogenesis
; meat
1. Introduction
In cattle, early weaning consists of separating the calves from cows at less than 150 days of age [1] and is aimed at reducing the stress of suckling and nutritional requirements of the cow, thus enabling early body condition recovery and return to estrus [2]. However, attention must be paid to early weaned calves in order to avoid malnutrition [3,4]. Furthermore, energy supplementation of early weaned calves can be used to enhance characteristics of interest in animal production [5,6]. In breeds of European origin, early weaning has been shown to exert a major effect on the physiology of calves destined for slaughter when compared to those conventionally weaned at 210 days of age [6,7].
Studies have shown that early weaned calves supplemented with energy sources can achieve superior performance in systems that employ a slaughter age between 18 and 24 months, such as higher body weight, greater subcutaneous fat thickness, greater Longissimus thoracis muscle area, and higher intramuscular fat levels [5,6,8]. Among the key mechanisms underlying these metabolic changes are epigenetic modifications that can affect gene modulation and expression in response to environmental and nutritional stimuli [9] and, consequently, phenotypes.
DNA methylation, which is an important epigenetic modification, can alter gene expression through the formation of a physical barrier that inhibits the binding of general transcription factors or affects the state of chromatin condensation; in addition, DNA methylation is involved in the recruitment of methyl-binding proteins that form repressive complexes [10,11]. The diet is known to play a fundamental role in the determination of the DNA methylation pattern by providing substrates necessary for methylation and cofactors that modulate the enzymatic activity of DNA methyltransferase, as well as in the activity of enzymes that regulate one-carbon metabolism [12]. S-adenosylmethionine (SAM), which is synthesized in the methionine cycle from various dietary precursors, is a potent aminopropyl and methyl donor within the one-carbon cycle and serves as the main substrate for the methylation of DNA, associated proteins, and RNA [13,14].
Epigenetic programming is sensitive to nutritional factors, especially during the prenatal period and early phases of life of animals [12,15]. Thus, nutritional alterations can induce “metabolic imprinting”, a mechanism whereby adequate nutrition in the first months after birth alters glucose metabolism and causes long-term beneficial effects on the health and performance of animals [16]. This mechanism proposes critical periods of development, known as “nutritional windows”, in which changes in the DNA methylation pattern and gene expression can permanently modify the animal’s metabolism [17].
At present, there are no omics studies that have associated epigenetics, particularly DNA methylation, with gene expression in Nellore cattle submitted to early weaning and energy supplementation. In this context, we examined the effects of distinct nutritional management protocols on DNA methylation patterns in the Longissimus thoracis muscle of Nelore calves during the perinatal phase, and how these epigenetic modifications may have influenced the gene expression profile.
2. Results
2.1. Reduced-Representation Bisulfite Sequencing
A mean number of 30 million 150-bp reads were generated for the EW group and 28 million 150-bp reads for the CW group. After quality control and adapter removal, the raw number of reads decreased by approximately 1.6% in both groups, corresponding to the number of clean reads. The overall read mapping rate was 76.45% and 76.55% in the EW and CW groups, respectively (Table 1).
2.2. DNA Methylation Patterns in Muscle
A mean percentage of 3.84% mCpG, 0.54% mCHG and 0.47% mCHH was detected in the genome of EW animals, while these percentages were 3.79%, 0.51% and 0.44%, respectively, in the CW group (Table 2).
We found 481 DMRs showing differences in methylation between the two weaning groups at 205 days (qvalue < 0.05 and methylation difference >= 20%) (Supp. Table S1). Balanced ratios of hypo- and hypermethylated regions were observed in the two groups (CW vs. EW). However, there was a slightly higher level of methylation in early weaned animals, with approximately 52% (250) of hypermethylated regions and 48% (231) of hypomethylated regions (Figure 1).
2.3. Distribution of Differentially Methylated Regions across the Genome
Regarding functional location, DMRs were most frequently present in intergenic regions (65%), followed by introns (14%), exons (13%), and promoters/TSSes (7%) (Figure 2a). Approximately 23% of DMRs were located in CpG islands, while 26% were present in shores (Figure 2b; Supp. Table S1).
There were 172 DMRs overlapping 53 genes, some of them in more than one window and at different functional locations (Supp. Table S2). Of these prospected regions, 80 DMRs were hypermethylated in the EW group, while the other 92 were hypomethylated. These DMRs overlapped 53 different genes, which were classified as DMGs. Regarding functional location, 16 DMRs were located in gene promoters, while three others were present in TSSes (Table 3).
2.4. Functional Enrichment Analysis
Functional enrichment analysis considering the 53 DMGs/DEGs between the EW and CW groups highlighted the following biological processes related to 3’-5’-cyclic adenosine monophosphate (cAMP) signaling and positive lipid regulation: cAMP metabolic process (GO:0046058), cAMP biosynthetic process (GO:0006171), and positive regulation of lipid metabolic process (GO:0045834). Regarding metabolic pathways (KEGG), growth-related pathways can be highlighted, such as growth hormone synthesis, secretion and action and GnRH signaling and others (Table 4).
2.5. Relationship between Methylation and Gene Expression
In general, a trend can be seen towards a relationship between gene expression and levels of intragenic DNA methylation or methylation in promoter regions of the respective genes (Figure 3, Supp. Table S3). The estimated regression coefficient was -0.00316, with a pvalue of 0.0002. The significant slope indicates that many genes harbor hypermethylated regions associated with a decline in expression and hypomethylated regions associated with high gene expression. However, different associations have been reported in the literature in which highly methylated gene bodies tend to exhibit high transcription activity [18]. The ADCY3 (adenylate cyclase 3), STUB1 (STIP1 homology and U-box containing protein 1), and ZNF557 (zinc finger protein 557) genes contained low proportions of 5mC sites in the promotor regions of genes upregulated in the EW group. The same was observed in the CW group for the TECR (trans-2,3-enoyl-CoA reductase), GMDS (GDP-mannose 4,6-dehydratase), SSPO (SCO-spondin), SULF2 (sulfatase 2), MACROD1 (mono-ADP ribosylhydrolase 1), ARID3B (AT-rich interaction domain 3B), and ARHGEF10L (rho guanine nucleotide exchange factor 10 like) genes (Supp. Table S3).
Since not all genes involved in a pathway have their regulation mediated by DNA methylation but can be affected by genes regulated by these mechanisms, the DEG data are important for elucidating the activity of metabolic pathways. These results are therefore essential for studies on epigenetic regulation by DNA methylation and are presented in Supp. Table S4.
3. Discussion
In the present study, the comparison of groups of Nellore calves submitted to EW and energy supplementation and calves submitted to CW revealed an important correlation between methylated DNA regions and gene expression, with many of the genes being associated with fat metabolism. It is known that the epigenome is sensitive to nutritional factors [19]. Comparison of the EW vs CW groups showed a low percent variation in methylation. This finding can be explained by the conserved methylation profile of cattle [19], as well as by the fact that the animals were exposed to the same management conditions from birth to 120 days of age. However, the exposure of EW animals to a period of “nutritional window” (121 to 205 days) under energy supplementation exerted an epigenetic effect, with the identification of 485 DMRs. This finding might be related to the presence of so-called epigenetic modifiers – molecules that are important methyl donors and/or cofactors in DNA methylation reactions such as methionine, choline, folate, and vitamin B12 [20]. Thus, the hypermethylation of genes during the postnatal metabolic programming that occurred in the EW group may be the result of nutritional factors. Since these animals received a high-protein diet (20%), the availability of the compounds mentioned above, which are recognized as methyl donors for DNA methylation, was greater. These compounds enter one-carbon metabolism at different sites but are ultimately converted to the methyl group donor SAM, which provides one methyl group for DNA methylation [21]. In one-carbon metabolism, most methyl groups are derived from choline (60%), followed by methionine (20%) and folate (10-20%) [22]. Methionine is an essential amino acid that is regenerated from homocysteine. In addition to its importance for protein synthesis, when converted to SAM, methionine participates in more than 100 methylation reactions in the body [23]. Thus, variations in dietary methionine may affect DNA methylation [24]. However, some studies suggest that there is no simple correlation between the concentration of methyl donors and DNA methylation and that complex mechanisms of competitive inhibition of DNA methyltransferases may contribute to DNA imprinting [12,25].
Bos indicus breeds are known for their lower meat tenderness and intramuscular fat deposition when compared to Bos taurus [26]. Thus, the identification of gene pathways that could improve fat deposition and meat tenderness in Bos indicus is an important strategy for this animal production sector [26]. Within this context, studies of European cattle breeds suggested that early weaning management leads to changes in DNA methylation patterns and in the expression of genes involved in metabolism [6,8]. In the study by [6], metabolic programming due to early weaning resulted in significant changes in carcass fat deposition, suggesting that early postnatal metabolic imprinting events can be explored as a management tool to improve the value and quality of meat based on increased marbling. In our study, EW animals exhibited 53 DMGs/DEGs. These results are consistent with the effects of early postnatal metabolic programming on the expression of genes levels involved in numerous biological processes, including those related to the positive regulation of lipid metabolic processes.
Among the main genes exhibiting significant epigenetic changes and alteration in expression due to early weaning, we highlight the ADCY3 and AKT1 genes. The ADCY3 gene is involved in the regulation of different processes, including embryogenesis, hormone secretion, glycogen degradation, smooth muscle relaxation, cardiac muscle contraction, and olfaction [27,28,29]. In general, adenylyl cyclases (ADCYs) are enzymes that catalyze the synthesis of cAMP from adenosine triphosphate (ATP) [30]. The present results showed that the cAMP signaling pathway was enriched in the EW group. Cyclic AMP is a second messenger involved in intracellular signal transduction that is associated with the function of kinases in different biochemical processes, including the regulation of carbohydrate and lipid metabolism [30,31]. Increases in cAMP ultimately activate a number of enzymes and transcription factors that regulate satiety and metabolism [32].
In this scenario, we evaluated some pathways linked to energy metabolism and regulated by overexpression of ADCY3 regarding genes differentially expressed in the EW group. The altered expression of ADCY3 is related to an increase in protein kinase cAMP-activated catalytic subunit alpha (PRKACA). This kinase signals changes in adipogenesis, thermogenesis, fatty acid oxidation, and insulin resistance pathways [28]. However, the evaluation of DEGs in this study did not provide solid data on changes in adipogenesis, thermogenesis, or fatty acid oxidation; however, genes involved in de novo lipogenesis were upregulated.
Adipogenesis consists of the differentiation of mesenchymal stem cells into preadipocytes and the proliferation of these cells, the differentiation of preadipocytes into adipocytes, and the conversion to lipid-assimilating cells [33,34,35]. The mechanisms that control adipogenesis in skeletal muscle are largely regulated by transcription factors of the enhancer binding protein (CEBP) and peroxisome proliferator-activated receptor γ (PPARg) family [35,36,37]. The CEBP and PPARg genes were found to be overexpressed but not differentially methylated in the EW group. However, various other genes that are important for adipogenesis did not show consistent changes in expression, including bone morphogenetic protein 4 (BMP4), PR domain containing protein 16 (PRDM16), fibroblast growth factor 10 (FGF10), and fatty acid binding protein 4 adipocyte (FABP4). For example, PRDM16 acts as a switch between the myogenic lineage and brown adipocytes [38,39]. Cells expressing PRDM16 do not undergo differentiation to the myogenic lineage. Thus, although the EW group exhibited a significant change in ADCY3, the alteration in the expression of genes involved in adipogenesis was less consistent. In fact, it has been proposed that adipogenesis starts in the second half of gestation in ruminants and reaches is highest activity during the perinatal period [35]. In the present study, the postnatal period was the nutritional window, i.e., after the main phase of adipocyte differentiation.
Beta-oxidation and thermogenesis are other processes that can be influenced by excess ADCY3 and PRKACA [28]. Although the expression of these regulators was altered in the EW group, no significant changes were observed in the expression of the hormone-sensitive lipase (HSL or LIPE) or carnitine palmitoyltransferase (CPT1 and CPT2) gene, indicating the lack of a difference in beta-oxidation between groups. Cyclic AMP-responsive element-binding protein 1 (CREB1) is regulated by PRKACA during thermogenesis. Likewise, neither the expression of CREB1 nor of other genes involved in thermogenesis was significantly altered in the EW group.
The insulin resistance pathway has also been suggested to respond to cAMP signals [28]. According to [6], an increase in gluconeogenic substrates for ruminal fermentation and in the concentration of insulin in response to circulating glucose leads to greater cellular uptake and utilization of glucose for fat deposition in intramuscular adipocytes proliferated by imprinting, increasing marbling during the growth phase. The gene expression data obtained for the EW group showed increased expression of protein kinase AMP-activated catalytic subunit alpha 1 (PRKAA1 or AMPK), an important mediator of the insulin resistance pathway, along with phosphatidylinositol-4,5-bisphosphate 3-kinase catalytic subunit beta (PI3KCB) and AKT serine/threonine kinase 1 (AKT1) [28]. AKT1 is responsible for the regulation of glucose uptake by mediating the insulin-induced translocation of solute carrier family 2 member 4 or glucose transporter type 4 (SLC2A4 or GLUT4) to the cell surface [40]. AKT1 was hypermethylated in the promoter and intron regions in the EW group; however, no significant alteration in gene expression was observed. Furthermore, the analysis of DEGs in this study revealed no alteration.
AKT signaling has been reported to prevent the degradation of sterol regulatory element binding transcription factor 1 (SREBP1) and thus to promote de novo lipid synthesis [41]. This gene belongs to a family of transcription factors [41] and encodes an important transcriptional regulator of genes involved in lipid synthesis and metabolism, including fatty acid synthase (FASN) and ATP-citrate lyase (ACLY) [42,43]. SREBP1 was overexpressed, demonstrating that AKT1 hypermethylation did not compromise gene expression. Other factors may be involved in the positive regulation of de novo lipid synthesis in the EW group.
Indeed, the DEG data demonstrated overexpression of genes involved in the de novo lipid synthesis pathway, including acetyl-CoA synthetase (ACSS2), ACLY, acetyl-CoA carboxylase (ACACA), stearoyl-CoA desaturase (SCD), and FASN, as well as the transcription factor SREBF-1, as also reported by [44]. An intriguing question raised here is how the postnatal metabolic programming performed in this study has stimulated lipogenesis. According to the review by [35], fat synthesis requires the incorporation of triglycerides into the adipose tissue of the animal after absorption of dietary fatty acids or de novo synthesis of other fatty acids. Acetate – a volatile fatty acid produced during ruminal fermentation – is the main precursor molecule for the synthesis of fatty acids in ruminants [45]. After ruminal absorption and already in the adipocyte, acetyl-CoA synthetase (ACSS2) converts acetate into acetyl-CoA [46] which, in the presence of reduced nicotinamide adenine dinucleotide phosphate (NADPH), is crucial for de novo fatty acid synthesis [35].
Interestingly, the cAMP signaling pathway enriched in this study regulated various other processes through ADCYs. One such process involves the sodium/potassium-transporting ATPase subunits gamma, alpha-1 and beta-2 (KEGG Bos taurus: 281773). These proteins, in turn, participate in digestion and absorption pathways (bta04973 and bta04974) in the intestinal epithelium, including acetate absorption in colonic epithelial cells. Although the expression of ATPases was not obtained for intestinal cells in this study, indirect evidence of increased acetate absorption and de novo lipid synthesis stems from the overexpression of FABP4. Expressed mainly in adipocytes, the product of the FABP4 gene is a cytoplasmic protein that binds to long-chain fatty acids and other hydrophobic ligands and plays a role in uptake, transport, and hydrolysis [47,48]. Increased expression of this gene has been associated with greater intramuscular fat deposition, carcass weight, and fatty acid composition in beef cattle [44,49,50].
Taken together, the data reinforce the proposals of greater fat deposition in cattle submitted to early weaning [6,8,44]. Furthermore, emerging evidence indicates that postnatal metabolic programming through epigenetic modification mainly exerts an effect on the ADCY3 receptor which, in turn, leads to numerous changes in pathways linked to cAMP signaling.
Authors should discuss the results and how they can be interpreted from the perspective of previous studies and of the working hypotheses. The findings and their implications should be discussed in the broadest context possible. Future research directions may also be highlighted.
4. Materials and Methods
4.1. Animals and Collection of Muscle Tissue
The field experiment was conducted in the town of Cáceres, State of Mato Grosso, Brazil. The climate of the region is characterized as tropical, with two well-defined seasons (dry in winter and wet in summer), an average annual temperature of 25°C, and average precipitation of 1,396 mm/year [51]. Forty purebred Nellore cows that met the following criteria were selected from a herd of 3,500 animals: same age, same number of calvings, and having given birth to male calves. In addition, cows with a maximum difference between calvings of 15 days were chosen.
These cows and their calves were kept in a rotational grazing system of Brachiaria decumbens paddocks, with minerals being available ad libitum. At 120 days after the average calving date, 20 calves were weaned and started to receive a concentrate-based supplementation in a new paddock consisting of Brachiaria decumbens where they remained until 205 days of age. These calves formed the early weaning (EW) group. The other 20 calves remained with the cows until 205 days of age, when they were weaned conventionally (CW group) (Table 5). Thus, except for the period between 120 and 205 days corresponding to the different treatments, the animals shared a common environment and received the same management and diet.
For molecular analyses, biopsies of Longissimus thoracis muscle performed between the 12th and 13th rib were obtained from 40 calves (20 EW and 20 CW) at 205 days of age. The collected biopsies were kept in liquid nitrogen and transported to the Laboratory of Genetics and Animal Breeding (LGMA) of the School of Veterinary Medicine and Animal Science (FMVZ), São Paulo State University (Unesp), Botucatu. These samples were stored frozen at -80oC until the time of RNA and DNA extraction.
4.2. Genomic DNA Extraction, RRBS, Quality Control and Alignment to Reference Genome
For DNA methylation analysis, total genomic DNA was extracted from the muscle biopsies of five individuals from each group (EW and CW) for reduced-representation bisulfite sequencing (RRBS), which focuses on genomic regions rich in CpG. For this purpose, 10 genomic libraries were prepared and sequenced (five EW vs five CW) using 30 U of the MspI restriction enzyme to digest CpG-rich regions, followed by bisulfite treatment using the EZ DNA Methylation-Lightning™ Kit (Zymo Research, USA). Sequencing was performed using 150 paired-end reads on the Illumina NovaSeq 6000 platform (Illumina, USA).
The reads obtained were identified using standard base calling software (Illumina, USA) and the quality of the raw fastq files was analyzed with FastQC 0.11.9 [52]. Adapters was trimmed and low-quality reads were removed using the TrimGalore 0.6.4 software [53]. Alignment to the reference genome (Bos taurus ARS-UCD1.2) was performed using the Bismark 0.22.3 software [54]. Total methylated (C) and unmethylated (T) cytosine reads were called using the MethylDackel v0.5.0 tool (https://github.com/dpryan79/MethylDackel).
4.3. Identification and Characterization of Differentially Methylated Regions and Genes
First, to better understand the context of cytosine methylation, metrics that distinguish cytosines directly linked to guanines (CpG), indirectly linked to guanines (CHG), or not linked to guanines (CHH) were obtained with the MethylDackel v0.5.0 tool, in which H is the IUPAC ambiguity code for any nucleotide other than G. In addition, coverage metrics, correlation of methylation levels between samples, and chromosomal distribution of methylated cytosines were generated with the R package methylKit [55].
To identify differential DNA methylation patterns, the methylKit v1.24.0 package [55] was used for previous coverage filtering (>10x) and normalization of T/C ratios across samples. In addition, for each sample, 1000 bp tiles were formed every 500 bp (sliding tiles), which allowed to calculate the T/C ratios per delimited and overlapping genomic regions. Based on Fisher’s exact test, it was then possible to identify positions containing differentially methylated cytosines (DMCs) between groups, as well as genomic regions containing average proportions of DMCs between groups (DMRs). For more robust identification of DMCs and DMRs, in addition to the p-value adjusted for multiple comparisons (qvalue < 0.05), the minimum difference of methylated cytosines of 20% between groups was also used in both cases (DMCs and DMRs).
For description of the basic DMR annotation, the plotTargetAnnotation function was applied through the interface of the genomation [56] and methylKit [55] packages of R [57], in which DMRs can overlap with only promoter regions, intergenic regions, exons, and introns. Overlaps with CpG islands and shores are also observed.
For the subsequent gene expression and methylation combined analyses, which require a greater amount of genomic information in terms of DMR annotation, were performed a customized annotation script using NCBI RefSeq and CpG_island files obtained from the UCSC Genome Browser (https://genome.ucsc.edu/cgi-bin/hgTables) based on the URS-ACD1.2 assembly. In this case, in addition to the information obtained above, the position of introns and exons was discriminated, as well as the overlap between CpG islands and shores in gene and promoter regions. To definition of the promoter region was considered 2000 bp downstream and 500 bp upstream of the transcription start site (TSS).
4.4. Relative Gene Expression
To access to the expression level of the genes studied here, a transcriptome dataset of Longissimus thoracis muscle obtained for the same samples as used in this experiment was employed, which are available at https://drive.google.com/drive/folders/113q1QKulYBU22EC7ZwtbWk-2ORFIEzek?usp=share_link. The data obtained from the n x m matrix containing the genes symbol (n) and the number of samples (m) were normalized using counts per million (CPM) to obtain the relative expression between treatments (CW and EW), given as the logarithmic function of fold change (logFC). The significance values of the difference between mean treatment counts were obtained with a generalized model assuming a negative binomial distribution, followed by application of the likelihood ratio test assuming an F-distribution of pvalues. For this purpose, the dispersion parameter was estimated in a standard manner and TNM normalized data were obtained considering the relative size of the libraries. The edgeR v. 4.2.0 package [58] in R v. 4.3.3 was used for these differential expression analyses [57].
4.5. Relationship between Differentially Methylated Genes and Genes Expression
To investigate the relationship between differentially methylated genes (DMGs) and their expression levels, graphical representation and statistical associations between methylation percentage and gene expression level were performed. In general, the positions and relative methylation levels (hyper- or hypomethylated) of genomic regions to which these DMRs were mapped were analyzed in relation to the level of gene expression (over- or underexpressed). Next, the correlation between the gene expression level given as logFC of DMGs and the methylation percentage of the DMRs was analyzed using Pearson’s correlation coefficient. Finally, a trend line was fitted by simple linear regression in which the level of gene expression given as logFC was the response variable and the methylation level expressed as percentage was the explanatory variable. For this, only genes that were DMRs and DMGs was considerated.
4.6. Functional Enrichment of Differentially Methylated Genes
Enrichment analysis of gene ontology biological processes (GO_BP) and metabolic pathways (KEGG) was performed using the EnrichR software [59], considering both DMGs and differentially expressed genes (DEGs) obtained by differential gene expression analysis [44]. GO terms and KEGG pathways with a pvalue < 0.01 and qvalue < 0.1 were considered to be significantly enriched.
5. Conclusions
The data obtained in this study suggest that early weaning of Nellore cattle alters the methylation profile of some genes linked to metabolism. The ADCY3 gene is one of the main genes that were differentially methylated and differentially expressed. Functional enrichment analysis suggested that the cAMP signaling pathway may play an important role in the metabolic changes observed in early weaned cattle. Cyclic AMP signaling is involved in adipogenesis and lipogenesis processes and the DEG data found here demonstrated strong alteration in the expression of genes involved in de novo lipogenesis. The differential methylation of metabolism genes due to early weaning supplementation found in this study suggests that ADCY3 may be one of keys gene for understanding metabolic programming associated with fat deposition pathways in cattle and indicate that epigenetic mechanisms such as DNA methylation may be involved in the energetic metabolism adaptation caused by diet and environmental modification in Nellore calves early weaned.
Supplementary Materials
The following supporting information can be downloaded at the website of this paper posted on Preprints.org, Table S1: DMR Complete Annotation Methylated Regions; Table S2: DMG Results; Table S3: DMG expression level; Table S4: Relative expression results from edgeR.
Author Contributions
Conceptualization, Rogério Curi, Luis Arthur Chardulo, Otávio Neto and Guilherme Pereira; Data curation, Gustavo Tinoco, Juliana Torrecilhas and Guilherme Pereira; Formal analysis, Gustavo Tinoco, Marcelo Vicari, Isabella Lissa Souza and Guilherme Pereira; Funding acquisition, Guilherme Pereira; Investigation, Gustavo Tinoco; Methodology, Philipe Moriel, Luis Arthur Chardulo and Otávio Neto; Project administration, Guilherme Pereira; Software, Gustavo Tinoco and Guilherme Pereira; Supervision, Guilherme Pereira; Validation, Rogério Curi, Gustavo Russo, Philipe Moriel and Welder Baldassini; Visualization, Rogério Curi; Writing – original draft, Juliana Torrecilhas, Philipe Moriel and Welder Baldassini; Writing – review & editing, Gustavo Tinoco, Rogério Curi, Marcelo Vicari and Guilherme Pereira. All authors have read and agreed to the published version of the manuscript.
Funding
This research was funded by São Paulo Research Foundation (FAPESP), grant number 12851-1 and 2022/09291-7.
Institutional Review Board Statement
The animal study protocol was approved by the Institutional Ethics Committee of the College of Veterinary and Animal Science of the University of São Paulo State, Brazil (protocol code 0190/2020 on 16 December 2020).
Data Availability Statement
The data presented in this study are available on request from the corresponding author.
Acknowledgments
The São Paulo Research Foundation, FAPESP for financial support (process numbers: 12851-1; 2022/09291-7). Fazenda Batuque e Silveira Consultoria Pecuária for supplying animals, assistance with field experiments and tissues collection logistics.
Conflicts of Interest
The authors declare no conflicts of interest.
References
- Loy, D., Maxwell, D., Rouse, G. Effect of Early Weaning of Beef Calves on Performance and Carcass Quality. 1999 Beef Research Report — Iowa State University, 2000.
- Restle, J. , Vaz, R. Z., Alves Filho, D. C., Bernardes, R. A. D. L. C., Pascoal, L. L., Senna, D. B. D., & Polli, V. A. Desempenho de vacas Charolês e Nelore desterneiradas aos três ou sete meses. R. Bras. Zootec. 2001, 30(2), 499–507. [CrossRef]
- Beretta, V. , Lobato, J. F. P., & Mielitz Netto, C. G. Produtividade e eficiência biológica de sistemas de produção de gado de corte de ciclo completo no Rio Grande de Sul. R. Bras. Zootec. 2002, 31(2 suppl), 991–1001. [CrossRef]
- Almeida, L. S. P. D. , & Lobato, J. F. P. Efeito da idade de desmame e suplementação no desenvolvimento de novilhas de corte. R. Bras. Zootec. 2004, 33(6 suppl 2), 2086–2094. [CrossRef]
- De Menezes, L.F.G. , Restle J., Pascoal L.L., Brondani I.L., Rosa J.R.P., Pizzuti L.A., Dalla Chieza E. Fontes energéticas para suplementação de bezerros desmamados precocemente, mantidos em pastagem de capim-elefante (Pennisetum purpureum, SCHUM.). C. Anim. Bras. 2008, 9(1), 30-42.
- Scheffler J.M., McCann M.A., Greiner S.P., Jiang H., Hanigan M.D., Bridges G.A., ... & Gerrard D.E. Early metabolic imprinting events increase marbling scores in fed cattle. J. Anim. Sci. 2014. 92(1), 320-324. [CrossRef]
- Gasser, C.L. , Behlke E.J., Grum D.E., Day M.L. Effect of timing of feeding a high concentrate diet on growth and attainment of puberty in early-weaned heifers. J. Anim. Sci. 2006, 84(11), 3118-3122. [CrossRef]
- Reddy, K.E. , Jeong J., Baek Y.C., Oh Y.K., Kim M., So K.M., Kim M.J., Kim D.W., Park S.K., Lee H.J. Early weaning of calves after different dietary regimens affects later rumen development, growth, and carcass traits in Hanwoo cattle. Asian-Australas J. Anim. Sci. 2017, 30(10):1425-1434. [CrossRef]
- Veland, N. , Chen T. Mechanisms of DNA Methylation and Demethylation During Mammalian Development. In Handbook of Epigenetics. 2nd ed. [s.l.]. 2017, Elsevier. p. 11–24. [CrossRef]
- Curradi, M. , Izzo A., Badaracco G., Landsberger N. Molecular mechanisms of gene silencing mediated by DNA methylation. Molecular and cellular biology. 2002, 22(9), 3157 3173. [CrossRef]
- Niciura S.C.M., Saraiva N.Z. Epigenética: bases moleculares, efeitos na fisiologia e na patologia, e implicações para a produção animal e a vegetal. 2nd ed. São Carlos, SP: Embrapa Pecuária Sudeste; Brasília, DF: Embrapa Informação Tecnológica. 2015. http://www.alice.cnptia.embrapa.br/handle/doc/1077512.
- Zhang, N. Epigenetic modulation of DNA methylation by nutrition and its mechanisms in animals. Animal Nutrition. 2015, 1(3), 144–151. [Google Scholar] [CrossRef] [PubMed]
- McKay, J. A. , & Mathers, J. C. Diet induced epigenetic changes and their implications for health: Nutrition, epigenetics and health. Acta Physiologica. 2011, 202(2), 103–118. [CrossRef]
- Feil, R. , & Fraga, M. F. Epigenetics and the environment: emerging patterns and implications. Nature Reviews Genetics. 2012, 13(2), 97–109. [CrossRef]
- Mentch, S. J. , & Locasale, J. W. One-carbon metabolism and epigenetics: understanding the specificity. Annals of the New York Academy of Sciences. 2016, 1363(1), 91–98. [CrossRef]
- Silveira, L. G. G. , Piona, M. N. M., Mousquer, C. J., Gomes, R. S., & Silveira, A. C. Sistemas de cria em áreas tropicais: desmama precoce. Revisão de Literatura. Ver. Bras. Hig. San. Anim. 2021,15(1), 1–14. [CrossRef]
- Murdoch, B. M., Murdoch, G. K., Greenwood, S., & McKay, S. Nutritional Influence on Epigenetic Marks and Effect on Livestock Production. Frontiers in Genetics. 2016, 7. [CrossRef]
- Ngo, V. , & Hein, L. Epigenetics concepts: An overview. In Epigenetics in Cardiovascular Disease (p. 19–40). Elsevier. 2021. [CrossRef]
- McKay, S. , Betancourt, F., Bhattarai, S., Buttolph, T., White, S., Lachance, H., Quijada, D., Friedman, S., Perlee, S., Cantrell, B., & Murdoch, B. 115 Profiling Conservation of DNA Methylation in Cattle. J. Anim. Sci. 2018, 96(suppl_3), 370–370. [CrossRef]
- Crouse, M. S., Caton, J. S., Claycombe-Larson, K. J., Diniz, W. J. S., Lindholm-Perry, A. K., Reynolds, L. P., Dahlen, C. R., Borowicz, P. P., & Ward, A. K. Epigenetic Modifier Supplementation Improves Mitochondrial Respiration and Growth Rates and Alters DNA Methylation of Bovine Embryonic Fibroblast Cells Cultured in Divergent Energy Supply. Frontiers in Genetics. 2022; 13, 812764. [CrossRef]
- Anderson, O. S. , Sant, K. E., & Dolinoy, D. C. Nutrition and epigenetics: an interplay of dietary methyl donors, one-carbon metabolism and DNA methylation. The Journal of Nutritional Biochemistry. 2012, 23(8), 853–859. [CrossRef]
- Niculescu, M. D., & Zeisel, S. H. Diet, Methyl Donors and DNA Methylation: Interactions between Dietary Folate, Methionine and Choline. The Journal of Nutrition. 2012, 132(8), 2333S–2335S. [Google Scholar] [CrossRef]
- Lobley, G. E. Control of the metabolic fate of amino acids in ruminants: a review. J. Anim. Sci. 1992, 70(10), 3264–3275. [Google Scholar] [CrossRef] [PubMed]
- Amaral, C. L. D. , Bueno, R. D. B. E. L., Burim, R. V., Queiroz, R. H. C., Bianchi, M. D. L. P., & Antunes, L. M. G. The effects of dietary supplementation of methionine on genomic stability and p53 gene promoter methylation in rats. Mutation Research/Genetic Toxicology and Environmental Mutagenesis. 2011, 722(1), 78–83. [CrossRef]
- Mukherjee, N., Kumar, A. P., & Ghosh, R. DNA Methylation and Flavonoids in Genitourinary Cancers. Current Pharmacology Reports. 2015, 1(2), 112–120. [Google Scholar] [CrossRef]
- Ramos, P. M., Scheffler, T. L., Beline, M., Bodmer, J., Gerrard, D. E., Silva, S. L. Challenges and opportunities of using Bos indicus cattle to meet consumers’ demand for quality beef. Meat Science. 2024, 207, 109375. [CrossRef] [PubMed]
- Rogne, M. , & Taskén, K. Compartmentalization of cAMP Signaling in Adipogenesis, Lipogenesis, and Lipolysis. Hormone and Metabolic Research. 2014, 46(12), 833–840. [CrossRef]
- Tong, T. , Shen, Y., Lee, H.-W., Yu, R., & Park, T. Adenylyl cyclase 3 haploinsufficiency confers susceptibility to diet-induced obesity and insulin resistance in mice. Scientific Reports. 2016, 6(1), 34179. [CrossRef]
- Goni, L. , Riezu-Boj, J. I., Milagro, F. I., Corrales, F. J., Ortiz, L., Cuervo, M., & Martínez, J. A. Interaction between an ADCY3 Genetic Variant and Two Weight-Lowering Diets Affecting Body Fatness and Body Composition Outcomes Depending on Macronutrient Distribution: A Randomized Trial. Nutrients. 2018, 10(6), 789. [CrossRef]
- Wu, L. , Shen, C., Seed Ahmed, M., Östenson, C. -G., & Gu, H. F. Adenylate cyclase 3: a new target for anti-obesity drug development. Obesity Reviews. 2016, 17(9), 907–914. [CrossRef]
- London, E. , Bloyd, M., & Stratakis, C. A. PKA functions in metabolism and resistance to obesity: lessons from mouse and human studies. J. Endocri. 2020, 246(3), R51–R64. [CrossRef]
- Fitzpatrick, M. , & Solberg Woods, L. C. Adenylate cyclase 3: a potential genetic link between obesity and major depressive disorder. Physiological Genomics. 2024, 56(1), 1–8. [CrossRef]
- Hausman, G. J. , Dodson, M. V., Ajuwon, K., Azain, M., Barnes, K. M., Guan, L. L., Jiang, Z., Poulos, S. P., Sainz, R. D., Smith, S., Spurlock, M., Novakofski, J., Fernyhough, M. E., & Bergen, W. G. BOARD-INVITED REVIEW: The biology and regulation of preadipocytes and adipocytes in meat animals1,2. J. Anim. Sci. 2009, 87(4), 1218–1246. [CrossRef]
- Tseng, Y.-H. , Cypess, A. M., Kahn, C. R. Cellular bioenergetics as a target for obesity therapy. Nature Reviews Drug Discovery. 2010, 9(6), 465–482. [CrossRef] [PubMed]
- Ladeira, M. , Schoonmaker, J., Gionbelli, M., Dias, J., Gionbelli, T., Carvalho, J., & Teixeira, P. Nutrigenomics and Beef Quality: A Review about Lipogenesis. Inter. J. Mol. Sci. 2016, 17(6), 918. [CrossRef]
- Dodson, M. V. , Jiang, Z., Chen, J., Hausman, G. J., Guan, L. L., Novakofski, J., Thompson, D. P., Lorenzen, C. L., Fernyhough, M. E., Mir, P. S., & Reecy, J. M. Allied Industry Approaches to Alter Intramuscular Fat Content and Composition in Beef Animals. J. Food Sci. 2010, 75(1). [CrossRef]
- Fernyhough, M. E., Okine, E., Hausman, G., Vierck, J. L., & Dodson, M. V. PPARγ and GLUT-4 expression as developmental regulators/markers for preadipocyte differentiation into an adipocyte. Domestic Animal Endocrinology. 2007, 33(4), 367–378. [Google Scholar] [CrossRef] [PubMed]
- Seale, P., Kajimura, S., Yang, W., Chin, S., Rohas, L. M., Uldry, M., Tavernier, G., Langin, D., & Spiegelman, B. M. Transcriptional Control of Brown Fat Determination by PRDM16. Cell Metabolism. 2007, 6(1), 38–54. [CrossRef]
- Frühbeck, G. , Sesma, P., & Burrell, M. A. PRDM16: the interconvertible adipo-myocyte switch. Trends in Cell Biology. 2009, 19(4), 141–146. [CrossRef]
- Pacini, F. , & Cantara, S. Molecular Diagnosis of Thyroid Cancer. In Genetic Diagnosis of Endocrine Disorders (p. 153–162). 2016, Elsevier. [CrossRef]
- Yokoyama, C., Wang, X., Briggs, M. R., Admon, A., Wu, J., Hua, X., Goldstein, J. L., & Brown, M. S. SREBP-1, a basic-helix-loop-helix-leucine zipper protein that controls transcription of the low density lipoprotein receptor gene. Cell. 1993, 75(1), 187–197. [CrossRef]
- Li, Y. , Xu, S., Mihaylova, M. M., Zheng, B., Hou, X., Jiang, B., Park, O., Luo, Z., Lefai, E., Shyy, J. Y.-J., Gao, B., Wierzbicki, M., Verbeuren, T. J., Shaw, R. J., Cohen, R. A., & Zang, M. AMPK Phosphorylates and Inhibits SREBP Activity to Attenuate Hepatic Steatosis and Atherosclerosis in Diet-Induced Insulin-Resistant Mice. Cell Metabolism. 2011, 13(4), 376–388. [CrossRef]
- Shimano, H., & Sato, R. SREBP-regulated lipid metabolism: convergent physiology — divergent pathophysiology. Nature Reviews Endocrinology. 2017, 13(12), 710–730. [CrossRef]
- Pedro, A. E. , Torrecilhas, J. A., Torres, R. N. S., Ramírez-Zamudio, G. D., Baldassini, W. A., Chardulo, L. A. L., Curi, R. A., Russo, G. H., Napolitano, J. A., Bezerra Tinoco, G. L., Mariano, T. B., Caixeta, J. L., Moriel, P., & Pereira, G. L. Early Weaning Possibly Increases the Activity of Lipogenic and Adipogenic Pathways in Intramuscular Adipose Tissue of Nellore Calves. Metabolites. 2023, 13(9), 1028. [CrossRef]
- Shingfield, K. J., Bernard, L., Leroux, C., & Chilliard, Y. Role of trans fatty acids in the nutritional regulation of mammary lipogenesis in ruminants. Animal. 2010, 4(7), 1140–1166. [CrossRef]
- Fujino, T. , Kondo, J., Ishikawa, M., Morikawa, K., & Yamamoto, T. T. Acetyl-CoA Synthetase 2, a Mitochondrial Matrix Enzyme Involved in the Oxidation of Acetate. J. Bio. Chem. 2001, 276(14), 11420–11426. [CrossRef]
- Kaikaus, R. M., Bass, N. M., & Ockner, R. K. Functions of fatty acid binding proteins. Experientia. 1990, 46(6), 617–630. [CrossRef]
- Goszczynski, D. E. , Papaleo-Mazzucco, J., Ripoli, M. V., Villarreal, E. L., Rogberg-Muñoz, A., Mezzadra, C. A., Melucci, L. M., & Giovambattista, G. Genetic Variation in FABP4 and Evaluation of Its Effects on Beef Cattle Fat Content. Animal Biotechnology. 2017, 28(3), 211–219. [CrossRef]
- Barendse, W., Bunch, R. J., Thomas, M. B., & Harrison, B. E. A splice site single nucleotide polymorphism of the fatty acid binding protein 4 gene appears to be associated with intramuscular fat deposition in longissimus muscle in Australian cattle. Animal Genetics. 2009, 40(5), 770–773. [CrossRef]
- Maharani, D., Jung, Y., Jung, W. Y., Jo, C., Ryoo, S. H., Lee, S. H., Yeon, S. H., & Lee, J. H. Association of five candidate genes with fatty acid composition in Korean cattle. Molecular Biology Reports. 2012, 39(5), 6113–6121. [CrossRef]
- Silva A., Souza Filho E.E., & Cunha S.B. Padrões de canal do rio Paraguai na região de Cáceres (MT). Revista Brasileira de Geociências. 2008, volume 38 (1).
- Andrews, S. "FastQC: a quality control analysis tool for high throughput sequencing data." *Github*. 2010.
- Krueger, F. , James, F., Ewels, P., Afyounian, E., Weinstein, M., Schuster-Boeckler, B., Hulselmans, G., & Sclamons. FelixKrueger/TrimGalore: v0.6.10 - add default decompression path (0.6.10). Zenodo. 2023. [Google Scholar] [CrossRef]
- Krueger, F. , & Andrews, S. R. Bismark: a flexible aligner and methylation caller for Bisulfite-Seq applications. Bioinformatics. 2011, 27(11), 1571–1572. [CrossRef]
- Akalin, A. , Kormaksson, M., Li, S., Garrett-Bakelman, F. E., Figueroa, M. E., Melnick, A., & Mason, C. E. methylKit: a comprehensive R package for the analysis of genome-wide DNA methylation profiles. Genome Biology. 2012, 13(10), R87. [CrossRef]
- Akalin, A. , Franke, V., Vlahoviček, K., Mason, C. E., & Schübeler, D. genomation: a toolkit to summarize, annotate and visualize genomic intervals. Bioinformatics. 2015, 31(7), 1127–1129. [CrossRef]
- Team, R. Core. "RA language and environment for statistical computing, R Foundation for Statistical." Computing. 2020.
- Chen, Y. , Chen, L., Lun, A. T. L., Baldoni, P. L., & Smyth, G. K. edgeR 4.0: powerful differential analysis of sequencing data with expanded functionality and improved support for small counts and larger datasets. 2024. [CrossRef]
- Chen, E. Y., Tan, C. M., Kou, Y., Duan, Q., Wang, Z., Meirelles, G. V., Clark, N. R., & Ma’ayan, A. Enrichr: interactive and collaborative HTML5 gene list enrichment analysis tool. BMC Bioinformatics. 2013, 14(1), 128. [CrossRef]
Figure 1.
Percentage of hyper- and hypomethylated regions per chromosome of the reference genome (Bos taurus ARS-UCD1.2).
Figure 1.
Percentage of hyper- and hypomethylated regions per chromosome of the reference genome (Bos taurus ARS-UCD1.2).
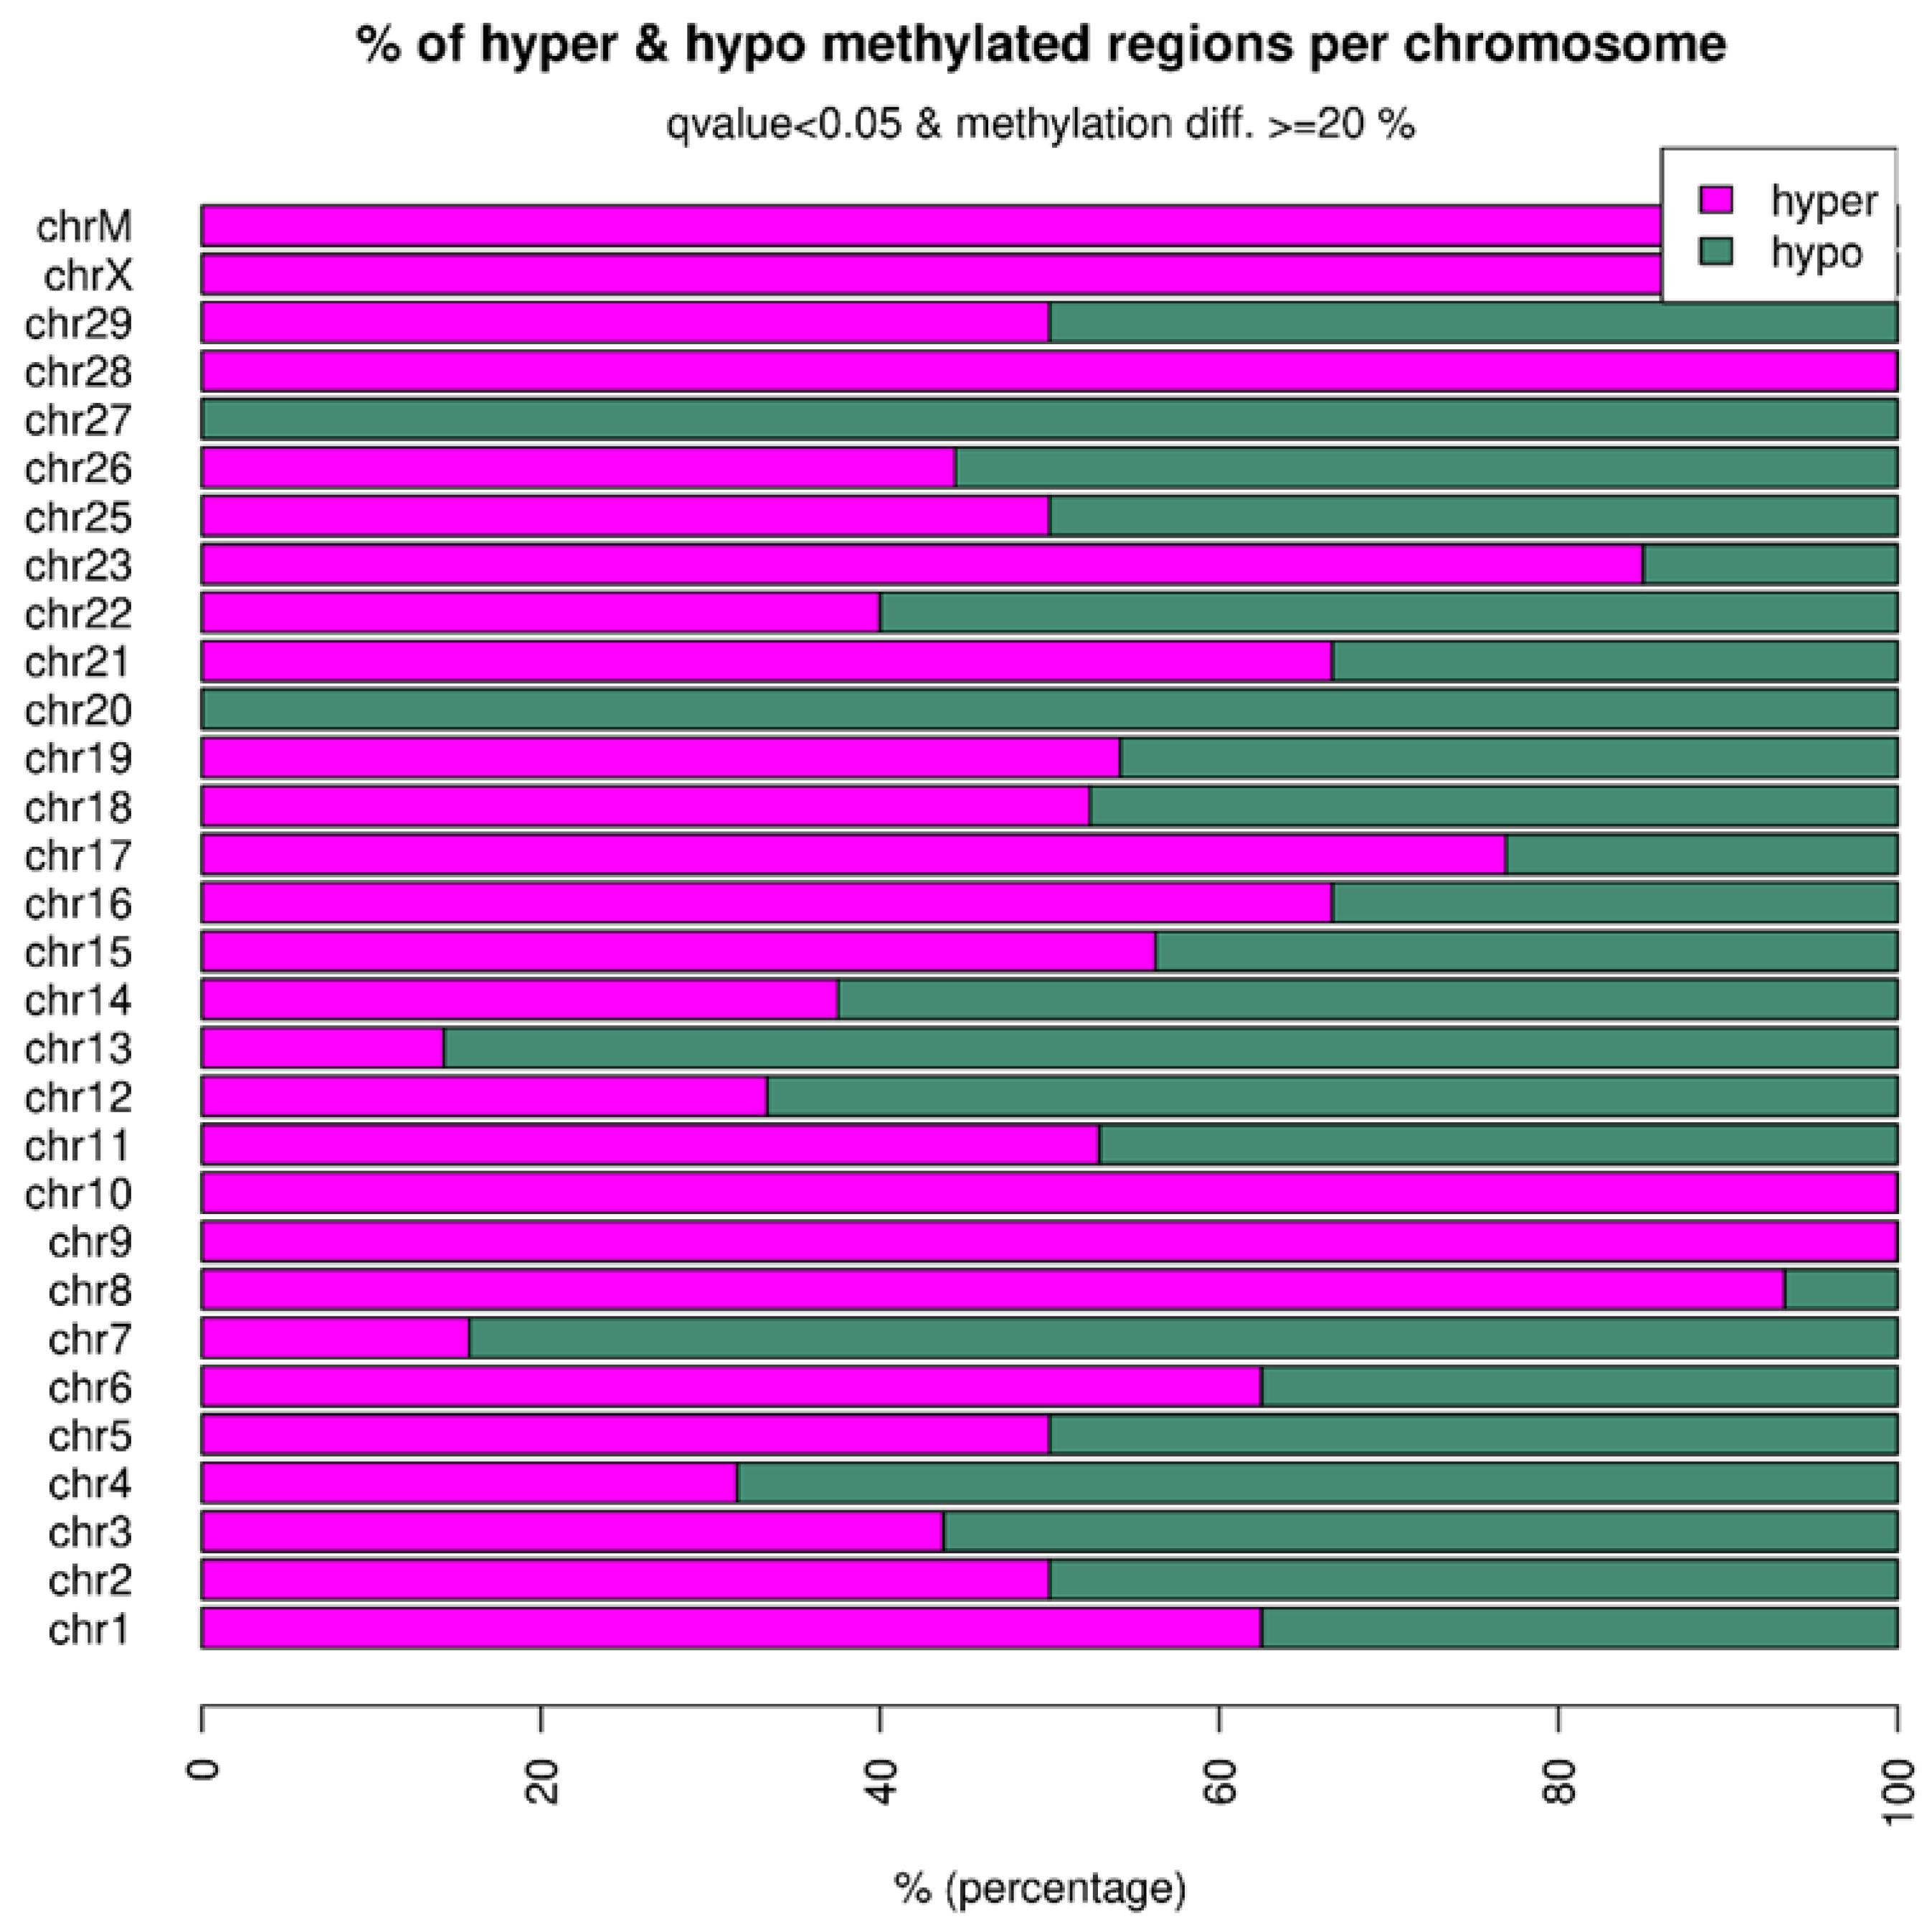
Figure 2.
Proportion of differentially methylated regions (DMRs) overlapping intergenic regions, gene body (exon and intron), and promoter regions (a). Proportion of DMRs in CpG islands (CpGi), shores, and others (b).
Figure 2.
Proportion of differentially methylated regions (DMRs) overlapping intergenic regions, gene body (exon and intron), and promoter regions (a). Proportion of DMRs in CpG islands (CpGi), shores, and others (b).
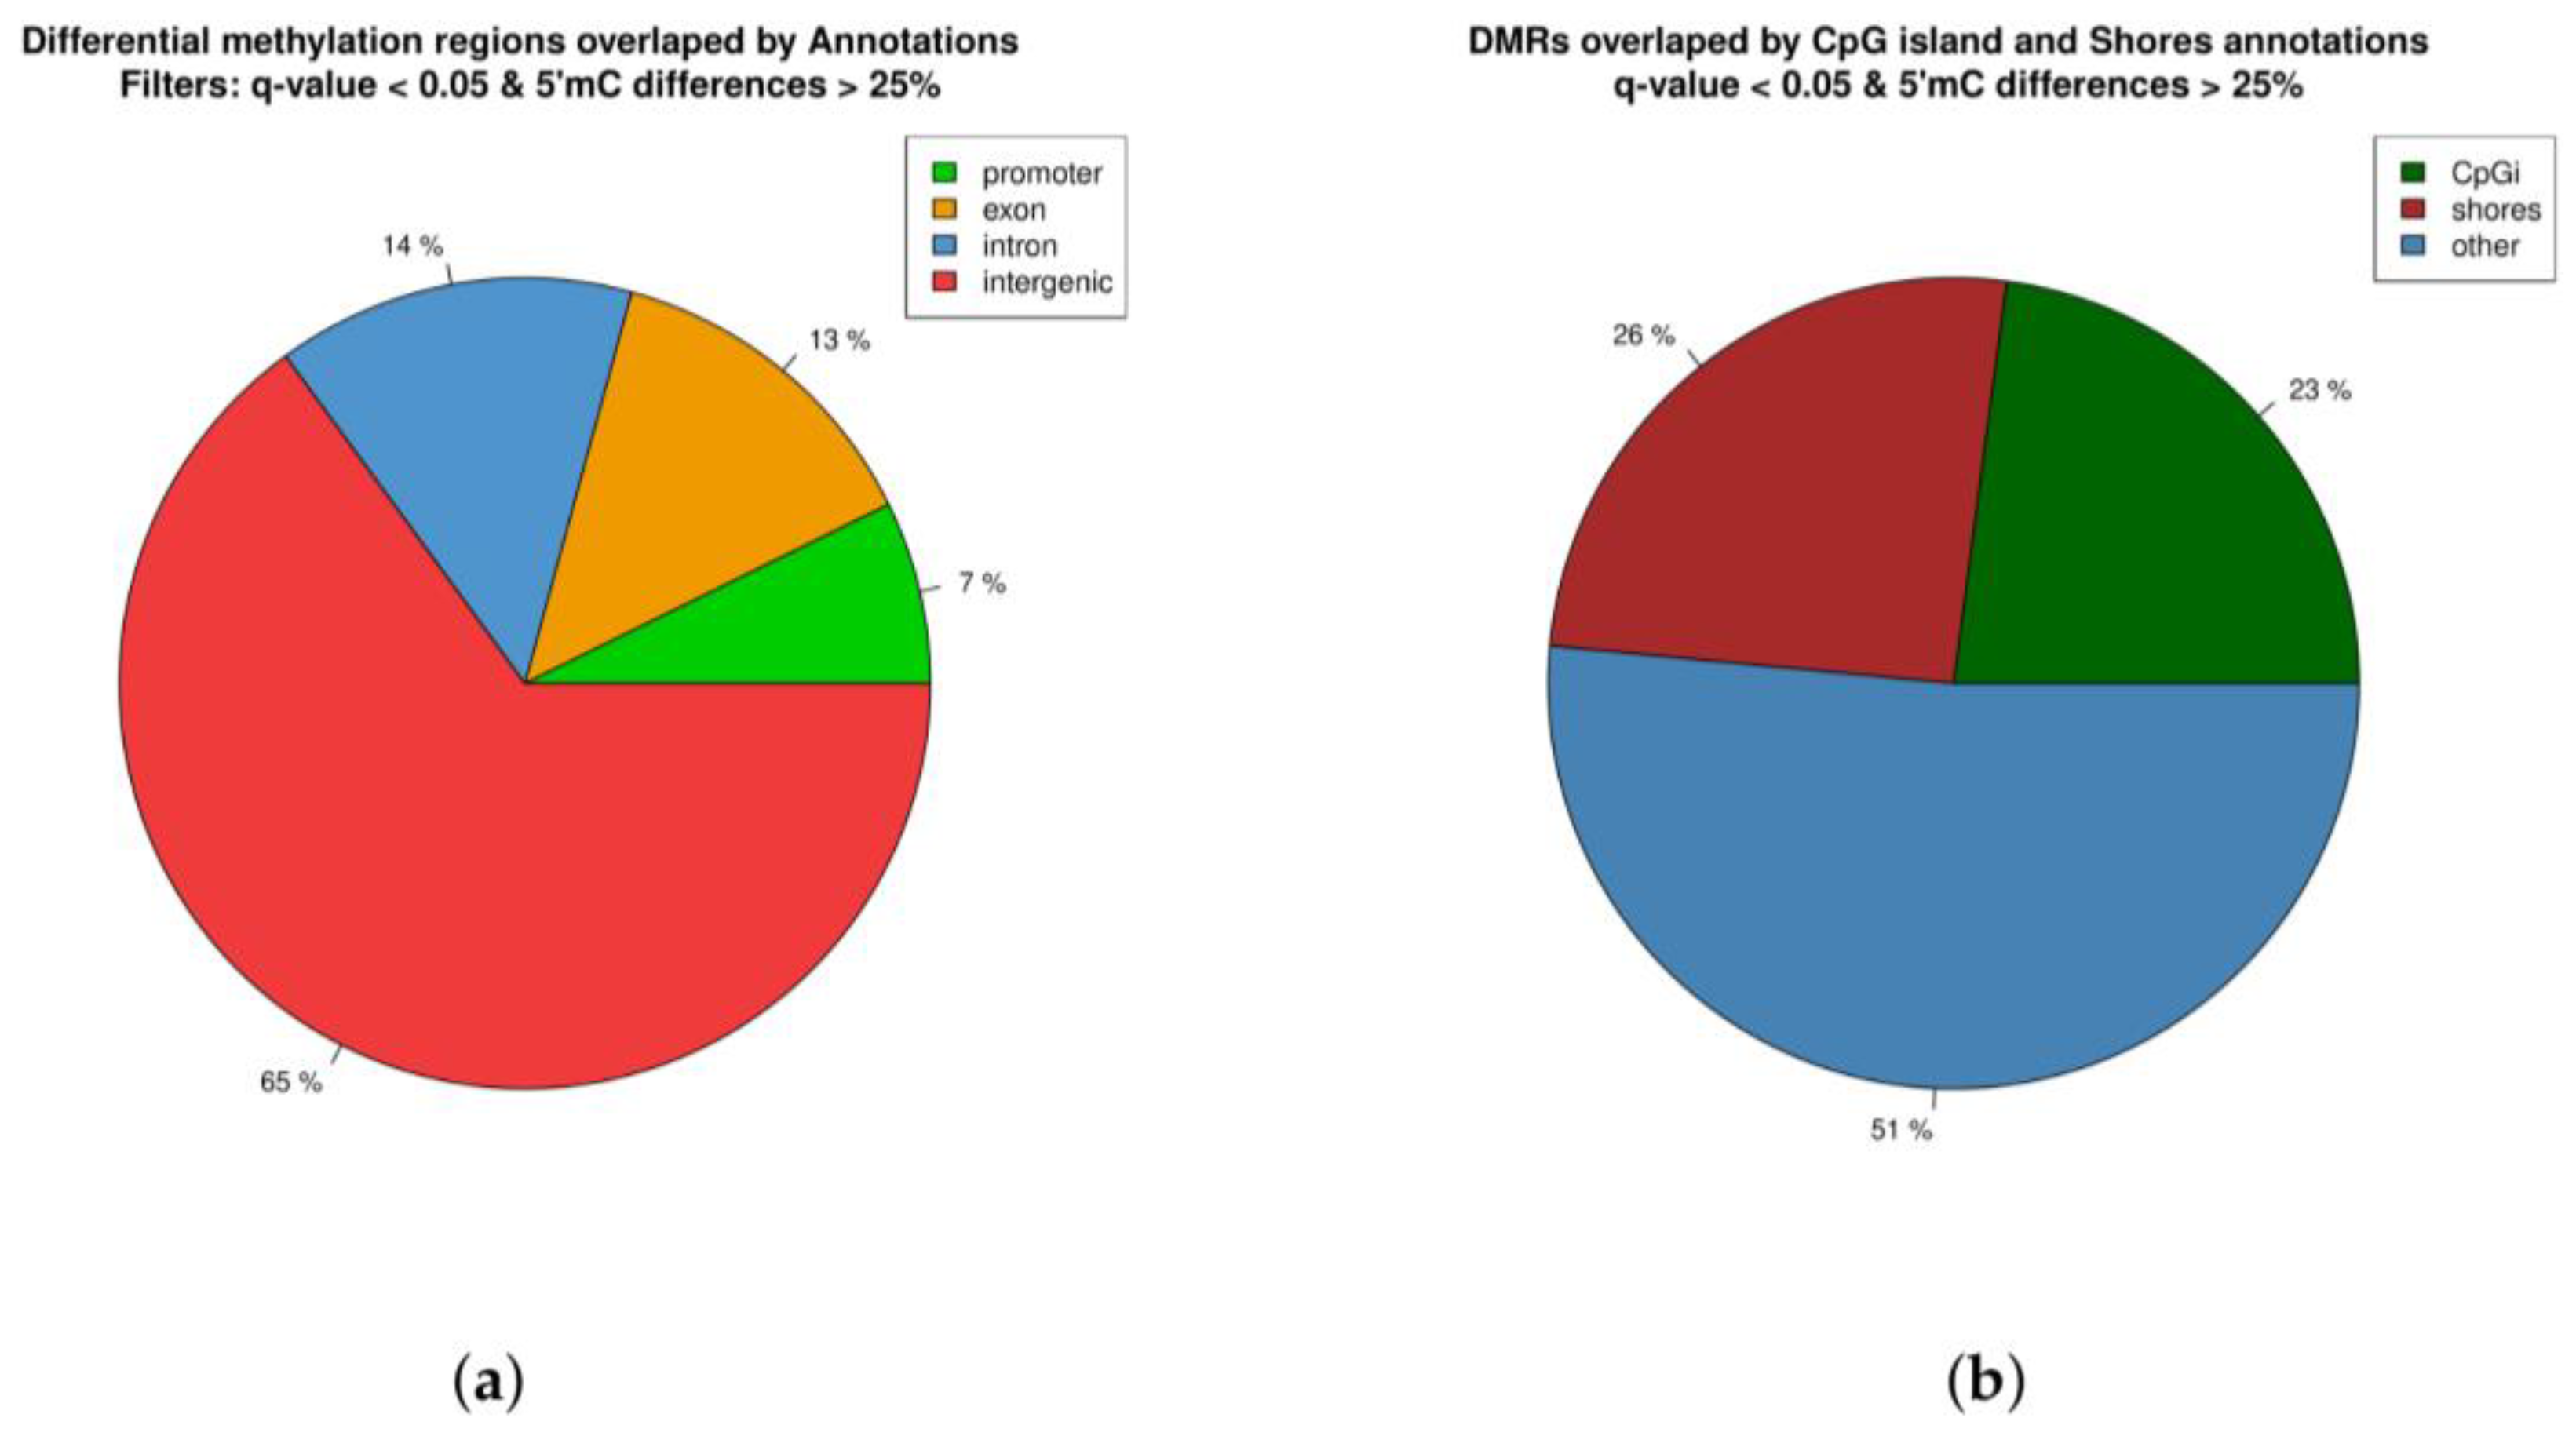
Figure 3.
Scatter plot of methylation percentage and gene expression level in the early weaning vs conventional weaning groups at 205 days. Gray dots indicate promoter regions.
Figure 3.
Scatter plot of methylation percentage and gene expression level in the early weaning vs conventional weaning groups at 205 days. Gray dots indicate promoter regions.
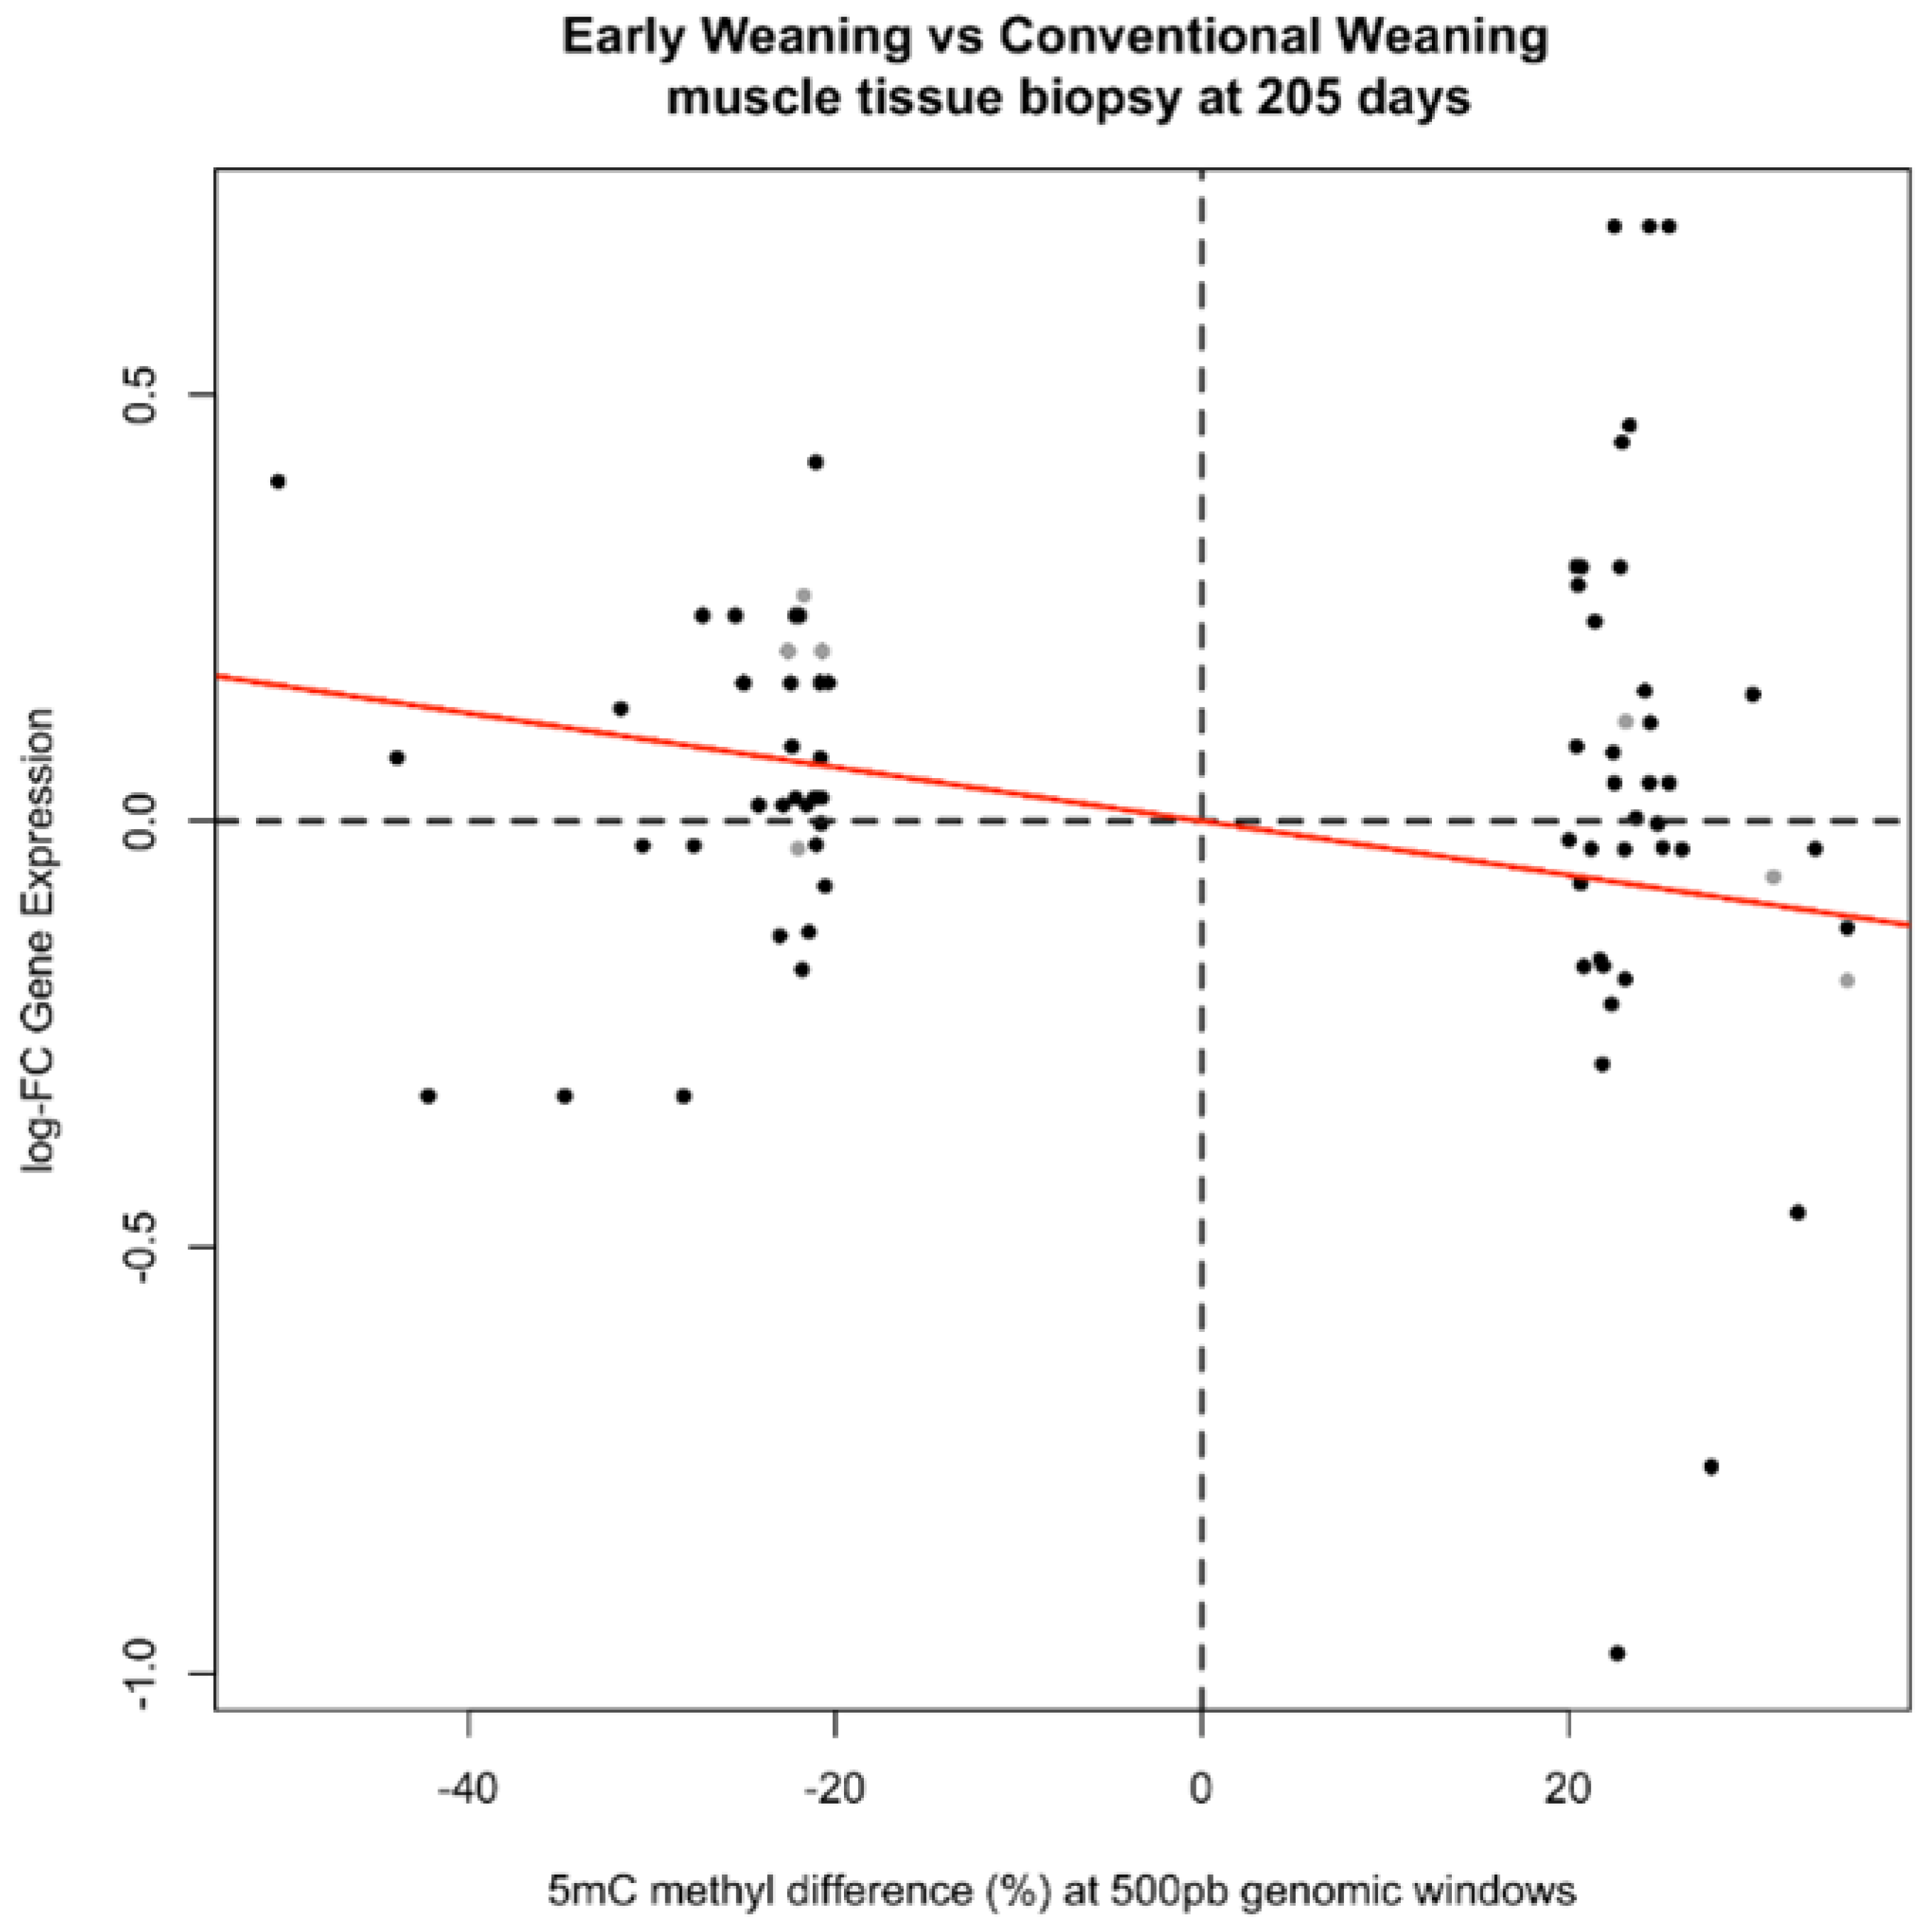

Table 1.
Descriptive statistics of reduced-representation bisulfite sequencing.
| Early weaning | Conventional weaning | |
| Number of raw reads | 30,703,133 | 28,494,972 |
| Number of clean reads | 30,194,010 | 28,023,825 |
| Number of aligned reads | 23,084,052 | 21,452,788 |
| Percentage of aligned reads | 76.45% | 76.55% |
Table 2.
Percentage of methylated CpG, CHG and CHH in the genome of early and conventionally weaned animals.
Table 2.
Percentage of methylated CpG, CHG and CHH in the genome of early and conventionally weaned animals.
| Early weaning | Conventional weaning | |
| mCpG (%) | 3.84% | 3.79% |
| mCHG (%) | 0.54% | 0.51% |
| mCHH (%) | 0.47% | 0.44% |
Table 3.
Differentially methylated regions (DMRs) located in promotors and transcription start sites (TSSes).
Table 3.
Differentially methylated regions (DMRs) located in promotors and transcription start sites (TSSes).
| DMG | Description | LocChr | Start | End | DMR.p-value | Meth.diff | Category |
| ADCY3 | adenylate cyclase 3 | chr11 | 74335201 | 74335700 | 2,83E-24 | -20,7252 | TSSes |
| ADCY3 | chr11 | 74335301 | 74335800 | 1,92E-24 | -22,5866 | TSSes | |
| ADCY3 | chr11 | 74335201 | 74335700 | 2,83E-24 | -20,7252 | promoters | |
| ADCY3 | chr11 | 74335301 | 74335800 | 1,92E-24 | -22,5866 | promoters | |
| AKT1 | AKT serine/threonine kinase 1 | chr21 | 69246101 | 69246600 | 3,72E-15 | 31,18985 | promoters |
| ATP6 | mitochondrially encoded ATP synthase 6 | chrM | 6201 | 6700 | 5,75E-23 | 35,20596 | promoters |
| COX1 | cytochrome c oxidase subunit I | chrM | 6201 | 6700 | 5,75E-23 | 35,20596 | promoters |
| F2 | coagulation factor II, thrombin | chr15 | 76656801 | 76657300 | 2,77E-06 | 21,88917 | promoters |
| F2 | chr15 | 76656801 | 76657300 | 2,77E-06 | 21,88917 | TSSes | |
| MAP2K1 | mitogen-activated protein kinase 1 | chr10 | 13275401 | 13275900 | 5,80E-05 | 23,12619 | promoters |
| MAP2K1 | chr10 | 13275201 | 13275700 | 5,80E-05 | 23,12619 | promoters | |
| MAP2K1 | chr10 | 13275301 | 13275800 | 5,80E-05 | 23,12619 | promoters | |
| MRPL28 | mitochondrial ribosomal protein L28 | chr25 | 363101 | 363600 | 0,000182 | -20,7854 | promoters |
| RUVBL1 | RuvB like AAA ATPase 1 | chr22 | 59508001 | 59508500 | 2,67E-08 | -22,0339 | promoters |
| STUB1 | STIP1 homology and U-box containing protein 1 | chr25 | 585001 | 585500 | 1,74E-05 | -25 | promoters |
| STUB1 | chr25 | 584901 | 585400 | 1,74E-05 | -25 | promoters | |
| STUB1 | chr25 | 584801 | 585300 | 0,000112 | -22,4395 | promoters | |
| STUB1 | chr25 | 585101 | 585600 | 1,74E-05 | -25 | promoters | |
| ZNF557 | zinc finger protein 557 | chr7 | 15991901 | 15992400 | 2,77E-08 | -21,7254 | promoters |
Table 4.
GO_BP terms and KEGG pathways enriched for the 53 differentially expressed and methylated genes and their pvalue and qvalue.
Table 4.
GO_BP terms and KEGG pathways enriched for the 53 differentially expressed and methylated genes and their pvalue and qvalue.
| Term | Library | pvalue | qvalue | Genes |
| Growth hormone synthesis, secretion and action | KEGG_2021_Human | 0.00001 | 0.00162 | MAP2K1, ADCY3, ADCY5, MAP2K6, AKT1 |
| Rap1 signaling pathway | KEGG_2021_Human | 0.00001 | 0.00162 | ADCY3, MAP2K6, ADCY5, PGF, MAP2K1, AKT1 |
| Positive regulation of lipid metabolic process (GO:0045834) | GO_Biological_Process_2021 | 0.00003 | 0.02894 | F2, AKT1, PPARD |
| Phospholipase D signaling pathway | KEGG_2021_Human | 0.00004 | 0.00254 | AKT1, ADCY3, ADCY5, F2, MAP2K1 |
| Pathways in cancer | KEGG_2021_Human | 0.00007 | 0.00310 | MAP2K1, PGF, ADCY3, AKT1, ADCY5, F2, PPARD, HEYL |
| GnRH signaling pathway | KEGG_2021_Human | 0.00010 | 0.00323 | MAP2K1, ADCY3, MAP2K6, ADCY5 |
| Connective tissue development (GO:0061448) | GO_Biological_Process_2021 | 0.00013 | 0.70289 | COL11A2, SULF2, DYRK1B |
| Progesterone-mediated oocyte maturation | KEGG_2021_Human | 0.00014 | 0.00323 | MAP2K1, ADCY3, ADCY5, AKT1 |
| Surfactant homeostasis (GO:0043129) | GO_Biological_Process_2021 | 0.00014 | 0.02894 | CTSH, ABCA3 |
| Chemical homeostasis within a tissue (GO:0048875) | GO_Biological_Process_2021 | 0.00014 | 0.02894 | ABCA3, CTSH |
| Chemokine signaling pathway | KEGG_2021_Human | 0.00015 | 0.00323 | MAP2K1, FGR, ADCY3, AKT1, ADCY5 |
| Longevity regulating pathway | KEGG_2021_Human | 0.00015 | 0.00323 | ADCY3, AKT1, ADCY5, EHMT1 |
| Parathyroid hormone synthesis, secretion and action | KEGG_2021_Human | 0.00017 | 0.00323 | ADCY3, ADCY5, MAP2K1, PDE4A |
| Focal adhesion | KEGG_2021_Human | 0.00018 | 0.00323 | PGF, AKT1, ITGB5, TNXB, MAP2K1 |
| Cellular response to forskolin (GO:1904322) | GO_Biological_Process_2021 | 0.00024 | 0.03297 | ADCY3, ADCY5 |
| Response to forskolin (GO:1904321) | GO_Biological_Process_2021 | 0.00024 | 0.03297 | ADCY3, ADCY5 |
| cAMP biosynthetic process (GO:0006171) | GO_Biological_Process_2021 | 0.00030 | 0.03526 | ADCY3, ADCY5 |
| Regulation of proteolysis (GO:0030162) | GO_Biological_Process_2021 | 0.00039 | 0.03996 | F2, AKT1, STUB1 |
| Peptidyl-threonine phosphorylation (GO:0018107) | GO_Biological_Process_2021 | 0.00054 | 0.04846 | DYRK1B, AKT1, MAP2K1 |
| cAMP metabolic process (GO:0046058) | GO_Biological_Process_2021 | 0.00061 | 0.04958 | ADCY3, ADCY5 |
Table 5.
Supplementation and diets consisting of natural forage, soybean meal, corn, additives, and minerals supplied to Nellore cattle at different stages of development and submitted to different weaning protocols.
Table 5.
Supplementation and diets consisting of natural forage, soybean meal, corn, additives, and minerals supplied to Nellore cattle at different stages of development and submitted to different weaning protocols.
| Rearing phase | Early weaning | Conventional weaning |
| Birth to 120 days | Conventional suckling on Brachiaria pasture | |
| 120 to 205 days | Brachiaria decumbens pasture + concentrate-based diet (20% CP¹; 75% TDN²): 1 g of DM³/kg BW⁴ | Conventional suckling + Brachiaria decumbens |
¹crude protein; ²total digestible nutrients; ³dry matter; ⁴body weight.
Disclaimer/Publisher’s Note: The statements, opinions and data contained in all publications are solely those of the individual author(s) and contributor(s) and not of MDPI and/or the editor(s). MDPI and/or the editor(s) disclaim responsibility for any injury to people or property resulting from any ideas, methods, instructions or products referred to in the content. |
© 2024 by the authors. Licensee MDPI, Basel, Switzerland. This article is an open access article distributed under the terms and conditions of the Creative Commons Attribution (CC BY) license (https://creativecommons.org/licenses/by/4.0/).
Copyright: This open access article is published under a Creative Commons CC BY 4.0 license, which permit the free download, distribution, and reuse, provided that the author and preprint are cited in any reuse.


