Preprint
Article

Sensorless Detection of Mechanical Unbalance in Servodrive with Elastic Coupling

Altmetrics

Downloads

87

Views

40

Comments

0

A peer-reviewed article of this preprint also exists.

Submitted:

03 September 2024

Posted:

03 September 2024

You are already at the latest version

Alerts
Abstract
The article focusses on detecting the unbalance of a mechanical component in the electric drive system of a two-mass servomechanism with a PMSM motor, which is connected to the load via a long, flexible shaft. In the example analysed, the degree of unbalance was determined using the reference current signal from the speed controller of the FOC control system. The authors pre-sented a two-mass model with an unbalanced mechanical system. The STFT transform was used to analyse the symptoms of unbalance and an artificial neural network MLP was used for system state inference. The effectiveness of the presented analysis, based on the reference current signal from the sensor embedded in the control system, was experimentally confirmed.
Keywords: 
Subject: Engineering  -   Electrical and Electronic Engineering

1. Introduction

Converter-based drive systems with permanent magnet synchronous motors (PMSM) are widely used in many industrial sectors. Consequently, issues related to the monitoring and diagnosis of electrical, magnetic, and mechanical faults are becoming increasingly important due to the growing use of these drives in various devices, including those critical to safety. Modern drive systems consist not only of the motor and magnets but also of a range of specialised devices, such as power supply systems, frequency converters with pulse width modulation (PWM), measurement and control systems, and complex mechanical systems that transmit mechanical torque (shafts, gears, couplings) to drive the given actuator. Each of these components is susceptible to failures that can disrupt normal drive system operation and require appropriate actions, particularly from the control system, to detect anomalies in the drive system [1,2,3]. Modern diagnostic methods enable the detection of both electrical faults (including various types of short circuit, interphase faults, winding connection issues, etc.) and mechanical faults (such as the most common: bearing damage, eccentricity, misalignment of the drive system, unbalance of rotating elements, shaft deflection, etc.), as well as demagnetisation in permanent magnet motors [4]. Lack of proper diagnostics can lead to significant losses, including a substantial reduction in drive system efficiency, decreased positioning accuracy in servodrives and CNC machines, increased energy consumption, and unplanned downtime. According to the ISO 17359 standard [5], the following signals are used for the proper evaluation of motor condition: current, voltage, input and output power, temperature, rotational speed, vibrations, torque, noise, and acoustic techniques. In advanced motor diagnostics, the most commonly used methods include [1,2,3,6]: motor current and voltage analysis, temperature measurement [7] vibration analysis, and noise analysis. The degradation of the motor and the torque transmission system, manifested by various anomalies or asymmetries, leads to unstable operation. This is typically observed through increased levels of vibration, noise, and temperature [2,4,7]. The electric drive is not fully symmetric [8,9]. To differentiate between asymmetry caused by drive system degradation and asymmetry resulting from power supply issues or inherent design characteristics, it is crucial to correctly identify, record and classify the relevant signals for the proper operation of the drive system. Assessing characteristics, particularly those related to current, helps increase detection sensitivity, thereby eliminating design or power supply asymmetries. Analysis and estimation of these changes serve as criteria for effective operation and accurate detection. As highlighted in review studies [1,2,3,4,10] anomalies can occur in various parts of the drive system. In this article, the focus is on detecting the unbalance of a mechanical component in the electric drive system of a two-mass servomechanism with a PMSM motor, which is connected to the load via a long, flexible shaft. In the analysed system, no additional external sensors for current, acceleration, or acoustics were used; instead, sensors that are part of the drive system's basic equipment (such as speed, position, and current measurement) were utilised. The unbalance was modelled by adding additional masses to a rotating disc that was rigidly attached to the motor shaft. The test mass was varied during the experiments. A review of the literature indicates that there are many methods to detect unbalances in drive systems, most of which pertain to single-mass systems using external sensors [2–4,7,10-12]. These include diagnostic signals such as mechanical vibrations (acceleration) [2] noise (acoustic waves) [2,4] current (stator current) [3,11,12] and temperature [7]. These signals allow for the assessment of the current condition of the electric drive system, particularly in the evaluation of the state of bearings, alignment, balancing, and the condition of the foundation. Thanks to modern measuring instruments (dedicated sensors, measurement cards, and microprocessors), it is possible to measure mechanical vibrations (which can have various causes, whether electrical, magnetic, or mechanical) that indicate the condition of the drive system. In industrial environments, fully symmetrical drive systems are rare or non-existent. Even if such a system was initially balanced at a particular workstation, over time, degradation of a component of the system (whether electrical, magnetic, or mechanical) may occur [13]. Therefore, this work focusses on detecting unbalance in the drive system of a two-mass setup with a PMSM motor, using, among other things, the reference current signal from the speed controller. The two-mass model was investigated because it allows for analysing the impact of torsional vibrations on the drive system. One source of these vibrations is a sudden change in the motor rotational speed, which causes twisting in the flexible connection [14]. Vibrations in two-mass systems lead to energy loss, reduced efficiency, and dynamic stresses [15]. These vibrations are also problematic in precise position control. Therefore, diagnosing the unbalance in the system, which significantly exacerbates this issue, becomes crucial. When a mechanical fault occurs in an electric drive, particularly for a PMSM motor operating in a field-orientated control structure, changes in electrical, magnetic and mechanical parameters lead to disturbances in current, voltage, and speed signals, affecting the proper functioning of the frequency control structure [3,10,16,17,18,19,20]. An uncontrolled increase in the level of damage leads to unstable drive operation [17]. Therefore, it is crucial to detect faults as quickly as possible. Depending on the type and power of the drive, this could range from a few to several seconds. As demonstrated in [3,4,16] internal signals from the drive control structure, particularly current, can be utilised effectively for this purpose. Hence, the aim of this work is to develop a method for monitoring and diagnosing unbalance faults in a two-mass precision servodrive system, using signals from the internal field-orientated control structure embedded within the control system. Many existing solutions, such as those described in [2,3,4,10,12,13,21,22,23,24,25,26,27,28,29] use additional sensors to monitor the condition of machines or equipment. Adding these elements to existing systems significantly increases costs during both installation and operation. This requires regular calibration, maintenance, and, in the case of failure, replacement, which introduces another potential source of problems within the system. It often requires modifications to existing infrastructure and integration with monitoring software. Furthermore, data from different sensors can be difficult to interpret, often requiring the use of advanced analysis algorithms and personnel with specialised qualifications. The use of non-invasive measurement methods in the drive system, as proposed in the article, reduces costs because utilising existing control signals does not incur additional expenses related to the purchase, installation, and maintenance of new sensors. The non-invasive approach does not require intervention in existing mechanical or electrical systems, thereby eliminating the risk of introducing new sources of failure. Signals used for control are typically already well validated and monitored, which enhances the system's reliability. Since these signals are already part of the control system, using them for fault detection is much simpler and less risky. Fewer components in the system mean fewer potential points of failure, which increases the overall reliability of the system, not just the drive system. For example, in [20] an online diagnostic method for minor Interturn Short Circuits (ISCF) in low-speed Permanent Magnet Synchronous Motors (PMSM) used a technique based on the decomposition of the zero-sequence voltage vector, which is measured within the internal system. Many studies measure voltage, current, or speed signals, such as in [12] where current and speed measurements, along with frequency analysis, were used to diagnose mechanical faults in synchronous machines, with additional sensors used. In [30] a model-based scheme was proposed to detect and identify faults in a gear drive with a steady state PMSM motor. A state-space model of the system was proposed and the Recursive Least Squares (RLS) algorithm was used for parameter estimation. Fault detection was performed using a thresholding method on the residual current spectrum to assess the frequency characteristic of a particular fault. Both invasive and non-invasive methods are applied in this context. For example, in [11,31] the stator current, after Park's transformation, was analysed for rotor unbalance using the discrete wavelet transform. This work focused on the latter method. From a diagnostic perspective, both invasive and non-invasive signals, as well as the methods for processing them, are of equal or similar importance. Thus, the effectiveness of the diagnostic process depends not only on the diagnostic signals analysed [7-9,12,14-15,30] but also on the processing methods applied. For example, in [18], although analysis of Root Mean Square (RMS) vibration signals detects individual faults and helps to determine the technical condition of the machine, unfortunately it cannot specify the cause of its malfunction. In [19] the Fast Fourier Transform (FFT) algorithm was used to detect broken rotor cage bars, eccentricity, and damaged bearings in an induction machine based on mechanical vibration analysis. In [32] the potential for using average, maximum and RMS signals, as well as cross-correlation coefficients, kurtosis, and peak values, for detecting rotor unbalance was presented, with an MLP neural network employed to differentiate these faults. In [33] phase currents and a vibration sensor were used to detect stator faults in a PMSM motor, where wavelet analysis of vibrations was able to identify up to 15% of turn-to-turn shorts in a single phase. Mechanical vibrations are a versatile and widely used diagnostic signal, as demonstrated in [34] where they were also used to detect electromagnetic faults. An example of applying vibroacoustic to identify misalignment in a drive system consisting of a motor, a cylindrical gear and a worm gear is presented in [35]. To detect unbalance in a PMSM drive system, mechanical vibration signals can be analysed using FFT, bispectrum, full spectrum, and orbit shape analysis, as described in [22]. In [21] mechanical vibrations were analysed with FFT to detect PMSM unbalance, with additional modelling of demagnetisation and dynamic eccentricity. In [23], FFT and bispectral analysis of mechanical vibrations and stator current were used to detect rotor unbalance in an induction motor powered by a frequency converter. FFT analysis has limitations because it does not account for changes in process over time [24,25,26,36,37] which is why the Short-Time Fourier Transform (STFT) is used to detect faults in dynamic states, enabling the identification of both the type of fault and its timing. In [36] STFT was used to detect stator faults in a PMSM machine by analysing the stator current, its envelope, and the spatial vector module of the stator current, highlighting STFT's advantages over traditional FFT analysis. In [24] the possibility of detecting the rotor unbalance in an induction motor was demonstrated using STFT analysis of the stator current vector, with results compared to an approach based on FFT analysis of the stator current. In [25] the application of STFT to detect mechanical faults, such as blade-to-stator friction in turbochargers, was demonstrated by analysing vibration signals during machine start-up and braking, showcasing the method's superiority over traditional FFT analysis. In [26] STFT was used to analyse noise from both an undamaged motor and motors with unbalance, misalignment, and bearing damage, allowing for precise determination of the timing of the fault. In [37] the use of variable window STFT was proposed to detect winding faults in PMSM by analysing stator current signals and automating the detection process using a convolutional neural network. It should be noted that the presented literature review does not cover two-mass systems nor does it analyse the reference current signal from the speed controller. In the existing literature, the unbalance is modelled in various types of electric machines and drives. Specifically, an this phenomenon has been identified in induction motors [23,24,26] PMSMs [11,21,22,31,36] tidal turbines [13], commutator motors in impact drills and mixers [27] and washing machines [28,29]. The literature analysis indicates that the issue of unbalance affects all rotating machines. Consequently, this work focusses on detecting unbalance in a two-mass system with a long shaft consisting of two AC servodrives (PMSMs). The non-invasive standard equipment in an automated control system, the reference current signal in the q axis of the speed controller, was analysed using STFT. The study investigated the impact of varying the test mass installed in single-mass and two-mass systems on the level of unbalance in the drive system, specifically examining how the moving average window affects this issue. The influence of different neural network architectures was also analysed, and the optimal solution for the given example was proposed, with experimental validation of this choice in relation to the single-mass system.

2. Unbalance Model

For the purposes of this publication, a simplified unbalance model was adopted, which focuses on taking into account the influence of the weight of the unbalance mass on the creation of the moment of force coming from the force of gravity [38]. This approach does not take into account the centrifugal force because the control system on which the method was developed does not have any information about the current value of this force. The idea is presented in Figure 1, which shows the action of the gravitational force mg on an unbalanced mass m, located at a distance r from the axis of rotation of a cylinder with mass M, moment of inertia J and radius R. It was assumed that this cylinder rotates with constant angular velocity ω relative to the stationary x-y coordinate system. The acceleration due to gravity is set in the vertical direction, parallel to the y axis. The value of the torque acting on the mass m can be expressed by the formula (1)
T u = m g r cos ( φ ) .
Most often it happens m M . During the operation of the system, the unbalance moment T u affects the rotational motion of the cylinder in accordance with Newton's second law of dynamics (2)
J d ω d t = T u = m g r cos ( φ ) .
Assuming that the rotating mass has the shape of a cylinder with mass M and radius R (3)
M R 2 d ω d t = m g r cos ( φ ) .
Hence, the angular acceleration resulting from unbalance is a cosine function of the angle and directly proportional to the amount of unbalance. This means that during operation there is an additional component of angular acceleration, closely related to the unbalanced mass and the instantaneous speed ω (4)
d ω d t = m g r M R 2 cos ( φ ) = m g r M R 2 cos ( ω t ) .
In absolute terms, remembering that in general m M , it is expected that this acceleration will have a small amplitude, but the speed control system will compensate for the resulting disturbance, which should result in the appearance of an additional component with angular speed ω in the control signal. Therefore, it is reasonable to analyse the frequency of the control signal, which should be expected to contain an additional component of rotational frequency, which has its source in the unbalance.
The model of the mechanical part of the single-mass system was implemented in Matlab - Simulink environment to verify the concept for the single-mass object, which were presented in subsection 7.1.

3. Model of the Two – Mass System

The two – mass object is a popular control object in drive automation [39,40,41], since it reflects the characteristics of typical connections found in the mind. The block diagram of the dual-mass system is shown in Figure 2. The description intentionally omits the loss factor inside the connection, as it is generally negligible.
The equations describing the dynamics of an undamped system are described by the relations (5)
J 1 d ω 1 d t = T E k ( θ 1 θ 2 ) J 2 d ω 2 d t = k ( θ 1 θ 2 ) .
Such a system is characterized by two frequencies: resonant ωR and anti-resonant ωA, which result from the physical properties of the object (6)
ω R = k J 1 + J 2 J 1 J 2 ω A = k J 2 .
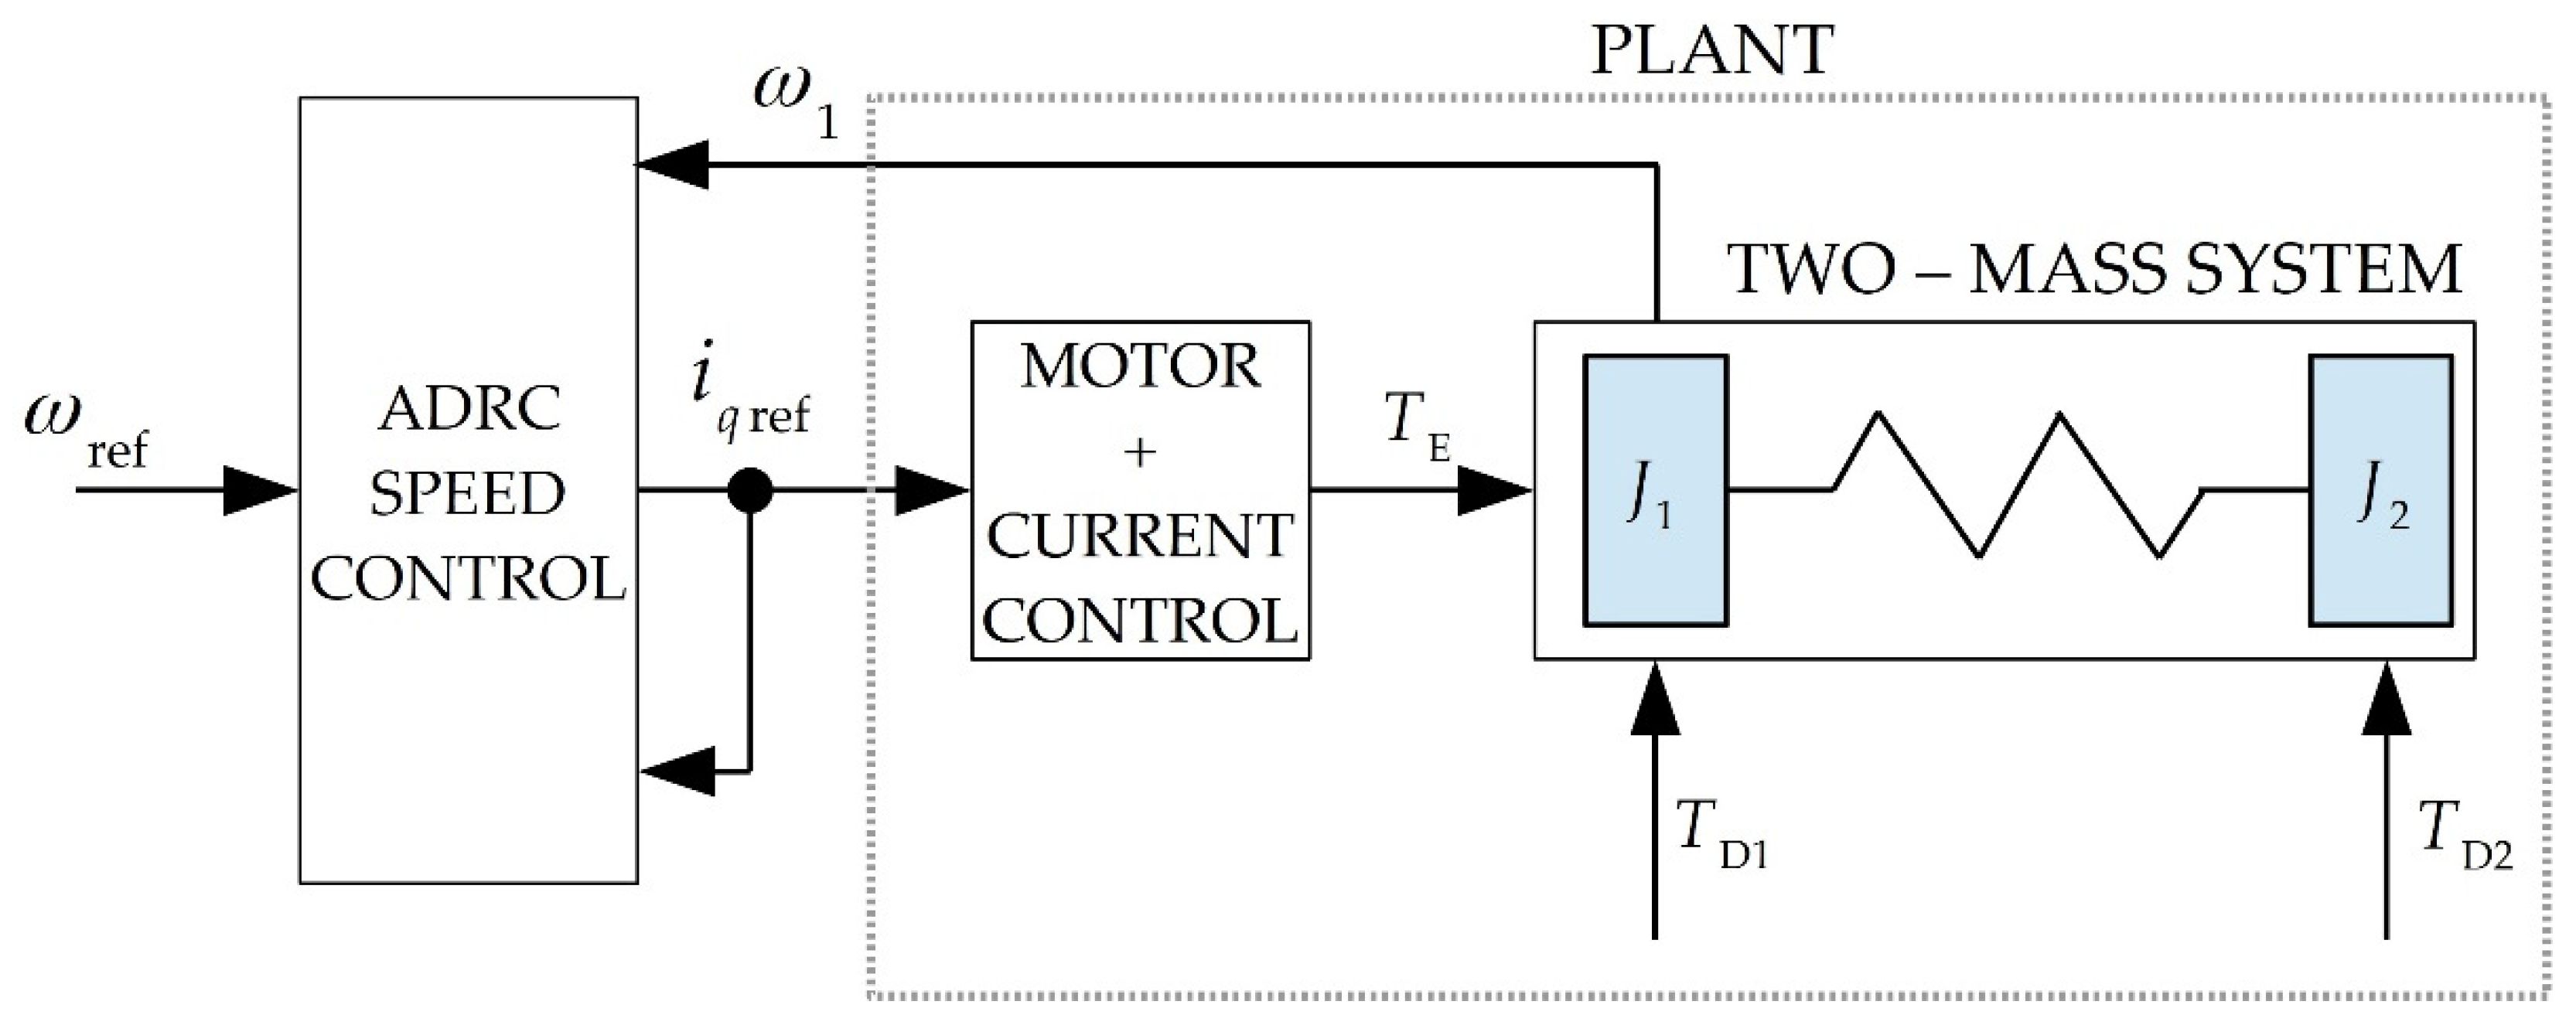
In the described drive system after applying the Clarke and Park transform, the electromagnetic torque TE is proportional to the current in the q-axis: TE = kφ iq Assuming that the time constant of the current control system (τE) is negligible with respect to the resonance frequency of the system, it can be assumed to a good approximation that the current in the q-axis (iq) is equal to the set current (iq ref), which is the output signal from the speed control system. In addition to the above, disturbance moments such as friction moment, external load, as well as moments resulting from mechanical defects: misalignment, unbalance and runout can act on the two – mass object on both sides, these moments are denoted TD1 and TD2 (total disturbance). Taking into account the aforementioned phenomena, the equation of motion of the dual-mass system subjected to interference moments is presented by equation (7)
J 1 d ω 1 d t = k φ i q   ref k ( θ 1 θ 2 ) T D 1 J 2 d ω 2 d t = k ( θ 1 θ 2 ) T D 2 .
A block diagram of the control system is provided in Figure 3.
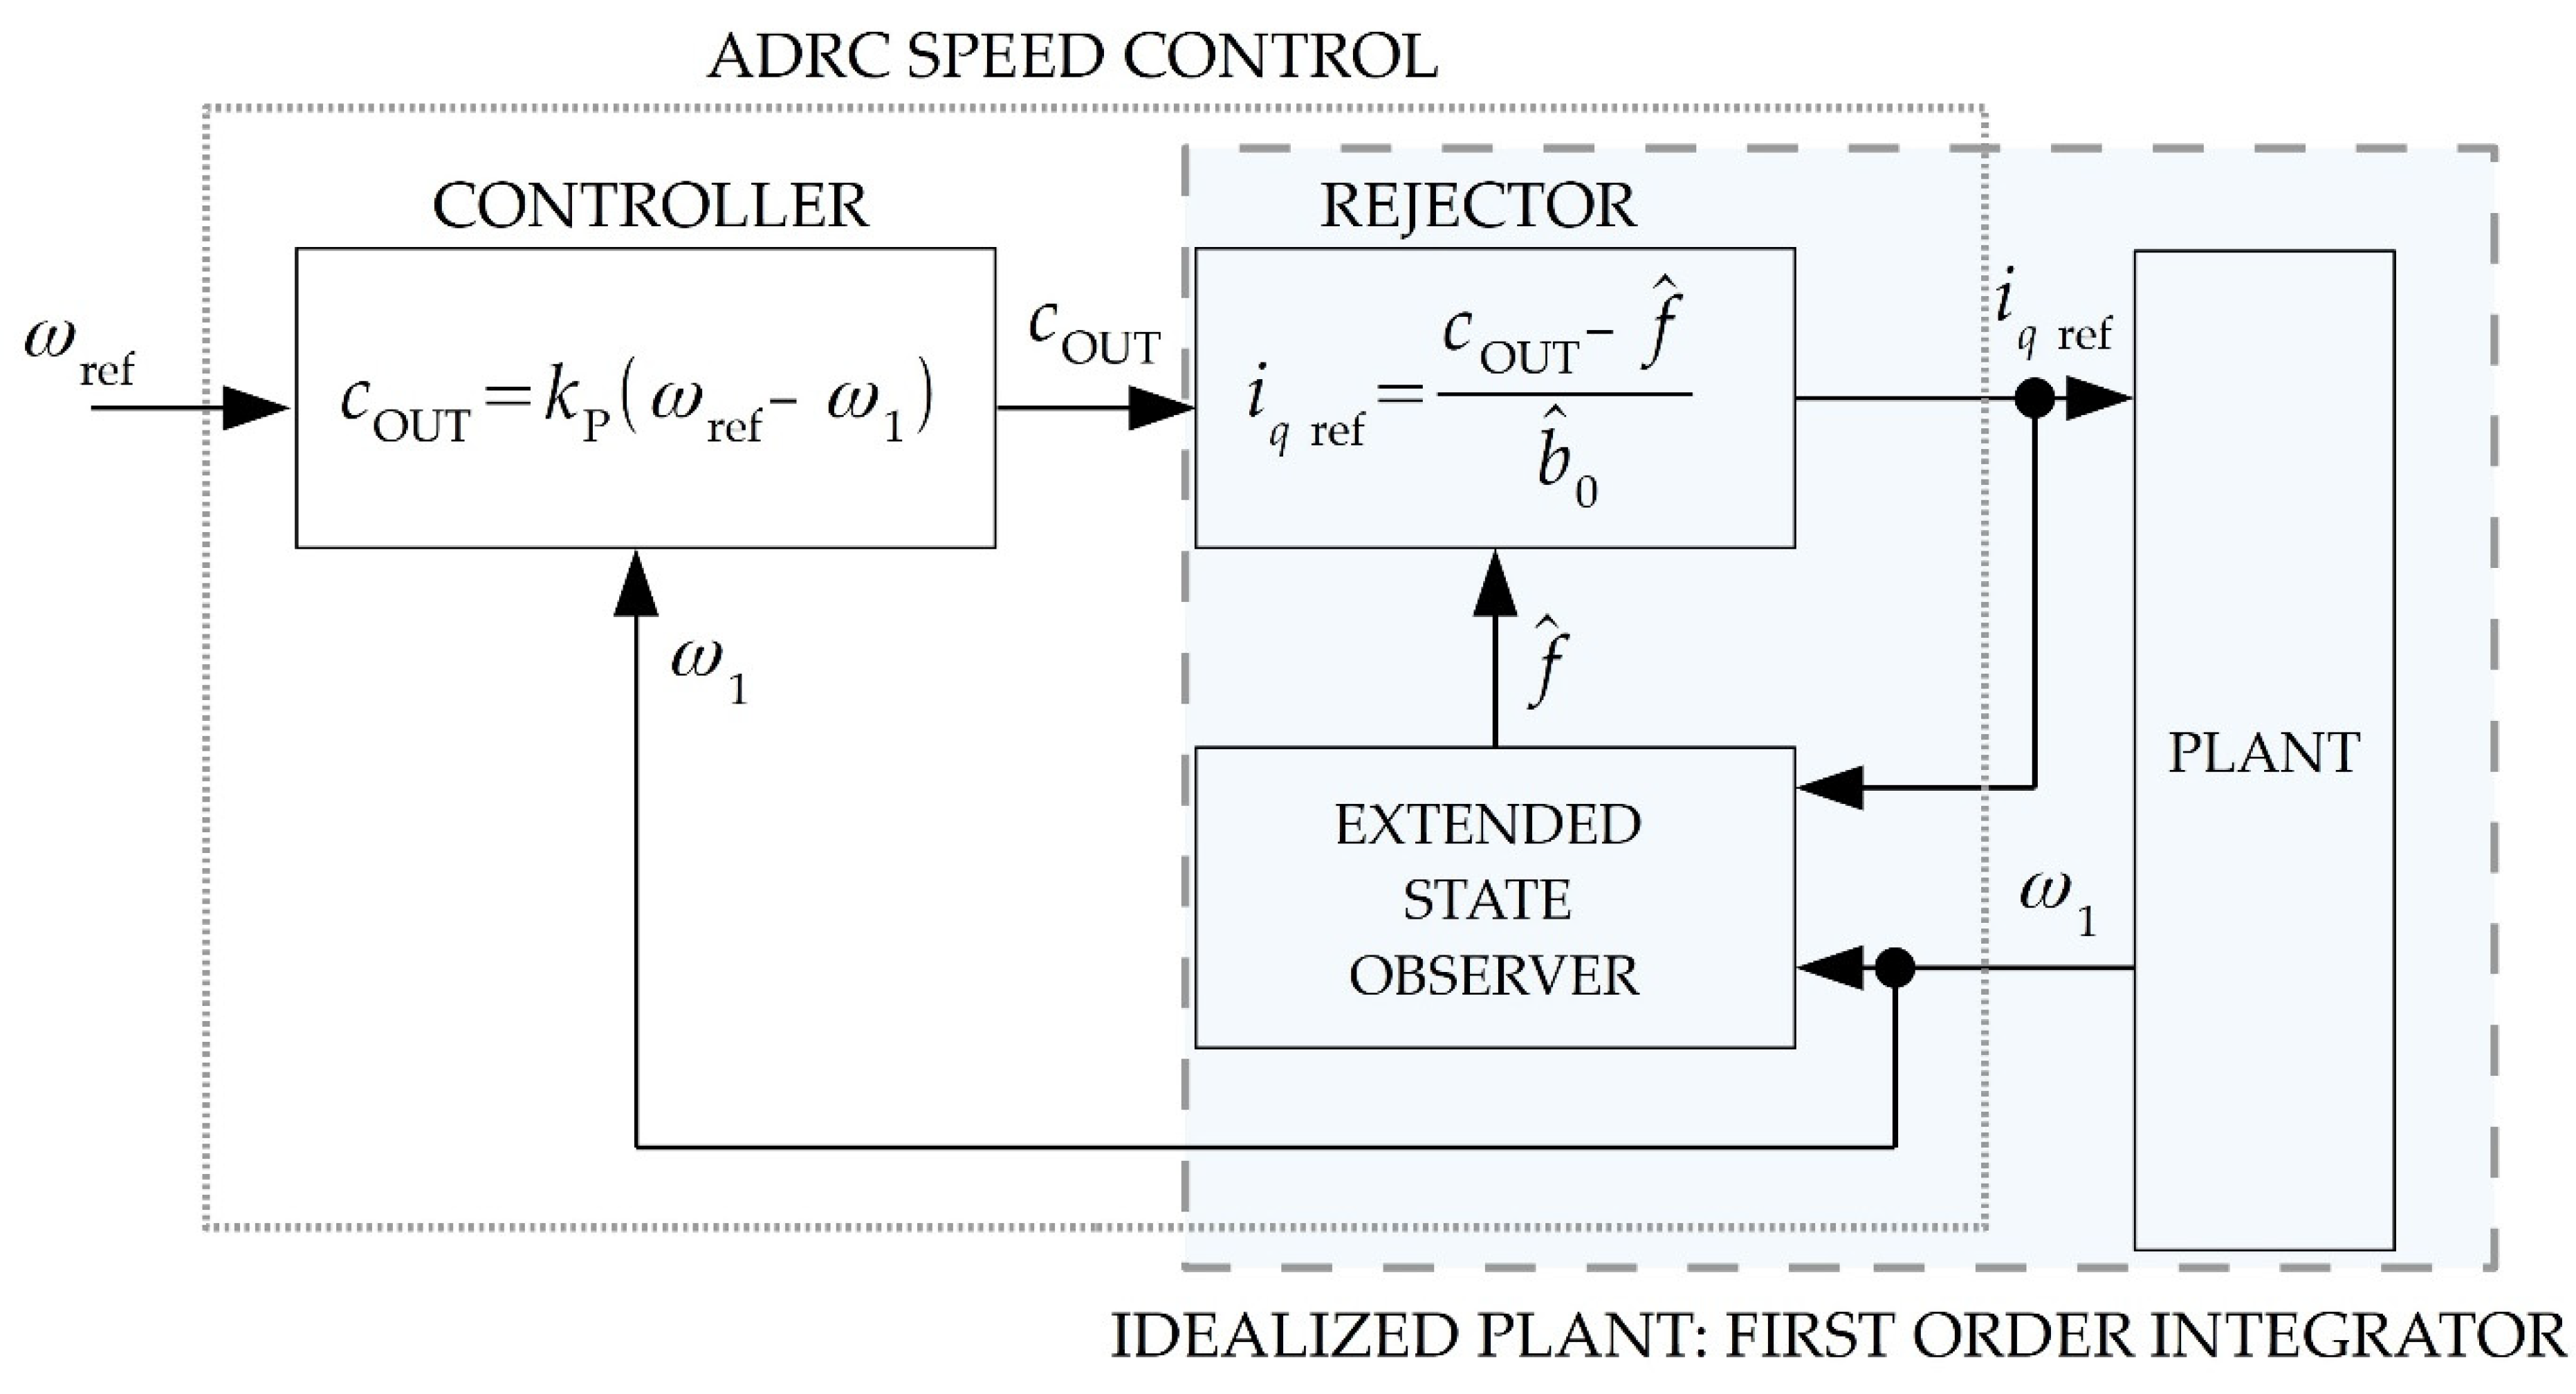
The speed control system is based on the Active Disturbance Rejection Control [42] method, the block diagram is shown in Figure 4. The essential part is the Extended State Observer, which estimates the disturbance f ^ affecting the object in real time, which is then decoupled in the REJECTOR block, so that from the controller's point of view the control object is reduced to a first-order integrator. The ADRC method provides the possibility to shape the bandwidth for the regulator and the disturbance decoupling part independently, with the ESO bandwidth generally exceeding the regulator bandwidth by at least 4 times [43,44]. This causes such a control system to respond quickly to the occurrence of a disturbance, while at the same time making it possible to limit the dynamic response to the setpoint, which is desirable for a vibrating system (the two-mass system described). Thus, the ADRC structure makes it possible to respond efficiently (thanks to an observer with a sufficiently wide bandwidth) to even small values of disturbance moments, a property desirable for unbalance detection.

4. Short-Time Fourier Transform (STFT)

Many proposed methods for diagnosing electrical motor faults, including rotor unbalance or misalignment issues in drive systems, are based on frequency domain analysis using FFT and searching for frequency components characteristic of specific faults [45,46]. The Fourier transform assumes that the analysed information is periodic and stationary. This function is then decomposed into a fixed number of sinusoidal signals with specified frequencies. Unfortunately, in practice, signals recorded from real-world objects often do not meet these key assumptions. This method relies on sinusoidal periodic functions that represent a single frequency, which results in a loss of important temporal information about the occurrence of individual frequency events. Additionally, the amplitude values of the signal in the frequency domain are averaged, which means that short-duration events present in the signal may be invisible in the FFT spectrum. In fault diagnosis, knowing the exact moment of a fault's occurrence is crucial, as it can help determine the cause by analysing other system parameters from the period before the fault occurred. To overcome this limitation, alternative methods are used that perform time-frequency analysis, such as Discrete and Continuous Wavelet Transform (DWT) [47,48], Hilbert-Huang Transform (HHT) [49,50] or Short-Time Fourier Transform (STFT) [51,52]. In this article, the STFT of the reference current signal Iq ref from the Field Oriented Control (FOC) system is proposed as a method for extracting symptoms of rotor unbalance and assessing its degree. The STFT method involves sliding a window of a specified length (usually a power of 2) with a certain step along the signal and analysing its frequency content using the FFT. A key feature of this method is its time-frequency resolution: a larger window provides better frequency resolution but poorer time resolution; conversely, a smaller time window implies better time resolution but worse frequency resolution. This trade-off can be managed by carefully selecting the parameters and type of window function. The STFT computes the Fourier transform of the function x(t) with a symmetric window function with real values w(t), which is shifted in time t along the signal and modulated with frequency ω. The continuous form of STFT can be expressed by the following equations (8) [51,52]:
S T F T C τ , ω = x t w t τ e j ω t d t .
During measurements with a constant sampling frequency, the signal obtained is discrete and therefore STFT can be expressed as (9) [51,52]:
S T F T C τ , ω S T F T D m , k = n = 0 n = N 1 x n w n m H e j 2 π n k N .
where: N represents the number of FFT samples (points), n is the index of the input sample in the time domain, dependent on the length of the window function, x[n] denotes the input signal, w[n] is the window function, m indicates the position of the window function, H signifies the overlap between consecutive windows, and k is the frequency index.
The result of the STFT transformation is often presented in the form of a spectrogram, which is a three-dimensional plot of the spectral density function of the Fourier transform. It is described by the following equation (10):
spectrogram τ , ω = S T F T τ , ω 2 .

5. Laboratory Stand and Research Methodology

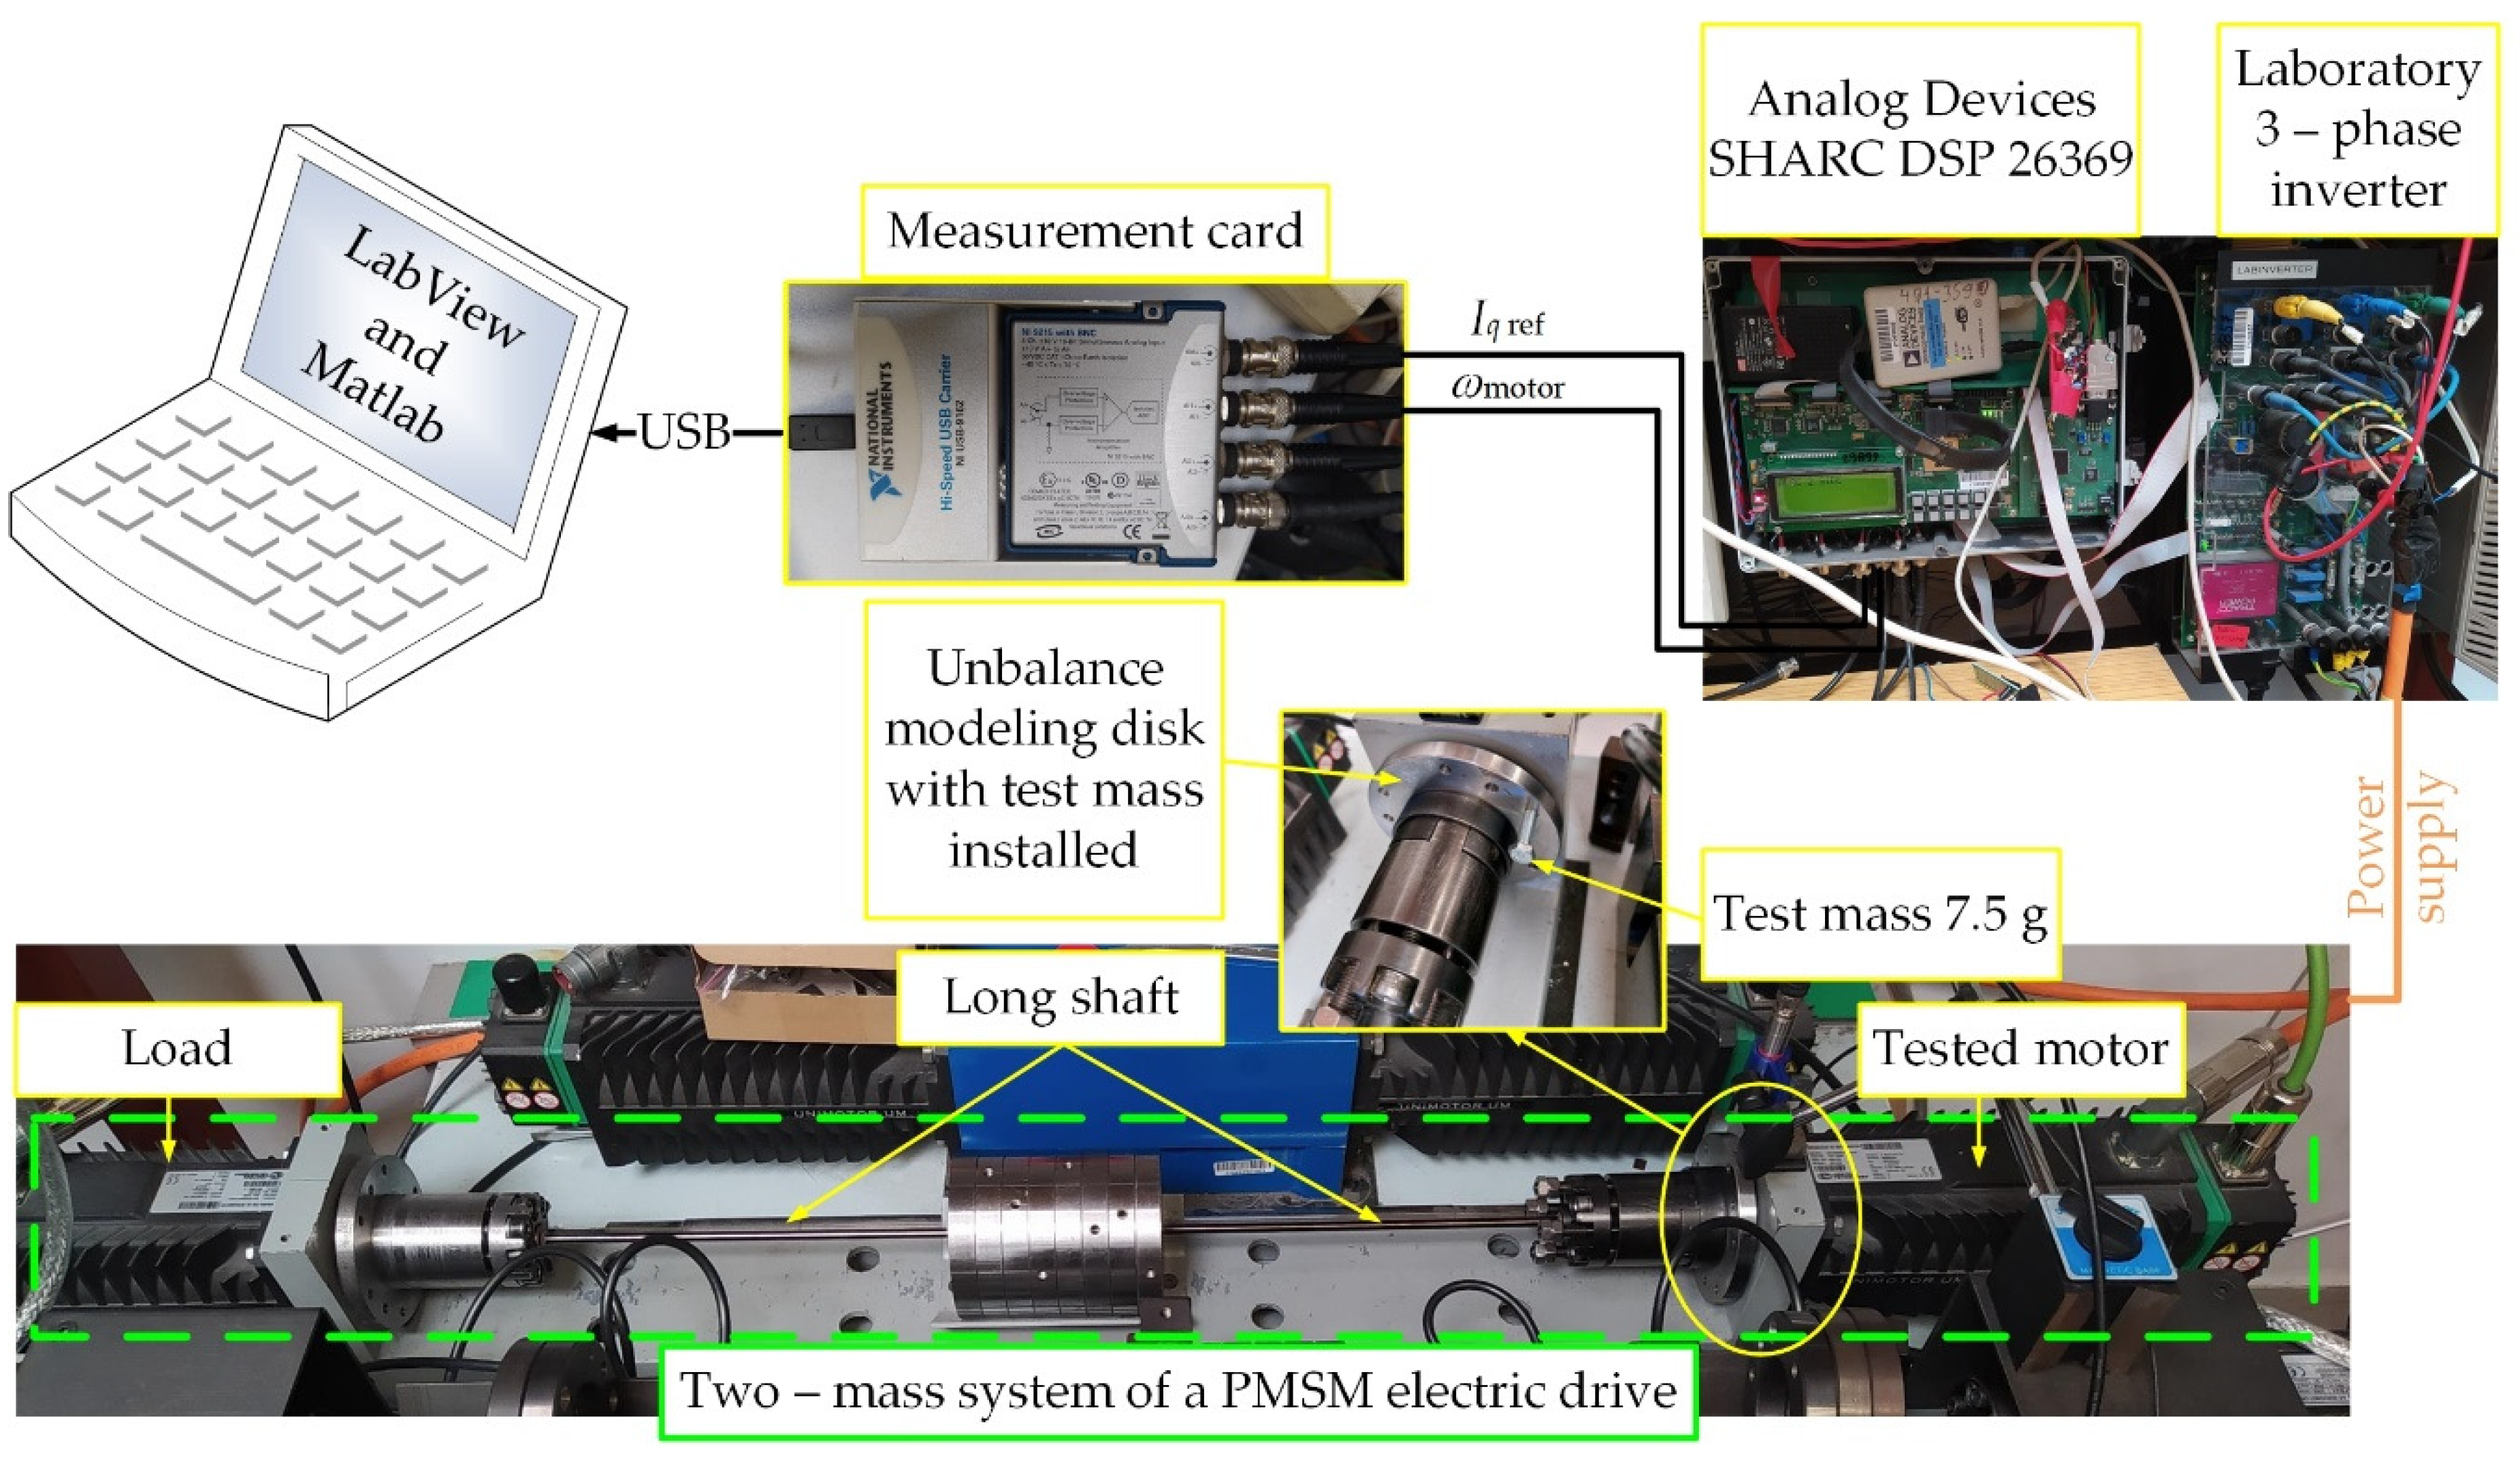
The object of the research was a two-mass drive system consisting of two permanent magnet synchronous motors with three pairs of poles, a rated power of 3 kW and a rotational speed of 3000 rpm. The motors were connected to each other by a long shaft with a diameter of 6 mm. A disc was mounted on the drive side, to which a test mass was mounted at a radius of 42 mm. The drive system was attached to a concrete foundation, the purpose of which was to reduce the vibrations that occur during the operation. During the research, the set current Iq ref and the angular speed of the motor ωmotor were recorded using the NI USB-9162 card with a sampling frequency of 12.8 kS/s. Signals were measured for 10 s. The Iq ref current was generated from the vector control system implemented (Figure 5) in the Analog Devices SHARC DSP 26369 signal processor. The motor was powered by a laboratory 3-phase converter. During laboratory testing, unbalance was modelled with additional test masses: 7.5 g,, 15.9 g, 24 g and 45 g mounted at a radius of 42 mm from the centre of rotation. The drive system was operated unloaded, with a constant angular velocity of 60 rad/s. The study checked the effect of the test mass on the operation of the engine itself (single-mass system) and the two-mass system with PMSMs. The purpose of the laboratory tests was to obtain the diagnostic patterns necessary for the process of training neural networks to detect rotor unbalance and determine its level. These patterns were to be obtained from the control system and not from additional external sensors (measurement systems).

6. Simulation Studies

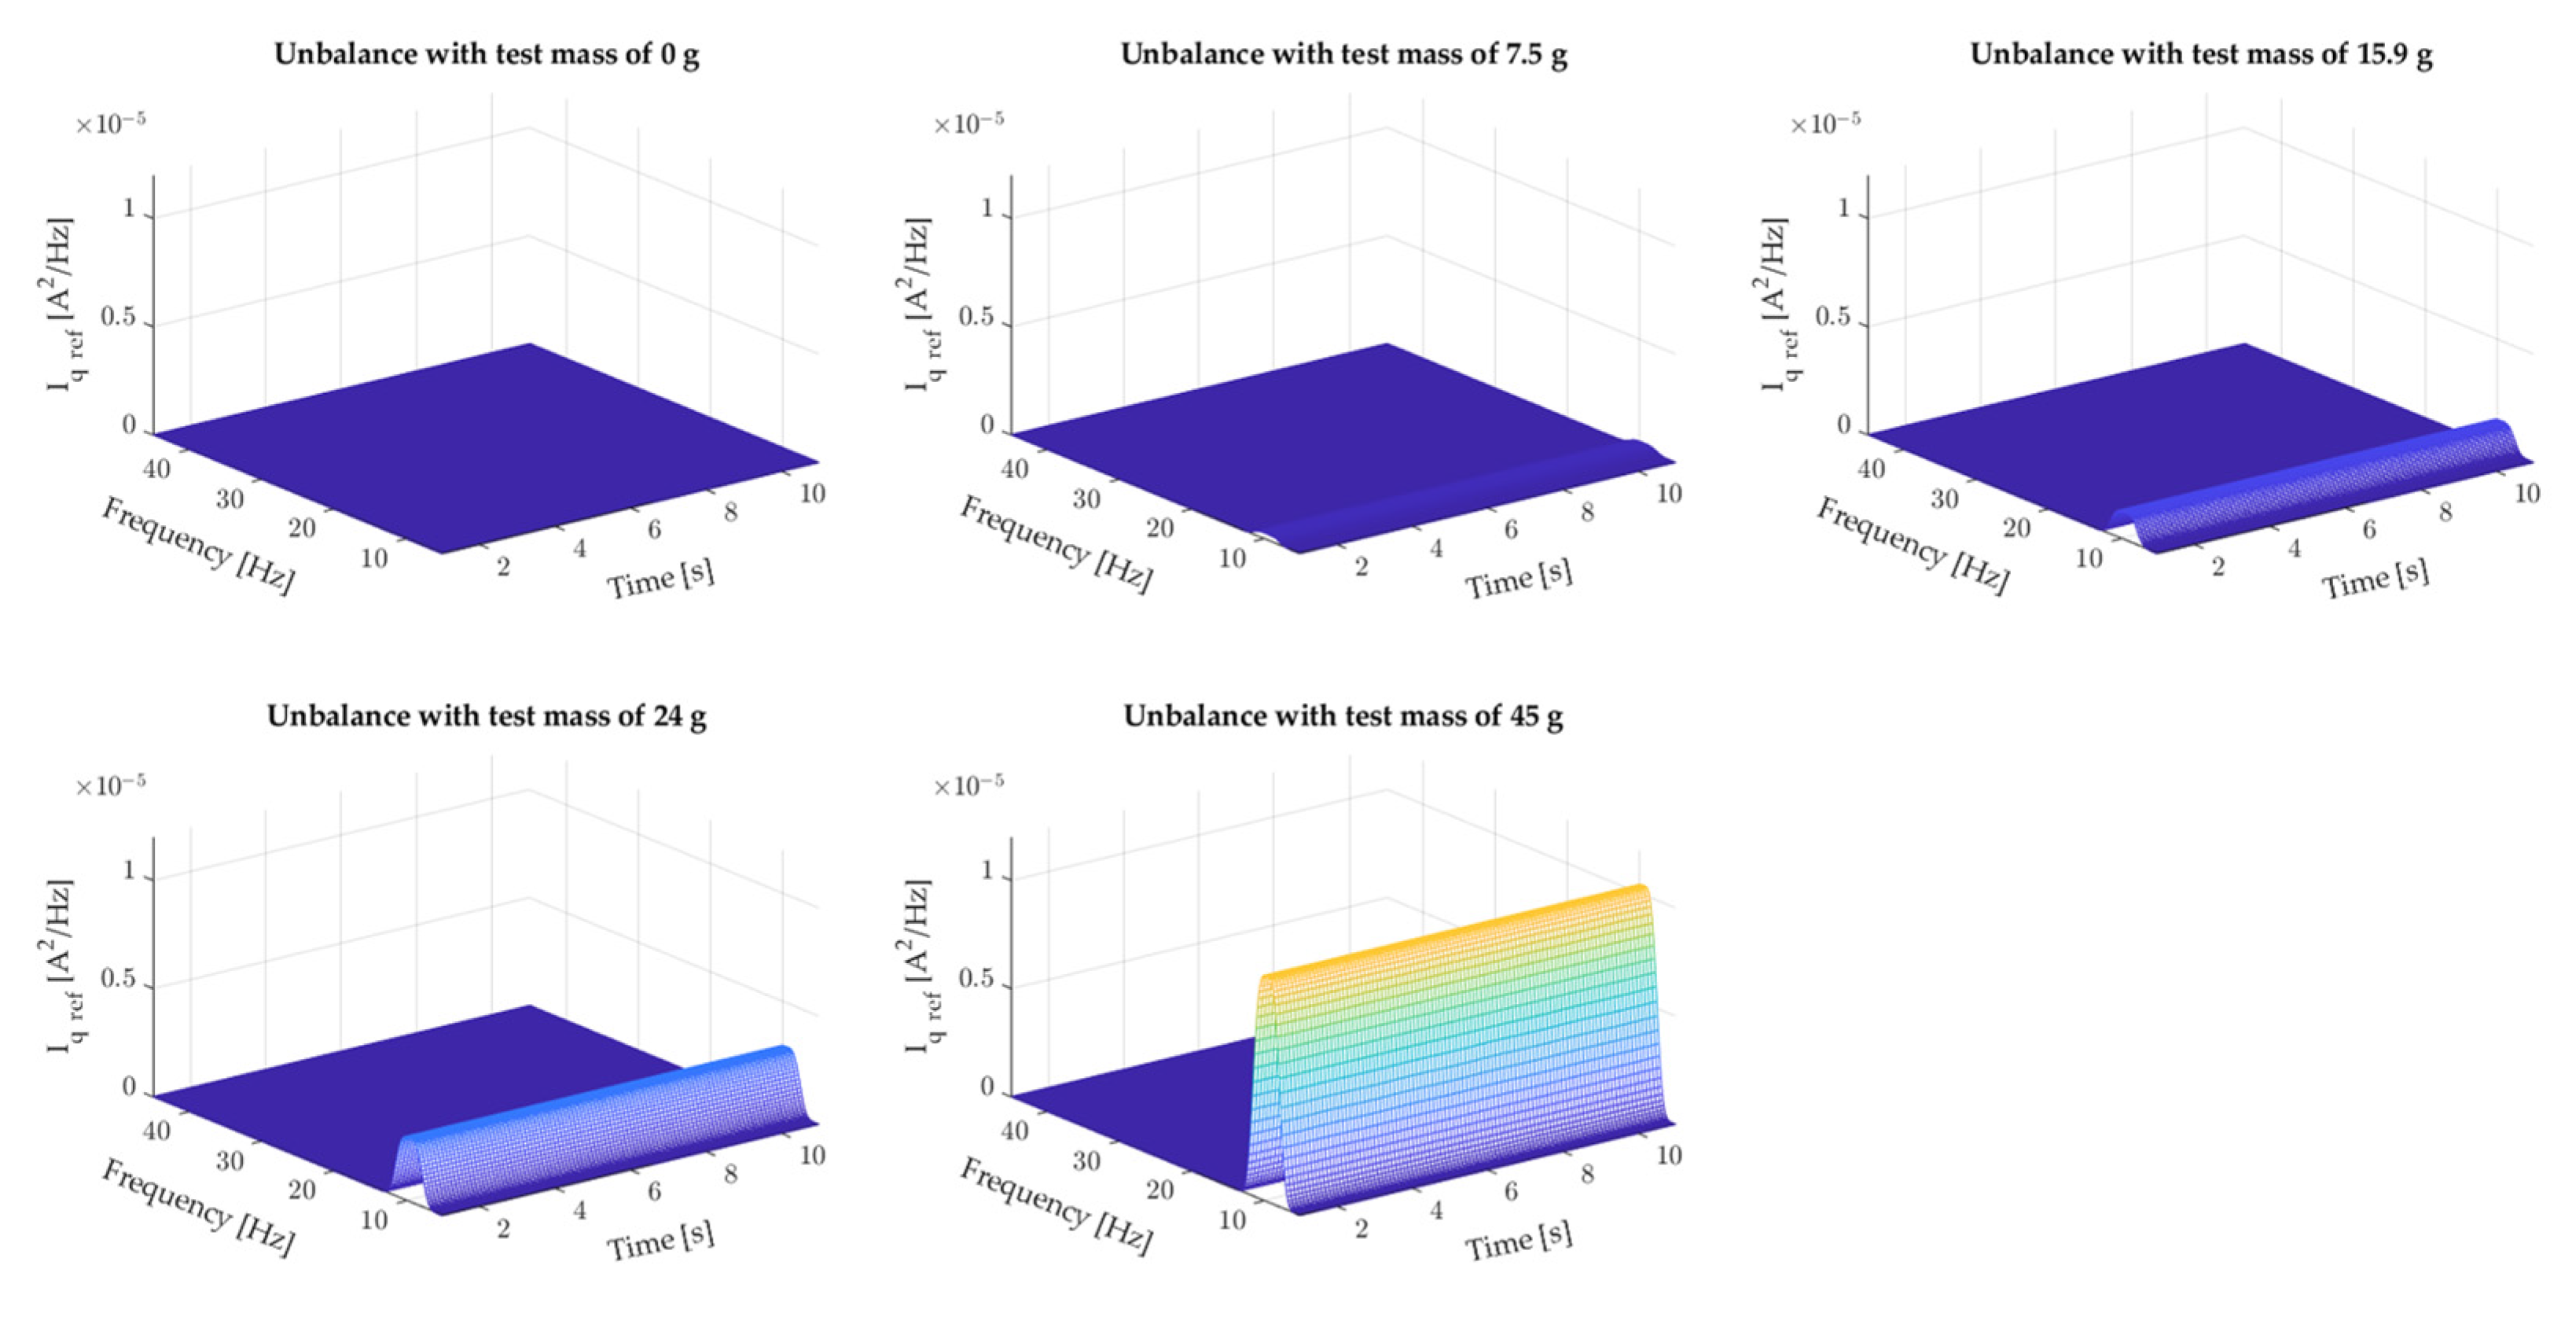
The purpose of the simulation studies was to confirm the diagnostic symptoms indicative of rotor unbalance occurring in the reference current Iq ref. During these studies, the same masses that were also used during laboratory tests were used to model the unbalance. The effect of the test mass on the Iq ref current is shown in Figure 6, from which it can be seen that the additional test mass increases the amplitude of the rotational frequency fr. Apart from the rotational frequency, there are no additional harmonics in the Iq ref current spectrum up to 45 Hz. Moreover, with simulation time, the value of the rotational frequency amplitude does not change. The restriction of the band to 45 Hz is due to the fact that a symptom of rotor unbalance is an increase in rotational frequency amplitude. In the case of the modelled motor, the set speed was about 60 rad/s, which is equivalent to a frequency fr of about 9.6 Hz. The set spectrogram range allows observing up to a fourth multiple of the rotational frequency.

7. Experimental Research

7.1. Single-Mass System

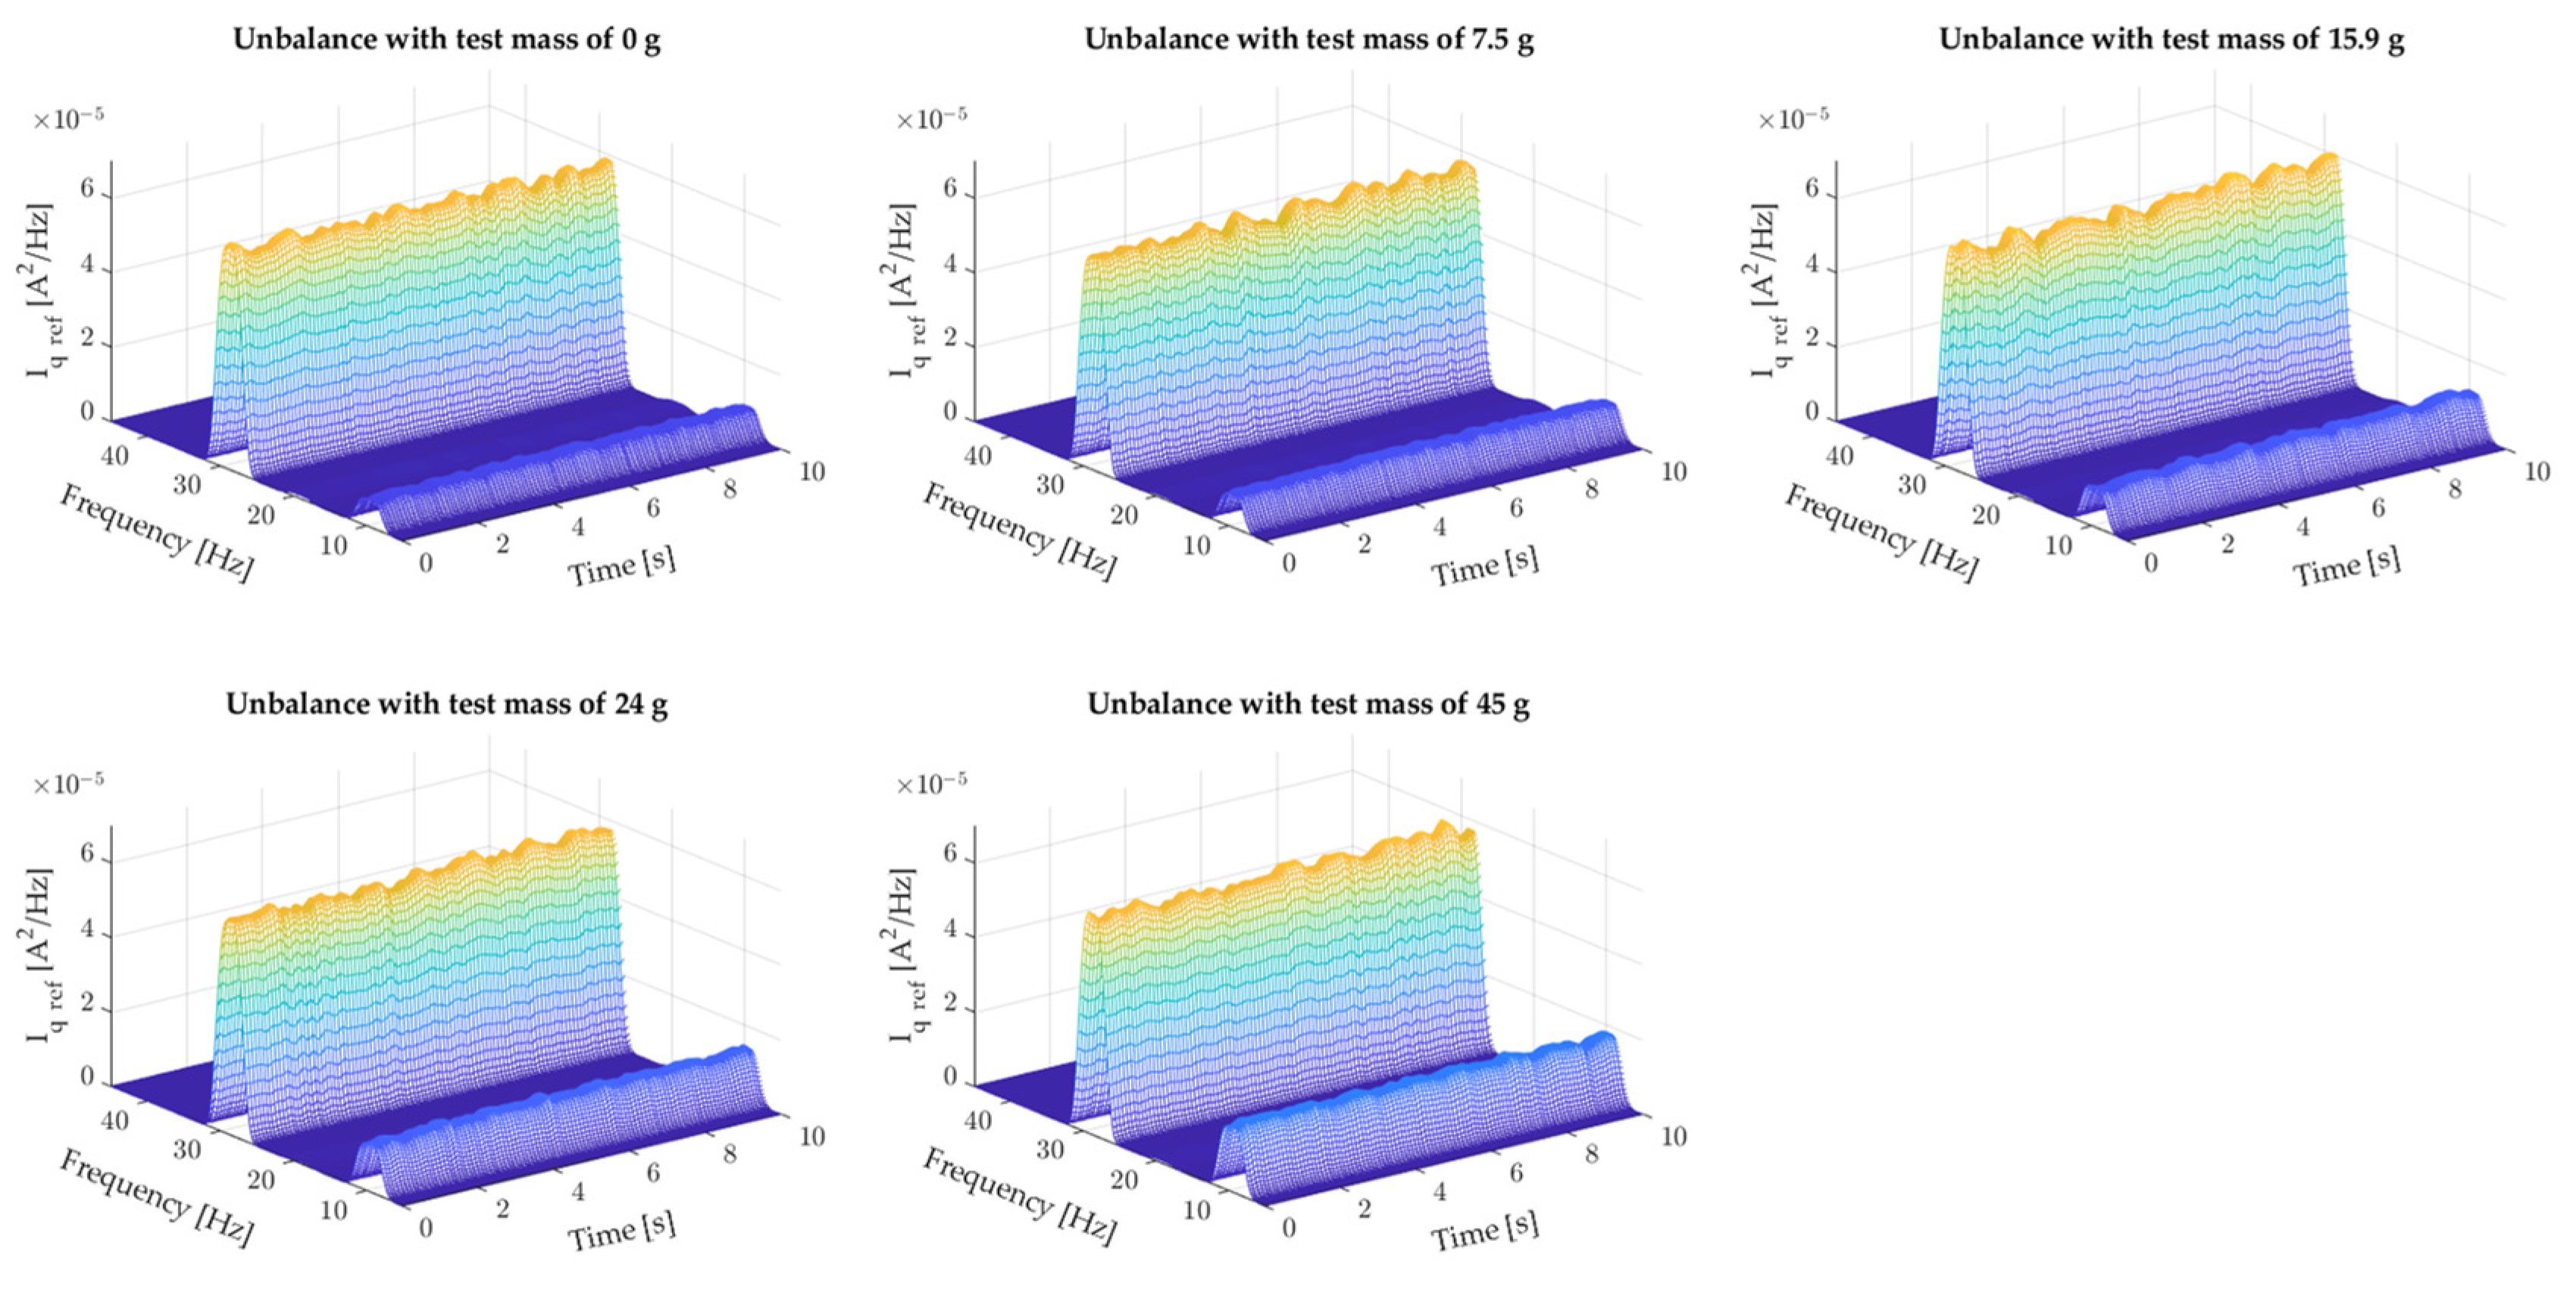
The first experimental tests were performed for a single-mass system. For this purpose, the test motor was not coupled to a load (a second PMSM). During the tests, the effect of the test mass on the Iq ref current in the control system was also checked. A summary of the results obtained are shown in Figure 7.
From the summary shown in Figure 7, it can be seen that in the case of tests performed on a real motor, in addition to the visible changes in the amplitude of the rotational frequency fr, the current spectrogram Iq ref also includes a 3fr component. Increasing the test mass causes only an increase in the amplitude of the fr frequency, the value of which assumes an approximately constant value during operation. Increasing the unbalance level does not change the amplitude of the 3fr frequency, which assumes an approximately constant value of about 60μA2/Hz with slight oscillations.

7.2. Two-Mass System

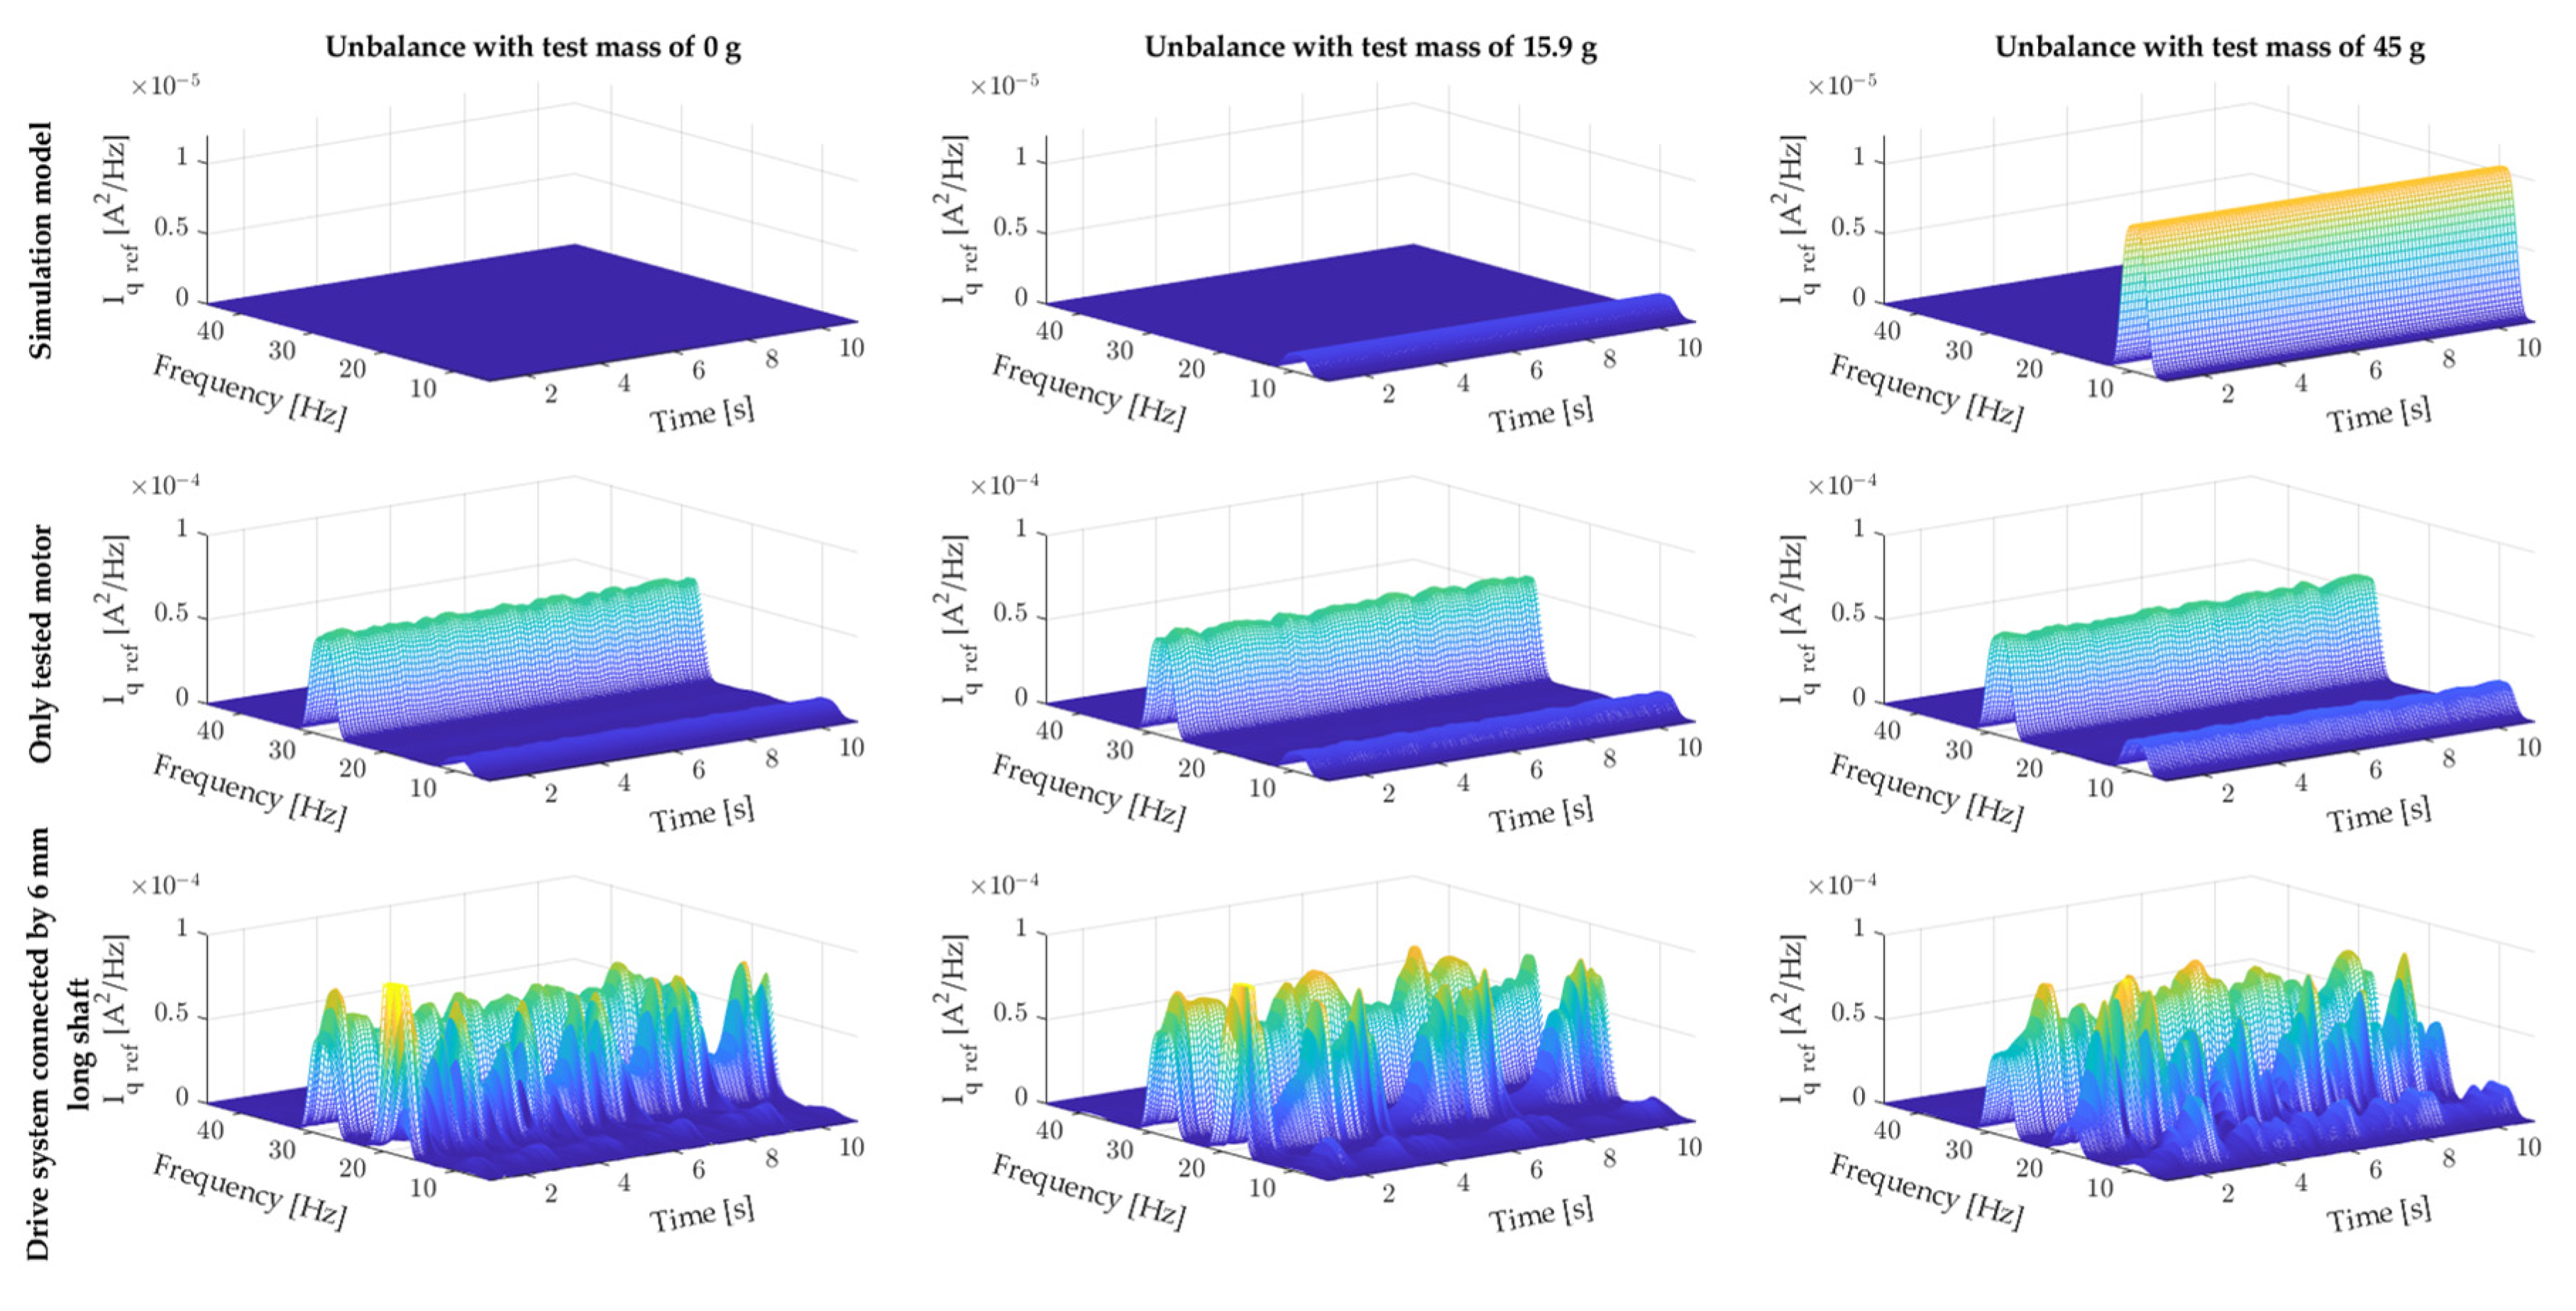
The final stage of the experimental study was to check the effect of the mounted test mass on the reference current Iq ref of the two-mass system. Figure 8 summarises the spectrograms of this current from the vector control system for different values of the test mass. Figure 8 compares the results obtained from the simulation model with those obtained experimentally when modelling the unbalance of the motor itself (single-mass system) and the two-mass system consisting of two PMSMs. The analysis of the figure showed that the simulation model can be used for a preliminary analysis of diagnostic symptoms generated by a given failure (in this case, rotor unbalance). Experimental verification of the simulation model made it apparent that in the spectrogram, in addition to the fr component indicating unbalance, an additional 3fr component appears, approximately of constant amplitude. Coupling the test motor with a long, thin shaft (two-mass system) to a second PMSM clearly disturbs the control system. In the spectrogram, in addition to the fr and 3fr components, whose amplitudes take on an oscillatory character with high variability, a 2fr component appears, which indicates that the two machines are not properly coupled (misalignment). In addition, a detailed visual inspection of the bench showed a slight bend in the shaft during operation of the tested two-mass system. It can be assumed that the object under study is a two-mass system with a strongly nonlinear character that we often encounter in real-world conditions. An attempt to detect unbalance based on the analysis of the rotational frequency fr and its subsequent multiples is difficult due to the oscillatory nature of their amplitude changes during steady-state operation, which can be seen in Figure 8, therefore, the following part of the article presents an approach based on the use of artificial neural networks for the detection and classification of rotor unbalance in a two-mass system.

8. Application of Neural Networks for the Detection and Classification

8.1. Input Data Analysis

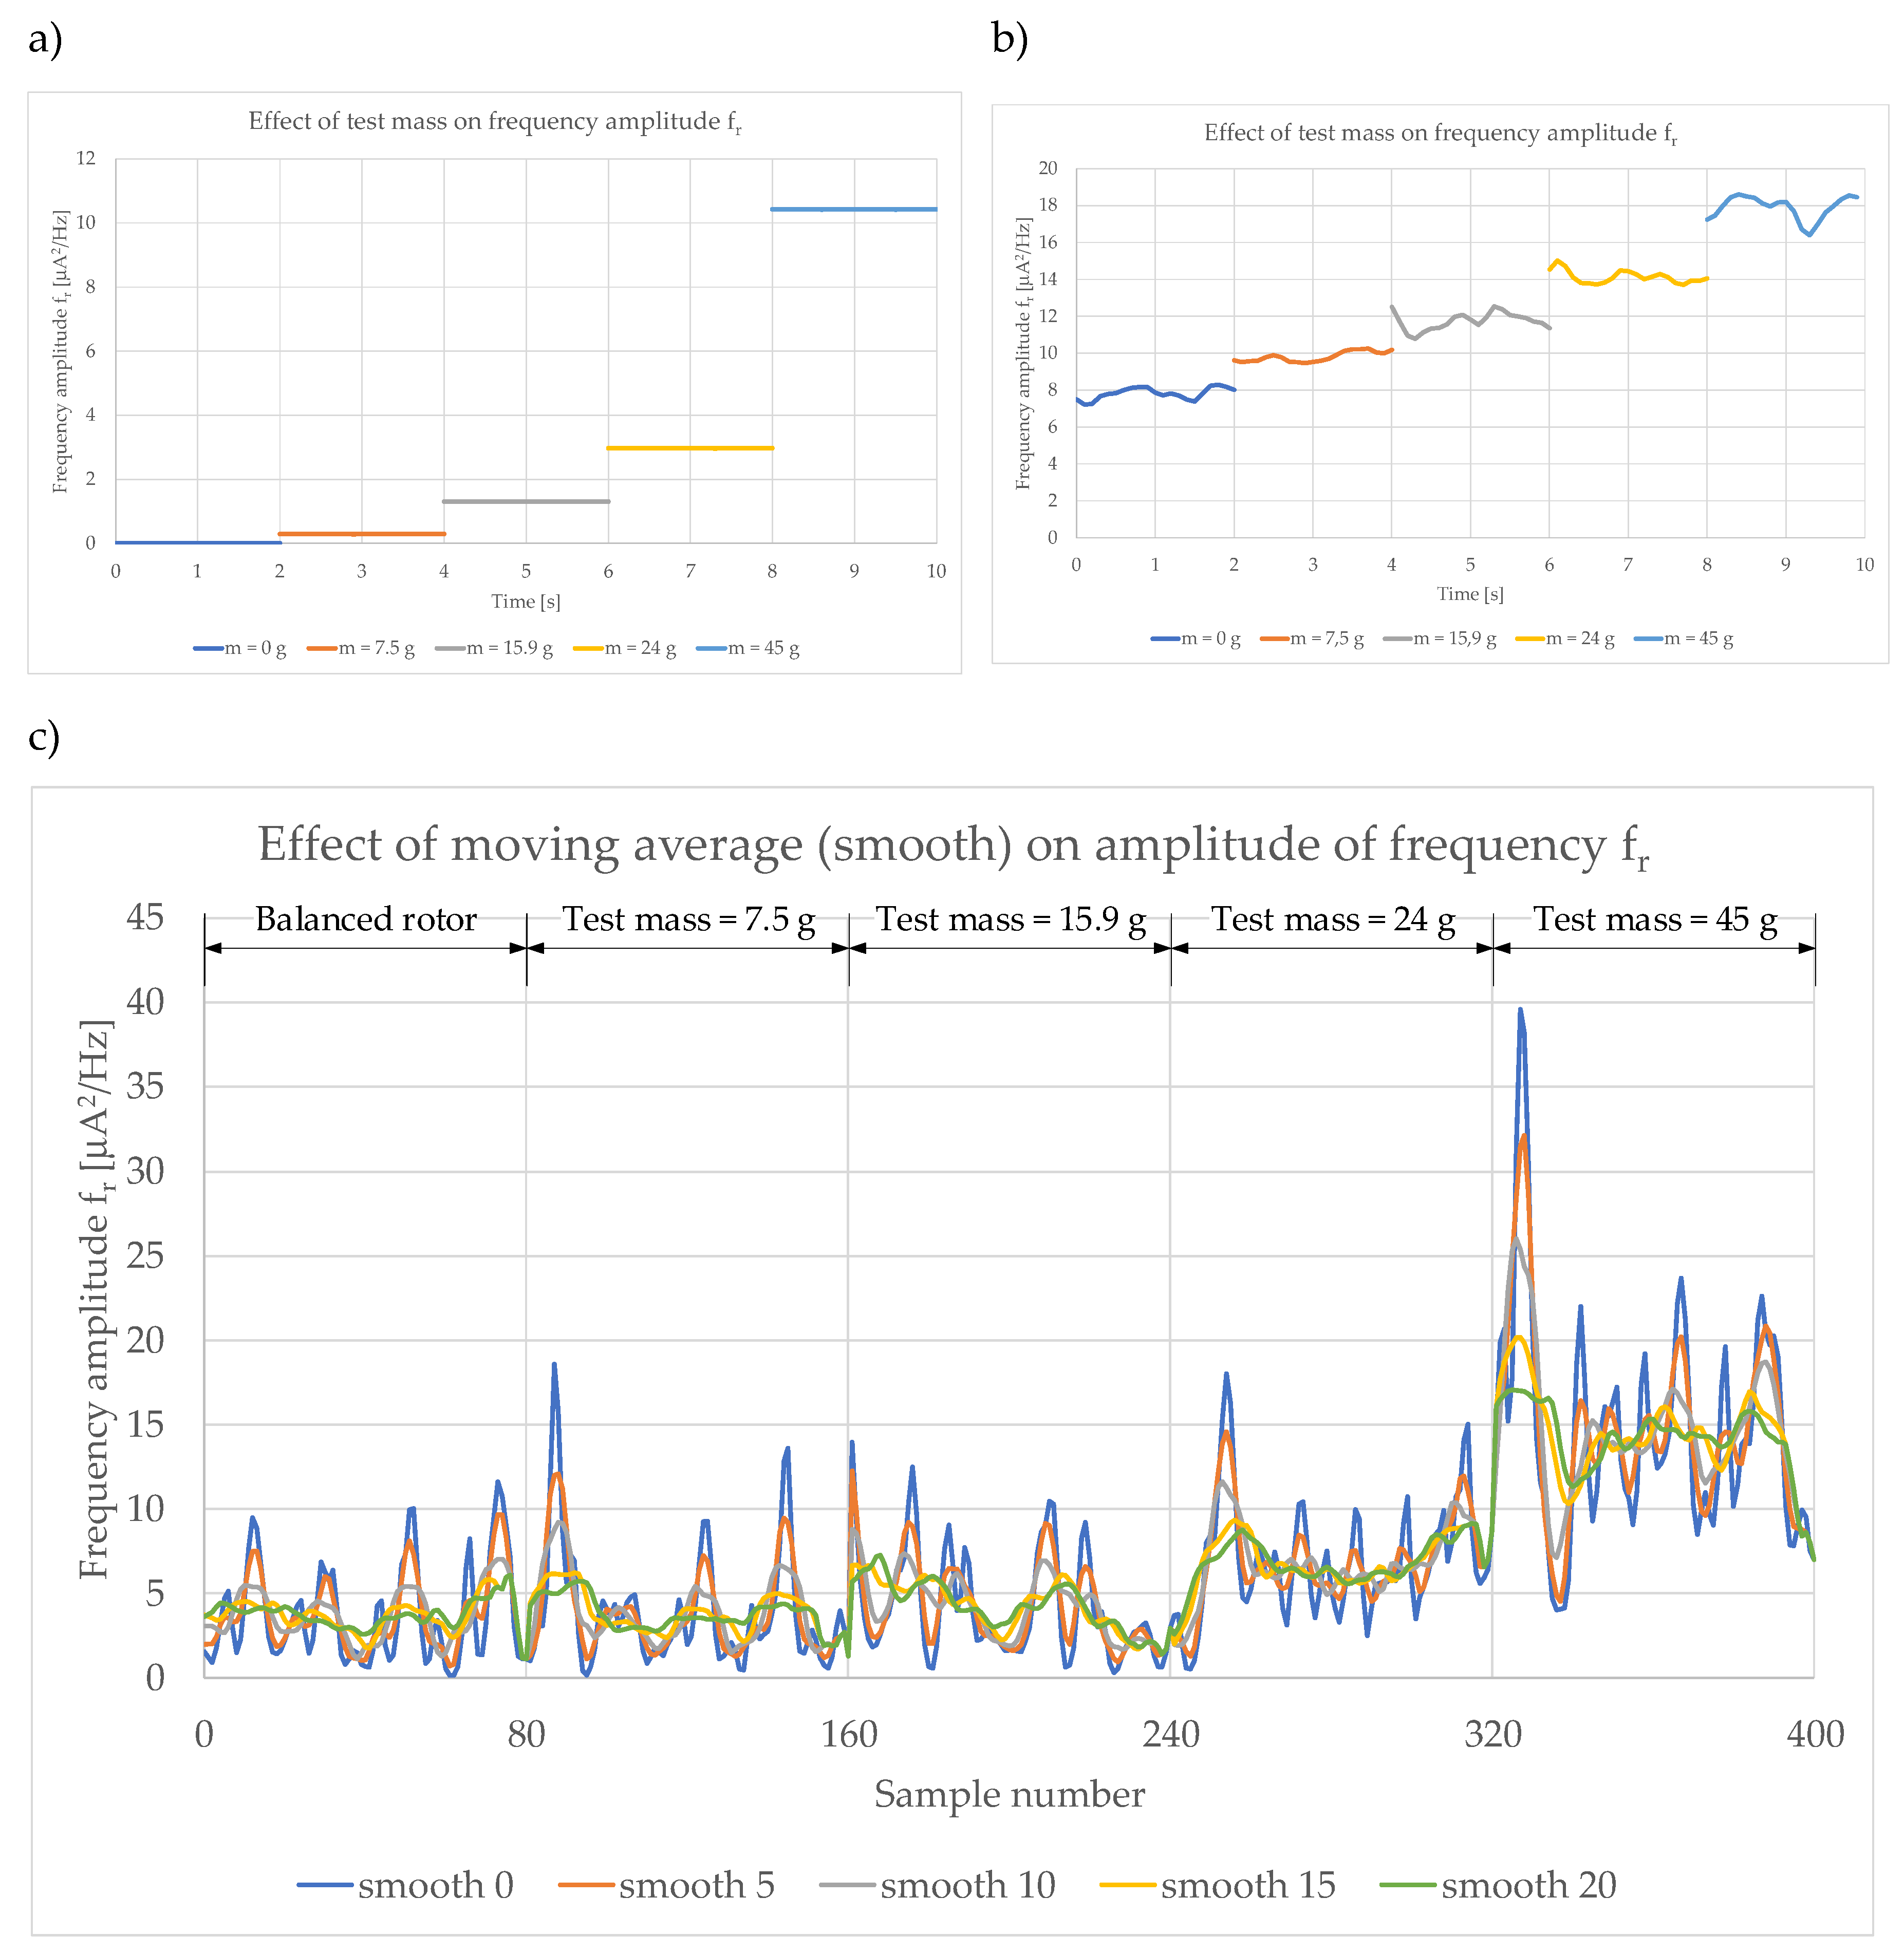
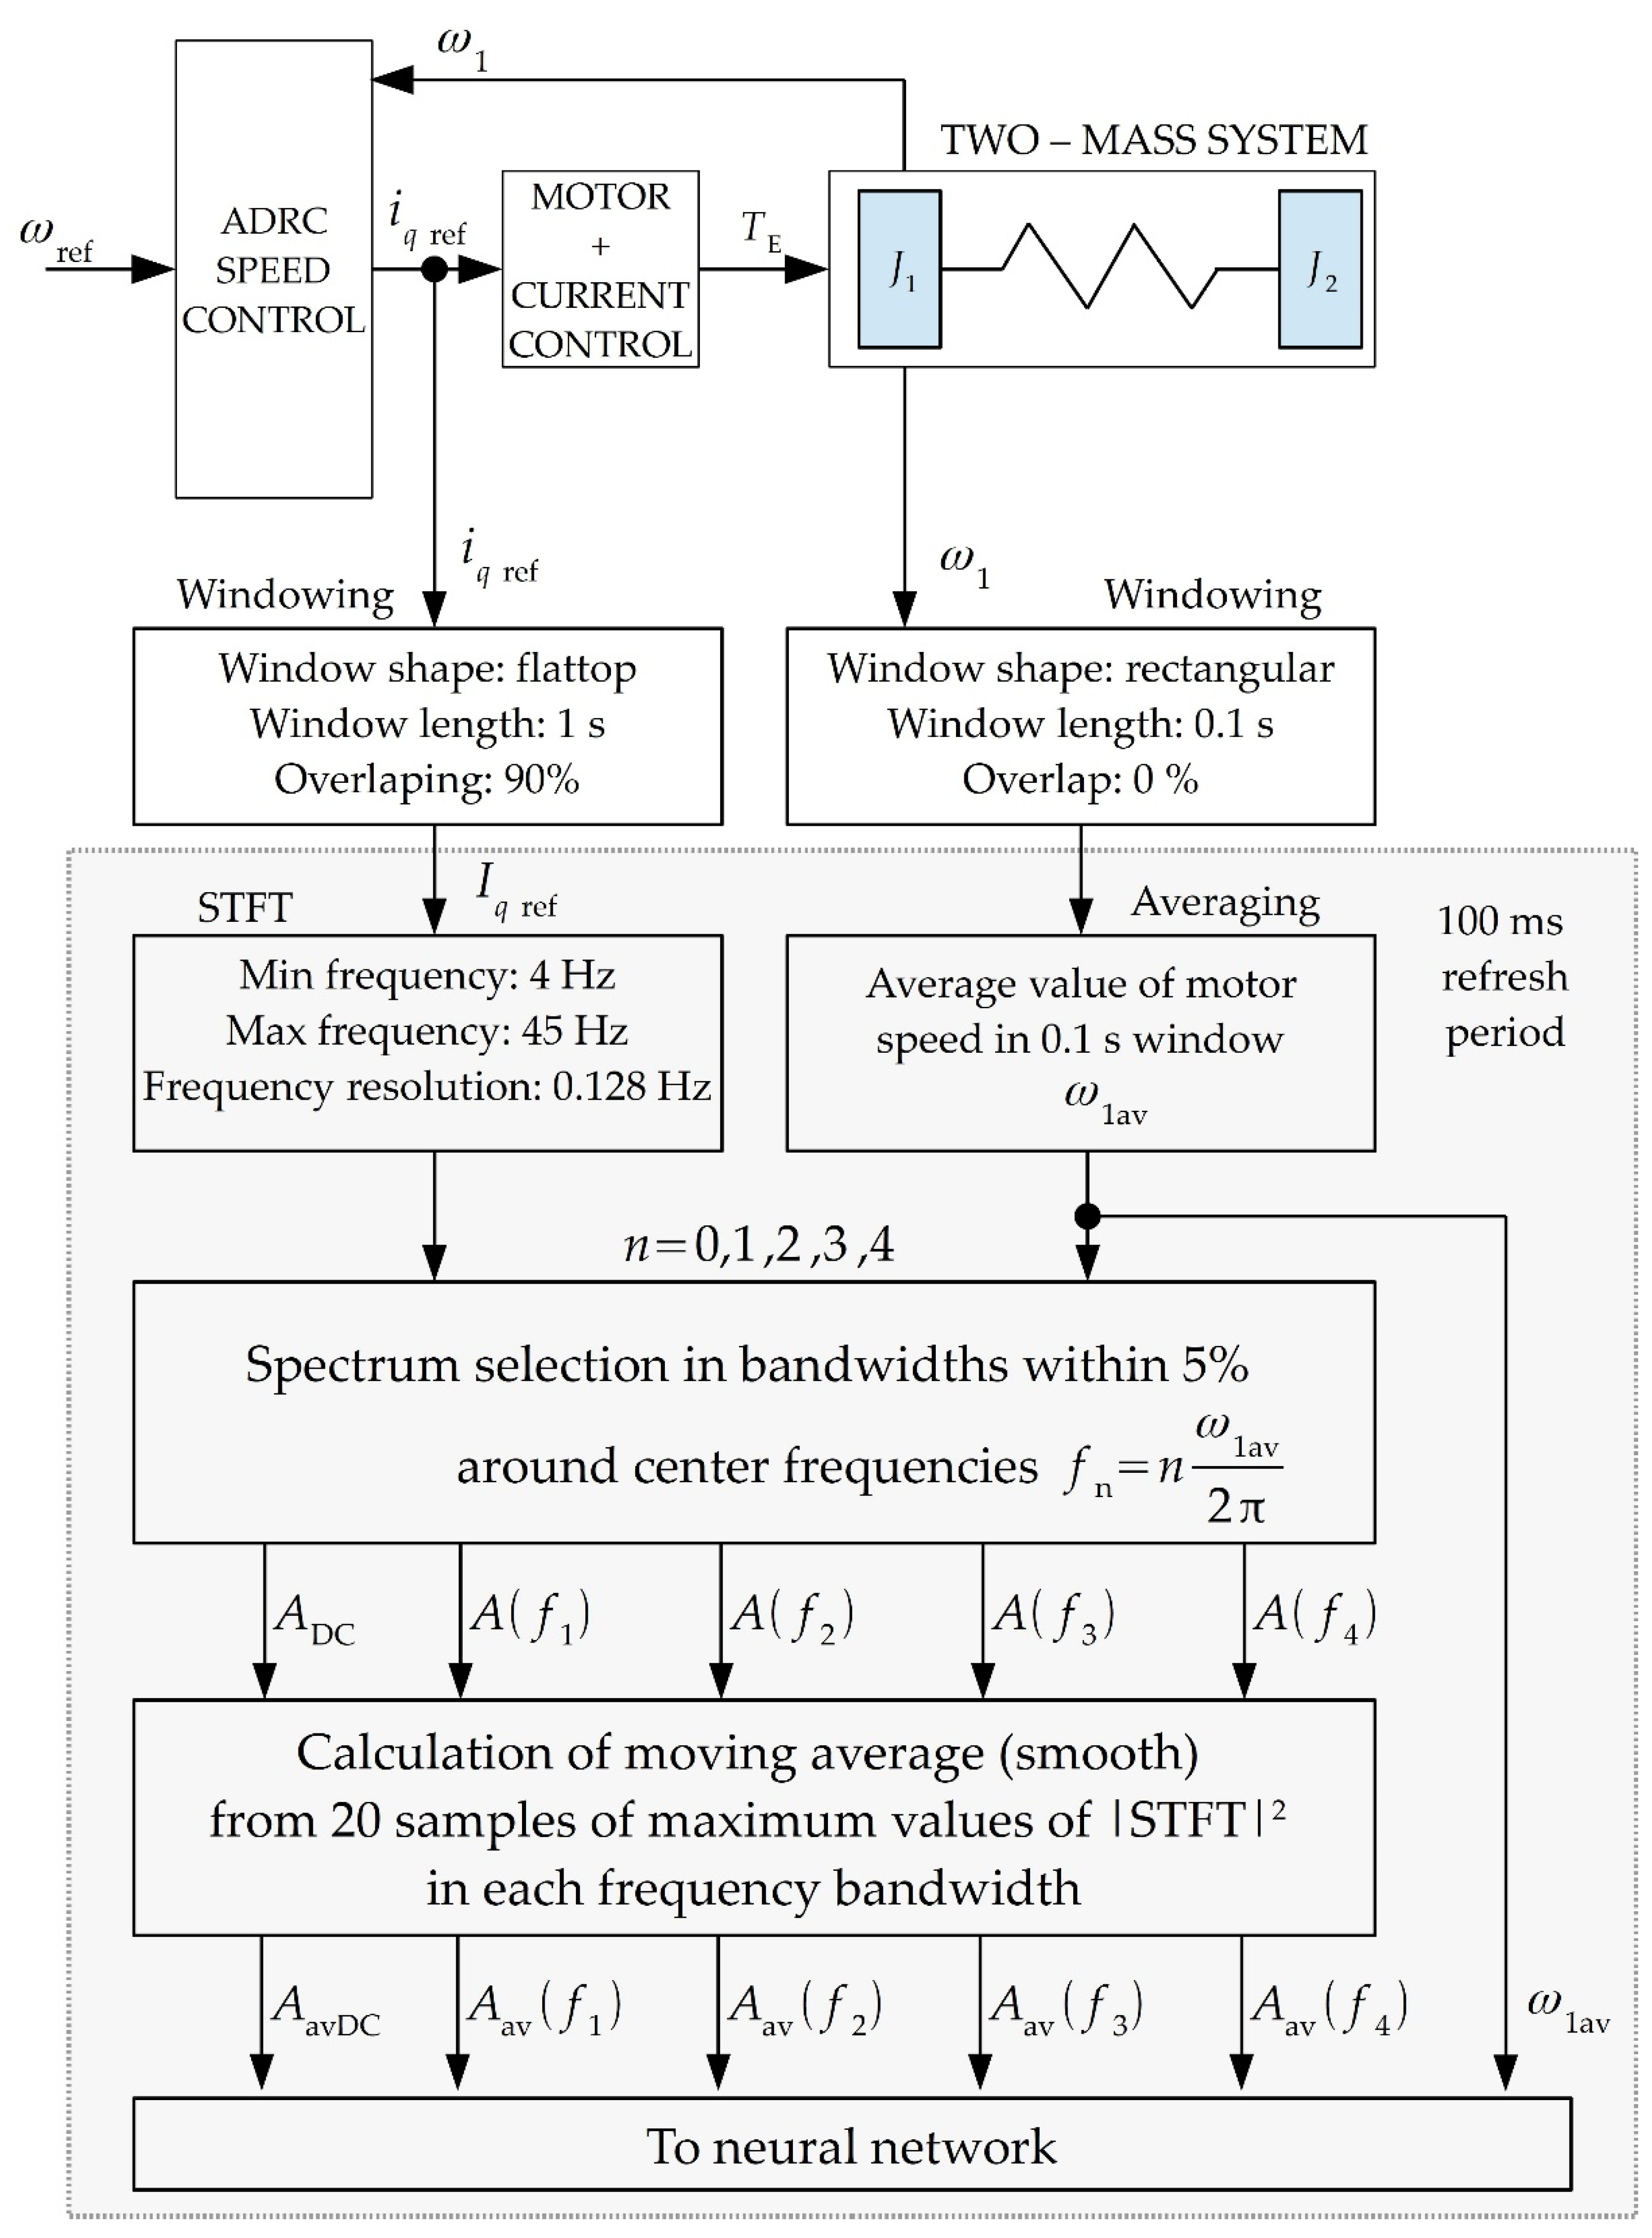
Before designing a neural network, it is necessary to select the signals that will be given to its inputs. A good diagnostic symptom indicating unbalance is the amplitude of the rotational frequency. The summaries presented in Section 6 and Section 7 showed that increasing the mass of unbalance causes an increase in the amplitude of fr frequency. Figure 9 summarises the change in the amplitude of the rotational frequency with increasing the value of the test mass observed during simulation and experimental tests for both single-mass and two-mass systems. It can be seen from the summary shown in Figure 9 that the fr frequency amplitude is a good symptom of rotor unbalance, as shown by both simulation studies (Figure 9a) and experimental studies for the single-mass system (Figure 9b). In the cases discussed, the changes are so pronounced that the use of classical thresholding is sufficient to detect unbalance and to determine its level. In both cases, a neural network is not necessary. The differences in amplitude levels are due to the simplifications used in the simulation model. Unfortunately, in the case of a real dual-mass system, the situation is no longer so simple. The amplitude of the rotational frequency is not constant, its value is oscillatory (Figure 9c, blue line), which makes its analysis even more difficult. Additionally, an increase in amplitude is observed only from the unbalance caused by a test mass of 24g. As shown in Figure 9c, the use of a smoothing filter (smooth) reduces the oscillations of the analysed symptom. Preparing a moving average of 20 samples (green in Figure 9c - smooth 20) smooths the oscillations, which should benefit the performance of the designed neural networks. The data preparation process for the artificial neural network is shown in Figure 10.

8.2. Methodology of Testing Neural Networks

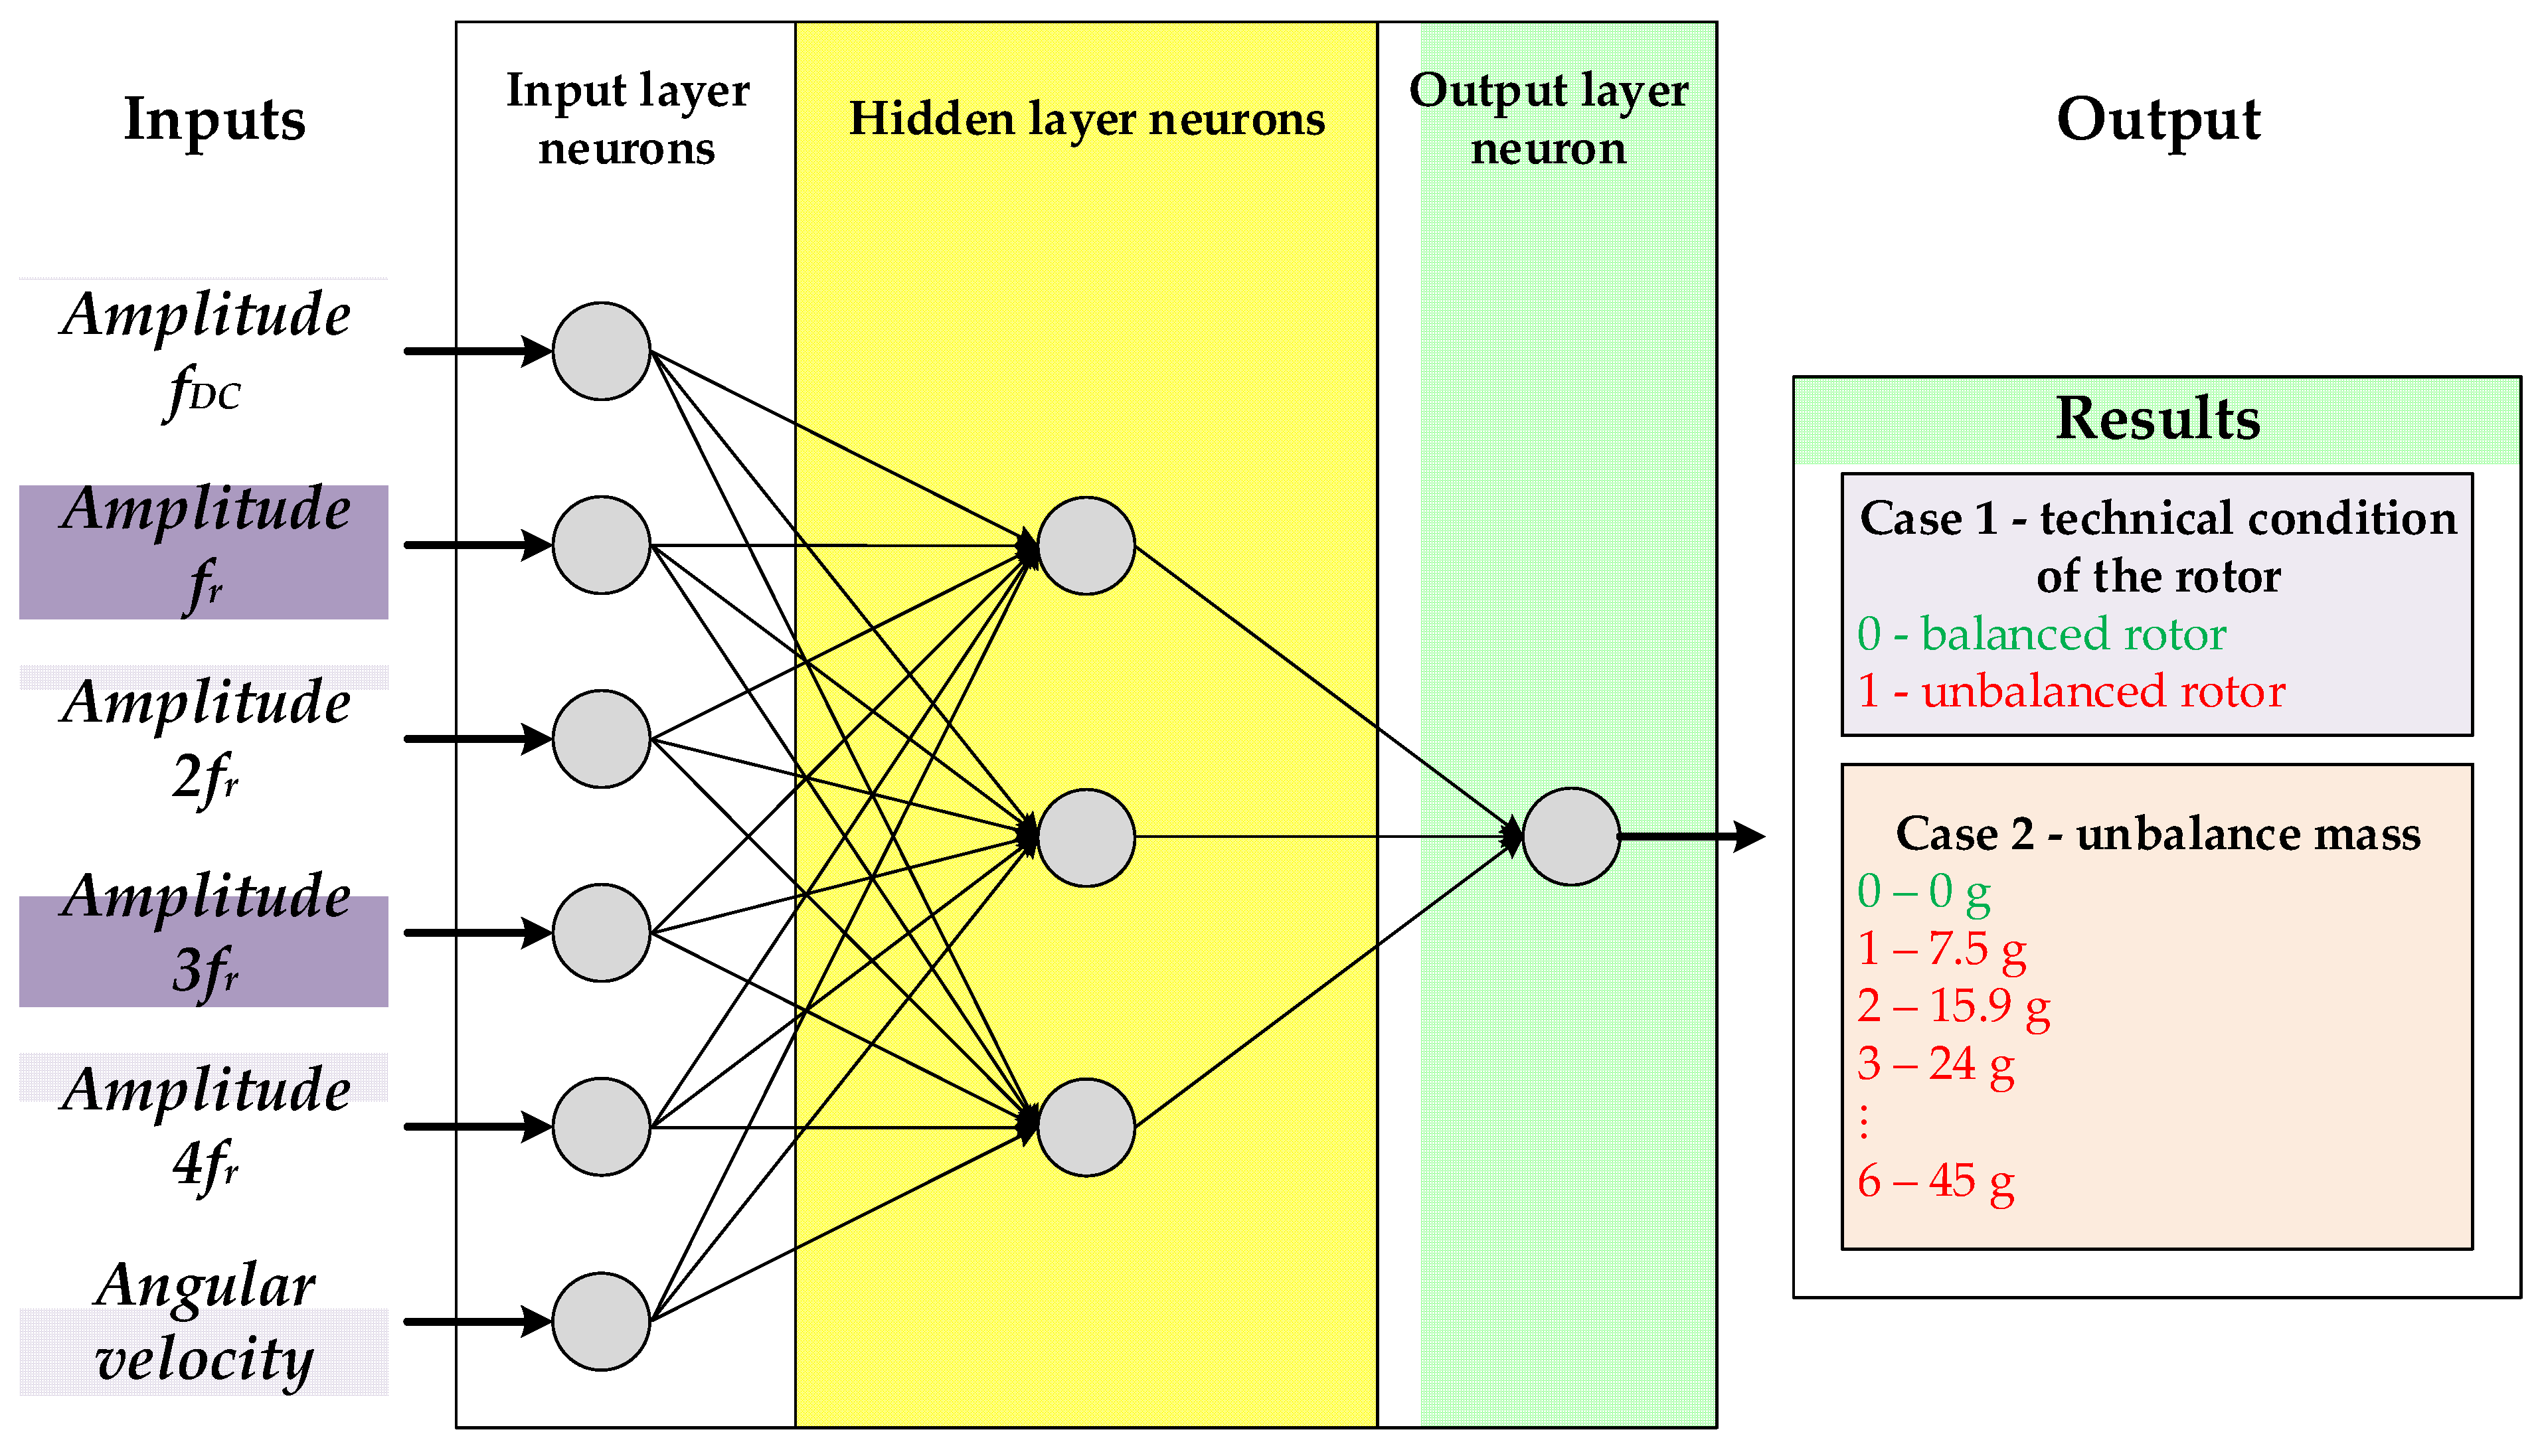
A unidirectional Multi Layer Perceptron (MLP) neural network was used to detect the unbalance of the two-mass system and classify its level. MLP networks are characterised by a layered structure (Figure 11). Neurons in a layer are not connected to each other, moreover, the hidden layers and the output layer have no direct connection to external signals. In the input and output layers, the neuron activation functions are linear, while the hidden layer uses hyperbolic tangent-type functions. The neuron output signal of the MLP network is described by the relation [53,54] (11, 12):
y i = f i = 1 N w i j x i t + w 0 j .
f u = t g h β u
where: f is the example activation function, wij is the weighting coefficients, xi is the input signals, β is the coefficient that corrects the shape of the activation function, u is the argument of the activation function and w0j is the bias value.
The weight connection coefficients were selected using the Levenberg-Marquardt algorithm.
Neural detector tests were performed in the Matlab environment. The input signals were the maximum values in the +/-5% width of the kfr frequency calculated from the current rotational speed. Additionally, as shown in Figure 9c, the amplitudes of the rotational frequency and its multiples were smooth filtered from 20 consecutive samples. In addition, the input vector was expanded to include the value of the rotational speed and the DC component to account for varying operating conditions. The input data was normalised to the range <0, 1>. Training and testing vectors consisted of 200 samples. The testing set did not contain the information used in the training process. The parameters regarding the method of obtaining the input data and the neural network training process are listed in Table 1.
In the study, two different neural detectors were tested. The task of the first was to detect unbalance, while the second was to determine its level. During the research, neural networks with one and two hidden layers were tested. To average the results of the effectiveness of the tested MLP network structures for detecting unbalance and determining its level, 20 successive training and testing series were performed. The results obtained for the change of neurons in the hidden layers are summarized graphically. Comparative tests for networks with one hidden layer were performed by changing the number of neurons in this layer from 3 to 10. The presented summaries were made on the basis of 160 series of training and testing of networks with one hidden layer. Comparative studies of networks with two hidden layers were also carried out by varying from 3 to 10 the number of neurons in these layers. The reports presented were made based on 1280 training and testing series of networks with two hidden layers.

8.3. Rotor Unbalance Detection

The task of the first neural networks was to detect rotor unbalance. Both networks with one hidden layer (Figure 12a) and with two (Figure 12b) were tested. In the case of networks with one hidden layer, the number of neurons in the hidden layer was changed from 3 to 10. The tests showed that from structures containing 6 neurons in the hidden layer, a decrease in the average efficiency of rotor unbalance detection is observed. In addition, from about 5 neurons in the hidden layer, large deviations of the minimum and maximum detection efficiency from the average value of 20 training and testing series are observed. This may be indicative of the increasing adaptation to the training vector. Figure 12a also shows a clear increase in average detection efficiency as the number of samples subjected to smooth filtering increases. Based on the study, it can be concluded that a neural network with a structure 6-4-1 can be used to detect rotor unbalance of a two-mass system, with an average efficiency of about 96% using a moving average of 20 samples.
The use of two hidden layers only slightly improves the performance of the rotor unbalance detection of the two-mass system. The tests showed that there should be 3 neurons in the second hidden layer. Increasing the number of neurons in this layer causes a decrease in the effectiveness of the structures tested. In the case of a structure with two hidden layers, a neural network with a 6-5-3-1 structure is recommended to detect the unbalanced tested of the tested two-mass system tested, whose average detection efficiency was about 98%.

8.4. Classifying the Rotor Unbalance Level of a Two-Mass System

The purpose of subsequent analyses of the various neural network structures was to determine the level of rotor unbalance of the two-mass system. For this purpose, structures with one hidden layer (Figure 13a) and two hidden layers (Figure 13b) were again analysed.
Classifying the level of unbalance is a more difficult task. Neural networks with one hidden layer with 3 or 4 neurons were able to achieve a minimum efficiency of 20%, which was equivalent to learning only one level of unbalance. The summary shown in Figure 13 shows that in this case, too, it is necessary to use a filter that smooths the input data from 15 or 20 samples. Furthermore, the statement shows that for determining the rotor unbalance level of the two-mass system, it is recommended to use a neural network with a 6 – 8 – 1 structure, whose average efficiency of classifying the unbalance level using smooth 20 filtering was about 93%.
For networks with two hidden layers, studies have shown that the use of 5 neurons in the second hidden layer is recommended. The use of 5 neurons in the first hidden layer makes it possible to achieve an average efficiency of classification of the rotor unbalance level of the two-mass system of about 93% using a smooth 20. The use of at least 9 neurons in the first hidden layer results in a minimum efficiency of 20%, which is equivalent to setting the output of such a network at one level.
The high efficiency of the detection of rotor unbalance of the two-mass system and classification of its level based on Iq ref current analysis is achieved with the use of a smoothing filter from at least 15 samples.

9. Summary

This article explores the detection of rotor unbalance in a two-mass system with a PMSM using the STFT applied to the reference current signal from the speed controller. The significance of monitoring and diagnosing faults in drive systems has increased with their widespread use in industrial sectors, particularly for safety-critical applications. Modern drive systems, which include motors, power supply systems, frequency converters, and mechanical components, are prone to various failures that can alter the operation. Diagnosing these faults is essential to prevent efficiency losses, reduced accuracy, increased energy consumption, and unplanned downtime. Effective diagnostic methods include analysing current, voltage, temperature, vibrations, and noise. In particular, the STFT method offers advantages over traditional Fourier transform techniques by providing better time-frequency resolution, which is crucial for identifying and diagnosing faults in dynamic conditions. This study uses the reference current signal and investigates how the varying test masses impact unbalance levels in both single-mass and two-mass systems. It also evaluates different neural network architectures to optimise fault detection. The noninvasive approach of using existing control signals (coming directly from the control system), rather than additional sensors, reduces costs and simplifies the diagnostic process while enhancing system reliability.
The use of neural networks makes it possible to automate the process of detecting the rotor unbalance of a two-mass system, as well as determining its level. The simple MLP network structures used (networks with one and two hidden layers) were characterised by a high unbalance detection efficiency of over 95% and an unbalance level determination efficiency of approximately 93%. A prerequisite for such high efficiency is the use of a smoothing filter with at least 15 samples. The approach proposed in this paper for detecting rotor unbalance of a two-mass system can be implemented in a PMSM control system, which will be analysed by the authors in the future.

Author Contributions

Conceptualization, P.E., B.W. and T.P.; methodology, P.E. and B.W.; software, P.E. and B.W.; validation, P.E., B.W. and T.P.; formal analysis, P.E., B.W. and T.P.; investigation, P.E. and B.W.; resources, P.E., B.W. and T.P.; data curation, P.E. and B.W.; writing—original draft preparation, P.E. and B.W.; writing—review and editing, P.E., B.W. and T.P.; visualization, P.E. and B.W.; supervision, T.P.; project administration, P.E., B.W. and T.P.; funding acquisition, P.E. All authors have read and agreed to the published version of the manuscript.

Funding

This research received no external funding. Publication is exempt from APC.

Data Availability Statement

Data are contained within the article.

Conflicts of Interest

The authors declare no conflicts of interest.

References

  1. Lang, W.; Hu, Y.; Gong, C.; Zhang, X.; Xu, H.; Deng, J. Artificial Intelligence-Based Technique for Fault Detection and Diagnosis of EV Motors: A Review. IEEE Trans. Transp. Electrification 2022, 8, 384–406. [Google Scholar] [CrossRef]
  2. Choi, S.; Haque, M.S.; Tarek, M.T.B.; Mulpuri, V.; Duan, Y.; Das, S.; Garg, V.; Ionel, D.M.; Masrur, M.A.; Mirafzal, B.; et al. Fault Diagnosis Techniques for Permanent Magnet AC Machine and Drives—A Review of Current State of the Art. IEEE Trans. Transp. Electrification 2018, 4, 444–463. [Google Scholar] [CrossRef]
  3. Niu, G.; Dong, X.; Chen, Y. Motor Fault Diagnostics Based on Current Signatures: A Review. IEEE Trans. Instrum. Meas. 2023, 72, 1–19. [Google Scholar] [CrossRef]
  4. Orlowska-Kowalska, T.; Wolkiewicz, M.; Pietrzak, P.; Skowron, M.; Ewert, P.; Tarchala, G.; Krzysztofiak, M.; Kowalski, C.T. Fault Diagnosis and Fault-Tolerant Control of PMSM Drives–State of the Art and Future Challenges. IEEE Access 2022, 10, 59979–60024. [Google Scholar] [CrossRef]
  5. ISO 17359:2011, Condition monitoring and diagnostics of machines — General guidelines, Available online: https://www.iso.org/standard/39912.html (accessed on 22 July 2024).
  6. Dunn, S. Condition Monitoring in the 21st Century. Available online: https://www.plant-maintenance.com/articles/ConMon21stCentury.shtml (accessed on 22 July 2024).
  7. Piechocki, M.; Pajchrowski, T.; Kraft, M.; Wolkiewicz, M.; Ewert, P. Unraveling Induction Motor State through Thermal Imaging and Edge Processing: A Step towards Explainable Fault Diagnosis. Eksploat. Niezawodn. – Maint. Reliab. 2023, 25. [Google Scholar] [CrossRef]
  8. Calderon-Uribe, U.; Lizarraga-Morales, R.A.; Guryev, I.V. Unbalance Detection in Induction Motors through Vibration Signals Using Texture Features. Appl. Sci. 2023, 13, 6137. [Google Scholar] [CrossRef]
  9. Belkhadir, A.; Pusca, R.; Belkhayat, D.; Romary, R.; Zidani, Y. Analytical Modeling, Analysis and Diagnosis of External Rotor PMSM with Stator Winding Unbalance Fault. Energies 2023, 16, 3198. [Google Scholar] [CrossRef]
  10. Park, C.H.; Lee, J.; Ahn, G.; Youn, M.; Youn, B.D. Fault Detection of PMSM under Non-Stationary Conditions Based on Wavelet Transformation Combined with Distance Approach. In Proceedings of the 2019 IEEE 12th International Symposium on Diagnostics for Electrical Machines, Power Electronics and Drives (SDEMPED); IEEE: Toulouse, France, August 2019; pp. 88–93. [Google Scholar] [CrossRef]
  11. Hang, J.; Zhang, J.; Cheng, M.; Wang, Z. Fault Diagnosis of Mechanical Unbalance for Permanent Magnet Synchronous Motor Drive System under Nonstationary Condition. In Proceedings of the 2013 IEEE Energy Conversion Congress and Exposition; IEEE: Denver, CO, USA, September, 2013; pp. 3556–3562. [Google Scholar] [CrossRef]
  12. Allouche, A.; Etien, E.; Rambault, L.; Doget, T.; Cauet, S.; Sakout, A. Mechanical Fault Diagnostic in PMSM from Only One Current Measurement: A Tacholess Order Tracking Approach. Sensors 2020, 20, 5011. [Google Scholar] [CrossRef]
  13. Xie, T.; Wang, T.; He, Q.; Diallo, D.; Claramunt, C. A Review of Current Issues of Marine Current Turbine Blade Fault Detection. Ocean Eng. 2020, 218, 108194. [Google Scholar] [CrossRef]
  14. Kawaharada, H.; Godler, I.; Ninomiya, T.; Honda, H. Vibration Suppression Control in 2-Inertia System by Using Estimated Torsion Torque. In Proceedings of the 2000 26th Annual Conference of the IEEE Industrial Electronics Society. IECON 2000. 2000 IEEE International Conference on Industrial Electronics, Control and Instrumentation. 21st Century Technologies and Industrial Opportunities (Cat. No.00CH37141); IEEE: Nagoya, Japan, 2000; Vol. 3, pp. 2219–2224. [CrossRef]
  15. Beards, C.F. Vibration Analysis and Control System Dynamics; Ellis Horwood series in engineering science; E. Horwood ; Halsted Press: Chichester, W. Sussex : New York, 1981; ISBN 978-0-85312-242-5. [Google Scholar] [CrossRef]
  16. Wolkiewicz, M.; Tarchala, G.; Orlowska-Kowalska, T.; Kowalski, C.T. Online Stator Interturn Short Circuits Monitoring in the DFOC Induction-Motor Drive. IEEE Trans. Ind. Electron. 2016, 63, 2517–2528. [Google Scholar] [CrossRef]
  17. Bellini, A.; Filippetti, F.; Franceschini, G.; Tassoni, C. Closed-Loop Control Impact on the Diagnosis of Induction Motors Faults. IEEE Trans. Ind. Appl. 2000, 36, 1318–1329. [Google Scholar] [CrossRef]
  18. ISO 20816-3:2022; Measurement and Evaluation of Machine Vibration—Part 3: Industrial Machinery with a Power Rating above 15 kW and Operating Speeds between 120 r/min and 30 000 r/min. Measurement and Evaluation of Mechanical Vibration and Shock as Applied to Machines, Vehicles and Structures. OCT: Geneva, Switzerland, 2022.
  19. Faiz, J. Application of Signal Processing Tools for Fault Diagnosis in Induction Motors-A Review-Part I. AUT J. Electr. Eng. 2017. [Google Scholar] [CrossRef]
  20. Zhang, Y.; Liu, G.; Zhao, W.; Zhou, H.; Chen, Q.; Wei, M. Online Diagnosis of Slight Interturn Short-Circuit Fault for a Low-Speed Permanent Magnet Synchronous Motor. IEEE Trans. Transp. Electrification 2021, 7, 104–113. [Google Scholar] [CrossRef]
  21. Rafaq, M.S.; Lee, H.; Park, Y.; Lee, S.B.; Fernandez, D.; Diaz-Reigosa, D.; Briz, F. A Simple Method for Identifying Mass Unbalance Using Vibration Measurement in Permanent Magnet Synchronous Motors. IEEE Trans. Ind. Electron. 2022, 69, 6441–6444. [Google Scholar] [CrossRef]
  22. Ewert, P.; Kowalski, C.T.; Jaworski, M. Comparison of the Effectiveness of Selected Vibration Signal Analysis Methods in the Rotor Unbalance Detection of PMSM Drive System. Electronics 2022, 11, 1748. [Google Scholar] [CrossRef]
  23. Ewert, P. The Application of the Bispectrum Analysis to Detect the Rotor Unbalance of the Induction Motor Supplied by the Mains and Frequency Converter. Energies 2020, 13, 3009. [Google Scholar] [CrossRef]
  24. Bouras, A.; Bouras, S.; Kerfali, S. Prediction of the Mass Unbalance of a Variable Speed Induction Motor by Stator Current Multiple Approaches. Turk. J. Electr. Eng. Comput. Sci. 2018, 26, 1056–1068. [Google Scholar] [CrossRef]
  25. Al-Badour, F.; Cheded, L.; Sunar, M. Non-Stationary Vibration Signal Analysis of Rotating Machinery via Time-Frequency and Wavelet Techniques. In Proceedings of the 10th International Conference on Information Science, Signal Processing and their Applications (ISSPA 2010); IEEE: Kuala Lumpur, Malaysia, May 2010; pp. 21–24. [Google Scholar] [CrossRef]
  26. Atmaja, B.T.; Arifianto, D. Machinery Fault Diagnosis Using Independent Component Analysis (ICA) and Instantaneous Frequency (IF). In Proceedings of the International Conference on Instrumentation, Communication, Information Technology, and Biomedical Engineering 2009; IEEE: Bandung, Indonesia, November, 2009; pp. 1–5. [Google Scholar] [CrossRef]
  27. Glowacz, A. Recognition of Acoustic Signals of Commutator Motors. Appl. Sci. 2018, 8, 2630. [Google Scholar] [CrossRef]
  28. Hack Jun Kim; Kwan Yuhl Cho; Hag Wone Kim; Byung Moon Han; Se Kyo Chung Unbalance Weight Detection in Washing Machine Using Band Pass Filter with Variable Center Frequency. In Proceedings of the 2016 IEEE 8th International Power Electronics and Motion Control Conference (IPEMC-ECCE Asia); IEEE: Hefei, China, May 2016; pp. 1915–1922. [CrossRef]
  29. Yörükoğlu, A.; Altuğ, E. Estimation of Unbalanced Loads in Washing Machines Using Fuzzy Neural Networks. IEEEASME Trans. Mechatron. 2013, 18, 1182–1190. [Google Scholar] [CrossRef]
  30. Purbowaskito, W.; Wu, P.-Y.; Lan, C.-Y. Permanent Magnet Synchronous Motor Driving Mechanical Transmission Fault Detection and Identification: A Model-Based Diagnosis Approach. Electronics 2022, 11, 1356. [Google Scholar] [CrossRef]
  31. Zhang, J.; Hang, J.; Cheng, M. Diagnosis of Mechanical Unbalance Fault in Permanent Magnet Synchronous Machine Drives. Electr. Power Compon. Syst. 2016, 44, 1408–1417. [Google Scholar] [CrossRef]
  32. Ribeiro Junior, R.F.; De Almeida, F.A.; Gomes, G.F. Fault Classification in Three-Phase Motors Based on Vibration Signal Analysis and Artificial Neural Networks. Neural Comput. Appl. 2020, 32, 15171–15189. [Google Scholar] [CrossRef]
  33. Liang, H.; Chen, Y.; Liang, S.; Wang, C. Fault Detection of Stator Inter-Turn Short-Circuit in PMSM on Stator Current and Vibration Signal. Appl. Sci. 2018, 8, 1677. [Google Scholar] [CrossRef]
  34. Lipus, J.; Jankovych, R.; Hammer, M.; Lipus, T. VIBRATION AND RELATED DIAGNOSTICS OF MOTORS AND GENERATORS. MM Sci. J. 2016, 2016, 1639–1642. [Google Scholar] [CrossRef]
  35. Pawlik, P.; Lepiarczyk, D.; Dudek, R.; Ottewill, J.R.; Rzeszuciński, P.; Wójcik, M.; Tkaczyk, A. Vibroacoustic Study of Powertrains Operated in Changing Conditions by Means of Order Tracking Analysis. Eksploat. Niezawodn. - Maint. Reliab. 2016, 18, 606–612. [Google Scholar] [CrossRef]
  36. Pietrzak, P.; Wolkiewicz, M. Stator Winding Fault Detection of Permanent Magnet Synchronous Motors Based on the Short-Time Fourier Transform. Power Electron. Drives 2022, 7, 112–133. [Google Scholar] [CrossRef]
  37. Mohammad-Alikhani, A.; Pradhan, S.; Dhale, S.; Mobarakeh, B.N. A Variable Speed Fault Detection Approach for Electric Motors in EV Applications Based on STFT and RegNet. In Proceedings of the 2023 IEEE Transportation Electrification Conference & Expo (ITEC); IEEE: Detroit, MI, USA, June 21, 2023; pp. 1–5. [Google Scholar] [CrossRef]
  38. Kim, H. On-Line Mechanical Unbalance Estimation for Permanent Magnet Synchronous Machine Drives. IET Electr. Power Appl. 2009, 3, 178. [Google Scholar] [CrossRef]
  39. Brock, S.; Luczak, D. Speed Control in Direct Drive with Non-Stiff Load. In Proceedings of the 2011 IEEE International Symposium on Industrial Electronics; IEEE: Gdansk, Poland, June, 2011; pp. 1937–1942. [Google Scholar]
  40. Szabat, K.; Orlowska-Kowalska, T. Vibration Suppression in a Two-Mass Drive System Using PI Speed Controller and Additional Feedbacks—Comparative Study. IEEE Trans. Ind. Electron. 2007, 54, 1193–1206. [Google Scholar] [CrossRef]
  41. Brock, S.; Deskur, J.; Janiszewski, D.; Muszyński, R. Active Damping of Torsional Vibrations in Servodrives. Power Electron. Electr. Driv. - Sel. Probl. 2014, 271–290. [Google Scholar] [CrossRef]
  42. Han, J. From PID to Active Disturbance Rejection Control. IEEE Trans. Ind. Electron. 2009, 56, 900–906. [Google Scholar] [CrossRef]
  43. Wicher, B. ADRC Load Position Controller for Two Mass System with Elastic Joint and Backlash. In Proceedings of the 2018 23rd International Conference on Methods & Models in Automation & Robotics (MMAR); IEEE: Miedzyzdroje, August, 2018; pp. 333–338. [Google Scholar]
  44. Zhiqiang Gao Scaling and Bandwidth-Parameterization Based Controller Tuning. In Proceedings of the Proceedings of the 2003 American Control Conference, 2003.; IEEE: Denver, CO, USA, 2003; Vol. 6, pp. 4989–4996. [CrossRef]
  45. Leboeuf, N.; Boileau, T.; Nahid-Mobarakeh, B.; Clerc, G.; Meibody-Tabar, F. Real-Time Detection of Interturn Faults in PM Drives Using Back-EMF Estimation and Residual Analysis. IEEE Trans. Ind. Appl. 2011, 47, 2402–2412. [Google Scholar] [CrossRef]
  46. Guefack, F.L.T.; Kiselev, A.; Kuznietsov, A. Improved Detection of Inter-Turn Short Circuit Faults in PMSM Drives Using Principal Component Analysis. In Proceedings of the 2018 International Symposium on Power Electronics, Electrical Drives, Automation and Motion (SPEEDAM); IEEE: Amalfi, June, 2018; pp. 154–159. [Google Scholar] [CrossRef]
  47. Haje Obeid, N.; Battiston, A.; Boileau, T.; Nahid-Mobarakeh, B. Early Intermittent Interturn Fault Detection and Localization for a Permanent Magnet Synchronous Motor of Electrical Vehicles Using Wavelet Transform. IEEE Trans. Transp. Electrification 2017, 3, 694–702. [Google Scholar] [CrossRef]
  48. Warren Liao, T.; Ting, C.-F.; Qu, J.; Blau, P.J. A Wavelet-Based Methodology for Grinding Wheel Condition Monitoring. Int. J. Mach. Tools Manuf. 2007, 47, 580–592. [Google Scholar] [CrossRef]
  49. Huang, N.E.; Shen, Z.; Long, S.R.; Wu, M.C.; Shih, H.H.; Zheng, Q.; Yen, N.-C.; Tung, C.C.; Liu, H.H. The Empirical Mode Decomposition and the Hilbert Spectrum for Nonlinear and Non-Stationary Time Series Analysis. Proc. R. Soc. Lond. Ser. Math. Phys. Eng. Sci. 1998, 454, 903–995. [Google Scholar] [CrossRef]
  50. Urresty, J.; Riba, J.; Romeral, L.; Rosero, J.; Serna, J. Stator Short Circuits Detection in PMSM by Means of Hilbert-Huang Transform and Energy Calculation. In Proceedings of the 2009 IEEE International Symposium on Diagnostics for Electric Machines, Power Electronics and Drives; IEEE: Cargese, France, August 2009; pp. 1–7. [Google Scholar]
  51. Li, Q.; Wang, W.; Chen, L.; Sun, D. Rotor-System Log-Decrement Identification Using Short-Time Fourier-Transform Filter. Int. J. Rotating Mach. 2015, 2015, 1–12. [Google Scholar] [CrossRef]
  52. Satpathi, K.; Yeap, Y.M.; Ukil, A.; Geddada, N. Short-Time Fourier Transform Based Transient Analysis of VSC Interfaced Point-to-Point DC System. IEEE Trans. Ind. Electron. 2018, 65, 4080–4091. [Google Scholar] [CrossRef]
  53. Bishop, C.M. Neural Networks for Pattern Recognition; Clarendon Press ; Oxford University Press: Oxford : New York, 1995; ISBN 978-0-19-853849-3. [Google Scholar]
  54. Haykin, S.S. Neural Networks: A Comprehensive Foundation; 2nd ed.; Prentice Hall: Upper Saddle River, N.J, 1999; ISBN 978-0-13-273350-2. [Google Scholar]
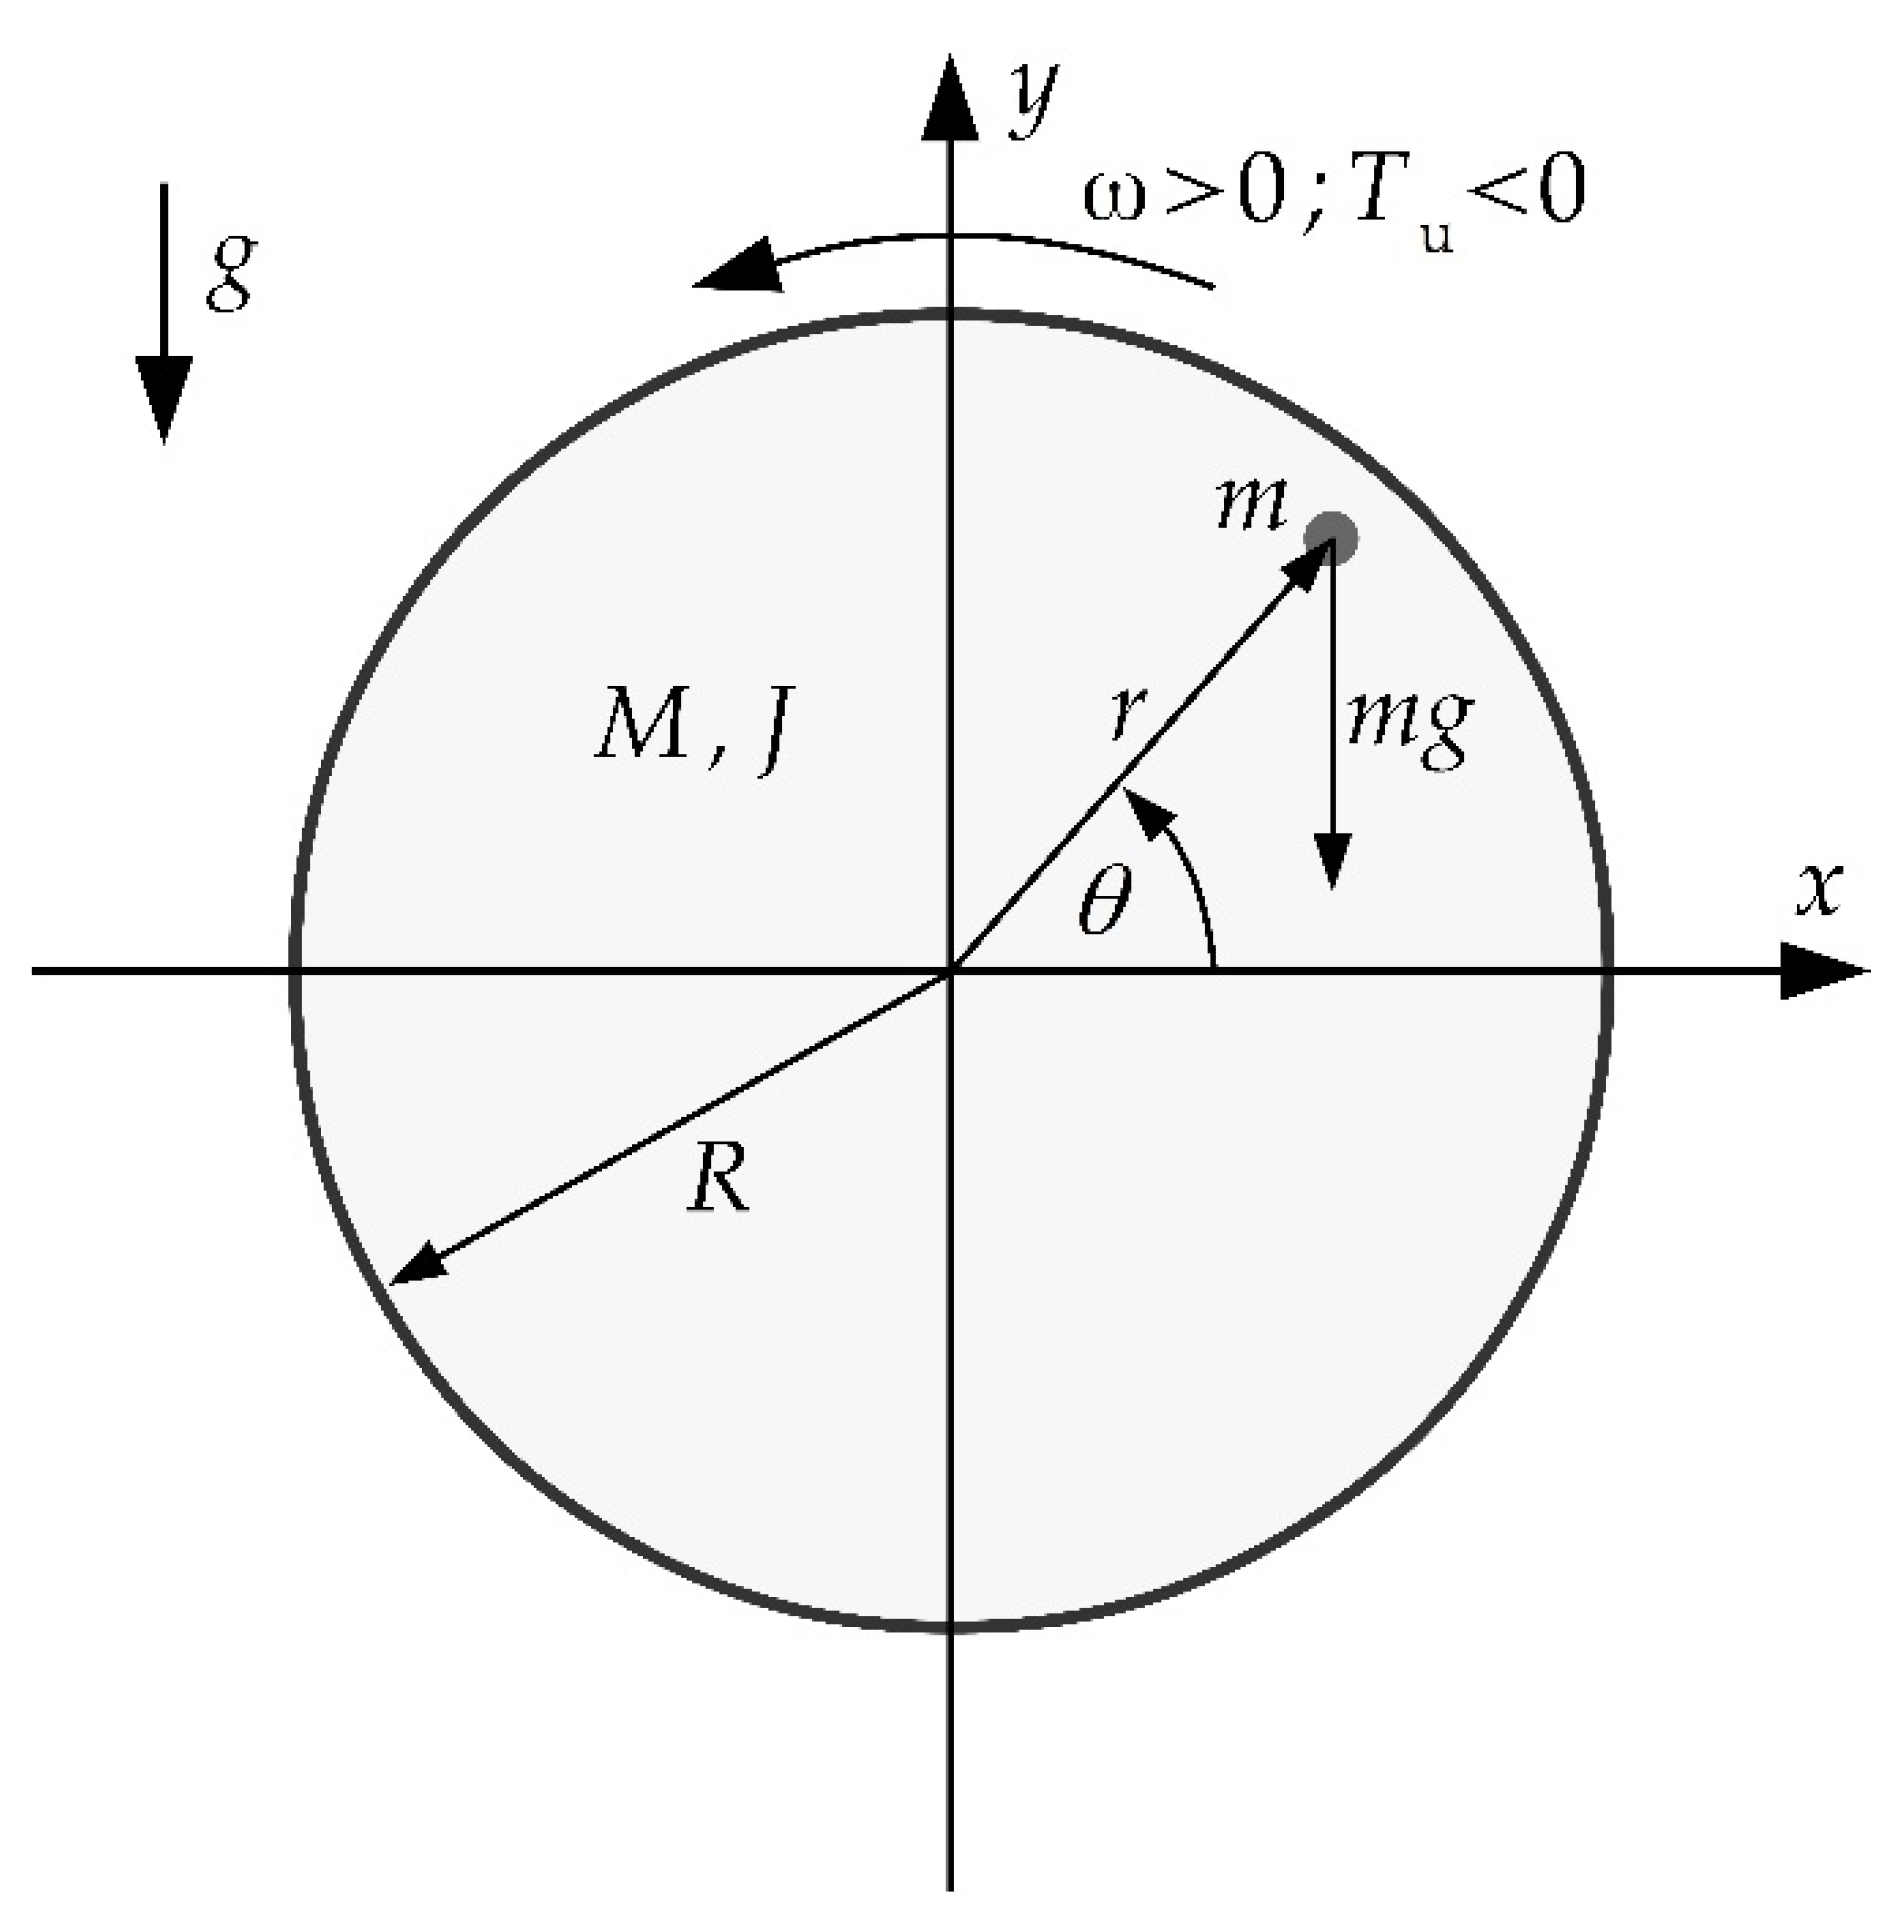
Figure 1. Distribution of forces acting on a cylinder rotating at a constant angular speed ω on which an unbalanced mass m is placed.
Preprints 117122 g001
Figure 2. Schematic representation of the two-mass system.
Preprints 117122 g002
Figure 3. Block diagram of the speed control system.
Preprints 117122 g003
Figure 4. Block diagram of a motor-side speed control system based on the ADRC method.
Preprints 117122 g004
Figure 5. Photo of the laboratory stand for testing the unbalance of a two-mass system with PMSMs.
Preprints 117122 g005
Figure 6. Effect of the test mass on the Iq ref current of the modelled PMSM.
Preprints 117122 g006
Figure 7. Effect of the test mass on the Iq ref current of the modelled PMSM.
Preprints 117122 g007
Figure 8. Summary of the spectrograms of the Iq ref current of the modelled motor (simulation studies), the tested motor (single-mass system), and the tested two-mass system for different values of the test mass.
Preprints 117122 g008
Figure 9. Summary of fr frequency amplitudes for different values of test weight: a) simulation tests, b) experimental tests of a single-mass system, c) experimental tests of a two-mass system for different values of smoothing filter.
Preprints 117122 g009
Figure 10. The algorithm of data preprocessing before feeding into neural network.
Preprints 117122 g010
Figure 11. Structure of the applied MLP neural network.
Preprints 117122 g011
Figure 12. Graphical summary of the effectiveness of neural detectors for detecting rotor unbalance of the two-mass system: a) neural networks with one hidden layer, b) neural networks with two hidden layers.
Preprints 117122 g012
Figure 13. Graphical summary of the effectiveness of neural classifiers in determining the level of rotor unbalance of the two-mass system: a) neural networks with one hidden layer and b) neural networks with two hidden layers.
Preprints 117122 g013
Table 1. Summary of parameters considering the method of obtaining input data and the process of learning neural networks.
Parameter Explanation
Input data Analysed signal Current Iq ref
Input data Amplitudes of: fDC (constant component of current Iq ref), fr, 2fr, 3fr, 4fr and current angular velocity
Calculation of kfr amplitude A maximum value within +/−5% of the kfr frequency width calculated from the current speed value
Normalization of input data Yes, in the range <0, 1>
The number of elements of the training vector 200
The number of elements of the testing vector 200
Neural network Type of neural network Feed-forward backpropagation network
Transfer function of hidden layers Hyperbolic tangent sigmoid transfer function (tansig)
Transfer function of output layer Linear transfer function (purelin)
Network training function Levenberg-Marquardt backpropagation (trainlm)
Weight/bias learning function Gradient descent with momentum weight and bias learning function (learngdm)
Performance function Mean squared normalized error performance function (mse)
Maximum number of epochs to train 2000
Performance goal 1 × 10⁻⁵
Disclaimer/Publisher’s Note: The statements, opinions and data contained in all publications are solely those of the individual author(s) and contributor(s) and not of MDPI and/or the editor(s). MDPI and/or the editor(s) disclaim responsibility for any injury to people or property resulting from any ideas, methods, instructions or products referred to in the content.
Copyright: This open access article is published under a Creative Commons CC BY 4.0 license, which permit the free download, distribution, and reuse, provided that the author and preprint are cited in any reuse.
Prerpints.org logo

Preprints.org is a free preprint server supported by MDPI in Basel, Switzerland.

Subscribe

© 2024 MDPI (Basel, Switzerland) unless otherwise stated