1. Introduction
The use of algae for the removal, biotransformation, or mineralisation of several nutrients and heavy metals from wastewater is an environmentally friendly process, as no secondary pollution occurs if the biomass produced is used as feedstock and the treated wastewater is reused. According to [
1,
2], research in this field is not new and has demonstrated the ability of microalgae to efficiently use nitrogen, phosphorus and other impurities of wastewater to promote their growth [
3,
4,
5]. In addition to these nutrients that come with the wastewater, microalgae also depend on other external parameters, such as light that is absorbed and used in a photosynthesis process [
6], and temperature that has an effect on photosynthesis and cell division [
7]. Moreover, since they are autotrophic microorganisms, they contribute to reducing the concentration of greenhouse gases by fixing CO2 during their growth [
8]. These efforts over the years have allowed an advanced level of mastery of this technology to be achieved until its implementation for a rural community of 300 people [
9].
The effects of temperature and solar irradiance on the growth of many different strains of microalgae cultivated on open or closed systems are studied by considerable research organisations [
10,
11]. In [
12], the study of the impact of temperature on microalgae shows a decrease in viable cells at high temperature and an increase from 20 ° C to 28 ° C, the optimum range. This range of optimal temperature changes with the microalgae strain [
11]. Regarding incident light, three different levels of solar irradiance (6213, 2741 and 3799 Wh m–2 d–1) were investigated to understand the influence of solar irradiance on the microalgae bacteria consortium cultivated in 80 L domestic wastewater in the outdoor High Rate Algae Pond (HRAP) [
13]. In the same way, the effect of both parameters on the growth of microalgae has been also studied in [
14] by modelling and validating the variation of the growth rate as a function of temperature at different light intensity levels. In addition to the importance of light intensity, its quality and photoperiodicity also play a key role in the metabolism of microalgae. For example, the work presented in [
15] shows a faster growth rate and a higher lipid content in algae biomass, when the medium receives white light instead of red light.
Large-scale outdoor microalgae cultivations were carried out effectively under natural daily or seasonally solar irradiance and temperature and eventually produced satisfactory results to understand the impact of both culture parameters [
16,
17,
18]. However, it is important to know the long-term temporal variability of these parameters when planning the installation of an HRAP system at a given site. To consider climatic variability in outdoor mass culture, Typical Meteorological Sequences (TMS) were developed as a preliminary step to evaluate the effects of temperature and solar irradiance on the growth of microalgae growth in HRAP, for example [
19]. This would make it possible to consider the extreme conditions of these parameters when assessing the long-term viability of a proposed project.
On the other hand, the economic viability of an open pond cultivation system in a given location is strictly related to in situ climatic conditions. When microalgae are grown in an open pond, meteorological parameters, among others, are beyond our control. The daily and seasonal fluctuation of the culture weather parameters significantly affect microalgae metabolism [
18]. In some cases, this could have negative effects on the productivity of these microorganisms and therefore the quality of recycling water, energy and fertilizer nutrients. In an open-pond system for microalgae culture, temperature, and solar irradiance, photosynthetically active radiation (PAR), in particular, are the most relevant meteorological parameters. In the case of solar radiation, assuming the representativeness of the period covered by the available meteorological database, the corresponding empirical probability distribution function [
20] allows characterising its long-term temporal variability. Previous works in the field of solar thermal power generation [
21,
22] has presented in detail the possibilities that, from the point of view of economic viability, the probabilistic analysis of different production scenarios provides.
In this work, the average daily productivities (in terms of microalgae concentration) corresponding to n-growth meteorogical sequences (1204 in our case study) have been simulated from hourly PAR and temperature measurements recorded in-situ using a simplified production model. This series of ‘biomass productivities’ for a given season has been compared with the productivity corresponding to the representative TMS for that same period of the year [
19]. This manuscript is structured as follows:
Section 2 introduces the case of study, describes the measured data set used and the growth model proposed in the work, as well as the simulation model performed.
Section 3 shows the main results and their discussion. Finally,
Section 4 presents conclusions and future works.
2. Materials and Methods
The growth of photosynthetic organisms (plants, protists, and bacteria) requires conditions that are difficult to achieve, especially when this bioprocess is carried out in a device exposed to weathering. In this case, crop yield would be significantly affected by environmental impacts that change throughout the year. However, optimal crop development depends on many factors, some of which directly influence growth characteristics. This is the case with respect to temperature and light or photosynthetically active radiation (PAR) in massive outdoor cultivation. In this situation, a representative of the long-term variability of these two parameters at a given site may be advantageous when running growth simulation tools of photosynthetic organisms or conducting laboratory-scale studies for application at that site.
A Growth Meteorological Sequence (GMS) corresponds to a sequence of consecutive days of a given site and season; the number of consecutive days of each GMS can be adapted taking into account the growth period of the photosynthetic species under study. This adaptive tool has been designed as input data to simulate different types of crops that have a growing period from a few days to a few weeks. Therefore, the cultivation of microalgae or other plant species could be a case study.
On the other hand, it provides a general representation of the long-term variability solar irradiance and temperature over a period corresponding to the time it takes for the crop species to reach harvest. The simulation of the productivity from long-term weather data series offers an opportunity to explore crop profitability under different scenarios before its implementation in-situ. In this framework, the cultivation of microalgae, tomatoes, or other crops would be examples for a numerical simulation case study that includes PAR and temperature as input data.
2.1. Case of Study
A wastewater treatment model based on microalgae is the case study discussed below. Such a model, which considers the long-term variability of air temperature and PAR, can be useful to anticipate when making decisions on the implementation of such a system. In our case study, long-term climate variability will be taken into account from a set of n-GMS consisting of 7 consecutive days generated according to the methodology proposed in [
19]. Each of these sequences was used to obtain the algal biomass production and then to evaluate the variability of productivity in statistical terms. This section is described in more detail in
Section 2.3 and
Section 2.4. Arbitrarily, 7 consecutive days have been considered according to the range proposed by [
23] that indicated that more than 80% of total nitrogen and 70% of total phosphorus are eliminated after 5 days, with an average biomass productivity of 0.64
for batch culture. Furthermore, Zou et al. obtained a significant result of 1.72
of microalgal biomass produced during batch treatment and proposed that a hydraulic retention time of 7 to 9 days could be efficient for nutrient removal and microalgal biomass production during continuous treatment [
24].
Additionally, a 7-day PAR and temperature variation data set was obtained from 15-year remote sensing data, with a spatial resolution of . PAR data have been obtained from Kato bands, provided by the spectral resolved irradiance (SRI) of the Satellite Application Facility on Climate Monitoring (CMSAF), which belongs to the European Organisation for the Exploitation of Meteorological Satellites (EUMETSAT). The temperature values were sourced from the Copernicus Climate Change Service (2023): ERA5 hourly data.
2.2. Microalgae Growth Model
In this study, a high-rate algae pond (reactor) model was just simplified to focus on microalgae growth as a function of air temperature (T), photosynthetically active radiation (PAR) and a reduced number of impurities present in the cultivation medium. Phosphorus (P) and nitrogen (N) are two of the impurities in wastewater (cultivation medium) that microalgae are able to remove for their growth. There are several nitrogen compounds, such as ammonium, organic nitrogen, nitrate, and nitrite, present in wastewater. In this study, total nitrogen is considered equal to the sum of total Kjeldahl nitrogen, nitrite, and nitrate. Likewise, wastewater is relatively rich in phosphorus compounds, including phosphate ion, inorganic form (ortho and polyphosphates), and organic form (organically bound phosphates). Therefore, total phosphorus is given here as a combination of these different phosphorus compounds. These parameters were taken as limiting substrates for the growth of these photosynthetic microorganisms.
The remaining micropollutants, heavy metals, other nutrients, and organic pollutants are considered nonlimiting nutrients. The bacteria population and maintenance of microalgae were not considered in the model. Furthermore, in this work, the energy balance [
25] and the exchange of gases [
8,
26] between the system and its environment were also ruled out. Finally, only the depth of the pond was included as the geometry of the system and was equal to 10 cm. This magnitude is used to calculate the average PAR value in the culture medium.
The cell mass concentration of the microalgae in the culture medium was determined using the material balance approach. For a batch culture model, the influent and effluent of materials in the medium are null, i.e., it does not add nutrients in the culture medium, and the volume is considered constant. Furthermore, assuming that all cells have the same mass, the growth kinetics of microalgae is proportional to its specific growth rate (
) which depends on the availability of a limiting substrate. A proportion of microalgae that die during the cultivation period was added to the model formulation and represented by the specific mortality rate (
).
where
is microalgae concentration,
, in
, is the maximum specific growth rate of microalgae. To calculate the specific growth rate, these factors
and
were estimated from the Monod model [
27],
from modified Monod model [
28,
29], and
from so-called cardinal temperature model [
14,
30]. The empirical Monod model, which is easy to calibrate and links growth to a culture parameter, is widely used to simulate wastewater treatment using microorganisms [
31]. For PAR, Monod's modified model involved adding a term to the denominator to account for inhibition when the substrate (PAR) is highly above the optimum limit. The same consideration was included in the cardinal temperature model.
The following equation 2 shows the form to determinate the factors
and
with S which represents the concentration of phosphorus or nitrogen, in this case it can be either N or P.
is a constant, expressed in
, which represents the half-saturation concentration of the limiting nutrients (P and N).
For Equations 3 and 4, an intermediate calculation was performed to find the mean values for the available PAR and the medium temperature of cultivation, respectively. Regarding the photosynthesis rate (Equation 3), the Lambert-Beer law is applied to obtain the average value of PAR
which represents the light intensity to which the cells are exposed in the culture medium and has been taken as proposed in [
32,
33].
Image 1 shows the laboratory experience to determine the attenuation of light through the culture medium during the growth period by placing two PAR sensors, one inside and the other outside. From these two measurements, the extinction coefficient found in the Lambert-Beer equation was estimated by relating the absorbance to the transmittance of the light. The extinction coefficient was experimentally estimated for each season. A calibrated lamp was programmed with PAR values corresponding to the TMS of each season. and (in are inhibition constant and saturation intensity at which the specific growth rate is half the maximum, respectively.
The productivity of microalgal is also affected by the external temperature. The remaining factor (Equation 4) models the growth kinetics of the microalgae as a function of the culture temperature (T). Having an open system, this temperature is influenced by the recorded surrounding air temperature. Furthermore, the water that makes up the culture system is constantly in motion. The idea is to obtain the temperature of the culture medium from that of the air using the logistic function established in [
34] that associates these two parameters. Equation 4 also includes minimum (
), maximum (
), and optimum (
) temperature values that are specific to the selected microalgae.
Image 1.
Experimental start-up of microalgae cultivation in domestic wastewater.
Image 1.
Experimental start-up of microalgae cultivation in domestic wastewater.
2.3. Simulation Process
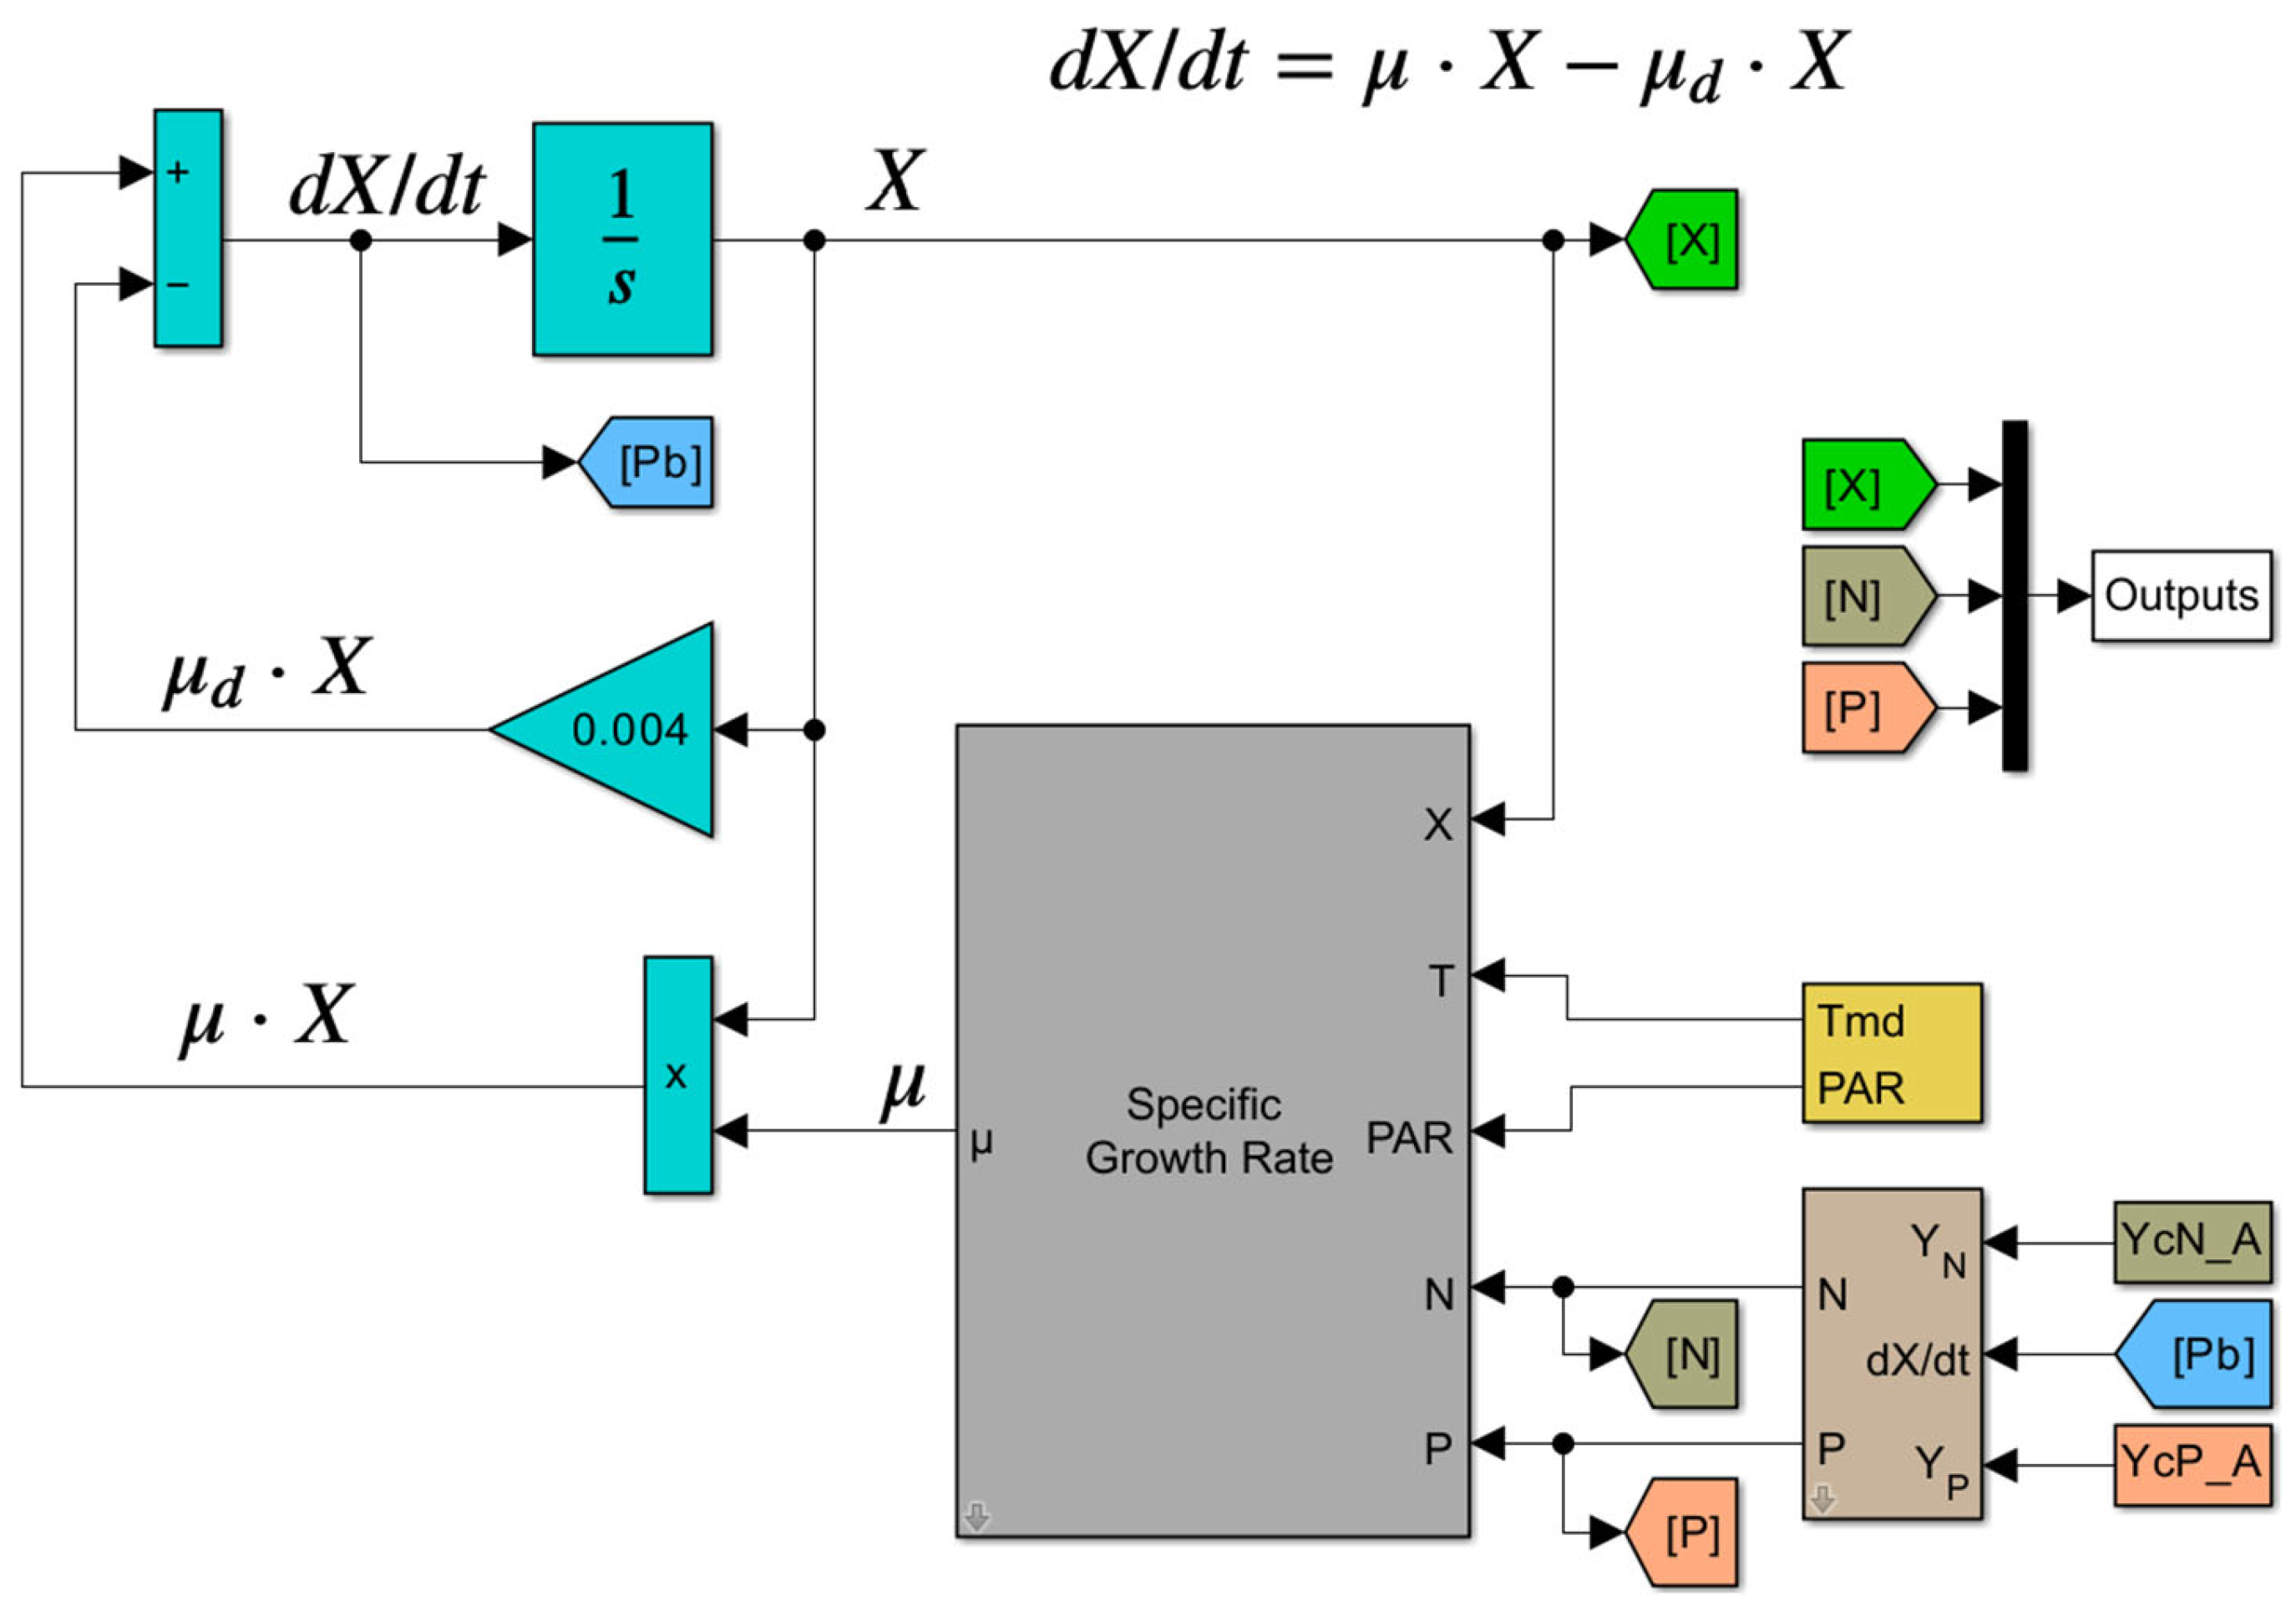
The computational implementation of the modelling described above was done using MATLAB and Simulink [
35]. This allowed us to combine textual and graphical programming in the same environment to perform a multitude of parallel simulations (
Figure 1). Therefore, for a given meteorological season (spring, summer, autumn, or winter) in the Madrid region, microalgae batch production was simulated for all GMS generated during this period. In our case, as previously we present, a GMS corresponds to a sequence of 7 consecutive days formed by the data pair
and
. While referring still with [
19], there are 1204 GMS for the spring season, 1204 GMS for summer, 1190 GMS for the autumn and 1184 GMS for the winter. Therefore, the average daily concentration of microalgae was determined in each of them. The average daily
and
data of these GMS were taken as input parameters for the microalgae production simulation. These are the external parameters involved in the growth of microalgae that characterize environmental conditions. With this 7-day package workflow that involves the use of a lot of data, the simulations have been run in parallel considering the other input data as initialization parameters of the process.
The initialisation of the simulation process is based on the concentration of microalgae inoculum and nutrients initially present in the wastewater sample used for the cultivation experiment (Image 1). To achieve this, we need the characteristics of the aqueous medium, a wastewater sample, and the microalgae species to be used. The type of wastewater selected for this study came from a wastewater treatment plant in a municipality in the Madrid region and was therefore domestic. Its overall nitrogen and phosphorus compositions are given in
Table 1. Chlorella vulgaris is the microalgal strain inoculated in the culture medium, and its concentration is also shown in
Table 1. The specific parameters of the latter were taken from the consulted references and shown in
Table 1. In addition,
that are constants for all seasons, was obtained after adjusting the proposed model. The results of this model were compared with those obtained in the study presented by Eze et al. [
27]. The minimum temperature corresponds to the apparent threshold for any microalgae growth, which is about 8 ° C [
36]. The optimum and maximum temperature have been taken from [
37]. The mortality rate was chosen arbitrarily, so as to be low compared to the growth rate. The same value proposed by [
27] has been adopted, although they work with a different type of microalgae. Finally, inhibition and half-saturation coefficients were estimated to be constant throughout the simulation.
2.4. Dataset for Statistical Analysis
Having the biomass concentration for each day of the GMS that makes up a season, the next step was to concatenate the daily production per day. Building the data set per day enables a statistical analysis by calculating the probability distribution function (PDF) of the biomass concentration of each data grouping per day (D2, D3, D4, D5, D6, or D7). In other words, for example, the biomass concentration for all days 2 (D2) of those GMSs is put together, the same for days 3 (D3), and so on. Day 1 (D1) has not been taken since it corresponds to initialization. The idea was then to calculate PDF of microalgae concentration for each of these datasets, grouped by day. The final step in the methodology consists of observing whether the biomass concentration on a given day (D2, D3, D4, D5, D6 or D7) of the TMS selected in [
19] is, for the same day, in the bin with the largest PDF.
For a given season, the determination of the average daily biomass concentration was carried out for all generated GMSs. The model outputs for identical days (D2, D3, D4, D5, D6 or D7) were used to calculate their daily PDFs. For example,
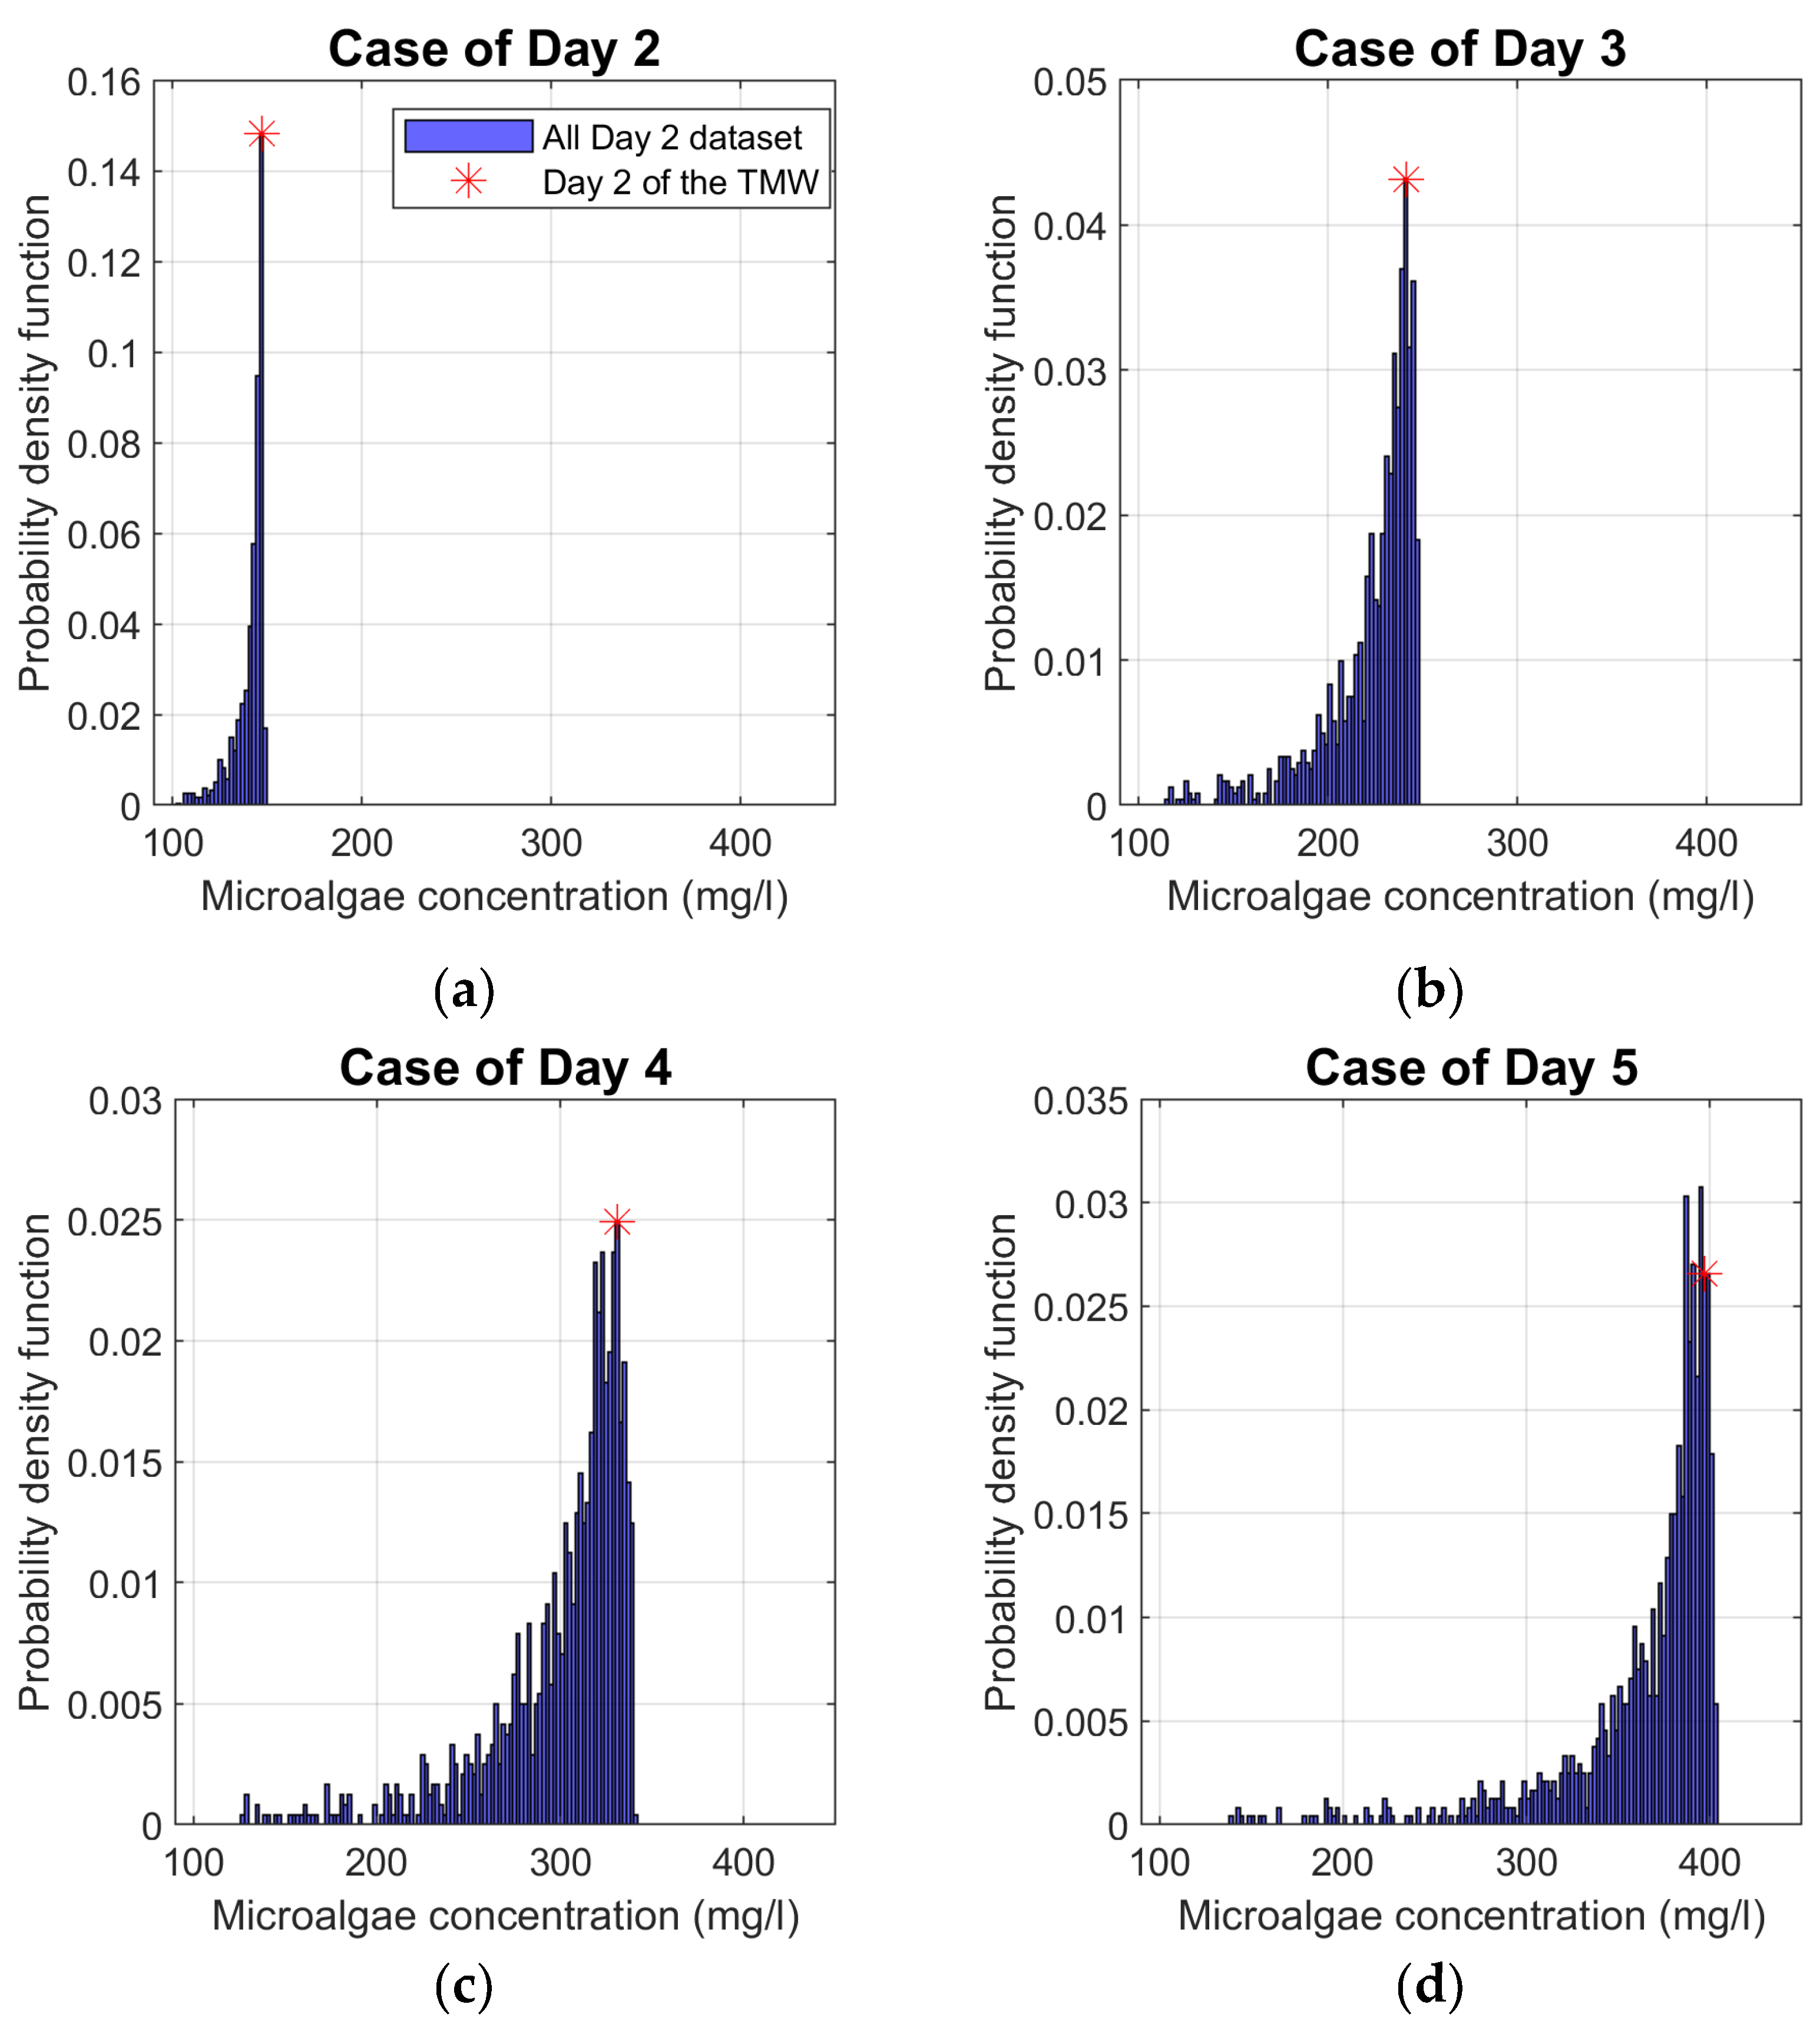
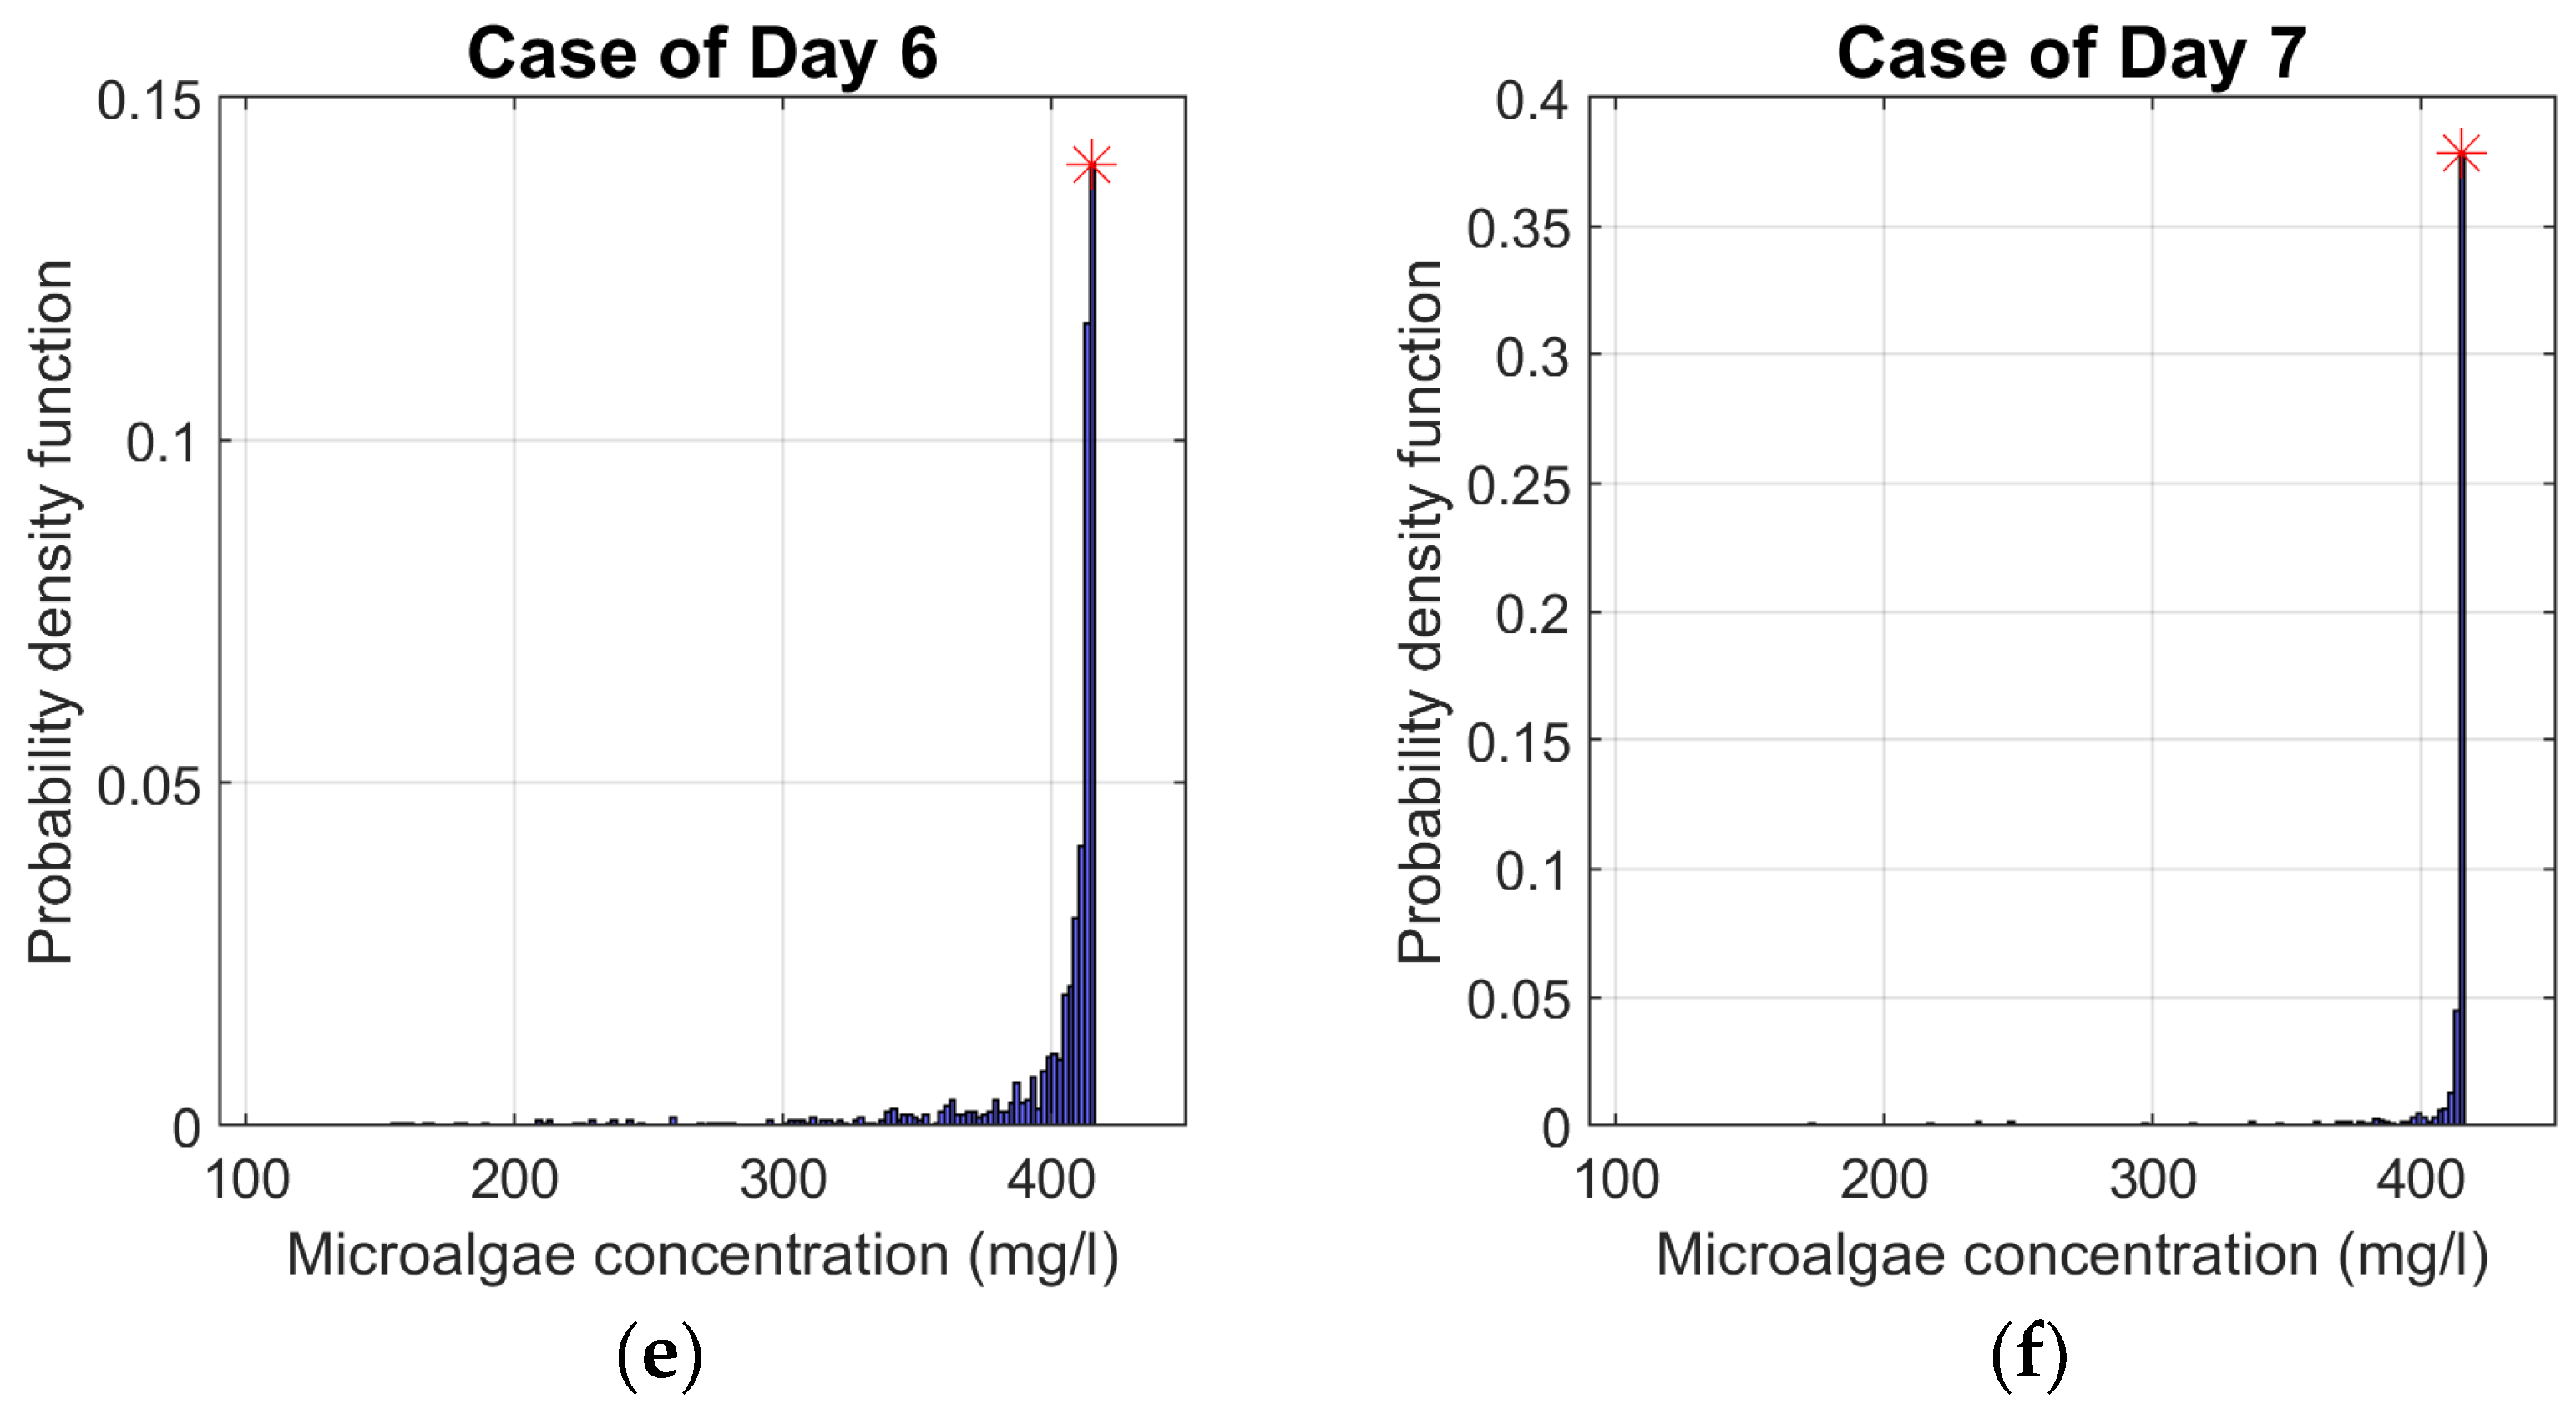
Figure 4a shows the PDFs of biomass concentrations obtained from all D2 of the GMS for the representative summer TMS used as model input data. The same was applied to the other TMS days. Beyond showing the range of probable results for a given day in terms of their frequency of occurrence, this graphical representation includes the graphic concordance of the biomass concentration for the corresponding day of the same day in the TMS. Therefore, it was possible to compare whether this biomass concentration position belonged to the concentration bin with the highest PDF value. For greater accuracy, the length of the biomass concentration bin is reduced to 2 mg/l.
3. Results and Discussion
3.1. Seasonal Biomass Production
Microalgae growth is not only affected by solar irradiance, temperature, phosphorus, and nitrogen, but also depends on other parameters such as pH, dissolved carbon dioxide, bacteria, etc. These parameters not mentioned in this work are each maintained at their optimum value, which corresponds to a specific growth rate equal to unity. In summary, the focus has been exclusively on the influence of these physical parameters on the variation in microalgal growth. In addition, this overlooks the reality of interactions between microorganisms and the various components of the culture system, which are essential for model fidelity.
In addition, nitrogen and phosphorus initially available in the culture medium are adequate for the growth of microorganisms and are consumed progressively. This means that only PAR and temperature are beyond our control and can sometimes act as inhibitors. This simplification has made it possible to reduce the complexity of such a system and to study its biomass productivity using a GMS that considers climatic variability..
Notwithstanding these assumptions, this approach produced statistically acceptable results. When comparing the results with those obtained by [
27], although the latter may have worked with a different species of algae, the order of magnitude of the final concentration of microalgae produced in the summer season is 400 mg/l. Furthermore, the study conducted in [
40] on Chlorella vulgaris growth under four culture conditions with different physicochemical properties gives approximate results in the same range. However, these results were obtained over a period ranging from 8 to 14 days.
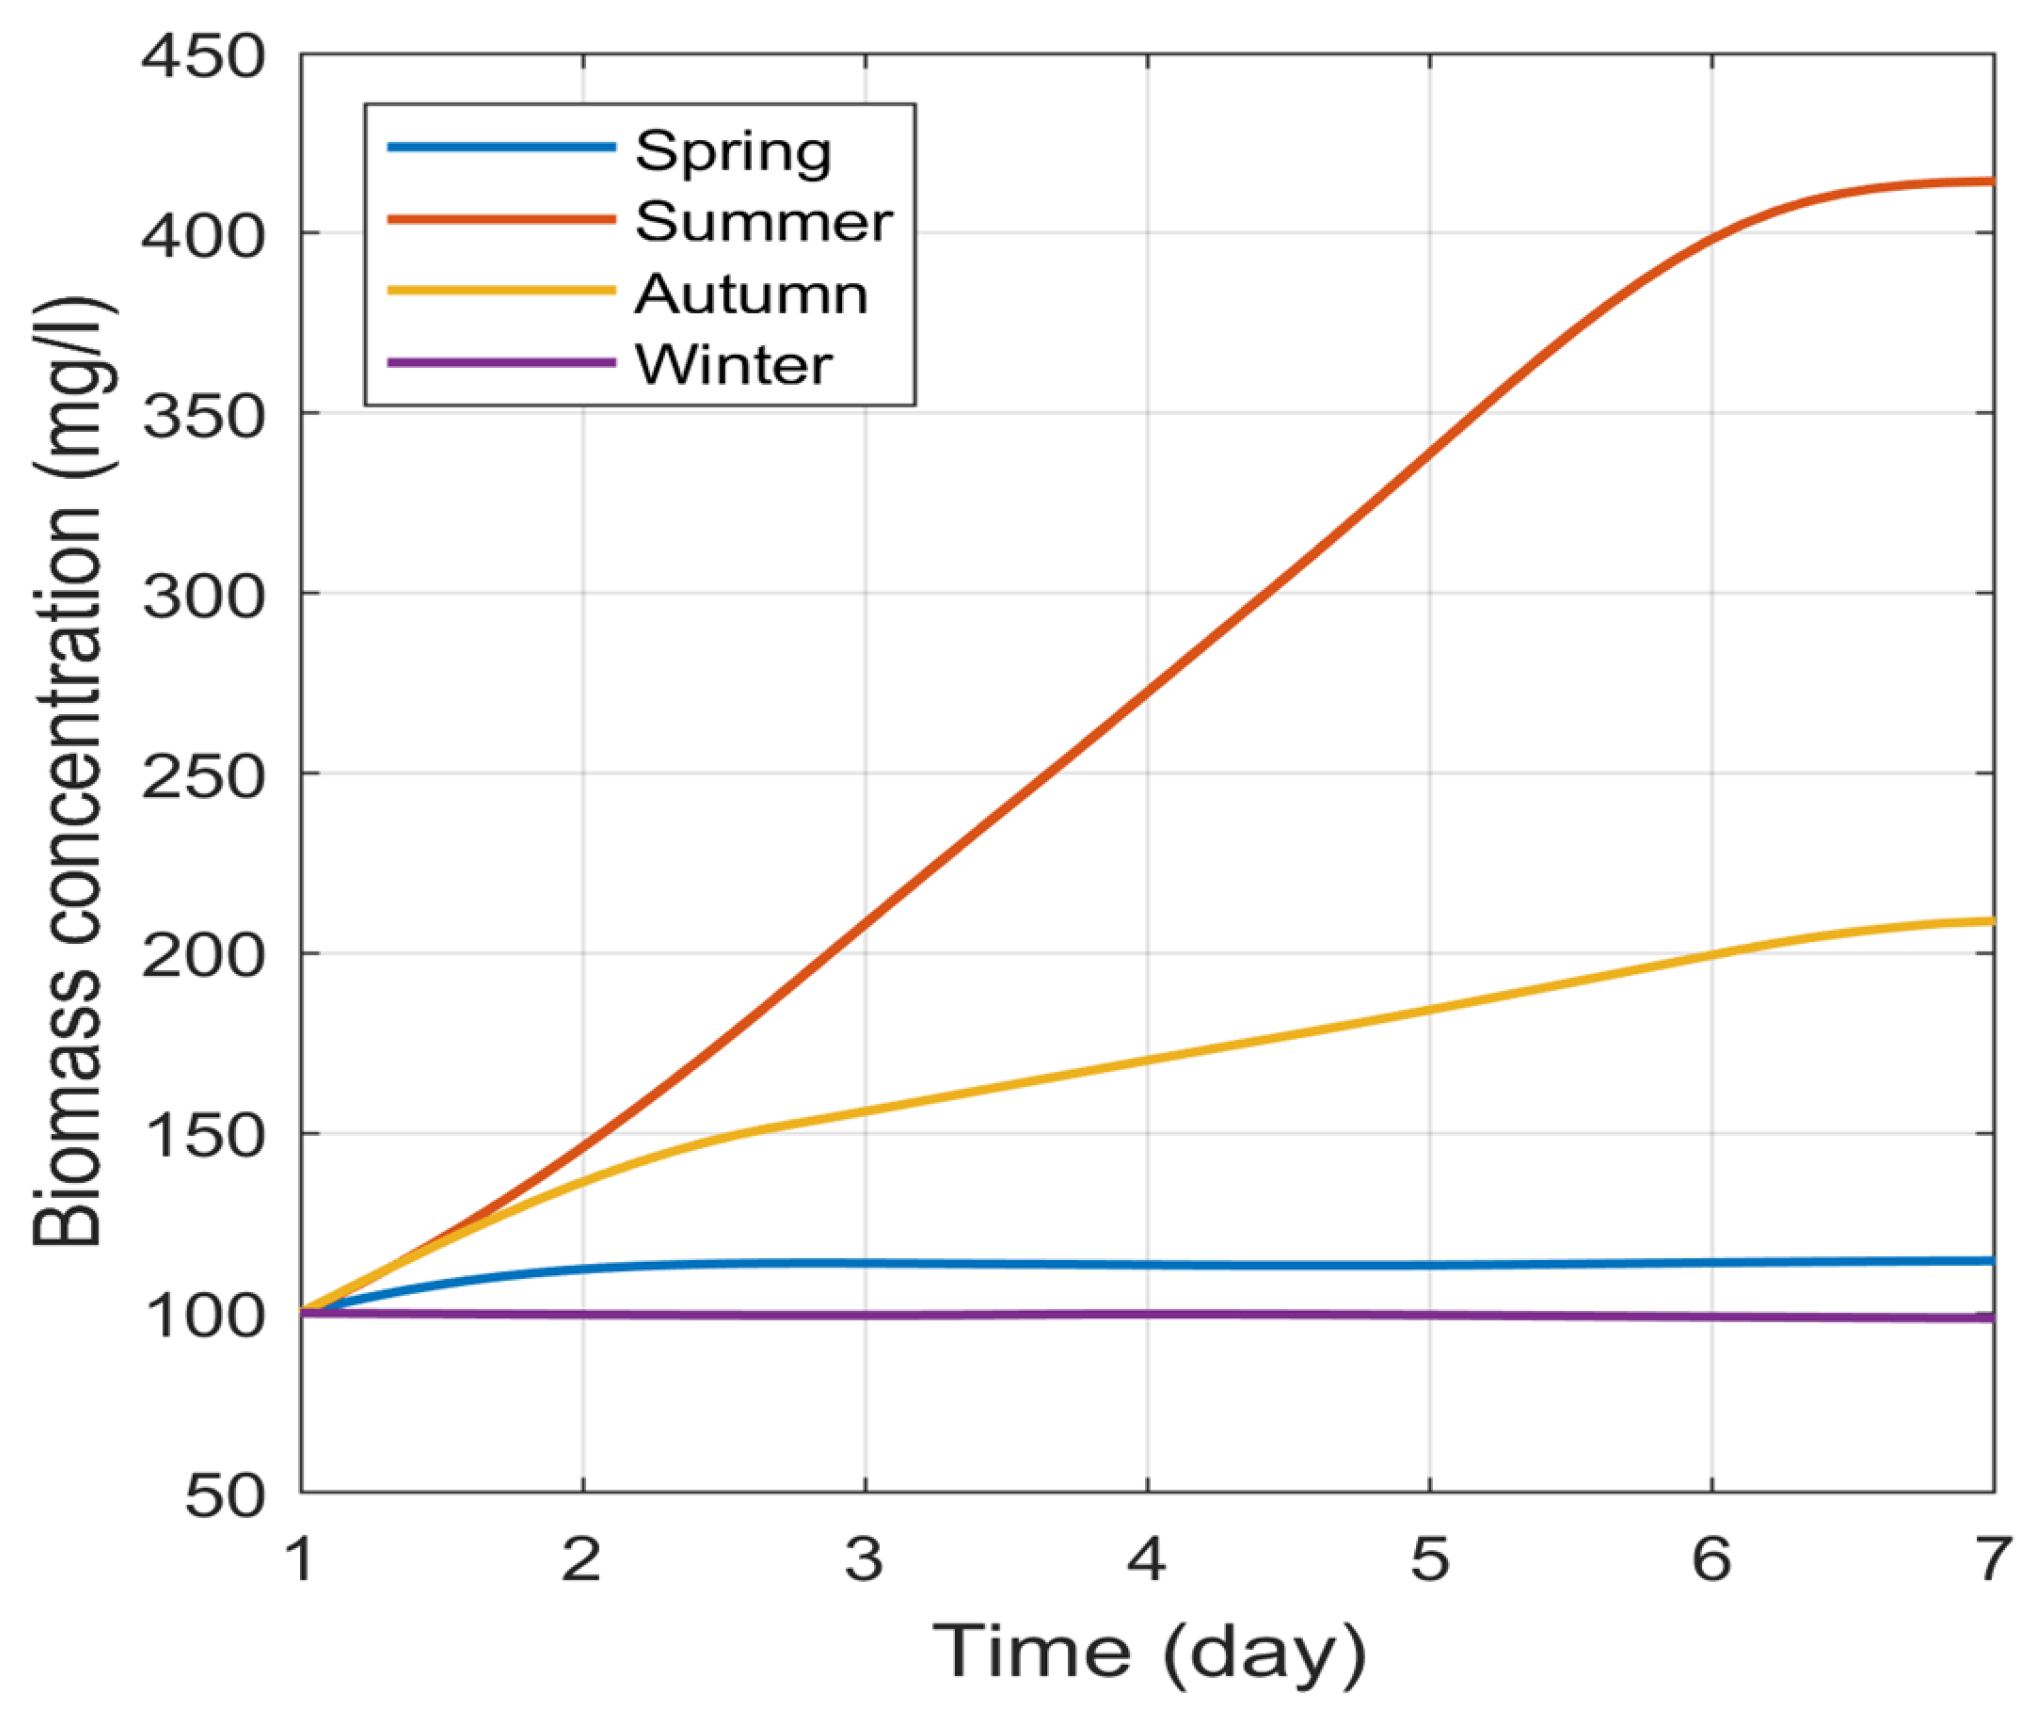
Figure 2 shows the growth curves for the four meteorological seasons of the year using selected TMS from a site in the north of the Madrid region (Riosequillo) [
19].
The result in
Figure 2 reveals the difference in algal biomass production between the four seasons of the year, with a higher concentration in summer. This may be explained by the fact that the growth of these microorganisms is intrinsically dependent on the intensity of these two physical parameters.
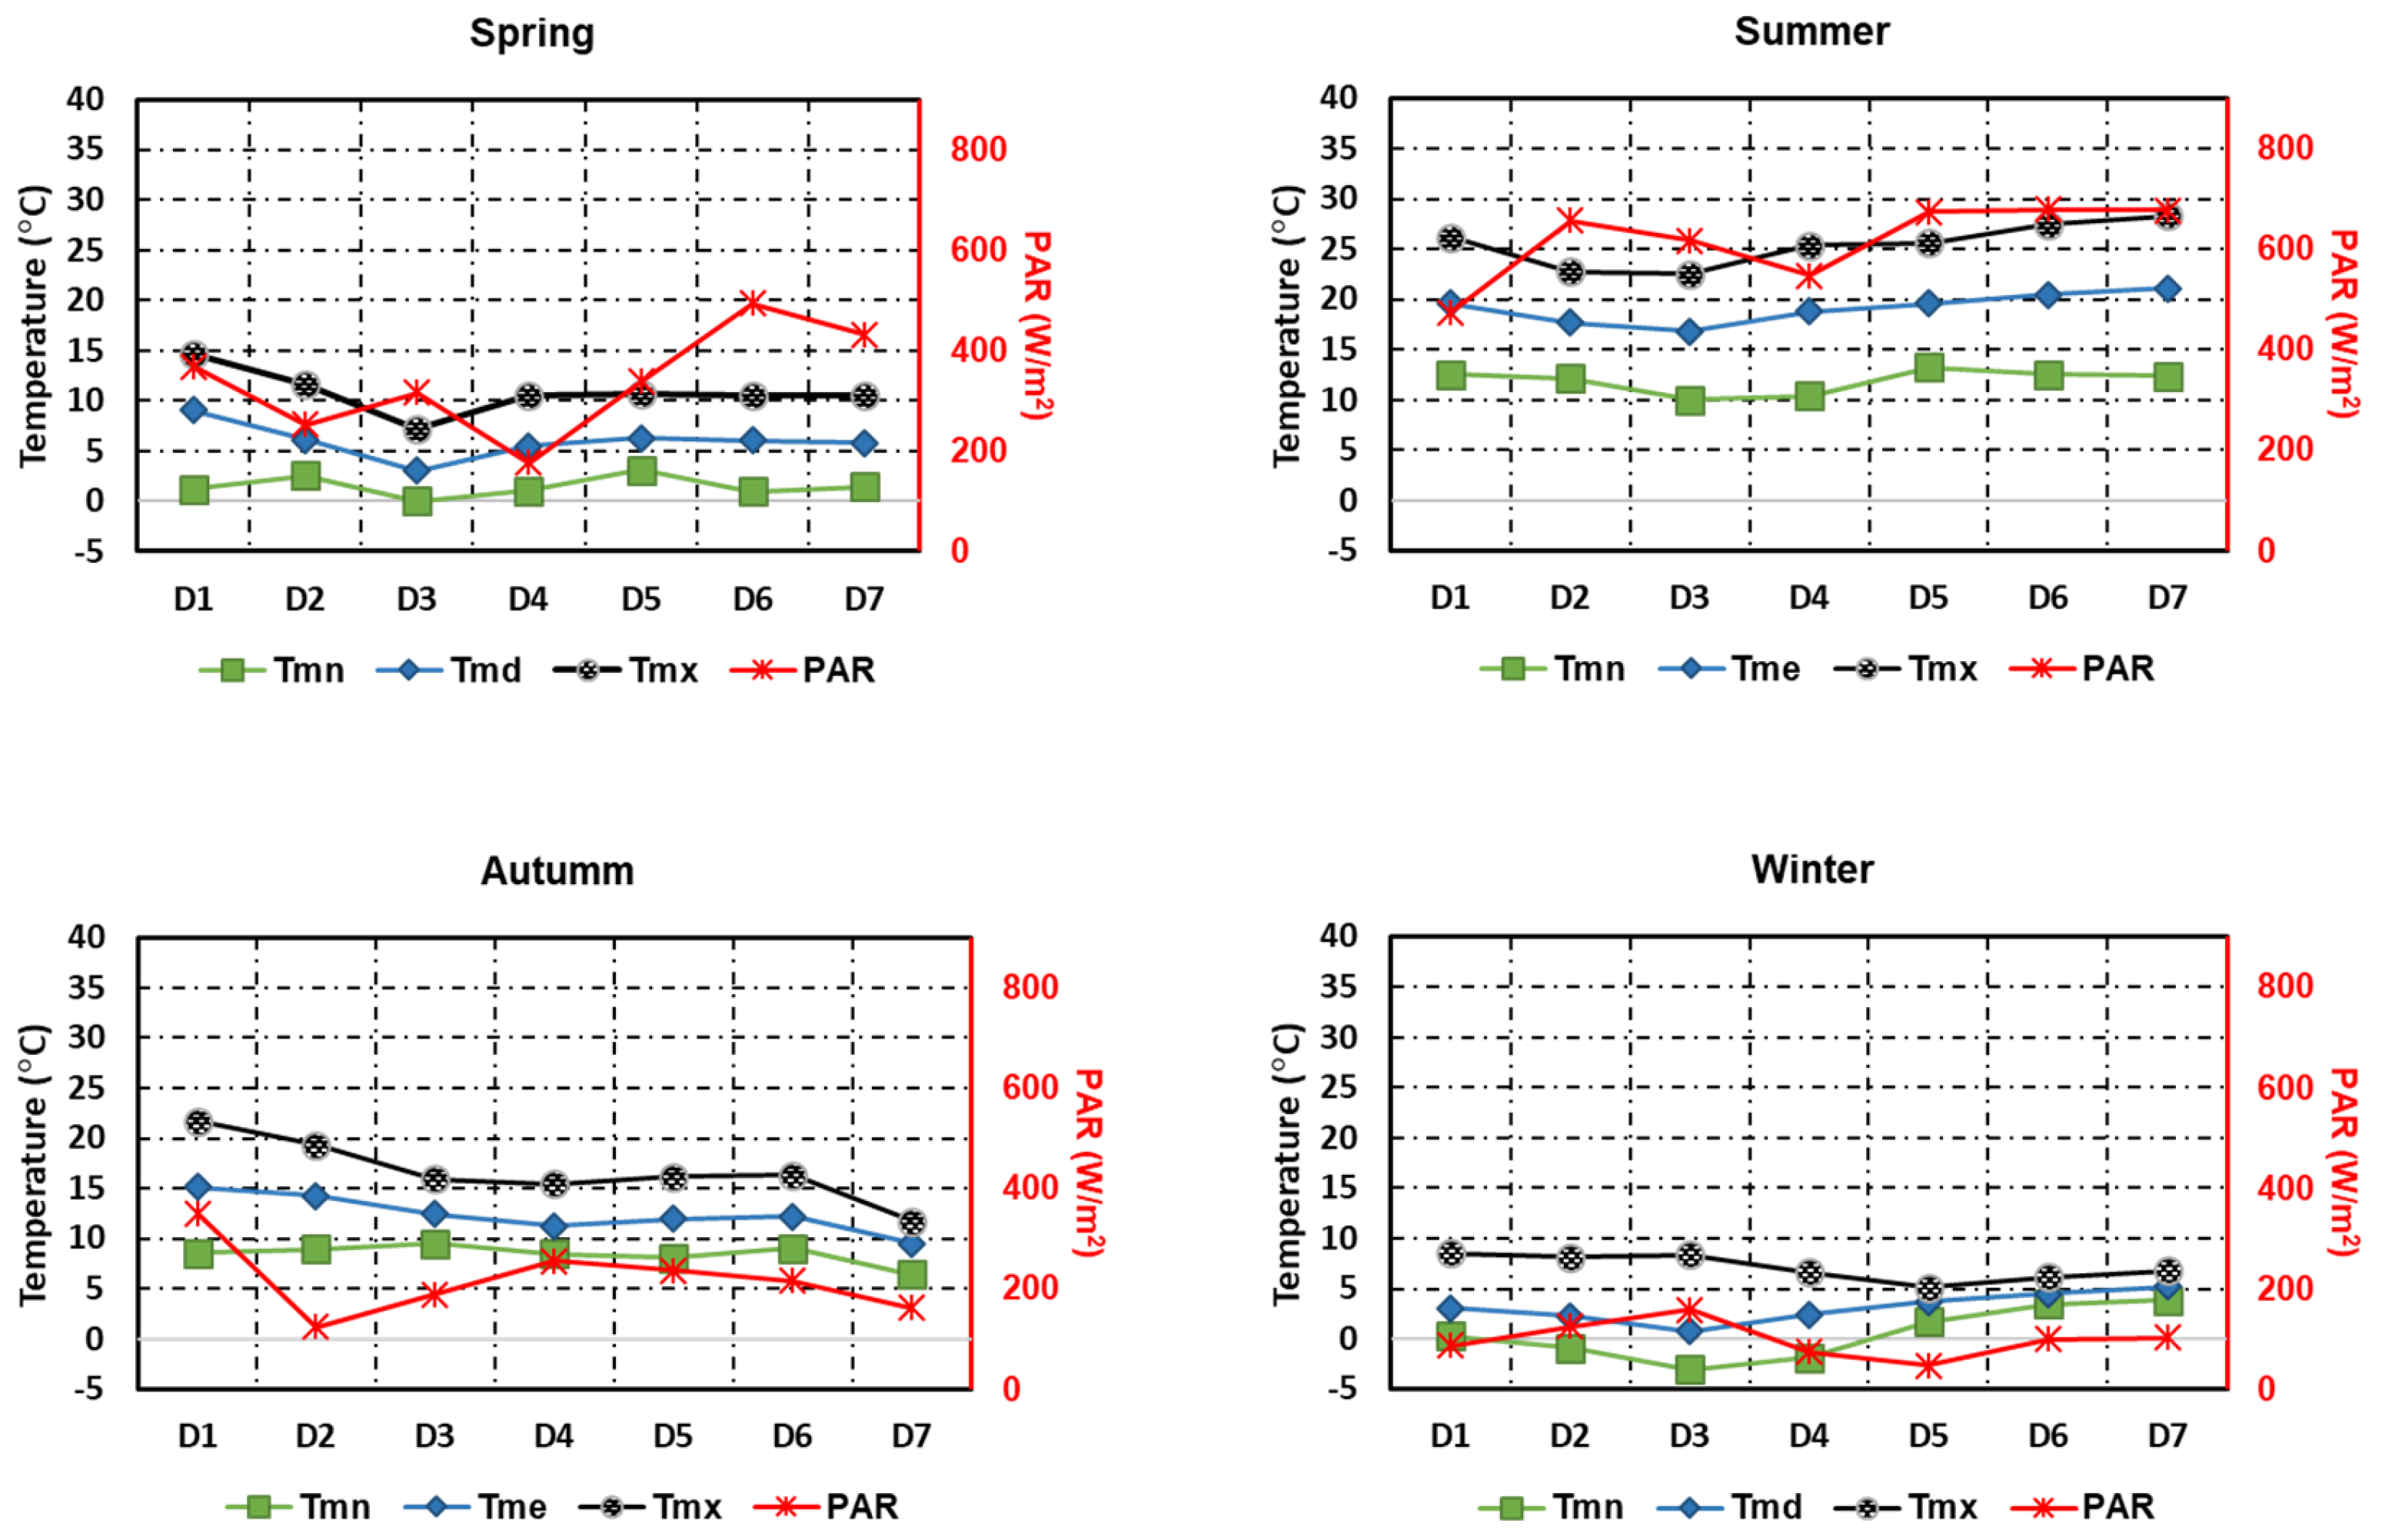
Figure 2 also shows that biomass production is higher in the autumn than in spring. This difference in production between these two periods of the year appears to be mainly due to the temperature, which is higher in the autumn (
Figure 3). Comparing the PAR during these two periods, it is higher in spring. In spring and winter, the microalgae concentration varies very little, even decreasing to 98.5
on the seventh day in the lowest temperature period (winter). However, in
Figure 2 it appears stationary for these two seasons, due to the relatively large variation obtained in summer. Furthermore, a general analysis of the curves in all seasonal figures (
Figure 4 and A1-A3) also shows the biomass concentrations that are the most likely to be obtained throughout the day of cultivation.
3.2. Comparative Analysis of Algae Production
In this section, the PDF of the microalgal productivity for each day that forms each GMS for the summer season are represented for the study location. The spring, autumn, and winter figures are in the Appendix. In
Figure 4, the asterisk symbol represents the position of the biomass concentration obtained at one day TMS. It has been positioned so that it is in the centre of the biomass concentration bin.
The biomass concentration values corresponding to the TMS during the summer were within the range corresponding to the most probable concentration values,
Figure 4. The same observation was observed more closely with data from the spring season, with an exception for the case of days D2 and D7, Figure A1. The position of biomass concentration, for D5 of summer (
Figure 4) and for D2 and D7 of spring TMS (Figure A1), is in the concentration bin with a relatively high probability and is directly preceded or followed by the bin with the highest PDF value. The methodology seems to confirm the representativeness of the TMS for the summer and spring seasons at the studied location. In fact, at these two seasons, almost all the days of TMS already selected in [
19] are in one of the ranges of biomass concentration that have the highest PDFs.
On the other hand, the PDF is much more dispersed for the autumn season (see Figure A2). In this case, the biomass concentration position of each of the TMS days is not within the bin with the highest PDFs or in the bins near the latter. In Figure A3, the exception is the case of day D2, otherwise the biomass concentration for each of the other days of TMS representing winter is far from being among those with the highest probability of distribution, despite the low dispersion of the results. Furthermore, the concentration hardly increases during this period. Consequently, most of the concentrations with the highest probability of distribution are below the initial biomass concentration. The nongrowth of the biomass concentration can be explained by the fact that the PAR and temperature values are relatively low during these periods of the year and unfavourable to the proliferation of these microorganisms. For example, according to
Figure 3, average daily temperatures are below the minimum required for chlorella vulgaris growth.
The best results, in terms of productivity, were obtained for the summer and spring. The explanation may lie in the fact that certain values of the model parameter were taken from references which worked in conditions with a presence of light and adequate temperature almost similar to those of these two periods of the year. As
Figure 1,
Figure 2, and
Figure 3 show, the other two seasons, autumn and winter, offer unsuitable conditions for microalgae cultivation.
Figure 4.
Probability distribution function (PDF) of the set of biomass concentrations on day D2, D3, D4, D5, D6 and D7 using PAR and temperature data from the GMS of the summer season in a locality north of Madrid (Riosequillo) as model input.
Figure 4.
Probability distribution function (PDF) of the set of biomass concentrations on day D2, D3, D4, D5, D6 and D7 using PAR and temperature data from the GMS of the summer season in a locality north of Madrid (Riosequillo) as model input.
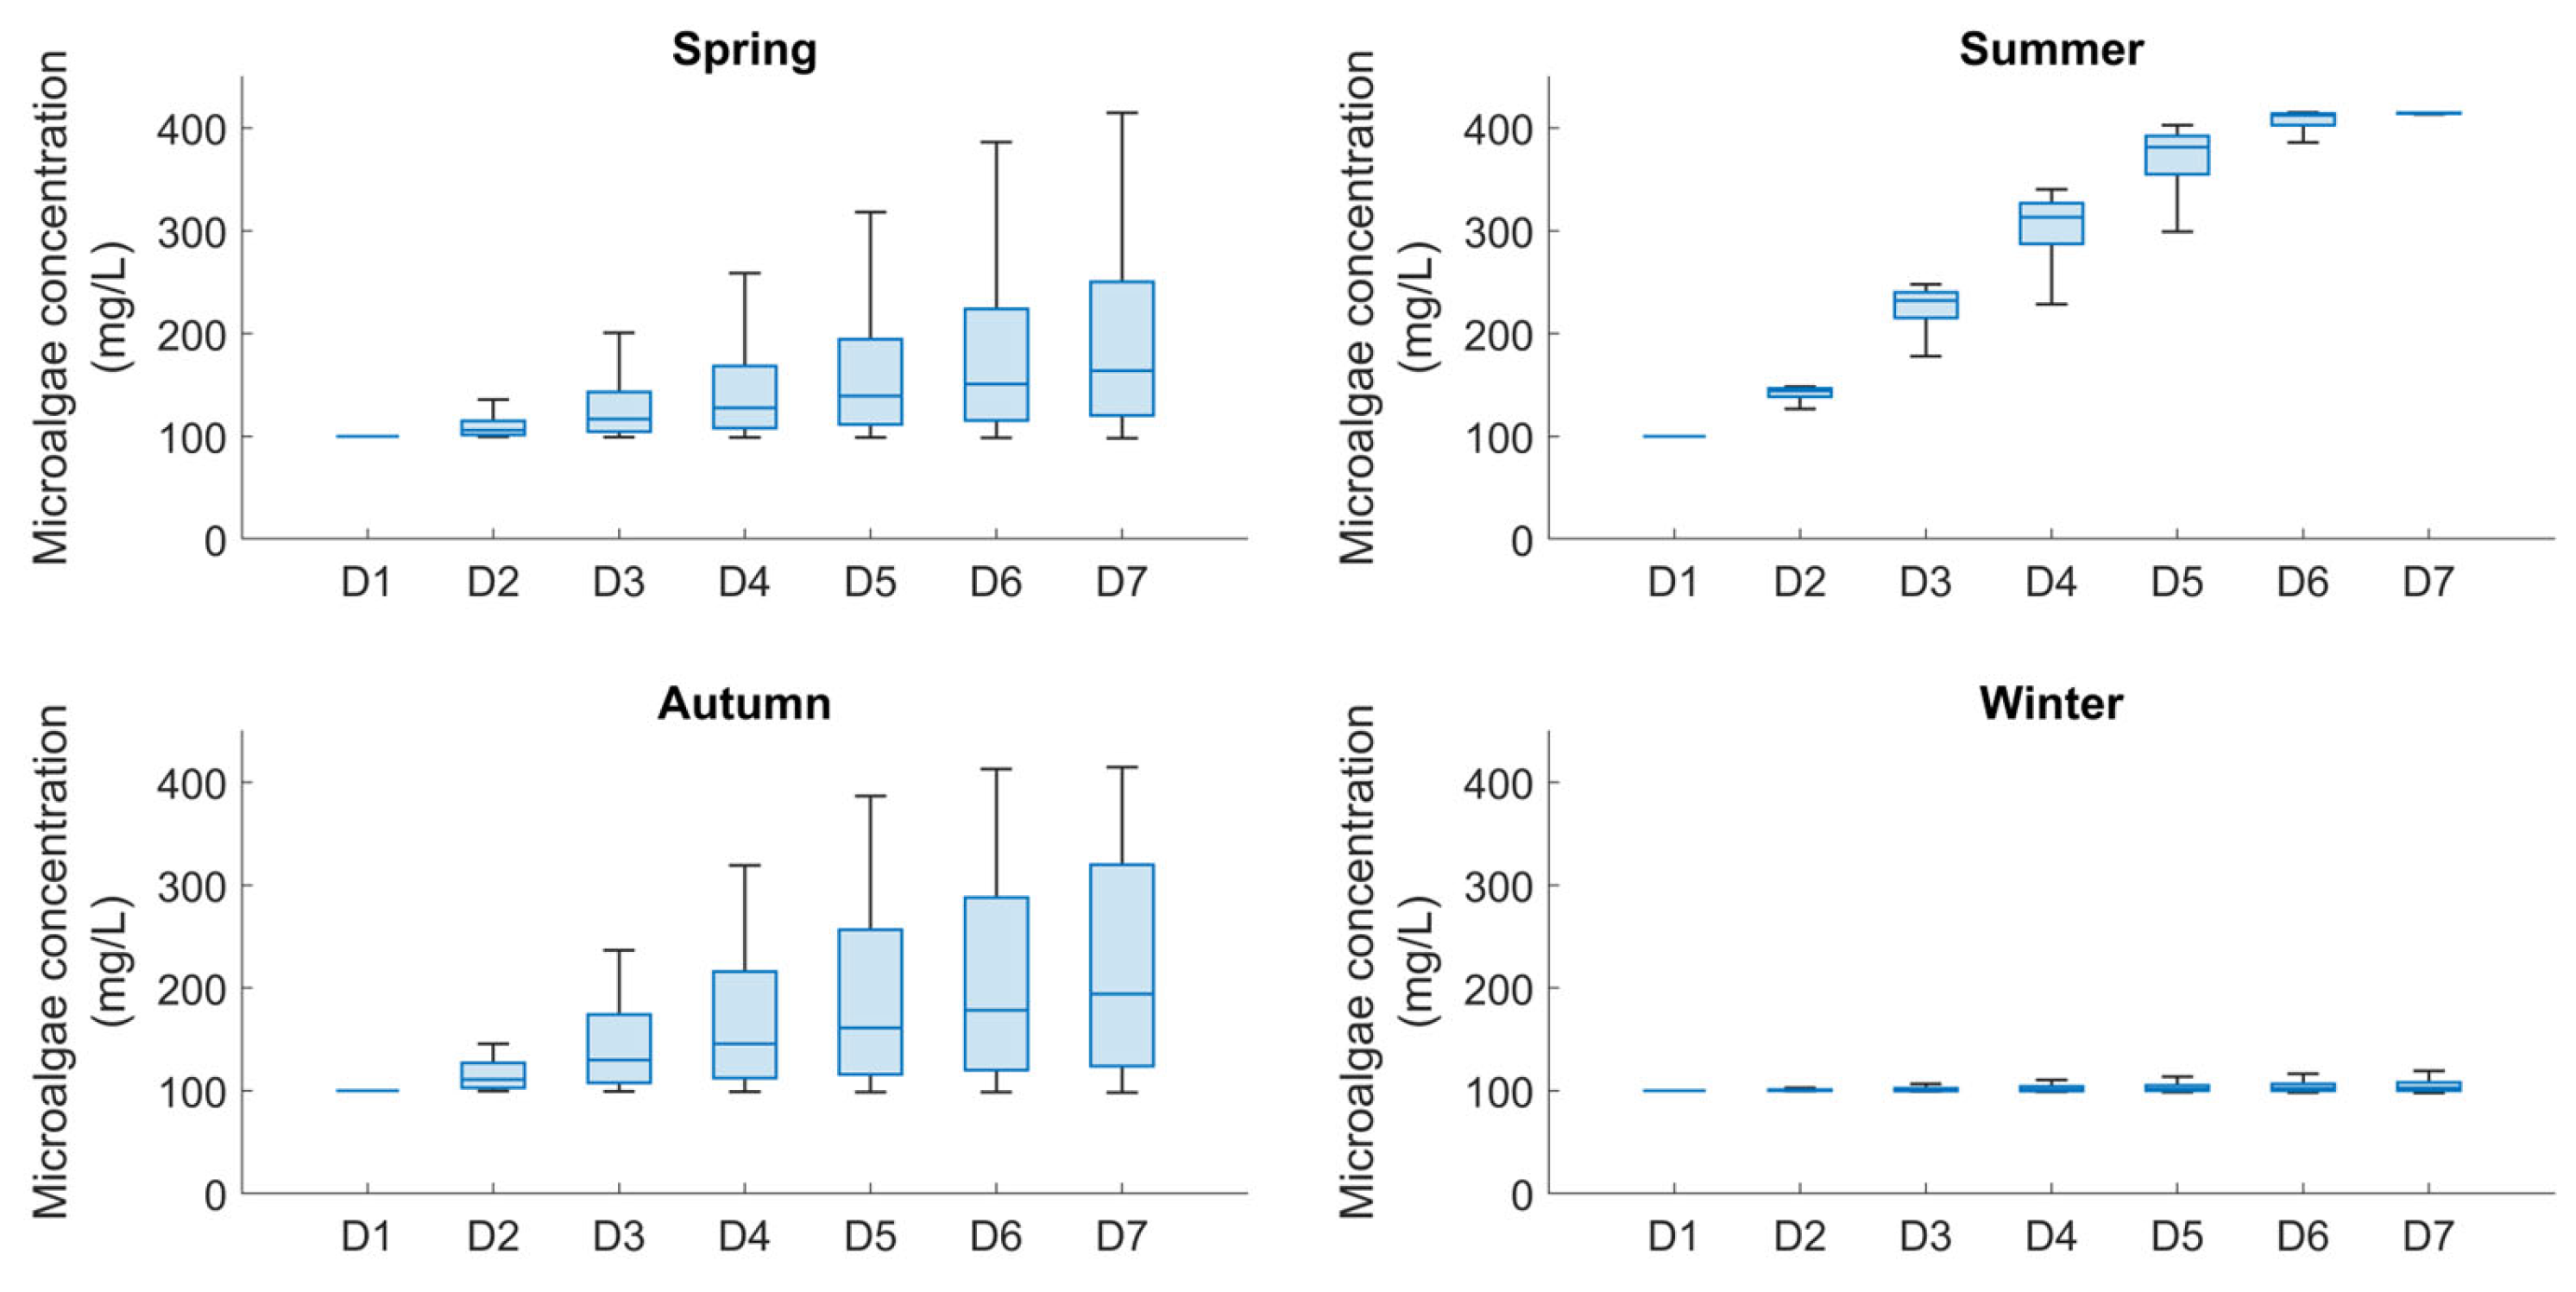
Figure 5 shows four box plots for the different seasons, grouping the daily average biomass concentrations obtained from the simulation by day. This allows to evaluate the ranges within which daily biomass production is recorded. It can be observed that the results are almost similar in spring and autumn with more spread boxes between 25th and 75th percentiles for the latter. On the other hand, daily production is less dispersed during summer and winter, clearly showing optimal performance during summer and negligible production levels during winter.
4. Conclusions
In this article we present a plant growth/productivity simulation and assessment methodology adaptable to all types of crops.
The application of this methodology using long-term meteorological data sets makes it possible to identify the most probable production scenarios, which is of great help in decision-making processes (project feasibility analysis, site selection, planning and management, etc.).
The results obtained for our case study confirm the representativeness of typical meteorological sequences, very close to the 50th percentile, for the use of more complex simulation programs.
Author Contributions
Conceptualization, L.F.Z. and R.X.V.; methodology, L.F.Z., O.W. and A.N.N; software, O.W.; validation, O.W. and L.F.Z.; formal analysis, L.F.Z., O.W. and F.F-C; investigation, O.W., L.F.Z., R.X.V., F.F-C and A.A.N.; resources, R.X.V. and L.F.Z.; data curation, O.W., R.X.V., A.A.N., L.F.Z., and F.F-C.; writing—original draft preparation, O.W., R.X.V., A.A.N., L.F.Z., and F.F-C.; writing—review and editing, O.W., ,R.X.V., A.A.N., L.F.Z., and F.F-C.; visualization, O.W., and A.A.N.; supervision, R.X.V. and L.F.Z.; project administration, R.X.V. and L.F.Z.; funding acquisition, R.X.V. All authors have read and agreed to the published version of the manuscript.
Funding
This research was funded by the Spanish Ministry of Science and Innovation (MCIN/AEI/10.13039/501100011033) and the European Union “Next Generation EU”/PRTR, TEDDY (TED2021-130366B-I00).
Data Availability Statement
Acknowledgments
The authors would like to thank the funding from the Spanish Ministry of Science and Innovation (MCIN/AEI/10.13039/501100011033) and the European Union “Next Generation EU”/PRTR, TEDDY (TED2021-130366B-I00). The authors also acknowledge the CYTED-IberoAmerican Program on Science and Technology for Development (RED RENUWAL P320RT0005 CYTED). O.W. thanks Gdańsk University of Technology in the form of grant (grant DEC-6/1/2022/IDUB/II.1a/Au) under the Aurum Supporting International Research Team Building programme.
Conflicts of Interest
The authors declare that they have no conflict of interest.
References
- Oswald, W.J.; Gotaas, H.B. Photosynthesis in Sewage Treatment. Transactions of the American Society of Civil Engineers 1957, 122, 73–97. [CrossRef]
- García, J.; Green, B.F.; Lundquist, T.; Mujeriego, R.; Hernández-Mariné, M.; Oswald, W.J. Long Term Diurnal Variations in Contaminant Removal in High Rate Ponds Treating Urban Wastewater. Bioresour Technol 2006, 97, 1709–1715. [CrossRef]
- AlMomani, F.A.; Örmeci, B. Performance Of Chlorella Vulgaris, Neochloris Oleoabundans, and Mixed Indigenous Microalgae for Treatment of Primary Effluent, Secondary Effluent and Centrate. Ecol Eng 2016, 95, 280–289. [CrossRef]
- Sacristán de Alva, M.; Luna-Pabello, V.M.; Cadena, E.; Ortíz, E. Green Microalga Scenedesmus Acutus Grown on Municipal Wastewater to Couple Nutrient Removal with Lipid Accumulation for Biodiesel Production. Bioresour Technol 2013, 146, 744–748. [CrossRef]
- Wang, L.; Min, M.; Li, Y.; Chen, P.; Chen, Y.; Liu, Y.; Wang, Y.; Ruan, R. Cultivation of Green Algae Chlorella Sp. in Different Wastewaters from Municipal Wastewater Treatment Plant. Appl Biochem Biotechnol 2010, 162, 1174–1186. [CrossRef]
- Janssen, M. Microalgal Photosynthesis and Growth in Mass Culture. In Advances in Chemical Engineering; Academic Press Inc., 2016; Vol. 48, pp. 185–256 ISBN 9780128036617.
- Ras, M.; Steyer, J.P.; Bernard, O. Temperature Effect on Microalgae: A Crucial Factor for Outdoor Production. Rev Environ Sci Biotechnol 2013, 12, 153–164. [CrossRef]
- Gerotto, C.; Norici, A.; Giordano, M. Toward Enhanced Fixation of CO2 in Aquatic Biomass: Focus on Microalgae. Front Energy Res 2020, 8.
- Buchanan, N.A.; Young, P.; Cromar, N.J.; Fallowfield, H.J. Performance of a High Rate Algal Pond Treating Septic Tank Effluent from a Community Wastewater Management Scheme in Rural South Australia. Algal Res 2018, 35, 325–332. [CrossRef]
- Darvehei, P.; Bahri, P.A.; Moheimani, N.R. Model Development for the Growth of Microalgae: A Review. Renewable and Sustainable Energy Reviews 2018, 97, 233–258.
- Singh, S.P.; Singh, P. Effect of Temperature and Light on the Growth of Algae Species: A Review. Renewable and Sustainable Energy Reviews 2015, 50, 431–444.
- Serra-Maia, R.; Bernard, O.; Gonçalves, A.; Bensalem, S.; Lopes, F. Influence of Temperature on Chlorella Vulgaris Growth and Mortality Rates in a Photobioreactor. Algal Res 2016, 18, 352–359. [CrossRef]
- Arcila, J.S.; Buitrón, G. Influence of Solar Irradiance Levels on the Formation of Microalgae-Bacteria Aggregates for Municipal Wastewater Treatment. Algal Res 2017, 27, 190–197. [CrossRef]
- Bernard, O.; Rémond, B. Validation of a Simple Model Accounting for Light and Temperature Effect on Microalgal Growth. Bioresour Technol 2012, 123, 520–527. [CrossRef]
- Metsoviti, M.N.; Papapolymerou, G.; Karapanagiotidis, I.T.; Katsoulas, N. Effect of Light Intensity and Quality on Growth Rate and Composition of Chlorella Vulgaris. Plants 2020, 9. [CrossRef]
- Hoyo, Á.; Rodríguez-Miranda, E.; Guzmán, J.L.; Acién, F.G.; Berenguel, M.; Moreno, J.C. A Computer-Based Tool to Simulate Raceway Photobioreactors for Design, Operation and Control Purposes. Comput Chem Eng 2022, 156. [CrossRef]
- Huesemann, M.; Crowe, B.; Waller, P.; Chavis, A.; Hobbs, S.; Edmundson, S.; Wigmosta, M. A Validated Model to Predict Microalgae Growth in Outdoor Pond Cultures Subjected to Fluctuating Light Intensities and Water Temperatures. Algal Res 2016, 13, 195–206. [CrossRef]
- Díez-Montero, R.; Belohlav, V.; Ortiz, A.; Uggetti, E.; García-Galán, M.J.; García, J. Evaluation of Daily and Seasonal Variations in a Semi-Closed Photobioreactor for Microalgae-Based Bioremediation of Agricultural Runoff at Full-Scale. Algal Res 2020, 47. [CrossRef]
- Wane, O.; Zarzalejo, L.F.; Ferrera-Cobos, F.; Navarro, A.A.; Rodríguez-López, A.; Valenzuela, R.X. Generation of Typical Meteorological Sequences to Simulate Growth and Production of Biological Systems. Applied Sciences (Switzerland) 2023, 13. [CrossRef]
- Dobos, A.; Gilman, P.; Kasberg, M. P50/P90 Analysis for Solar Energy Systems Using the System Advisor Model Preprint; Denver, Colorado, 2012;
- Fernández Peruchena, C.M.; Ramírez, L.; Silva-Pérez, M.A.; Lara, V.; Bermejo, D.; Gastón, M.; Moreno-Tejera, S.; Pulgar, J.; Liria, J.; Macías, S.; et al. A Statistical Characterization of the Long-Term Solar Resource: Towards Risk Assessment for Solar Power Projects. Solar Energy 2016, 123, 29–39. [CrossRef]
- Fernández-Peruchena, C.M.; Vignola, F.; Gastón, M.; Lara-Fanego, V.; Ramírez, L.; Zarzalejo, L.; Silva, M.; Pavón, M.; Moreno, S.; Bermejo, D.; et al. Probabilistic Assessment of Concentrated Solar Power Plants Yield: The EVA Methodology. Renewable and Sustainable Energy Reviews 2018, 91, 802–811. [CrossRef]
- Hongyang, S.; Yalei, Z.; Chunmin, Z.; Xuefei, Z.; Jinpeng, L. Cultivation of Chlorella Pyrenoidosa in Soybean Processing Wastewater. Bioresour Technol 2011, 102, 9884–9890. [CrossRef]
- Zou, G.; Liu, Y.; Zhang, Q.; Zhou, T.; Xiang, S.; Gu, Z.; Huang, Q.; Yan, H.; Zheng, H.; Wu, X.; et al. Cultivation of Chlorella Vulgaris in a Light-Receiving-Plate (LRP)-Enhanced Raceway Pond for Ammonium and Phosphorus Removal from Pretreated Pig Urine. Energies (Basel) 2020, 13. [CrossRef]
- Behera, B.; Aly, N.; Balasubramanian, P. Biophysical Modeling of Microalgal Cultivation in Open Ponds. Ecol Modell 2018, 388, 61–71. [CrossRef]
- Ali, H.; Park, C.W. Numerical Multiphase Modeling of CO2 Absorption and Desorption in Microalgal Raceway Ponds to Improve Their Carbonation Efficiency. Energy 2017, 127, 358–371. [CrossRef]
- Eze, V.C.; Velasquez-Orta, S.B.; Hernández-García, A.; Monje-Ramírez, I.; Orta-Ledesma, M.T. Kinetic Modelling of Microalgae Cultivation for Wastewater Treatment and Carbon Dioxide Sequestration. Algal Res 2018, 32, 131–141. [CrossRef]
- Aiba, S. Growth Kinetics of Photosynthetic Microorganisms. In Proceedings of the Microbial Reactions; Springer Berlin Heidelberg: Berlin, Heidelberg, 1982; pp. 85–156.
- Schirmer, M.; Posten, C. Modeling of Microalgae Bioprocesses. In Advances in Chemical Engineering; Academic Press Inc., 2016; Vol. 48, pp. 151–184 ISBN 9780128036617.
- Rosso, L.; Lobry, J.R.; Flandrois, J.P. An Unexpected Correlation between Cardinal Temperatures of Microbial Growth Highlighted by a New Model. J Theor Biol 1993, 162, 447–463. [CrossRef]
- Shoener, B.D.; Schramm, S.M.; Béline, F.; Bernard, O.; Martínez, C.; Plósz, B.G.; Snowling, S.; Steyer, J.P.; Valverde-Pérez, B.; Wágner, D.; et al. Microalgae and Cyanobacteria Modeling in Water Resource Recovery Facilities: A Critical Review. Water Res X 2019, 2.
- García-Malea, M.C.; Acién, F.G.; Fernández, J.M.; Cerón, M.C.; Molina, E. Continuous Production of Green Cells of Haematococcus Pluvialis: Modeling of the Irradiance Effect. Enzyme Microb Technol 2006, 38, 981–989. [CrossRef]
- Pawłowski, A.; Guzmán, J.L.; Berenguel, M.; Acíen, F.G.; Dormido, S. Application of Predictive Feedforward Compensator to Microalgae Production in a Raceway Reactor: A Simulation Study. Energies (Basel) 2018, 11. [CrossRef]
- Kamarianakis, Y.; Ayuso, S.V.; Rodríguez, E.C.; Velasco, M.T. Water Temperature Forecasting for Spanish Rivers by Means of Nonlinear Mixed Models. J Hydrol Reg Stud 2016, 5, 226–243. [CrossRef]
- Mathworks Why Use MATLAB and Simulink | FPGA Design with MATLAB, Part 1.
- Aleya, L.; Dauta, A.; Reynolds, C.S. Endogenous Regulation of the Growth-Rate Responses of a Spring-Dwelling Strain of the Freshwater Alga, Chlorella Minutissima, to Light and Temperature. Eur J Protistol 2011, 47, 239–244. [CrossRef]
- Serra-Maia, R.; Bernard, O.; Gonçalves, A.; Bensalem, S.; Lopes, F. Influence of Temperature on Chlorella Vulgaris Growth and Mortality Rates in a Photobioreactor. Algal Res 2016, 18, 352–359. [CrossRef]
- Pires, J.C.M.; Gonçalves, A.L.; Martins, F.G.; Alvim-Ferraz, M.C.M.; Simões, M. Effect of Light Supply on CO2 Capture from Atmosphere by Chlorella Vulgaris and Pseudokirchneriella Subcapitata. Mitig Adapt Strateg Glob Chang 2014, 19, 1109–1117. [CrossRef]
- Shaw, A.; Takács, I.; Pagilla, K.R.; Murthy, S. A New Approach to Assess the Dependency of Extant Half-Saturation Coefficients on Maximum Process Rates and Estimate Intrinsic Coefficients. Water Res 2013, 47, 5986–5994. [CrossRef]
- Ajala, S.O.; Alexander, M.L. Assessment of Chlorella Vulgaris, Scenedesmus Obliquus, and Oocystis Minuta for Removal of Sulfate, Nitrate, and Phosphate in Wastewater. International Journal of Energy and Environmental Engineering 2020, 11, 311–326. [CrossRef]
|
Disclaimer/Publisher’s Note: The statements, opinions and data contained in all publications are solely those of the individual author(s) and contributor(s) and not of MDPI and/or the editor(s). MDPI and/or the editor(s) disclaim responsibility for any injury to people or property resulting from any ideas, methods, instructions or products referred to in the content. |
© 2024 by the authors. Licensee MDPI, Basel, Switzerland. This article is an open access article distributed under the terms and conditions of the Creative Commons Attribution (CC BY) license (http://creativecommons.org/licenses/by/4.0/).

