
Submitted:
03 September 2024
Posted:
04 September 2024
You are already at the latest version
Abstract
Minimizing optical losses in resonant cavities is crucial for improving photonic device performance. This study focuses on the development of a simulation tool to analyze scattering losses in Fabry-Pérot interferometers (FPI), offering precise modeling of waveguide dynamics and contributing to accurate loss predictions across various platforms. Optical cavities often suffer from scattering losses due to surface roughness and material defects. Our approach integrates theoretical models and simulations to quantify these losses, utilizing the FPI as a model system. We identified upper and lower reflectivity thresholds, beyond which accurate measurement of losses becomes unreliable. For reflectivity below a certain threshold, measurement errors arise, while excessively high reflectivity can reduce fringe visibility and introduce detector sensitivity issues. Simulations were used to validate the model's ability to predict reflectivity and attenuation in waveguides with varying loss levels. The software’s flexibility to adjust transmission parameters for different cavity configurations enhances its utility for a broad range of photonic systems. Our study offers a novel methodology for optical loss analysis, with practical applications in optimizing photonic devices. By providing a reliable tool for precise loss measurement, this work supports advancements in optical technologies, enabling the design of more efficient, high-performance devices across various applications.
Keywords:
Optical loss measurement
; Fabry-Pérot interferometer
; Waveguide reflectivity
; Scattering losses
; Photonic device optimization
1. Introduction
Integrated photonics leverages light for transporting information and enabling diverse applications on several substrates. The goal is to miniaturize and integrate optical functions and devices onto a unified platform, akin to how electronic circuits are incorporated onto a microchip [1,2]. The primary advantage of integrated optics lies in its capability to manipulate and control light signals on a microscopic scale, resulting in compact and highly efficient optical systems. By embedding various optical components onto a single chip, it becomes feasible to execute complex optical tasks, such as signal generation, modulation, amplification, routing, and detection, within a small and stable platform [3].
Silicon photonics, a dominant technology in this field, allows for seamless integration and fabrication within standard electronics foundries [4,5,6]. On the other hand, advances in glass waveguide fabrication technologies, such as femtosecond laser writing, offer promising alternatives. This technique employs ultrafast laser pulses to inscribe waveguides directly into glass substrates, providing precise control over the waveguide's geometry and properties [7,8,9]. By utilizing femtosecond laser writing, it is possible to create complex, three-dimensional photonic circuits that can be used in various applications, enhancing the versatility and performance of photonic devices. Numerous platforms exist for fabricating waveguides, including polymers, crystals, and others, each offering distinct characteristics that make them suitable for specific applications. Polymers, for example, are known for their flexibility and ease of processing, making them ideal for applications requiring large-scale or flexible photonic devices [10]. Crystals, conversely, often provide superior optical properties such as low loss and high nonlinearity, which are crucial for high-precision applications like nonlinear optics and high-power lasers [11]. Each material platform comes with its own set of advantages and disadvantages, necessitating careful selection based on the specific requirements and constraints of the intended application [2,12].
Independent of the technology, waveguides that confine and direct guided modes are central to the functionality of photonic devices. From a platform-based photonic design perspective, the propagation loss coefficient is essential in balancing device performance and physical footprint. Accurate measurement of these losses is, therefore, critical [13,14,15,16]. Consequently, developing a comprehensive model to describe the losses occurring in waveguides, regardless of the platform, is essential for the targeted and efficient design of integrated photonic devices. Our model, based on the Fabry-Pérot (FP) technique, embeds both material absorption and scattering due to surface roughness into a single loss factor. This approach involves forming an optical cavity with the waveguide, allowing for the encapsulation of all loss mechanisms within the cavity's behavior. Understanding this combined loss factor enables engineers and researchers to optimize waveguide geometries and material choices, thereby enhancing device performance. Moreover, an accurate loss model is crucial for predicting the overall efficiency and reliability of photonic circuits, facilitating the integration of complex optical functions on a single chip. This predictive capability is indispensable for advancing photonic technologies and expanding their applications in communications, sensing, and computation.
Previous studies have suggested that measuring waveguide losses in glass is challenging due to its very low reflectivity, which impedes reliable loss assessment [17]. However, in a prior work, we demonstrated that this limitation can be overcome by applying a removable high reflective coating (~0.40 reflectivity) to the waveguide facets [7]. This innovation enabled accurate loss measurements in glass waveguides using FP technique, and our results showed a strong agreement with theoretical predictions. Building upon these results, the current study introduces advanced simulations developed using our purpose-built software. The simulations are designed to estimate propagation losses based on facet reflectivity, allowing us to explore waveguide performance across different material platforms, including low, medium and high reflectivity materials. By adjusting the reflectivity, we demonstrate how varying loss factors impact waveguide efficiency and functionality.
Our findings indicate that with appropriate modifications, such as the application of reflective coatings, accurate loss measurements can be achieved across a range of materials. This work not only validates the feasibility of loss measurements in glass but also extends the methodology to other platforms, providing a versatile tool for the design and optimization of integrated photonic devices.
2. Losses in a Waveguide
Waveguide losses can be categorized into three primary components [18]. Firstly, absorption losses arise from the intrinsic properties of the waveguide material itself, where the material absorbs some of the propagating light. Secondly, the finite number of bound modes in the waveguide allows for the existence of a continuum of radiative modes. Surface roughness acts as a perturbative element that couples these guided modes with radiative modes, leading to scattering losses. This scattering effect occurs due to imperfections on the waveguide surface, causing some of the light to scatter out of the guided modes into radiative modes. Thirdly, surface roughness can also induce backscattering within the guided mode, where the light is scattered in the reverse direction. However, material absorption losses are generally smaller compared to scattering losses caused by surface roughness, and, consequently, they are frequently regarded as negligible in many practical scenarios. [19,20].
In our method, based on Fabry-Perot technique, all contributions to propagation losses are encapsulated into a single factor (attenuation coefficient). This approach simplifies the loss characterization process while enhancing the robustness and accuracy of our simulations. By integrating these loss mechanisms into a unified model, we can more effectively predict and optimize waveguide performance across various platforms. This not only streamlines the design process but also enhances the capability to simulate and mitigate losses in integrated photonic devices.
3. The Fabry-Perot (FP) Technique
Waveguide low-loss evaluation can be effectively performed using the FP technique, which was initially applied to the lithium niobate ( ) systems [21,22]. This technique offers significant advantages, such as independence from optical coupling and the ability to produce rapid results without altering the physical properties of the sample during testing. The simplicity and non-destructive nature of this method make it particularly appealing for practical applications. However, the accuracy of this method is constrained by the precision with which the modal facet reflectivity is known, as this parameter is critical for accurate measurements [23].
The planar phase front of a guided mode allows the transmission characteristics of a waveguide to be treated similarly to those of a Fabry-Perot resonator under the plane-wave approximation [24]. This hypothesis simplifies the analysis, enabling the use of established resonator theory to evaluate waveguide performance. Specifically, in a single-mode waveguide with a monochromatic input, the transmission can be described by the Airy function, which characterizes the resonant behavior of the waveguide, providing a clear framework for understanding and quantifying losses:
where the coupling efficiency, the waveguide length, is the modal attenuation coefficient, the reflectivity (transmission) of the two facets (supposed to be equal), and is the combined loss-reflection factor. As in [24], is a periodic function of the round-trip dephasing , with the free-space wave vector and the mode effective index. By adjusting the input wavelength or altering the effective index (such as through changes in sample temperature), the transmission oscillates between its maximum and minimum values, which are solely dependent on the reflectivity . This variation in transmission can be observed by measuring the contrast of the transmission fringes as:
The reflectivity can be determined using the following relation:
Given the known modal reflectivity of the facet, the attenuation coefficient can be computed using the following formula:
For single-mode, weakly confining waveguides (as, for example, , or annealed waveguides), the Fresnel formula provides a good approximation for the reflectivity as:
due to the guided mode's small numerical aperture. This method typically achieves high accuracy in measuring the attenuation coefficient, often better than 0.1 dB/cm.
Reflectivity can be modified by applying high-reflectivity (HRC) or anti-reflection (ARC) coatings to the end facets. Using HRC at the waveguide's end facets reduces interference from additional Fabry-Pérot cavities in the measurement setup. This interference can introduce modulations in the measured across the wavelength range, complicating the determination of the contrast K from the sample being tested, as shown in [7].
4. Analysis
As mentioned before, different systems employ a variety of techniques to measure optical losses, and in cases such as transparent polymers with low reflectivity, the method presented in this study could offer substantial advantages. However, prior to applying the HRC to the facets of these materials, it is crucial to determine the minimum reflectivity required for accurate attenuation coefficient measurements.
To address this, we developed a Python-based simulator that integrates scientific and graphical packages to model the required reflectivity, based on typical material losses. The simulator is based on the transfer-matrix method (TMM) in optical cavities, it is analytical and scalable [25]. This tool facilitates precise simulations, allowing us to identify the optimal reflectivity necessary for accurate loss measurements. This approach not only improves the reliability of the measurement process but also broadens its applicability across a wider range of material systems.
In a typical characterization setup, the primary components include a fiber at the injection side (see Figure 1 (a)), the sample positioned centrally (see Figure 1 (b)), and either a fiber or a lens at the collection side (see Figure 1 (c) and (d)). Utilizing a lens for light collection enhances the efficiency of the characterization process, particularly when dealing with multiple waveguides on the same sample. Switching between waveguides is facilitated by transitioning to visible light and verifying alignment on a whiteboard after the lens, which ensures accurate light injection. This setup involves four interfaces and three optical cavities.
In the subsequent simulation, we analyze the overall transmission across four scenarios where the sample is inscribed within a glass matrix using a femtosecond laser. Figure 2 depicts scenarios with a single cavity (the sample, 2.24 cm in length and 5% reflectivity at both facets, black line), two cavities (the cleaved injection fiber with a micro-scale focal distance, 5% reflectivity and the sample, blue line), and three cavities (the fiber, the sample, and a BK7 lens with a 1.8 cm focal length) both without (red line) and with waveguide losses (, magenta line).
The third cavity, formed between the back facet of the sample and the collecting lens, significantly affects the observed fringe pattern. This additional interference distorts the visibility of the fringes, introducing unwanted modulations in the measurement spectrum, which reduce the contrast necessary to accurately assess the waveguide’s performance. As a result, the visibility of the fringes is compromised, and it becomes increasingly difficult to obtain a precise estimate of the optical losses within the waveguide. This interference can obscure important details about the attenuation, making it challenging to isolate the FP fringes associated with the sample from those introduced by the external cavity. Such disturbances lead to inaccuracies in loss measurement, particularly when trying to apply standard methods for determining the attenuation coefficient. Therefore, minimizing or mitigating the effects of this third cavity is crucial to ensuring the reliability and precision of the loss measurements.
Technological advancements in the optical component market now offer solutions to mitigate these issues. To maintain the described setup configuration, it is possible to purchase lenses with anti-reflection coatings (see Figure 1d), which could significantly reduce the influence of the third cavity [26].
Figure 3-2 (blue line) demonstrates how the previous configuration (fiber, sample, and lens) with lossy waveguide could benefit from applying an anti-reflection coating (ARC) to the collecting lens. Despite this, the fringe pattern remains affected by interference between the second and third cavities, which complicates the accurate estimation of visibility—a crucial factor for calculating sample losses, as detailed in the previous paragraph.
To enhance visibility for a more precise loss estimation in the waveguide, we proposed an additional technological step. By using our simulation software, we provide a method to determine the optimal minimal High Reflectivity Coating (HRC) to be deposited on the sample's end facets. This approach strengthens the contribution of the second cavity, effectively amplifying its role in the interference pattern and, as a result, improving the overall accuracy of the measurement.
The results from the simulations are summarized in Figure 4. As shown, we present the outcomes for two different loss levels — 0.3 cm−1 and 0.5 cm−1 — depicted in panels (a) and (b), respectively, as a function of the reflectivity of the device faces. The simulation indicates that higher losses correspond, as expected, to reduced visibility, as observed in the color map.
5. Discussion
As the losses increase, the constraints on the HRC that can be applied to the device also become more stringent. While it might seem logical to assume that increasing HRC would consistently improve the accuracy of attenuation coefficient measurements in waveguides- especially when aiming for nearly perfect reflectivity values such as 99.99% - our simulations revealed a more complex reality. We found that there is a critical threshold to the HRC that can be effectively applied, beyond which further increases in reflectivity not only fail to enhance accuracy but can hinder the measurement process. This threshold becomes particularly important in high-loss systems, where exceeding the optimal reflectivity point results in a significant reduction in fringe visibility. Thus, instead of achieving better precision, excessive reflectivity creates conditions where the measurement's reliability is compromised by detector limitations and noise, ultimately degrading the quality of the data. These findings suggest the importance of carefully balancing HRC values to match the specific loss characteristics of the waveguide material being tested, rather than assuming that higher reflectivity universally leads to better outcomes. For instance, as shown in Figure 4, visibility for waveguides with losses of 0.3 cm⁻¹ drops significantly beyond 90% HRC, while for waveguides with losses of 0.5 cm⁻¹, visibility declines sharply after 75% HRC.
Additionally, our findings indicate a lower threshold for the HRC, which is also intricately linked to the inherent losses within the waveguide. This emphasizes the importance of finding the right balance between achieving the desired reflectivity and managing the associated uncertainty. Figure 5a,b illustrate the optimal trade-off between loss measurement and uncertainty, revealing that this balance is highly dependent on the specific loss characteristics of the waveguide. For waveguides with lower losses, convergence occurs more rapidly as the HRC increases, resulting in a corresponding decrease in measurement uncertainty. Conversely, waveguides with higher losses also show convergence as the HRC increases, but at a slightly slower rate and with greater uncertainty.
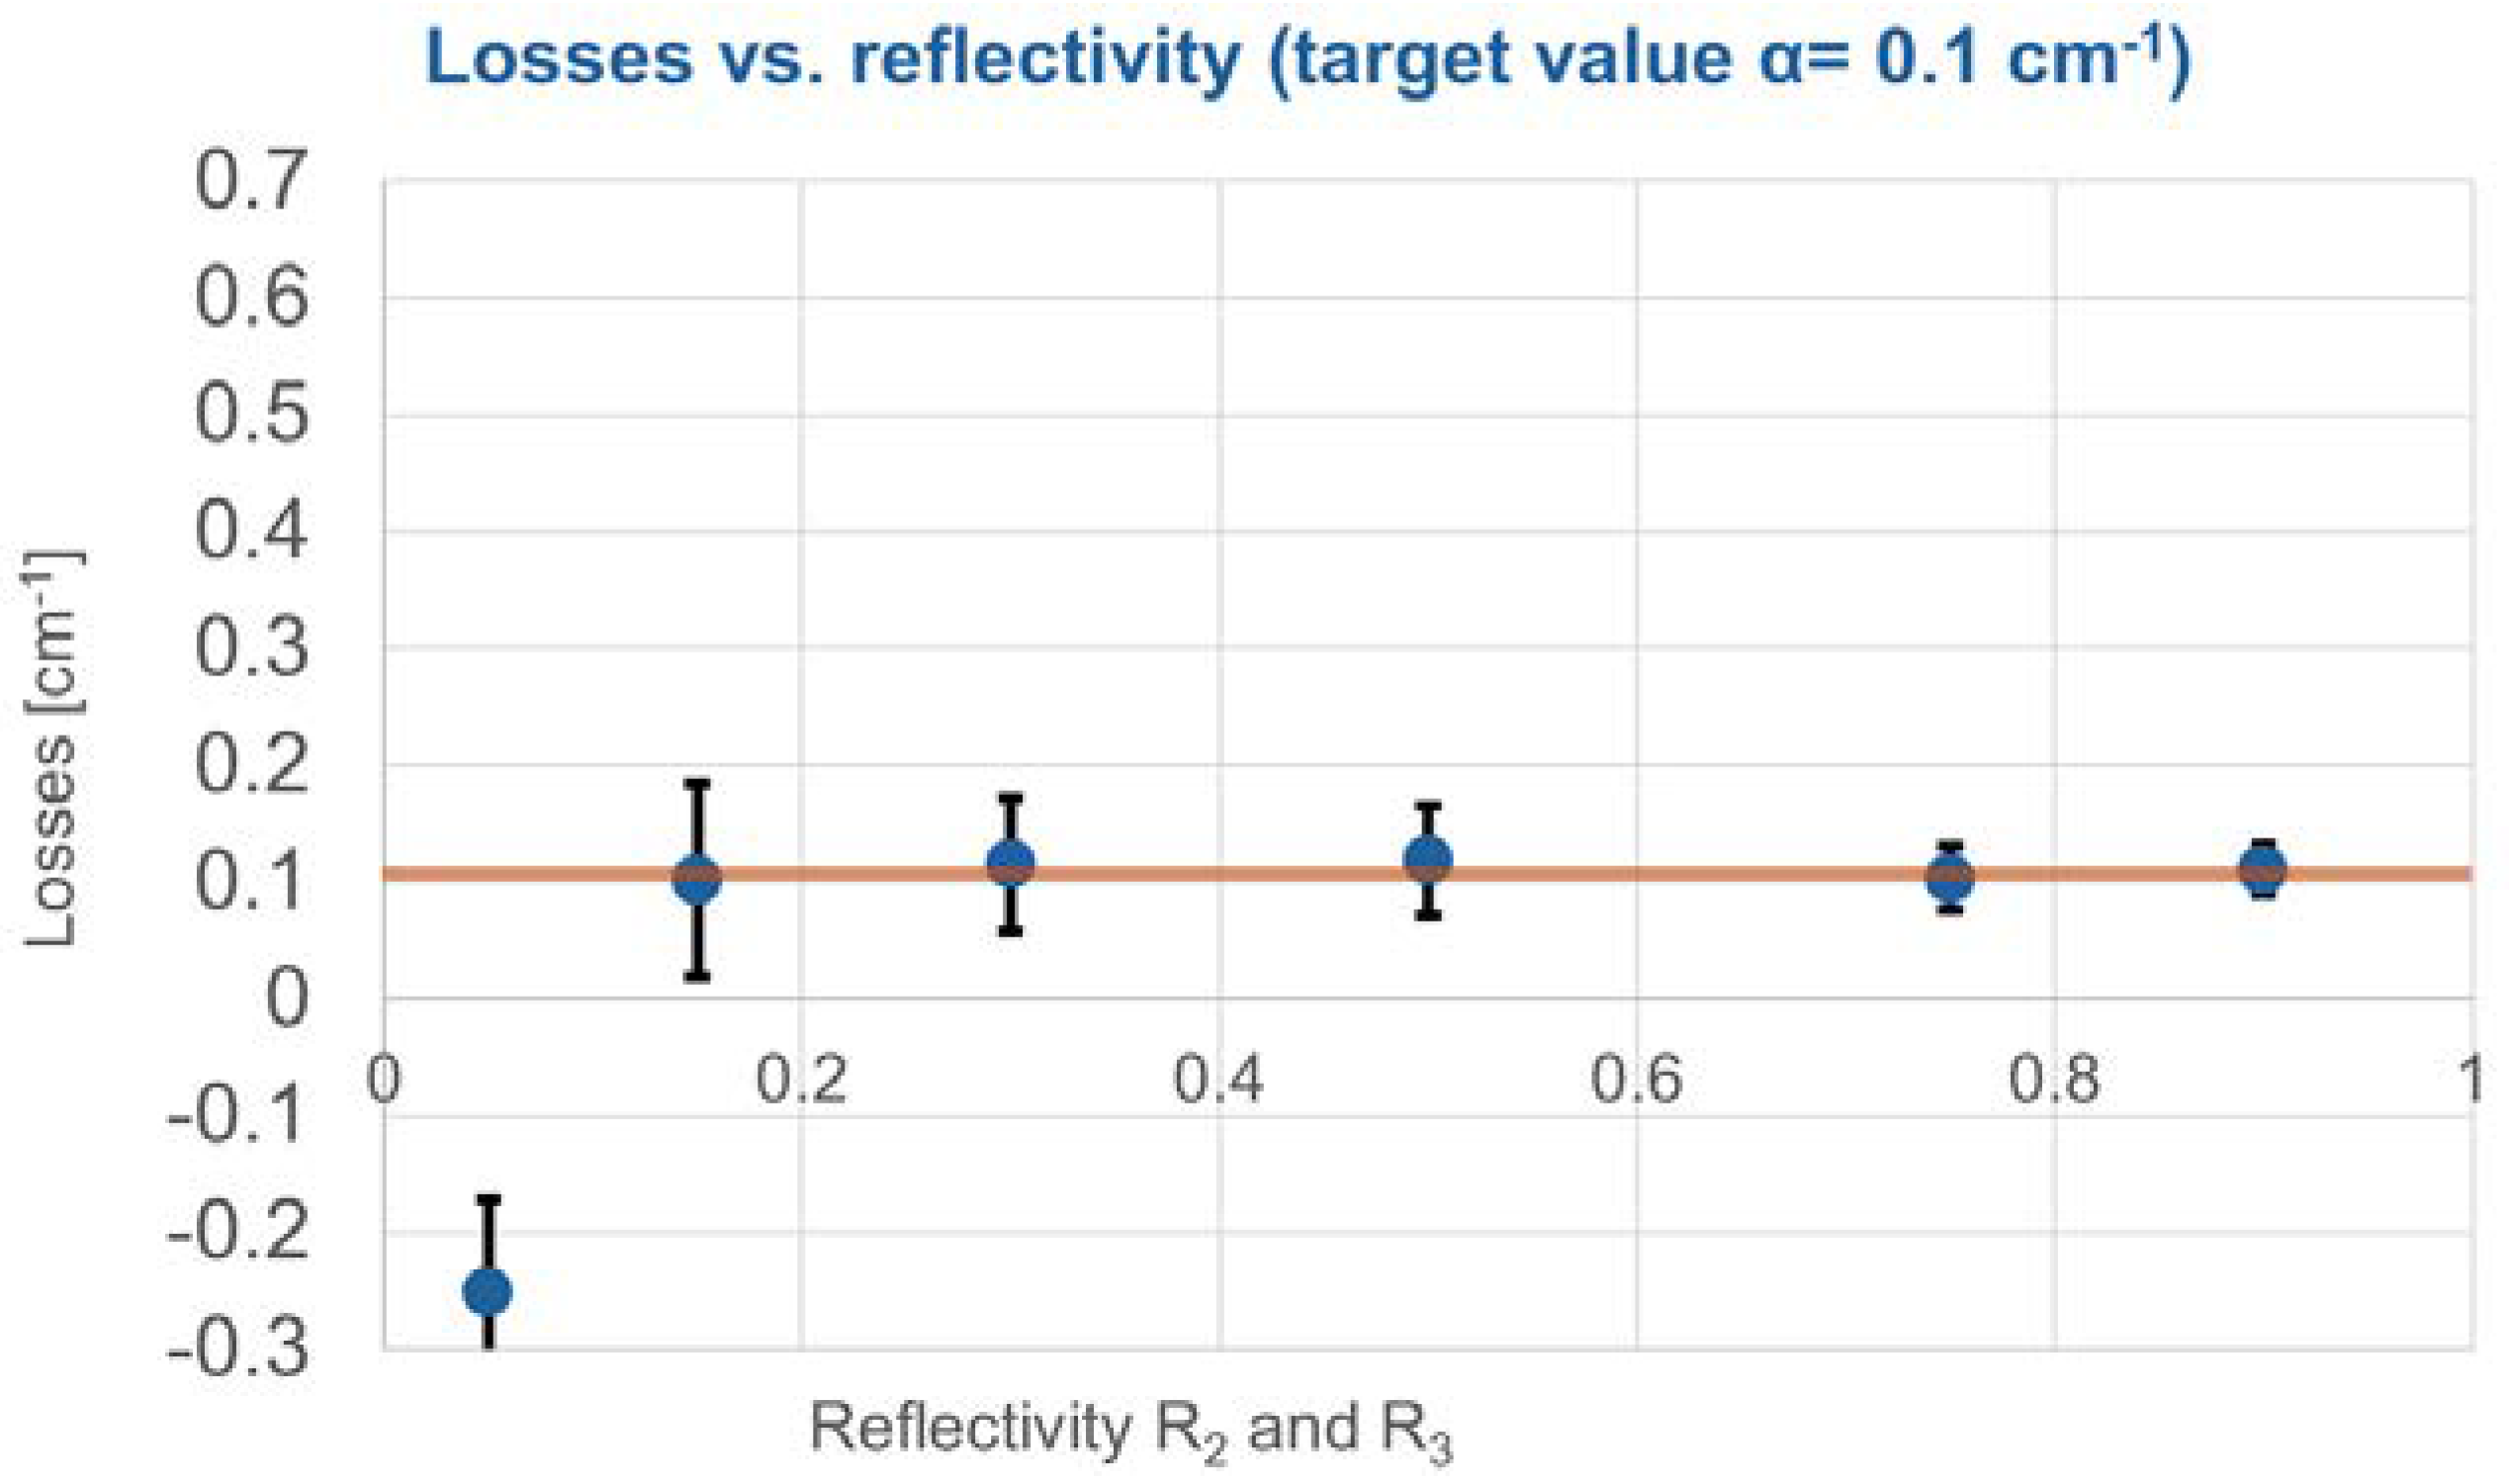
This relationship highlights that while increasing the HRC generally improves measurement accuracy by reducing uncertainty, the extent of this benefit varies depending on the initial loss characteristics of the waveguide. To validate our approach, we conducted a detailed study on a waveguide with 0.1 cm-1 loss (Figure 6).
In this scenario, the visibility of the interference fringes can be detected with an HRC of up to 99%. For a loss level value of 0.1 cm⁻¹, the convergence is faster compared to cases with higher losses, such as 0.3 cm⁻¹ and 0.5 cm⁻¹. However, it is only when the HRC reaches 60% that the uncertainty is reduced to 20% of the target value, reinforcing the importance critical of optimizing the HRC to achieve precise measurements. This optimization is essential to minimize measurement uncertainty and ensure precise loss estimation, as shown in the results of Figure 5.
Additionally, during our study, we observed that for reflectivity below a certain threshold (specifically around 5%), the simulations began to yield negative loss values (particularly for target losses of 0.1 cm-1 and 0.3 cm-1), clearly indicating that such low reflectivity values make it impossible to accurately measure waveguide losses. This is a critical insight, as it shows that for reflectivity below this threshold, the interference
fringes lack the necessary visibility to produce reliable attenuation measurements. Beyond this observation, our simulations further demonstrate that there is a minimum reflectivity limit which is directly tied to the level of loss in the waveguide. This lower limit is crucial, as it highlights that attempting to measure losses with reflectivity below this value leads not only to unreliable data but also to substantial uncertainty in the results. As waveguide losses increase, the reflectivity threshold required to obtain meaningful measurements also rises. This observation stresses the importance of carefully selecting appropriate reflectivity values based on the specific loss characteristics of the material being tested, ensuring that the measurement process remains both accurate and consistent. These findings once again highlight that while higher reflectivity aids in reducing uncertainty, achieving the ideal balance between HRC and waveguide loss characteristics is key to precise measurements.
6. Conclusions
In conclusion, our study provides valuable insights into optimizing waveguide loss measurements by carefully tuning the high-reflectivity coatings (HRC). While earlier studies suggested limitations in measuring losses for low-reflectivity materials, we successfully demonstrated that by applying HRC and using targeted simulations, it is possible to achieve accurate attenuation coefficient measurements even for challenging systems such as glass or transparent polymer waveguides. Through simulations, we established both upper and lower reflectivity thresholds, ensuring optimal visibility and minimized uncertainty across a range of loss values.
Our findings underscore the importance of balancing HRC to suit the specific loss characteristics of the waveguide. Higher reflectivity does not always guarantee better precision, as there are critical thresholds beyond which further increases in HRC introduce more challenges, such as detector sensitivity issues. At the same time, a lower reflectivity bound is essential to avoid excessive measurement uncertainty. The flexibility of our approach extends beyond glass waveguides, showing promise for use with other platforms like polymers and medium-reflectivity materials.
Ultimately, this work presents a practical framework for improving the precision and applicability of loss measurements in integrated photonic devices, contributing to advancements in optical communications, sensing technologies, and photonic system optimization. The potential to apply this method across diverse material platforms makes it a relevant tool for future developments in the field.
Author Contributions
Conceptualization, P.H.D.F. and F.G.; methodology, P.H.D.F. and F.G.; software, D.R.A. and F.G.; validation, D.R.A., F.G., and P.H.D.F.; formal analysis, P.H.D.F. and F.G.; investigation, P.H.D.F. and F.G.; resources, P.H.D.F.; data curation, P.H.D.F.; writing—original draft preparation, P.H.D.F. and F.G.; writing—review and editing, P.H.D.F., F.G., V.T., J.F.R.M., and J.F.F.; visualization, J.F.R.M., P.H.D.F. and F.G.; supervision, P.H.D.F. and F.G. All authors have read and agreed to the published version of the manuscript.
Funding
This research was funded by FAPESP, project nº 2016/21322-4 (PDE) and nº 2013/21569-1 (AUXPE).
Data Availability Statement
The data supporting the findings of this study are available upon request. Interested researchers can contact the corresponding author for access to the datasets generated or analyzed during the study. All data will be provided in accordance with ethical and privacy considerations.
Acknowledgments
The authors would like to express their gratitude to the Physics Department at the Federal University of São Carlos and the Instituto de Física at the Universidade de Brasília (UnB) for their valuable support and resources, which were instrumental in the successful completion of this research.
Conflicts of Interest
The authors declare no conflicts of interest.
References
- L. Eldada and L. W. Shacklette, "Advances in polymer integrated optics," IEEE Journal of Selected Topics in Quantum Electronics 6, 54–68 (2000).
- Butt, M.A. Integrated Optics: Platforms and Fabrication Methods. Encyclopedia 2023, 3, 824–838, . [CrossRef]
- Minzioni, P.; Lacava, C.; Tanabe, T.; Dong, J.; Hu, X.; Csaba, G.; Porod, W.; Singh, G.; E Willner, A.; Almaiman, A.; et al. Roadmap on all-optical processing. J. Opt. 2019, 21, 063001, . [CrossRef]
- Stojanović, V.; Ram, R.J.; Popović, M.; Lin, S.; Moazeni, S.; Wade, M.; Sun, C.; Alloatti, L.; Atabaki, A.; Pavanello, F.; et al. Monolithic silicon-photonic platforms in state-of-the-art CMOS SOI processes [Invited]. Opt. Express 2018, 26, 13106–13121, . [CrossRef]
- L. Chrostowski and M. Hochberg, Silicon Photonics Design: From Devices to Systems (Cambridge University Press, 2015).
- Luan, E.; Shoman, H.; Ratner, D.M.; Cheung, K.C.; Chrostowski, L. Silicon Photonic Biosensors Using Label-Free Detection. Sensors 2018, 18, 3519, . [CrossRef]
- Ferreira, P.H.D.; Tribuzi, V.; Osellame, R.; Ghiglieno, F. Improvement in measuring losses by interferometric technique for glass waveguides produced by femtosecond laser writing. Opt. Commun. 2023, 530, . [CrossRef]
- Sugioka, K.; Cheng, Y. Fabrication of 3D microfluidic structures inside glass by femtosecond laser micromachining. Appl. Phys. A 2013, 114, 215–221, . [CrossRef]
- Blanc, W.; Choi, Y.G.; Zhang, X.; Nalin, M.; Richardson, K.A.; Righini, G.C.; Ferrari, M.; Jha, A.; Massera, J.; Jiang, S.; et al. The past, present and future of photonic glasses: A review in homage to the United Nations International Year of glass 2022. Prog. Mater. Sci. 2023, 134, . [CrossRef]
- S. Park, W. Shou, L. Makatura, W. Matusik, and K. (Kelvin) Fu, "3D printing of polymer composites: Materials, processes, and applications," Matter 5, 43–76 (2022).
- Boyd, Robert W., Nonlinear Optics, 3rd Edition (Academic Press, 2007).
- R. DeCorby, "Glasses for Photonic Integration," in Springer Handbook of Electronic and Photonic Materials, S. Kasap and P. Capper, eds. (Springer US, 2007), pp. 1041–1061.
- Moresco, M.; Romagnoli, M.; Boscolo, S.; Midrio, M.; Cherchi, M.; Hosseini, E.S.; Coolbaugh, D.; Watts, M.R.; Dutt, B. Method for characterization of Si waveguide propagation loss. Opt. Express 2013, 21, 5391–5400, . [CrossRef]
- Okamura, Y.; Yoshinaka, S.; Yamamoto, S. Measuring mode propagation losses of integrated optical waveguides: a simple method. Appl. Opt. 1983, 22, 3892–3894, . [CrossRef]
- M. A. Tran, T. Komljenovic, J. C. Hulme, M. L. Davenport, and J. E. Bowers, "A robust method for characterization of optical waveguides and couplers," in 2016 IEEE Photonics Conference (IPC) (2016), pp. 827–828.
- M. I. Reja, J. Akhtar, M. N. Malik, S. Ahmed, J. Islam, and A. Iqbal, "A comparative analysis of the characterization methods for submicron silicon waveguide propagation loss," in 2015 2nd International Conference on Electrical Information and Communication Technologies (EICT) (2015), pp. 347–352.
- He, Y.; Lu, D.; Zhao, L. Reflection Airy distribution of a Fabry-Pérot resonator and its application in waveguide loss measurement. Opt. Express 2019, 27, 17876–17886, . [CrossRef]
- Hörmann, S.M.; Hinum-Wagner, J.W.; Bergmann, A. An Ab Initio, Fully Coherent, Semi-Analytical Model of Surface-Roughness-Induced Scattering. J. Light. Technol. 2022, 41, 1503–1510, . [CrossRef]
- Payne, F.P.; Lacey, J.P.R. A theoretical analysis of scattering loss from planar optical waveguides. Opt. Quantum Electron. 1994, 26, 977–986, . [CrossRef]
- Melati, D.; Melloni, A.; Morichetti, F. Real photonic waveguides: guiding light through imperfections. Adv. Opt. Photon- 2014, 6, 156–224, . [CrossRef]
- R. Regener and W. Sohler, "Loss in low-finesse Ti:LiNbO3 optical waveguide resonators," Appl. Phys. B 36, 143–147 (1985).
- De Rossi, A.; Ortiz, V.; Calligaro, M.; Lanco, L.; Ducci, S.; Berger, V.; Sagnes, I. Measuring propagation loss in a multimode semiconductor waveguide. J. Appl. Phys. 2005, 97, . [CrossRef]
- Tittelbach, G.; Richter, B.; Karthe, W. Comparison of three transmission methods for integrated optical waveguide propagation loss measurement. Pure Appl. Opt. J. Eur. Opt. Soc. Part A 1993, 2, 683–700, . [CrossRef]
- The Fabry-Perot Interferometer: History, Theory, Practice and Applications," https://www.routledge.com/The-Fabry-Perot-Interferometer-History-Theory-Practice-and-Applications/Vaughan/p/book/9780852741382.
- H. van de Stadt and J. M. Muller, “Multimirror Fabry-Perot interferometers”, J. Opt. Soc. Am. A 2(8), 1985.
- C280TMD-C - Mounted Aspheric Lens, f = 18.4 mm, NA = 0.15, WD = 15.6 mm, ARC: 1050 - 1700 nm (thorlabs.com) Accessed on 30 August 2024.
Figure 1.
(a) the fiber (right) in from of the sample, a waveguide in a glass matrix; (b) the sample, 30 waveguides directly written in a glass matrix with femtosecond pulsed laser; (c) the characterization setup, the fiber, the sample and the collecting lens; (d) the characterization setup, the fiber, the sample and the collecting lens with antireflection coating (ARC).
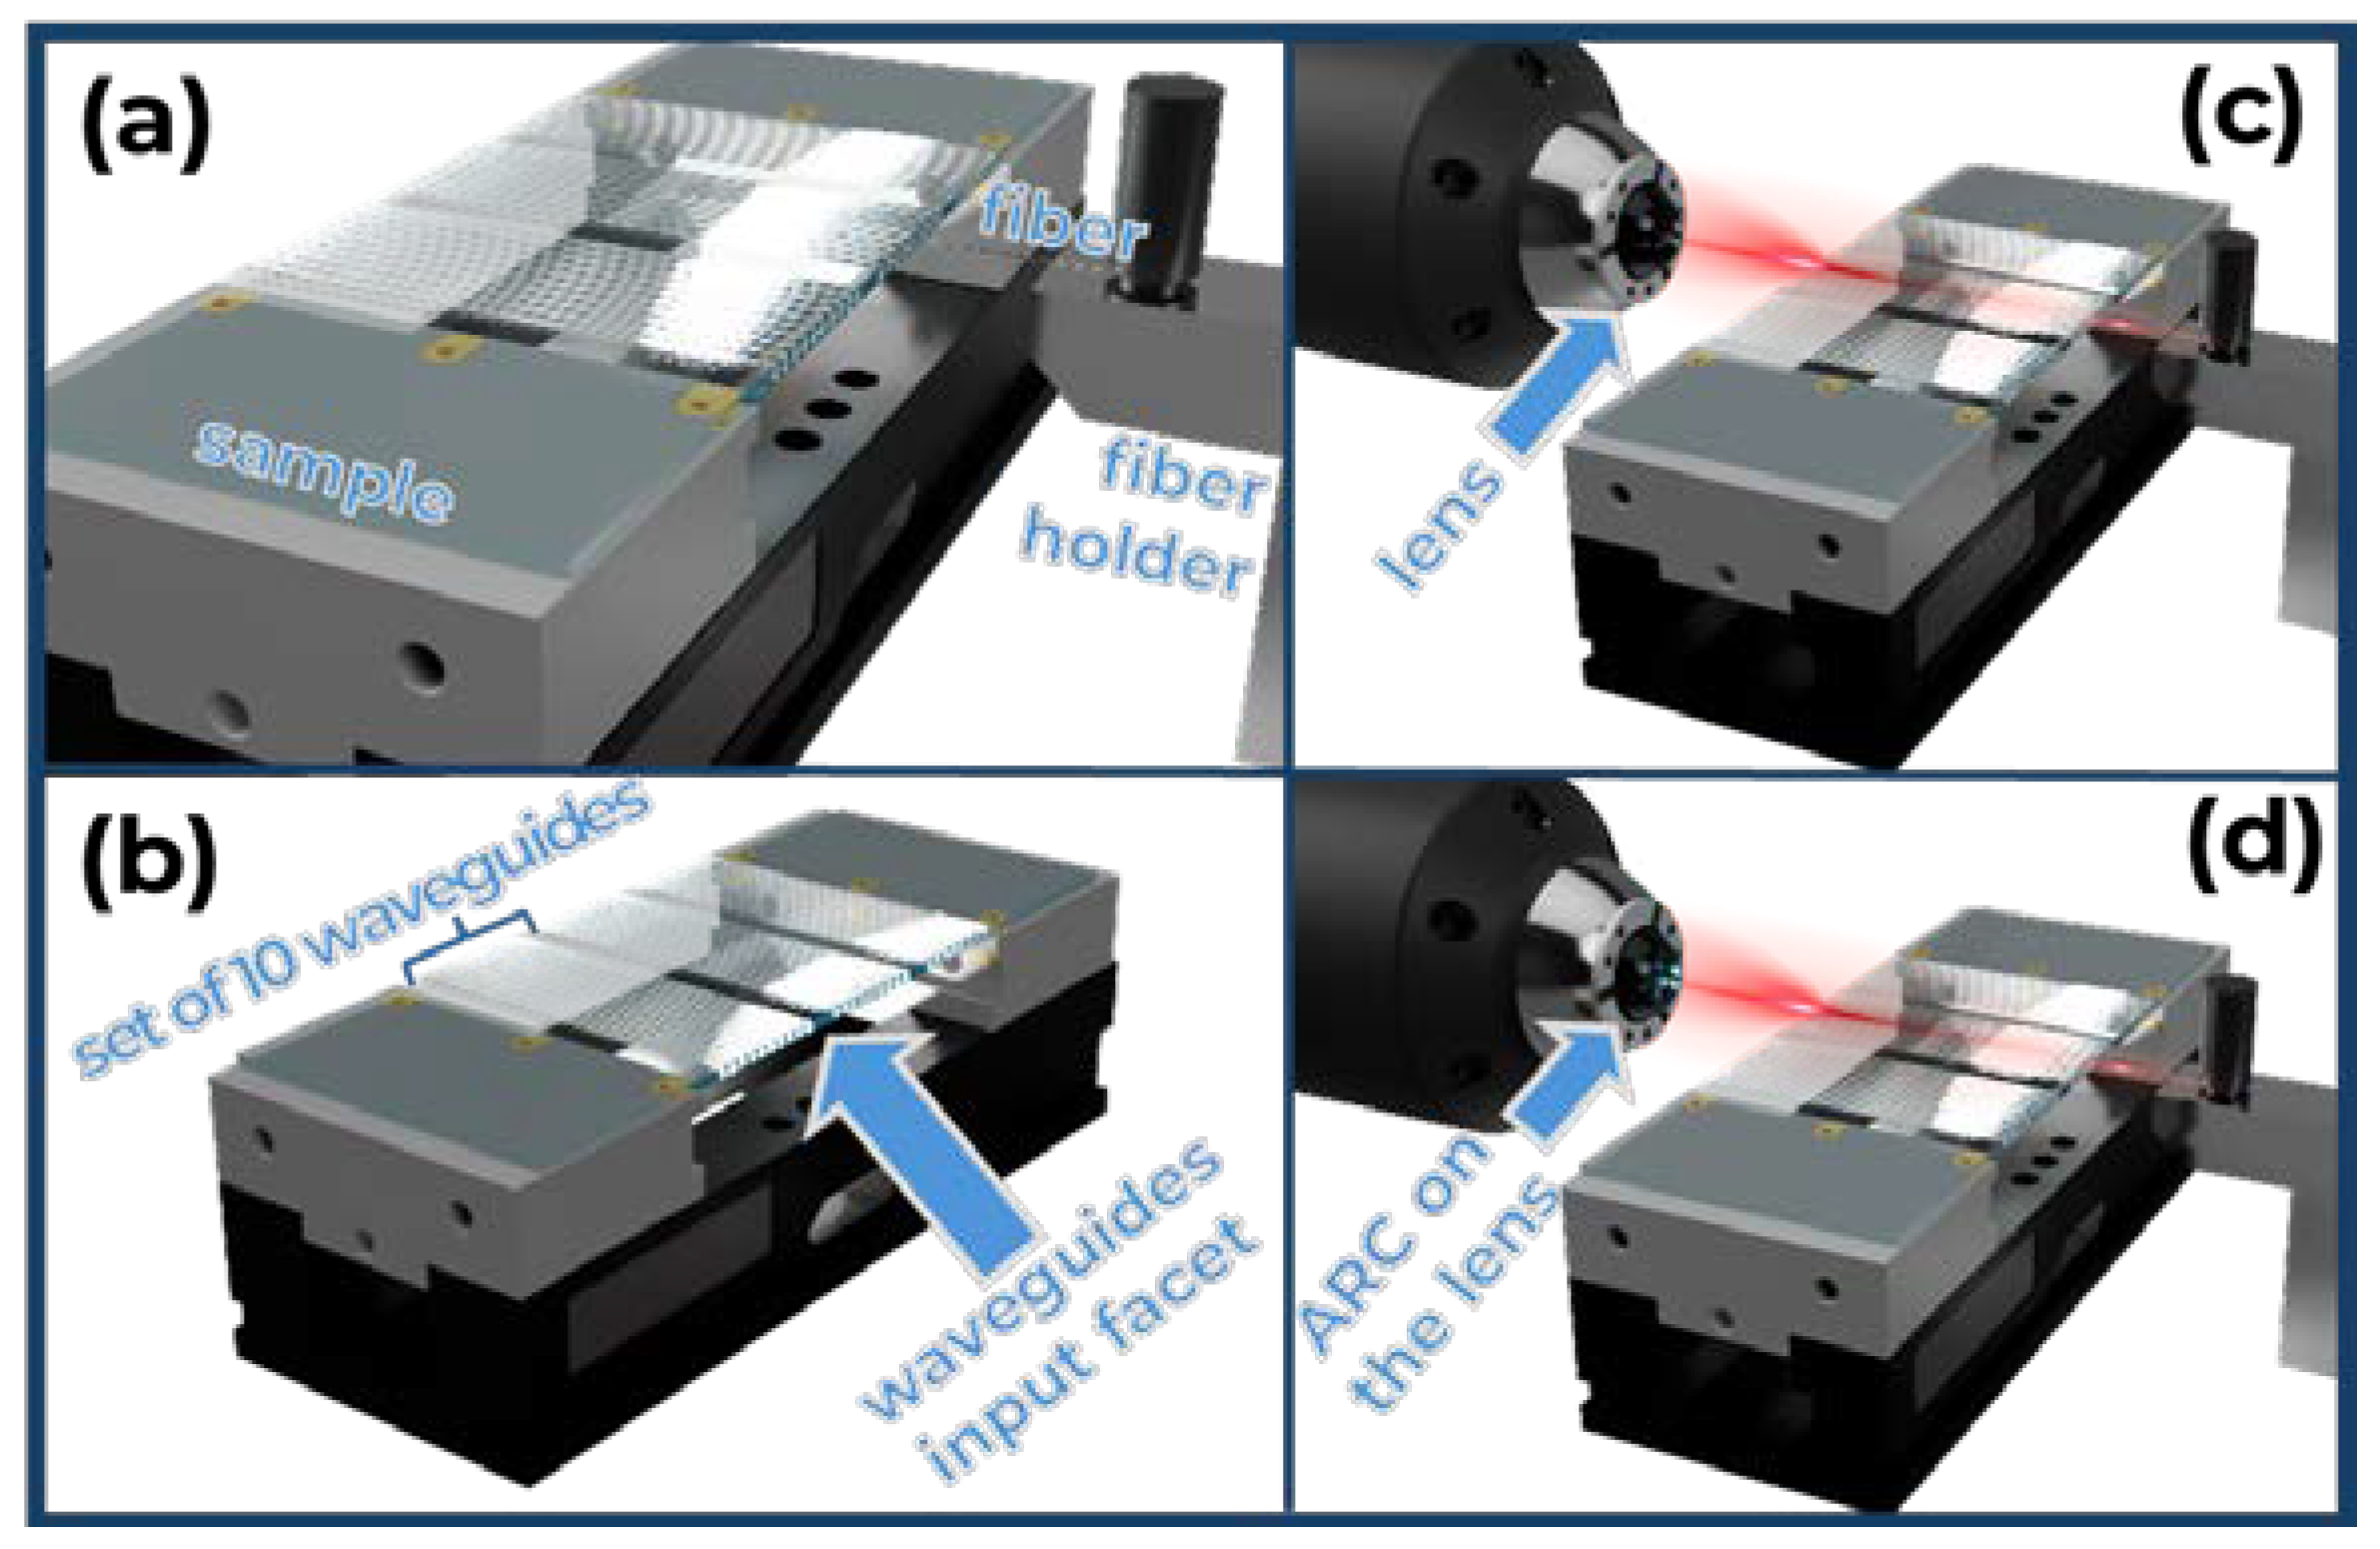
Figure 2.
(1) the Fabry-Perot fringes in transmission when we study the waveguide only (setup configuration in Figure 1 (b)); (2) the Fabry-Perot fringes in transmission when we study the waveguide with the coupling fiber (setup configuration in Figure 1 (a)); (3) the Fabry-Perot fringes in transmission when we study the waveguide with the coupling fiber and the collecting lens without losses in the sample (setup configuration in Figure 1 (c)); (4) the Fabry-Perot fringes in transmission when we study the waveguide with the coupling fiber and the collecting lens with losses in the sample (setup configuration in Figure 1 (c)).
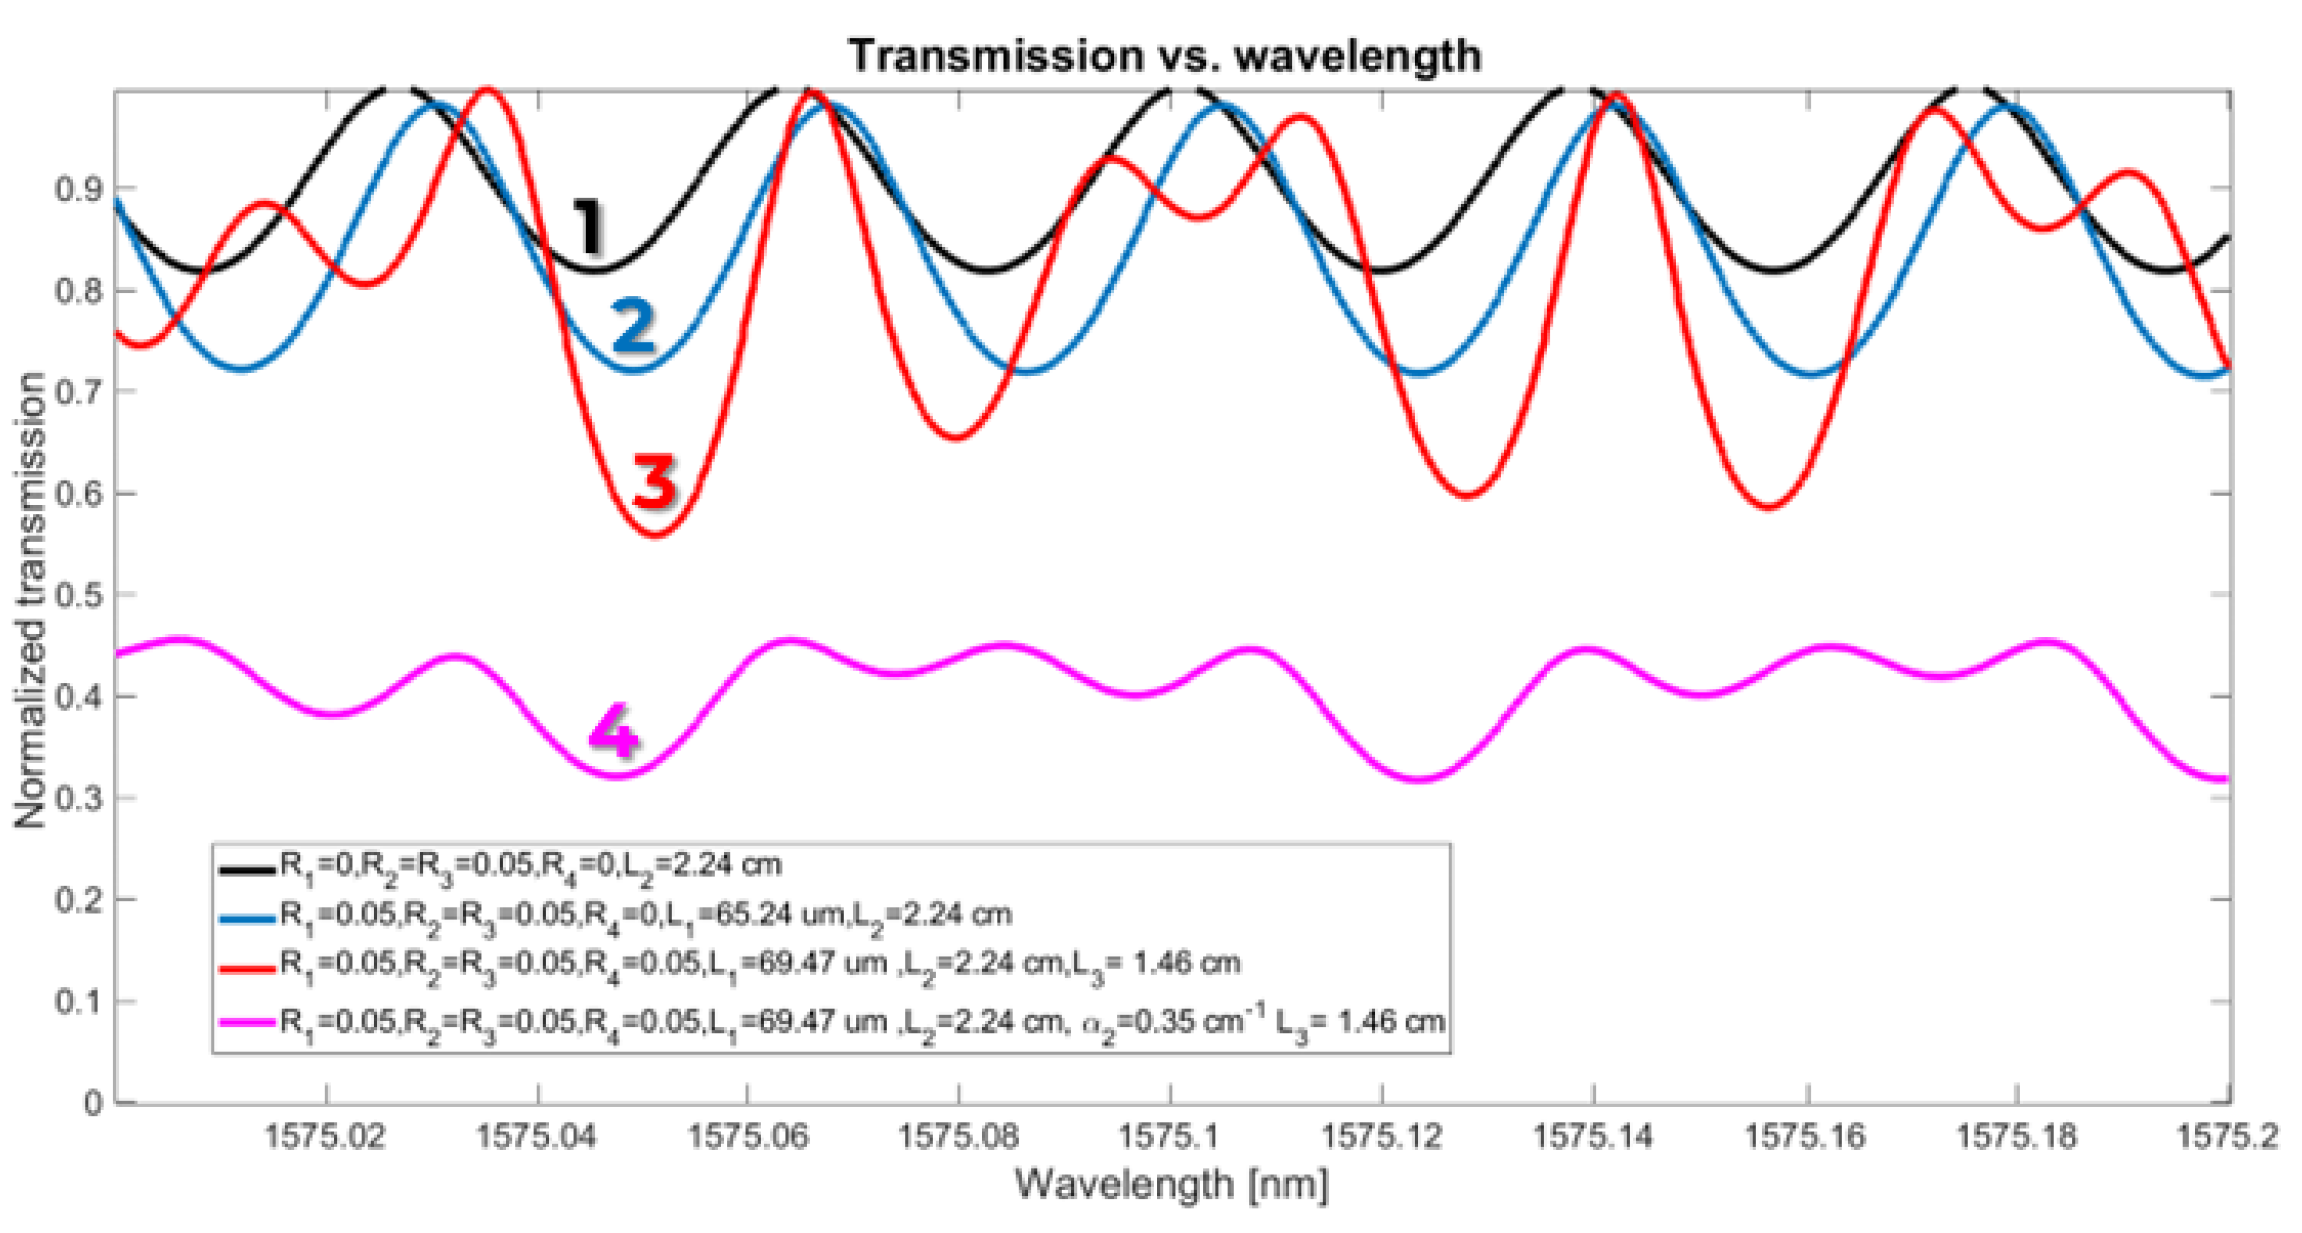
Figure 3.
The FP fringes in transmission of lossy waveguides (1) without coating (Figure 1 (c)); and (2) with an anti-reflection coating (ARC) on the collecting lens interface (Figure 1 (d)).
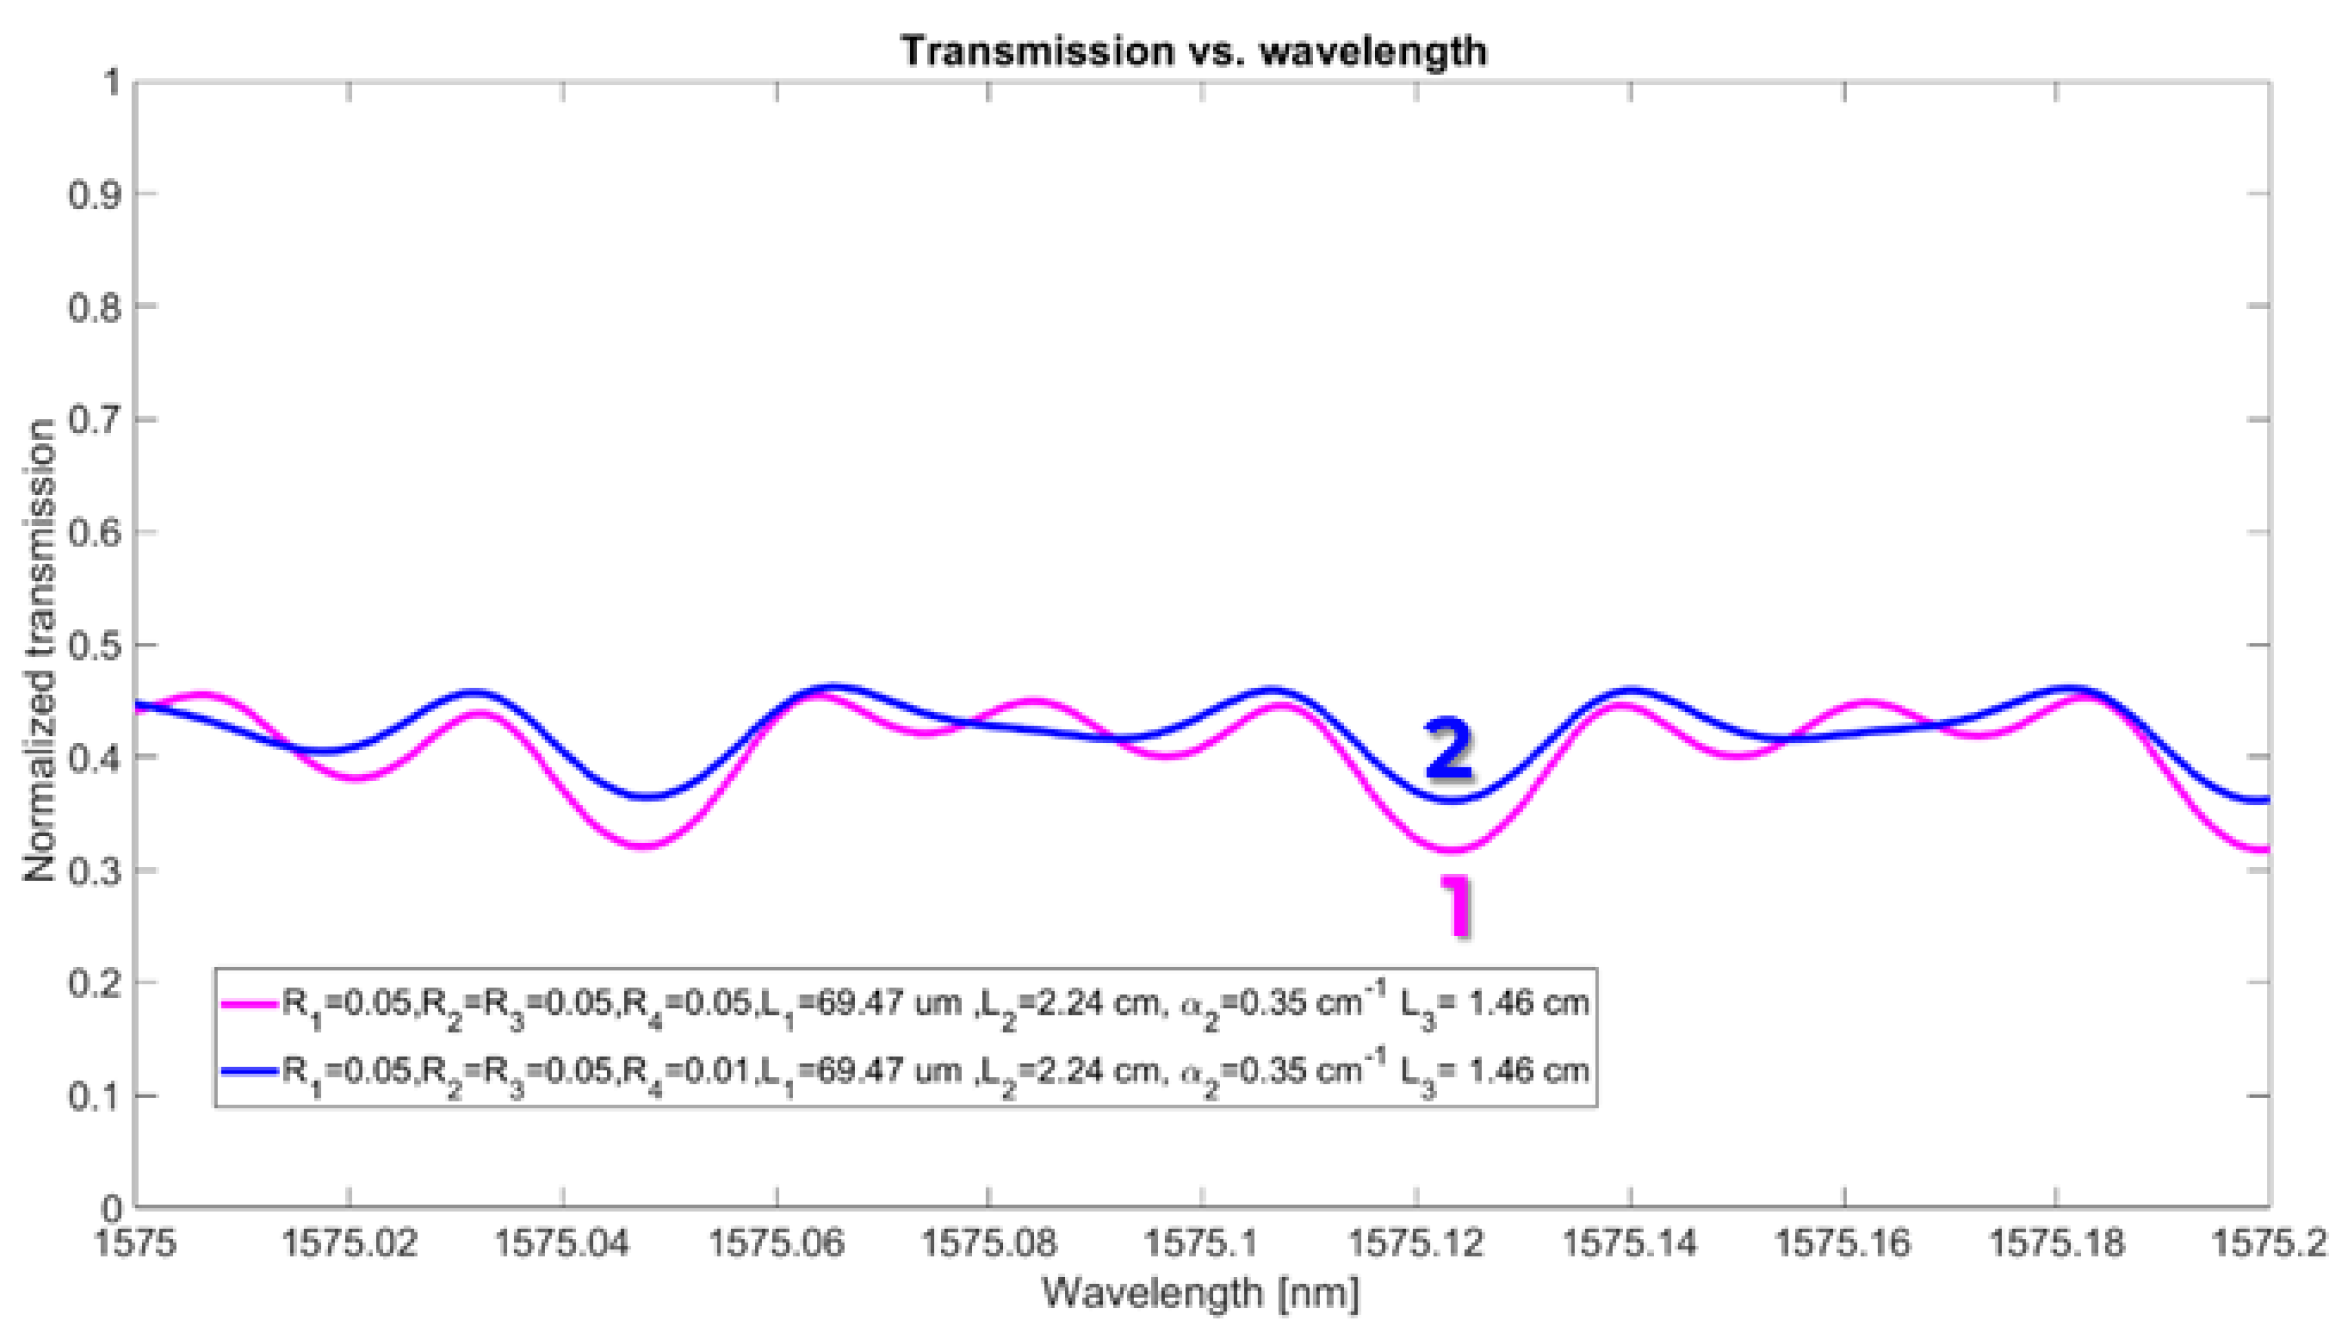
Figure 4.
Transmission fringes as function of the wavelength and reflectivity for a waveguide with (a) 0.3 cm-1 and (b) 0.5 cm-1 losses.
Figure 4.
Transmission fringes as function of the wavelength and reflectivity for a waveguide with (a) 0.3 cm-1 and (b) 0.5 cm-1 losses.
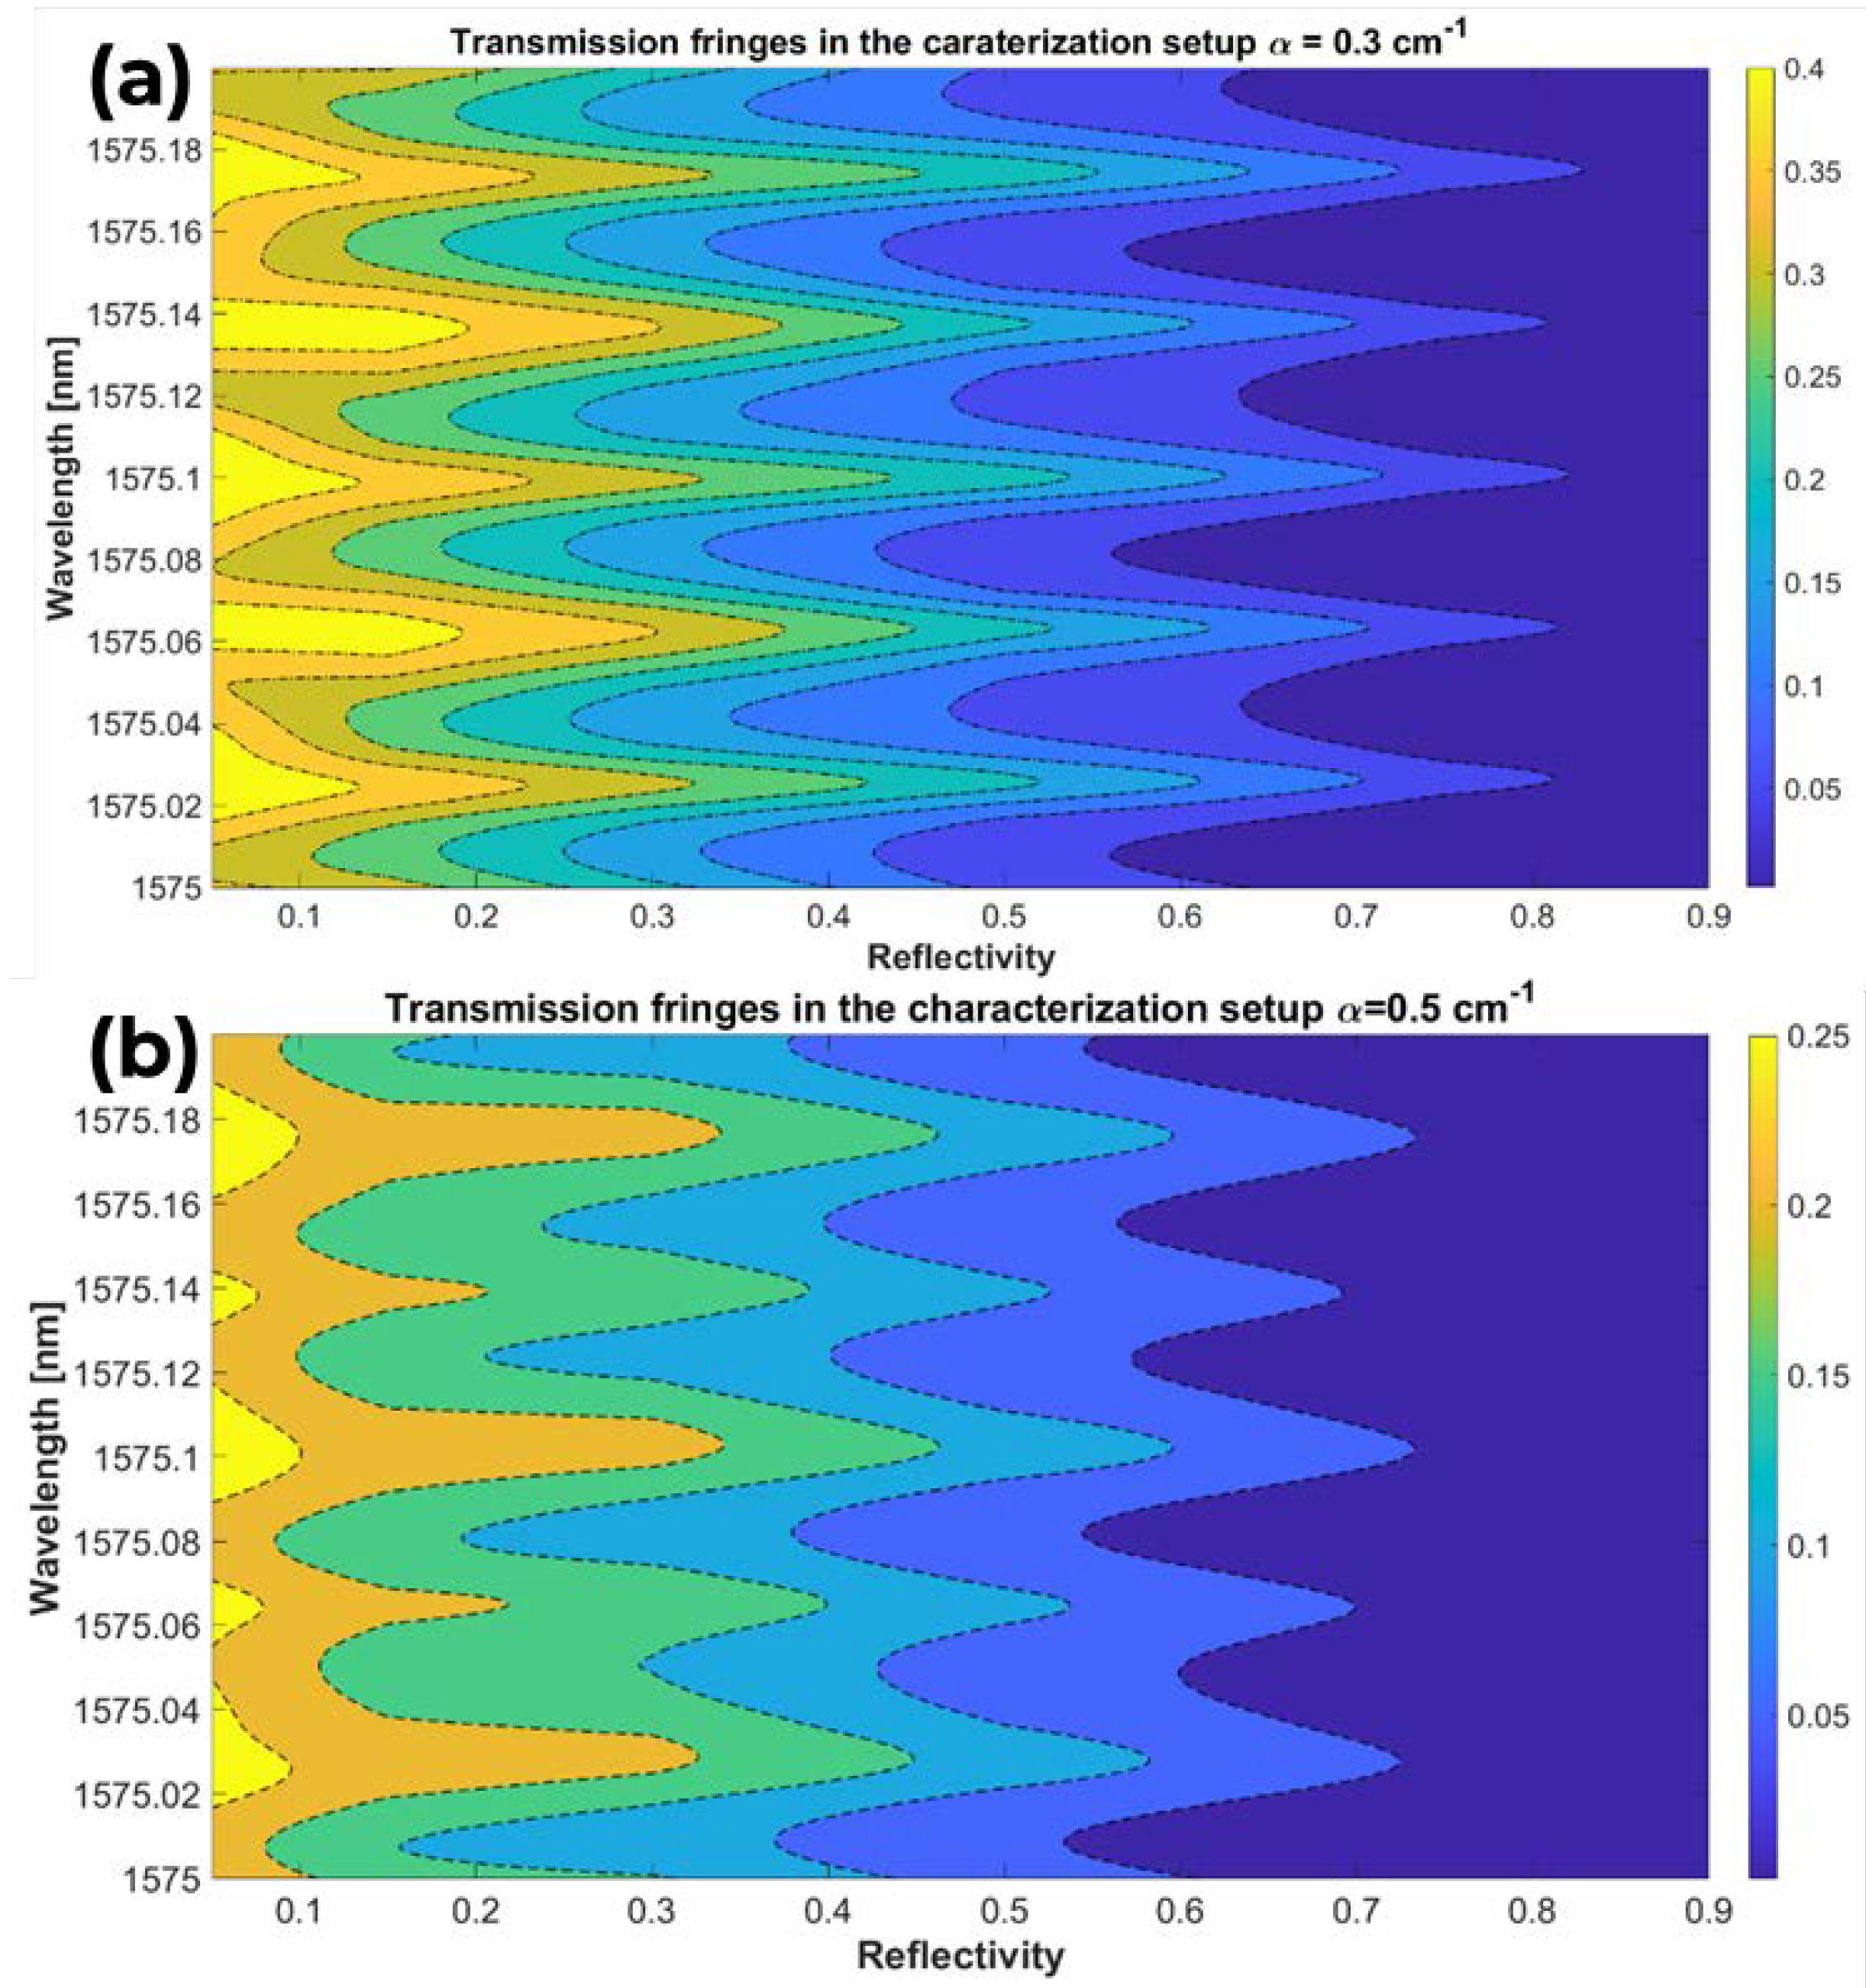
Figure 5.
Calculated losses with the FP technique for a waveguide with 0.3 cm-1 (a) and 0.5 cm-1 (b) losses as function of the HRC at the sample ad facets.
Figure 5.
Calculated losses with the FP technique for a waveguide with 0.3 cm-1 (a) and 0.5 cm-1 (b) losses as function of the HRC at the sample ad facets.
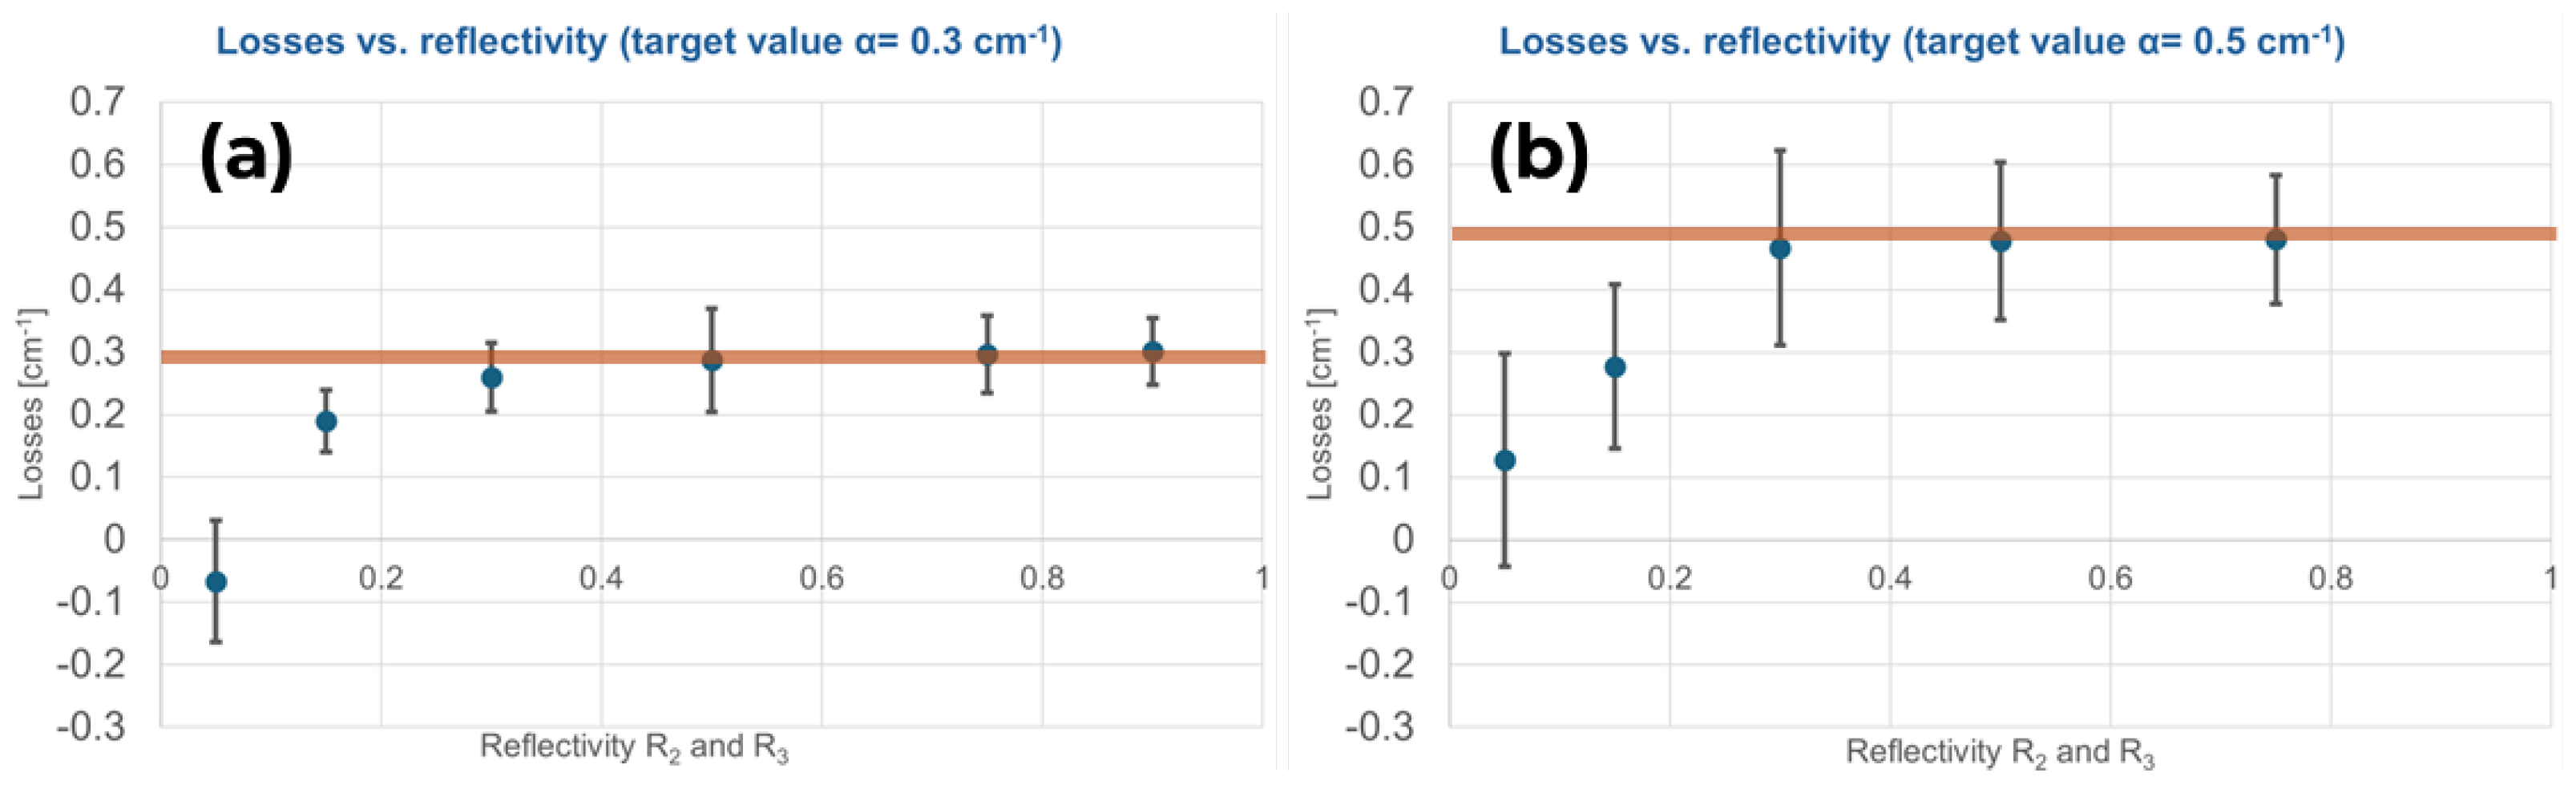
Figure 5.
Calculated losses with the FP technique for a waveguide with 0.3 cm-1 (a) and 0.5 cm-1 (b) losses as function of the HRC at the sample ad facets.
Figure 5.
Calculated losses with the FP technique for a waveguide with 0.3 cm-1 (a) and 0.5 cm-1 (b) losses as function of the HRC at the sample ad facets.
Disclaimer/Publisher’s Note: The statements, opinions and data contained in all publications are solely those of the individual author(s) and contributor(s) and not of MDPI and/or the editor(s). MDPI and/or the editor(s) disclaim responsibility for any injury to people or property resulting from any ideas, methods, instructions or products referred to in the content. |
© 2024 by the authors. Licensee MDPI, Basel, Switzerland. This article is an open access article distributed under the terms and conditions of the Creative Commons Attribution (CC BY) license (http://creativecommons.org/licenses/by/4.0/).
Copyright: This open access article is published under a Creative Commons CC BY 4.0 license, which permit the free download, distribution, and reuse, provided that the author and preprint are cited in any reuse.


