Submitted:
03 September 2024
Posted:
04 September 2024
You are already at the latest version
Abstract
A new-type vibration sensor based on a fiber Bragg grating combining with a special structure-packaged design is proposed for monitoring the mechanical vibration signals. Three different sensing structures including the film squeeze type, new film squeeze type and elastic tape squeeze type are proposed for measuring the vibration signals with the frequency range from tens to thousands of Hz. In the comparison of experimental results, the new film squeeze structure has a nice sensing performance in the range from 100 to 1000 Hz with the sensitivity of 35 mV/V. For the elastic tape squeeze structure, the elastic tape is designed to encapsulate the optical fiber with a good frequency response from 1100 to 3100 Hz. In addition, by using the new film squeeze structure to measure the steady-state and non-steady-state vibration signals, the spectral components of sensing signals are analyzed by using the wavelet transformation for confirming the testing signals. These vibration fiber sensors can be applied in the measurement of high-end manufacture-facility vibration or earthquake vibrations etc.
Keywords:
fiber Bragg grating
; vibration wave sensors
; fiber sensors
1. Introduction
In recent years, the development of fiber grating sensors has greatly attracted the attention of researchers due to a wide range of applications. In comparison with the conventional sensors there are many advantages including the simple structure, long life-time, high sensitivity and nice stability etc. [1]. Even in special or harsh operating environments such as the high temperature, high electric field, radiative and corrosive gases, the sensing performance can be effectively maintained. For the field of measuring the vibration signals created from an instrument or facility, there are many different sensing technologies including the conventional eddy current vibration wave sensors, piezoelectric vibration sensors, soft PZT nanofiber sensors, and fiber grating sensors etc. [2]. Generally, the vibration wave can be divided into damped and non-damped vibration wave. The real vibration mode is damped vibration in which the frequency of vibration can be a single frequency or a mixture of frequencies and the vibration period is included in the periodic and aperiodic vibration according to the different vibration sources. Based on the nice characteristics for sensing vibration signals, a variety of FBG-based vibration or accelerometer sensors have been proposed [3,4,5,6,7,8,9,10]. By utilizing a cantilever beam and fiber Bragg grating is one of important vibration or acceleration sensors [3,4,5,6,7]. For these previous publications and according to the parameters of light modulation, optical vibration sensors can be divided into three categories: light intensity modulation, light phase modulation and optical wavelength modulation [8]. In general, the simple vibration or acceleration sensors are mostly one or two dimensional design. For one-dimensional FBG accelerometer or vibration meter, the FBG is typically attached to a mass-spring system. When the system senses acceleration or vibration signals, it causes a displacement of the mass, which induces a strain on the FBG to in turn cause a fiber grating wavelength shift. By monitoring the grating wavelength shift, the acceleration or vibration can be accurately obtained. By adjusting the effective distance between the sensor axis and the cantilever neutral axis, the sensor sensitivity can be effectively improved [9]. A string-type based two-dimensional FBG vibration sensor is a nice technology that utilizes the transversal vibrational property of a tightly suspended optical fiber [10]. This type of sensor can be used in distributed two-dimensional vibration measurement due to its two-dimensional sensing properties. It’s a significant advancement in the field of optical fiber sensing, where precision and innovation converge. In recent years, three-dimensional measurement has become increasingly important, so the design of three-dimensional sensors has gradually received attention [11]. The new three-dimensional acceleration sensor that uses composite flexure hinges and fiber Bragg grating. The researchers investigated the coupling mechanism between a new integrated elastomer structure and fiber grating. They studied the influence of structural parameters on the static and dynamic characteristics, volume, and mass of the sensor.
Our purpose of measuring the vibration signals created from instruments or facilities is to monitor their operating performance for estimating the requirement of being maintained. For our proposed fiber grating sensors, the fiber grating combining the packaged-design can be applied in checking the instrument or facility whether or not to be maintained by according to the sensing spectrum.
2. Basic Sensing Principle
The key element of this vibration fiber sensor is the fiber Bragg grating which is one of potentially passive fiber components. For the fabrication of fiber gratings, the most general method is the phase-mask fabricating technique firstly proposed by K.O. Hill et al. in 1993 [12,13]. The ultraviolet light beam (248 nm) from KrF excimer laser passes through the phase mask to form the interference fringe of ±1 order diffraction beams to exposure on the optical fiber to form the fiber grating with a periodical index variation along the fiber core axis. When the measuring light source from a broad-band light source is launched into a fiber grating, the forward fundamental propagation mode is coupled to the backward fundamental core mode to cause the reflection light with a specific wavelength to be called the grating Bragg wavelength (λB), and the relationship between the Brag wavelength and the rating period is shown in equation (1):
In which neff is the effective index of grating and Λ is the grating period. From the formula, we can see that the different fiber-grating wavelengths can be easily fabricated by changing the grating period (i.e. the period of phase mask). For writing high reflectivity fiber gratings, the general commercial single mode fiber (SMF-28) requires to be hydrogen-loaded for increasing the fiber photosensitivity. The operating mechanism for measuring the vibration signal by using a fiber grating is to combine the design of fiber-grating packaged-structure and to induce the strain caused by the vibration signals to create the grating center-wavelength shift.
For the design of the sensor structure, since the natural resonance frequency of the structure itself is fixed, if the resonant cavity structure is fabricated to amplify the signal amplitude, it may be limited by the vibration wave of a specific frequency or due to the compressibility of the air to cause the vibration wave to be absorbed. Therefore, the design of the film squeeze structure mainly refers to the traditional load-bearing extrusion method of piezoelectric sensors. During the vibration process, the piezoelectric material is deformed by the squeeze of the weight and the process of generating electrical signals. This idea is used in the structure of fiber grating. Firstly, the fiber grating is embedded in a silicone rubber film with a thickness of 277μm, and then the film is cut into strips along the axial direction of the grating. 3D printing technique is used to print a circle closed on one side. One end of the fiber grating is passed through the circular film, and finally the whole is fixed to the cylindrical structure as shown in Figure 1. In this way, the bottom film can be aligned with the vibration source, and through the upper and lower resonance effect of the bottom film. The central vertical film will be stretched and compressed to cause the grating to be strained and then to result in the grating center wavelength shift. By measuring the grating wavelength shift, the vibration signals can be obtained. From the experiments, the elastic tape has a nice tensile and elastic effects for the better frequency response. The film fiber grating is fabricated by a fiber grating embedded with an elastic film to compare the sensing performance between the two different sensors.
In addition, the 3D printing time of the film squeeze structure is more long and during the measurement process the sensing height must be fixed by hand-holding or using the object to stand up to cause the structure deformation or to create an additional protruding blocks. For solving the problem, the support frame is designed to stabilize the overall structure for measuring the vibration signals according to the appropriate fixed height as shown in Figure 2.
The operating mechanism of sensors is based on the film of sensors can sense vibrational signals to transfer the vibrational force to squeeze and extrude the fiber grating to cause the grating wavelength shift. When an uniform stress (P) is applied in the sensing fiber grating along the axial direction, it will create the fiber strain (ε) in the fiber grating, ε = (υP)/E, where υ is the Poisson’s ratio and E is the fiber module parameter. The strain in a fiber grating will cause the variation both of grating period and grating effective index and then to create the grating wavelength shift. This equation can be given as following
where ∆Λ is the grating period variation induced by the strain-elastic coefficient and ∆neff is the effective index variation induced by the strain-optic effect.
Equation (1) can be further indicated as
where ∆L is the grating physical length variation along fiber axis and ∆d is the fiber diameter variation in the radial direction. is the strain-optic effect and is the photo-waveguide effect which can be neglected due to being very small value. By using Taylor-series expansion to neglect the high order terms and to introduce the strain-optic coefficient components of fused-silica (pij), equation (3) can be given as
where Se is the strain-induced coefficient of the relative grating wavelength shift and υ is the Poisson ratio.
3. Experimental Setup and Results
For the experiment, the source of vibration signals is a full-range speaker with 8Ω-3W. Each sensor is fixed at a support frame to have the height of 45mm above the speaker. The signal generator generates a sine wave signal with an amplitude of 300mVpp to be amplified by a signal amplifier to create 6 Vpp signals to drive the speaker as shown in Figure 3. The output frequency of the signal generator is tuned in the range from 20 to 2000Hz at every step is 20Hz interval for the overall measurement. The frequency of vibration signals from 0 to 100Hz is defined as the low frequency band, 100 to 1000Hz is defined the mid-frequency band, and above 1000Hz is defined as the high frequency band.
For confirming the frequency response of the output signals of the speaker, we firstly use the no-packaged bare-fiber grating to directly glue on the surface of the speaker to sense the vibration signals. This original frequency response can be obtained for providing the comparison with that of another sensing heads. The original frequency response is obtained as shown in Figure 4 acting as a benchmark for comparing the sensing performance by using different packaged-structures.
The overall experimental set-up is shown in Figure 5 in which the output light of the broadband spontaneous emission light source (ASE Light Source) is put into the first fiber circulator and then to launch into the matching fiber grating (Match Gating, MG) to get the grating reflection signal which is input into the second fiber circulator. The overlapping spectrum between the matching grating and sensing grating (SG) from the port 3 of second fiber circulator is sent to the photodetector (InGaAs). finally converted into an electrical signal by a photodetector and connected to an oscilloscope. In addition, the center wavelength of the matching fiber grating and the sensing fiber grating must be the same after selection, because the light energy finally transmitted to the photoelectric converter will be determined according to the overlapping area of the sensing center wavelength and the matching center wavelength. During the process, the change of light energy will be displayed on the oscilloscope, and the waveform will be reflected as a sine wave signal, so that the amplitude and frequency of the vibration wave can be observed and analyzed.
For comparing the experimental results in different sensing structures, the film squeeze type is used for detecting vibration signals in the mid-high frequency range from 260 to 1000Hz and in the mid-low frequency range from 100 to 150Hz. Because the vibration amplitude of the bottom film is too large, the irregular oscillation makes the waveform distortion as shown in Figure 6(a). In the intermediate frequency band, although the amplitude is not large, the waveform can be measured stably as shown in Figure 6(b), (c). For the signals above 2000Hz, it is difficult to be measure due to the small vibration amplitude and the soft absorption characteristics of the film. The overall signal measurement with its frequency response spectrum is shown in Figure 7.
The elastic-tape squeeze type shows its material properties for the frequency range from 100 to 200Hz, and has a high signal amplification effect, but also due to the excessive deformation of the fiber grating, the waveform distortion is shown in Figure 8(a), (b). However, the characteristic of this structure is that it has a significant sensing effect in the high frequency range from 1100 to 2500Hz. The main reason is that the stretching effect of the elastic tape is better, and it is not easy to absorb the signal amplitude, so that it can measure up to about 3100Hz. The sensor with the best mid- and high-frequency response is shown in Figure 8(c), (d); and in the frequency response, it can also be observed that compared with unstructured fiber grating, its high-frequency response is about 2 times that of a pure grating and the waveform is stable, as shown in Figure 9; the sensor with the best high-frequency response in the experiment is an elastic tape squeeze structure.
For improving the low-frequency sensing performance, a probe is installed at the bottom of the elastic tape squeeze sensor as shown in Figure 10 by directly contacting the vibration source created by the speaker. We can find that the frequency signals lower than 100Hz can be measured by this method. The frequency of the lowest signal is enhanced to the signal of 10Hz as shown in Figure 11 which can measure the signal frequency range from 10 to 500Hz. Due to the small vibration amplitude in the middle and high frequency bands, the sensing performance will be decayed by using the probe contact method.
For solving the limitation of the film squeeze sensor only to be held at a fixed height, a new film squeeze structure is proposed to improve this problem. The frequency response spectrum of the new film squeeze structure is shown in Figure 12. We can see that owing to the effect of the sensing support fixing frame the amplitude gain response is nice in the frequency from 100 to 250Hz. But the film vibrates too big to cause the drift of the grating center wavelength to exceed the matching grating range and then to sense the waveform with the phenomenon of positive peak interception as shown in Figure 13 (a). This is attributed to that the high sensitivity of the new film structure sensor in this frequency band. If the amplitude of vibration signal is decreased, this sensor has a nice capability to measure the signal of this frequency band as shown in Figure 13 (b). This sensor has a stable sensing performance in the mid-frequency range from 100 to 1000Hz as shown in Figure 13 (c), (d).
However, in order to clearly understand the sensing sensitivity of each sensor, a sine wave from the signal generator with a frequency of 300Hz is amplified and adjusted to be the output voltage range from 2 Vpp to 20 Vpp per 2 Vpp to drive the speaker. The output signals of the photodetector detecting from the sensing-head optical signals are monitored for obtaining the relationship between the output and input amplitudes as shown in Figure 14. From the figure, we can see that the measurement curves between the output and the input voltages for the sensors are almost linear. The sensitivity of each sensor is the curve slope which can also be linearly fitted from each line segment in the figure. From the curves, the sensitivity of 35 mV/V for the new film squeeze type at 300Hz is obtained and the sensitivity of the elastic tape squeeze type is 15 mV/V at 300Hz. Thus the sensitivity of the new film squeeze structure in the intermediate frequency is higher than that of other types of sensors.
In addition to monitoring the time-domain signals from the output signals of photodetector, it is required to obtain frequency information of sensing signals. Different digital signal algorithms are used for confirming the frequency spectrum of sensing signals. The actual sensing signals are usually not a single frequency or a stable amplitude. By using the Fourier transform, it is difficult to simultaneously obtain the signal spectrum at various time points. Therefore, in order to improve this problem, the wavelet analysis (Continuous Wavelet Transform, CWT) is used for this signal analysis [14]. The following formula shows the theoretical expression of wavelet analysis:
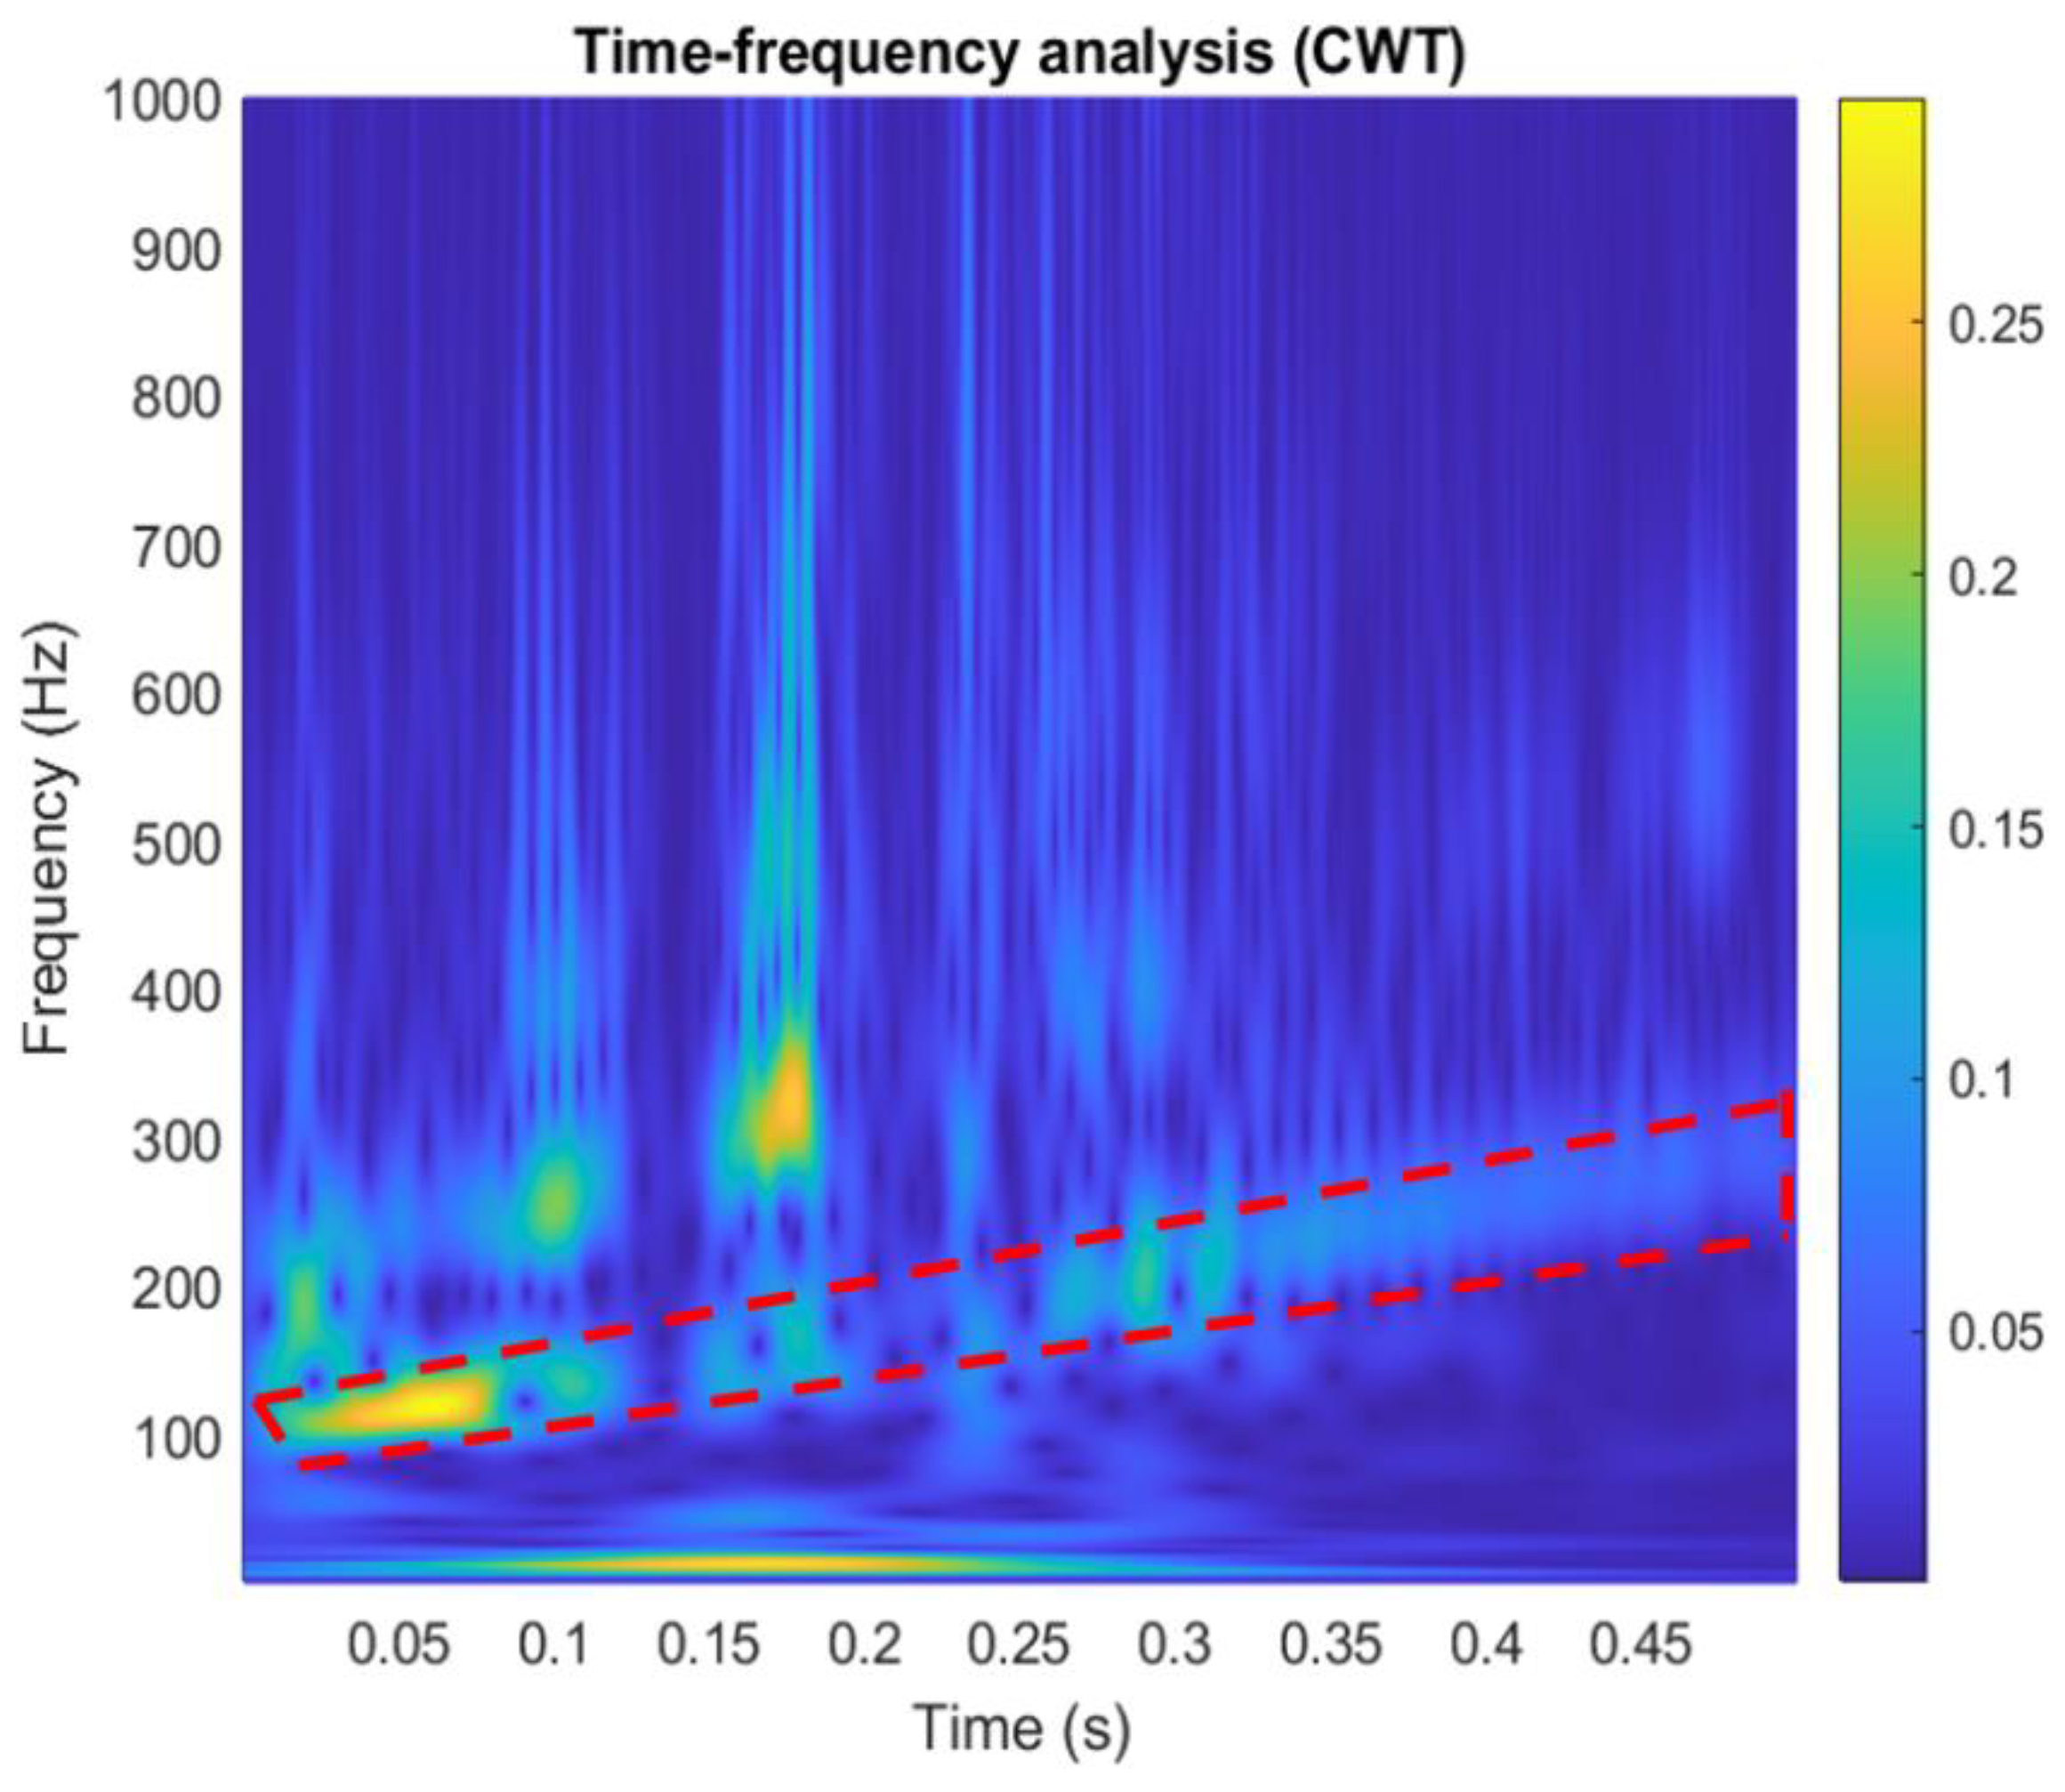
where ψ(t) is a continuous function in both time domain and frequency domain. Since it introduces a special window function for calculation, the low-frequency component is calculated with long-term series and narrow bandwidth and the high-frequency component is calculated with a short time series and a wide bandwidth to obtain the timing of the frequency to be reflected in the time series of the signal as shown in Figure 15 in which the time-domain signal is measured by a new film squeeze sensor. By using the fast Fourier transform analysis, the vibration signal has the frequency changes from 100Hz to 300Hz within 0.5 seconds as shown in Figure 16. From this figure, we can see that the spectral distribution is mainly focused the frequency range from 100Hz to 300Hz. It shows the sensing signals with the components of 100Hz~300Hz Figure 17 is a wavelet analysis diagram in which the color contrast is used to distinguish different time points and the amplitude of the components that appear at each frequency. The marked-red region shows that within the time variation the appearance time of frequency components from 100Hz to 300Hz is extending from the bottom left to the top right, it can be known that the vibration signals whose frequency changes with time rather than a mixing signal, which can reduce the misjudgment of the spectrum.
4. Conclusions
In this paper, various packaged-structure fiber-grating vibration sensors are proposed. From the experimental results, we can see that the contact-type structure in the low-frequency vibration band has better sensing performance. The film type is suitable in the medium-frequency vibration wave. For high-frequency vibration waves, the sensing materials with more elasticity and tension are required due to that the high-frequency extrusion and stretching effects can effectively cause the deformation of the fiber grating. In addition, in terms of signal analysis, wavelet transform can be used simultaneously to analyze time-frequency signals for obtaining more time-frequency information. Thus the sensor based on fiber gratings can achieve effectively the measurement of vibration signals created from high-end machines or facilities owing to the characteristics of high sensitivity, anti-corrosion, anti-electromagnetic interference, etc.
Acknowledgments
The authors would like to specifically thank National Science and Technology Council, Taiwan, for sponsoring this research under Contract No. NSTC 112-2221-E-035-061.
References
- Pendao, C.; Silva, I. Optical Fiber Sensors and Sensing Networks: Overview of the Main Principles and Applications. Sensors 2022, 22, 7554. [CrossRef]
- Chen, X.; Guo, S.; Li, J.; Zhang, G.; Lu, M.; Shi, Y. Flexible piezoelectric nanofiber composite membranes as high performance acoustic emission sensors. Sens. Actuators A Phys. 2013, 199, 372-378. [CrossRef]
- Jia Z.; Dang S.; Yu D.; Fan W. Cantilever vibration sensor based on Fiber Bragg Grating temperature compensation. Optical Fiber Technology. 2023, 75, 103183.
- Jia Z., Zhao X.; Fan W.; Gao H.; Liu Q.; Yong Z.; Liu Y.; Yang K. A two-dimensional cantilever beam vibration sensor based on fiber Bragg Grating. Optical Fiber Technology. 2023, 61, 102447.
- Wu H.; Lin Q.; Han F.; Zhao L.; Jiang Z. Design and analysis of high-frequency fiber Bragg grating vibration sensor. Measurement Science and Technology. 2021, 32, 025108.
- Yao, K.; Lin, Q.; Jiang, Z.; Zhao, N.; Tian, B.; Shi, P.; Peng, G.-D. Modeling and Analysis of a Combined Stress-Vibration Fiber Bragg Grating Sensor. Sensors 2018, 18, 743. [CrossRef]
- Kong, C.; Zhao, D.; Zhang, J.; Liang, B. Real-Time Virtual Sensing for Dynamic Vibration of Flexible Structure via Fiber Bragg Grating Sensors. IEEE Sens. J. 2022, 22, 21706–21718. [CrossRef]
- Zhang Z. Y.; Liu C. T.; Li H. C. Research Progress of Fiber Grating Vibration Sensor. International Conference on Frontiers of Manufacturing Science & Measuring Technology. Taiyuan, China, 24-25 June, 2017.
- Basumallick, N.; Chatterjee, I.; Biswas, P.; Dasgupta, K.; Bandyopadhyay, S. Fiber Bragg grating accelerometer with enhanced sensitivity. Sens. Actuators A Phys. 2012, 173, 108–115. [CrossRef]
- Li, T.L.; Tan, Y.G.; Zhou, Z.D. String-type based two-dimensional fiber Bragg grating vibration sensing principle and structure optimization. Sens. Actuators A Phys. 2017, 259, 85–95. [CrossRef]
- Wang, H.; Liang, L.; Zhou, X.; Tu, B. New Fiber Bragg Grating Three-Dimensional Accelerometer Based on Composite Flexure Hinges. Sensors 2021, 21, 4715. [CrossRef]
- Hill, K.O.; Malo, B.; Bilodeau, F.; Johnson, D.C.; Albert, J. Bragg gratings fabricated in monomode photosensitive optical fiber by UV exposure through a phase mask. Appl. Phys. Lett 1993, 62, 1035–1037. [CrossRef]
- Hill, K.O.; Meltz, G. Fiber Bragg grating technology fundamentals and overview. J. Light. Technol. 1997, 15, 1263–1276. [CrossRef]
- Barsanti, R. J., & Fargues, M. P. Wavelet-based denoising of acoustic transients. Conference Record of The Thirtieth Asilomar Conference on Signals, Systems and Computers. Pacific Grove, CA, USA, 03-06 November 1996.
Figure 1.
(a) The film squeeze structure, (b) Elastic tape squeeze structure.
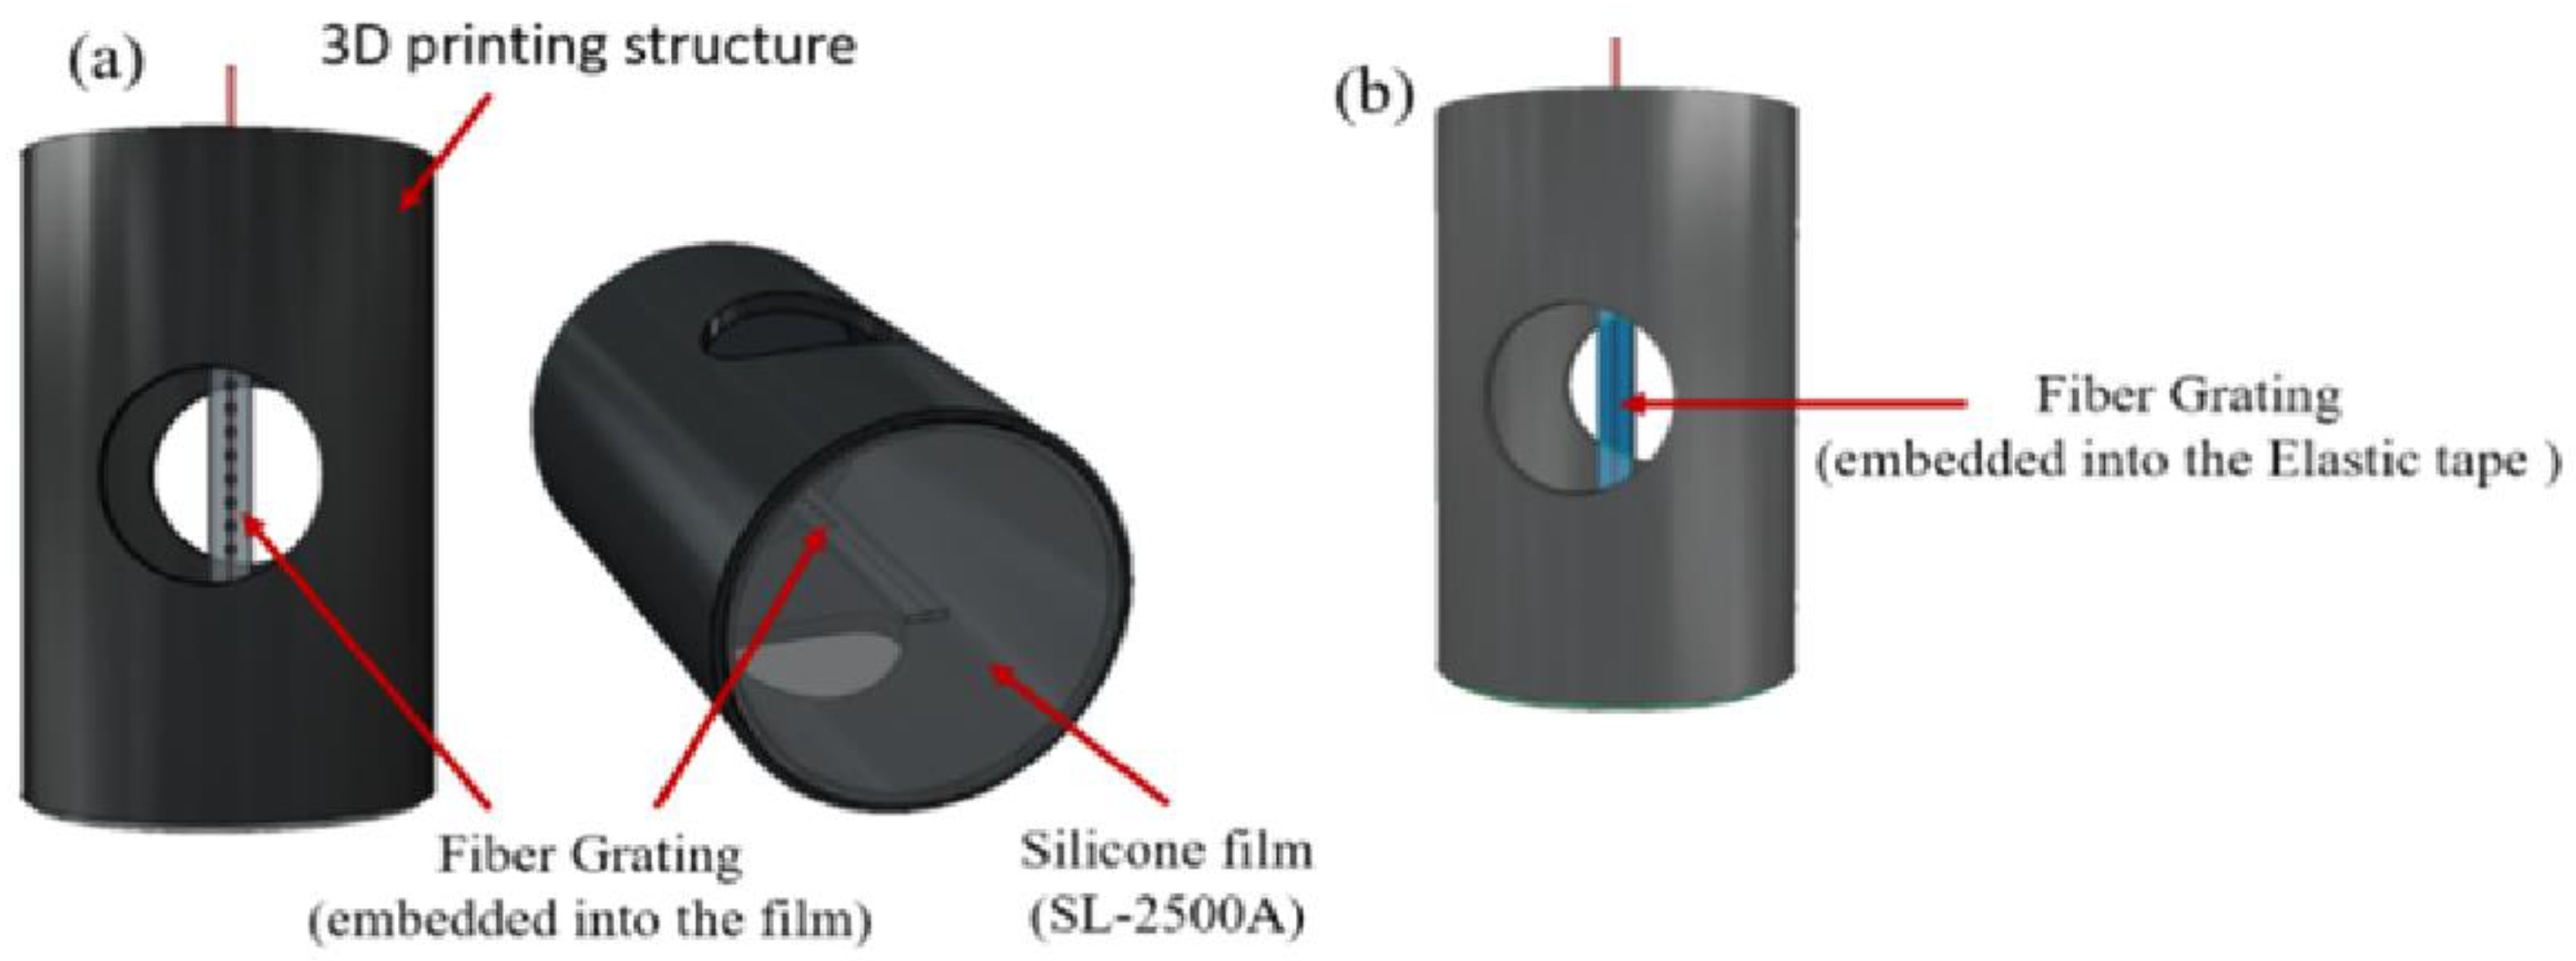
Figure 2.
New film squeeze structure.
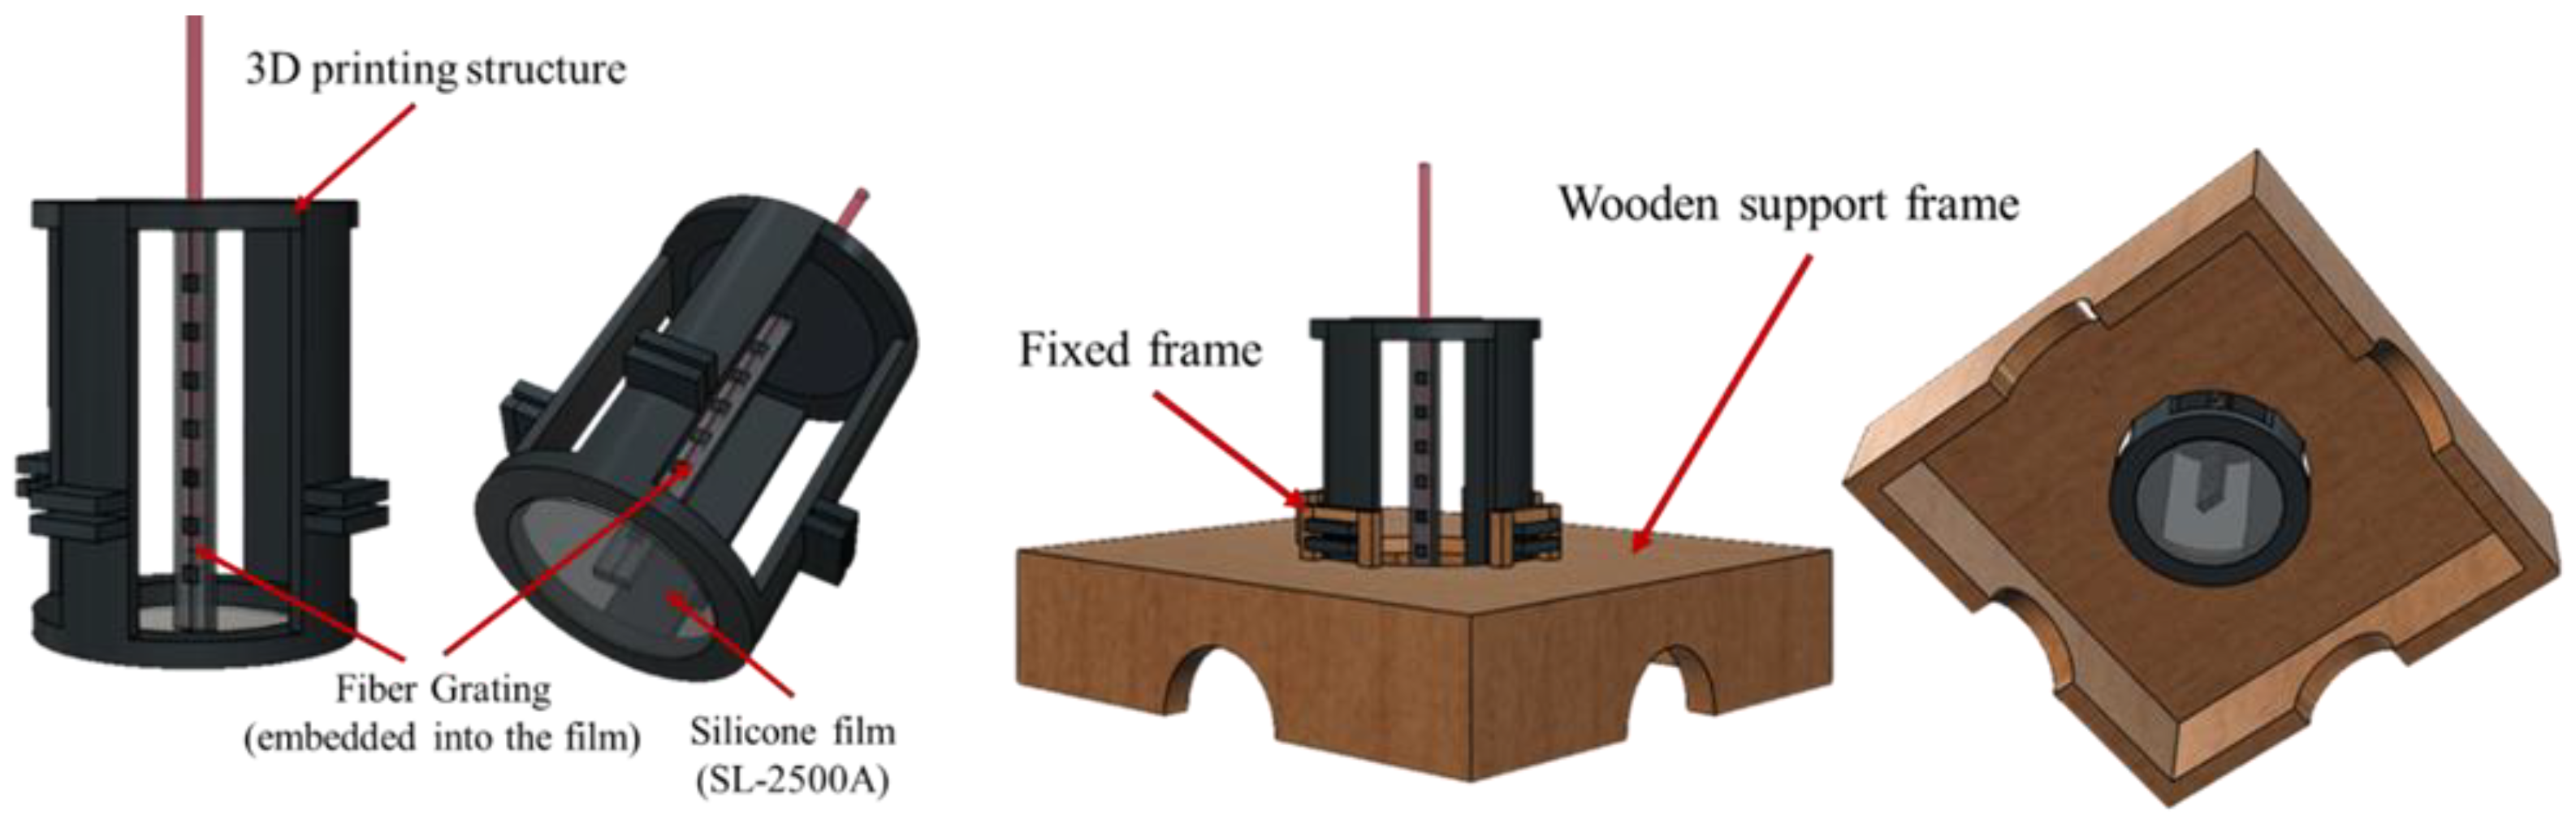
Figure 3.
Experimental configuration of generating vibration signals.
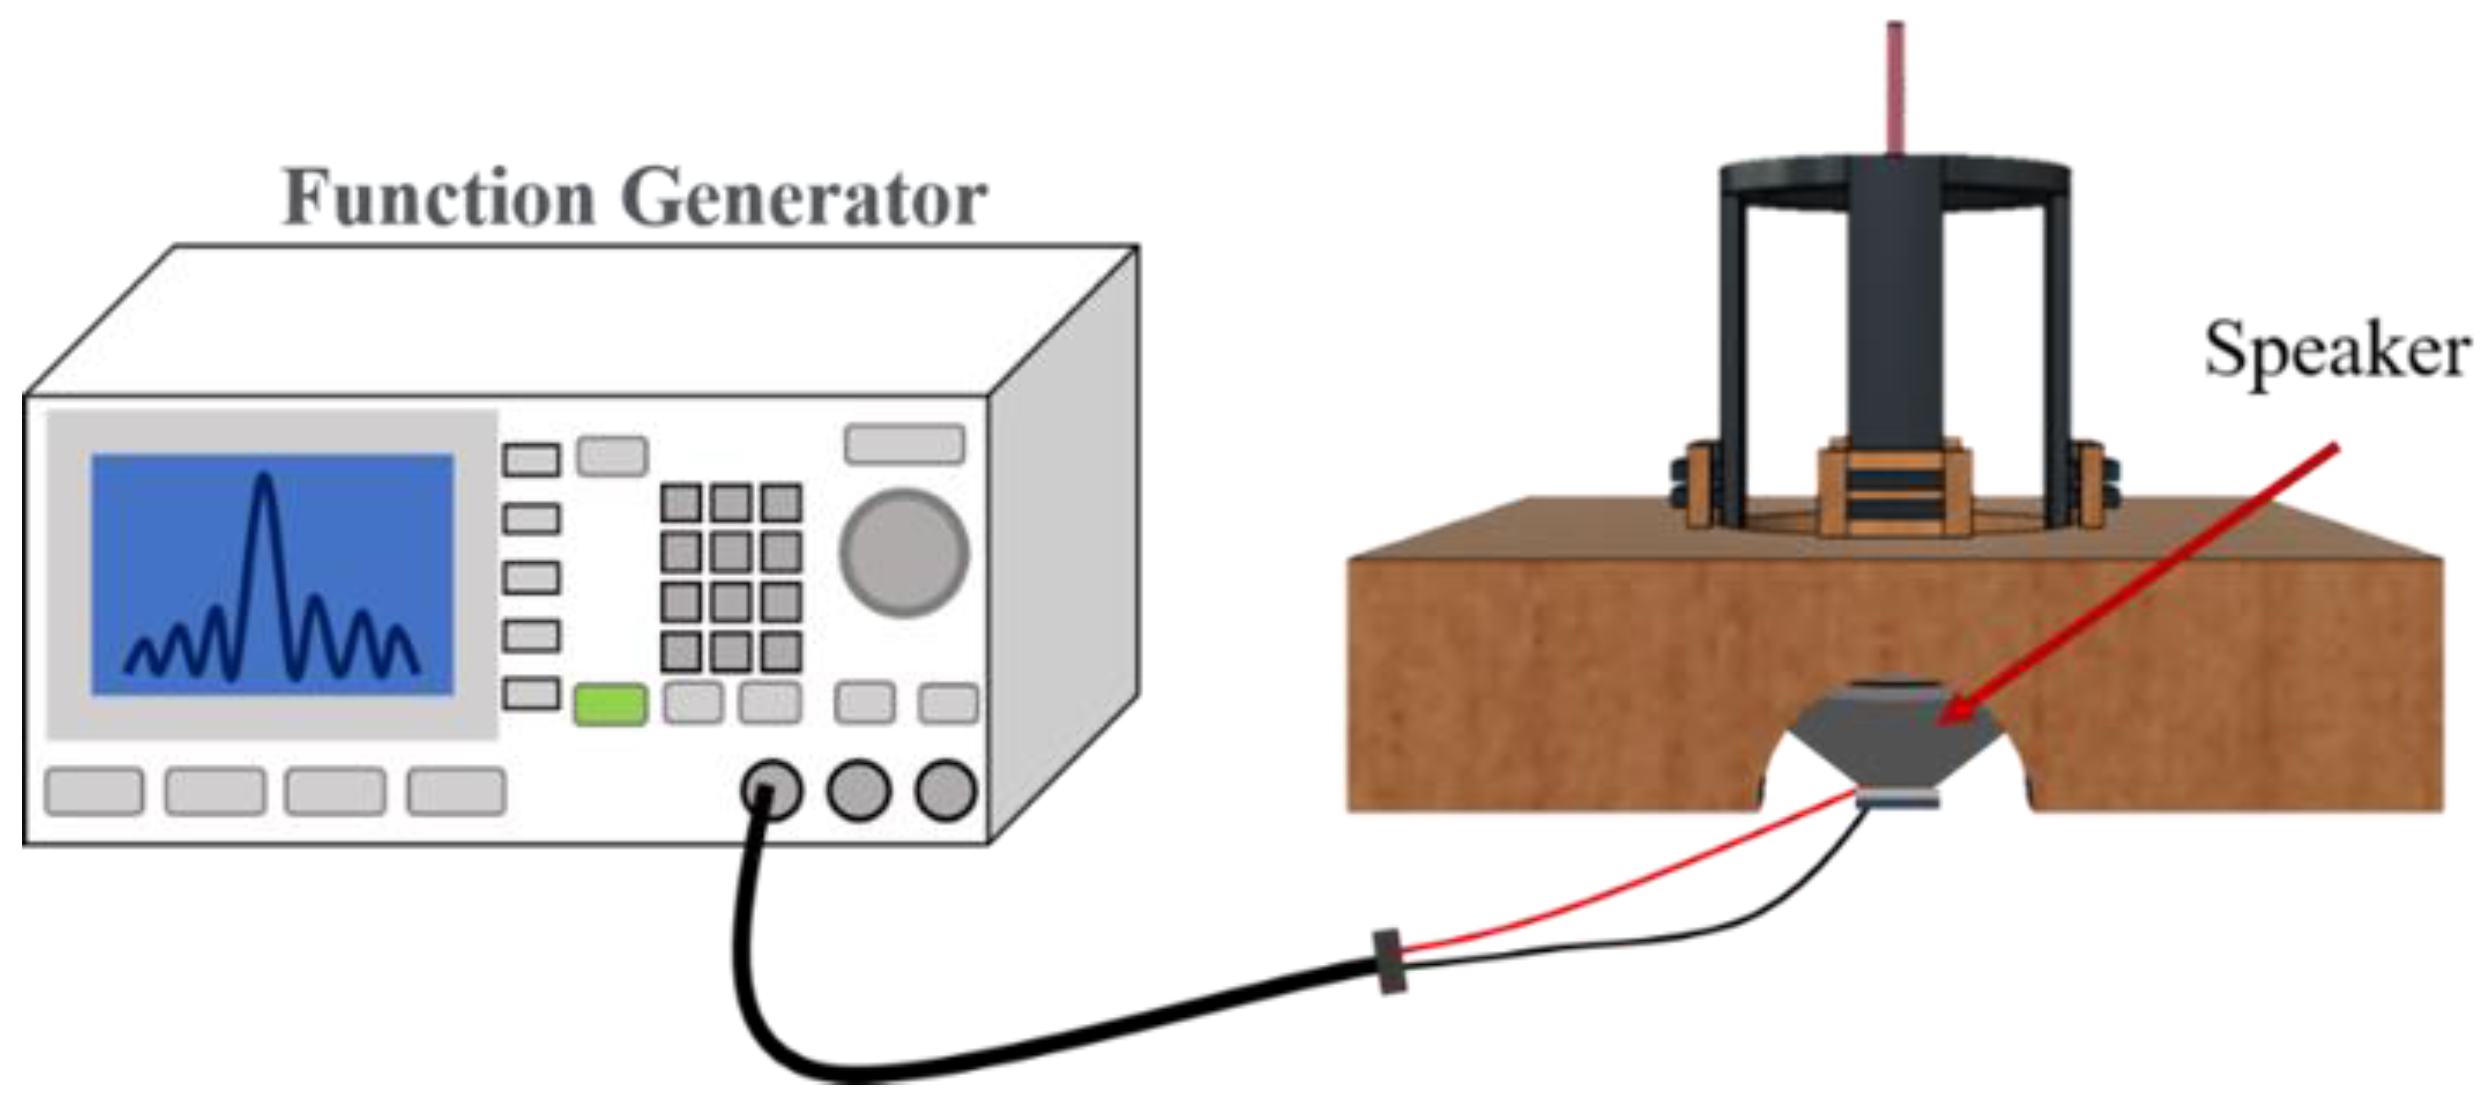
Figure 4.
Frequency response of bare fiber grating for sensing vibrational signals.
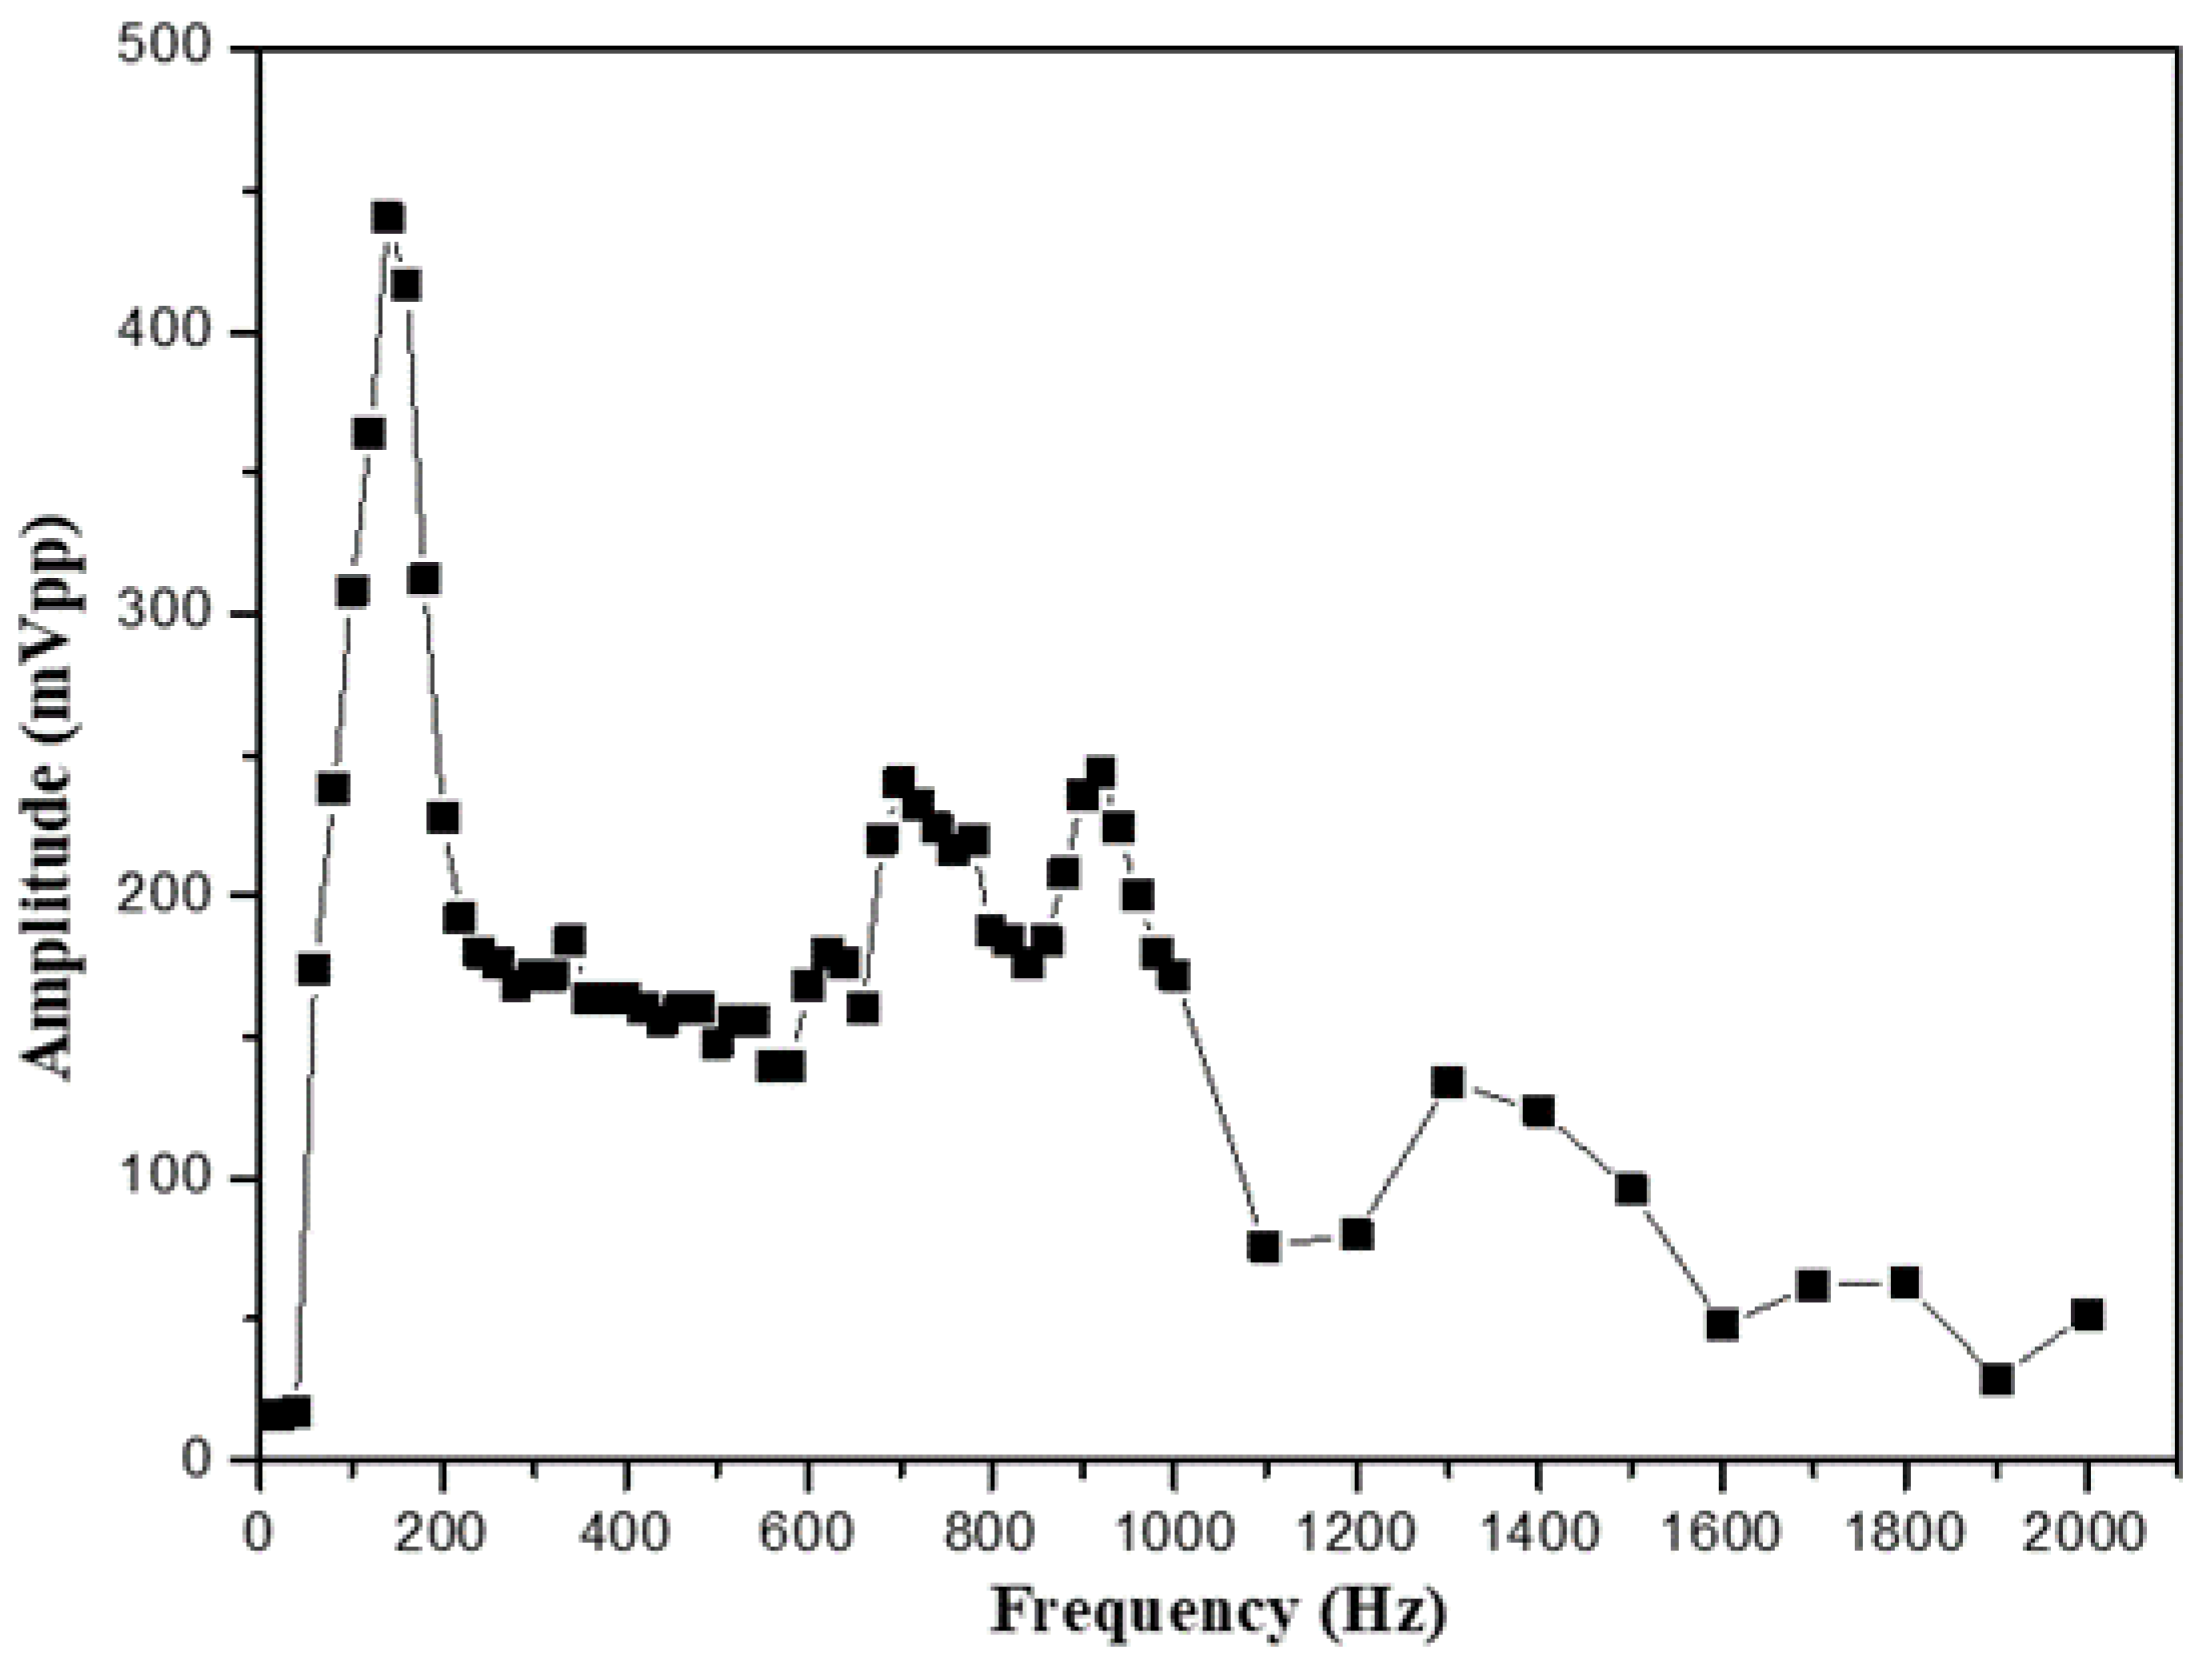
Figure 5.
Experimental set-up of sensing vibrational signals.
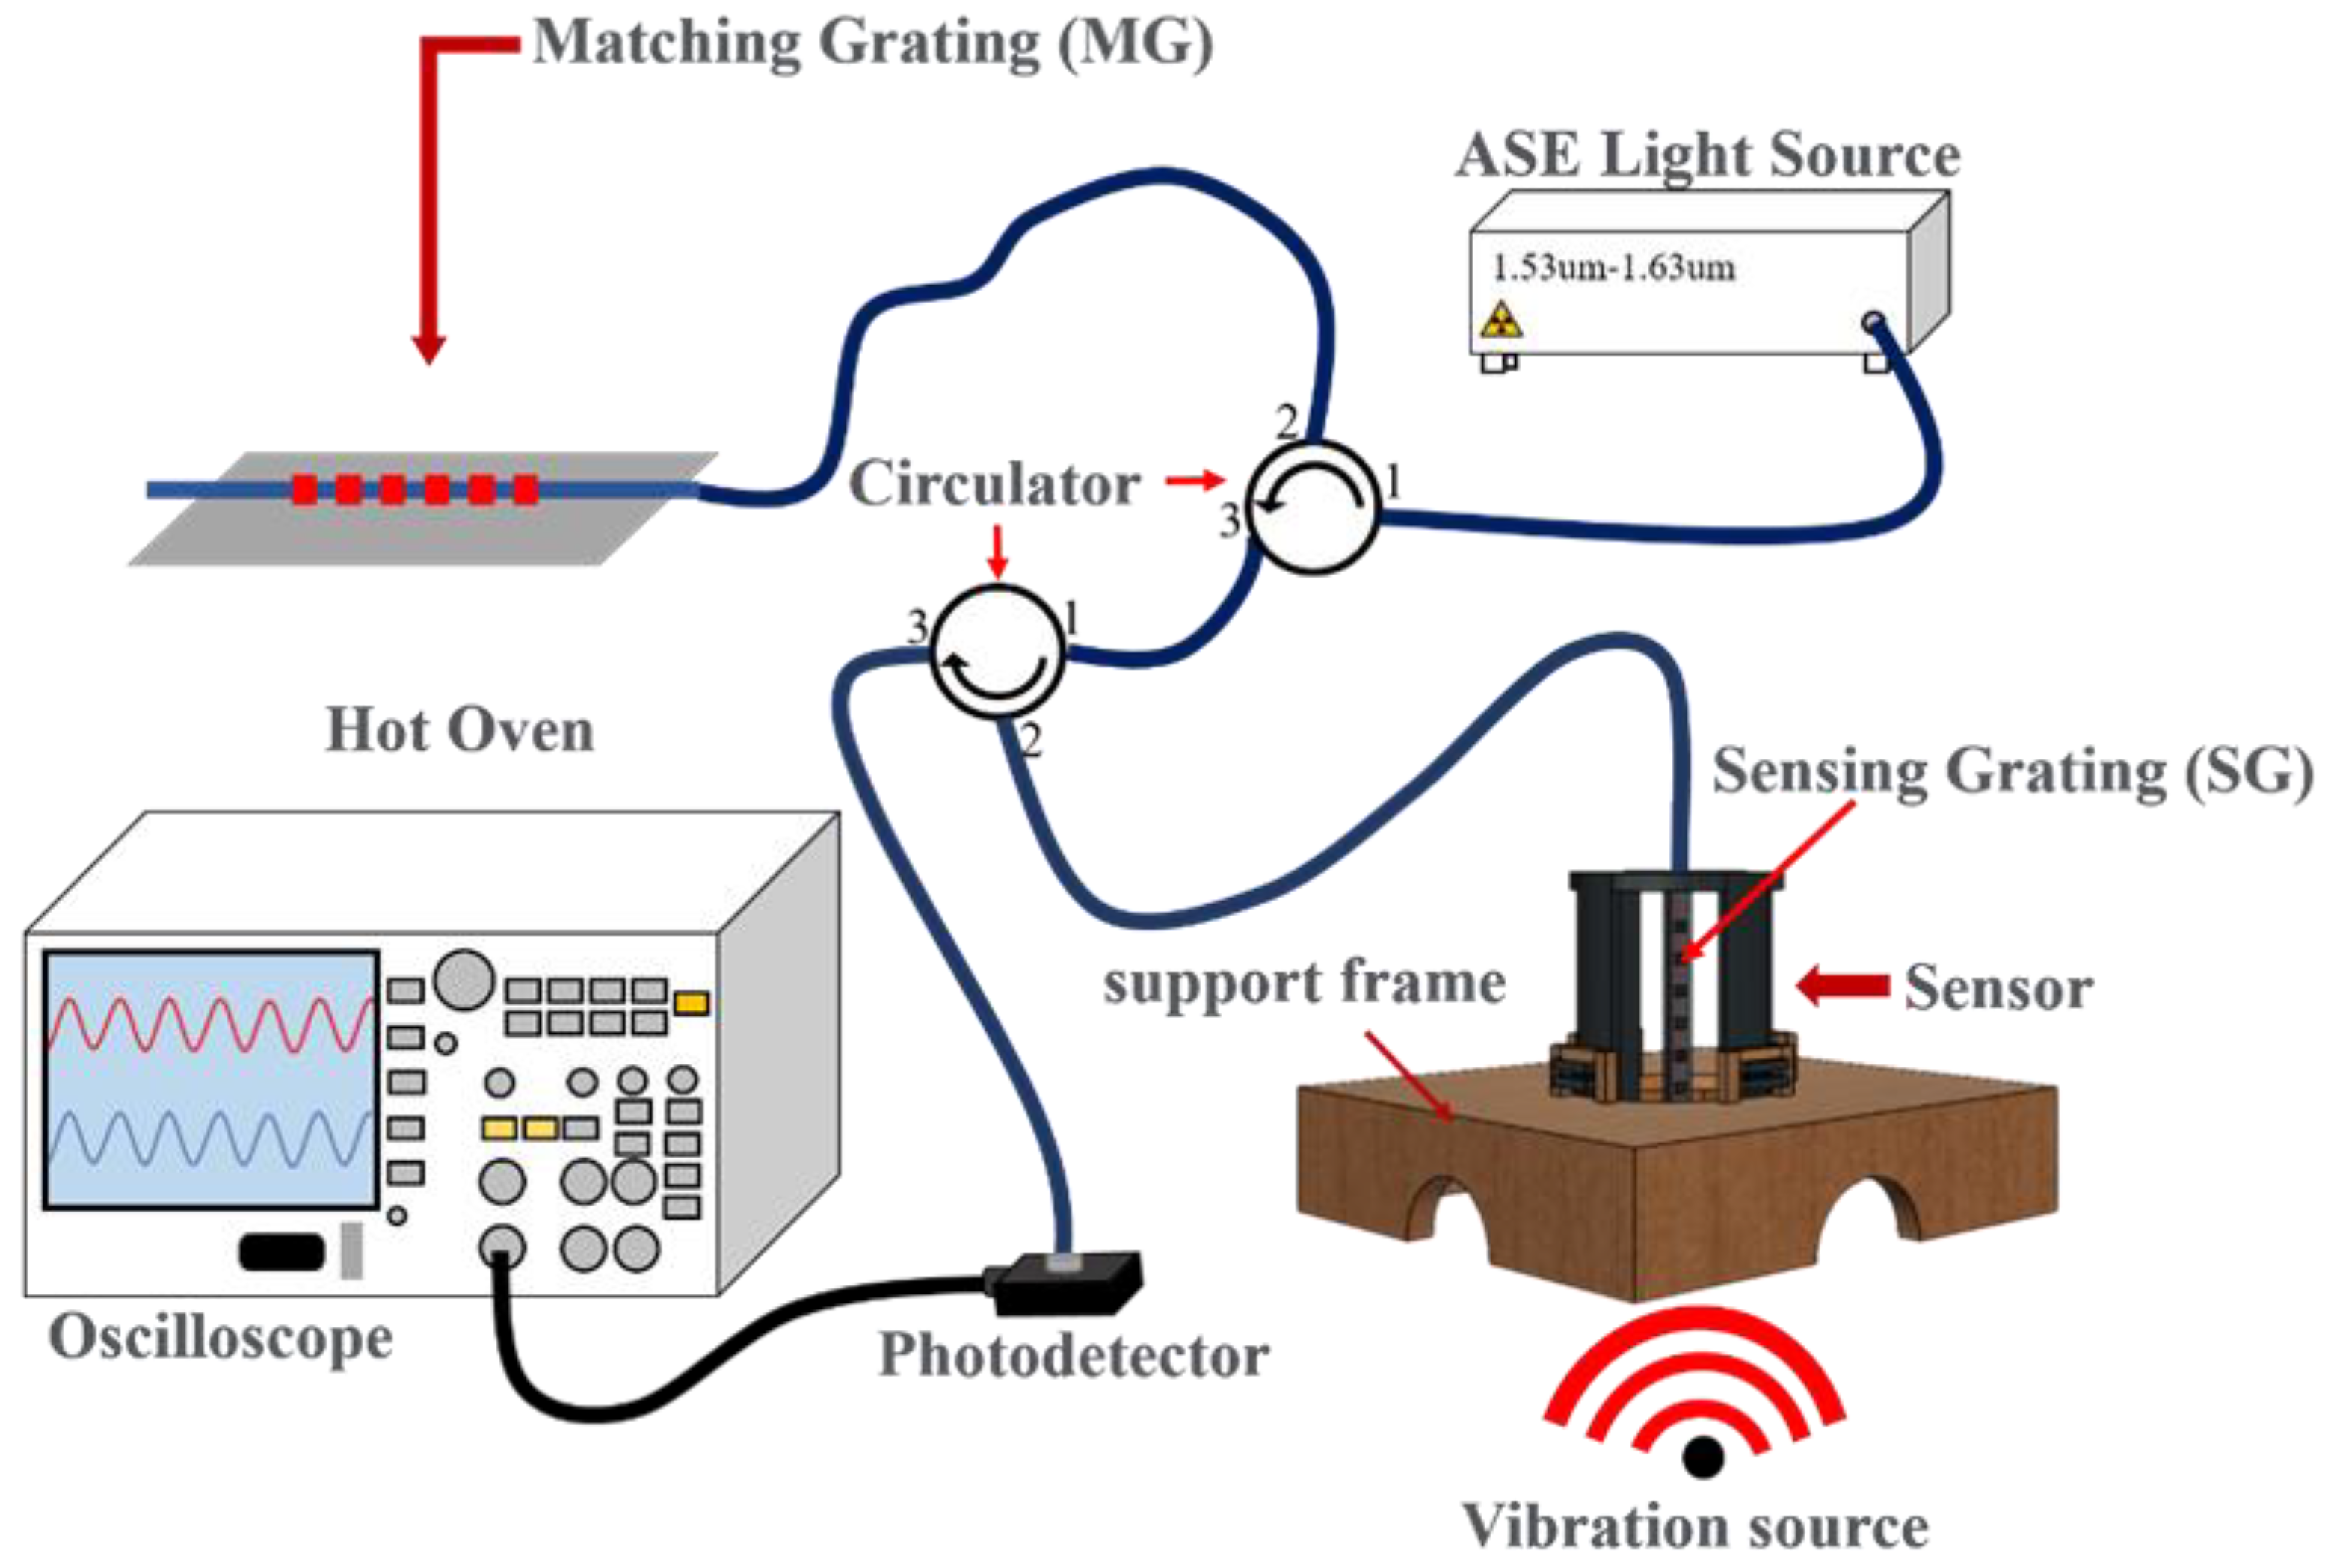
Figure 6.
(a)100Hz sensing signal, (b)300Hz sensing signal, (c)1000Hz sensing signal.
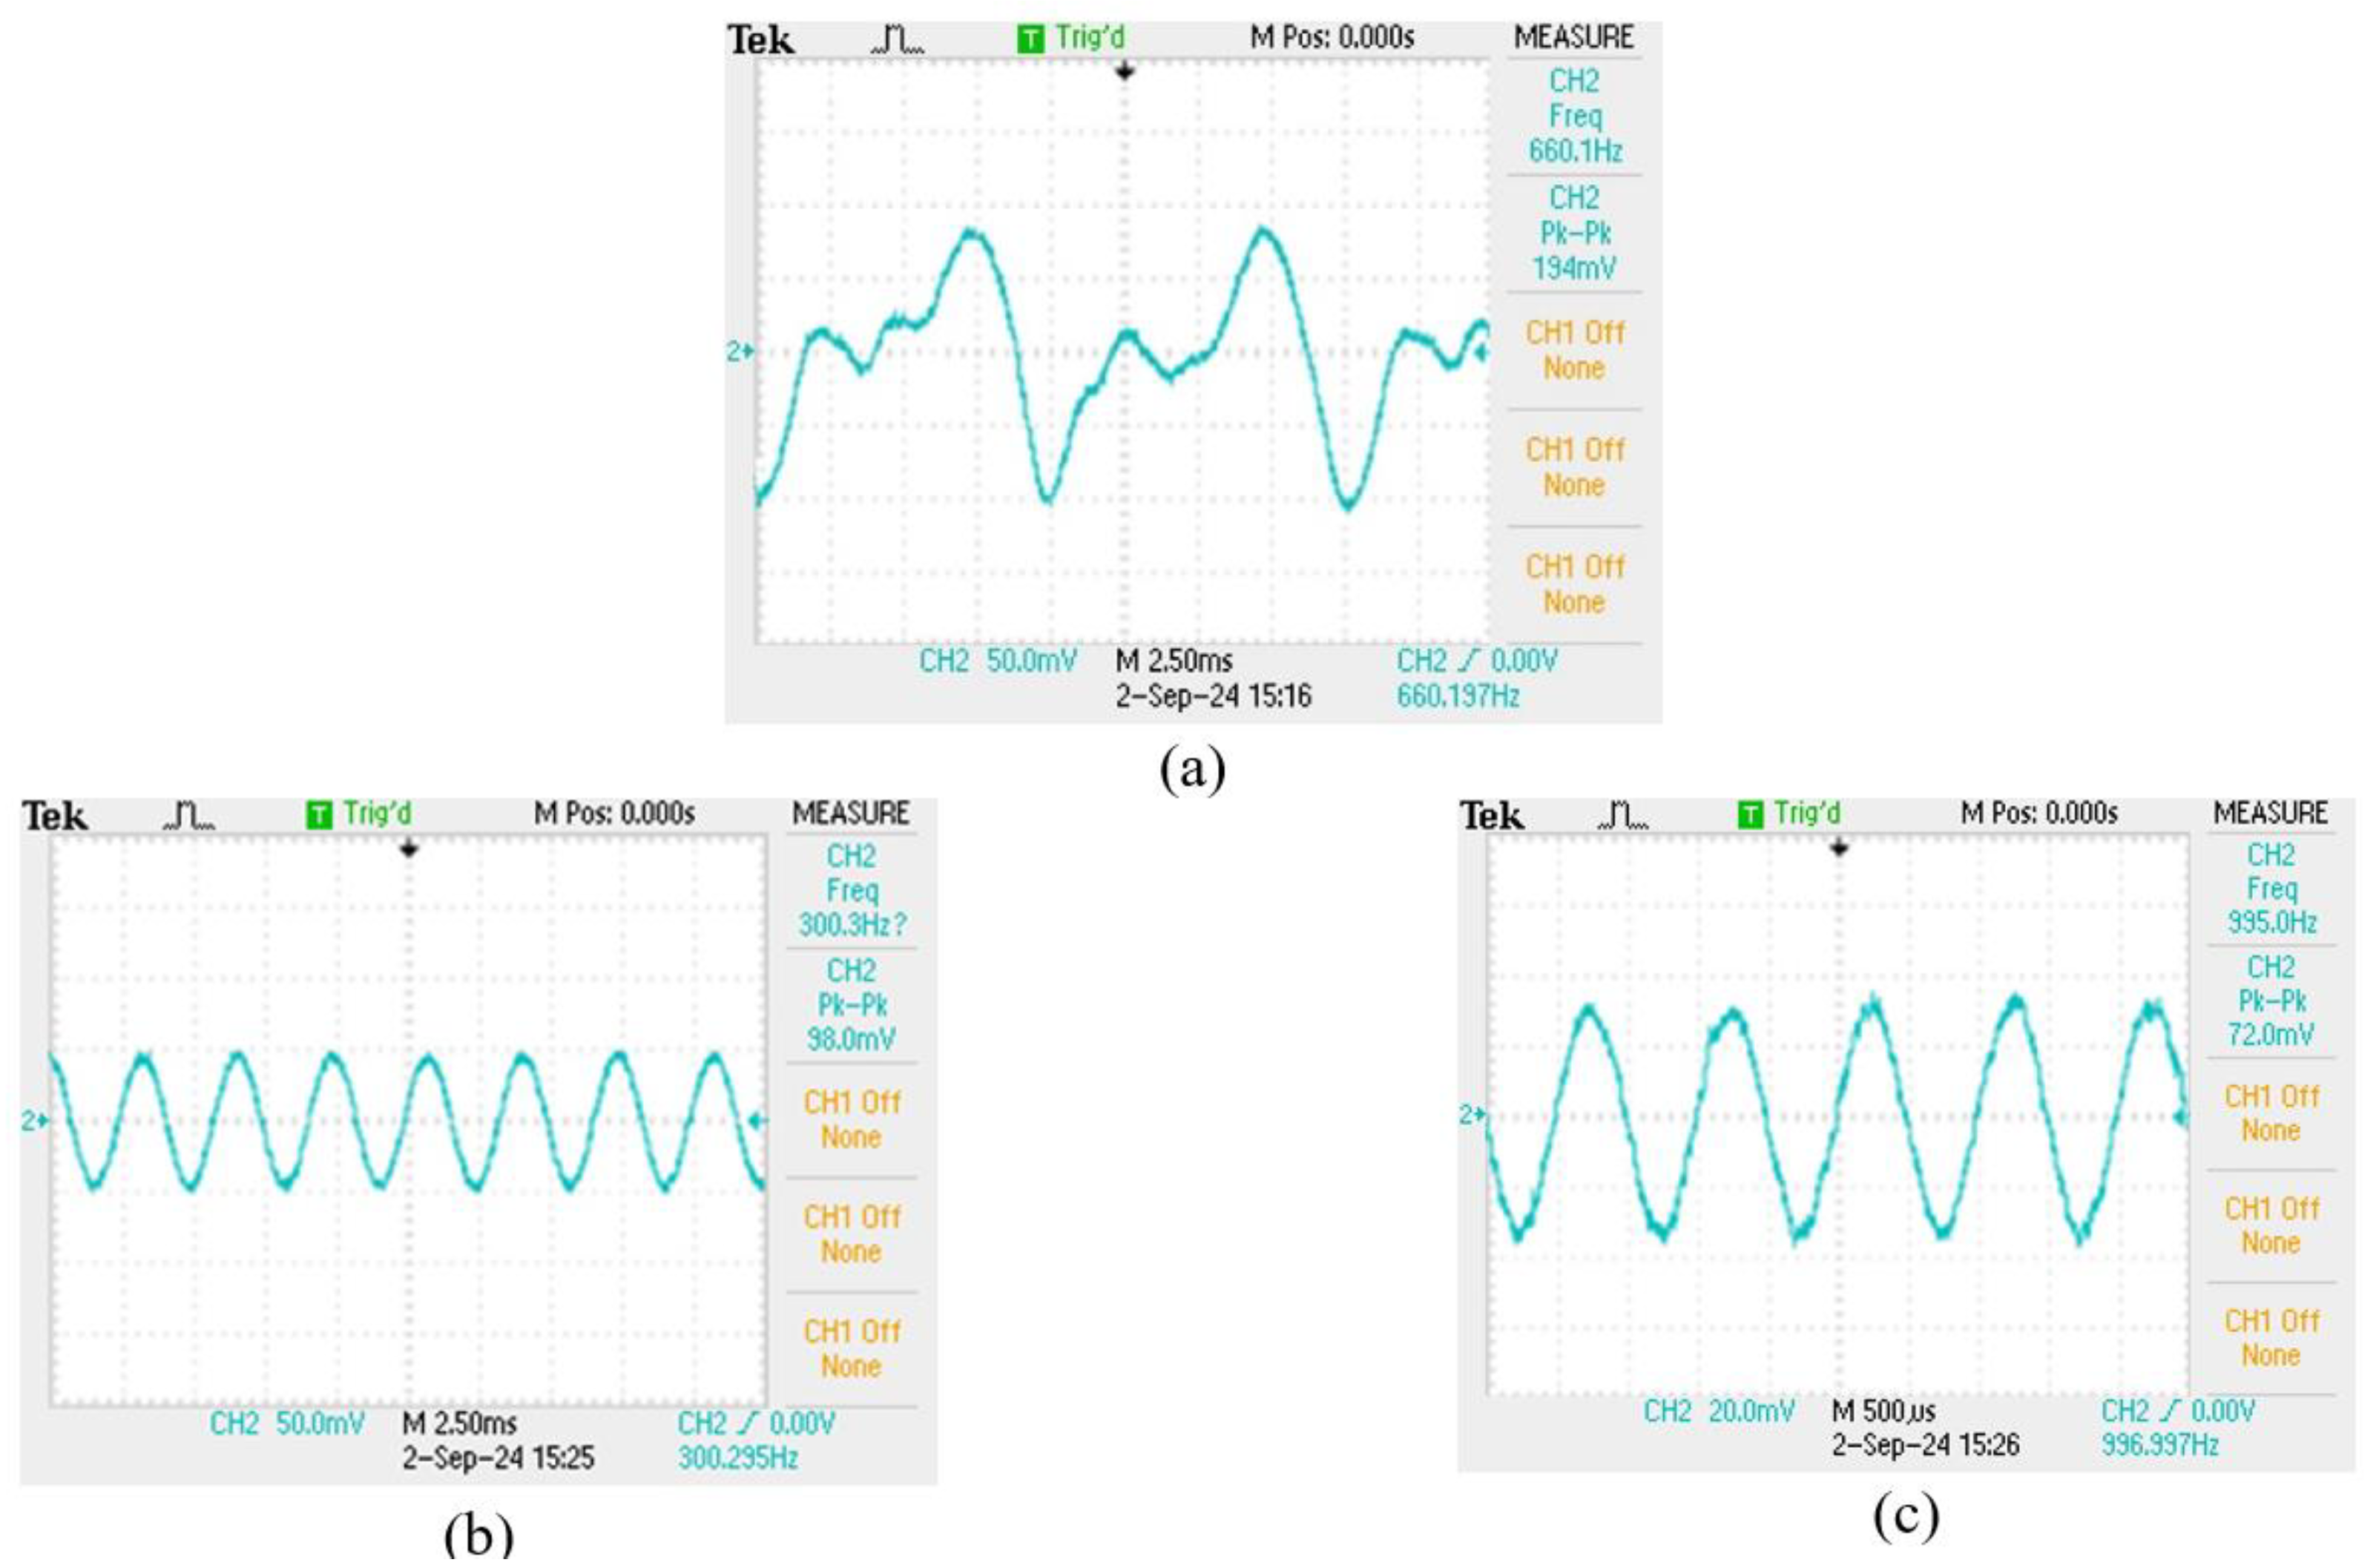
Figure 7.
Comparison of frequency response of film squeeze type and bare fiber grating.
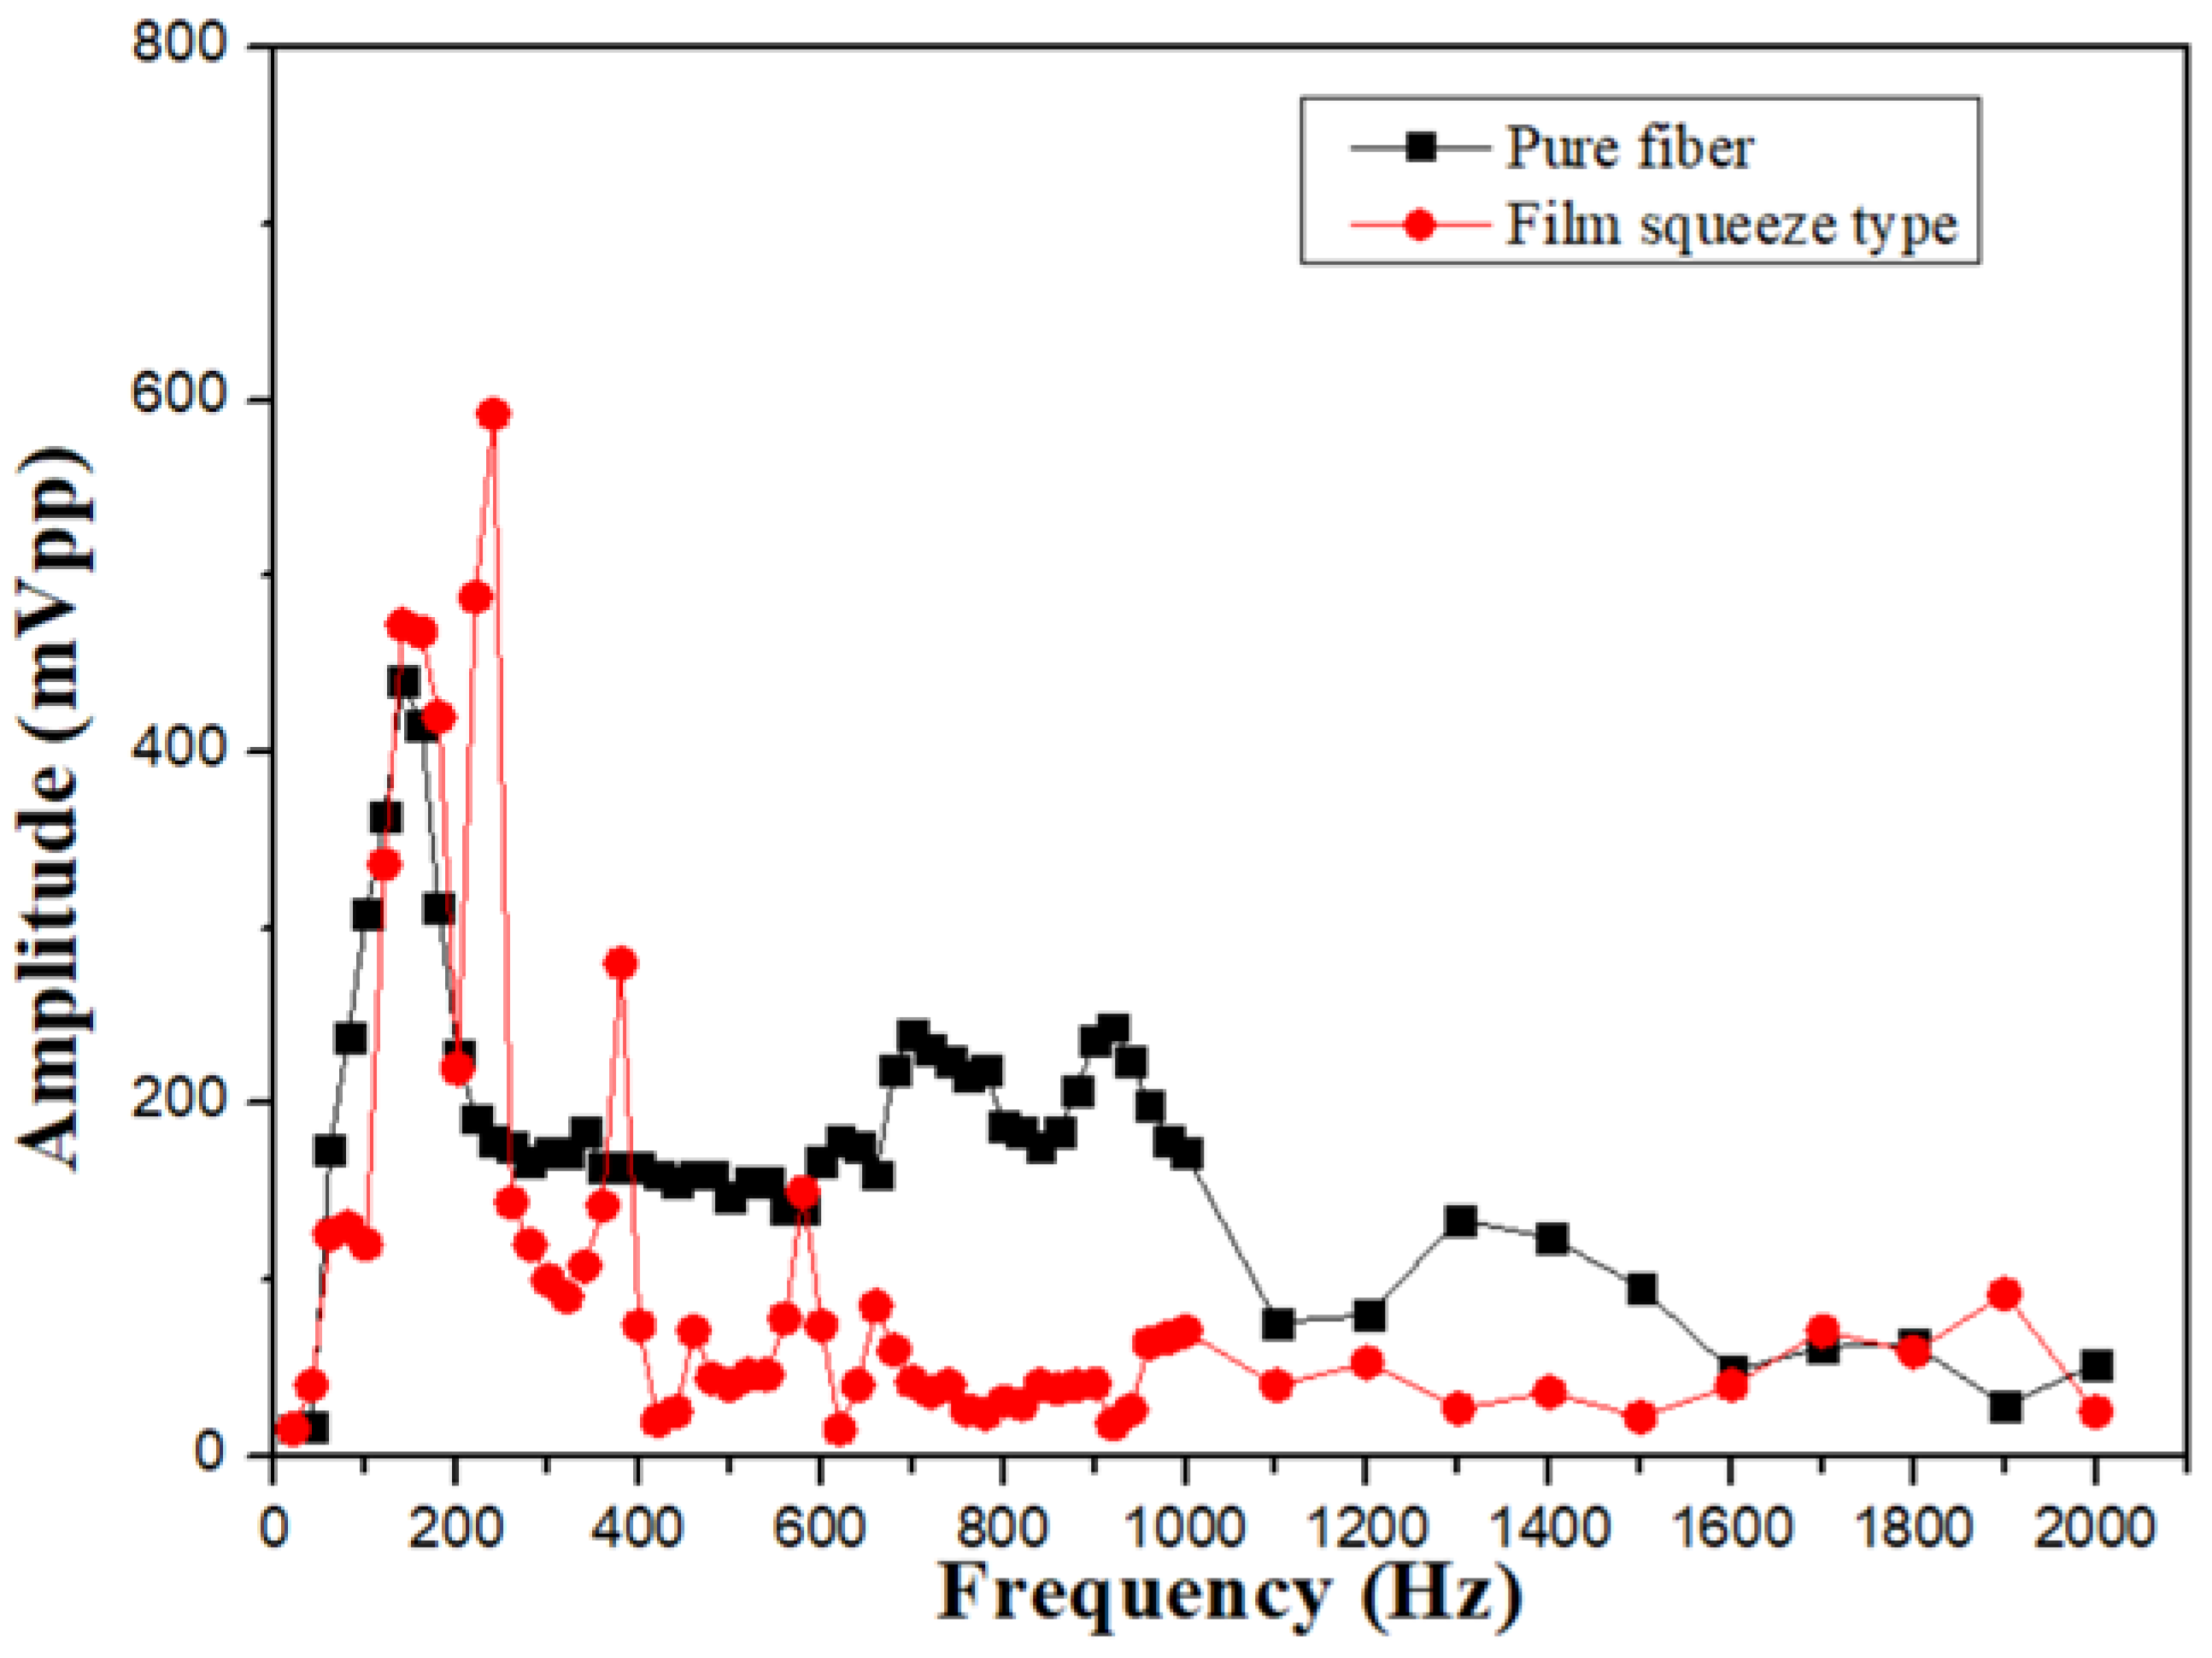
Figure 8.
(a) 100Hz sensing signal, (b) 400Hz sensing signal, (c) 2000Hz sensing signal, (d) 3100Hz sensing signal.
Figure 8.
(a) 100Hz sensing signal, (b) 400Hz sensing signal, (c) 2000Hz sensing signal, (d) 3100Hz sensing signal.
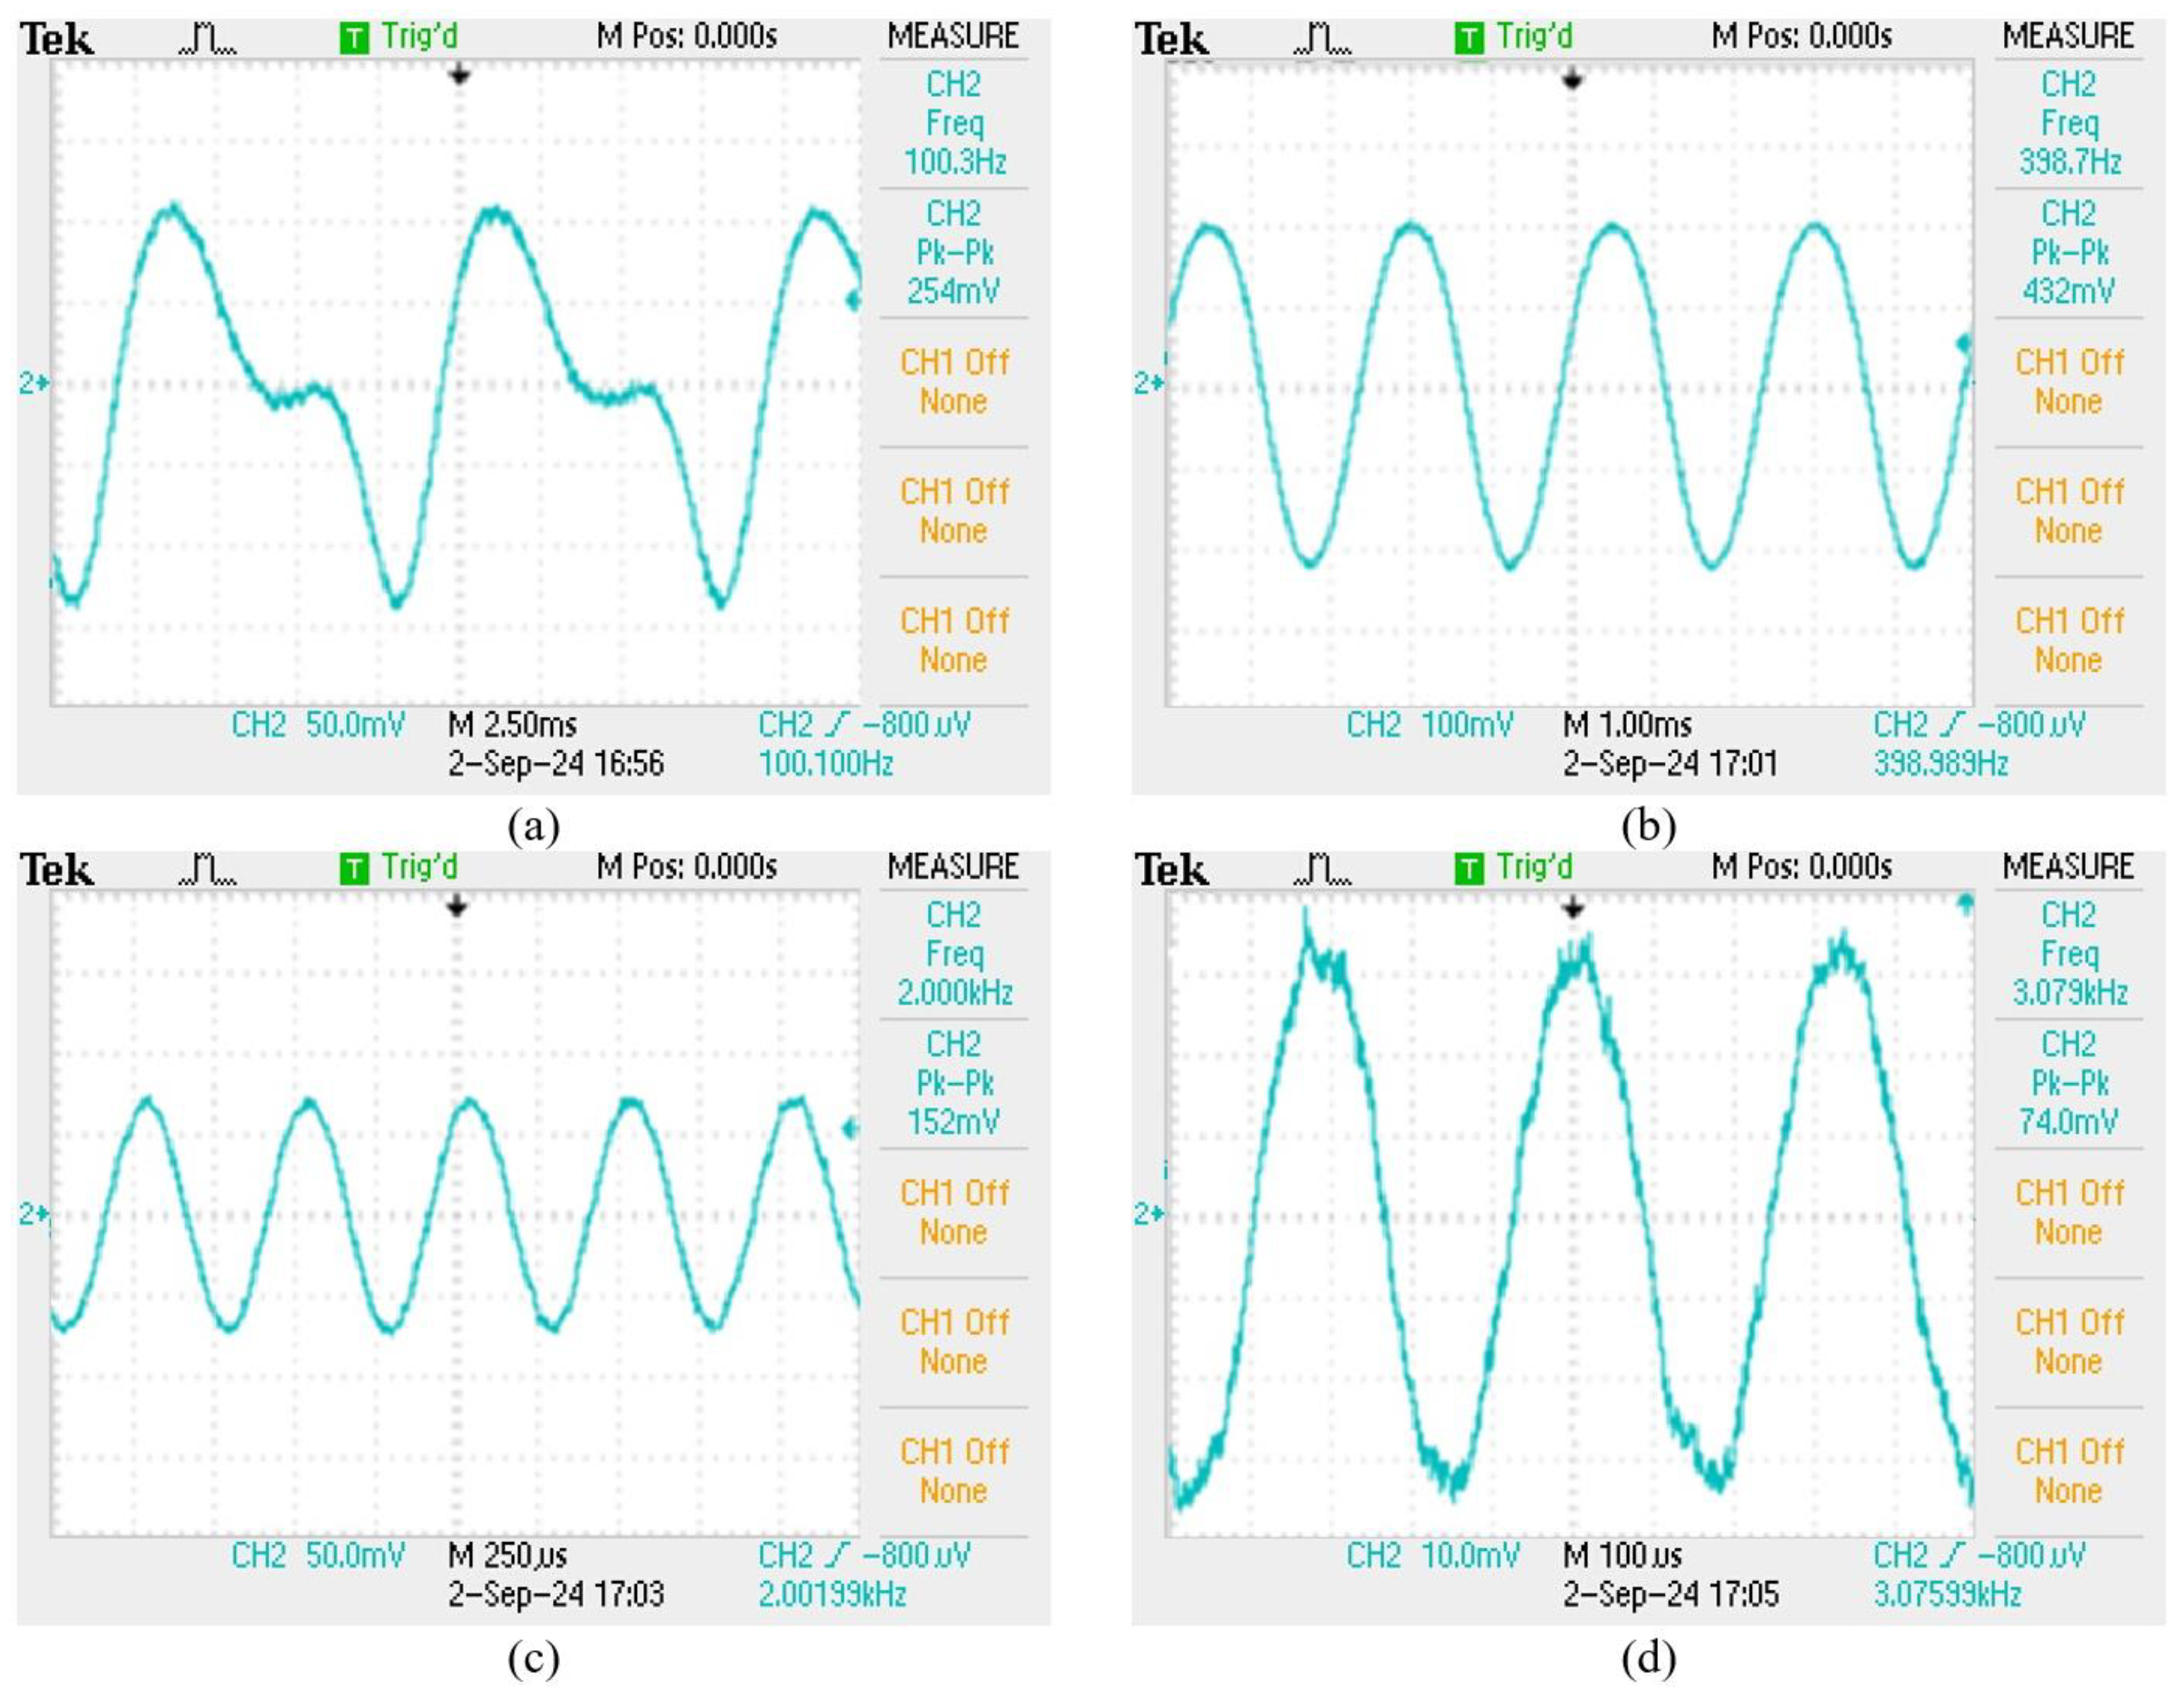
Figure 9.
Comparison of frequency response of elastic tape squeeze structure and unstructured fiber grating.
Figure 9.
Comparison of frequency response of elastic tape squeeze structure and unstructured fiber grating.
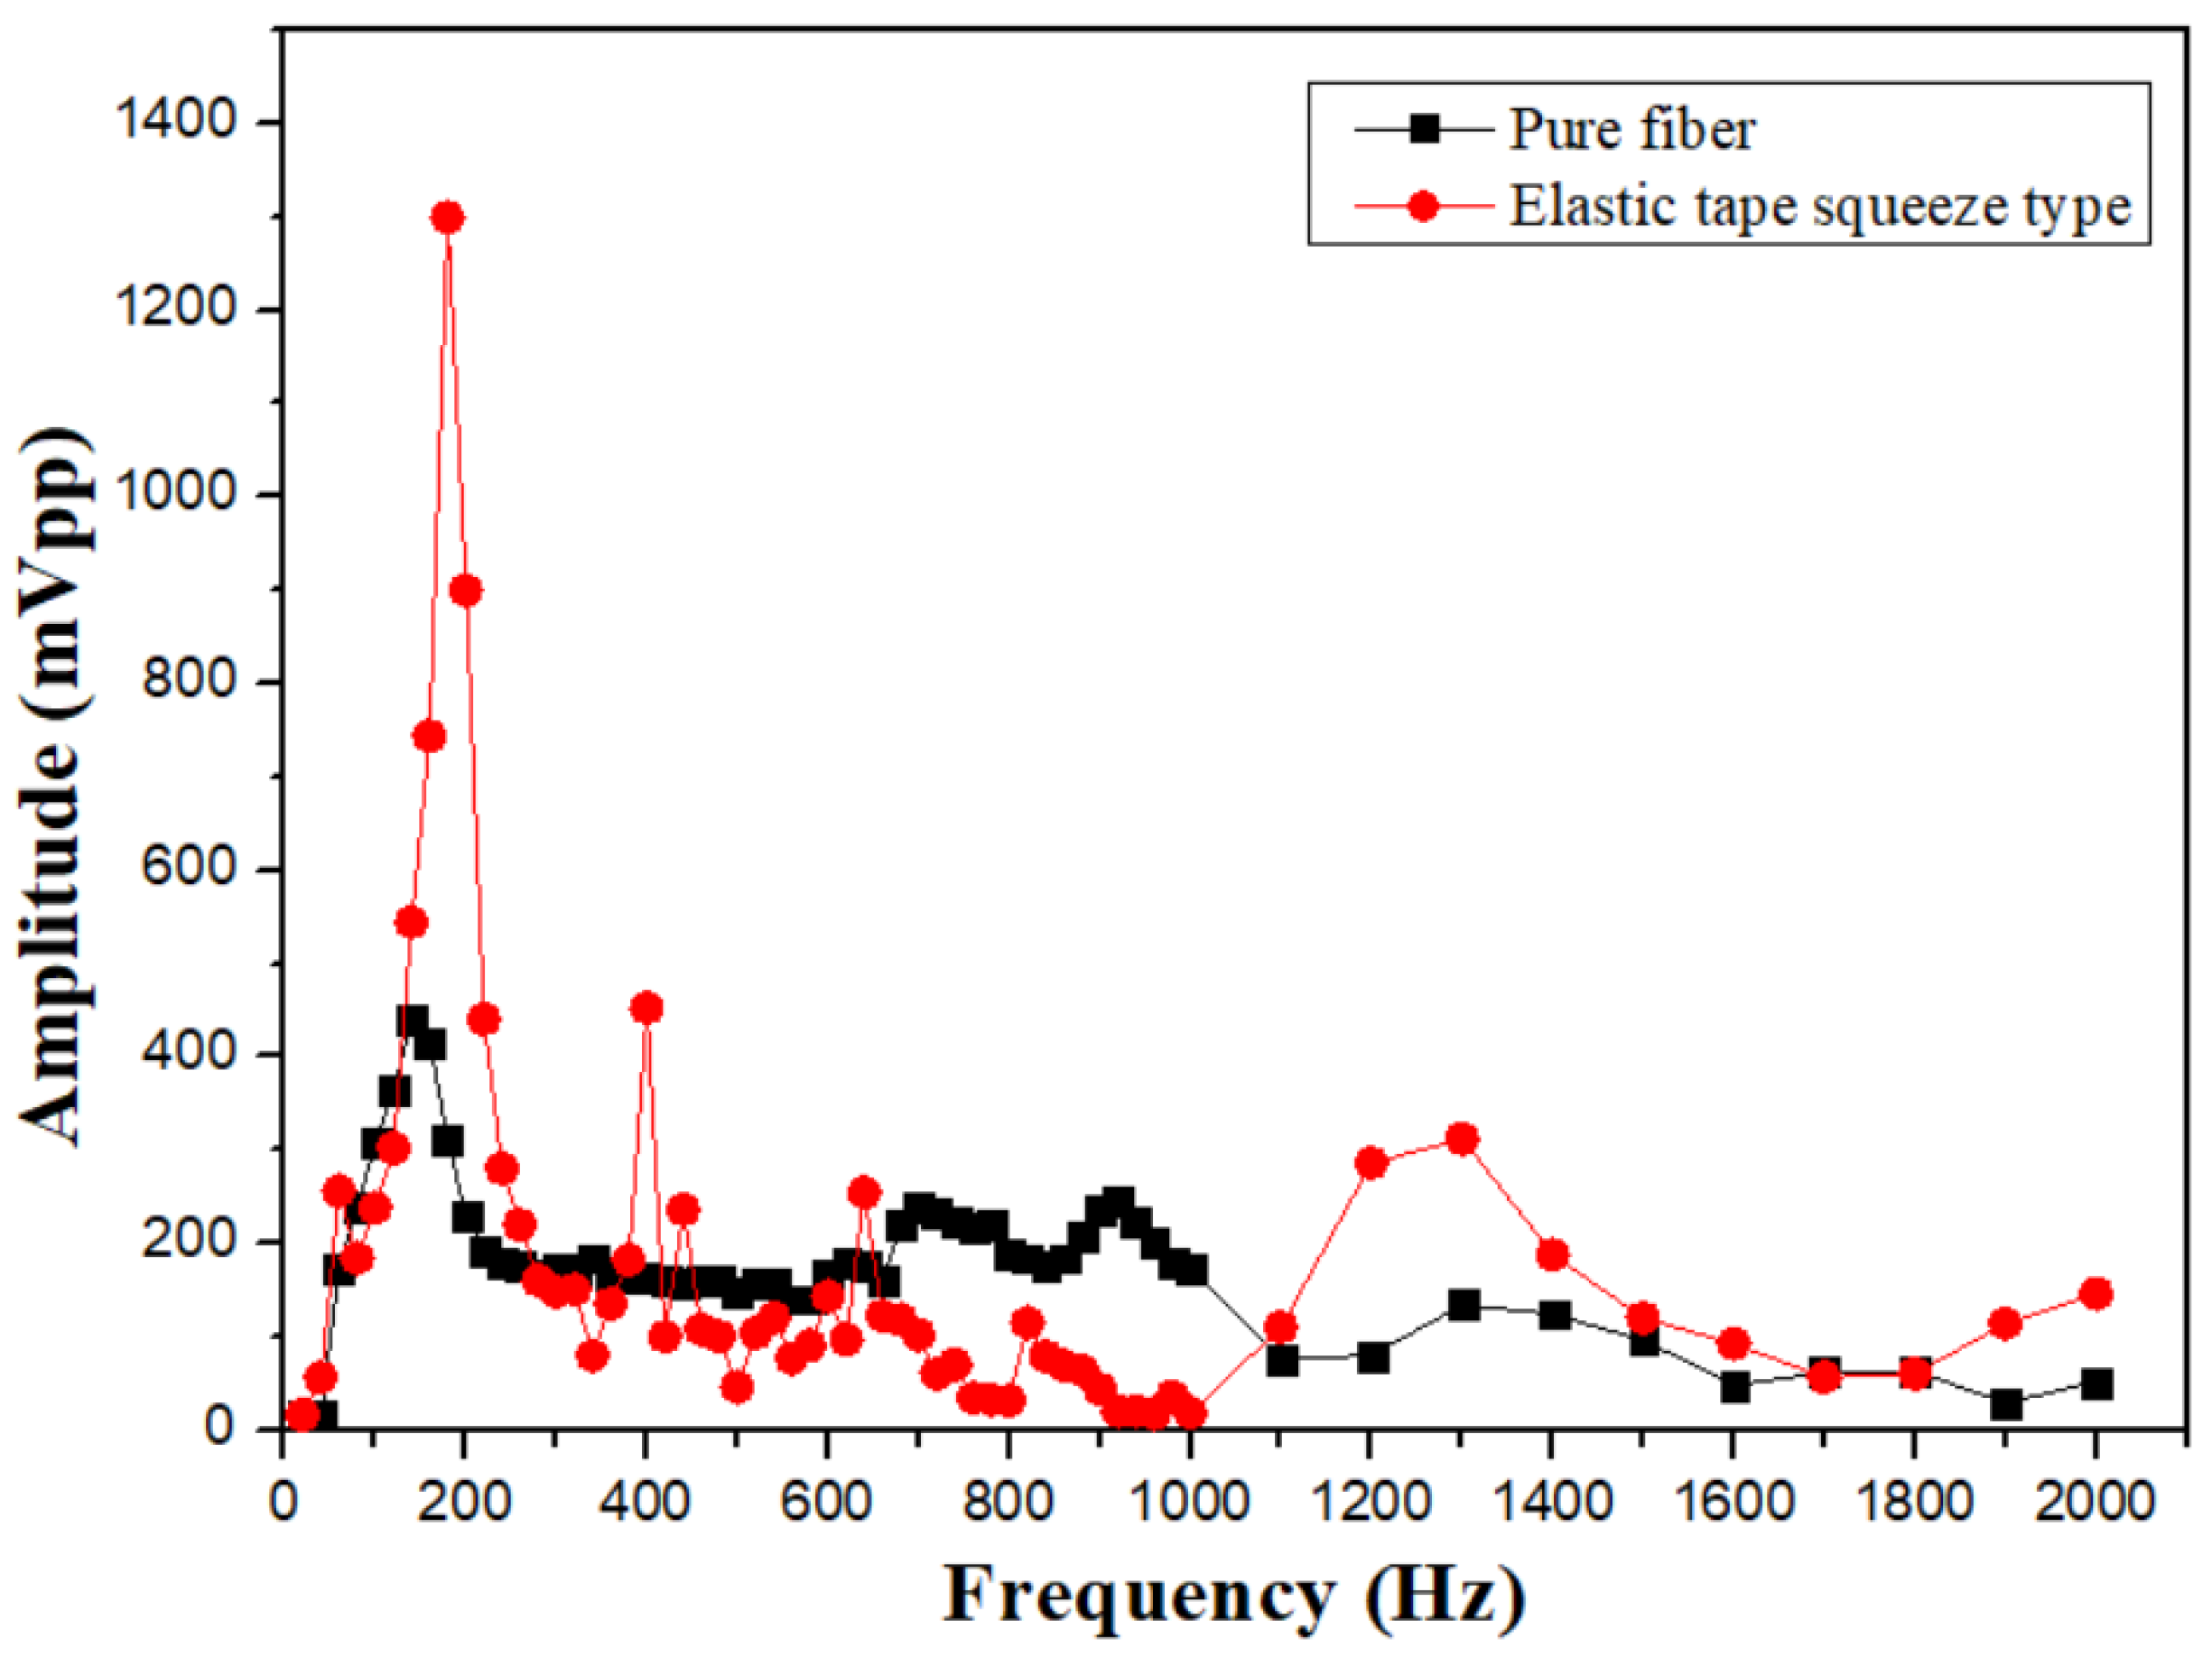
Figure 10.
The elastic-tape squeeze type with a probe.
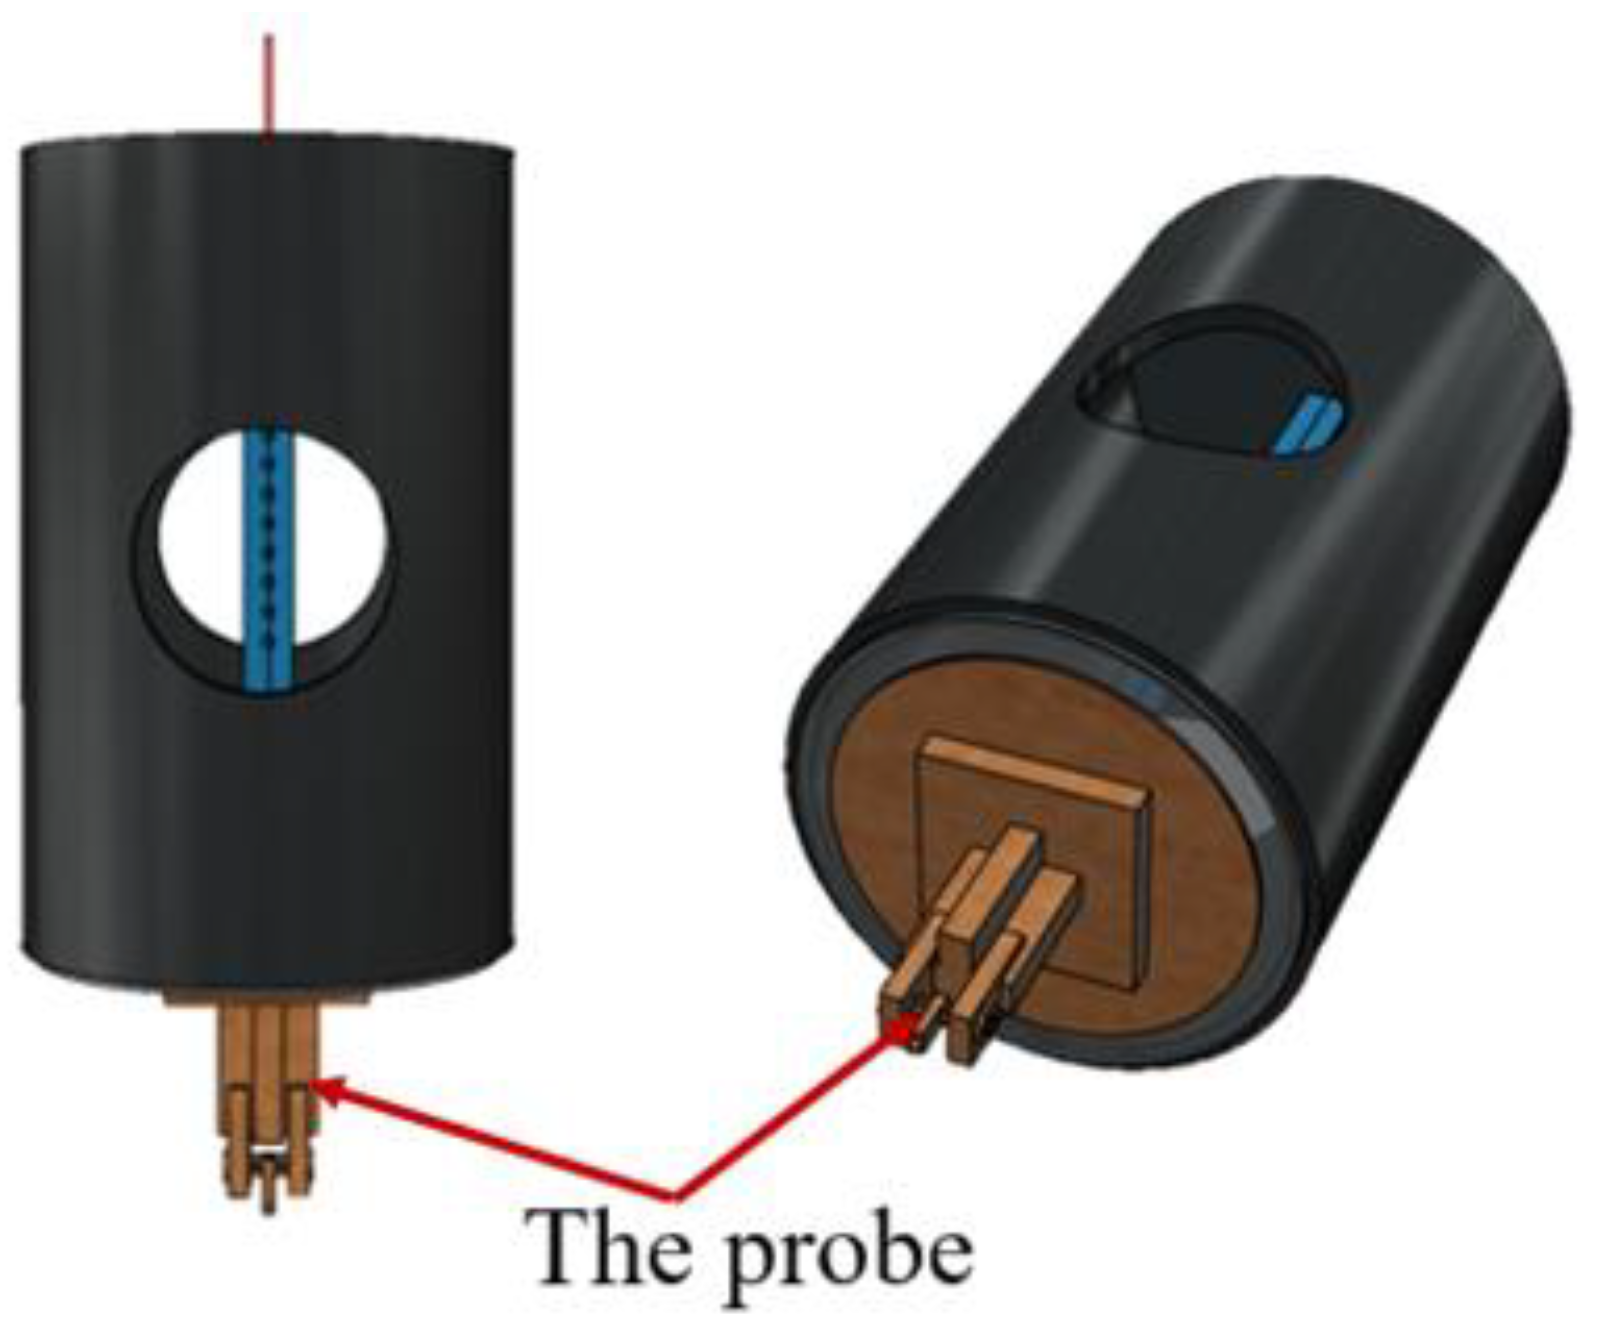
Figure 11.
The sensing signal of 10 Hz and sensing signal of 500Hz.
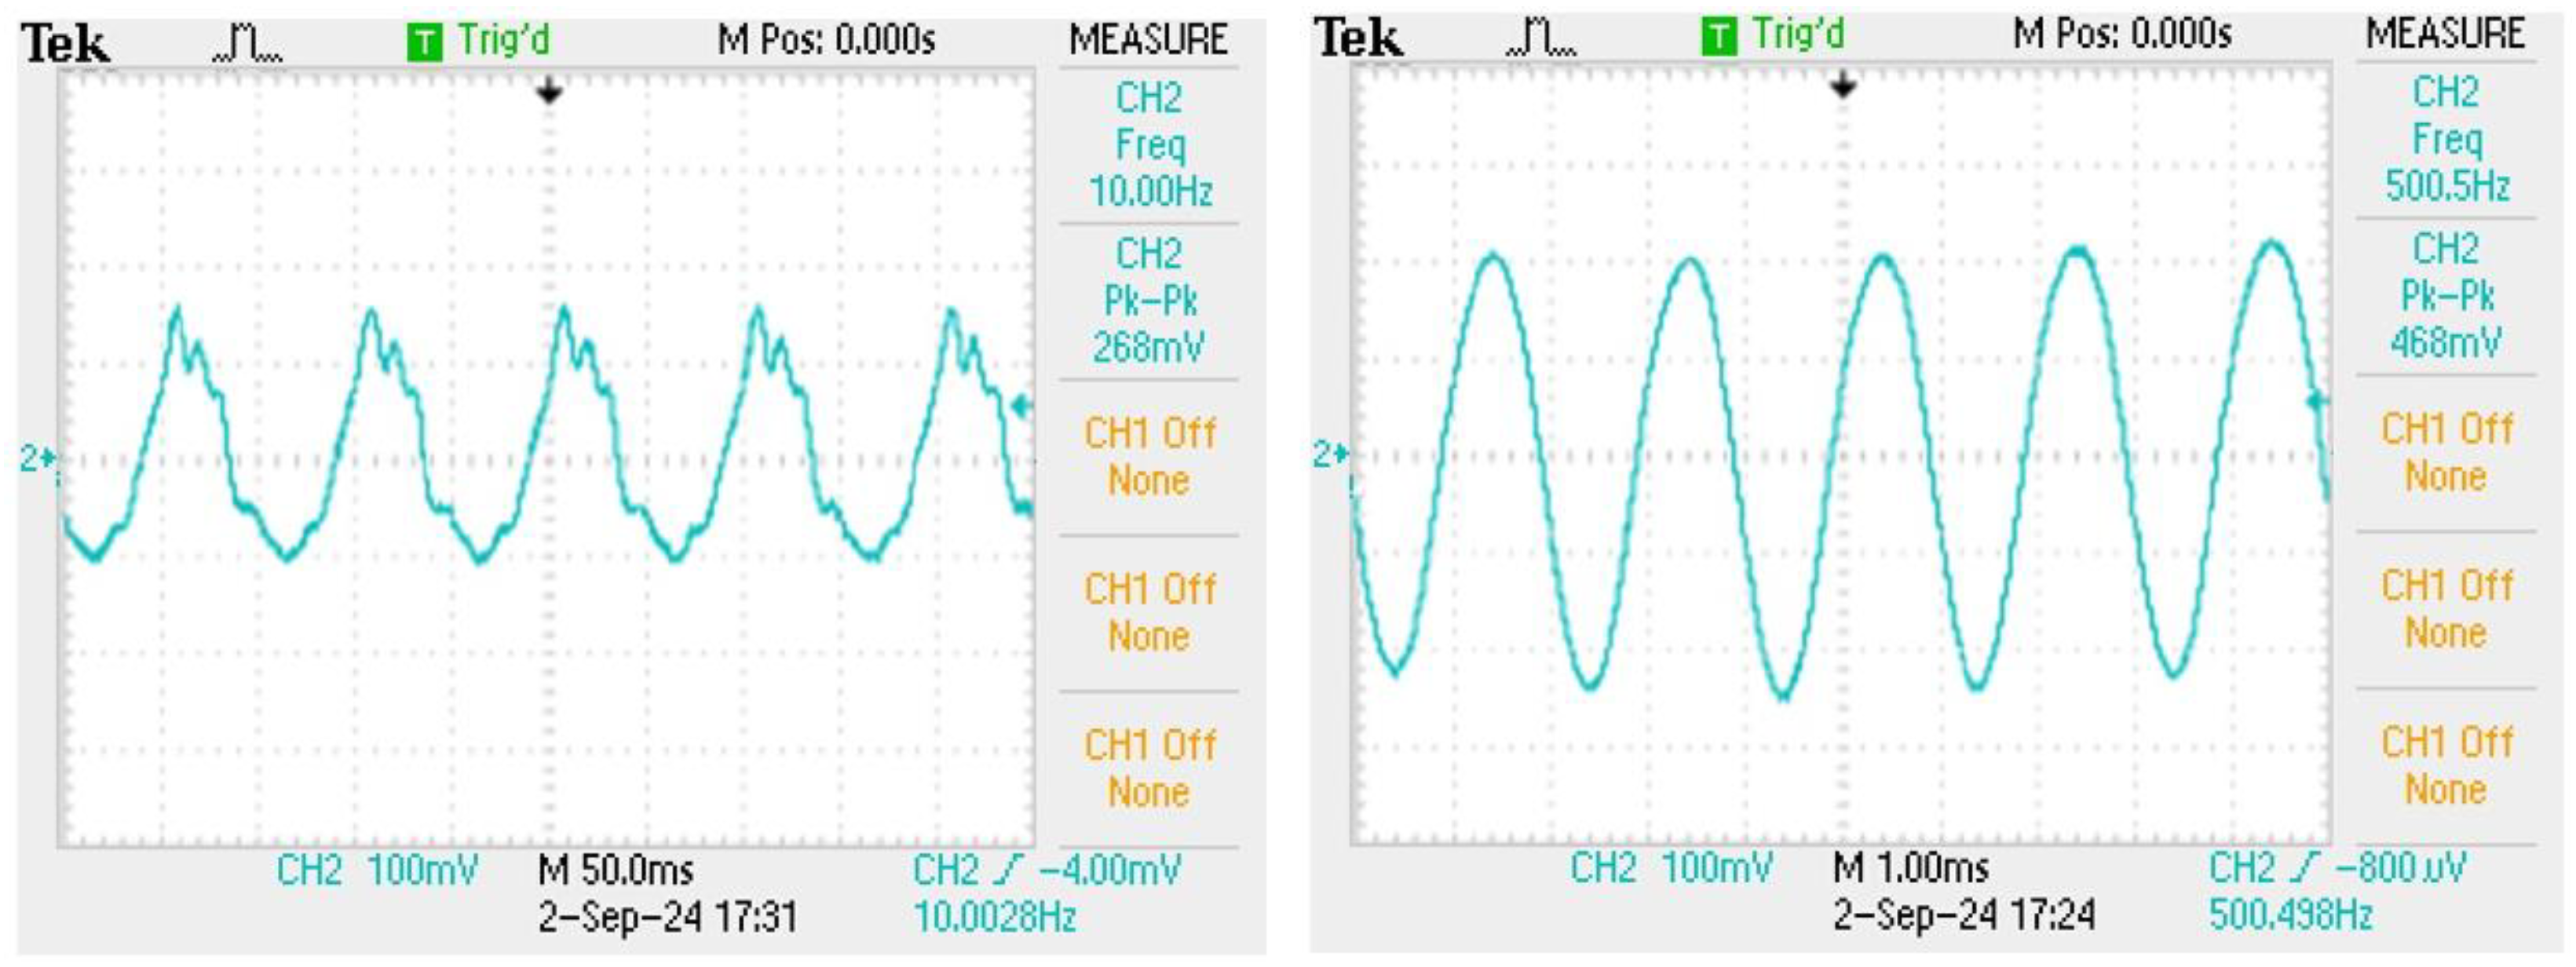
Figure 12.
Comparison of frequency response of new film squeeze and unstructured fiber grating.
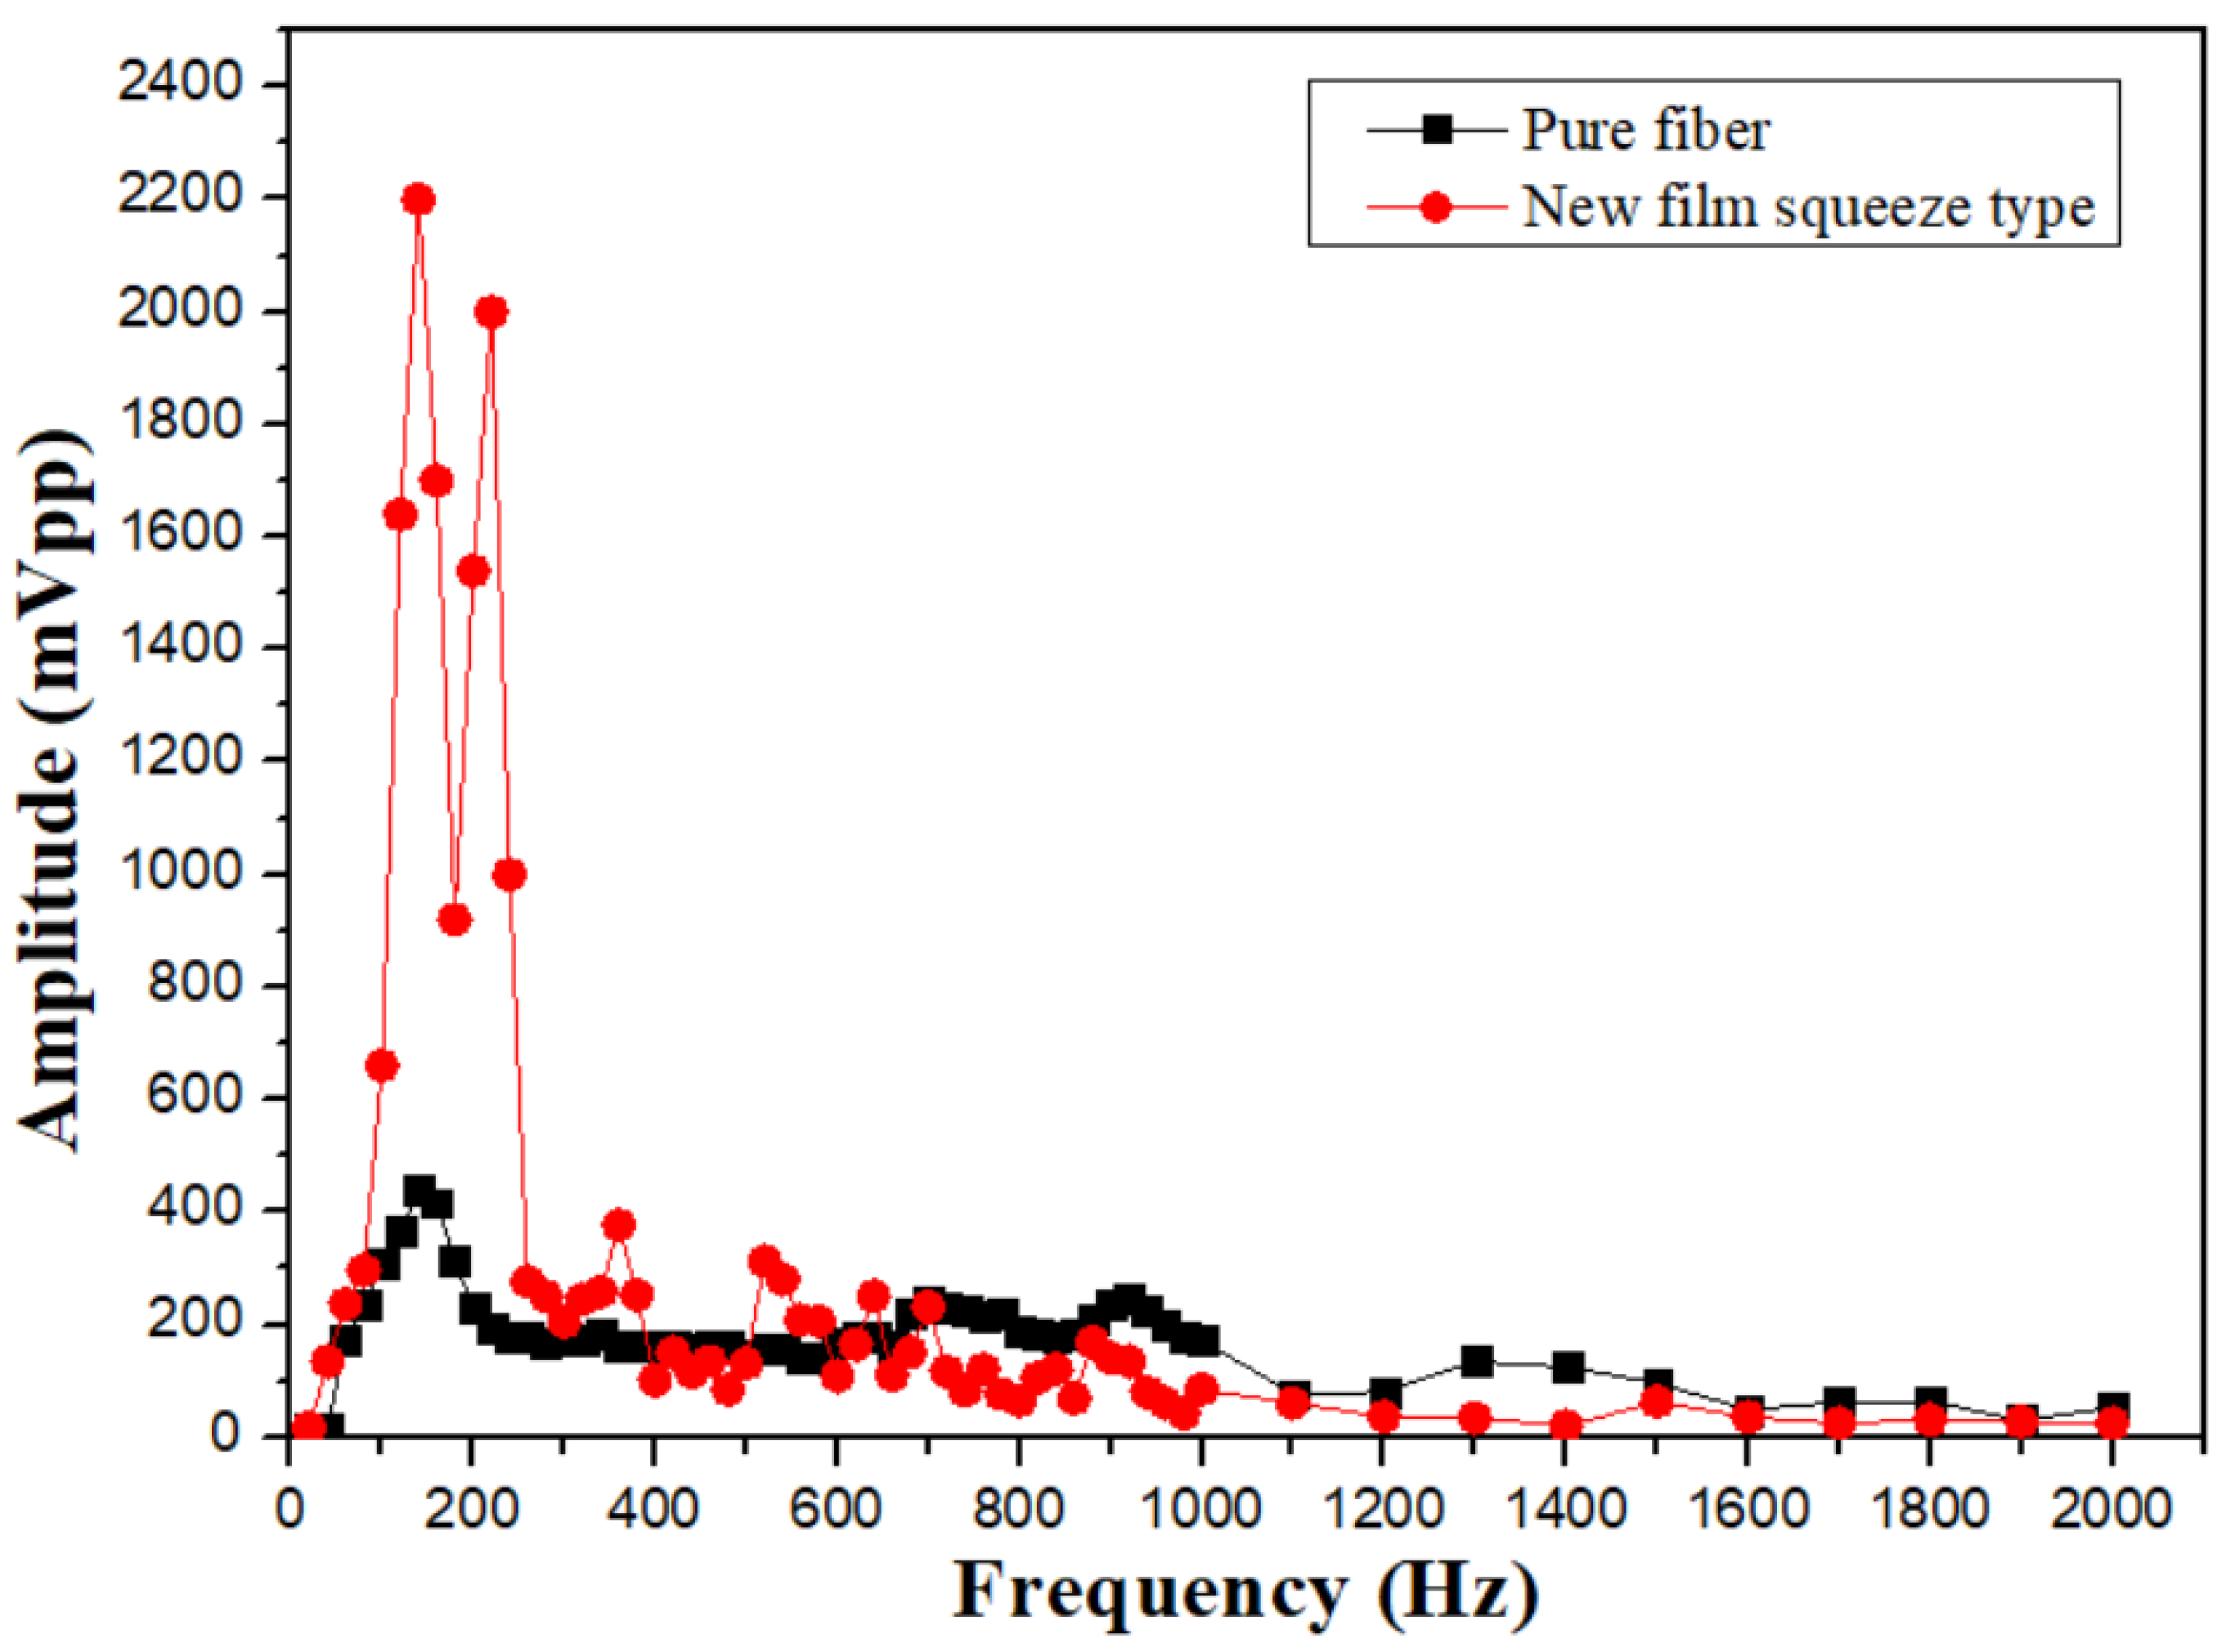
Figure 13.
The sensing signals with different vibration amplitude and frequency.
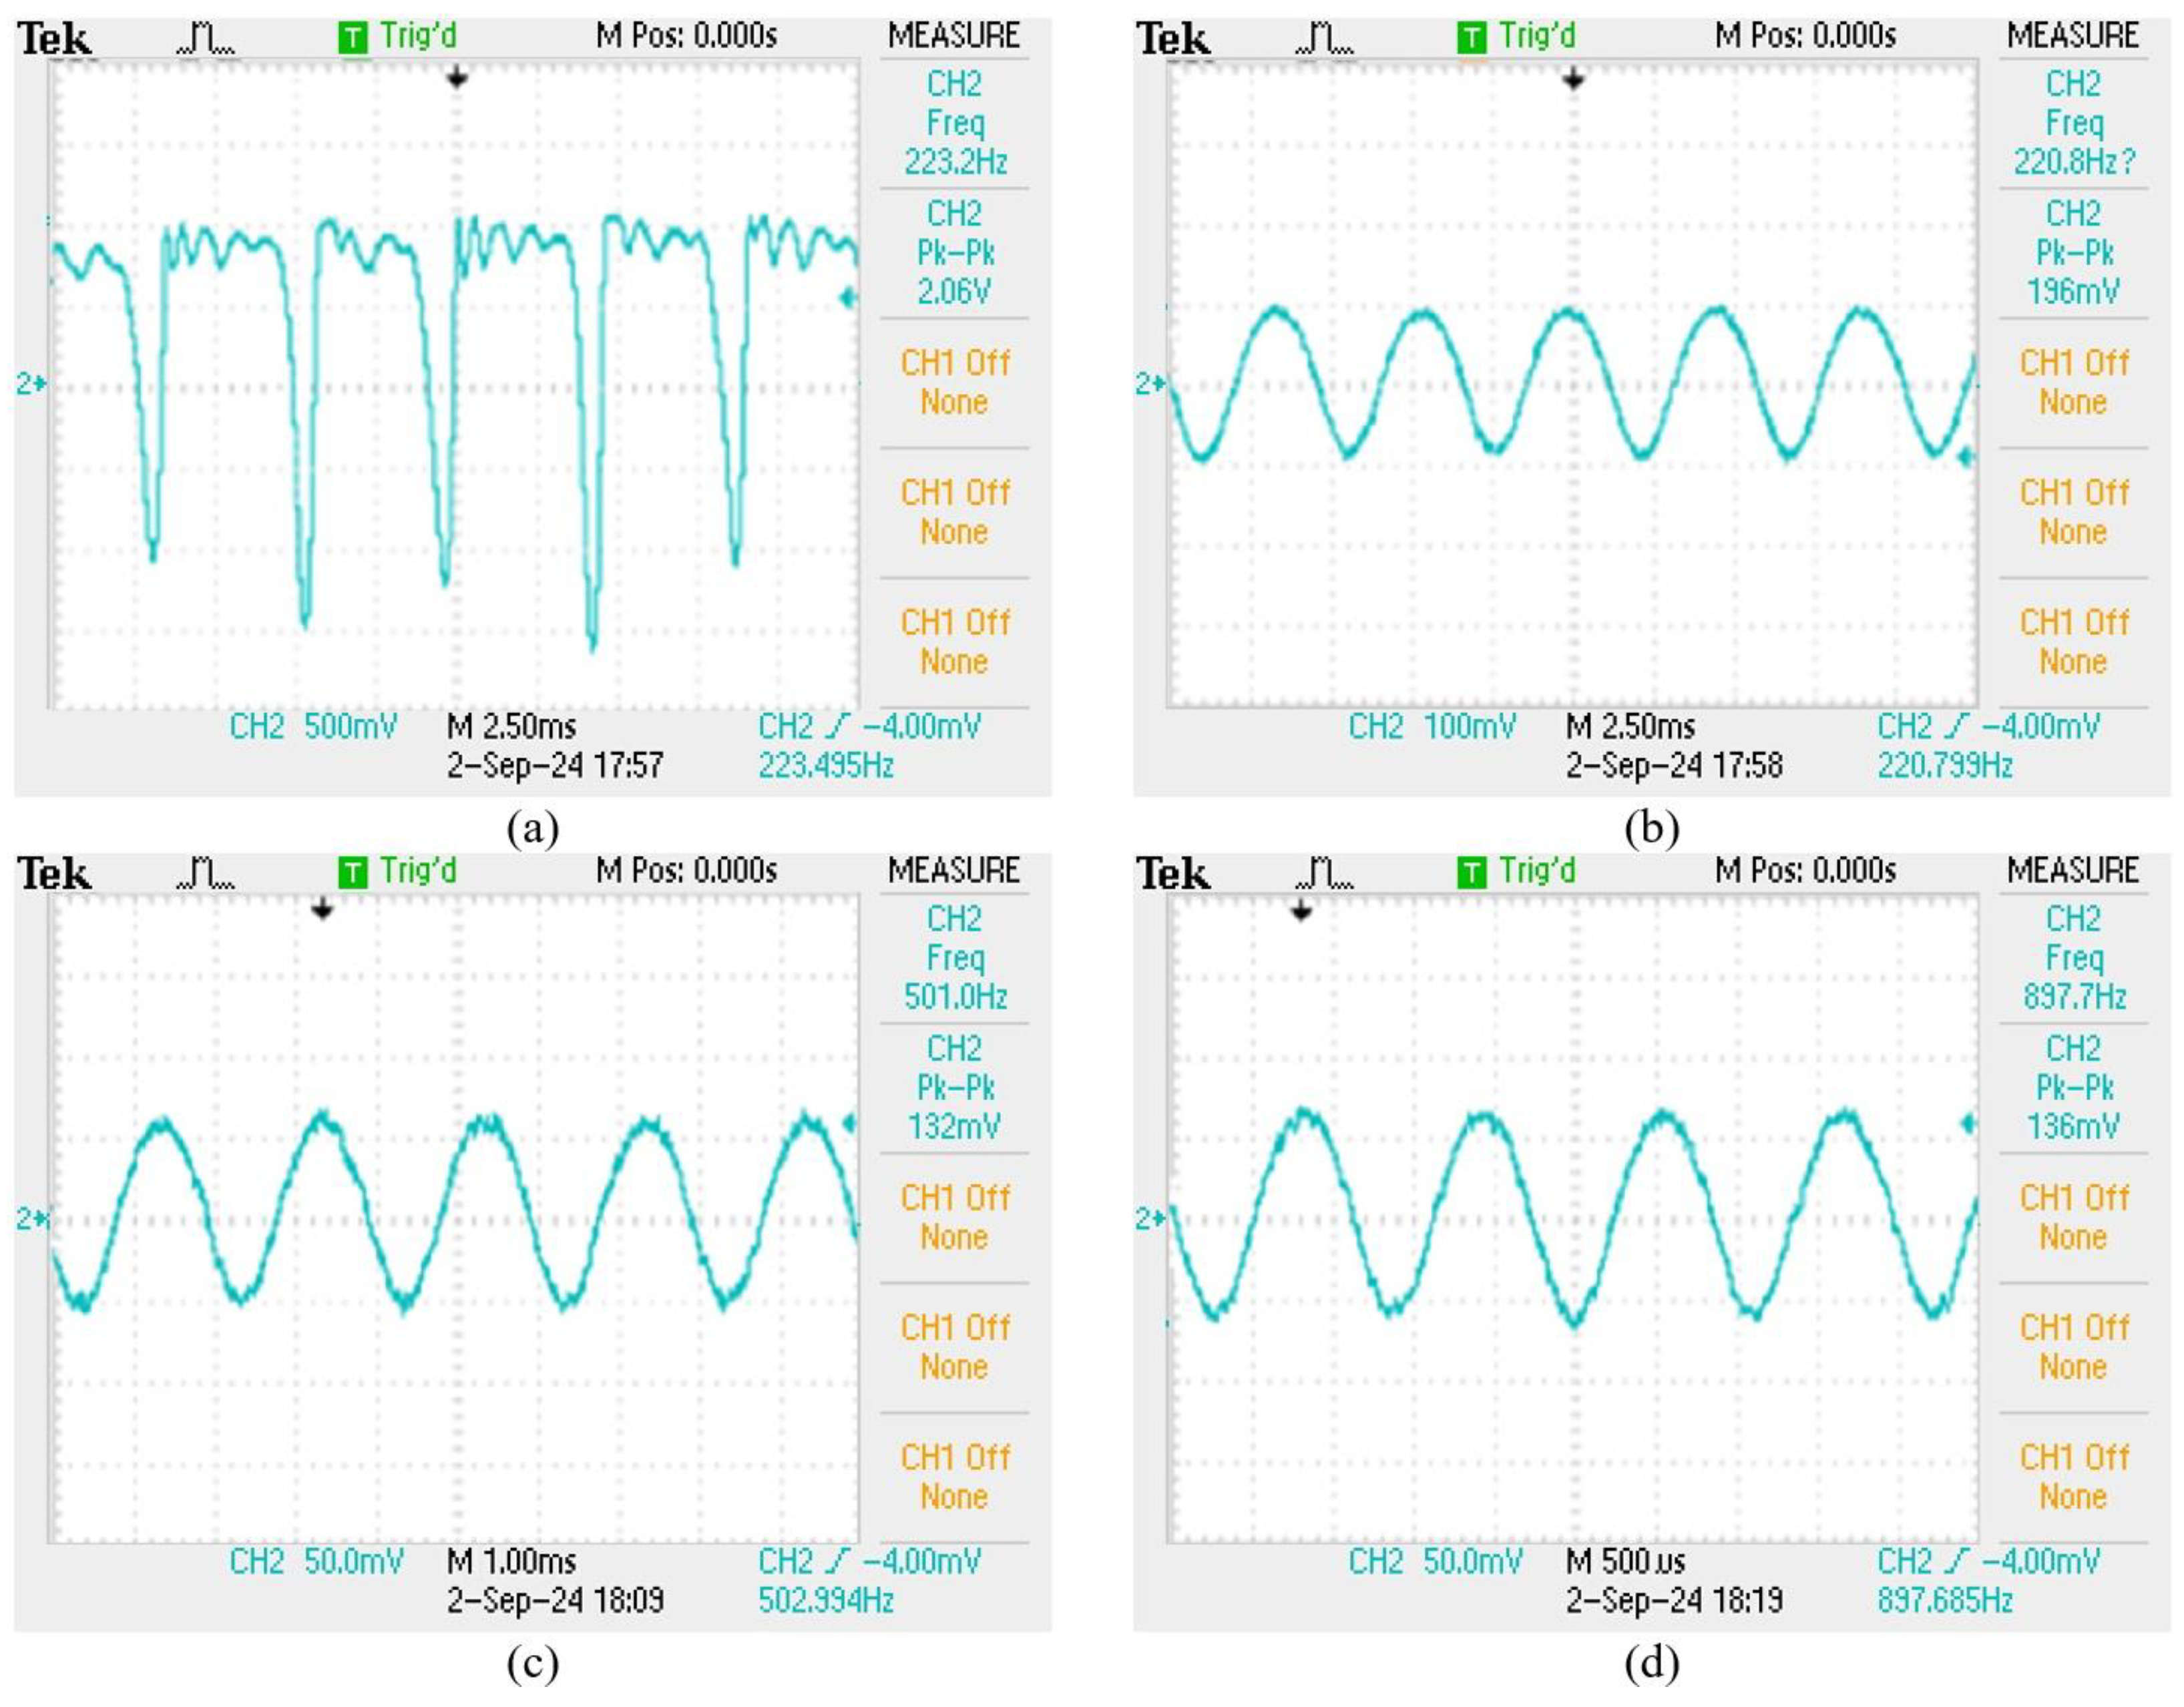
Figure 14.
The relationship between vibration signal and sensing amplitude.
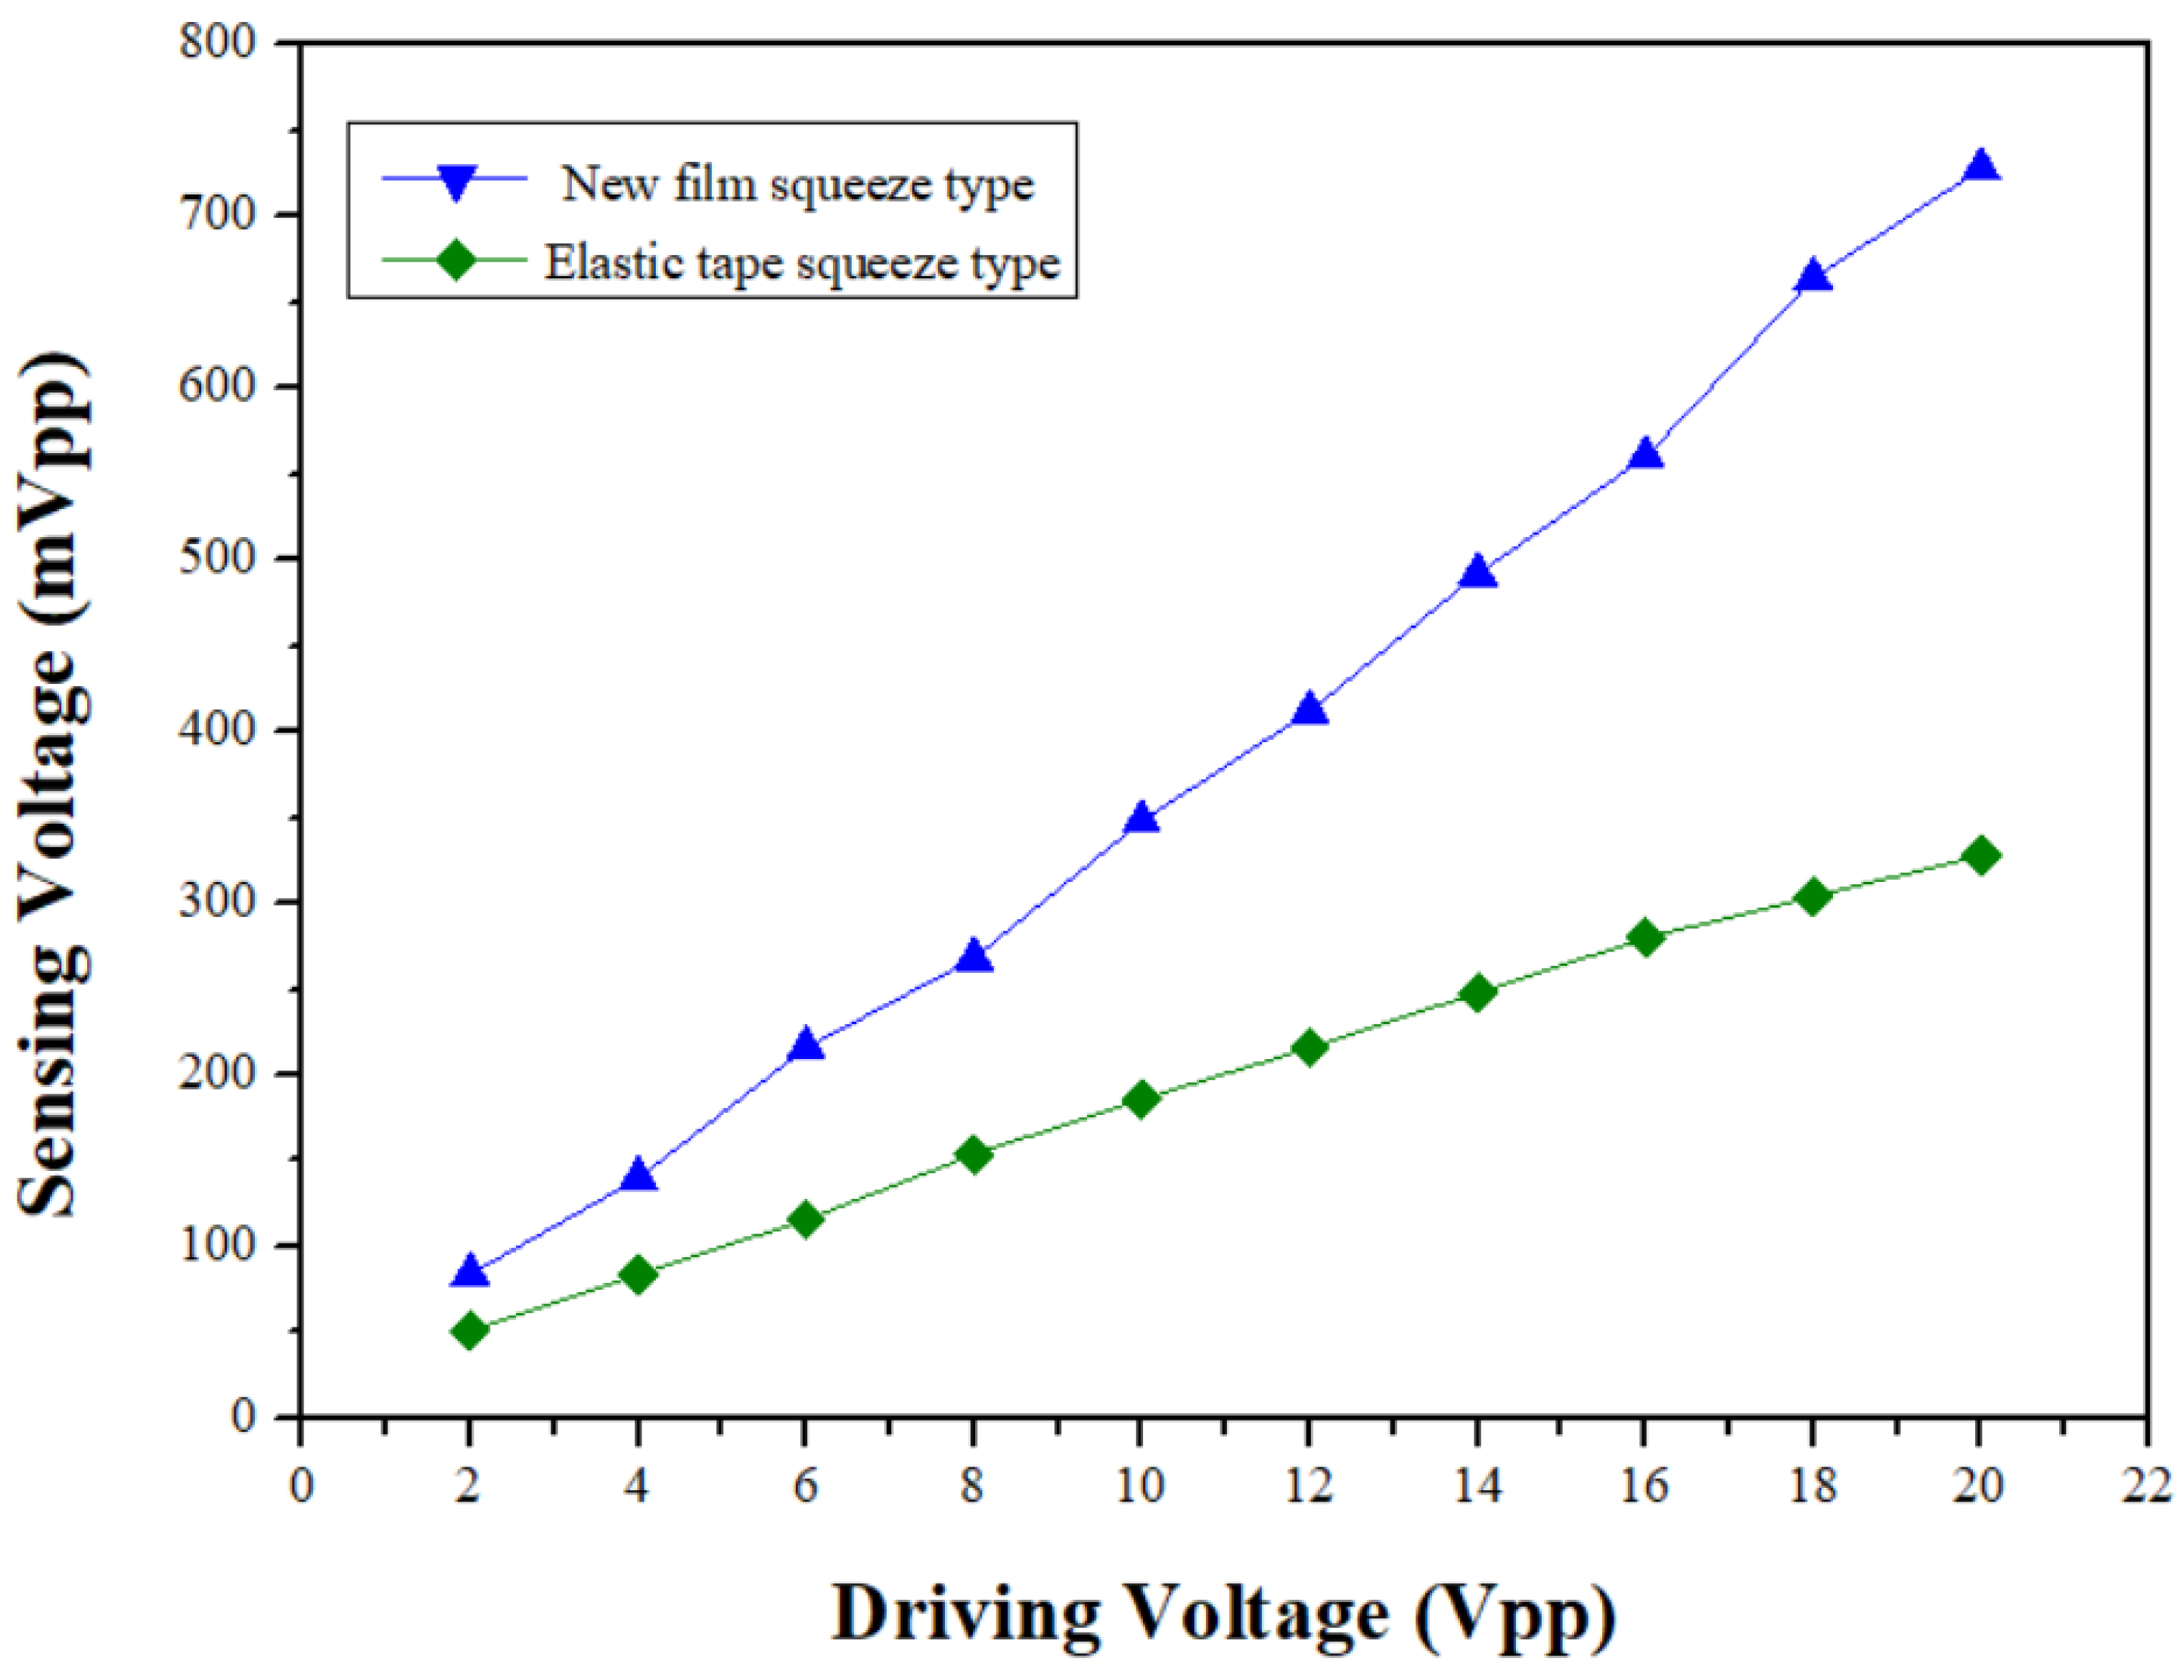
Figure 15.
A signal frequency varies with time series (100Hz~300Hz).
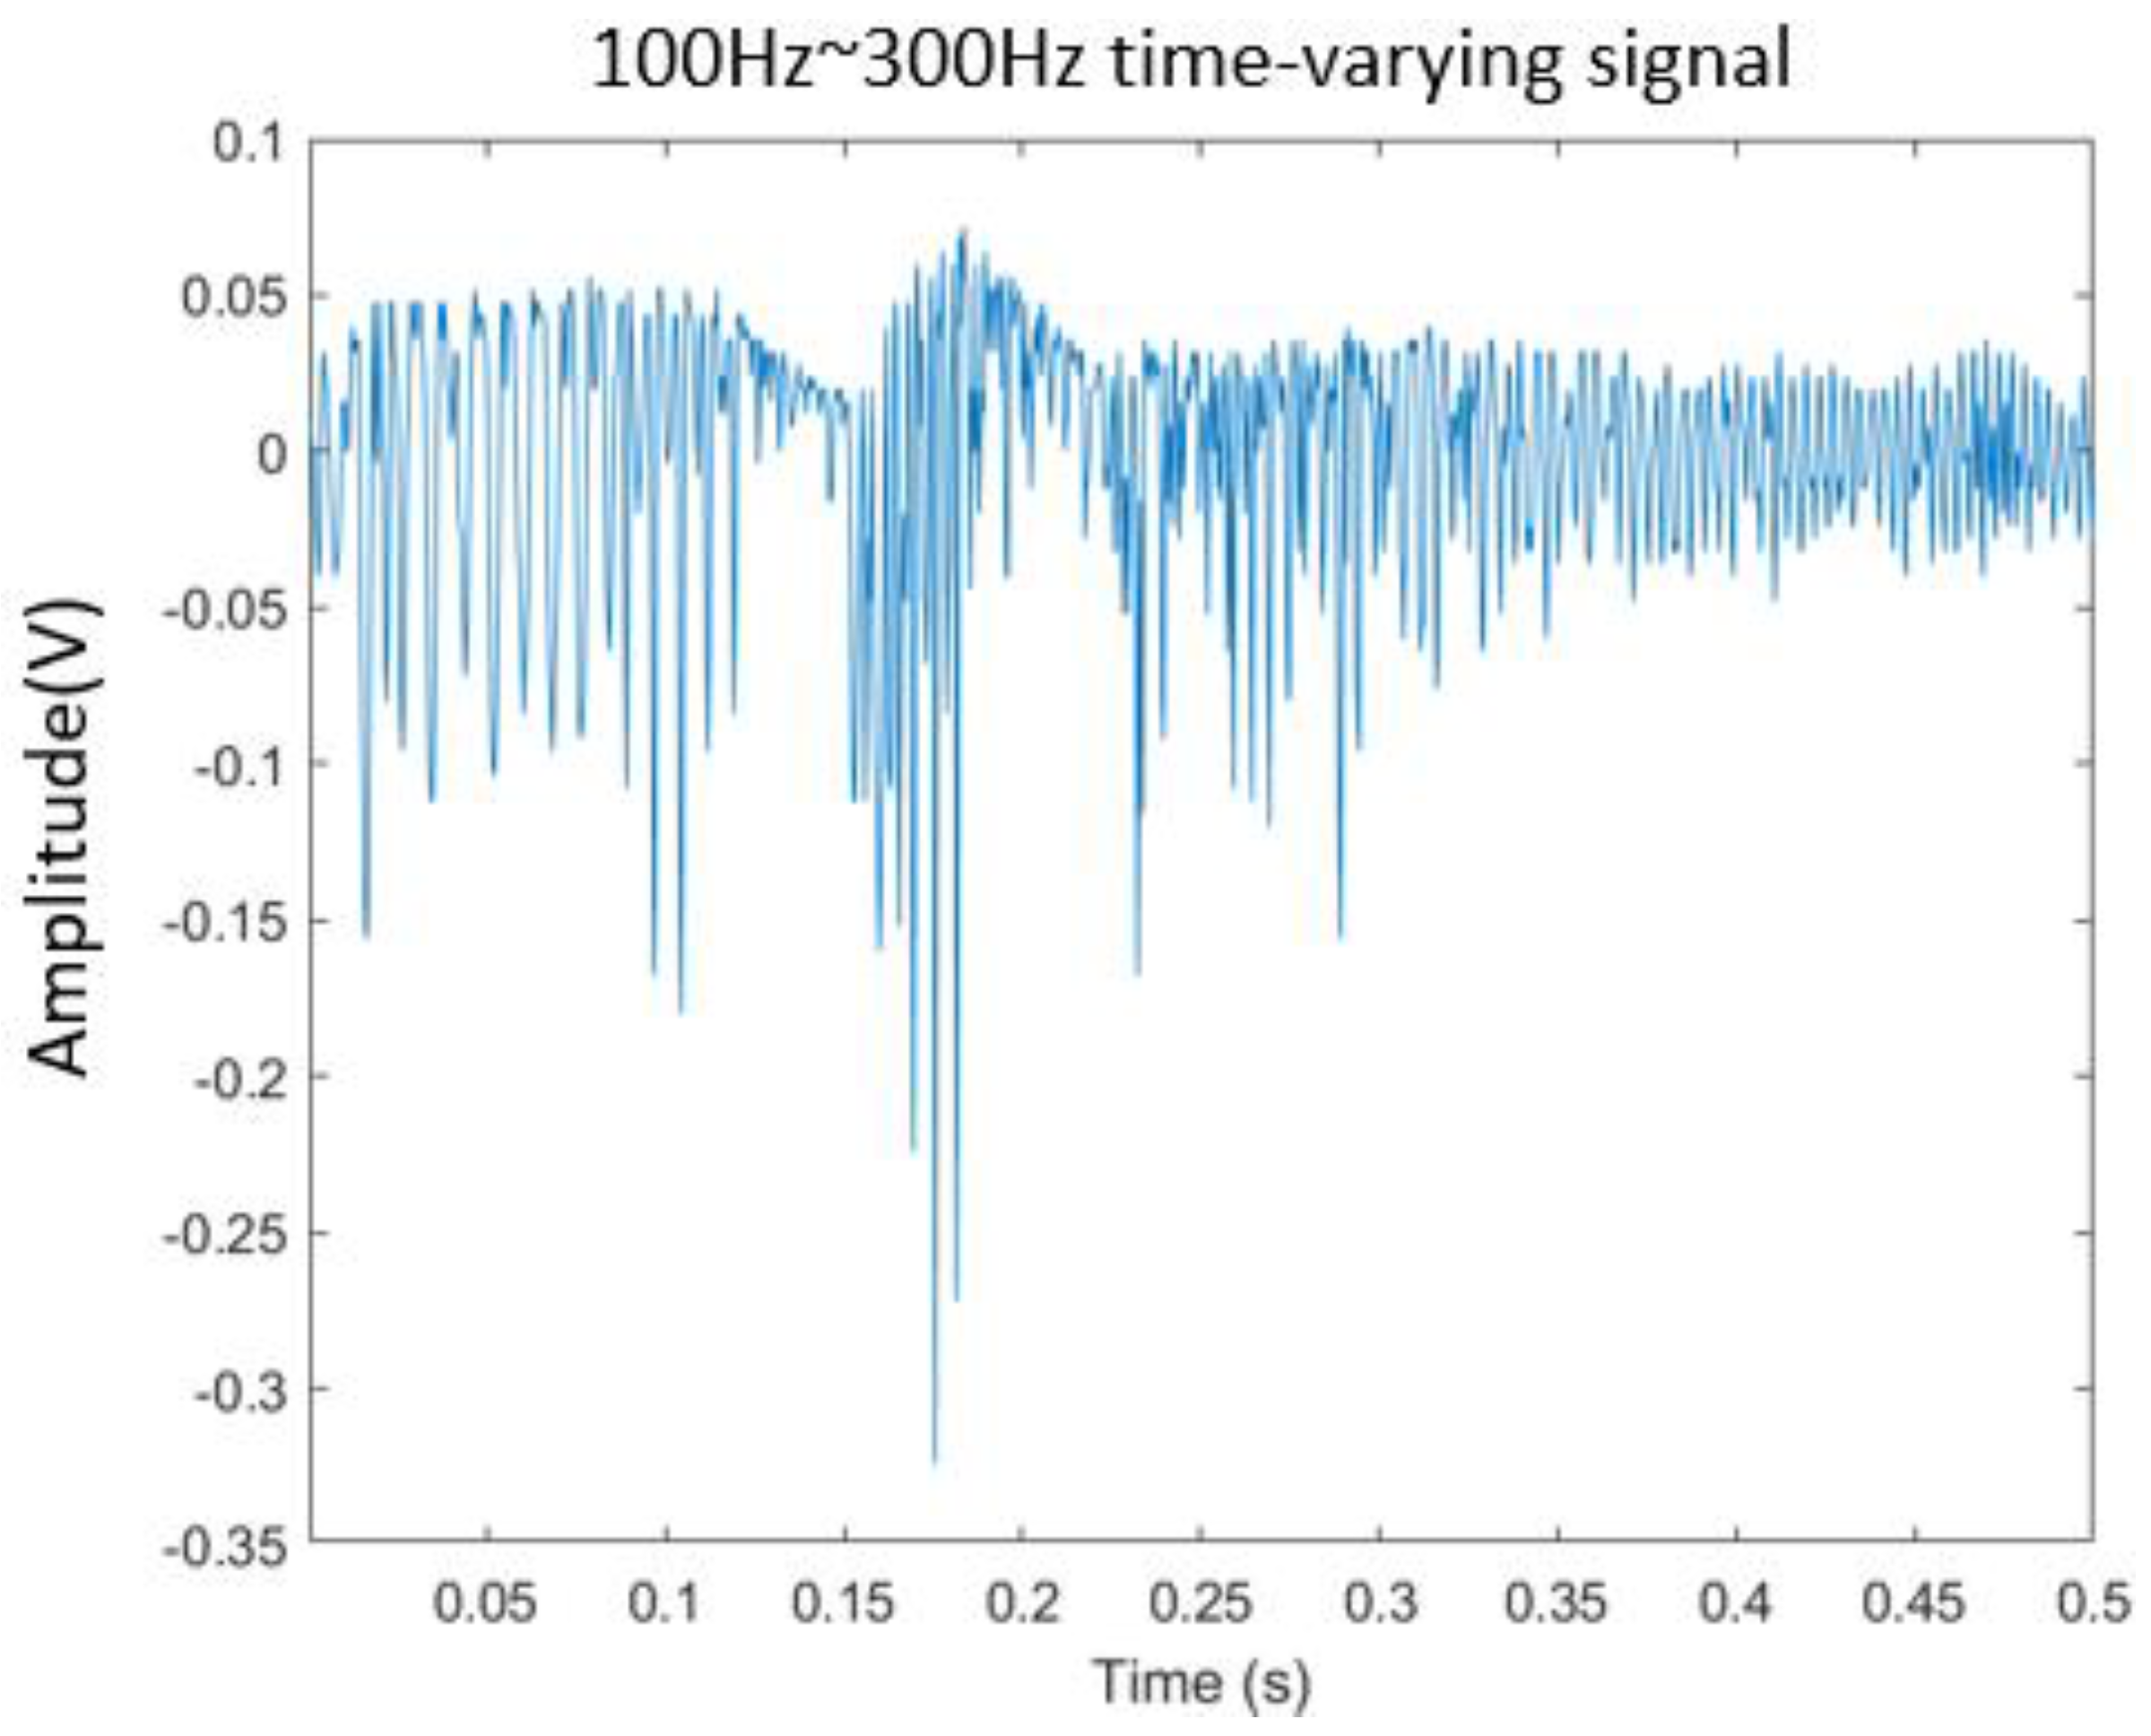
Figure 16.
The time-frequency analysis vibration signals with FFT.
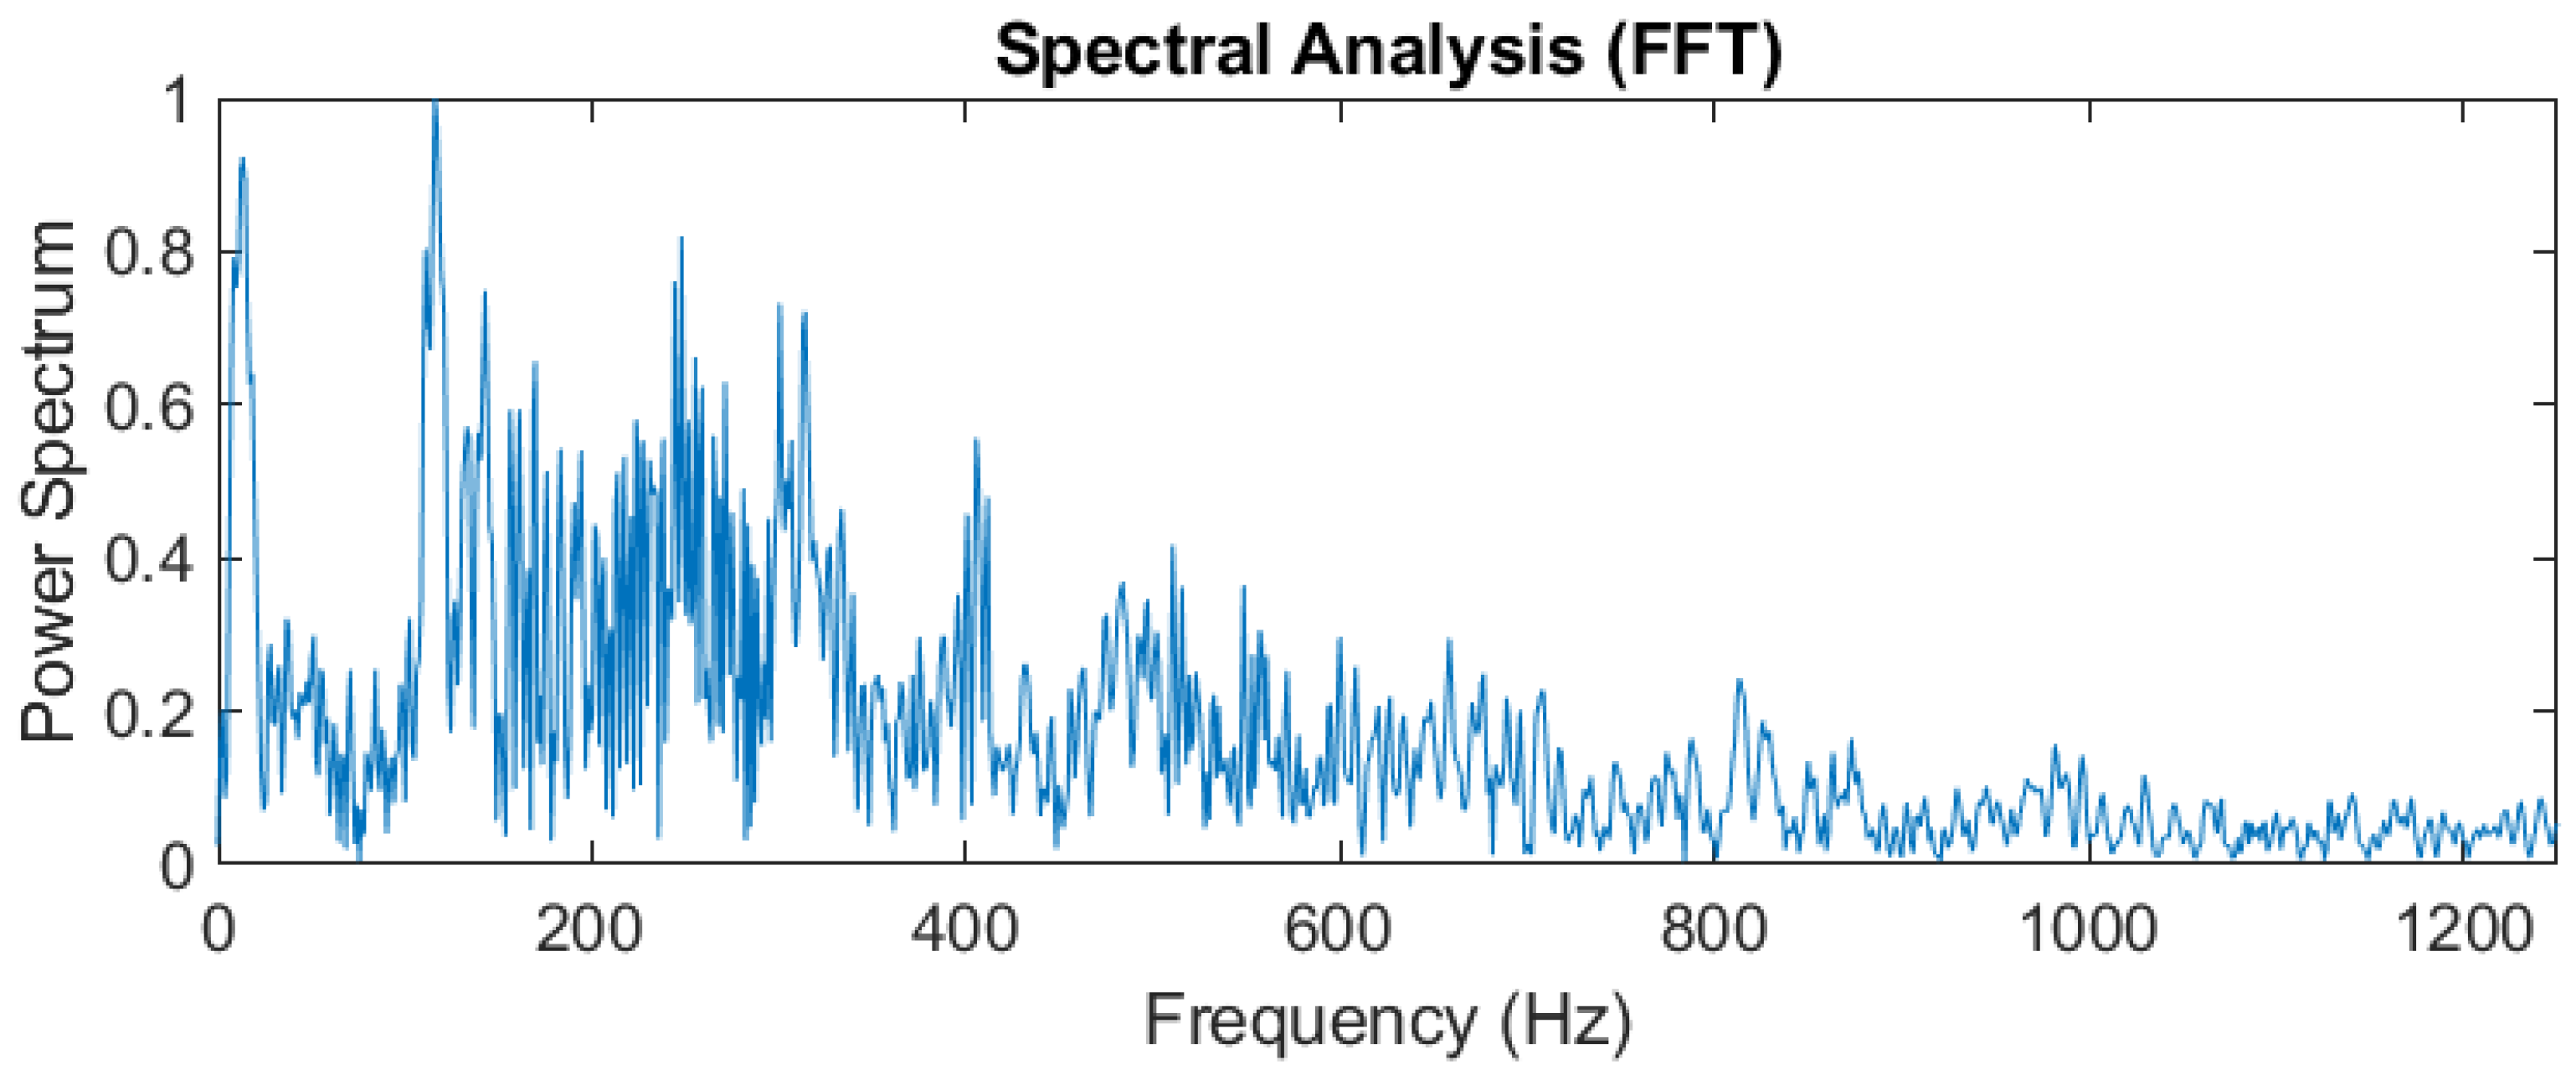
Figure 17.
The time-frequency analysis vibration signals with CWT.
Disclaimer/Publisher’s Note: The statements, opinions and data contained in all publications are solely those of the individual author(s) and contributor(s) and not of MDPI and/or the editor(s). MDPI and/or the editor(s) disclaim responsibility for any injury to people or property resulting from any ideas, methods, instructions or products referred to in the content. |
© 2024 by the authors. Licensee MDPI, Basel, Switzerland. This article is an open access article distributed under the terms and conditions of the Creative Commons Attribution (CC BY) license (http://creativecommons.org/licenses/by/4.0/).
Copyright: This open access article is published under a Creative Commons CC BY 4.0 license, which permit the free download, distribution, and reuse, provided that the author and preprint are cited in any reuse.


